european tourism - etc-corporate.org
TRANSCRIPT


EUROPEAN TOURISM: TRENDS & PROSPECTS (Q2/2021) 2
EUROPEAN TOURISM:
TRENDS & PROSPECTS
Quarterly report (Q2/2021)
A report produced for the European Travel Commission
by Tourism Economics
Brussels, July 2021
ETC Market Intelligence Report

EUROPEAN TOURISM: TRENDS & PROSPECTS (Q2/2021) 3
Copyright © 2021 European Travel Commission
EUROPEAN TOURISM: TRENDS & PROSPECTS (Q2/2021)
All rights reserved. The contents of this report may be quoted, provided the source is given accurately and clearly. Distribution or reproduction in full is permitted for own or internal use only. While we encourage dis-tribution via publicly accessible websites, this should be done via a link to ETC's corporate website, referring visitors to the Research/Trends Watch section.
The designations employed and the presentation of material in this publication do not imply the expression of any opinions whatsoever on the part of the Executive Unit of the European Travel Commission.
Data sources: This report includes data from the TourMIS database, STR, IATA, Eurocontrol, ForwardKeys, Google Trends, UNWTO, and Transparent. Economic analysis and forecasts are provided by Tourism Economics and are for interpretation by users according to their needs.
Published by the European Travel Commission Rue du Marché aux Herbes, 61, 1000 Brussels, Belgium
Website: www.etc-corporate.org
Email: [email protected]
ISSN No: 2034-9297
This report was compiled and edited by: Tourism Economics (an Oxford Economics Company) on behalf of the ETC Market Intelligence Group.
Cover: View of Bern. View of the river Aare
Image ID: 1316619692
Copyright: PPVector

EUROPEAN TOURISM: TRENDS & PROSPECTS (Q2/2021) 4
FOREWORD
Despite a sluggish start, the Covid-19 vaccine rollout is rapidly gathering pace across Europe, signifi-cantly boosting consumer and travel confidence. European destinations are already capturing strong pent-up demand from prospective vaccinated travellers, especially those coming from the US. In ad-dition to this, we have observed in recent months the strong correlation between the easing of travel restrictions and an upsurge in air bookings to certain destinations, increasing the possibility of a great summer season. On the downside however, the emergence of the new Covid-19 Delta variant, with considerable transmission advantage, has the potential to drive a rise in infection rates and threaten destination’s reopening plans.
The recovery of the tourism economy will not be possible without the revival of the travel sector, which despite the improving epidemiological situation, must still adhere to the health and hygiene protocols (wearing masks, physical distancing, etc.) which will remain in place for the foreseeable future. Consumer trends continue to revolve around travelling closer to home and “staycations”, cou-pled with longer-term stays, short booking windows, travellers craving local experiences, “safety first” mindset while travelling, and the pursuit of nature and outdoor experiences, among others. The “bleisure” phenomenon, also enabled by increased remote working is expected to be on the rise as well.
Meanwhile, domestic travel has so far supported the void left by international inbound travel to Eu-rope and has the potential to be a bridge to recovery in those destinations that are not highly de-pendent on international tourism. It is a fact that the pace of recovery will differ from country to country, and destinations where vaccines are rolling out more broadly are expected to bounce back faster.
In the effort to establish the “new normal” in the coming months, destinations are called on to de-velop a more coordinated approach to lifting travel restrictions across Europe, harmonise global travel requirements and communicate clear and consistent messages to those willing to visit Europe. It is imperative not to let our guard down despite encouraging signs, and destinations must continue to ensure safe experiences during the entire travel journey and invest in new technologies that could help to shape the recovery of the tourism sector.
The most recent edition of the European Tourism Trends & Prospects report continues to monitor the path to recovery and the impact of the Covid-19 pandemic on the tourism industry and the wider economic environment. The Special Feature of this latest edition addresses the prospects for recovery from long-haul markets which were brought to a standstill in the midst of the pandemic.
Jennifer Iduh (ETC Executive Unit)

TABLE OF CONTENTS
FOREWORD ............................................................................................................................................ 4
TABLE OF CONTENTS ........................................................................................................................... 5
EXECUTIVE SUMMARY ......................................................................................................................... 6
1. TOURISM PERFORMANCE SUMMARY 2021 ................................................................................... 9
2. GLOBAL TOURISM FORECAST SUMMARY ................................................................................... 13
3. RECENT INDUSTRY PERFORMANCE ............................................................................................ 14
AIR TRANSPORT ................................................................................................................................... 14
ACCOMMODATION .............................................................................................................................. 18
4. SPECIAL FEATURE: LONG-HAUL TRAVEL RECOVERY ............................................................... 21
5. KEY SOURCE MARKET PERFORMANCE ...................................................................................... 25
6. ORIGIN MARKET SHARE ANALYSIS .............................................................................................. 32
7. ECONOMIC OUTLOOK ..................................................................................................................... 44
APPENDIX 1 .......................................................................................................................................... 51
APPENDIX 2 .......................................................................................................................................... 52

EXECUTIVE SUMMARY
TOURISM REBOUND FEELS WITHIN SIGHT AHEAD OF THE SUMMER SEASON
European travel demand remained weak in early 2021 as international tourist arrivals dropped 83% in the first quarter of the year compared to the same period in 20201. The gradual easing of re-strictions, the ramp-up in vaccinations in Europe, and the reopening of the EU to fully vaccinated travellers from third countries provide some momentum ahead of the peak summer months. Down-side risks remain following the surge in infections of the new and more transmissible Covid-19 Delta variant, which could force the return of travel restrictions.
Foreign visits to selected destinations
Mass vaccinations have been essential to kickstart travel sentiment with 54% of surveyed Europeans intending to book a trip once they have been vaccinated against Covid-192. This sentiment is in line with a recent EU survey which shows that 75% of respondents believe that Covid-19 vaccines are the only way to end the pandemic, and 49% agree that getting a vaccine is very important to allow them to resume travel3. However, uneven vaccination rates, will lead to an uneven recovery across Europe.
1 UN World Tourism Organisation (UNWTO) 2 “Monitoring Sentiment for Domestic and Intra-European Travel – Wave 7“ 3 Flash Eurobarometer 494 - Attitudes on vaccination against Covid-19

EUROPEAN TOURISM: TRENDS & PROSPECTS (Q2/2021) 7
Impact of Covid-19 vaccination on travel attitudes among Europeans
Source: European Travel Commission
Recent data shows that 3 in 5 reporting destinations posted declines in excess of 80% although falls are smaller than those observed early in the year or throughout much of 2020. Croatia (+23%), where tourism accounts for 20% of its GDP, led the way in waiving most Covid-19 travel entry restrictions for international travellers4; those who have been vaccinated, present a negative Covid-19 test, or have recovered from the virus. In Austria (-97%) Covid-19 restrictions wiped out expectations of a winter tourism season. The Alpine country now pins its hopes on the EU’s Digital Covid-19 Certificate “Digital Green Pass” to salvage the summer season.
REOPENING ANNOUNCEMENTS DRIVE BOOKING MOMENTUM INCREASES
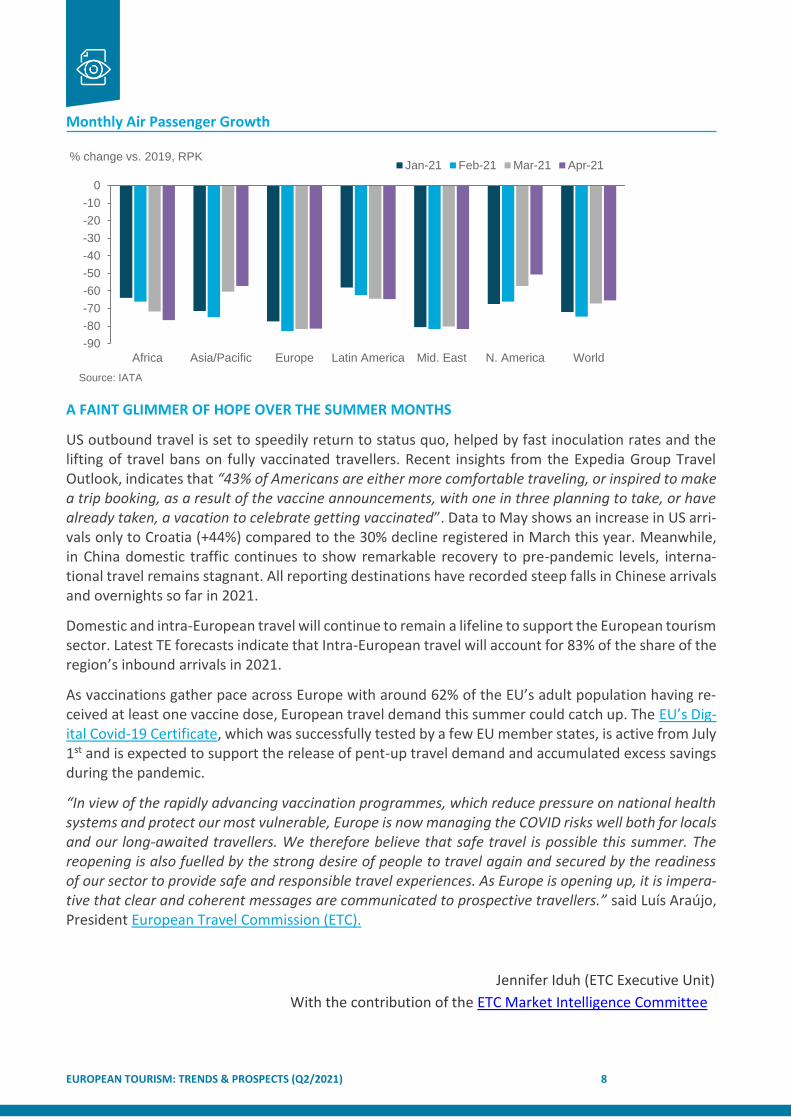
Announcements to welcome US vaccinated visitors have boosted Transatlantic travel to destinations such as Iceland, Croatia and Greece in May 2021 over 2019. According to ForwardKeys’ data to May, issued tickets from the US to Croatia (+0.5%) and Iceland (+22.7%) have surpassed 2019 levels, while Greece is just 10.9% behind. Overall ticketing trends to Europe accelerate, especially to destinations in the Southern Mediterranean. Despite mild improvements in global RPKs in recent months, in Eu-rope RPK volumes were 82% below their 2019 equivalent in April.
4 From the European Union, the European Economic Area countries and the United States.
EUROPEAN TOURISM: TRENDS & PROSPECTS (Q2/2021) 8
Monthly Air Passenger Growth
A FAINT GLIMMER OF HOPE OVER THE SUMMER MONTHS
US outbound travel is set to speedily return to status quo, helped by fast inoculation rates and the lifting of travel bans on fully vaccinated travellers. Recent insights from the Expedia Group Travel Outlook, indicates that “43% of Americans are either more comfortable traveling, or inspired to make a trip booking, as a result of the vaccine announcements, with one in three planning to take, or have already taken, a vacation to celebrate getting vaccinated”. Data to May shows an increase in US arri-vals only to Croatia (+44%) compared to the 30% decline registered in March this year. Meanwhile, in China domestic traffic continues to show remarkable recovery to pre-pandemic levels, interna-tional travel remains stagnant. All reporting destinations have recorded steep falls in Chinese arrivals and overnights so far in 2021.
Domestic and intra-European travel will continue to remain a lifeline to support the European tourism sector. Latest TE forecasts indicate that Intra-European travel will account for 83% of the share of the region’s inbound arrivals in 2021.
As vaccinations gather pace across Europe with around 62% of the EU’s adult population having re-ceived at least one vaccine dose, European travel demand this summer could catch up. The EU’s Dig-ital Covid-19 Certificate, which was successfully tested by a few EU member states, is active from July 1st and is expected to support the release of pent-up travel demand and accumulated excess savings during the pandemic.
“In view of the rapidly advancing vaccination programmes, which reduce pressure on national health systems and protect our most vulnerable, Europe is now managing the COVID risks well both for locals and our long-awaited travellers. We therefore believe that safe travel is possible this summer. The reopening is also fuelled by the strong desire of people to travel again and secured by the readiness of our sector to provide safe and responsible travel experiences. As Europe is opening up, it is impera-tive that clear and coherent messages are communicated to prospective travellers.” said Luís Araújo, President European Travel Commission (ETC).
Jennifer Iduh (ETC Executive Unit)
With the contribution of the ETC Market Intelligence Committee
Africa Asia/Pacific Europe Latin America Mid. East N. America World
-90
-80
-70
-60
-50
-40
-30
-20
-10
0
Jan-21 Feb-21 Mar-21 Apr-21
Source: IATA
% change vs. 2019, RPK
1. TOURISM PERFORMANCE SUMMARY 2021
SUMMARY
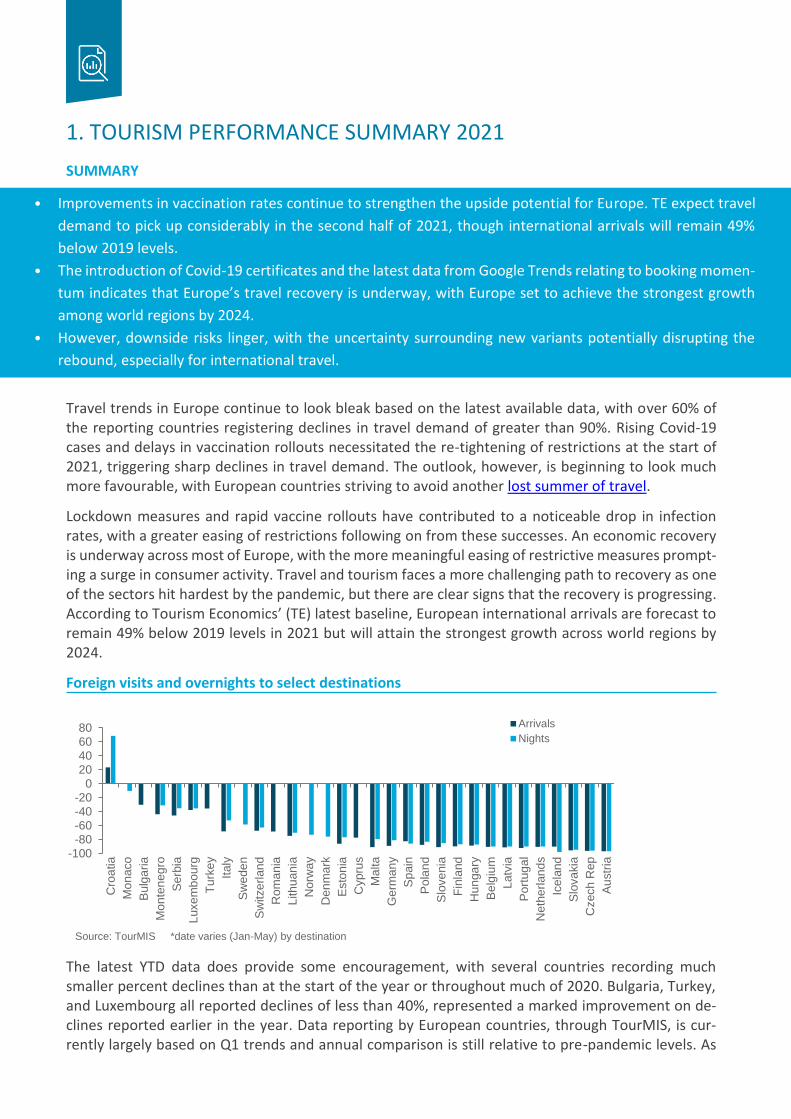
Travel trends in Europe continue to look bleak based on the latest available data, with over 60% of the reporting countries registering declines in travel demand of greater than 90%. Rising Covid-19 cases and delays in vaccination rollouts necessitated the re-tightening of restrictions at the start of 2021, triggering sharp declines in travel demand. The outlook, however, is beginning to look much more favourable, with European countries striving to avoid another lost summer of travel.
Lockdown measures and rapid vaccine rollouts have contributed to a noticeable drop in infection rates, with a greater easing of restrictions following on from these successes. An economic recovery is underway across most of Europe, with the more meaningful easing of restrictive measures prompt-ing a surge in consumer activity. Travel and tourism faces a more challenging path to recovery as one of the sectors hit hardest by the pandemic, but there are clear signs that the recovery is progressing. According to Tourism Economics’ (TE) latest baseline, European international arrivals are forecast to remain 49% below 2019 levels in 2021 but will attain the strongest growth across world regions by 2024.
Foreign visits and overnights to select destinations
The latest YTD data does provide some encouragement, with several countries recording much smaller percent declines than at the start of the year or throughout much of 2020. Bulgaria, Turkey, and Luxembourg all reported declines of less than 40%, represented a marked improvement on de-clines reported earlier in the year. Data reporting by European countries, through TourMIS, is cur-rently largely based on Q1 trends and annual comparison is still relative to pre-pandemic levels. As
-100-80-60-40-20
020406080
Cro
atia
Mo
na
co
Bu
lga
ria
Mo
nte
ne
gro
Se
rbia
Luxe
mb
ourg
Tu
rke
y
Italy
Sw
ed
en
Sw
itze
rlan
d
Ro
ma
nia
Lith
uan
ia
Norw
ay
Den
ma
rk
Esto
nia
Cypru
s
Ma
lta
Ge
rma
ny
Sp
ain
Po
lan
d
Slo
ve
nia
Fin
land
Hun
ga
ry
Be
lgiu
m
Latv
ia
Po
rtug
al
Neth
erl
an
ds
Ice
lan
d
Slo
va
kia
Czech
Rep
Au
str
ia
Arrivals
Nights
Source: TourMIS *date varies (Jan-May) by destination
• Improvements in vaccination rates continue to strengthen the upside potential for Europe. TE expect travel
demand to pick up considerably in the second half of 2021, though international arrivals will remain 49%
below 2019 levels.
• The introduction of Covid-19 certificates and the latest data from Google Trends relating to booking momen-
tum indicates that Europe’s travel recovery is underway, with Europe set to achieve the strongest growth
among world regions by 2024.
• However, downside risks linger, with the uncertainty surrounding new variants potentially disrupting the
rebound, especially for international travel.

EUROPEAN TOURISM: TRENDS & PROSPECTS (Q2/2021) 10
data are reported for later months, growth will become apparent by comparison with the low levels experienced throughout much of 2020. Any growth should be interpreted with care as travel will likely remain below the pre-pandemic levels.
Intra-European travel will help bolster travel demand in H2 2021, with vaccine success across Europe enabling governments to ease restrictions and satisfy the longing among citizens to travel again. TE forecast that intra-European travel will account for 83% of Europe’s inbound arrivals in 2021 com-pared to 77% in 2019.
Croatia significantly outperformed the other European countries based on data to May, reporting a 23% increase in visitor arrivals. Growth is partly due to reporting for the more recent months and comparison with 2020 lows. However, Croatia was one of the first European countries to allow vac-cinated tourists to forego quarantine measures. The Croatian government, recognising the im-portance of the travel industry’s recovery for the wider economic recovery is eager to sustain this strong growth. A targeted vaccination programme is being undertaken, prioritising tourism workers to facilitate a quicker reopening of the full industry. Campaigns by the Croatian National Tourism Board, the introduction of additional non-stop flights from the US to Croatia, alongside high vaccina-tion rates in the US should also help Croatia attract US tourists as transatlantic travel returns.
Austria has so far suffered the greatest percent decline in visitor arrivals, reporting a 97% drop in arrivals based on data for the first 4 months of 2021. While tight containment measures helped con-trol the virus outbreak, it devastated travel demand during Austria’s peak ski season. A travel warning for Tyrol issued due to rising cases of the South African variant depressed travel activity to the Aus-trian region, which is a major tourist spot within the country and renowned for its ski resorts.
Europe’s travel industry is hanging its hopes on vaccine success, Covid-19 certificates, and tar-
geted travel campaigns stimulating greater travel activity.
While Covid-19 is certainly not behind us, European governments are in a much better position to encourage travel without risking the safety of their citizens or fearing their healthcare sector will again come under extreme pressure. This is largely attributable to a successful vaccination campaign and more restrictive policies pursued by governments earlier in the year which helped control out-breaks.
The reopening of the hospitality and retail industries has occurred across many European destinations recently and will significantly lift the prospects for tourism hotspots. This is reinforced by almost 95% of the reporting European countries in the World Hotel Index receiving increased bookings over the last month compared to 67% of all countries5.
The implementation of the EU’s Covid-19 certificates from 1st July marks a major step forward for the travel industry, with many European countries already launching certificates. This will allow those who have been vaccinated to travel freely across the EU, enabling the release of pent-up travel de-mand and excess savings accumulated throughout the pandemic.
An uneven travel recovery may occur across European destinations due to varying rates of vac-
cinations and Covid-19 cases.
5 SiteMinder, June 2021
EUROPEAN TOURISM: TRENDS & PROSPECTS (Q2/2021) 11
While the digital health passes will help countries feel easier about lifting international restrictions and instil greater confidence among travellers, the success is contingent on European tourists being vaccinated. Many countries have achieved high rates of vaccination among their population but there are still some that are lagging, which may lead to an uneven recovery. The UK got off to the fastest start and has fully vaccinated almost 50% of its population (as of the 14th June – the highest share across Europe at present), and since the start of this June, Germany, France and Italy have all admin-istered more doses of vaccine than the UK on a seven-day average basis. While the UK remains ahead on fully vaccinated people in both absolute and relative terms, EU countries are catching up fast: Germany recently reached 50% of its population with a first dose. However, in contrast, many Emerg-ing European countries, including Russia, have fully vaccinated less than 10% of their population.
The emergence of new, highly transmissible variants, such as the Delta variant still have the potential to threaten well-intentioned efforts by governments to restart travel. If these variants of concern spread across countries before there is sufficient vaccine coverage, it may lead again to the tightening of border restrictions and endanger the recovery of traveller confidence. The adverse impact of the Delta variant has been witnessed most recently in the UK, causing a surge in Covid-19 infections and has prompted some unilateral restrictions on outbound travel from the UK. Spain, however, has con-tinued to welcome UK travellers.
The Open up to Europe campaign, a collaboration between the ETC, the EU, and the tourism industry will also encourage travel by seeking to increase online engagement and provide assurances to po-tential tourists that European countries are meeting all the essential health and safety standards. The campaign also involves the launching of a microsite to collate all the necessary information and guid-ance for travelling across Europe to achieve a smooth transition back to ‘normality’. This campaign is primarily designed to inform European nationals of the current travelling situation across the conti-nent and highlight the health and safety measures the tourism industry has put in place, but travellers from beyond the region can also benefit from access to the same information.
EUROPEAN TOURISM: TRENDS & PROSPECTS (Q2/2021) 12
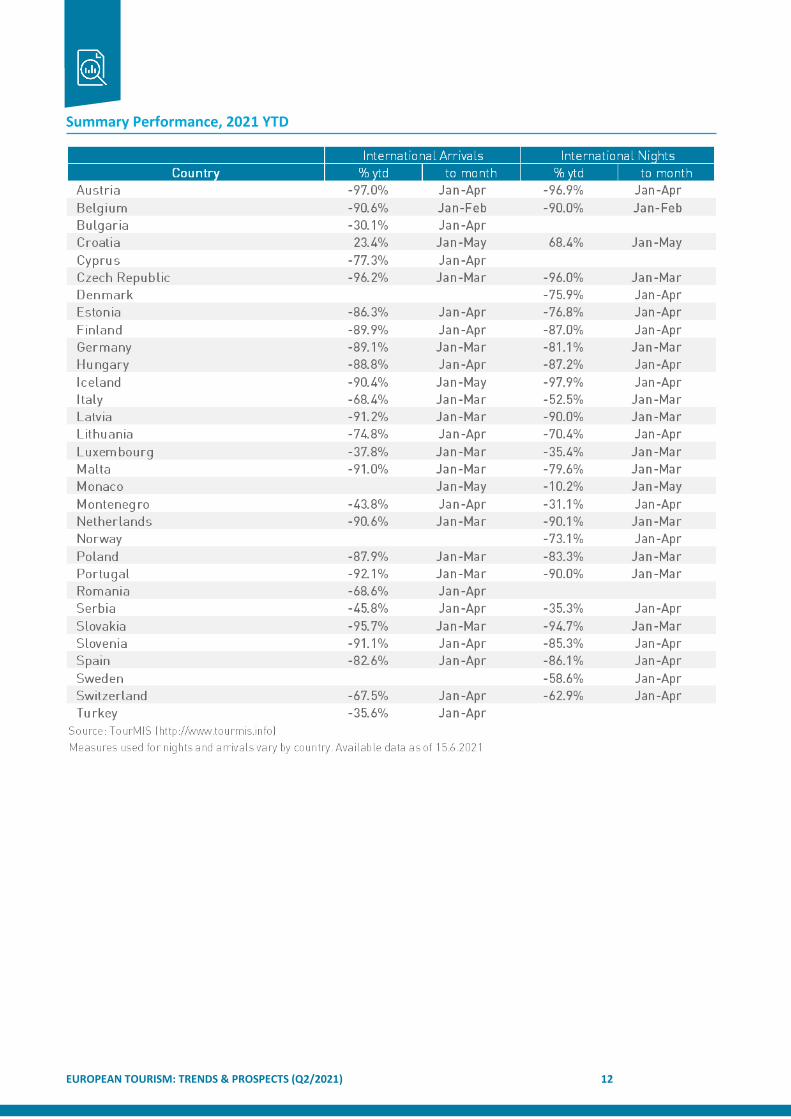
Summary Performance, 2021 YTD

EUROPEAN TOURISM: TRENDS & PROSPECTS (Q2/2021) 13
2. GLOBAL TOURISM FORECAST SUMMARY
Tourism Economics’ global travel forecasts are shown on an inbound and outbound basis in the fol-
lowing table. These are the results of the Global Travel Service (GTS) model, which is updated in detail
three times per year. Forecasts are consistent with Oxford Economics’ macroeconomic outlook ac-
cording to estimated relationships between tourism and the wider economy. Full origin-destination
country detail is available online to subscribers.
GTS Visitor Growth Forecasts, % change

EUROPEAN TOURISM: TRENDS & PROSPECTS (Q2/2021) 14
3. RECENT INDUSTRY PERFORMANCE
AIR TRANSPORT
Latest data for air passenger demand show some semblance of recovery is underway, with a slight improvement in global revenue passenger kilometres (RPK) in March and April versus the start of the year. While global RPKs were still 65% lower compared to April 2019, April 2021 represented the most improved month since the onset of the pandemic, outperforming mid-2020 when international re-strictions were relaxed to permit some summer travel.
April 2021 represented the most improved month since the onset of pandemic
This improvement has largely been driven by increased domestic activity, with international demand still stifled by travel restrictions as of April; relative to April 2019, international RPK was down 87%, while domestic RPK was 26% lower. But the strength of global economic recovery combined with the decline in new Covid-19 cases globally bodes well for international travel demand in the coming months. Indeed, bookings in May point to further recovery in both domestic and international travel demand.
Global Air Passenger Traffic Growth
The improvements in global RPK in recent months can clearly be attributed to improvements in Asia
Pacific and North America. Domestic demand in China and the US (the two largest domestic markets
in the world based on 2019 RPK volumes) has driven performance in these regions. In China in par-
ticular, domestic RPKs in April are suggestive of a full recovery, exceeding volumes of April 2019.
In Europe and the Middle East, however, total RPK have shown limited signs of improvement in re-
cent months; in April RPK volumes were 82% below their 2019 equivalent. In Latin America, Brazil
continued to deteriorate amid a surge in new Covid-19 cases and consequent imposition of new re-
strictions.
-95
-75
-55
-35
-15
5
Total
3mth mav
Pre-Covid avg (10-year)
Source: IATA
% change 2019, RPK

EUROPEAN TOURISM: TRENDS & PROSPECTS (Q2/2021) 15
Monthly Air Passenger Growth
The fact that load factors have remained high relative to such steep declines in demand points to
the vast reduction in global seat capacity as a consequence of lower demand. Despite the significant
supply-side response to lower levels of demand, load factors in April were still well below those in
2019 as a whole. As the demand outlook continues to improve, it is expected that supply will quickly
mobilise to meet it, although there is some risk that some degree of capacity will be slower to re-
turn due to a portion of the industry’s workforce having moved into other types of employment
during the pandemic.
Monthly Passenger Load Factor
European airport traffic data from Eurocontrol confirms this improvement in March and April. While flights arriving and departing European airports remain well below their pre-pandemic volumes, there was significantly more airport traffic in April of this year compared to April 2020 when most of Euro-pean travel demand was stifled during the initial series of lockdowns and travel restrictions.
Africa Asia/Pacific Europe Latin America Mid. East N. America World
-90
-80
-70
-60
-50
-40
-30
-20
-10
0
Jan-21 Feb-21 Mar-21 Apr-21
Source: IATA
% change vs. 2019, RPK
Africa Asia/Pacific Europe Latin America Middle East N. America Total
0
10
20
30
40
50
60
70
80
902019 Feb-21 Mar-21 Apr-21
Source: IATA
Load factor, %

EUROPEAN TOURISM: TRENDS & PROSPECTS (Q2/2021) 16
European* Airport Traffic, Total Flights Arriving and Departing by Month
Latest data from Eurocontrol show a wide variation in airport traffic across European destinations for 2021 so far. Based on flights arriving and departing, Turkey’s recovery towards 2019 levels was the most advanced according to data to April. Flights volumes were around half what they were in 2019, although this improvement was mainly driven by domestic flows. In contrast to Turkey, where re-strictions on air travel are relatively lax, at the time of writing travelling by air to or within Denmark requires a negative Covid-19 test within 48 hours prior to departure. As such, airport traffic in Den-mark has not enjoyed similar reprieve from increased domestic activity, with flight volumes 82% be-low that for the same period in 2019.
European Airport Traffic in 2021 by Country, Year-to-date (Jan-Apr)
Recent developments indicate a strong willingness to travel from individuals. Announcements of new travel bubbles, quarantine exemptions or roadmaps to reopening borders have often been followed by an uptick in travel bookings according to Google Trends data. Combined with the large savings that many consumers have accumulated, this is likely to provide an important boost to travel demand, once vaccination becomes widespread and most travel restrictions are lifted. Indeed, early bookings for June-August travel period point to an improvement, although travellers continue to book much closer to their preferred date of travel than usual.
0,0
0,2
0,4
0,6
0,8
1,0
1,2
1,4
1,6
1,8
Jan
-19
Fe
b-1
9
Ma
r-1
9
Ap
r-19
Ma
y-1
9
Jun
-19
Jul-
19
Au
g-1
9
Se
p-1
9
Oct-
19
No
v-1
9
De
c-1
9
Jan
-20
Fe
b-2
0
Ma
r-2
0
Ap
r-20
Ma
y-2
0
Jun
-20
Jul-
20
Au
g-2
0
Se
p-2
0
Oct-
20
No
v-2
0
De
c-2
0
Jan
-21
Fe
b-2
1
Ma
r-2
1
Ap
r-21
Source Eurocontrol *Europe = aggregate data for ETC+4 countries
No. flights, mns
Tu
rke
y
Norw
ay
Se
rbia
Cro
atia
Bu
lga
ria
Luxe
mb
ourg
Gre
ece
Fra
nce
Be
lgiu
m
Ro
ma
nia
Mo
nte
ne
gro
Neth
erl
an
ds
Lith
uan
ia
Esto
nia
Cypru
s
Sp
ain
Slo
ve
nia
Po
rtug
al
Ma
lta
Slo
va
kia
Po
lan
d
Ge
rma
ny
Czech
Rep
.
Sw
itze
rlan
d
Italy
Au
str
ia
Latv
ia
Fin
land
Ire
lan
d
Sw
ed
en
Hu
nga
ry
UK
Den
ma
rk
To
tal*
-90-80-70-60-50-40-30-20-10
0
Source: Eurocontrol
% change vs. 2019, no. flights

EUROPEAN TOURISM: TRENDS & PROSPECTS (Q2/2021) 17
EU: Tourism-related online activity
0
20
40
60
80
100
120
BookingTravelAir travelHotels & accommodationsTourist destinationsTravel tips
Source: Oxford Economics/ Google Trends
Index relative to corresponding week in 2019
EUROPEAN TOURISM: TRENDS & PROSPECTS (Q2/2021) 18
ACCOMMODATION
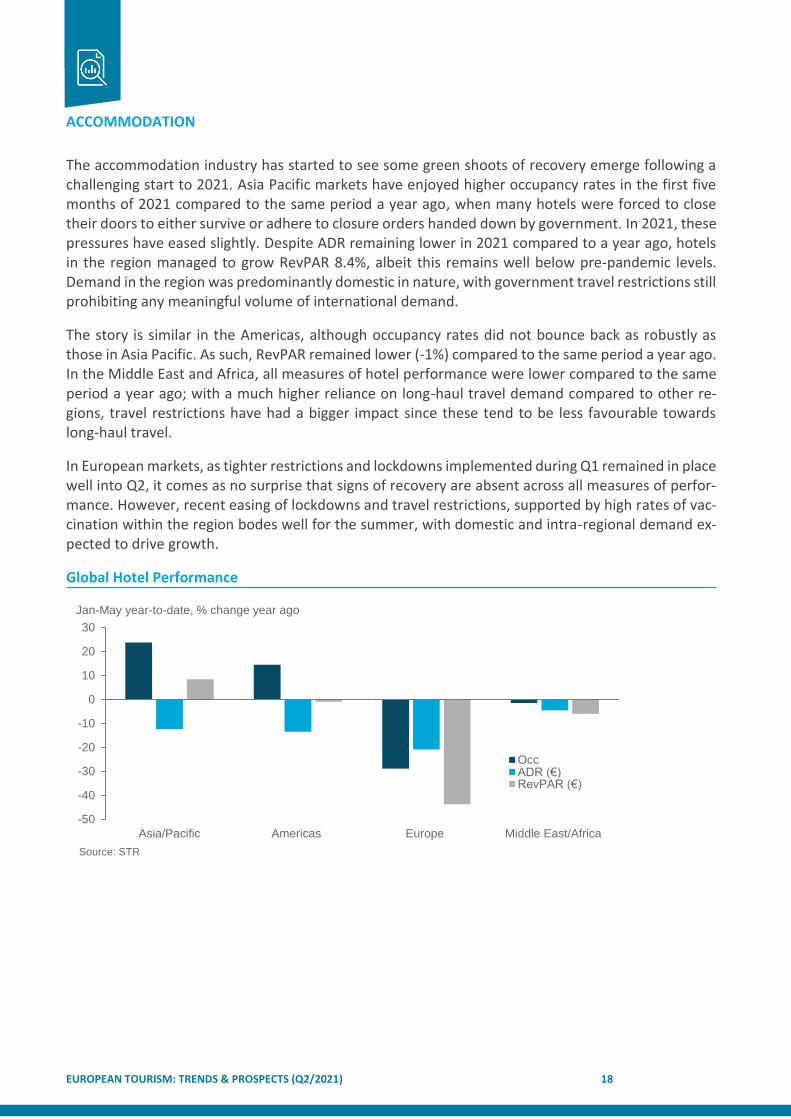
The accommodation industry has started to see some green shoots of recovery emerge following a challenging start to 2021. Asia Pacific markets have enjoyed higher occupancy rates in the first five months of 2021 compared to the same period a year ago, when many hotels were forced to close their doors to either survive or adhere to closure orders handed down by government. In 2021, these pressures have eased slightly. Despite ADR remaining lower in 2021 compared to a year ago, hotels in the region managed to grow RevPAR 8.4%, albeit this remains well below pre-pandemic levels. Demand in the region was predominantly domestic in nature, with government travel restrictions still prohibiting any meaningful volume of international demand.
The story is similar in the Americas, although occupancy rates did not bounce back as robustly as those in Asia Pacific. As such, RevPAR remained lower (-1%) compared to the same period a year ago. In the Middle East and Africa, all measures of hotel performance were lower compared to the same period a year ago; with a much higher reliance on long-haul travel demand compared to other re-gions, travel restrictions have had a bigger impact since these tend to be less favourable towards long-haul travel.
In European markets, as tighter restrictions and lockdowns implemented during Q1 remained in place well into Q2, it comes as no surprise that signs of recovery are absent across all measures of perfor-mance. However, recent easing of lockdowns and travel restrictions, supported by high rates of vac-cination within the region bodes well for the summer, with domestic and intra-regional demand ex-pected to drive growth.
Global Hotel Performance
-50
-40
-30
-20
-10
0
10
20
30
Asia/Pacific Americas Europe Middle East/Africa
OccADR (€)RevPAR (€)
Source: STR
Jan-May year-to-date, % change year ago
EUROPEAN TOURISM: TRENDS & PROSPECTS (Q2/2021) 19
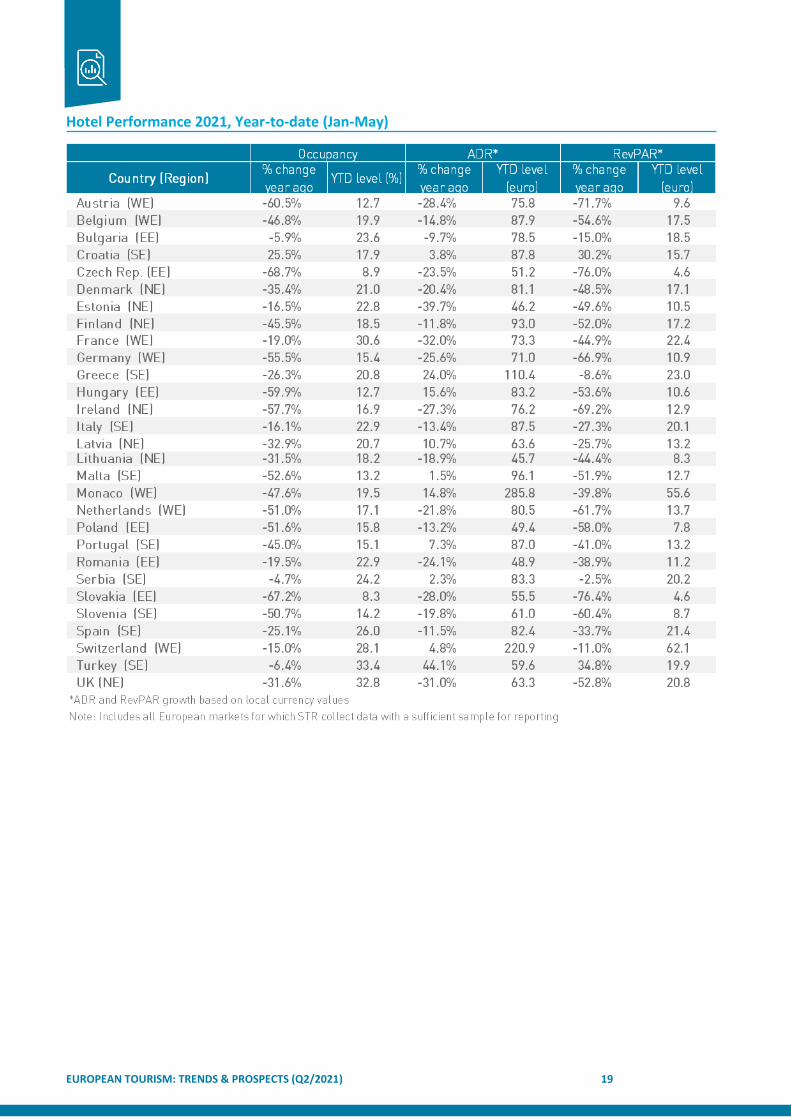
Hotel Performance 2021, Year-to-date (Jan-May)

EUROPEAN TOURISM: TRENDS & PROSPECTS (Q2/2021) 20
SHORT TERM RENTALS
As vaccination accelerates and travel restrictions relax, pent-up demand for travelling has been un-leashed. For short-term accommodations, which promise a more self-sufficient, flexible, and con-tained experience, this demand has seen unprecedented growth.
At the end of March, occupancy was more recovered in short-term rentals than hotels, and also for on the books occupancy for the rest of 2021, with pricing reflecting this sector’s confidence in de-mand.
Indeed, European short-term rental reservations have recovered to -33% of 2019 levels during the second quarter of 2021, now surpassing the recovery seen in Oceania and Asia. While demand is currently strongest in Germany and France, fluctuation is continuous across the continent; largely reactive to restriction changes. Indeed, Portugal enjoyed a 155% increase in summer occupancy fol-lowing their border relaxation announcements – similar to the spike experienced in the UK in the aftermath of initial announcements.
Weekly average length of stay worldwide 2019-21
Worldwide, this new influx of guests are still staying longer than in previous years, while their booking window has stabilised around the 6 week mark once again. Perhaps most critically, these guests are paying more, with global rates up 10% on 2019.
We
ek 1
We
ek 3
We
ek 5
We
ek 7
We
ek 9
We
ek 1
1
We
ek 1
3
We
ek 1
5
We
ek 1
7
We
ek 1
9
We
ek 2
1
We
ek 2
3
We
ek 2
5
We
ek 2
7
We
ek 2
9
We
ek 3
1
We
ek 3
3
We
ek 3
5
We
ek 3
7
We
ek 3
9
We
ek 4
1
We
ek 4
3
We
ek 4
5
We
ek 4
7
We
ek 4
9
We
ek 5
1
0
1
2
3
4
5
6
7
8
9
102019
2020
2021
Source: Transparent
No. days

EUROPEAN TOURISM: TRENDS & PROSPECTS (Q2/2021) 21
4. SPECIAL FEATURE: LONG-HAUL TRAVEL RECOVERY
SUMMARY
Recovery in domestic and short-haul travel is currently underway, with some marked improvement likely as the summer progresses and restrictions ease more meaningfully, helped by successful vac-cine rollouts. There are also improved upside prospects for global travel following a depressing start to the year. Advanced vaccination rates have increased the possibility for countries to maintain low coronavirus case numbers, ease domestic restrictions and be able to start a gradual lifting of interna-tional travel restrictions.
From July 1st, the EU digital Covid-19 certificate is available and active across the EU. The certificate makes it easier to travel across EU countries: it is a proof that you are vaccinated, tested negative, or recovered from Covid-19. It is free of charge and recognised in all 27 EU member states as well as in Iceland, Liechtenstein, Norway, and Switzerland.
Covid-19 travel impact index for Europe
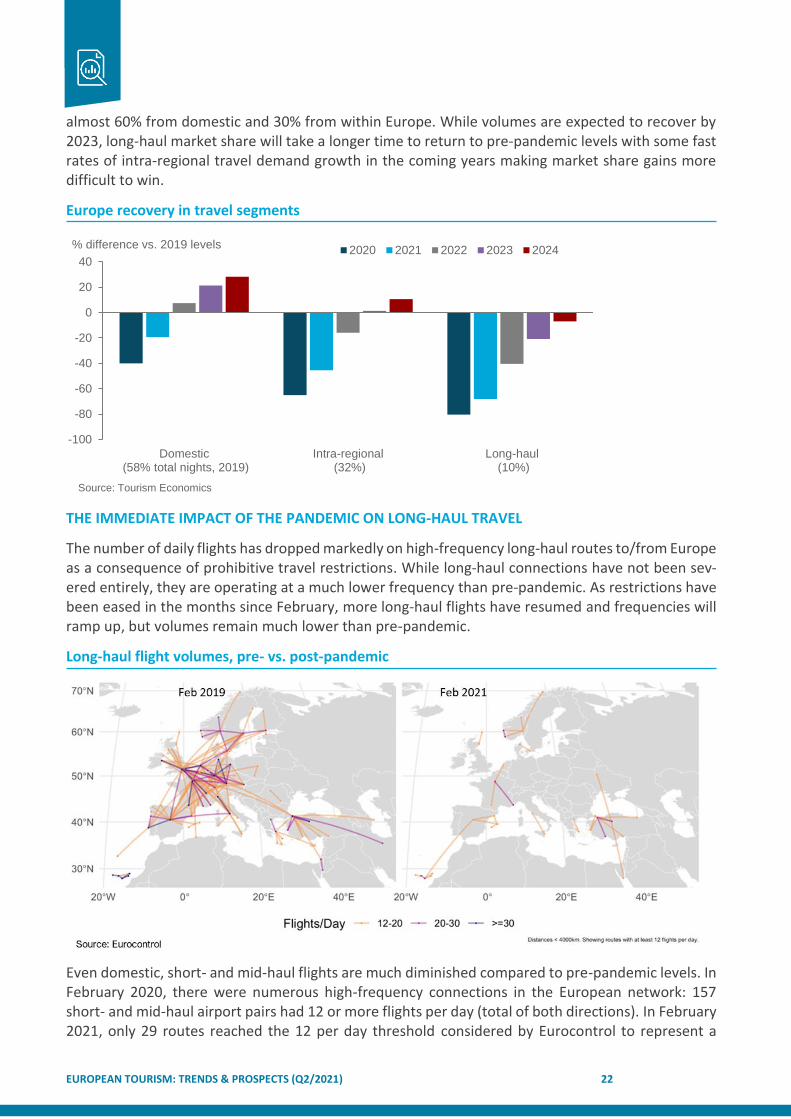
But long-haul travel demand is expected to recover more slowly with barriers set to remain in place well beyond the end of this year. While domestic visitor nights at European destinations are expected to return to 2019 volumes by 2022, and intra-regional visitor nights (i.e., short-haul) is expected to recover by 2023, visitor nights from long-haul source markets are not expected to return to 2019 volumes until 2025 on average. While this is a blow to the sector, particularly for countries which typically enjoyed a higher proportion of total overnights from long-haul markets, for Europe as a whole, just one in ten overnights came from long-haul source market in 2019. This compares to
Jan
-20
Fe
b-2
0
Ma
r-2
0
Ap
r-20
Ma
y-2
0
Jun
-20
Jul-
20
Au
g-2
0
Se
p-2
0
Oct-
20
Nov-2
0
Dec-2
0
Jan
-21
Fe
b-2
1
Ma
r-2
1
Ap
r-21
Ma
y-2
1
Jun
-21
Jul-
21
Au
g-2
1
Se
p-2
1
Oct-
21
Nov-2
1
Dec-2
1
-100
-90
-80
-70
-60
-50
-40
-30
-20
-10
0
Total int'l Long-haul
Mid-haul Short-haul
Domestic
Source: Tourism Economics
Index (full restrictions = -100)
• Advanced vaccination rates have increased the possibility for countries to maintain low coronavirus case
numbers, ease domestic restrictions and be able to start a gradual lifting of international travel restrictions.
• But long-haul travel demand is expected to recover more slowly, with barriers set to remain in place well
beyond the end of this year.
• The United States is the long-haul source market expected to make the most significant contribution to Eu-
rope-wide travel demand growth between 2019-30.
• TE expect long-haul demand to return to its 2019 market share by 2030.
EUROPEAN TOURISM: TRENDS & PROSPECTS (Q2/2021) 22
almost 60% from domestic and 30% from within Europe. While volumes are expected to recover by 2023, long-haul market share will take a longer time to return to pre-pandemic levels with some fast rates of intra-regional travel demand growth in the coming years making market share gains more difficult to win.
Europe recovery in travel segments
THE IMMEDIATE IMPACT OF THE PANDEMIC ON LONG-HAUL TRAVEL
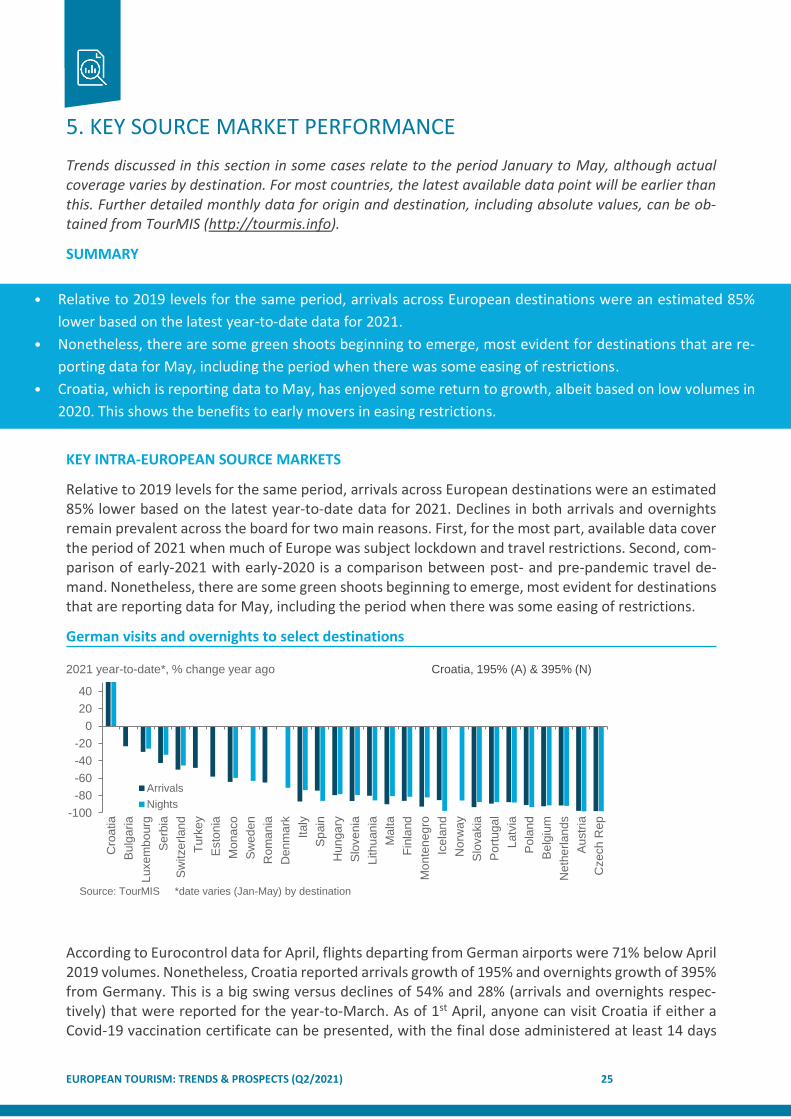
The number of daily flights has dropped markedly on high-frequency long-haul routes to/from Europe as a consequence of prohibitive travel restrictions. While long-haul connections have not been sev-ered entirely, they are operating at a much lower frequency than pre-pandemic. As restrictions have been eased in the months since February, more long-haul flights have resumed and frequencies will ramp up, but volumes remain much lower than pre-pandemic.
Long-haul flight volumes, pre- vs. post-pandemic
Even domestic, short- and mid-haul flights are much diminished compared to pre-pandemic levels. In February 2020, there were numerous high-frequency connections in the European network: 157 short- and mid-haul airport pairs had 12 or more flights per day (total of both directions). In February 2021, only 29 routes reached the 12 per day threshold considered by Eurocontrol to represent a
Domestic (58% total nights, 2019)
Intra-regional (32%)
Long-haul (10%)
-100
-80
-60
-40
-20
0
20
402020 2021 2022 2023 2024
Source: Tourism Economics
% difference vs. 2019 levels

EUROPEAN TOURISM: TRENDS & PROSPECTS (Q2/2021) 23
“high-frequency” route. Domestic routes were less affected with a number of high-frequency domes-tic routes continuing to operate in the midst of one of the most prohibitive periods of the pandemic for travel. In Spain and Turkey in particular, a large volume of high-frequency domestic flights was operating in February 2021.
High-frequency* short/mid-haul flights in Europe, Feb 20 (LHS) vs. Feb 21 (RHS)
THE ROAD TO RECOVERY
While travel restrictions and the economic fallout from the pandemic induced global recession will weigh on travel demand in the near-term, TE nonetheless expect long-haul source markets to make significant contributions to growth in European travel demand over the coming decade. Once travel restrictions are fully lifted and economies recover, TE expect travel behaviour to converge on pre-pandemic growth trends once again.
Source market contribution to growth in Europe, 2019-30
The United States will make the most significant contribution to Europe-wide travel demand growth between 2019-30 from a long-haul source market. This contribution is expected to be bettered only by Germany and the UK (Europe’s first and second largest source markets based on share of growth in arrivals to the region).
Norway
Sweden
Turkey
Italy
Switzerland
Netherlands
France
Spain
United Kingdom
Germany
Other Europe
0 50 100 150
Norway
Sweden
Turkey
Italy
Switzerland
Netherlands
France
Spain
United Kingdom
Germany
Other Europe
0 150 300 450 600
Domestic Int'l
No. daily flightsSource: Eurocontrol *"High-frequency" = 12 or more flights per day
No. daily flights
GermanyUnited Kingdom
United StatesChina
NetherlandsRussiaFranceSpain
SwitzerlandBelgiumPoland
ItalyDenmark
NorwaySwedenAustria
IndiaTurkeyJapan
CanadaBrazil
0 2 4 6 8 10 12 14
Source: Tourism Economics
% of total Europe inbound arrivals growth, 2019-30

EUROPEAN TOURISM: TRENDS & PROSPECTS (Q2/2021) 24
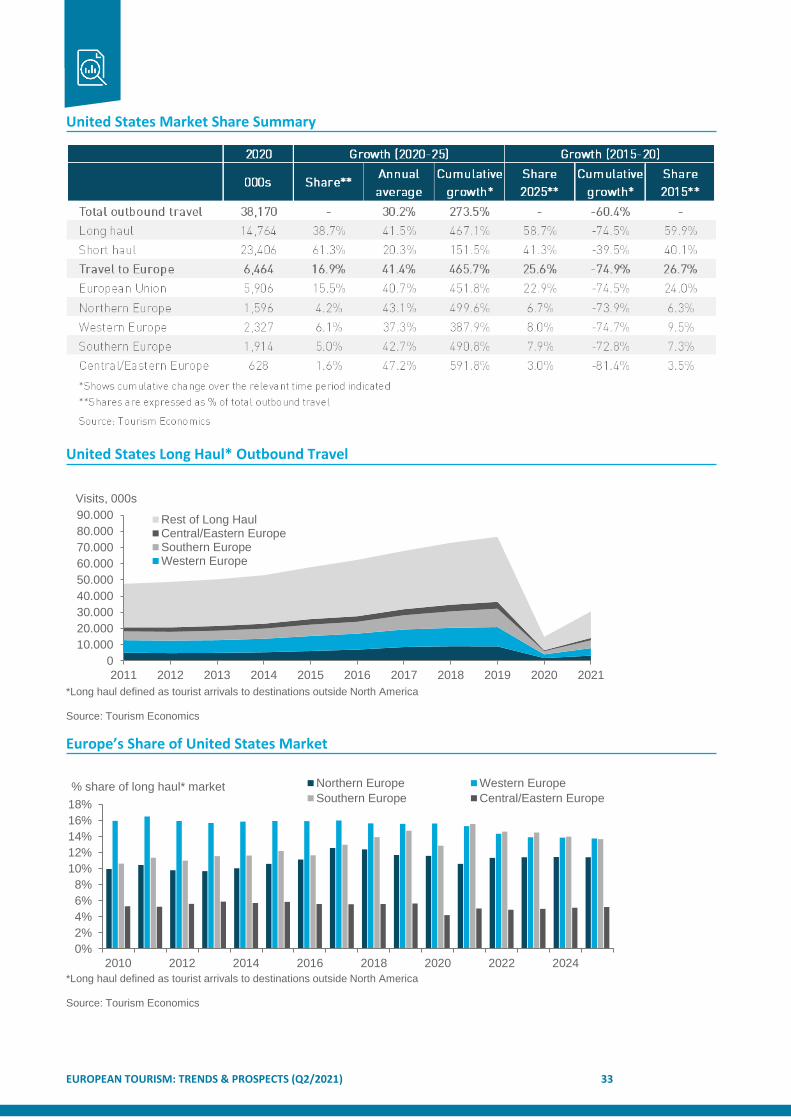
Slower rates of growth from Germany and the UK will yield significant contributions to overall growth in the region because of the large size of these markets. By contrast, arrivals from the US are expected to grow at a much faster rate, consistent with established trends and expected developments in de-mographics and economic activity. Combined with the significant share of past demand, US arrivals are expected to account for 5% of overall arrivals growth over the 2019-30 period. This is the largest expected contribution beyond that from the much larger German and the UK markets which will yield contributions in excess of 12% over the same period.
China is also expected to make a sizeable contribution to European travel demand growth over the next decade. Despite accounting for a smaller proportion of arrivals to the region, an expected robust average annual growth rate of 12% would see Chinese arrivals contribute 4.7% of overall arrivals growth to European destinations over the 2019-30 period. This robust rate of growth will be under-pinned by the rapid increase in the number of middle-income households in China; by 2030 an addi-tional 77 million households are expected to be sufficiently wealthy to travel abroad (with household income over $35,000) compared to 2019. The growing importance of long-haul demand for European destinations overall is evident with a number of key long-haul markets moving into the space occu-pied by some large European source markets.
TE expect the restoration of long-haul demand’s pre-pandemic market share will be slow, not regain-ing its 2019 market share until 2030. The economic scarring caused by the pandemic-induced reces-sion is expected to weigh on inbound and outbound long-haul travel demand. There, this slowness is as much a function of European outbound demand to long-haul destinations being slow to recover, with intra-regional travel accounting for a higher market share compared to pre-pandemic as a con-sequence.
Overnights arrivals to Europe from long-haul source markets
2000 2002 2004 2006 2008 2010 2012 2014 2016 2018 2020 2022 2024 2026 2028 2030
0
2
4
6
8
10
12
14
16
18
Long-haul share
2019 share
Source:Tourism Economics
% share, total overnight arrivals
EUROPEAN TOURISM: TRENDS & PROSPECTS (Q2/2021) 25
5. KEY SOURCE MARKET PERFORMANCE
Trends discussed in this section in some cases relate to the period January to May, although actual coverage varies by destination. For most countries, the latest available data point will be earlier than this. Further detailed monthly data for origin and destination, including absolute values, can be ob-tained from TourMIS (http://tourmis.info).
SUMMARY
KEY INTRA-EUROPEAN SOURCE MARKETS
Relative to 2019 levels for the same period, arrivals across European destinations were an estimated 85% lower based on the latest year-to-date data for 2021. Declines in both arrivals and overnights remain prevalent across the board for two main reasons. First, for the most part, available data cover the period of 2021 when much of Europe was subject lockdown and travel restrictions. Second, com-parison of early-2021 with early-2020 is a comparison between post- and pre-pandemic travel de-mand. Nonetheless, there are some green shoots beginning to emerge, most evident for destinations that are reporting data for May, including the period when there was some easing of restrictions.
German visits and overnights to select destinations
According to Eurocontrol data for April, flights departing from German airports were 71% below April 2019 volumes. Nonetheless, Croatia reported arrivals growth of 195% and overnights growth of 395% from Germany. This is a big swing versus declines of 54% and 28% (arrivals and overnights respec-tively) that were reported for the year-to-March. As of 1st April, anyone can visit Croatia if either a Covid-19 vaccination certificate can be presented, with the final dose administered at least 14 days
-100
-80
-60
-40
-20
0
20
40
Cro
atia
Bu
lga
ria
Luxe
mb
ourg
Se
rbia
Sw
itze
rlan
d
Tu
rke
y
Esto
nia
Mo
na
co
Sw
ed
en
Rom
an
ia
Den
ma
rk
Italy
Sp
ain
Hun
ga
ry
Slo
ve
nia
Lith
uan
ia
Ma
lta
Fin
land
Mo
nte
ne
gro
Ice
lan
d
Norw
ay
Slo
va
kia
Po
rtug
al
Latv
ia
Po
lan
d
Be
lgiu
m
Neth
erl
an
ds
Au
str
ia
Czech
Rep
Arrivals
Nights
Source: TourMIS *date varies (Jan-May) by destination
2021 year-to-date*, % change year ago Croatia, 195% (A) & 395% (N)
• Relative to 2019 levels for the same period, arrivals across European destinations were an estimated 85%
lower based on the latest year-to-date data for 2021.
• Nonetheless, there are some green shoots beginning to emerge, most evident for destinations that are re-
porting data for May, including the period when there was some easing of restrictions.
• Croatia, which is reporting data to May, has enjoyed some return to growth, albeit based on low volumes in
2020. This shows the benefits to early movers in easing restrictions.
EUROPEAN TOURISM: TRENDS & PROSPECTS (Q2/2021) 26
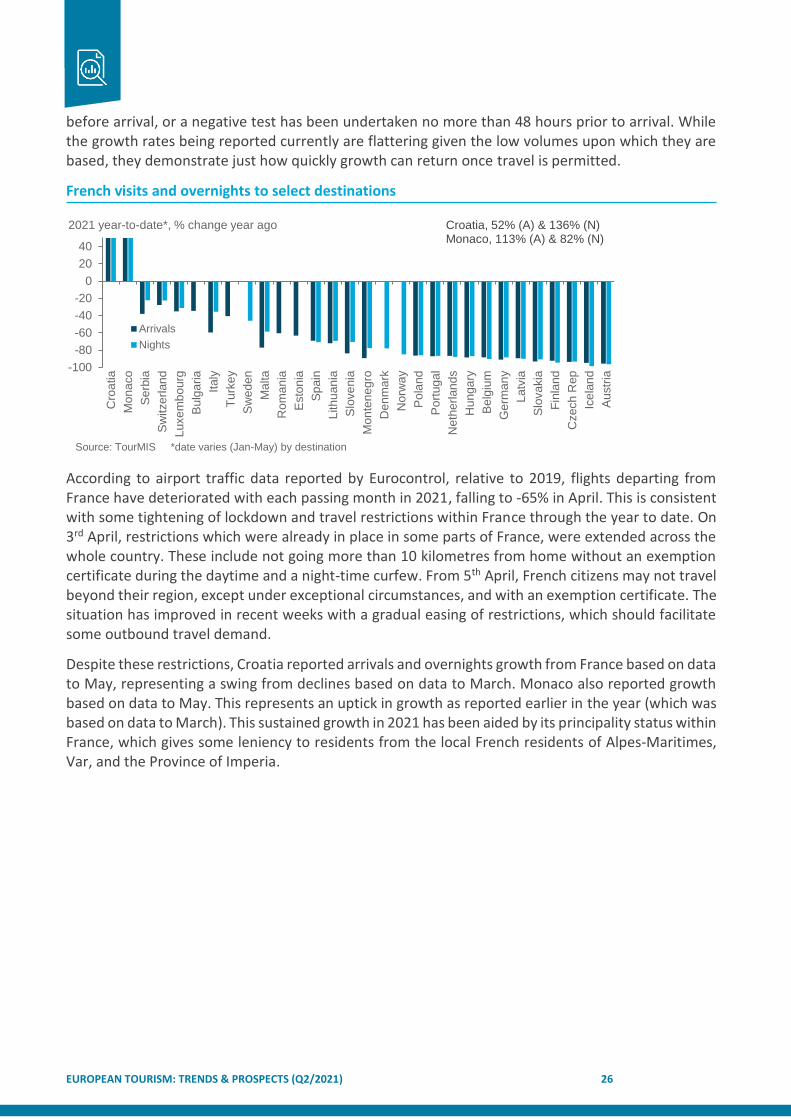
before arrival, or a negative test has been undertaken no more than 48 hours prior to arrival. While the growth rates being reported currently are flattering given the low volumes upon which they are based, they demonstrate just how quickly growth can return once travel is permitted.
French visits and overnights to select destinations
According to airport traffic data reported by Eurocontrol, relative to 2019, flights departing from France have deteriorated with each passing month in 2021, falling to -65% in April. This is consistent with some tightening of lockdown and travel restrictions within France through the year to date. On 3rd April, restrictions which were already in place in some parts of France, were extended across the whole country. These include not going more than 10 kilometres from home without an exemption certificate during the daytime and a night-time curfew. From 5th April, French citizens may not travel beyond their region, except under exceptional circumstances, and with an exemption certificate. The situation has improved in recent weeks with a gradual easing of restrictions, which should facilitate some outbound travel demand.
Despite these restrictions, Croatia reported arrivals and overnights growth from France based on data to May, representing a swing from declines based on data to March. Monaco also reported growth based on data to May. This represents an uptick in growth as reported earlier in the year (which was based on data to March). This sustained growth in 2021 has been aided by its principality status within France, which gives some leniency to residents from the local French residents of Alpes-Maritimes, Var, and the Province of Imperia.
-100
-80
-60
-40
-20
0
20
40
Cro
atia
Mo
na
co
Se
rbia
Sw
itze
rlan
d
Luxe
mb
ourg
Bu
lga
ria
Italy
Tu
rke
y
Sw
ed
en
Ma
lta
Ro
ma
nia
Esto
nia
Sp
ain
Lith
uan
ia
Slo
ve
nia
Mo
nte
ne
gro
De
nm
ark
No
rwa
y
Po
lan
d
Po
rtug
al
Ne
the
rlan
ds
Hu
nga
ry
Be
lgiu
m
Ge
rma
ny
Latv
ia
Slo
va
kia
Fin
land
Czech
Rep
Ice
lan
d
Au
str
ia
Arrivals
Nights
Source: TourMIS *date varies (Jan-May) by destination
2021 year-to-date*, % change year ago Croatia, 52% (A) & 136% (N)Monaco, 113% (A) & 82% (N)

EUROPEAN TOURISM: TRENDS & PROSPECTS (Q2/2021) 27
Italian visits and overnights to select destinations
Lithuania and Croatia have both reported some growth in overnights from Italy according to data to April and May respectively. Although arrivals are lower compared to last year, the average length of stay has increased. Italy had planned to showcase a celebration of Lithuanian independence, and while many events had to be cancelled, the significance of the celebration itself has supported some travel demand. Modest nights growth reported by Croatia is much weaker than from some other markets due to the continued restrictions on Italian outbound.
Restrictions in Italy were extended until the end of April, but the UK and the Tyrol region of Austria have joined the ‘C’ list of countries (which includes most of the EU), which can only be visited for work or health. Despite restrictions being prolonged, departing flights from Italy have continued to recover to 2019 levels, with improvements in March and April compared to February according to Eurocontrol data (-77% in February, ticking up to -75% in March and -73% in April).
United Kingdom visits and overnights to select destinations
While domestic restrictions have eased significantly, at present the UK government permits quaran-tine-free travel (upon return to the UK) to less than a dozen countries, most of which are UK territo-ries. In addition to this, concerns surrounding the prevalence of the Delta Covid-19 variant in the UK have prompted a number of unilateral travel bans against the UK. The impact of these restrictions is evident in the most recent data with all destinations continuing to report steep declines versus the same period a year ago. Eurocontrol air traffic data show flights departing the UK in April 2021 were
-100
-80
-60
-40
-20
0
20
40
Lith
uan
ia
Cro
atia
Se
rbia
Luxe
mb
ourg
Mo
nte
ne
gro
Ma
lta
Mo
na
co
Sw
itze
rlan
d
Sw
ed
en
Tu
rke
y
Bu
lga
ria
Esto
nia
Ro
ma
nia
De
nm
ark
No
rwa
y
Po
lan
d
Sp
ain
Fin
land
Po
rtug
al
Ge
rma
ny
Slo
va
kia
Latv
ia
Au
str
ia
Ne
the
rlan
ds
Be
lgiu
m
Hu
nga
ry
Ice
lan
d
Slo
ve
nia
Czech
Rep
Arrivals
Nights
Source: TourMIS *date varies (Jan-May) by destination
2021 year-to-date*, % change year ago Lithuania, 64% (N)
-100-90-80-70-60-50-40-30-20-10
0
Cro
atia
Mo
na
co
Luxe
mb
ourg
Se
rbia
Italy
Esto
nia
Lith
uan
ia
Tu
rke
y
Sw
ed
en
Norw
ay
Mo
nte
ne
gro
Rom
an
ia
Den
ma
rk
Bu
lga
ria
Sw
itze
rlan
d
Slo
ve
nia
Latv
ia
Ge
rma
ny
Hun
ga
ry
Ma
lta
Po
rtug
al
Fin
land
Neth
erl
an
ds
Be
lgiu
m
Po
lan
d
Sp
ain
Czech
Rep
Slo
va
kia
Au
str
ia
Ice
lan
d
Arrivals
Nights
Source: TourMIS *date varies (Jan-May) by destination
2021 year-to-date*, % change year ago

EUROPEAN TOURISM: TRENDS & PROSPECTS (Q2/2021) 28
82% lower compared to 2019. Portugal’s inclusion on the UK’s initial “green list” in May saw a spike in bookings for UK holidays to Portugal. However, Portugal was swiftly relegated to the “amber list” (meaning a lengthy quarantine period at home is required for anyone returning) and is likely to have stifled demand. Arrivals and overnights data are not yet available beyond March meaning the extent to which these bookings translated to actual arrivals and overnights cannot yet be assessed.
Dutch visits and overnights to select destinations
Unless deemed essential (family emergencies, or for work that cannot be postponed and that re-quires physical presence), Dutch residents were required to remain in the Netherlands until 15th May. Few destinations have reported data for May, meaning that the easing of these restrictions will not yet be visible within the data. There was a clear positive impact for Croatia which has enjoyed some uptick in the number of Dutch arrivals and overnights compared to the same period a year ago.
Russian visits and overnights to select destinations
Russian travel demand has shifted from international to local destinations due to restrictions and government promotions to support local destinations amid the pandemic. Despite this, where re-strictions are more favourable towards them, Russians have travelled internationally. Croatia, Turkey, and Serbia all reported arrivals growth from Russia compared to the same period a year ago.
Despite the Russian government imposing restrictions on regular and chartered air services with Tur-key in April 2021 until 1st June (ostensibly to slow the spread of Covid-19, but possibly also connected to improving relations between Turkey and Ukraine), there was a swing from a 26% fall in arrivals in
-100
-80
-60
-40
-20
0
20
40
Cro
atia
Luxe
mb
ourg
Bu
lga
ria
Tu
rke
y
Neth
erl
an
ds
Mo
na
co
De
nm
ark
Rom
an
ia
Esto
nia
Mo
nte
ne
gro
Sw
ed
en
Ma
lta
Sw
itze
rlan
d
Hun
ga
ry
Slo
ve
nia
Po
lan
d
Lith
uan
ia
Sp
ain
Latv
ia
No
rwa
y
Be
lgiu
m
Slo
va
kia
Fin
land
Ice
lan
d
Ge
rma
ny
Po
rtug
al
Czech
Rep
Au
str
ia
Arrivals
Nights
Source: TourMIS *date varies (Jan-May) by destination
2021 year-to-date*, % change year ago Croatia, 122% (A) & 158% (N)
-100
-80
-60
-40
-20
0
20
40
Cro
atia
Tu
rke
y
Se
rbia
Italy
Mo
nte
ne
gro
Norw
ay
Mo
na
co
Rom
an
ia
Sw
itze
rlan
d
Ma
lta
Bu
lga
ria
Den
ma
rk
Slo
ve
nia
Sp
ain
Neth
erl
an
ds
Ge
rma
ny
Ice
lan
d
Sw
ed
en
Lith
uan
ia
Po
lan
d
Po
rtug
al
Be
lgiu
m
Esto
nia
Latv
ia
Slo
va
kia
Hun
ga
ry
Fin
land
Au
str
ia
Czech
Rep
Arrivals
Nights
Source: TourMIS *date varies (Jan-May) by destination
2021 year-to-date*, % change year agoCroatia, 82% (A) & 51% (N)Turkey, 74% (A)
EUROPEAN TOURISM: TRENDS & PROSPECTS (Q2/2021) 29
the year-to-February to 74% growth in the year-to-April. However, there may be a lag on the impact of these restrictions which will become apparent in May data.
NON-EUROPEAN SOURCE MARKETS
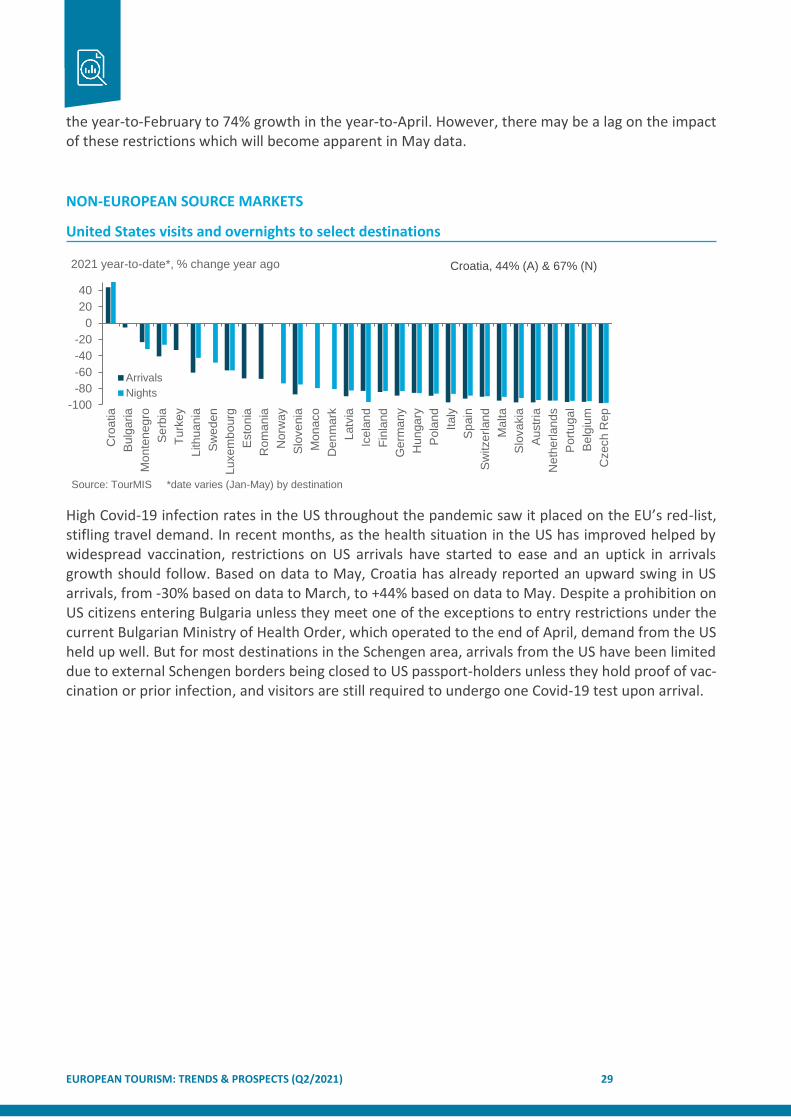
United States visits and overnights to select destinations
High Covid-19 infection rates in the US throughout the pandemic saw it placed on the EU’s red-list, stifling travel demand. In recent months, as the health situation in the US has improved helped by widespread vaccination, restrictions on US arrivals have started to ease and an uptick in arrivals growth should follow. Based on data to May, Croatia has already reported an upward swing in US arrivals, from -30% based on data to March, to +44% based on data to May. Despite a prohibition on US citizens entering Bulgaria unless they meet one of the exceptions to entry restrictions under the current Bulgarian Ministry of Health Order, which operated to the end of April, demand from the US held up well. But for most destinations in the Schengen area, arrivals from the US have been limited due to external Schengen borders being closed to US passport-holders unless they hold proof of vac-cination or prior infection, and visitors are still required to undergo one Covid-19 test upon arrival.
-100
-80
-60
-40
-20
0
20
40
Cro
atia
Bu
lga
ria
Mo
nte
ne
gro
Se
rbia
Tu
rke
y
Lith
uan
ia
Sw
ed
en
Luxe
mb
ourg
Esto
nia
Rom
an
ia
No
rwa
y
Slo
ve
nia
Mo
na
co
Den
ma
rk
Latv
ia
Ice
lan
d
Fin
land
Ge
rma
ny
Hun
ga
ry
Po
lan
d
Italy
Sp
ain
Sw
itze
rlan
d
Ma
lta
Slo
va
kia
Au
str
ia
Neth
erl
an
ds
Po
rtug
al
Be
lgiu
m
Czech
Rep
Arrivals
Nights
Source: TourMIS *date varies (Jan-May) by destination
2021 year-to-date*, % change year ago Croatia, 44% (A) & 67% (N)

EUROPEAN TOURISM: TRENDS & PROSPECTS (Q2/2021) 30
Chinese visits and overnights to select destinations
While Chinese domestic travel appeared to recover 2019 volumes in April, international demand re-mains well below 2019, with no destinations reporting growth so far in 2021. Rather than being due to travel restrictions present in Europe, lack of demand seems due to the Chinese government re-stricting Chinese airlines to just one international route to any specific country with no more than one flight every week. Sentiment towards foreign travel being lukewarm in China is also a factor.
Japanese visits and overnights to select destinations
In January, Japan declared a state of emergency in Tokyo which was expected to last one month. These emergency measures were reintroduced in April and were then extended until June 20th. These restrictions have severely limited outbound travel demand from Japan (as well as inbound). The se-verity of the restrictions has not been helped by Japan’s relatively slow start to its vaccination pro-gramme. Consequently, all destinations in Europe have reported declines from Japan for the year so far. With a significant proportion of Japanese citizens opposed to the Olympic Games going ahead this summer, there is clearly a high-degree of risk aversion impacting on Japanese outbound.
-100-90-80-70-60-50-40-30-20-10
0
Se
rbia
Ro
ma
nia
Ma
lta
Tu
rke
y
De
nm
ark
Bu
lga
ria
Cro
atia
Latv
ia
Po
lan
d
Mo
nte
ne
gro
Sw
ed
en
Lith
uan
ia
Slo
ve
nia
Ne
the
rlan
ds
Sp
ain
Ge
rma
ny
Hu
nga
ry
Be
lgiu
m
Sw
itze
rlan
d
No
rwa
y
Fin
land
Po
rtug
al
Au
str
ia
Slo
va
kia
Czech
Rep
Ice
lan
d
Arrivals Nights
Source: TourMIS *date varies (Jan-May) by destination
2021 year-to-date*, % change year ago
-100-90-80-70-60-50-40-30-20-10
0
Slo
ve
nia
Hun
ga
ry
Se
rbia
Den
ma
rk
Esto
nia
Mo
nte
ne
gro
Sw
ed
en
Cro
atia
Po
lan
d
Fin
land
Germ
an
y
Slo
va
kia
Sw
itze
rlan
d
Latv
ia
Tu
rke
y
Norw
ay
Czech
Rep
Italy
Au
str
ia
Sp
ain
Be
lgiu
m
Po
rtug
al
Lith
uan
ia
Ice
lan
d
Arrivals Nights
Source: TourMIS *date varies (Jan-May) by destination
2021 year-to-date*, % change year ago

EUROPEAN TOURISM: TRENDS & PROSPECTS (Q2/2021) 31
Indian visits and overnights to select destinations
Only Montenegro has reported growth from India in 2021, and in overnights only (arrivals declined, but by less than all other reporting destinations). However, Montenegro was among the worst per-formers in Q1 2020 and actual volumes of Indian visitors are very small and, therefore, subject to quite large swings. Travel from India has been subject to significant restrictions in most destinations due to the emergence of the more transmissible Delta variant.
The vaccine roll-out which began in January did briefly boost traveller confidence, but record high levels of new infections from April onwards (including a new variant) is significant and has prompted most destinations to impose prohibitive arrivals restrictions on India to combat the risk. Difficulties in procuring enough vaccines despite being one of the world’s major producers has not helped. The impact of these restrictions will become more visible in the coming months as more recent data cov-ering their imposition become available.
Canadian visits and overnights to select destinations
Only Montenegro reported any growth from Canada for 2021 so far, with arrivals 5.8% higher accord-ing to data-to-April compared to the same period of 2020. This is despite the Canadian government advising against any non-essential travel from Canada and the requirement upon re-entry to take a Covid-19 test and a mandatory stay of up to three nights at a government-authorised accommodation for air travellers. In common with most destinations in the Schengen area, arrivals from Canada have been limited due to external Schengen borders being closed to Canadians unless they hold proof of vaccination or prior infection, and visitors are still required to undergo one Covid-19 test upon arrival.
-100
-80
-60
-40
-20
0
20
40
Mo
nte
ne
gro
Se
rbia
Bu
lga
ria
Cro
atia
Sw
ed
en
Tu
rke
y
De
nm
ark
Sp
ain
Ro
ma
nia
Ge
rma
ny
Po
rtug
al
Po
lan
d
Ne
the
rlan
ds
Slo
va
kia
Sw
itze
rlan
d
Be
lgiu
m
Fin
land
Mo
na
co
Latv
ia
Czech
Rep
Hu
nga
ry
Au
str
ia
Ice
lan
d
Arrivals
Nights
Source: TourMIS *date varies (Jan-May) by destination
2021 year-to-date*, % change year ago Montenegro, 130% (N)
-100
-80
-60
-40
-20
0
Mo
nte
ne
gro
Cro
atia
Mo
na
co
Latv
ia
Ma
lta
Tu
rke
y
Se
rbia
Ro
ma
nia
Sp
ain
Sw
ed
en
Fin
land
Slo
ve
nia
Sw
itze
rlan
d
Hun
ga
ry
Italy
Ge
rma
ny
Den
ma
rk
Lith
uan
ia
Au
str
ia
Be
lgiu
m
Slo
va
kia
Po
lan
d
Po
rtug
al
Czech
Rep
Ice
lan
d
Arrivals Nights
Source: TourMIS *date varies (Jan-May) by destination
2021 year-to-date*, % change year ago
EUROPEAN TOURISM: TRENDS & PROSPECTS (Q2/2021) 32
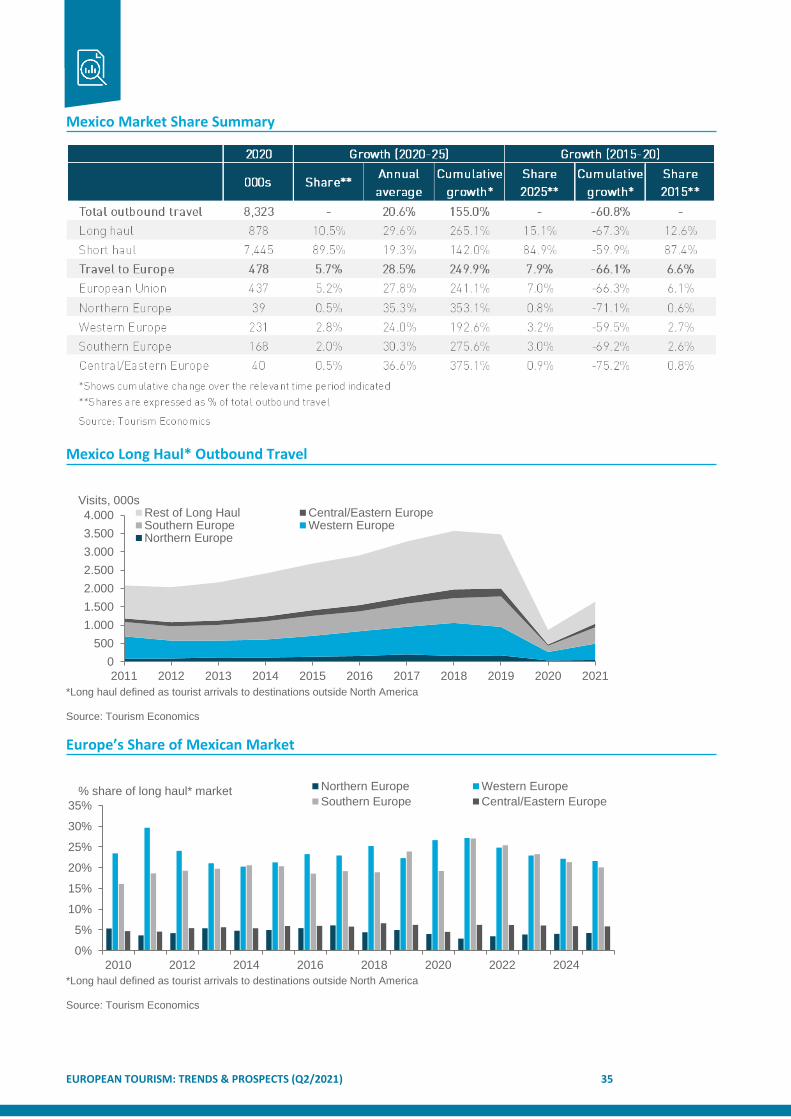
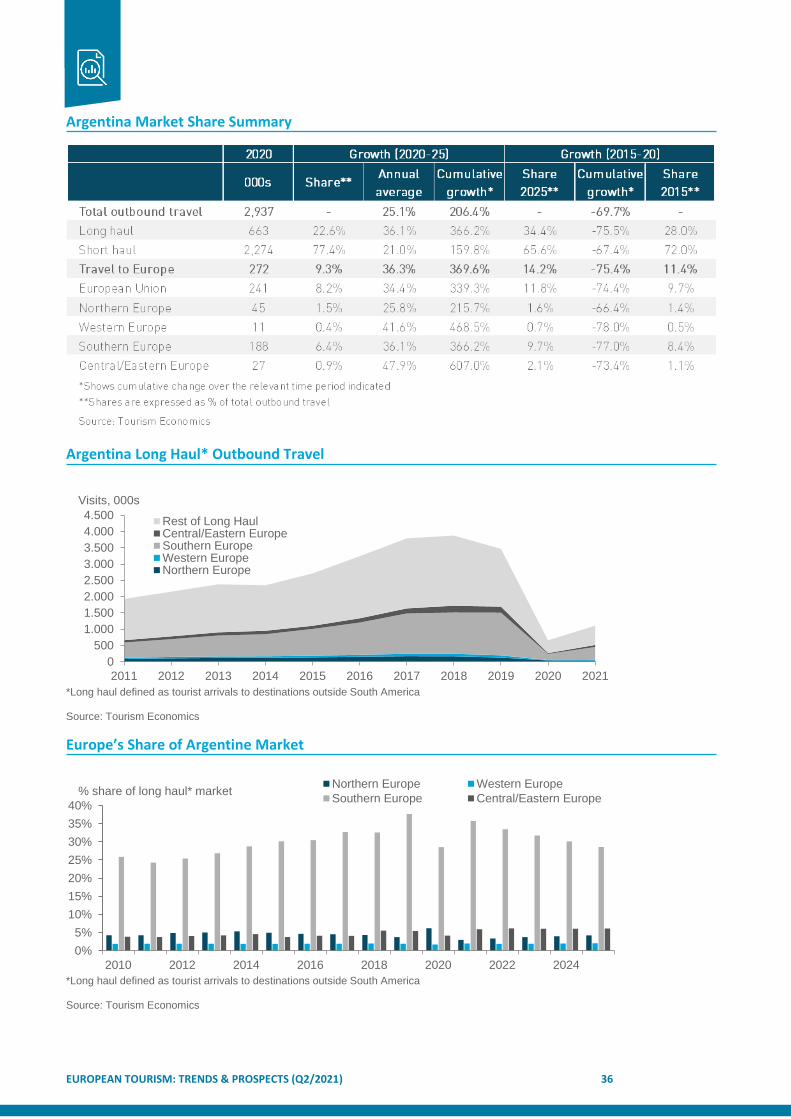
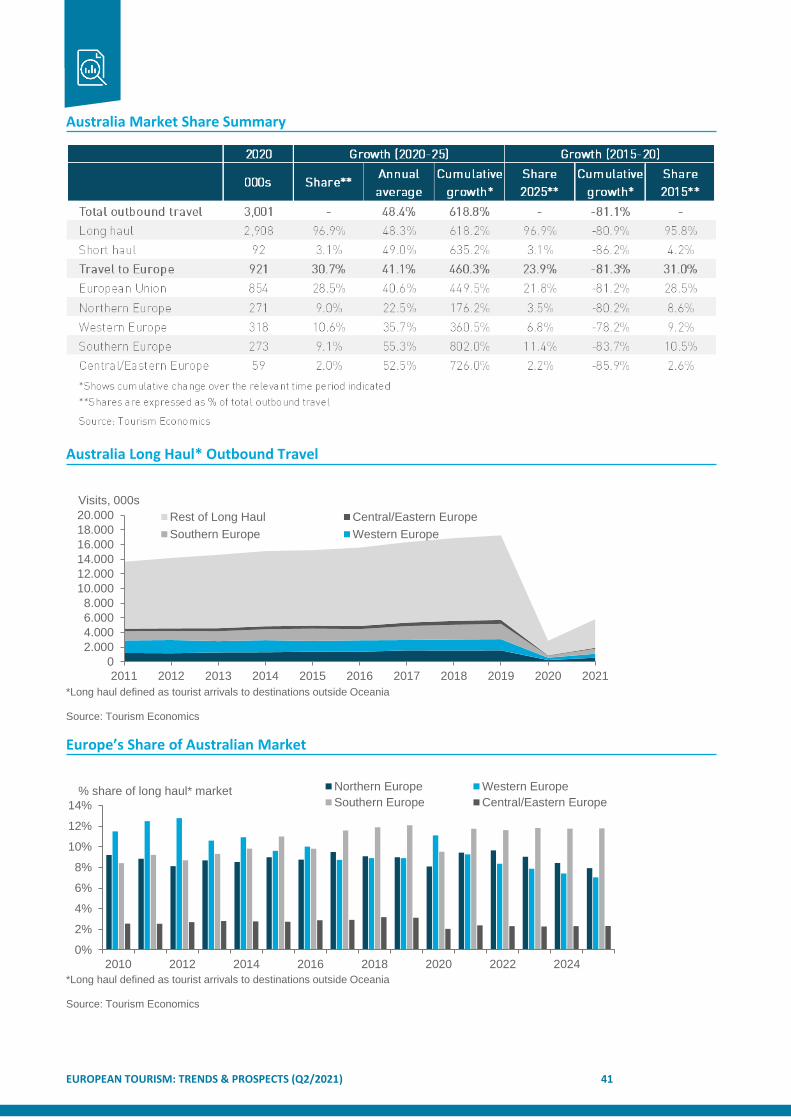
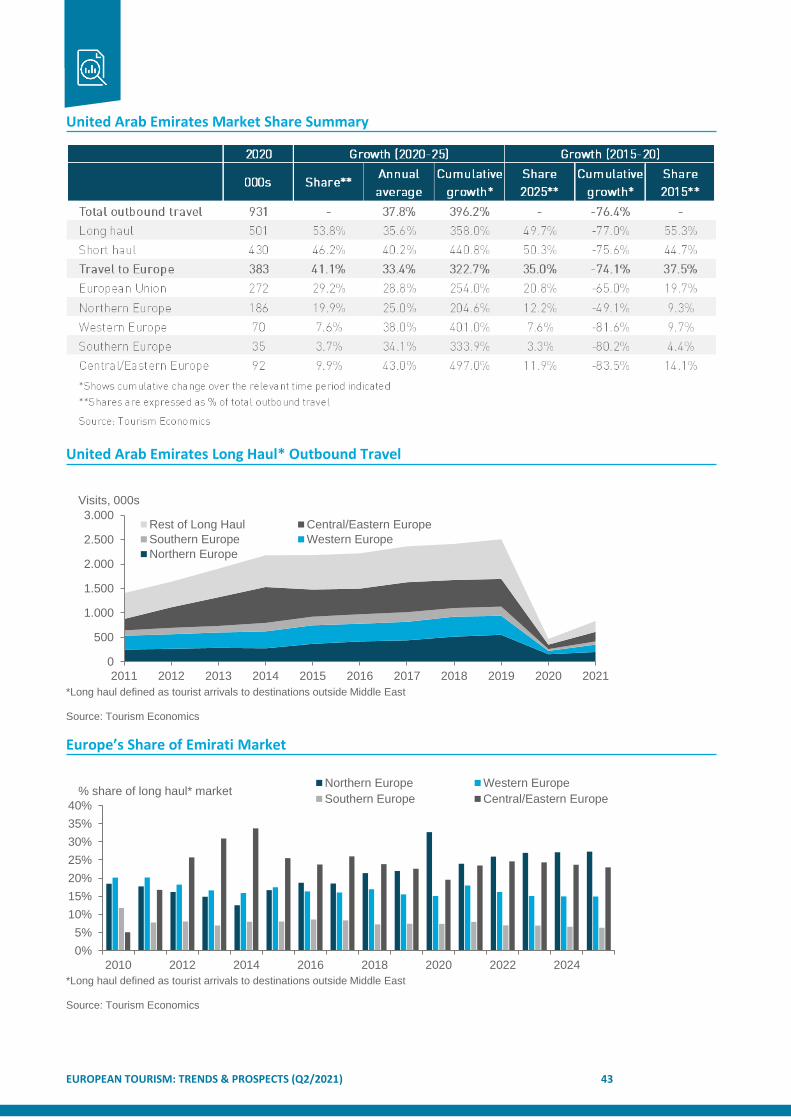
6. ORIGIN MARKET SHARE ANALYSIS
Based on the Tourism Economics’ Global Travel Service (GTS) model, the following charts and analysis show Europe’s evolving market position – in absolute and percentage terms – for selected source mar-kets.
Data in these charts and tables relate to reported arrivals in all destinations as a comparable measure of outbound travel for calculation of market share.
For example, US outbound figures featured in the analysis are larger than reported departures in na-tional statistics as long-haul trips often involve travel to multiple destinations. In a given year, US data reporting shows significantly fewer departures to Europe compared to the sum of European arrivals from the US. Thus, each US trip to Europe involved a visit to more than one destinations on average.
The geographies of Europe are defined as follows:
Northern Europe is Denmark, Finland, Iceland, Ireland, Norway, Sweden, and the UK;
Western Europe is Austria, Belgium, France, Germany, Luxembourg, Netherlands, and Swit-zerland;
Southern/Mediterranean Europe is Albania, Bosnia-Herzegovina, Croatia, Cyprus, North Mac-edonia, Greece, Italy, Malta, Montenegro, Portugal, Serbia, Slovenia, Spain, and Turkey;
Central/Eastern Europe is Armenia, Azerbaijan, Bulgaria, Czech Republic, Estonia, Hungary, Kazakhstan, Kyrgyzstan, Latvia, Lithuania, Poland, Romania, Russian Federation, Slovakia, and Ukraine.
EUROPEAN TOURISM: TRENDS & PROSPECTS (Q2/2021) 33
United States Market Share Summary
United States Long Haul* Outbound Travel
Europe’s Share of United States Market
0
10.000
20.000
30.000
40.000
50.000
60.000
70.000
80.000
90.000
2011 2012 2013 2014 2015 2016 2017 2018 2019 2020 2021
Rest of Long HaulCentral/Eastern EuropeSouthern EuropeWestern Europe
*Long haul defined as tourist arrivals to destinations outside North America
Source: Tourism Economics
Visits, 000s
2010 2012 2014 2016 2018 2020 2022 2024
0%
2%
4%
6%
8%
10%
12%
14%
16%
18%
Northern Europe Western Europe
Southern Europe Central/Eastern Europe
*Long haul defined as tourist arrivals to destinations outside North America
Source: Tourism Economics
% share of long haul* market

EUROPEAN TOURISM: TRENDS & PROSPECTS (Q2/2021) 34
Canada Market Share Summary
Canada Long Haul* Outbound Travel
Europe’s Share of Canadian Market
0
2.000
4.000
6.000
8.000
10.000
12.000
14.000
16.000
18.000
2011 2012 2013 2014 2015 2016 2017 2018 2019 2020 2021
Rest of Long Haul Central/Eastern EuropeSouthern Europe Western EuropeNorthern Europe
*Long haul defined as tourist arrivals to destinations outside North America
Source: Tourism Economics
Visits, 000s
2010 2012 2014 2016 2018 2020 2022 2024
0%
5%
10%
15%
20%
25%
Northern Europe Western Europe
Southern Europe Central/Eastern Europe
*Long haul defined as tourist arrivals to destinations outside North America
Source: Tourism Economics
% share of long haul* market
EUROPEAN TOURISM: TRENDS & PROSPECTS (Q2/2021) 35
Mexico Market Share Summary
Mexico Long Haul* Outbound Travel
Europe’s Share of Mexican Market
0
500
1.000
1.500
2.000
2.500
3.000
3.500
4.000
2011 2012 2013 2014 2015 2016 2017 2018 2019 2020 2021
Rest of Long Haul Central/Eastern EuropeSouthern Europe Western EuropeNorthern Europe
*Long haul defined as tourist arrivals to destinations outside North America
Source: Tourism Economics
Visits, 000s
2010 2012 2014 2016 2018 2020 2022 2024
0%
5%
10%
15%
20%
25%
30%
35%
Northern Europe Western Europe
Southern Europe Central/Eastern Europe
*Long haul defined as tourist arrivals to destinations outside North America
Source: Tourism Economics
% share of long haul* market
EUROPEAN TOURISM: TRENDS & PROSPECTS (Q2/2021) 36
Argentina Market Share Summary
Argentina Long Haul* Outbound Travel
Europe’s Share of Argentine Market
0
500
1.000
1.500
2.000
2.500
3.000
3.500
4.000
4.500
2011 2012 2013 2014 2015 2016 2017 2018 2019 2020 2021
Rest of Long HaulCentral/Eastern EuropeSouthern EuropeWestern EuropeNorthern Europe
*Long haul defined as tourist arrivals to destinations outside South America
Source: Tourism Economics
Visits, 000s
2010 2012 2014 2016 2018 2020 2022 2024
0%
5%
10%
15%
20%
25%
30%
35%
40%
Northern Europe Western Europe
Southern Europe Central/Eastern Europe
*Long haul defined as tourist arrivals to destinations outside South America
Source: Tourism Economics
% share of long haul* market

EUROPEAN TOURISM: TRENDS & PROSPECTS (Q2/2021) 37
Brazil Market Share Summary
Brazil Long Haul* Outbound Travel
Europe’s Share of Brazilian Market
0
1.000
2.000
3.000
4.000
5.000
6.000
7.000
8.000
9.000
10.000
2011 2012 2013 2014 2015 2016 2017 2018 2019 2020 2021
Rest of Long Haul Central/Eastern EuropeSouthern Europe Western EuropeNorthern Europe
*Long haul defined as tourist arrivals to destinations outside South America
Source: Tourism Economics
Visits, 000s
2010 2012 2014 2016 2018 2020 2022 2024
0%
5%
10%
15%
20%
25%
30%
35%
40%
Northern Europe Western Europe
Southern Europe Central/Eastern Europe
*Long haul defined as tourist arrivals to destinations outside South America
Source: Tourism Economics
% share of long haul* market

EUROPEAN TOURISM: TRENDS & PROSPECTS (Q2/2021) 38
India Market Share Summary
India Long Haul* Outbound Travel
Europe’s Share of Indian Market
0
5.000
10.000
15.000
20.000
25.000
2011 2012 2013 2014 2015 2016 2017 2018 2019 2020 2021
Rest of Long Haul Central/Eastern Europe
Southern Europe Western Europe
Northern Europe
*Long haul defined as tourist arrivals to destinations outside South Asia
Source: Tourism Economics
Visits, 000s
2010 2012 2014 2016 2018 2020 2022 2024
0%
2%
4%
6%
8%
10%
12%
Northern Europe Western Europe
Southern Europe Central/Eastern Europe
*Long haul defined as tourist arrivals to destinations outside South Asia
Source: Tourism Economics
% share of long haul* market

EUROPEAN TOURISM: TRENDS & PROSPECTS (Q2/2021) 39
China Market Share Summary
China Long Haul* Outbound Travel
Europe’s Share of Chinese Market
0
10.000
20.000
30.000
40.000
50.000
60.000
2011 2012 2013 2014 2015 2016 2017 2018 2019 2020 2021
Rest of Long HaulCentral/Eastern EuropeSouthern EuropeWestern EuropeNorthern Europe
*Long haul defined as tourist arrivals to destinations outside Northeast Asia
Source: Tourism Economics
Visits, 000s
2010 2012 2014 2016 2018 2020 2022 2024
0%
2%
4%
6%
8%
10%
12%
14%
16%
18%
Northern Europe Western Europe
Southern Europe Central/Eastern Europe
*Long haul defined as tourist arrivals to destinations outside Northeast Asia
Source: Tourism Economics
% share of long haul* market

EUROPEAN TOURISM: TRENDS & PROSPECTS (Q2/2021) 40
Japan Market Share Summary
Japan Long Haul* Outbound Travel
Europe’s Share of Japanese Market
0
2.000
4.000
6.000
8.000
10.000
12.000
14.000
16.000
18.000
2011 2012 2013 2014 2015 2016 2017 2018 2019 2020 2021
Rest of Long Haul Central/Eastern EuropeSouthern Europe Western EuropeNorthern Europe
*Long haul defined as tourist arrivals to destinations outside Northeast Asia
Source: Tourism Economics
Visits, 000s
2010 2012 2014 2016 2018 2020 2022 2024
0%
2%
4%
6%
8%
10%
12%
14%
16%
18%
Northern Europe Western EuropeSouthern Europe Central/Eastern Europe
*Long haul defined as tourist arrivals to destinations outside Northeast Asia
Source: Tourism Economics
% share of long haul* market
EUROPEAN TOURISM: TRENDS & PROSPECTS (Q2/2021) 41
Australia Market Share Summary
Australia Long Haul* Outbound Travel
Europe’s Share of Australian Market
0
2.000
4.000
6.000
8.000
10.000
12.000
14.000
16.000
18.000
20.000
2011 2012 2013 2014 2015 2016 2017 2018 2019 2020 2021
Rest of Long Haul Central/Eastern Europe
Southern Europe Western Europe
*Long haul defined as tourist arrivals to destinations outside Oceania
Source: Tourism Economics
Visits, 000s
2010 2012 2014 2016 2018 2020 2022 2024
0%
2%
4%
6%
8%
10%
12%
14%
Northern Europe Western Europe
Southern Europe Central/Eastern Europe
*Long haul defined as tourist arrivals to destinations outside Oceania
Source: Tourism Economics
% share of long haul* market

EUROPEAN TOURISM: TRENDS & PROSPECTS (Q2/2021) 42
Russia Market Share Summary
Russia Long Haul* Outbound Travel
Europe’s Share of Russian Market
0
5.000
10.000
15.000
20.000
25.000
30.000
35.000
40.000
45.000
2011 2012 2013 2014 2015 2016 2017 2018 2019 2020 2021
Rest of World Central/Eastern Europe
Southern Europe Western Europe
Northern Europe
*Long haul defined as tourist arrivals to all destinations
Source: Tourism Economics
Visits, 000s
2010 2012 2014 2016 2018 2020 2022 2024
0%
10%
20%
30%
40%
50%
60%
Northern Europe Western Europe
Southern Europe Central/Eastern Europe
*Long haul defined as tourist arrivals to all destinations
Source: Tourism Economics
% share of long haul* market
EUROPEAN TOURISM: TRENDS & PROSPECTS (Q2/2021) 43
United Arab Emirates Market Share Summary
United Arab Emirates Long Haul* Outbound Travel
Europe’s Share of Emirati Market
0
500
1.000
1.500
2.000
2.500
3.000
2011 2012 2013 2014 2015 2016 2017 2018 2019 2020 2021
Rest of Long Haul Central/Eastern Europe
Southern Europe Western Europe
Northern Europe
*Long haul defined as tourist arrivals to destinations outside Middle East
Source: Tourism Economics
Visits, 000s
2010 2012 2014 2016 2018 2020 2022 2024
0%
5%
10%
15%
20%
25%
30%
35%
40%
Northern Europe Western Europe
Southern Europe Central/Eastern Europe
*Long haul defined as tourist arrivals to destinations outside Middle East
Source: Tourism Economics
% share of long haul* market

EUROPEAN TOURISM: TRENDS & PROSPECTS (Q2/2021) 44
7. ECONOMIC OUTLOOK
Assessing recent tourism data and industry performance is a useful way of directly monitoring the key trends for travel demand across Europe. This can be complemented by looking at key trends and rela-tionships in macroeconomic performance in Europe’s key source markets which can provide further insight into likely tourism developments throughout the year.
The linkages between macroeconomics and tourism performance can be very informative. For exam-ple, strong GDP or consumer spending growth is an indication of rising prosperity with people more likely to travel abroad. It is also an indication of rising business activity and therefore stronger business travel. Movements in exchange rates against the euro can be equally important as it can influence choice of destination. For example, if the euro appreciated (gained value) against the US dollar, the Eurozone would become a more expensive destination and therefore potentially less attractive for US visitors. Conversely, depreciation of the euro against the US dollar would make the Eurozone a rela-tively cheaper destination and therefore more attractive to US travellers.
Disclaimer: the opinions expressed in the forthcoming section [Economic Outlook] are those of Ox-ford Economics (“we, us, our”). They do not purport to reflect the opinions or views of ETC or its members.
OVERVIEW
We have nudged up our world GDP growth forecast for 2021 to 6.4% from 6.3% previously and con-tinue to expect a healthy gain of 4.6% in 2022. Our above consensus outlook for global economic growth both this year and next year continues to be supported by recent activity developments.
Recent news on Covid-19 cases have been positive, as global case numbers are almost back down to their March lows, and economic data have continued to consistently beat economists’ expectations on the upside. Business surveys indicate that the healthy rebalancing of the global economy away from manufacturing and towards services is continuing. The global services PMI remains comfortably ahead of the manufacturing headline index for a second consecutive month after rising in May.
We continue to expect a strong global growth rebound in Q2 as the Chinese economy regains mo-mentum and advanced economies benefit from a relaxation in activity restrictions and the resulting release of pent-up demand by households. Non-Chinese emerging markets are likely to see GDP growth slow in Q2 because of a surge in Covid-19 cases, most notably in India, but growth should improve in H2.
We have raised our CPI inflation forecasts to reflect the strengthening recovery, supply bottlenecks, and rising cost pressures. At a global level, we now expect inflation to average 3.8% this year, the strongest annual rise since the 2011/2012 period.
Although there has been plenty of talk about a new inflation regime, we still think there is only a small chance of the current inflation pick-up marking the start of a sustained period of high inflation. For most economies, we continue to believe the current rise in inflation is a response to temporary supply and demand dynamics that will start to subside as we move into 2022.
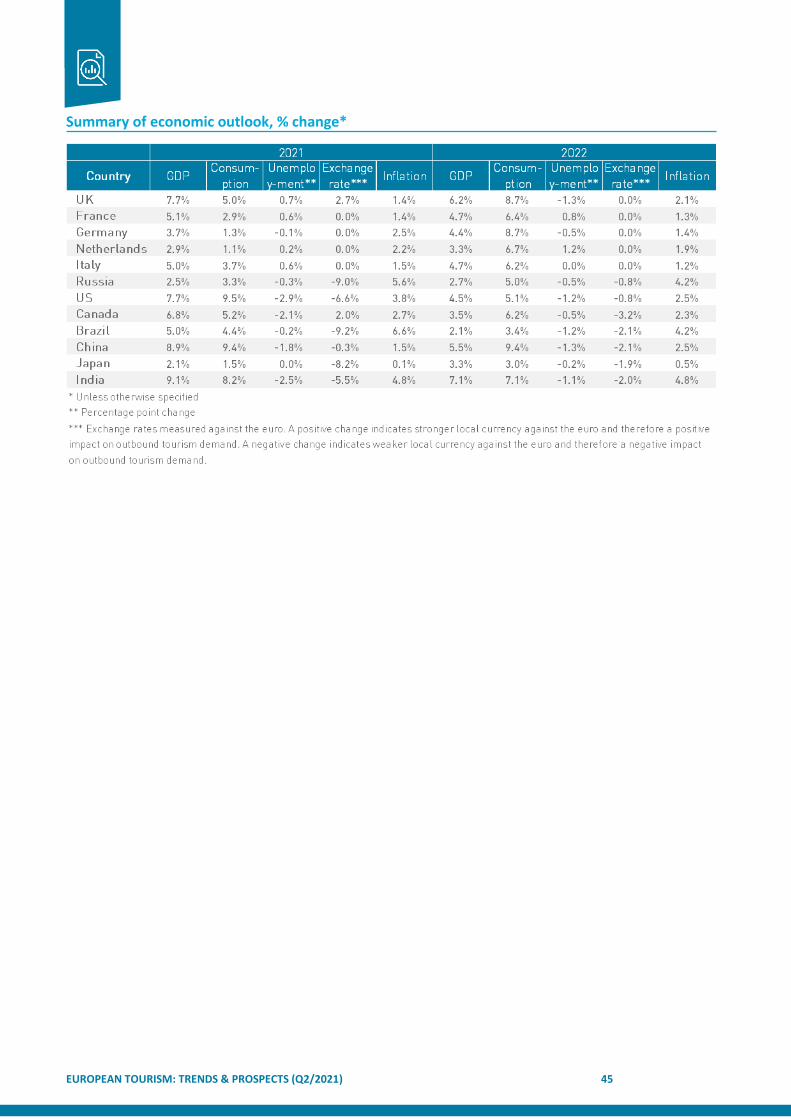
EUROPEAN TOURISM: TRENDS & PROSPECTS (Q2/2021) 45
Summary of economic outlook, % change*

EUROPEAN TOURISM: TRENDS & PROSPECTS (Q2/2021) 46
EUROZONE
Restrictions to fight second and third waves of Covid-19 infections weakened activity across the eu-rozone at the start of the year. But the situation is improving thanks to falling infection numbers and rising vaccination rates. Governments have started to ease restrictions, and consumers are eager to take advantage. High-frequency data points to a faster-than-expected rebound in consumption, as the reopening of the hospitality and non-essential retail sectors lifts prospects for Europe’s tourism hotspots. We now forecast GDP growth of 4.3% in 2021 (up from 4.2% last month) and increasing to 4.6% in 2022.
Retail sales dropped 3.1% month on month in April after rising 3.3% in March, signalling that measures to counter the spread of Covid-19 continue to weigh on economic activity. But more recent evidence from mobility data and surveys paints a more upbeat picture. The services PMI jumped to a three-year high in May, while Google mobility data at the end of May suggest that activity in non-essential retail and the hospitality sector rose to near the highs seen last summer. Our Eurozone Re-covery Tracker also suggests activity strengthened throughout May.
After a GDP drop of 0.6% in Q1, vaccination progress and the gradual but broad-based reopening of the eurozone economies point to a strong GDP rise in Q2 and Q3. While uncertainty surrounding the scale of the rebound is still high, our bottom-up forecast now points to quarterly GDP growth of 1.7% in Q2 and 2.2% in Q3.
Inflation rose to 2% in May, the highest in over two years, due to surging energy prices. But underlying price pressures remained subdued, with core inflation rising to 0.9%. Inflation could be as high as 2.5% in H2, lifted by price hikes in hospitality, supply-bottlenecks, and base effects. We expect infla-tion to average 1.8% this year, but we anticipate a slowdown to 1.4% in 2022 given weak underlying price pressures.
Economic performance in key eurozone economies, GDP real
-10
-8
-6
-4
-2
0
2
4
6
2011 2014 2017 2020 2023
Germany France Italy
Source: Oxford Economics
% change year ago
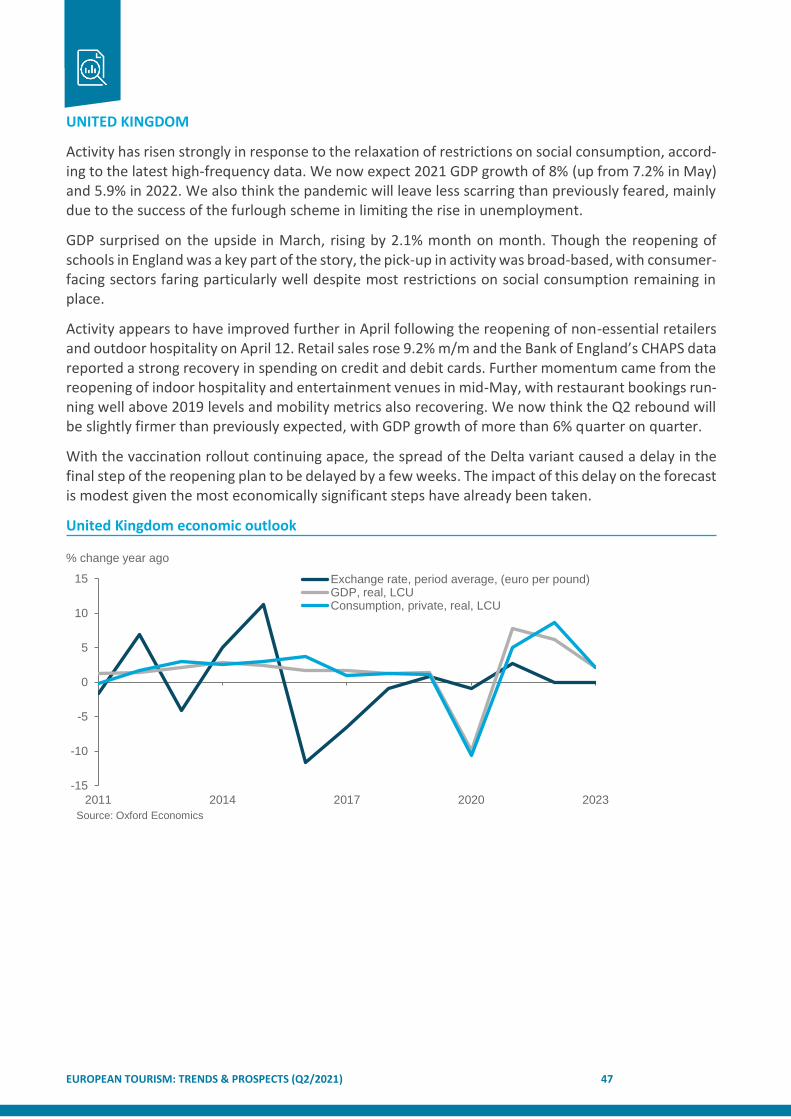
EUROPEAN TOURISM: TRENDS & PROSPECTS (Q2/2021) 47
UNITED KINGDOM
Activity has risen strongly in response to the relaxation of restrictions on social consumption, accord-ing to the latest high-frequency data. We now expect 2021 GDP growth of 8% (up from 7.2% in May) and 5.9% in 2022. We also think the pandemic will leave less scarring than previously feared, mainly due to the success of the furlough scheme in limiting the rise in unemployment.
GDP surprised on the upside in March, rising by 2.1% month on month. Though the reopening of schools in England was a key part of the story, the pick-up in activity was broad-based, with consumer-facing sectors faring particularly well despite most restrictions on social consumption remaining in place.
Activity appears to have improved further in April following the reopening of non-essential retailers and outdoor hospitality on April 12. Retail sales rose 9.2% m/m and the Bank of England’s CHAPS data reported a strong recovery in spending on credit and debit cards. Further momentum came from the reopening of indoor hospitality and entertainment venues in mid-May, with restaurant bookings run-ning well above 2019 levels and mobility metrics also recovering. We now think the Q2 rebound will be slightly firmer than previously expected, with GDP growth of more than 6% quarter on quarter.
With the vaccination rollout continuing apace, the spread of the Delta variant caused a delay in the final step of the reopening plan to be delayed by a few weeks. The impact of this delay on the forecast is modest given the most economically significant steps have already been taken.
United Kingdom economic outlook
-15
-10
-5
0
5
10
15
2011 2014 2017 2020 2023
Exchange rate, period average, (euro per pound)GDP, real, LCUConsumption, private, real, LCU
Source: Oxford Economics
% change year ago

EUROPEAN TOURISM: TRENDS & PROSPECTS (Q2/2021) 48
UNITED STATES
The US economy is about to experience a summer boom fuelled by reduced virus fears, steady house-hold incomes, and elevated savings. Consumer demand will rotate from goods toward services while supply gradually responds to stronger activity. Higher inflation will be a feature of the transitory sup-ply and demand imbalance, but we do not foresee the economy overheating. We continue to expect GDP growth of 7.7% in 2021, the fastest rate since 1951.
Consumer spending paused in April after a shopping spree in March. But households still have the itch to spend, the means to do so, and fewer health reasons not to indulge. As health conditions improve and the economy reopens, generous fiscal stimulus, rebounding employment, and rising op-timism will power consumption growth of 9.5% this year – the strongest performance since 1946.
The labour market only felt a little warmer in May as the economy added 559,000 jobs, while the unemployment rate fell to 5.8% amid lower labour force participation. While the spectacle of a blooming labour market is not visible yet, we still foresee multiple +1 million jobs reports over the summer with the economy adding around 8 million jobs in 2021 and the unemployment rate falling to 4.3% by year-end.
Our baseline signals that the pickup in inflation is neither purely “transitory” nor the start of an up-ward spiral. We see headline inflation averaging 3.2% in 2021 and core PCE at 3.1% – its highest since the early 1990s. Core inflation will likely display some signs of stickiness, remaining at 2.5% in 2022 compared with 1.6% during 2010-2019.
In this environment, we anticipate the Fed will tread carefully and await a formal announcement for QE tapering plans at the annual Jackson Hole Economic Symposium in August, with tapering com-mencing in early 2022. Thereafter, we believe the Fed will proceed with a rate lift-off in Q1 2023.
United States economic outlook
-20
-15
-10
-5
0
5
10
15
2011 2014 2017 2020 2023
Exchange rate, period average, per euro
GDP, real, LCU
Unemployment rate
Source: Oxford Economics *Unemployment rate is absolute
% change year ago*

EUROPEAN TOURISM: TRENDS & PROSPECTS (Q2/2021) 49
JAPAN
The Japanese government extended the State of Emergency (SOE) for major cities until June 20th, meaning that the economy will likely experience another contraction in Q2 after the 1.3% decline in Q1. We have therefore downgraded our 2021 GDP forecast to 2.1% from 3% previously. We still fore-cast the recovery to pick up pace in H2, reflecting progress in the vaccination programme, and expect GDP growth of 3.3% in 2022.
While we think the SOE will not be as disruptive as last year, the consequent contraction in Q2 will be modest as the manufacturing sector should fare better, partly due to strong foreign demand from China and the US. Indeed, the manufacturing PMI of 53 for May remains above 50, which separates contraction from expansion, while the services PMI dropped to 46.5 from 49.5 in April.
We see the economic recovery picking up pace in H2 as domestic demand recovers, supported by progress in the vaccine rollout and a buoyant manufacturing sector due to strong foreign demand. However, health-related risks are skewed to the downside, and a combination of delays in the vaccine rollout and limited medical capacity to treat Covid-19 patients could lead to tighter restrictions, threatening recovery prospects.
As the SOE is prolonged, the government is considering extending the deadlines for some of the sup-port it has been providing to assist firms and households, including the employment subsidies. At its June meeting, the Bank of Japan (BoJ) will likely leave monetary policy unchanged, but it may extend the deadline of its Covid-19 related lending and purchase operations beyond end-September 2021. With more favourable US growth prospects amid additional fiscal expansion, the yen has somewhat depreciated in the past month and will likely remain weak until late 2022.
Private consumption in Japan
-15
-10
-5
0
5
10
15
20
25
30
2011 2013 2015 2017 2019 2021 2023
270.000
275.000
280.000
285.000
290.000
295.000
300.000
305.000
310.000 Consumption, private, real, LCU
Exchange rate, period average, per euro
Source: Oxford Economics
Billions % change year ago

EUROPEAN TOURISM: TRENDS & PROSPECTS (Q2/2021) 50
EMERGING MARKETS
Our outlook for emerging markets (EMs) continues to be more optimistic than the consensus. Our GDP growth forecasts of 7% in 2021 and 5% in 2022 are little changed relative to last month. However, recent developments highlight the ongoing divergence of the economic trajectories for EM countries.
Our current baseline forecast continues to imply EMs (ex-China) will recover to pre-pandemic GDP levels by year-end. But with only a handful of governments having succeeded in bringing Covid-19 outbreaks under control, we expect sequential GDP growth in many locations will be weaker in Q2 than in Q1. While the broad outlook is bright for H2, the slow pace of the vaccination programmes will impinge on the expected rebound in some countries, including India and ASEAN.
The strong global economic recovery will buoy the EM industry and export outlook, consistent with recent PMI readings, with commodity producers benefitting from the upswing in prices. However, supply shortages and shipping delays may dampen industrial momentum in the coming months, and producer prices could face further upward pressure. Meanwhile, weakness in services exports will linger in the near term, though the reopening of international travel will underpin the recovery in H2 and into 2022.
With inflationary pressures picking up almost everywhere and offsetting wide output gaps, more cen-tral banks are turning hawkish. In addition to Brazil, Mexico, and Russia, where we had expected higher rates by the end of 2021, Colombia and some Central/ Eastern European countries are also expected to tighten monetary policy settings.
Propensity to consume in key emerging markets
2015 2020 2025
30%
35%
40%
45%
50%
55%
60%
65%
70%
75% China India Russia Brazil
Source: Oxford Economics
% share, private consumption / GDP
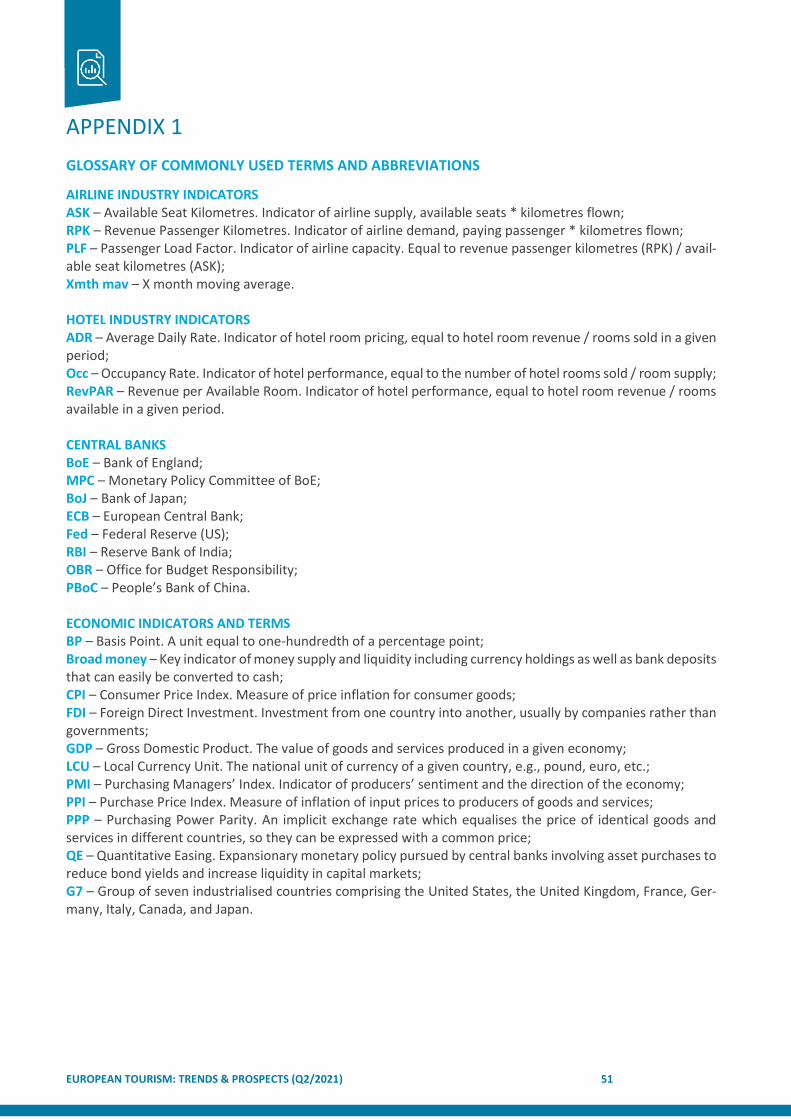
EUROPEAN TOURISM: TRENDS & PROSPECTS (Q2/2021) 51
APPENDIX 1
GLOSSARY OF COMMONLY USED TERMS AND ABBREVIATIONS
AIRLINE INDUSTRY INDICATORS ASK – Available Seat Kilometres. Indicator of airline supply, available seats * kilometres flown; RPK – Revenue Passenger Kilometres. Indicator of airline demand, paying passenger * kilometres flown; PLF – Passenger Load Factor. Indicator of airline capacity. Equal to revenue passenger kilometres (RPK) / avail-able seat kilometres (ASK); Xmth mav – X month moving average. HOTEL INDUSTRY INDICATORS ADR – Average Daily Rate. Indicator of hotel room pricing, equal to hotel room revenue / rooms sold in a given period; Occ – Occupancy Rate. Indicator of hotel performance, equal to the number of hotel rooms sold / room supply; RevPAR – Revenue per Available Room. Indicator of hotel performance, equal to hotel room revenue / rooms available in a given period. CENTRAL BANKS BoE – Bank of England; MPC – Monetary Policy Committee of BoE; BoJ – Bank of Japan; ECB – European Central Bank; Fed – Federal Reserve (US); RBI – Reserve Bank of India; OBR – Office for Budget Responsibility; PBoC – People’s Bank of China. ECONOMIC INDICATORS AND TERMS BP – Basis Point. A unit equal to one-hundredth of a percentage point; Broad money – Key indicator of money supply and liquidity including currency holdings as well as bank deposits that can easily be converted to cash; CPI – Consumer Price Index. Measure of price inflation for consumer goods; FDI – Foreign Direct Investment. Investment from one country into another, usually by companies rather than governments; GDP – Gross Domestic Product. The value of goods and services produced in a given economy; LCU – Local Currency Unit. The national unit of currency of a given country, e.g., pound, euro, etc.; PMI – Purchasing Managers’ Index. Indicator of producers’ sentiment and the direction of the economy; PPI – Purchase Price Index. Measure of inflation of input prices to producers of goods and services; PPP – Purchasing Power Parity. An implicit exchange rate which equalises the price of identical goods and services in different countries, so they can be expressed with a common price; QE – Quantitative Easing. Expansionary monetary policy pursued by central banks involving asset purchases to reduce bond yields and increase liquidity in capital markets; G7 – Group of seven industrialised countries comprising the United States, the United Kingdom, France, Ger-many, Italy, Canada, and Japan.

EUROPEAN TOURISM: TRENDS & PROSPECTS (Q2/2021) 52
APPENDIX 2
ETC MEMBER ORGANISATIONS
Belgium: Flanders – Visit Flanders, Wallonia – Wallonie-Belgique Tourisme
Bulgaria – Bulgarian Ministry of Tourism
Croatia – Croatian National Tourist Board (CNTB)
Cyprus – Deputy Ministry of Tourism, Republic of Cyprus
Czech Republic – CzechTourism
Denmark – VisitDenmark
Estonia – Estonian Tourist Board – Enterprise Estonia
Finland – Business Finland Oy, Visit Finland
Germany – German National Tourist Board (GNTB)
Greece – Greek National Tourism Organisation (GNTO)
Hungary – Hungarian Tourism Agency Ltd.
Iceland – Icelandic Tourist Board
Ireland – Fáilte Ireland and Tourism Ireland Ltd.
Italy – Italian Government Tourist Board
Latvia – Investment and Development Agency of Latvia (LIAA)
Lithuania – Ministry of the Economy and Innovation, Tourism Policy Division
Luxembourg – Luxembourg for Tourism (LFT)
Malta – Malta Tourism Authority (MTA)
Monaco – Monaco Government Tourist and Convention Office
Montenegro – National Tourism Organisation of Montenegro
Netherlands – NBTC Holland Marketing
Norway – Innovation Norway
Poland – Polish Tourism Organisation (PTO)
Portugal – Turismo de Portugal, I.P.
Romania – Romanian Ministry of Tourism
San Marino – State Office for Tourism
Serbia – National Tourism Organisation of Serbia (NTOS)
Slovakia – Ministry of Transport and Construction of the Slovak Republic
Slovenia – Slovenian Tourist Board
Spain – Turespaña – Instituto de Turismo de España
Switzerland – Switzerland Tourism