european journal of radiology · in water-fat mri: application to weight-loss in obesity jun...
TRANSCRIPT

Ac
JHDa
b
c
d
e
a
ARRA
KSVAW(W
1
pfIadis
o
h0
European Journal of Radiology 85 (2016) 1613–1621
Contents lists available at ScienceDirect
European Journal of Radiology
j ourna l h om epage: www.elsev ier .com/ locate /e j rad
utomatic segmentation of abdominal organs and adipose tissueompartments in water-fat MRI: Application to weight-loss in obesity
un Shena,b, Thomas Baumb, Christian Cordesb, Beate Ottc, Thomas Skurkc,d,endrik Kooijmane, Ernst J. Rummenyb, Hans Haunerc,d, Bjoern H. Menzea,1,imitrios C. Karampinosb,∗,1
Department of Computer Science, Technische Universität München, Munich, GermanyDepartment of Diagnostic and Interventional Radiology, Klinikum rechts der Isar, Technische Universität München, Munich, GermanyElse Kröner Fresenius Center for Nutritional Medicine, Klinikum rechts der Isar, Technische Universität München, Munich, GermanyZIEL Research Center for Nutrition and Food Sciences, Technische Universität München, GermanyPhilips Healthcare, Hamburg, Germany
r t i c l e i n f o
rticle history:eceived 8 April 2016eceived in revised form 26 May 2016ccepted 6 June 2016
eywords:ubcutaneous adipose tissue (SAT)isceral adipose tissue (VAT)utomatic image segmentationater-fat magnetic resonance imaging
MRI)eight loss
a b s t r a c t
Purpose: To develop a fully automatic algorithm for abdominal organs and adipose tissue compartmentssegmentation and to assess organ and adipose tissue volume changes in longitudinal water-fat magneticresonance imaging (MRI) data.Materials and methods: Axial two-point Dixon images were acquired in 20 obese women (age range 24–65,BMI 34.9 ± 3.8 kg/m2) before and after a four-week calorie restriction. Abdominal organs, subcutaneousadipose tissue (SAT) compartments (abdominal, anterior, posterior), SAT regions along the feet-headdirection and regional visceral adipose tissue (VAT) were assessed by a fully automatic algorithm usingmorphological operations and a multi-atlas-based segmentation method.Results: The accuracy of organ segmentation represented by Dice coefficients ranged from 0.672 ± 0.155for the pancreas to 0.943 ± 0.023 for the liver. Abdominal SAT changes were significantly greater in theposterior than the anterior SAT compartment (−11.4% ± 5.1% versus −9.5% ± 6.3%, p < 0.001). The loss of
VAT that was not located around any organ (−16.1% ± 8.9%) was significantly greater than the loss of VAT5 cm around liver, left and right kidney, spleen, and pancreas (p < 0.05).Conclusion: The presented fully automatic algorithm showed good performance in abdominal adiposetissue and organ segmentation, and allowed the detection of SAT and VAT subcompartments changesduring weight loss.© 2016 Elsevier Ireland Ltd. All rights reserved.
. Introduction
Obesity has become a major health issue, as an expanded adi-ose tissue accounts substantially to the risk for diabetes (by 44%),or ischemic heart disease (by 23%) and for cancer (by 7%–41%).n particular, the accumulation of abdominal adipose tissue (AAT)nd organ fat plays an important role in the risk of obesity-related
iseases. Lifestyle changes such as exercise programs or dietarynterventions have been shown to produce weight loss and toignificantly decrease the risk of obesity-related diseases [1]. There-
∗ Corresponding author at: Department of Diagnostic and Interventional Radiol-gy, Klinikum rechts der Isar, Ismaninger Str. 22, 81675 Munich, Germany.
E-mail address: [email protected] (D.C. Karampinos).1 equally contributed senior authors.
ttp://dx.doi.org/10.1016/j.ejrad.2016.06.006720-048X/© 2016 Elsevier Ireland Ltd. All rights reserved.
fore, there is a growing interest in investigating the associationbetween weight loss and changes of different adipose tissue com-partments and in defining effective lifestyle intervention strategiesfor the prevention of obesity-related diseases in different patientgroups [2].
Magnetic resonance imaging (MRI) is being increasingly usedfor non-invasively and accurately assessing adipose tissues andmonitoring changes of different adipose tissue compartments afterlifestyle interventions [3–5]. Specifically, the reduction of SAT andVAT volume or organ fat content has been investigated duringinterventions. Earlier studies used to estimate the SAT and VAT inthe human body by using a single MRI slice, while a recent study
showed that a single slice (L4-L5) poorly predicts SAT and VAT vol-ume changes in general [6]. In addition, different compartmentsof SAT (e.g. anterior versus posterior and deep versus superfi-cial) [7–9] and different compartments of VAT (e.g. intraperitoneal
1614 J. Shen et al. / European Journal of Radiology 85 (2016) 1613–1621
Fig. 1. Flow chart of the fully automatic organ segmentation approach: (I) atlas datasets consisted of 19 MRI water-only data. The labels of interested organs were generated fora the pfi . (III) To
vmcio
wCefe
tlas datasets. (II) Group-wise registration was performed to normalize all atlases toeld, which was then applied to normalize the organ labels of atlas to patient spacef interested organ of patient dataset.
ersus retroperitoneal) [10,11] have been shown to have distinctetabolic properties and responses after interventions. Finally, the
hanges of organ volume and fat content in liver and pancreas afternterventions have been of particular interest after interventions inbese subjects [12].
Chemical shift encoding-based water-fat MRI can separateater and fat signals relying on their chemical shift difference.
hemical shift encoding-based water-fat MRI has been recentlymerging as a reliable method to generate co-registered water andat images and measure fat content throughout the body [13]. How-ver, the rapid and accurate extraction of SAT and VAT volume andatient spatial coordinate system. The output of each registration was a deformationhe normalized labels were resampled and fused to compute the final segmentation
organ fat content requires the combination of water-fat MRI witha reliable image analysis methodology [14]. The automatic methodof localization and quantification of adipose tissue throughoutthe body is a long standing field of interest in image processing,as manual segmentation by a specialist is a tedious and time-consuming task, and the result directly depends on the specialist’sexperience and knowledge of anatomy [15–19]. Semi-automatic
segmentation is more efficient than manual segmentation. How-ever, semi-automatic segmentation still requires a moderate levelof user interaction and cannot process large datasets efficiently. Afully automatic approach with robust performance is highly attrac-
J. Shen et al. / European Journal of Radiology 85 (2016) 1613–1621 1615
F d fat do as furtm
tIudmttrittmVV
ig. 2. Flow chart of AAT classification: VAT and SAT were determined from water anf vertebral bodies from automatic segmentation procedure, the abdominal SAT weasured by means of organ labels.
ive and can significantly accelerate the segmentation workflow.n a previous study, a knowledge-based method was presentedsing statistical shape models (SSM) of the abdomen to distinguishifferent components of AAT [20]. However, the accuracy of suchethods can depend on the specialist creating the average SSM of
he abdomen. In some cases, an approximate shape model was usedo localize organs [21]. In another recent study, an intra-subjectegistration-based segmentation method was introduced measur-ng SAT, VAT and the fat content of some organs [22]. However,he method was only applied for the assessment of the efficacy of
he intervention in a longitudinal study. Most of the available auto-atic methods are limited to the classification of AAT into SAT andAT and cannot characterize the regional distribution of SAT andAT and quantify compartments of SAT and VAT.
ata by k-means clustering and morphological operations. According to the locationsher classified into anterior and posterior SAT. Meanwhile, organ-specific VAT was
The present work proposes a fully automatic multi-atlas-basedapproach for abdominal organ segmentation and regional adiposetissue analysis based on water-fat MRI data. The method was testedusing MRI datasets from 20 obese patients who underwent MRIscans before and after a 4-week dietary intervention, and the per-formance of the organ segmentation was validated against manualsegmentation as reference standard.
2. Materials and methods
2.1. Subjects and dietary intervention
The present human intervention study was carried out at theHuman Study Center (HSC) of the Else Kröner-Fresenius-Center of
1616 J. Shen et al. / European Journal of Radiology 85 (2016) 1613–1621
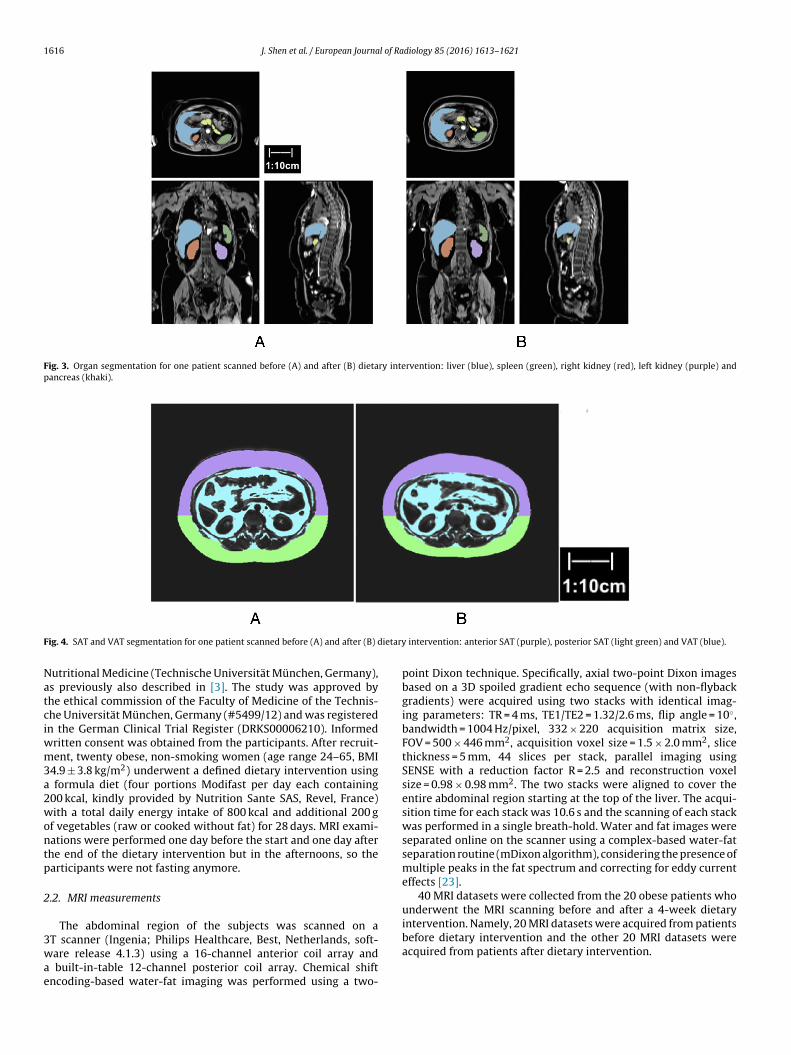
Fig. 3. Organ segmentation for one patient scanned before (A) and after (B) dietary intervention: liver (blue), spleen (green), right kidney (red), left kidney (purple) andpancreas (khaki).
F ietary
Natciwm3a2wontp
2
3wae
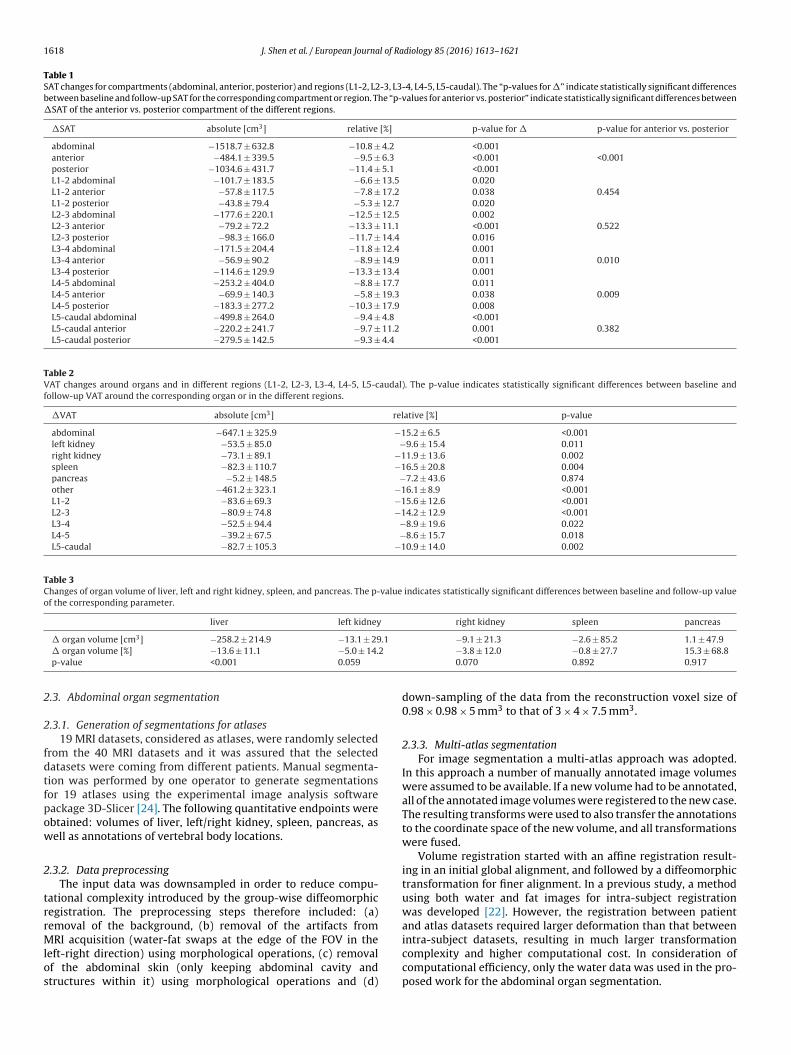
ig. 4. SAT and VAT segmentation for one patient scanned before (A) and after (B) d
utritional Medicine (Technische Universität München, Germany),s previously also described in [3]. The study was approved byhe ethical commission of the Faculty of Medicine of the Technis-he Universität München, Germany (#5499/12) and was registeredn the German Clinical Trial Register (DRKS00006210). Informed
ritten consent was obtained from the participants. After recruit-ent, twenty obese, non-smoking women (age range 24–65, BMI
4.9 ± 3.8 kg/m2) underwent a defined dietary intervention using formula diet (four portions Modifast per day each containing00 kcal, kindly provided by Nutrition Sante SAS, Revel, France)ith a total daily energy intake of 800 kcal and additional 200 g
f vegetables (raw or cooked without fat) for 28 days. MRI exami-ations were performed one day before the start and one day afterhe end of the dietary intervention but in the afternoons, so thearticipants were not fasting anymore.
.2. MRI measurements
The abdominal region of the subjects was scanned on a
T scanner (Ingenia; Philips Healthcare, Best, Netherlands, soft-are release 4.1.3) using a 16-channel anterior coil array andbuilt-in-table 12-channel posterior coil array. Chemical shiftncoding-based water-fat imaging was performed using a two-
intervention: anterior SAT (purple), posterior SAT (light green) and VAT (blue).
point Dixon technique. Specifically, axial two-point Dixon imagesbased on a 3D spoiled gradient echo sequence (with non-flybackgradients) were acquired using two stacks with identical imag-ing parameters: TR = 4 ms, TE1/TE2 = 1.32/2.6 ms, flip angle = 10◦,bandwidth = 1004 Hz/pixel, 332 × 220 acquisition matrix size,FOV = 500 × 446 mm2, acquisition voxel size = 1.5 × 2.0 mm2, slicethickness = 5 mm, 44 slices per stack, parallel imaging usingSENSE with a reduction factor R = 2.5 and reconstruction voxelsize = 0.98 × 0.98 mm2. The two stacks were aligned to cover theentire abdominal region starting at the top of the liver. The acqui-sition time for each stack was 10.6 s and the scanning of each stackwas performed in a single breath-hold. Water and fat images wereseparated online on the scanner using a complex-based water-fatseparation routine (mDixon algorithm), considering the presence ofmultiple peaks in the fat spectrum and correcting for eddy currenteffects [23].
40 MRI datasets were collected from the 20 obese patients whounderwent the MRI scanning before and after a 4-week dietaryintervention. Namely, 20 MRI datasets were acquired from patients
before dietary intervention and the other 20 MRI datasets wereacquired from patients after dietary intervention.
J. Shen et al. / European Journal of Radiology 85 (2016) 1613–1621 1617
Fig. 5. Organ-specific VAT classification for one patient scanned before (A) and after (B) dietary intervention: VAT around right kidney in 5 cm (red), VAT around left kidneyin 5 cm (green) and VAT not around any organs (yellow).
Fig. 6. SAT and VAT volume variation along the locations of vertebral bodies L1 to 10 cm downward from L5. Red and blue boxplots represent volume of adipose tissue frompatients before and after dietary intervention, respectively.
1618 J. Shen et al. / European Journal of Radiology 85 (2016) 1613–1621
Table 1SAT changes for compartments (abdominal, anterior, posterior) and regions (L1-2, L2-3, L3-4, L4-5, L5-caudal). The “p-values for �” indicate statistically significant differencesbetween baseline and follow-up SAT for the corresponding compartment or region. The “p-values for anterior vs. posterior” indicate statistically significant differences between�SAT of the anterior vs. posterior compartment of the different regions.
�SAT absolute [cm3] relative [%] p-value for � p-value for anterior vs. posterior
abdominal −1518.7 ± 632.8 −10.8 ± 4.2 <0.001anterior −484.1 ± 339.5 −9.5 ± 6.3 <0.001 <0.001posterior −1034.6 ± 431.7 −11.4 ± 5.1 <0.001L1-2 abdominal −101.7 ± 183.5 −6.6 ± 13.5 0.020L1-2 anterior −57.8 ± 117.5 −7.8 ± 17.2 0.038 0.454L1-2 posterior −43.8 ± 79.4 −5.3 ± 12.7 0.020L2-3 abdominal −177.6 ± 220.1 −12.5 ± 12.5 0.002L2-3 anterior −79.2 ± 72.2 −13.3 ± 11.1 <0.001 0.522L2-3 posterior −98.3 ± 166.0 −11.7 ± 14.4 0.016L3-4 abdominal −171.5 ± 204.4 −11.8 ± 12.4 0.001L3-4 anterior −56.9 ± 90.2 −8.9 ± 14.9 0.011 0.010L3-4 posterior −114.6 ± 129.9 −13.3 ± 13.4 0.001L4-5 abdominal −253.2 ± 404.0 −8.8 ± 17.7 0.011L4-5 anterior −69.9 ± 140.3 −5.8 ± 19.3 0.038 0.009L4-5 posterior −183.3 ± 277.2 −10.3 ± 17.9 0.008L5-caudal abdominal −499.8 ± 264.0 −9.4 ± 4.8 <0.001L5-caudal anterior −220.2 ± 241.7 −9.7 ± 11.2 0.001 0.382L5-caudal posterior −279.5 ± 142.5 −9.3 ± 4.4 <0.001
Table 2VAT changes around organs and in different regions (L1-2, L2-3, L3-4, L4-5, L5-caudal). The p-value indicates statistically significant differences between baseline andfollow-up VAT around the corresponding organ or in the different regions.
�VAT absolute [cm3] relative [%] p-value
abdominal −647.1 ± 325.9 −15.2 ± 6.5 <0.001left kidney −53.5 ± 85.0 −9.6 ± 15.4 0.011right kidney −73.1 ± 89.1 −11.9 ± 13.6 0.002spleen −82.3 ± 110.7 −16.5 ± 20.8 0.004pancreas −5.2 ± 148.5 −7.2 ± 43.6 0.874other −461.2 ± 323.1 −16.1 ± 8.9 <0.001L1-2 −83.6 ± 69.3 −15.6 ± 12.6 <0.001L2-3 −80.9 ± 74.8 −14.2 ± 12.9 <0.001L3-4 −52.5 ± 94.4 −8.9 ± 19.6 0.022L4-5 −39.2 ± 67.5 −8.6 ± 15.7 0.018L5-caudal −82.7 ± 105.3 −10.9 ± 14.0 0.002
Table 3Changes of organ volume of liver, left and right kidney, spleen, and pancreas. The p-value indicates statistically significant differences between baseline and follow-up valueof the corresponding parameter.
liver left kidney right kidney spleen pancreas
3 .1
2
2
2
fdtfpow
2
trrMlos
� organ volume [cm ] −258.2 ± 214.9 −13.1 ± 29� organ volume [%] −13.6 ± 11.1 −5.0 ± 14.p-value <0.001 0.059
.3. Abdominal organ segmentation
.3.1. Generation of segmentations for atlases19 MRI datasets, considered as atlases, were randomly selected
rom the 40 MRI datasets and it was assured that the selectedatasets were coming from different patients. Manual segmenta-ion was performed by one operator to generate segmentationsor 19 atlases using the experimental image analysis softwareackage 3D-Slicer [24]. The following quantitative endpoints werebtained: volumes of liver, left/right kidney, spleen, pancreas, asell as annotations of vertebral body locations.
.3.2. Data preprocessingThe input data was downsampled in order to reduce compu-
ational complexity introduced by the group-wise diffeomorphicegistration. The preprocessing steps therefore included: (a)emoval of the background, (b) removal of the artifacts from
RI acquisition (water-fat swaps at the edge of the FOV in theeft-right direction) using morphological operations, (c) removalf the abdominal skin (only keeping abdominal cavity andtructures within it) using morphological operations and (d)
−9.1 ± 21.3 −2.6 ± 85.2 1.1 ± 47.9−3.8 ± 12.0 −0.8 ± 27.7 15.3 ± 68.80.070 0.892 0.917
down-sampling of the data from the reconstruction voxel size of0.98 × 0.98 × 5 mm3 to that of 3 × 4 × 7.5 mm3.
2.3.3. Multi-atlas segmentationFor image segmentation a multi-atlas approach was adopted.
In this approach a number of manually annotated image volumeswere assumed to be available. If a new volume had to be annotated,all of the annotated image volumes were registered to the new case.The resulting transforms were used to also transfer the annotationsto the coordinate space of the new volume, and all transformationswere fused.
Volume registration started with an affine registration result-ing in an initial global alignment, and followed by a diffeomorphictransformation for finer alignment. In a previous study, a methodusing both water and fat images for intra-subject registrationwas developed [22]. However, the registration between patientand atlas datasets required larger deformation than that between
intra-subject datasets, resulting in much larger transformationcomplexity and higher computational cost. In consideration ofcomputational efficiency, only the water data was used in the pro-posed work for the abdominal organ segmentation.
l of Ra
rnwhAisacbtwoi
sfmFattIAtstaad
2
Sippsndo(ms
sofs
2
uaitC
2
arwv
J. Shen et al. / European Journa
The Advanced Normalization Tools [25] was used for the imageegistration. It provides an open source software library for imageormalization [25] and enabled multiple transformation abilitiesith adjustable level of complexity (ANTs was freely available atttp://stnava.github.io/ANTs/). The parameters set in ANTs were:ffine deformation (4 level image pyramid with each level 10000
terations at most) with a Mutual Information similarity mea-ure (32 bins and 16000 samples) was firstly applied for globallignment. A diffeomorphic registration was then performed usingross-correlation similarity measure (weight 1, window 5). It haseen reported that diffeomorphic transformations perform well inhe presence of large deformation fields [25,26]. The ANTs frame-ork was implemented in MATLAB and took approximately 20 min
f computation time per registration on a computer with Intel Core5 1.3 GHz processor, 8GB 1600 MHz DDR3 memory.
After all annotations had been transformed to the coordinatepace of new target volume, the transformed annotations wereused. In this step, the selective and iterative method for perfor-
ance level estimation (SIMPLE) [27] was employed for averaging.irst, a fused segmentation ground truth from all of the transformednnotations was generated using majority voting. Subsequently,he SIMPLE algorithm evaluated the Dice coefficient betweenhe initial fused segmentation and each transformed annotations.nputs with a Dice value smaller than a threshold were discarded.
specific threshold was computed at each iteration i according tohe equation �i = �Dice
i− �Dice
i, where � and � were the mean and
tandard deviation of the Dice values of all input annotations athis iteration. The remaining annotations were fused in a weightedveraging with the Dice coefficient values serving as weights. Thebove procedure was iterated until there was no annotation beingiscarded.
.3.4. Flow chart of abdominal organ segmentation approachFig. 1 shows the steps of the proposed segmentation algorithm.
tep (I) included the manual generation of 19 atlases. Step (II)ncluded the procedure of registration-based segmentation. Each ofreprocessed atlas dataset was co-registered with the preprocessedatient dataset. The output deformation field then transformedegmentations of interested organs to the patient spatial coordi-ate system. The registration consisted of affine and diffeomorphiceformation provided by the ANTs framework. In this way, a groupf normalized segmentation labels was automatically yielded. StepIII) included the label fusion method—SIMPLE that fused the nor-
alized and resampled segmentation labels to compute the finalegmentation.
The algorithm was applied on all 40 datasets and automaticallyegmented the aforementioned previously annotated abdominalrgans. When the algorithm annotated an MRI dataset, which wasrom the same patient as one of the atlases datasets, the corre-ponding atlas dataset was discarded.
.4. Adipose tissue measurement
The organ segmentation and morphological operations weresed to develop the algorithm for automatic measurement ofdipose tissues. The adipose tissue measurement algorithm wasmplemented in MATLAB and took around 3 min for the adiposeissue classification and measurement on a computer with Intelore i5 1.3 GHz processor, 8GB 1600 MHz DDR3 memory.
.4.1. SAT and VAT measurementSAT can be found under the skin and VAT is located within the
bdominal cavity. The center of vertebral bodies was used to sepa-ate SAT into anterior and posterior components. Specifically, SATas classified as anterior SAT (located anterior to the center of the
ertebral bodies) and posterior SAT (located posterior to the center
diology 85 (2016) 1613–1621 1619
of the vertebral bodies). In addition, the volume of VAT, anteriorand posterior SAT can be computed in the blocks of L1-L2, L2-L3,L3-L4, L4-L5 and L5-downward in 10 cm.
Fig. 2 shows the flow chart of the employed fat classificationalgorithm. K-means clustering was used to classify the adiposetissue within the abdomen, and morphological operations furtherseparated AAT into VAT and SAT. With the use of vertebral bodies,SAT could be classified as anterior SAT and posterior SAT and all SATand VAT compartments were computed in different regions acrossthe feet/head direction using the blocks of L1-L2, L2-L3, L3-L4, L4-L5and L5-downward in 10 cm.
2.4.2. Organ-specific adipose tissue measurementThe organ segmentations were used to measure organ-specific
VAT, as shown in Fig. 2. An Euclidean distance transformation wasapplied on each organ for marking the VAT around the organ within5 cm as organ-specific VAT, automatically creating, in this way,a VAT distribution map. The VAT volume within 5 cm from theperiphery of the kidneys, the spleen and the pancreas were deter-mined.
2.5. Statistical analysis
The statistical analysis was performed using SPSS (SPSS 22.0,Chicago, IL, USA). All tests were performed based on a 0.05level of significance. Mean and standard deviation (SD) of allparameters at baseline and follow-up as well as the abso-lute and relative change over time (� = follow-up—baseline and� = (follow-up—baseline)/baseline) were computed over the 20subjects. The Kolmogorov-Smirnov test showed for all parame-ters no significant difference from a normal distribution (p > 0.05).Therefore, changes over time were evaluated with paired t-tests.
3. Results
The ANTs registration method (using greedy symmetric dif-feomorphism as transformation model and cross correlation assimilarity metric) presented acceptable performance for organ seg-mentation on 40 datasets before performing the label fusion step.The final segmentation label of interested organ was generated bylabel fusion method (SIMPLE) fusing a set of normalized labels.The Dice coefficients between the manual and the final auto-matic segmentation (after the label fusion) were 0.943 ± 0.023 onliver, 0.894 ± 0.052 on left kidney, 0.873 ± 0.063 on right kidney,0.855 ± 0.091 on spleen and 0.672 ± 0.155 on pancreas. Fig. 3 illus-trates a representative organ segmentation result: axial, coronaland sagittal views from one subject before (A) and after (B) under-going dietary intervention are shown, using different colors forlabeling five of the automatically segmented organs.
Fig. 4(A) and (B) shows the same axial slice from one represen-tative subject before and after diet, respectively. The reduction ofanterior SAT, posterior SAT and VAT volumes can be easily recog-nized and measured, meanwhile, the change of organ-specific VATvolumes—5 cm around interested organ—was tracked. The axialslices in Fig. 5 show the segmentation of kidney-specific VAT andVAT not around any organs of one subject before and after per-formed dietary intervention.
The changes of different types of AAT after weight loss were sub-sequently analyzed. A statistically significant reduction of abdom-inal SAT was observed after four weeks (−1518.7 ± 632.8 cm3,−10.8% ± 4.2%, p < 0.001). SAT changes for all regions and com-partments were statistically significant (p < 0.05) as shown in
Table 1. Abdominal �SAT were significantly greater in the posteriorthan the anterior compartment (−11.4% ± 5.1% versus −9.5% ± 6.3%,p < 0.001, Table 1). Particularly, the posterior L3-L4 and L4-L5 �SATwere significantly greater than those in the corresponding anterior
1 l of Ra
ri(Lpt
(ai(aTs
fT
4
frmrrct
mmfVJatibfwmmarlsmvtSbatia
bwwbDaamu
620 J. Shen et al. / European Journa
egions (p < 0.05). The other regions showed no statistically signif-cant difference between the anterior and posterior compartmentp > 0.05, Table 1). Furthermore, SAT changes were greater in the2-L3 (−12.5% ± 12.5%) and L3-L4 (−11.8% ± 12.4%) region and lessronounced in the L1-L2 region (−6.6% ± 13.5%) (Fig. 6). However,he latter differences were not statistically significant (p > 0.05).
Abdominal VAT decreased after four weeks−647.1 ± 325.9 cm3, −15.2% ± 6.5%, p < 0.001). Except for VATround the pancreas, reductions of VAT were statistically signif-cant (p < 0.05; Table 2). VAT loss located not around any organ−16.1% ± 8.9%) was statistically significant greater than thoseround liver, left and right kidney, spleen, and pancreas (p < 0.001,able 2). The regional VAT loss from L1-L2 to L5-caudal was notignificantly different (p > 0.05, Table 2).
A statistically significant reduction in organ volume was onlyound for the liver (−258.2 ± 214.9 cm3, −13.6% ± 11.1%, p < 0.001,able 3).
. Discussion
The present work proposed a novel fully automatic methodor abdominal organ segmentation and abdominal adipose tissueegional analysis and quantification. The results from the automaticethod showed very good agreement with the manually created
eferences for organ segmentation. The developed automatic algo-ithm allowed the detection of SAT and VAT subcompartmentshanges in a study of 20 obese women undergoing a calorie restric-ion intervention [3].
Previous studies have presented semiautomatic or fully auto-atic methods for the classification of adipose tissue. However,ost of previous studies were limited to segmentation approaches
ocusing exclusively on the measurement of abdominal SAT andAT [3,4] and did not investigate SAT and VAT subcompartments.
oshi et al. showed the feasibility of using a registration-basedpproach for the segmentation of adipose tissue and liver [22], buthe developed method was only applicable to longitudinal stud-es in which manually segmented labels at baseline data coulde only propagated to the same subject’s dataset scanned inuture time points [22]. The presently proposed automatic methodas able to classify SAT and VAT subcompartments in a fewinutes without human interaction, and the multi-atlas-based seg-entation method provided a fully automatic way to segment
bdominal organs with high accuracy. The combination of theegistration-based approach with label fusion prevented the badabels generated by occasional failed registration from making finalegmentation decision. Voting fusion strategies have been com-only used to produce robust segmentations. Especially, weighted
oting method has provided significant improvement in segmen-ation accuracy [28]. In contrast to majority voting method, theIMPLE method remarkably improves the segmentation accuracyy taking atlas selection and performance estimation strategies intoccount. The performance estimation strategies result in discardinghe badly performing segmentations in each iteration. The remain-ng segmentations, which have good segmentation performance,re used to yield the final segmentation.
Some previous studies have used thresholding to differentiateetween abdominal adipose tissue and non-fat tissue from T1-eighted images [4]. The MRI datasets used in the present workere water- and fat-separated images from chemical encoding-
ased technique. Compared to T1-weighted images, the employedixon technique provided co-registered water- and fat-separated
bdominal images enabling the separation of fat tissue frombdominal water tissues and the development of an automaticethod analyzing fat depots. The water-separated images weresed as an input to the organ segmentation part of the algorithm
diology 85 (2016) 1613–1621
and both the water- and fat-separated images were used as an inputto the adipose tissue measurement and classification part of thealgorithm.
The SAT and VAT volumes were greatly decreased after weightloss in the studied 20 obese patients. Distinct changes were alsoobserved for different SAT and VAT compartments. AbdominalSAT reduction was significantly greater in posterior than the ante-rior compartment. This observation is consistent with a previouslystudy showing that AAT changes were more significantly linked tothe posterior than the anterior SAT changes [9]. The above observa-tion on SAT changes could be related to the fact that posterior SATcontains a larger component of deep SAT than anterior SAT does.In addition, we found that the significant difference between pos-terior and anterior SAT changes originates primarily from changesat L3-4 and L4-5 regions. Moreover, the reduction of abdominalVAT was statistically significant, however, the regional VAT lossfrom L1-2 to L5-caudal was not significantly different. The VAT losslocated not around any organ was significantly greater than theVAT loss around liver, left and right kidney, spleen, and pancreas,suggesting that VAT in the anterior part of the body is the mostmobile VAT depot after dietary intervention. The above observa-tion on VAT changes could be related to the fact that VAT locatednot around any organ would be primarily composed from intraperi-toneal fat, whereas the other presently studied VAT compartmentswould include also parts of retroperitoneal fat.
A reduction in liver volume was also presently observed. It isestablished that the liver fat reduction is strongly related to weightloss and it has been shown that weight loss is also associated withreduction in total liver volume and liver fat fraction [29]. In addition,there has been recent work using water-fat imaging and measuringthe total fat volume by integrating the liver fat fraction over theentire liver volume [12]. Therefore, the present work is consistentwith previous studies. However, a multi-echo sequence using morethan two echoes and accounting for known confounding factors(including T2* decay effects) would be required in order to measureliver proton density fat fraction and assess liver fat volume changes.
The current study presents a novel automatic method for theassessment of adipose tissue and the segmentation of abdominalorgans, but it has certain limitations. Firstly, in comparison to otherabdominal organs, the segmentation of pancreas was less accurate.This is likely due to the fact that the pancreas is small in volumeand it is, therefore, difficult to differentiate the pancreas from thesurrounding visceral fat. Secondly, the present analysis includedintramuscular and paravertebral fat in visceral adipose tissue. Theratio of the above two fat components to abdominal VAT in obesesubjects is small. However, the above two components have to beexcluded from abdominal VAT, when the methodology is appliedto leaner subjects. Thirdly, the present analysis did not extract thetraditional SAT compartments (deep and superficial) and the tra-ditional VAT compartments (retroperitoneal and intraperitoneal).The extraction of the above compartments would require the local-ization of the fascia lata and the peritoneum, which was not possiblewith the present data. Instead geometrically meaningful compart-ments were defined: for SAT based on the vertebral body locationand for VAT based on the organ location. Fourthly, the filling sta-tus of the bowel can affect the VAT regional assessment. Fifthly, thepresent methodology was only tested in obese subjects. Finally, theemployed methodology used two-point Dixon imaging and couldnot model T2* decay effects in the quantification of the fat fraction.The last limitation can be easily overcome by using a water-fat sig-nal model with a single T2* correction in an acquisition with morethan 2 echoes (typically six), in order to quantify the desired proton
density fat fraction [30].
l of Ra
5
sasmSi
C
jr
G
cRtEPMb
R
[
[
[
[
[
[
[
[
[
[
[
[
[
[
[
[
[
[
[
[
J. Shen et al. / European Journa
. Conclusion
The present work introduced a fully automatic method for organegmentation and adipose tissue regional assessment based onbdominal water and fat MRI images. The algorithm’s performancehowed a very good agreement on organ segmentation with theanually created reference and enabled the assessment of different
AT and VAT subcompartments changes after a dietary interventionn obese women.
onflict of interest
The authors declare the following conflicts of interest: H. Kooi-man is an employee of Philips Healthcare and D. C. Karampinoseceives grant support from Philips Healthcare.
rant support
The present study was supported by funding of Philips Health-are (to DCK), the German Federal Ministry of Education andesearch (BMBF, FKZ: 01EA1329, to HH), the Technische Universi-at Munchen—Institute for Advanced Study (funded by the Germanxcellence Initiative and the European Union Seventh Frameworkrogramme under grant agreement n 291763, to BHM) and thearie Curie COFUND program of the European Union (Rudolf Moss-
auer Tenure- Track Professorship to BHM).
eferences
[1] M. Takahara, I. Shimomura, Metabolic syndrome and lifestyle modification,Rev. Endocr. Metab. Disord. 15 (4) (2014) 317–327.
[2] K. Kantartzis, J. Machann, F. Schick, K. Rittig, F. Machicao, A. Fritsche, H.U.Haring, N. Stefan, Effects of a lifestyle intervention in metabolically benignand malign obesity, Diabetologia 54 (4) (2011) 864–868.
[3] C. Cordes, M. Dieckmeyer, B. Ott, J. Shen, S. Ruschke, M. Settles, C. Eichhorn,J.S. Bauer, H. Kooijman, E.J. Rummeny, T. Skurk, T. Baum, H. Hauner, D.C.Karampinos, MR-detected changes in liver fat, abdominal fat, and vertebralbone marrow fat after a four-week calorie restriction in obese women, J.Magn. Reson. Imaging 42 (5) (2015) 1272–1280.
[4] J. Machann, C. Thamer, N. Stefan, N.F. Schwenzer, K. Kantartzis, H.U. Haring,C.D. Claussen, A. Fritsche, F. Schick, Follow-up whole-body assessment ofadipose tissue compartments during a lifestyle intervention in a large cohortat increased risk for type 2 diabetes, Radiology 257 (2) (2010) 353–363.
[5] M.C. Mojtahedi, M.P. Thorpe, D.C. Karampinos, C.L. Johnson, D.K. Layman, J.G.Georgiadis, E.M. Evans, The effects of a higher protein intake during energyrestriction on changes in body composition and physical function in olderwomen, J. Gerontol. A Biol. Sci. Med. Sci. 66 (11) (2011) 1218–1225.
[6] W. Shen, J. Chen, M. Gantz, G. Velasquez, M. Punyanitya, S.B. Heymsfield, Asingle MRI slice does not accurately predict visceral and subcutaneousadipose tissue changes during weight loss, Obesity (Silver Spring) 20 (12)(2012) 2458–2463.
[7] Q. He, E.S. Engelson, D.P. Kotler, A comparison of abdominal subcutaneousadipose tissue pattern in obese and lean HIV-infected women, J. Nutr. 135 (1)(2005) 53–57.
[8] D.E. Kelley, F.L. Thaete, F. Troost, T. Huwe, B.H. Goodpaster, Subdivisions of
subcutaneous abdominal adipose tissue and insulin resistance, Am. J. Physiol.Endocrinol. Metab. 278 (5) (2000) E941–E948.[9] A. Misra, A. Garg, N. Abate, R.M. Peshock, J. Stray-Gundersen, S.M. Grundy,Relationship of anterior and posterior subcutaneous abdominal fat to insulinsensitivity in nondiabetic men, Obes. Res. 5 (2) (1997) 93–99.
[
diology 85 (2016) 1613–1621 1621
10] N. Abate, A. Garg, R. Coleman, S.M. Grundy, R.M. Peshock, Prediction of totalsubcutaneous abdominal, intraperitoneal, and retroperitoneal adipose tissuemasses in men by a single axial magnetic resonance imaging slice, Am. J. Clin.Nutr. 65 (2) (1997) 403–408.
11] C.J. Hsieh, P.W. Wang, T.Y. Chen, The relationship between regionalabdominal fat distribution and both insulin resistance and subclinical chronicinflammation in non-diabetic adults, Diabetol. Metab. Syndr. 6 (1) (2014) 49.
12] A. Tang, J. Chen, T.A. Le, C. Changchien, G. Hamilton, M.S. Middleton, R.Loomba, C.B. Sirlin, Cross-sectional and longitudinal evaluation of livervolume and total liver fat burden in adults with nonalcoholic steatohepatitis,Abdom. Imaging 40 (1) (2015) 26–37.
13] H.H. Hu, H.E. Kan, Quantitative proton MR techniques for measuring fat, NMRBiomed. 26 (12) (2013) 1609–1629.
14] H.H. Hu, J. Chen, W. Shen, Segmentation and quantification of adipose tissueby magnetic resonance imaging, MAGMA (2015), http://dx.doi.org/10.1007/s10334-015-0498-z.
15] J. Kullberg, J. Brandberg, J.E. Angelhed, H. Frimmel, E. Bergelin, L. Strid, H.Ahlstrom, L. Johansson, L. Lonn, Whole-body adipose tissue analysis:comparison of MRI, CT and dual energy X-ray absorptiometry, Br. J. Radiol. 82(974) (2009) 123–130.
16] P. Ranefall, A.W. Bidar, P.D. Hockings, Automatic segmentation ofintra-abdominal and subcutaneous adipose tissue in 3D whole mouse MRI, J.Magn. Reson. Imaging 30 (3) (2009) 554–560.
17] S.A. Sadananthan, B. Prakash, M.K. Leow, C.M. Khoo, H. Chou, K.Venkataraman, E.Y. Khoo, Y.S. Lee, P.D. Gluckman, E.S. Tai, S.S. Velan,Automated segmentation of visceral and subcutaneous (deep and superficial)adipose tissues in normal and overweight men, J. Magn. Reson. Imaging 41 (4)(2015) 924–934.
18] M.S. Thomas, D. Newman, O.D. Leinhard, B. Kasmai, R. Greenwood, P.N.Malcolm, A. Karlsson, J. Rosander, M. Borga, A.P. Toms, Test-retest reliabilityof automated whole body and compartmental muscle volume measurementson a wide bore 3T MR system, Eur. Radiol. 24 (9) (2014) 2279–2291.
19] A. Valentinitsch, D.C. Karampinos, H. Alizai, K. Subburaj, D. Kumar, T.M. Link,S. Majumdar, Automated unsupervised multi-parametric classification ofadipose tissue depots in skeletal muscle, J. Magn. Reson. Imaging 37 (4)(2013) 917–927.
20] D. Wald, B. Teucher, J. Dinkel, R. Kaaks, S. Delorme, H. Boeing, K. Seidensaal,H.P. Meinzer, T. Heimann, Automatic quantification of subcutaneous andvisceral adipose tissue from whole-body magnetic resonance images suitablefor large cohort studies, J. Magn. Reson. Imaging 36 (6) (2012) 1421–1434.
21] B.T. Addeman, S. Kutty, T.G. Perkins, A.S. Soliman, C.N. Wiens, C.M. McCurdy,M.D. Beaton, R.A. Hegele, C.A. McKenzie, Validation of volumetric andsingle-slice MRI adipose analysis using a novel fully automated segmentationmethod, J. Magn. Reson. Imaging 41 (1) (2015) 233–241.
22] A.A. Joshi, H.H. Hu, R.M. Leahy, M.I. Goran, K.S. Nayak, Automatic intra-subjectregistration-based segmentation of abdominal fat from water-fat MRI, J.Magn. Reson. Imaging 37 (2) (2013) 423–430.
23] H. Eggers, B. Brendel, A. Duijndam, G. Herigault, Dual-echo Dixon imagingwith flexible choice of echo times, Magn. Reson. Med. 65 (1) (2011) 96–107.
24] S. Pieper, M. Halle, R. Kikinis, 3D slicer, biomedical imaging: nano to macro,IEEE Int. Sym. (2004).
25] B.B. Avants, N.J. Tustison, G. Song, P.A. Cook, A. Klein, J.C. Gee, A reproducibleevaluation of ANTs similarity metric performance in brain image registration,Neuroimage 54 (3) (2011) 2033–2044.
26] J. Ashburner, A fast diffeomorphic image registration algorithm, Neuroimage38 (1) (2007) 95–113.
27] T.R. Langerak, et al., Label fusion in atlas-based segmentation using a selectiveand iterative method for performance level estimation (SIMPLE), medicalimaging, IEEE Trans. 29 (12) (2010) 2000–2008.
28] X. Artaechevarria, A. Munoz-Barrutia, C. Ortiz-de-Solorzano, Combinationstrategies in multi-atlas image segmentation: application to brain MR data,IEEE Trans. Med. Imaging 28 (8) (2009) 1266–1277.
29] N.S. Patel, I. Doycheva, M.R. Peterson, J. Hooker, T. Kisselva, B. Schnabl, E. Seki,C.B. Sirlin, R. Loomba, Effect of weight loss on magnetic resonance imaging
estimation of liver fat and volume in patients with nonalcoholicsteatohepatitis, Clin. Gastroenterol. Hepatol. 13 (3) (2015) 561–568.30] S.B. Reeder, I. Cruite, G. Hamilton, C.B. Sirlin, Quantitative assessment of liverfat with magnetic resonance imaging and spectroscopy, J. Magn. Reson.Imaging 34 (4) (2011) 729–749.