euro credit pilot
TRANSCRIPT
10
2010
Euro Credit Pilot
Economics & FI/FX Research Credit Research Equity Research Cross Asset Research
“2010's last quarter-slice”
<date>
5 October 2010 Credit Research
Euro Credit Pilot
UniCredit Research page 2 See last pages for disclaimer.
Contents 4 Story of the month: 2010's final act: A Midsummer Night’s Dream or
Macbeth
6 Credit Drivers
6 Macro: Still a long way to go for deleveraging
7 Micro Fundamentals: Earnings season forecast iBoxx
8 Debt-Equity Linkage: Earnings forecast & development
9 Credit Quality Trend: State of "slack" in corporate ratings
10 Market Technicals: A look in the rear-view mirror
11 Valuation & Timing
13 Other credit markets
13 Credit derivatives – Liquidity squeeze in single names?
14 Securitization: UK prime RMBS vs. weak UK housing market
15 EEMEA: Less leveraged credit map is emerging
16 Sector Allocation
17 Earnings Calendar
23 Fundamental Credit Views
23 Telecommunications (Marketweight)
29 Media (Marketweight)
31 Technology (Marketweight)
33 Automobiles & Parts (Marketweight)
35 Utilities (Marketweight)
42 Oil & Gas (Overweight)
44 Industrial Goods & Services (Core) (Underweight)
48 Aerospace & Defense (Marketweight)
49 Industrial Transportation (Overweight)
51 Basic Resources (Marketweight)
52 Chemicals (Underweight)
54 Construction & Materials (Underweight)
56 Health Care (Underweight)
58 Personal & Household Goods (Core) (Marketweight)
60 Tobacco (Overweight)
61 Food & Beverage (Overweight)
63 Travel & Leisure (Underweight)
64 Retail (Underweight)
66 Banks (Marketweight)
74 Financial Services (Marketweight)
74 Insurance (Marketweight)
78 UniCredit Research Model Portfolio
<date>
5 October 2010 Credit Research
Euro Credit Pilot
UniCredit Research page 3 See last pages for disclaimer.
From an investor's perspective, October is a classic in-between month – the largest part of the year is already behind us, but the focus is not (yet) fully on next year. Hittingthe home stretch, however, investors will worry about getting in this year's harvest.And for fixed income investors, it has been a good year (at least for those that avoidedthis year's credit bombs – European periphery), as the YTD total return for the iBoxxnon-financials, for example, stands at 6.4%. However, this is almost exclusively due tothe underlying interest rate dynamics, as the YTD credit return in the index is evenbelow 0.4%! While in the remainder of this year one probably cannot turn around a badyear, a volatile "final act" might destroy a good overall performance. Hence, the centralquestion is: Will the final act turn out to be a comedy or a tragedy?
■ Macro Outlook: In order to bring the excessive leverage to more sustainable levels, private and public sectors need to reduce spending and increase savings. However, the deleveragingprocess has a very unpleasant deflationary side effect, which could exacerbate theleverage problem via the so-called "debt-snowball-effect".
■ Micro Fundamentals: EPS estimates for the upcoming quarters are expected to remain relatively stable in 4Q and are likely to improve in 2011.
■ Debt-Equity-Linkage: Against the backdrop of an anticipated slowdown of economicactivity, it seems odd that forward EPS are still showing strong increases. However, this rise stems from an arithmetic effect and the actual EPS estimates are being loweredacross Europe, except for Germany.
■ Credit Quality Trend: Given the subdued growth environment, the question is wherecompanies stand in terms of rating slack, e.g., whether they have headroom in their financial profile compared to the criteria of the rating agencies ahead of the anticipated slowdown.
■ Market Technicals: While 2009 was an exceptional year for non-financials investment grade issuance activity, 2010 will be the year of high-yield bonds and covered bonds.
■ Valuation & Timing: We expect spread volatility to remain high despite stable creditfundamentals on the back of potential growth weaknesses ahead.
■ Other Credit Markets: Credit Derivatives: We take a look at recent liquidity data for single-name CDS referencing iTraxx Europe members. Apparently, liquidity is much betterthan anecdotal evidence suggests. Securitization: Recently, a battery of unsupportive data were released for the UK, which underline a weakening trend on the UK mortgage market. EEMEA: A less leveraged credit map is emerging.
■ Allocation: We stick to our defensive strategy.
■ Model Portfolio: Our financials portfolio outperformed the benchmark by 100bp, while the non-financials portfolio outperformed by 9bp.
Dr. Philip Gisdakis (UniCredit Bank) +49 89 378-13228 [email protected]
Dr. Tim Brunne (UniCredit Bank) +49 89 378-13521 [email protected]
Markus Ernst (UniCredit Bank) +49 89 378-14213 [email protected]
Dr. Stefan Kolek (UniCredit Bank) +49 89 378-12495 [email protected]
Dr. Christian Weber, CFA (UniCredit Bank) +49 89 378-12250 [email protected]
Corporate Credit Research Financials Credit Research
Bloomberg UCCR
Internet www.research.unicreditgroup.eu
<date>
5 October 2010 Credit Research
Euro Credit Pilot
UniCredit Research page 4 See last pages for disclaimer.
Story of the month
2010's final act: A Midsummer Night’s Dream or Macbeth From an investor's perspective, October is a classic in-between month – the largest
part of the year (and hopefully also the largest part of the required performance) isalready behind us, but the focus is not (yet) fully on next year. Hitting the home stretch, however, investors will worry about getting in this year's harvest. And for fixed incomeinvestors, it has been a good year (at least for those that avoided this year's creditbombs – European periphery), as the YTD total return for the iBoxx non-financials, for example, stands at 6.4%. However, this is almost exclusively due to the underlyinginterest rate dynamics, as the YTD credit return in the index is even below 0.4%! Whilein the remainder of this year one probably cannot turn around a bad year, a volatile "final act" might destroy a good overall performance. Hence, the central question is:Will the final act turn to out to be a comedy or a tragedy? The short (and balanced)answer is: a Macbeth-like bloodbath is not very likely, but there might well be some factors that could disturb a Midsummer Night's Dream.
Double-dip concerns, China property price bubble and European sovereign debt crisis remain the most dominant "bearish" drivers
The risks (that we have referred to frequently) are:
■ Double-dip recession fears in the US (as well as in Europe), and potential negativeimplications from what appears to be the resolution strategy "en vogue", i.e. quantitative easing. What started as a kind of "next level" after cutting policy rates close to zero in order to bringdown longer-term yields appears to evolve into something like intentionally weakeningcentral bank balance sheets in order to devaluate the own currency (some commentatorsare already referring to "currency war"). The problem emerging for credit investors fromthese developments (besides the general uncertainties that arise on the back of movinginto the unchartered territory of multiple unilateral currency interventions) is that weakeningthe currency by triggering rising inflation expectations may well result in a sharp andsubstantial rise in longer-term refinancing costs, which is particularly painful when thecountry needs to borrow substantial amounts also from private (or foreign) investors (and not just from its own central bank). However, rising government bond yields might result ina crowding out of private sector borrowers that currently benefit from inflows from investorsdesperately hunting for (minimal) yield.
■ The implications from a (potentially bursting) property bubble in China (i.e., a possibleinstability in the Chinese financial system and a drag on consumption – which would be important to "bail out" the developed economies – due to a declining perception of wealth)
■ The smoldering European sovereign debt crisis.
In particular the latter will have an impact on European credit risk for two reasons: first, thepoor performance of credit markets – secondary spreads, as well as primary volumes – have shown how sensitively investors react to this topic. And second, even when governmentshave learned their lesson, the short-term impact of austerity measures will likely not be positive for markets. In this respect, the IMF published an interesting article on the economicimpact of the fiscal adjustment processes in its October 2010 World Economic Outlook. Thetheoretical background for the notion of fiscal adjustments is the hypothesis of "expansionaryfiscal contraction" – fiscal retrenchment can stimulate growth even in the short term. However, the present IMF study shows that a short-term economic contraction is a more likely outcome. Nevertheless, expansionary effects can occur when the contraction comes on the back ofgovernment solvency concerns, or when the adjustment process is structured in a proper way, i.e. when it increases confidence of households and businesses. The main findings ofthe study are that a fiscal consolidation of 1% of GDP reduces GDP growth by 0.5% withintwo years and raises the unemployment rate by 0.3%. The recent numbers regarding the Greek budget projections seem to basically confirm these findings (i.e., they even overshootthe findings, as the targeted adjustment of the deficit of 10% – from 13% to 3% – results in a

<date>
5 October 2010 Credit Research
Euro Credit Pilot
UniCredit Research page 5 See last pages for disclaimer.
projected recession of 7.5% [a multiple of 0.75% per 1% consolidation], while the unemploymentrate is expected to rise by 5% [a multiple of 0.5%]). The study also mentions that declininginterest costs and a decline in the real value of the domestic currency typically support theeconomy – two factors that hardly apply to Greece (which, by the way, is the main criticism ofthe common currency). However, the study is also a warning for those who hope that thecurrent process of fiscal consolidation, in particular in Europe (which we welcome), will take place without any impact on the real economy. The concern is, in fact, that this kind ofadjustment will in the short term – weigh on growth.
Is the next phase a political crisis?
The ability and willingness of governments to put their finances back on a sustainable pathhave been and still are a major concern of investors. The Greek sovereign debt crisis is themost prominent example in this respect this year. In April 2009, the G-20 agreed to triple the lending resources of the IMF to USD 750bn, thereby acknowledging the severity of the fiscal difficulties in many countries around the globe. Since then, the IMF has repeatedly highlightedthe necessity of austerity measures and appealed to sovereign governments to return tosustainable debt and deficit levels. The ECB has assumed this role within the eurozone,continuously calling for fiscal prudence.
Necessity and economic impact of fiscal consolidation
As mentioned above, the IMF acknowledges in its World Economic Outlook that fiscalconsolidation measures will have a negative impact on economic output and unemployment.Historically, such short-term pain has been rewarded with a long-term improvement of the respective country's economic output, primarily due to the long-term stimulation of private consumption and investment. Unfortunately, the positive long-term benefits of austerity in highly indebted but developed countries will be even less pronounced than suggested by thehistorical precedents. Developed countries are trapped in a catch-22 situation, due to subdued growth potential. Monetary policy is effectively already at its limits and currencydevaluation is not an option for many countries that are trying to boost net exports. Adversedemographic developments in developed countries will put further pressure on their respective fiscal situation and growth outlook. However, austerity measures are inevitable toavoid a deadly debt spiral. Hence, most countries in the Western world will have to managesubstantial economic and social challenges. This translates into an unpopular political task.
Sovereign debt crisis followed by a political crisis?
To date, governments are reiterating their commitment to cut public spending and reducesovereign debt. However, implementation of the measures requires priority for a long time. It may take years for the benefits of fiscal prudence to become apparent. Policy makers areputting at risk their public support as the measures are clearly unpopular. According to theIMF, cutting public spending, hiking tax rates and overhauling national pension systems are all necessary and will at the same time negatively impact economic output and unemployment. Publicsupport for the reform agenda is already shrinking in many countries. On 29 September,Spain faced its first general strike in eight years and about 100,000 people gathered inBrussels for an anti-austerity march. Governments on both sides of the Atlantic face decliningpublic support. There are now several minority-led governments in the eurozone, showing that clear political majorities are lacking for the most pressing policy topics. There is alsodisagreement at the most senior level of the EMU. European governments need to agree onreform of the Stability and Growth Pact in order to enforce national fiscal discipline, but a political compromise currently seems almost impossible. In its history, Europe has successfullycoped with more challenging problems. However, a political crisis is a current downside risk,leading to the obvious repercussions for risky asset markets and negative feedback loops on sovereign debt risk premia. During 4Q, European parliaments will have to pass the 2011budgets. On the EU level, many compromises regarding financial market regulation, the futureof the EFSF and the reform of the Stability and Growth Pact will have to be found. These arethe next milestones.
<date>
5 October 2010 Credit Research
Euro Credit Pilot
UniCredit Research page 6 See last pages for disclaimer.
Credit Drivers
Macro: Still a long way to go for deleveraging The "debt-snowball-effect" might exacerbate the leverage problem
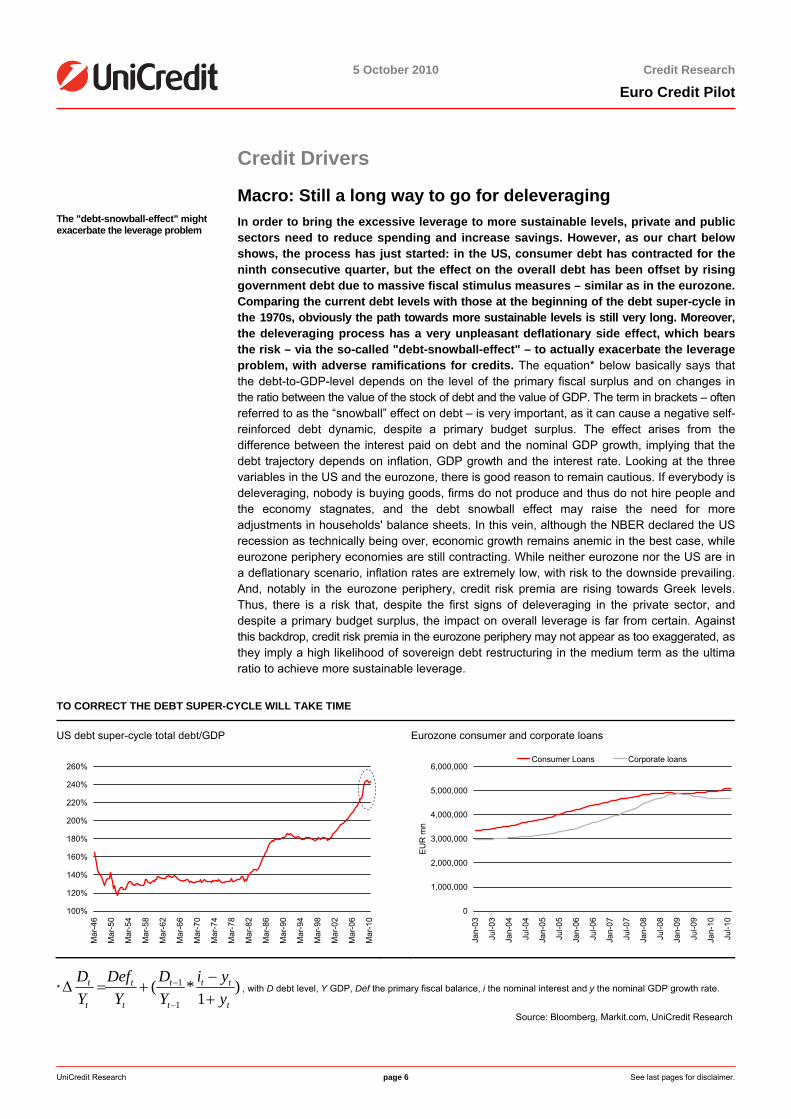
In order to bring the excessive leverage to more sustainable levels, private and publicsectors need to reduce spending and increase savings. However, as our chart belowshows, the process has just started: in the US, consumer debt has contracted for theninth consecutive quarter, but the effect on the overall debt has been offset by risinggovernment debt due to massive fiscal stimulus measures – similar as in the eurozone.Comparing the current debt levels with those at the beginning of the debt super-cycle inthe 1970s, obviously the path towards more sustainable levels is still very long. Moreover,the deleveraging process has a very unpleasant deflationary side effect, which bearsthe risk – via the so-called "debt-snowball-effect" – to actually exacerbate the leverageproblem, with adverse ramifications for credits. The equation* below basically says thatthe debt-to-GDP-level depends on the level of the primary fiscal surplus and on changes inthe ratio between the value of the stock of debt and the value of GDP. The term in brackets – oftenreferred to as the “snowball” effect on debt – is very important, as it can cause a negative self-reinforced debt dynamic, despite a primary budget surplus. The effect arises from thedifference between the interest paid on debt and the nominal GDP growth, implying that thedebt trajectory depends on inflation, GDP growth and the interest rate. Looking at the threevariables in the US and the eurozone, there is good reason to remain cautious. If everybody isdeleveraging, nobody is buying goods, firms do not produce and thus do not hire people andthe economy stagnates, and the debt snowball effect may raise the need for moreadjustments in households' balance sheets. In this vein, although the NBER declared the USrecession as technically being over, economic growth remains anemic in the best case, whileeurozone periphery economies are still contracting. While neither eurozone nor the US are ina deflationary scenario, inflation rates are extremely low, with risk to the downside prevailing.And, notably in the eurozone periphery, credit risk premia are rising towards Greek levels.Thus, there is a risk that, despite the first signs of deleveraging in the private sector, anddespite a primary budget surplus, the impact on overall leverage is far from certain. Againstthis backdrop, credit risk premia in the eurozone periphery may not appear as too exaggerated, asthey imply a high likelihood of sovereign debt restructuring in the medium term as the ultimaratio to achieve more sustainable leverage.
TO CORRECT THE DEBT SUPER-CYCLE WILL TAKE TIME
US debt super-cycle total debt/GDP Eurozone consumer and corporate loans
100%
120%
140%
160%
180%
200%
220%
240%
260%
Mar
-46
Mar
-50
Mar
-54
Mar
-58
Mar
-62
Mar
-66
Mar
-70
Mar
-74
Mar
-78
Mar
-82
Mar
-86
Mar
-90
Mar
-94
Mar
-98
Mar
-02
Mar
-06
Mar
-10
0
1,000,000
2,000,000
3,000,000
4,000,000
5,000,000
6,000,000
Jan-
03
Jul-0
3
Jan-
04
Jul-0
4
Jan-
05
Jul-0
5
Jan-
06
Jul-0
6
Jan-
07
Jul-0
7
Jan-
08
Jul-0
8
Jan-
09
Jul-0
9
Jan-
10
Jul-1
0
EU
R m
n
Consumer Loans Corporate loans
* )1
*(1
1
t
tt
t
t
t
t
t
t
yyi
YD
YDef
YD
+−
+=Δ−
− , with D debt level, Y GDP, Def the primary fiscal balance, i the nominal interest and y the nominal GDP growth rate.
Source: Bloomberg, Markit.com, UniCredit Research
<date>
5 October 2010 Credit Research
Euro Credit Pilot
UniCredit Research page 7 See last pages for disclaimer.
Micro Fundamentals: Earnings season forecast iBoxx The 3Q10 earnings season is waiting in the wings! We took a closer look at earnings
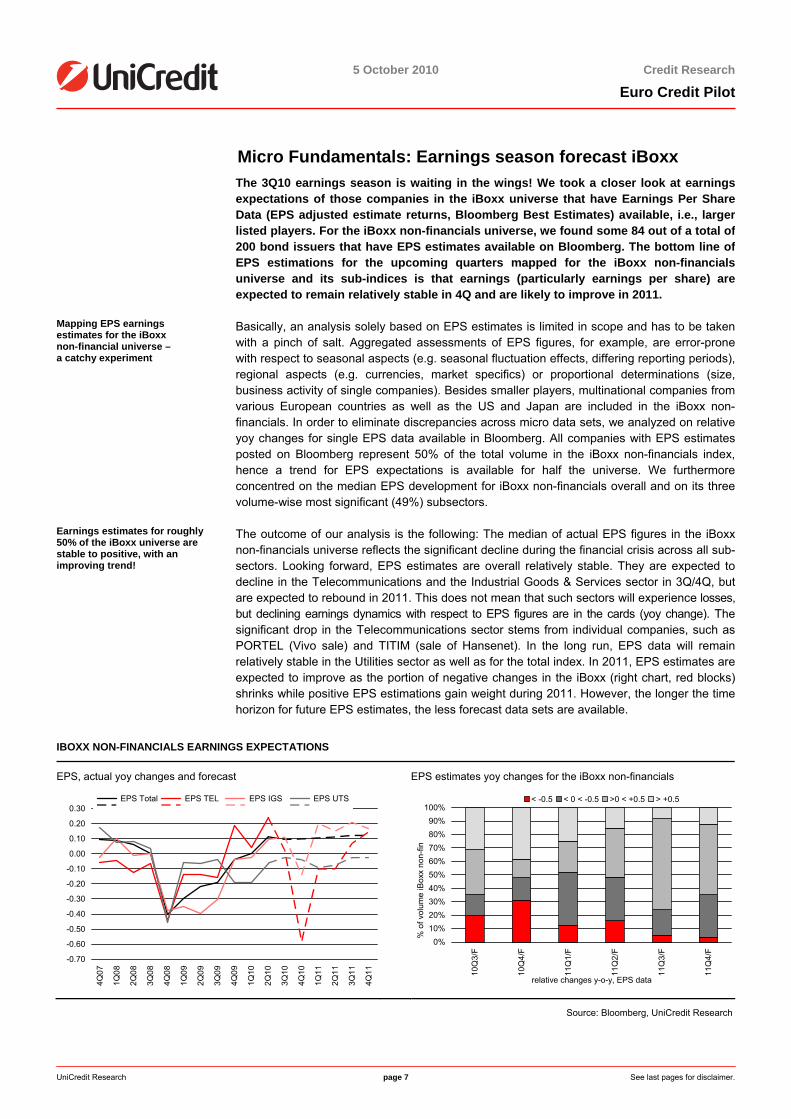
expectations of those companies in the iBoxx universe that have Earnings Per Share Data (EPS adjusted estimate returns, Bloomberg Best Estimates) available, i.e., largerlisted players. For the iBoxx non-financials universe, we found some 84 out of a total of 200 bond issuers that have EPS estimates available on Bloomberg. The bottom line of EPS estimations for the upcoming quarters mapped for the iBoxx non-financials universe and its sub-indices is that earnings (particularly earnings per share) areexpected to remain relatively stable in 4Q and are likely to improve in 2011.
Mapping EPS earnings estimates for the iBoxx non-financial universe – a catchy experiment
Basically, an analysis solely based on EPS estimates is limited in scope and has to be takenwith a pinch of salt. Aggregated assessments of EPS figures, for example, are error-prone with respect to seasonal aspects (e.g. seasonal fluctuation effects, differing reporting periods),regional aspects (e.g. currencies, market specifics) or proportional determinations (size,business activity of single companies). Besides smaller players, multinational companies fromvarious European countries as well as the US and Japan are included in the iBoxx non-financials. In order to eliminate discrepancies across micro data sets, we analyzed on relativeyoy changes for single EPS data available in Bloomberg. All companies with EPS estimatesposted on Bloomberg represent 50% of the total volume in the iBoxx non-financials index, hence a trend for EPS expectations is available for half the universe. We furthermoreconcentred on the median EPS development for iBoxx non-financials overall and on its three volume-wise most significant (49%) subsectors.
Earnings estimates for roughly 50% of the iBoxx universe are stable to positive, with an improving trend!
The outcome of our analysis is the following: The median of actual EPS figures in the iBoxxnon-financials universe reflects the significant decline during the financial crisis across all sub-sectors. Looking forward, EPS estimates are overall relatively stable. They are expected to decline in the Telecommunications and the Industrial Goods & Services sector in 3Q/4Q, butare expected to rebound in 2011. This does not mean that such sectors will experience losses, but declining earnings dynamics with respect to EPS figures are in the cards (yoy change). The significant drop in the Telecommunications sector stems from individual companies, such asPORTEL (Vivo sale) and TITIM (sale of Hansenet). In the long run, EPS data will remain relatively stable in the Utilities sector as well as for the total index. In 2011, EPS estimates areexpected to improve as the portion of negative changes in the iBoxx (right chart, red blocks)shrinks while positive EPS estimations gain weight during 2011. However, the longer the timehorizon for future EPS estimates, the less forecast data sets are available.
IBOXX NON-FINANCIALS EARNINGS EXPECTATIONS
EPS, actual yoy changes and forecast EPS estimates yoy changes for the iBoxx non-financials
-0.70
-0.60
-0.50
-0.40
-0.30
-0.20
-0.10
0.00
0.10
0.20
0.30
4Q07
1Q08
2Q08
3Q08
4Q08
1Q09
2Q09
3Q09
4Q09
1Q10
2Q10
3Q10
4Q10
1Q11
2Q11
3Q11
4Q11
EPS Total EPS TEL EPS IGS EPS UTS
0%10%20%30%40%50%60%70%80%90%
100%
10Q
3/F
10Q
4/F
11Q
1/F
11Q
2/F
11Q
3/F
11Q
4/F
relative changes y-o-y, EPS data
% o
f vol
ume
iBox
x no
n-fin
< -0.5 < 0 < -0.5 >0 < +0.5 > +0.5
Source: Bloomberg, UniCredit Research
<date>
5 October 2010 Credit Research
Euro Credit Pilot
UniCredit Research page 8 See last pages for disclaimer.
Debt-Equity Linkage: Earnings forecast & development With additional austerity measures being taken in the European periphery and a moderating
economic outlook, central bankers discuss further quantitative easing measures to securepositive growth. In this environment it seems odd that forward EPS are still showingstrong increases. However, this rise stems from an arithmetic effect and the actual EPSestimates are being lowered across Europe, except for Germany.
Earnings estimates have been trending upwards, but this is not as positive as it appears at first glance
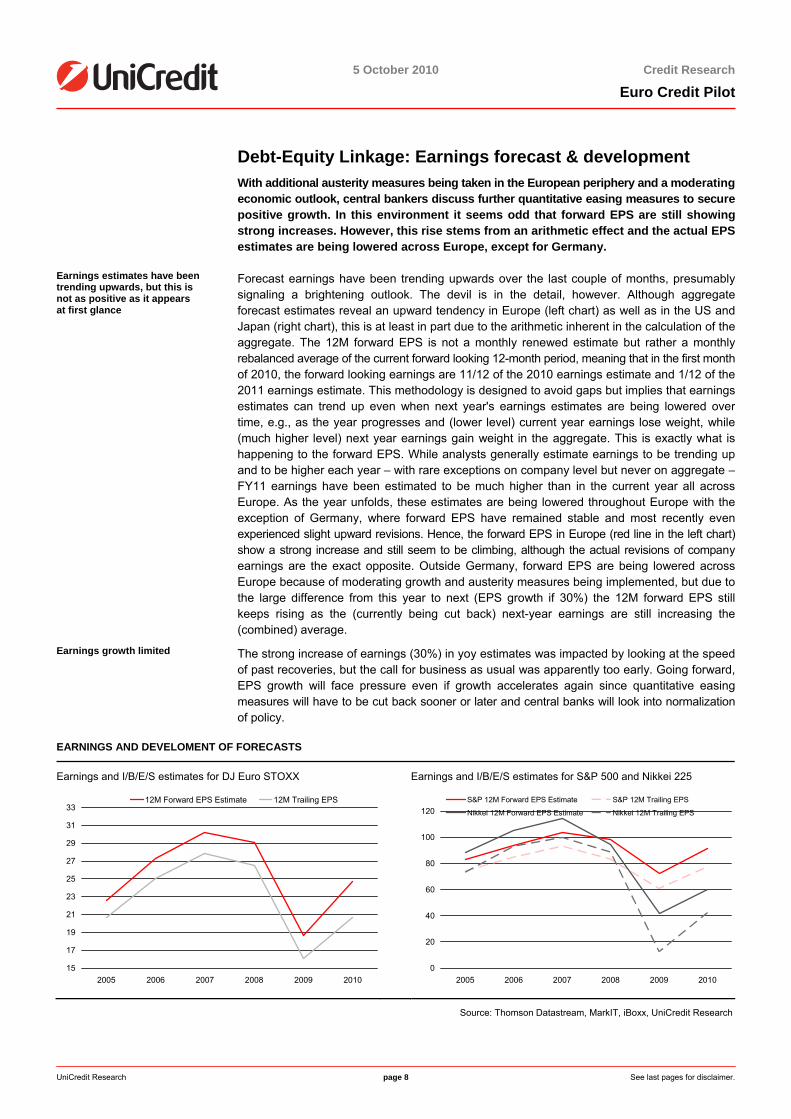
Forecast earnings have been trending upwards over the last couple of months, presumablysignaling a brightening outlook. The devil is in the detail, however. Although aggregateforecast estimates reveal an upward tendency in Europe (left chart) as well as in the US andJapan (right chart), this is at least in part due to the arithmetic inherent in the calculation of theaggregate. The 12M forward EPS is not a monthly renewed estimate but rather a monthlyrebalanced average of the current forward looking 12-month period, meaning that in the first monthof 2010, the forward looking earnings are 11/12 of the 2010 earnings estimate and 1/12 of the2011 earnings estimate. This methodology is designed to avoid gaps but implies that earningsestimates can trend up even when next year's earnings estimates are being lowered overtime, e.g., as the year progresses and (lower level) current year earnings lose weight, while(much higher level) next year earnings gain weight in the aggregate. This is exactly what ishappening to the forward EPS. While analysts generally estimate earnings to be trending upand to be higher each year – with rare exceptions on company level but never on aggregate –FY11 earnings have been estimated to be much higher than in the current year all acrossEurope. As the year unfolds, these estimates are being lowered throughout Europe with theexception of Germany, where forward EPS have remained stable and most recently evenexperienced slight upward revisions. Hence, the forward EPS in Europe (red line in the left chart)show a strong increase and still seem to be climbing, although the actual revisions of companyearnings are the exact opposite. Outside Germany, forward EPS are being lowered acrossEurope because of moderating growth and austerity measures being implemented, but due tothe large difference from this year to next (EPS growth if 30%) the 12M forward EPS stillkeeps rising as the (currently being cut back) next-year earnings are still increasing the(combined) average.
Earnings growth limited The strong increase of earnings (30%) in yoy estimates was impacted by looking at the speedof past recoveries, but the call for business as usual was apparently too early. Going forward,EPS growth will face pressure even if growth accelerates again since quantitative easingmeasures will have to be cut back sooner or later and central banks will look into normalizationof policy.
EARNINGS AND DEVELOMENT OF FORECASTS
Earnings and I/B/E/S estimates for DJ Euro STOXX Earnings and I/B/E/S estimates for S&P 500 and Nikkei 225
15
17
19
21
23
25
27
29
31
33
2005 2006 2007 2008 2009 2010
12M Forward EPS Estimate 12M Trailing EPS
0
20
40
60
80
100
120
2005 2006 2007 2008 2009 2010
S&P 12M Forward EPS Estimate S&P 12M Trailing EPS
Nikkei 12M Forward EPS Estimate Nikkei 12M Trailing EPS
Source: Thomson Datastream, MarkIT, iBoxx, UniCredit Research
<date>
5 October 2010 Credit Research
Euro Credit Pilot
UniCredit Research page 9 See last pages for disclaimer.
Credit Quality Trend: State of "slack" in corporate ratings Heading into the final quarter of the year, the macroeconomic picture has stabilized
and investors currently perceive a fall back into recession as unlikely. However, even ifgrowth is expected to remain in positive territory, the buffer to stagnation is minimaland the upside is limited. Given the subdued growth environment, the question iswhere companies stand in terms of rating slack, e.g. whether they have headroom intheir financial profile compared to the criteria of the rating agencies ahead of theanticipated slowdown.
Ratings are prone to move as a majority of companies show a financial profile better or worse than target
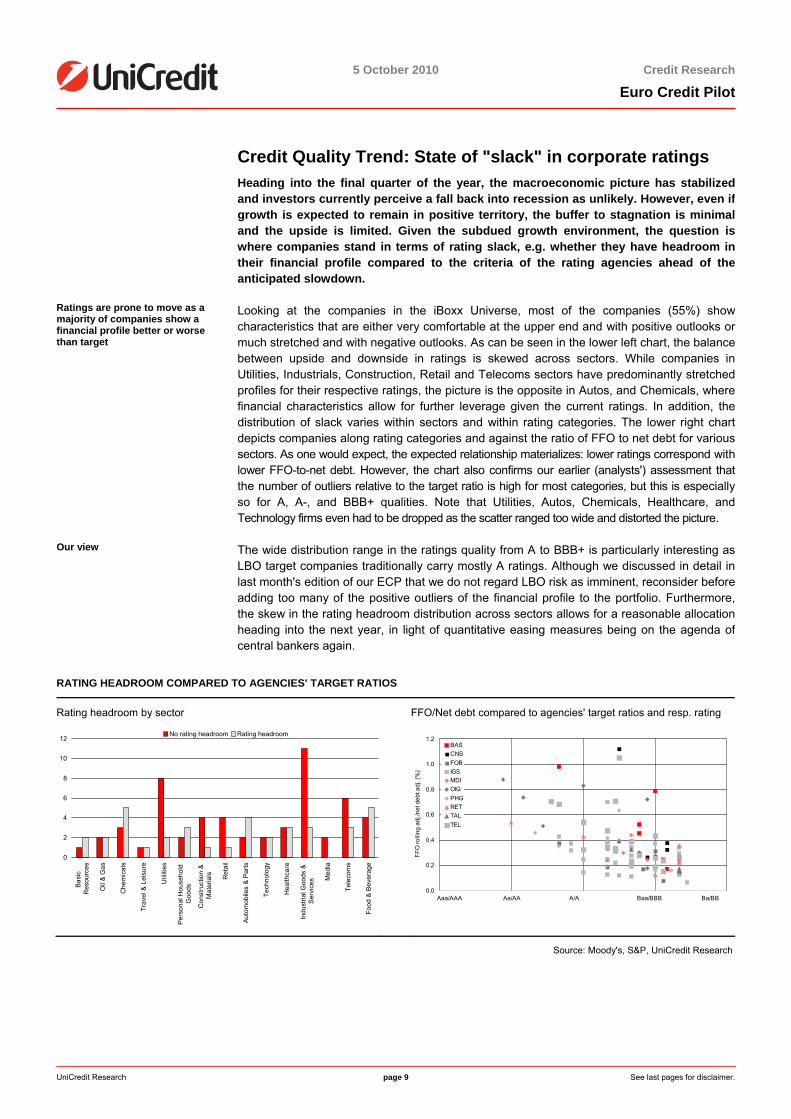
Looking at the companies in the iBoxx Universe, most of the companies (55%) showcharacteristics that are either very comfortable at the upper end and with positive outlooks ormuch stretched and with negative outlooks. As can be seen in the lower left chart, the balancebetween upside and downside in ratings is skewed across sectors. While companies inUtilities, Industrials, Construction, Retail and Telecoms sectors have predominantly stretchedprofiles for their respective ratings, the picture is the opposite in Autos, and Chemicals, wherefinancial characteristics allow for further leverage given the current ratings. In addition, thedistribution of slack varies within sectors and within rating categories. The lower right chartdepicts companies along rating categories and against the ratio of FFO to net debt for varioussectors. As one would expect, the expected relationship materializes: lower ratings correspond withlower FFO-to-net debt. However, the chart also confirms our earlier (analysts') assessment thatthe number of outliers relative to the target ratio is high for most categories, but this is especiallyso for A, A-, and BBB+ qualities. Note that Utilities, Autos, Chemicals, Healthcare, andTechnology firms even had to be dropped as the scatter ranged too wide and distorted the picture.
Our view The wide distribution range in the ratings quality from A to BBB+ is particularly interesting asLBO target companies traditionally carry mostly A ratings. Although we discussed in detail inlast month's edition of our ECP that we do not regard LBO risk as imminent, reconsider beforeadding too many of the positive outliers of the financial profile to the portfolio. Furthermore,the skew in the rating headroom distribution across sectors allows for a reasonable allocationheading into the next year, in light of quantitative easing measures being on the agenda ofcentral bankers again.
RATING HEADROOM COMPARED TO AGENCIES' TARGET RATIOS
Rating headroom by sector FFO/Net debt compared to agencies' target ratios and resp. rating
0
2
4
6
8
10
12
Basi
c R
esou
rces
Oil
& G
as
Che
mic
als
Trav
el &
Lei
sure
Util
ities
Pers
onal
Hou
seho
ld
Goo
ds
Con
stru
ctio
n &
M
ater
ials Ret
ail
Auto
mob
iles
& P
arts
Tech
nolo
gy
Hea
lthca
re
Indu
stria
l Goo
ds &
S
ervi
ces M
edia
Tele
com
s
Food
& B
ever
age
No rating headroom Rating headroom
0.0
0.2
0.4
0.6
0.8
1.0
1.2
0 3 6 9 12
BASCNSFOBIGSMDIOIGPHGRETTALTEL
Aaa/AAA Aa/AA A/A Baa/BBB Ba/BB
FFO
rolli
ng a
dj./n
et d
ebt a
dj. (
%)
Source: Moody's, S&P, UniCredit Research
<date>
5 October 2010 Credit Research
Euro Credit Pilot
UniCredit Research page 10 See last pages for disclaimer.
Market Technicals: A look in the rear-view mirror 2010: A significant slowdown in primary markets for non-financials investment grade…
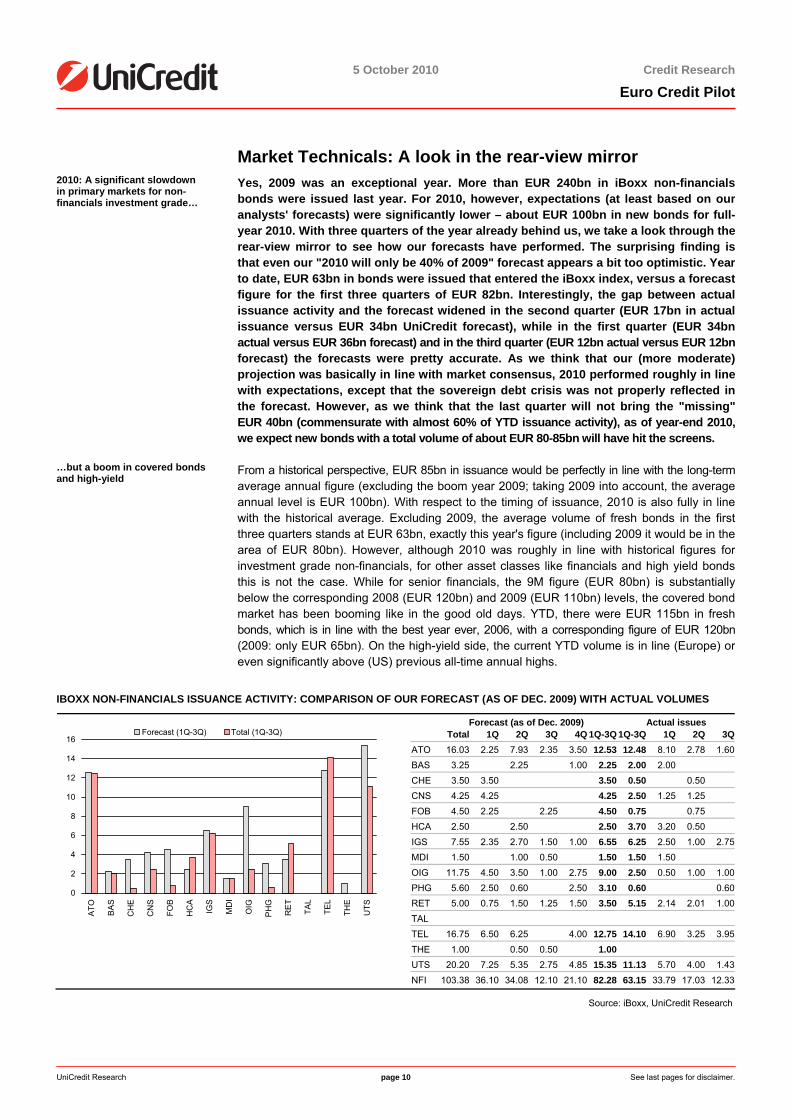
Yes, 2009 was an exceptional year. More than EUR 240bn in iBoxx non-financials bonds were issued last year. For 2010, however, expectations (at least based on ouranalysts' forecasts) were significantly lower – about EUR 100bn in new bonds for full-year 2010. With three quarters of the year already behind us, we take a look through therear-view mirror to see how our forecasts have performed. The surprising finding isthat even our "2010 will only be 40% of 2009" forecast appears a bit too optimistic. Yearto date, EUR 63bn in bonds were issued that entered the iBoxx index, versus a forecastfigure for the first three quarters of EUR 82bn. Interestingly, the gap between actualissuance activity and the forecast widened in the second quarter (EUR 17bn in actualissuance versus EUR 34bn UniCredit forecast), while in the first quarter (EUR 34bnactual versus EUR 36bn forecast) and in the third quarter (EUR 12bn actual versus EUR 12bnforecast) the forecasts were pretty accurate. As we think that our (more moderate)projection was basically in line with market consensus, 2010 performed roughly in linewith expectations, except that the sovereign debt crisis was not properly reflected inthe forecast. However, as we think that the last quarter will not bring the "missing"EUR 40bn (commensurate with almost 60% of YTD issuance activity), as of year-end 2010, we expect new bonds with a total volume of about EUR 80-85bn will have hit the screens.
…but a boom in covered bonds and high-yield
From a historical perspective, EUR 85bn in issuance would be perfectly in line with the long-termaverage annual figure (excluding the boom year 2009; taking 2009 into account, the averageannual level is EUR 100bn). With respect to the timing of issuance, 2010 is also fully in linewith the historical average. Excluding 2009, the average volume of fresh bonds in the firstthree quarters stands at EUR 63bn, exactly this year's figure (including 2009 it would be in the area of EUR 80bn). However, although 2010 was roughly in line with historical figures forinvestment grade non-financials, for other asset classes like financials and high yield bondsthis is not the case. While for senior financials, the 9M figure (EUR 80bn) is substantially below the corresponding 2008 (EUR 120bn) and 2009 (EUR 110bn) levels, the covered bondmarket has been booming like in the good old days. YTD, there were EUR 115bn in freshbonds, which is in line with the best year ever, 2006, with a corresponding figure of EUR 120bn(2009: only EUR 65bn). On the high-yield side, the current YTD volume is in line (Europe) or even significantly above (US) previous all-time annual highs.
IBOXX NON-FINANCIALS ISSUANCE ACTIVITY: COMPARISON OF OUR FORECAST (AS OF DEC. 2009) WITH ACTUAL VOLUMES
Forecast (as of Dec. 2009) Actual issues Total 1Q 2Q 3Q 4Q 1Q-3Q 1Q-3Q 1Q 2Q 3QATO 16.03 2.25 7.93 2.35 3.50 12.53 12.48 8.10 2.78 1.60BAS 3.25 2.25 1.00 2.25 2.00 2.00CHE 3.50 3.50 3.50 0.50 0.50CNS 4.25 4.25 4.25 2.50 1.25 1.25FOB 4.50 2.25 2.25 4.50 0.75 0.75HCA 2.50 2.50 2.50 3.70 3.20 0.50IGS 7.55 2.35 2.70 1.50 1.00 6.55 6.25 2.50 1.00 2.75MDI 1.50 1.00 0.50 1.50 1.50 1.50OIG 11.75 4.50 3.50 1.00 2.75 9.00 2.50 0.50 1.00 1.00PHG 5.60 2.50 0.60 2.50 3.10 0.60 0.60RET 5.00 0.75 1.50 1.25 1.50 3.50 5.15 2.14 2.01 1.00TAL TEL 16.75 6.50 6.25 4.00 12.75 14.10 6.90 3.25 3.95THE 1.00 0.50 0.50 1.00 UTS 20.20 7.25 5.35 2.75 4.85 15.35 11.13 5.70 4.00 1.43
0
2
4
6
8
10
12
14
16
ATO BA
S
CH
E
CN
S
FOB
HC
A
IGS
MD
I
OIG
PH
G
RE
T
TAL
TEL
THE
UTS
Forecast (1Q-3Q) Total (1Q-3Q)
NFI 103.38 36.10 34.08 12.10 21.10 82.28 63.15 33.79 17.03 12.33
Source: iBoxx, UniCredit Research
<date>
5 October 2010 Credit Research
Euro Credit Pilot
UniCredit Research page 11 See last pages for disclaimer.
Valuation & Timing
Tactical View: Volatile despite stable credit fundamentals… October is a kind of in-between month in markets. Investors do not yet focus on the new year
(which will be the case in November/December), but the old year is almost over, at leastperformance-wise. We say "Almost" because a bad year's performance can probably not beturned around in October alone, but a good year's performance can be destroyed. And forfixed income investors, it has been a good year, as the YTD total return for the iBoxx non-financials, for example, stands at 6.4%. However, this is almost exclusively due to the underlying interest rate dynamics, as the YTD credit return in the index (defined by spreadcarry plus mark-to-market performance due to spread changes) is even below 0.4%! Forfinancials (which include also subordinated paper), this is somewhat different: the credit return contributed 1.6% to the total return of 6.7%. However, as the total return has already beenhigher earlier this year (7% for non-financials at the end of August), investors might wonder how much of the performance can still be lost. From a credit investor's perspective, the risks seem to be moderated by the typical spread-yield correlation: when yields go up (and the declining yields have been the major performance drivers), spreads tend to tighten (andspreads remained remarkably resilient against the backdrop of extremely low yield levels).Moreover, since credit fundamentals, in particular for European investment grade non-financials, appear to be fairly sound, we do not expect a drastic spread blowout, even if fearsregarding a deteriorating economic outlook were to materialize. Any spread blowout will – in the first place – be driven by sentiment rather than by a real deterioration of creditfundamentals. On the other hand, many structural problems that the crisis revealed remain unresolved and market sentiment remains fragile. In particular in the current environment, inwhich portfolio managers have realized handsome returns, they might opt to err on the side ofcaution in order to protect this year's good performance, and hence might overreact in terms of hedging should a spread-widening trend crystallize. This refers not only to concernsregarding the financial system, but includes also structural problems (like overcapacity) on thenon-financials side. Capacity utilization, for example, amounts to only 75% in the US and Europe. Although it is still rising from historically low levels below 70%, there is still asubstantial gap to pre-crisis utilization rates (80%-85% area). However, demand weakness that arises on the back of austerity packages in Europe and the weak US labor market mayonly be temporarily camouflaged by demand from emerging Asia. We have our doubts thatChina alone can balance these deficiencies in the developed world on a sustainable basis.However, such fears will ultimately translate into a deterioration of credit fundamentals, whichmarkets will take into account rapidly.
Strategic View: …on potential growth weaknesses The risk drivers on a more strategic time horizon are not new: a potentially stronger-than-
expected slowdown in economic activity in the US and in the eurozone (austerity measures),and a potential bursting of the property bubble in China. This would have major implicationsfor the Chinese financial system and ultimately for the Chinese growth model, as authorities aim to shift it more towards domestic consumption rather than exports. The latter is inparticular important if China is expected to "bail out" the developed world. However, privateconsumption is very much driven by the perception of wealth of the consumer. Should a bubble burst, a lot of private household wealth will be destroyed, which will not motivate Chineseconsumers to purchase goods from the Western world. Last but not least, the Europeansovereign debt crisis is not yet over. A major risk factor is still the parliamentary debate regarding 2011 budget cuts, which are due in the coming weeks and months, and which maycreate headline risks. Volatile times lie ahead.
<date>
5 October 2010 Credit Research
Euro Credit Pilot
UniCredit Research page 12 See last pages for disclaimer.
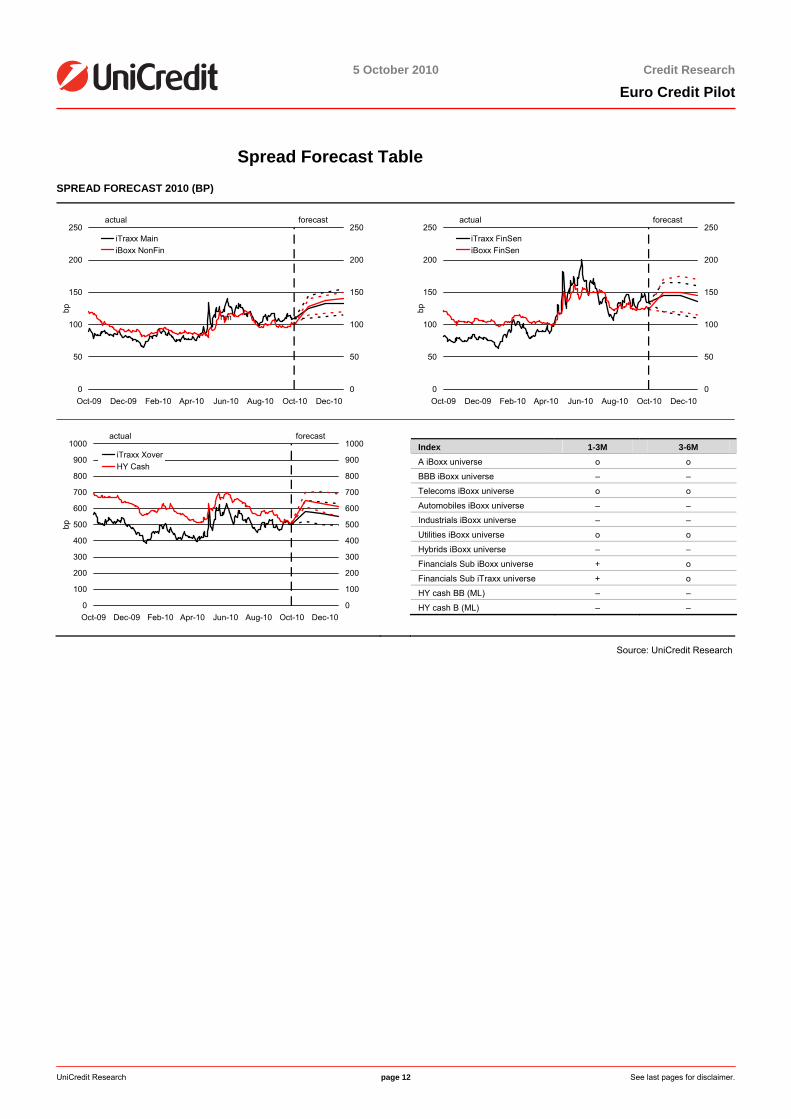
Spread Forecast Table SPREAD FORECAST 2010 (BP)
0
50
100
150
200
250
Oct-09 Dec-09 Feb-10 Apr-10 Jun-10 Aug-10 Oct-10 Dec-10
bp
0
50
100
150
200
250iTraxx MainiBoxx NonFin
actual forecast
nm
0
50
100
150
200
250
Oct-09 Dec-09 Feb-10 Apr-10 Jun-10 Aug-10 Oct-10 Dec-10
bp
0
50
100
150
200
250iTraxx FinSeniBoxx FinSen
actual forecast
0
100
200
300
400
500
600
700
800
900
1000
Oct-09 Dec-09 Feb-10 Apr-10 Jun-10 Aug-10 Oct-10 Dec-10
bp
0
100
200
300
400
500
600
700
800
900
1000iTraxx XoverHY Cash
actual forecast
Index 1-3M 3-6M A iBoxx universe o o
BBB iBoxx universe – –
Telecoms iBoxx universe o o
Automobiles iBoxx universe – –
Industrials iBoxx universe – –
Utilities iBoxx universe o o
Hybrids iBoxx universe – –
Financials Sub iBoxx universe + o
Financials Sub iTraxx universe + o
HY cash BB (ML) – –
HY cash B (ML) – –
Source: UniCredit Research
<date>
5 October 2010 Credit Research
Euro Credit Pilot
UniCredit Research page 13 See last pages for disclaimer.
Other credit markets
Credit derivatives – Liquidity squeeze in single names? On both sides of the Atlantic, the guidelines for the upcoming regulation of derivatives
markets are now being laid down. The technical – albeit important – details still need to befleshed out by financial regulatory bodies and will have an impact on CDS liquidity inparticular. We take a look at recent liquidity data for single-name CDS referencing iTraxx Europe members. Apparently, liquidity is much better than anecdotal evidencesuggests.
Main impact of the upcoming CDS trading environment
The upcoming requirement in Europe as well as in the US to centrally clear many of the more liquid single-name CDS ("eligible" CDS) will have to be accompanied by measures that makeit less attractive to trade single-name CDS in the traditional bilateral way. This is due to theintention to provide incentives for central clearing. We reiterate our view that future regulation will lead to a single-name CDS market that is split into a centrally cleared segment and abilaterally traded one. The latter is expected to attract more and more liquidity while the latterwill face declining liquidity.
Liquid single-name CDS market is not yet affected by change in the regulatory environment
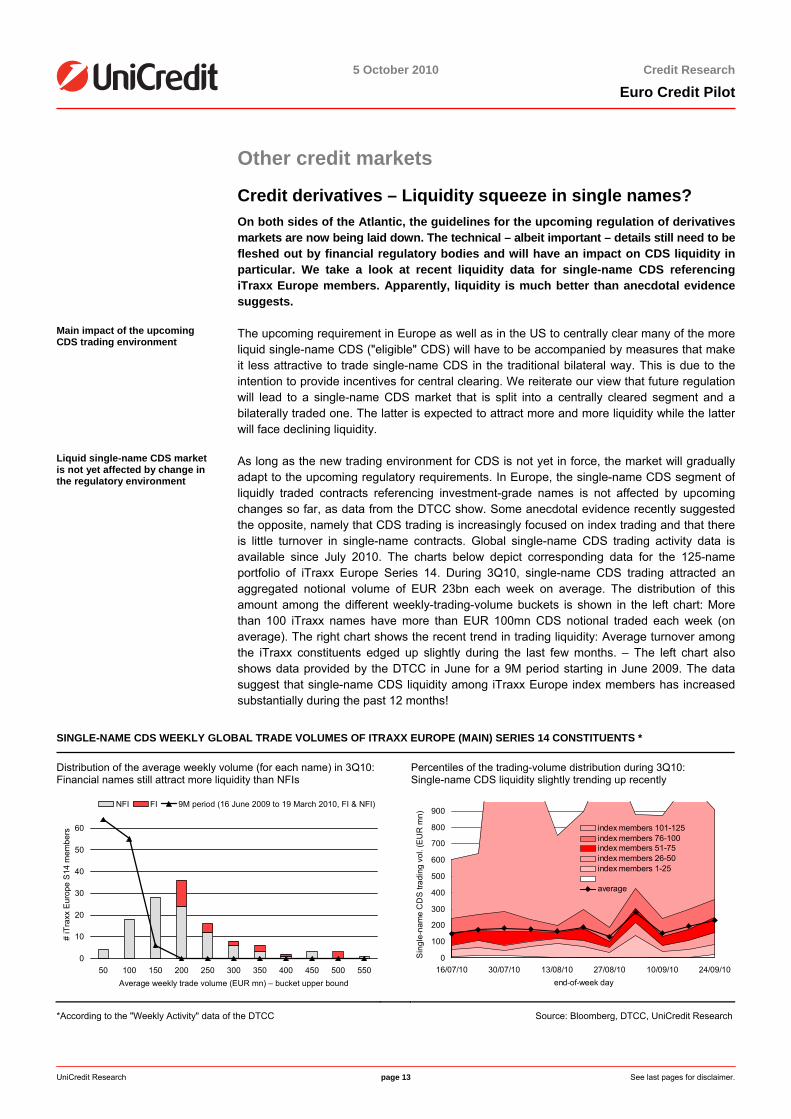
As long as the new trading environment for CDS is not yet in force, the market will graduallyadapt to the upcoming regulatory requirements. In Europe, the single-name CDS segment of liquidly traded contracts referencing investment-grade names is not affected by upcoming changes so far, as data from the DTCC show. Some anecdotal evidence recently suggestedthe opposite, namely that CDS trading is increasingly focused on index trading and that there is little turnover in single-name contracts. Global single-name CDS trading activity data is available since July 2010. The charts below depict corresponding data for the 125-name portfolio of iTraxx Europe Series 14. During 3Q10, single-name CDS trading attracted anaggregated notional volume of EUR 23bn each week on average. The distribution of thisamount among the different weekly-trading-volume buckets is shown in the left chart: More than 100 iTraxx names have more than EUR 100mn CDS notional traded each week (on average). The right chart shows the recent trend in trading liquidity: Average turnover amongthe iTraxx constituents edged up slightly during the last few months. – The left chart also shows data provided by the DTCC in June for a 9M period starting in June 2009. The datasuggest that single-name CDS liquidity among iTraxx Europe index members has increasedsubstantially during the past 12 months!
SINGLE-NAME CDS WEEKLY GLOBAL TRADE VOLUMES OF ITRAXX EUROPE (MAIN) SERIES 14 CONSTITUENTS *
Distribution of the average weekly volume (for each name) in 3Q10: Financial names still attract more liquidity than NFIs
Percentiles of the trading-volume distribution during 3Q10: Single-name CDS liquidity slightly trending up recently
0
10
20
30
40
50
60
50 100 150 200 250 300 350 400 450 500 550Average weekly trade volume (EUR mn) – bucket upper bound
# iT
raxx
Eur
ope
S14
mem
bers
NFI FI 9M period (16 June 2009 to 19 March 2010, FI & NFI)
0
100
200
300
400
500
600
700
800
900
16/07/10 30/07/10 13/08/10 27/08/10 10/09/10 24/09/10end-of-week day
index members 101-125index members 76-100index members 51-75index members 26-50index members 1-25
average
Sin
gle-
nam
e C
DS
trad
ing
vol.
(EU
R m
n)
*According to the "Weekly Activity" data of the DTCC Source: Bloomberg, DTCC, UniCredit Research
<date>
5 October 2010 Credit Research
Euro Credit Pilot
UniCredit Research page 14 See last pages for disclaimer.
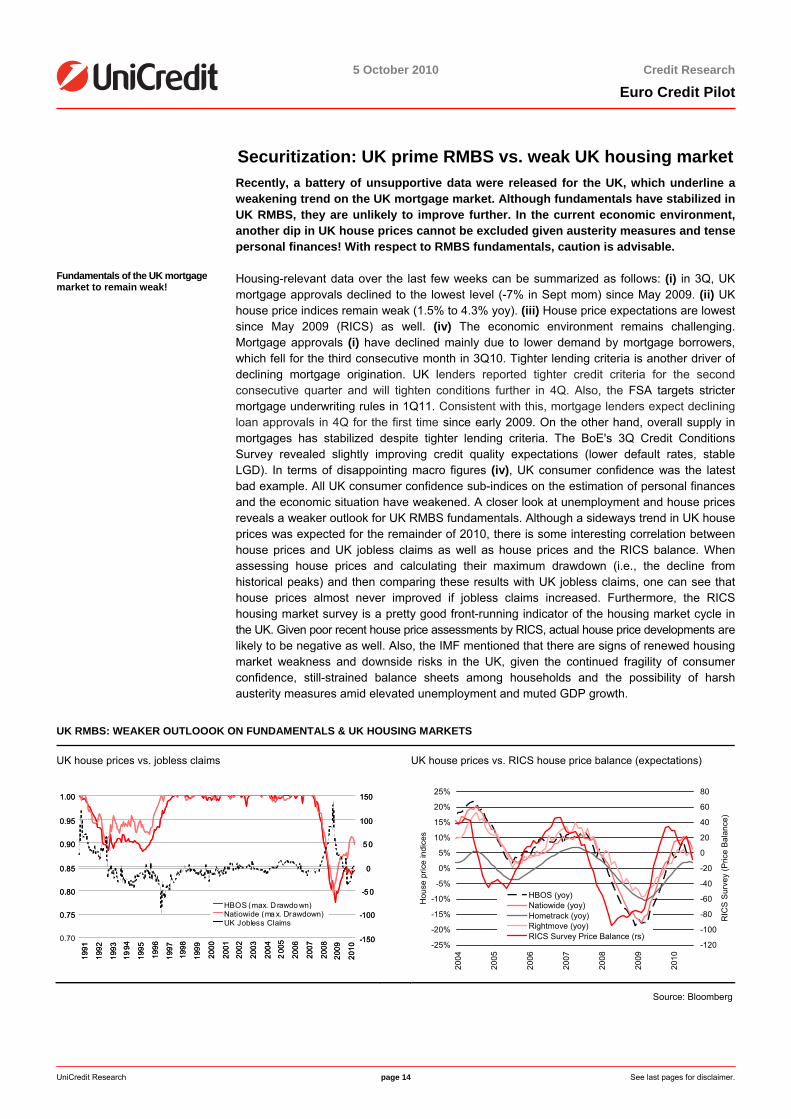
Securitization: UK prime RMBS vs. weak UK housing market Recently, a battery of unsupportive data were released for the UK, which underline a
weakening trend on the UK mortgage market. Although fundamentals have stabilized in UK RMBS, they are unlikely to improve further. In the current economic environment,another dip in UK house prices cannot be excluded given austerity measures and tense personal finances! With respect to RMBS fundamentals, caution is advisable.
Fundamentals of the UK mortgage market to remain weak!
Housing-relevant data over the last few weeks can be summarized as follows: (i) in 3Q, UK mortgage approvals declined to the lowest level (-7% in Sept mom) since May 2009. (ii) UK house price indices remain weak (1.5% to 4.3% yoy). (iii) House price expectations are lowest since May 2009 (RICS) as well. (iv) The economic environment remains challenging. Mortgage approvals (i) have declined mainly due to lower demand by mortgage borrowers,which fell for the third consecutive month in 3Q10. Tighter lending criteria is another driver ofdeclining mortgage origination. UK lenders reported tighter credit criteria for the second consecutive quarter and will tighten conditions further in 4Q. Also, the FSA targets stricter mortgage underwriting rules in 1Q11. Consistent with this, mortgage lenders expect declining loan approvals in 4Q for the first time since early 2009. On the other hand, overall supply inmortgages has stabilized despite tighter lending criteria. The BoE's 3Q Credit ConditionsSurvey revealed slightly improving credit quality expectations (lower default rates, stableLGD). In terms of disappointing macro figures (iv), UK consumer confidence was the latest bad example. All UK consumer confidence sub-indices on the estimation of personal finances and the economic situation have weakened. A closer look at unemployment and house pricesreveals a weaker outlook for UK RMBS fundamentals. Although a sideways trend in UK houseprices was expected for the remainder of 2010, there is some interesting correlation betweenhouse prices and UK jobless claims as well as house prices and the RICS balance. Whenassessing house prices and calculating their maximum drawdown (i.e., the decline fromhistorical peaks) and then comparing these results with UK jobless claims, one can see thathouse prices almost never improved if jobless claims increased. Furthermore, the RICShousing market survey is a pretty good front-running indicator of the housing market cycle in the UK. Given poor recent house price assessments by RICS, actual house price developments are likely to be negative as well. Also, the IMF mentioned that there are signs of renewed housing market weakness and downside risks in the UK, given the continued fragility of consumerconfidence, still-strained balance sheets among households and the possibility of harshausterity measures amid elevated unemployment and muted GDP growth.
UK RMBS: WEAKER OUTLOOOK ON FUNDAMENTALS & UK HOUSING MARKETS
UK house prices vs. jobless claims UK house prices vs. RICS house price balance (expectations)
0.75
0.80
0.85
0.90
0.95
1.00
1991
1992
1993
1994
1995
1996
1997
1998
1999
2000
2001
2002
2003
2004
200
5
2006
2007
2008
2009
2010
-150
-100
-5 0
0
5 0
100
150
0.70
HBOS (max. D rawdo wn)Natiowide (ma x. Drawdown)UK Jobless Claims
0.75
0.80
0.85
0.90
0.95
1.00
1991
1992
1993
1994
1995
1996
1997
1998
1999
2000
2001
2002
2003
2004
200
5
2006
2007
2008
2009
2010
-150
-100
-5 0
0
5 0
100
150
0.70
HBOS (max. D rawdo wn)Natiowide (ma x. Drawdown)UK Jobless Claims
-25%
-20%
-15%
-10%
-5%
0%
5%
10%
15%
20%
25%
2004
2005
2006
2007
2008
2009
2010
Hou
se p
rice
indi
ces
-120
-100
-80
-60
-40
-20
0
20
40
60
80
RIC
S S
urve
y (P
rice
Bala
nce)
HBOS (yoy)Natiowide (yoy)Hometrack (yoy)Rightmove (yoy)RICS Survey Price Balance (rs)
Source: Bloomberg
<date>
5 October 2010 Credit Research
Euro Credit Pilot
UniCredit Research page 15 See last pages for disclaimer.
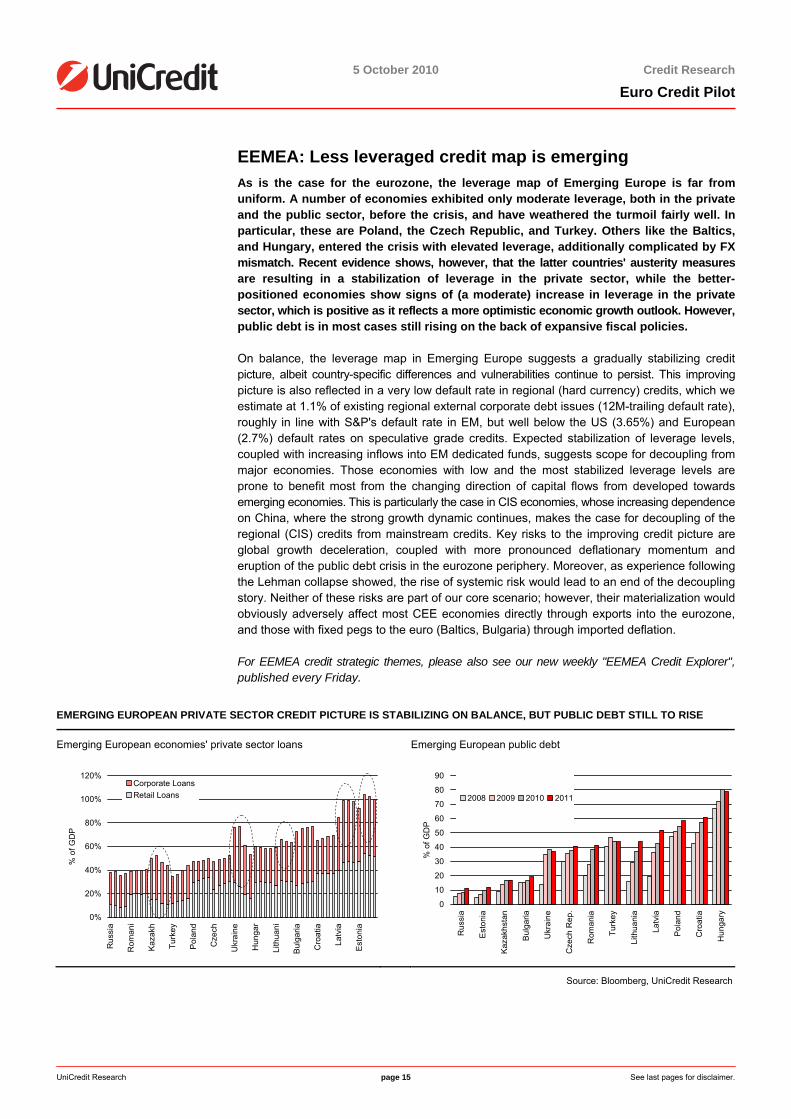
EEMEA: Less leveraged credit map is emerging As is the case for the eurozone, the leverage map of Emerging Europe is far from
uniform. A number of economies exhibited only moderate leverage, both in the privateand the public sector, before the crisis, and have weathered the turmoil fairly well. Inparticular, these are Poland, the Czech Republic, and Turkey. Others like the Baltics,and Hungary, entered the crisis with elevated leverage, additionally complicated by FXmismatch. Recent evidence shows, however, that the latter countries' austerity measuresare resulting in a stabilization of leverage in the private sector, while the better-positioned economies show signs of (a moderate) increase in leverage in the privatesector, which is positive as it reflects a more optimistic economic growth outlook. However, public debt is in most cases still rising on the back of expansive fiscal policies.
On balance, the leverage map in Emerging Europe suggests a gradually stabilizing creditpicture, albeit country-specific differences and vulnerabilities continue to persist. This improvingpicture is also reflected in a very low default rate in regional (hard currency) credits, which weestimate at 1.1% of existing regional external corporate debt issues (12M-trailing default rate), roughly in line with S&P's default rate in EM, but well below the US (3.65%) and European (2.7%) default rates on speculative grade credits. Expected stabilization of leverage levels,coupled with increasing inflows into EM dedicated funds, suggests scope for decoupling frommajor economies. Those economies with low and the most stabilized leverage levels areprone to benefit most from the changing direction of capital flows from developed towardsemerging economies. This is particularly the case in CIS economies, whose increasing dependence on China, where the strong growth dynamic continues, makes the case for decoupling of theregional (CIS) credits from mainstream credits. Key risks to the improving credit picture areglobal growth deceleration, coupled with more pronounced deflationary momentum and eruption of the public debt crisis in the eurozone periphery. Moreover, as experience followingthe Lehman collapse showed, the rise of systemic risk would lead to an end of the decouplingstory. Neither of these risks are part of our core scenario; however, their materialization would obviously adversely affect most CEE economies directly through exports into the eurozone,and those with fixed pegs to the euro (Baltics, Bulgaria) through imported deflation.
For EEMEA credit strategic themes, please also see our new weekly "EEMEA Credit Explorer", published every Friday.
EMERGING EUROPEAN PRIVATE SECTOR CREDIT PICTURE IS STABILIZING ON BALANCE, BUT PUBLIC DEBT STILL TO RISE
Emerging European economies' private sector loans Emerging European public debt
0%
20%
40%
60%
80%
100%
120%
Rus
sia
Rom
ani
Kaz
akh
Turk
ey
Pol
and
Cze
ch
Ukr
aine
Hun
gar
Lith
uani
Bul
garia
Cro
atia
Latv
ia
Est
onia
% o
f GD
P
Corporate Loans Retail Loans
0
10
20
30
40
50
60
70
80
90
Rus
sia
Est
onia
Kaz
akhs
tan
Bul
garia
Ukr
aine
Cze
ch R
ep.
Rom
ania
Turk
ey
Lith
uani
a
Latv
ia
Pol
and
Cro
atia
Hun
gary
% o
f GD
P
2008 2009 2010 2011
Source: Bloomberg, UniCredit Research

<date>
5 October 2010 Credit Research
Euro Credit Pilot
UniCredit Research page 16 See last pages for disclaimer.
Sector Allocation Given our concerns regarding a potential materialization of macroeconomic headline
risks, we stick to our cautious stance towards investment grade corporate credit risk.We prefer more stable and less cyclical sectors, such as Industrial Transportation (i.e.Toll Roads), Food & Beverages and Tobacco. However, we also stick to our morecyclical bet in overweighting Oil & Gas. We remain underweight in cyclical sectors likeIndustrial Goods & Services and Construction & Materials, as well as in Health Care(which is a non-cyclical sector but trading very tight). Chemicals (which we alsounderweight) is a special case. Although the industry tends to be more cyclical ingeneral, the iBoxx sector mainly consists of the German heavyweights BASF, Bayerand Linde (accounting for more than 60% of the outstanding volume and ranging in thesingle-A rating category), which either operate in stable niches (industrial gases in thecase of Linde) or diversified into non-cyclical operations (pharmaceuticals in the case of Bayer and oil and gas in the case of BASF). Nevertheless, we believe that the sectoroffers little value compared to other industries.
CREDIT ALLOCATION TABLE
As of 4 October 2010
Current recommendation
iBoxx weight (%)
YTD spread change
Current spread level
Macro allocation Sovereigns AAA OW 34.9 -16.1 -23.3Sovereigns ex-AAA MW 27.8 63.0 121.3Sub-Sovereigns OW 13.1 4.7 29.2Covered Bonds OW 4.1 49.2 114.5Financials MW 9.5 -7.2 188.8Non-Financials UW 10.7 8.0 99.9Sector allocation NFI Telecommunications TEL MW 16.8 23.7 115.8Media MDI MW 1.6 -21.3 113.9Technology THE MW 0.8 -7.3 94.0Automobiles & Parts ATO MW 9.3 -20.0 77.7Utilities UTS MW 25.5 21.6 96.3Oil & Gas OIG OW 7.3 11.1 97.6Industrial Goods & Services (Core) IGS UW 6.4 -15.0 105.2Aerospace & Defense AED MW 0.8 36.3 133.0Industrial Transportation ITR OW 3.6 41.9 155.7Basic Resources BAS MW 2.3 15.2 160.9Chemicals CHE UW 4.3 -10.2 79.0Construction & Materials CNS UW 3.4 36.3 176.9Health Care HCA UW 6.4 2.2 49.3Personal & Household Goods (Core) PHG MW 1.9 -11.8 71.0Tobacco TOB OW 2.3 -11.6 81.1Food & Beverage FOB OW 2.8 -19.5 69.7Travel & Leisure TAL UW 0.7 -109.9 155.6Retail RET UW 4.0 -3.4 81.9Quality allocation NFI AAA OW 0.2 -10.9 25.3AA OW 12.5 0.5 50.6A MW 49.2 3.6 75.9BBB UW 38.1 12.2 147.4
Source: UniCredit Research
<date>
5 October 2010 Credit Research
Euro Credit Pilot
UniCredit Research page 17 See last pages for disclaimer.
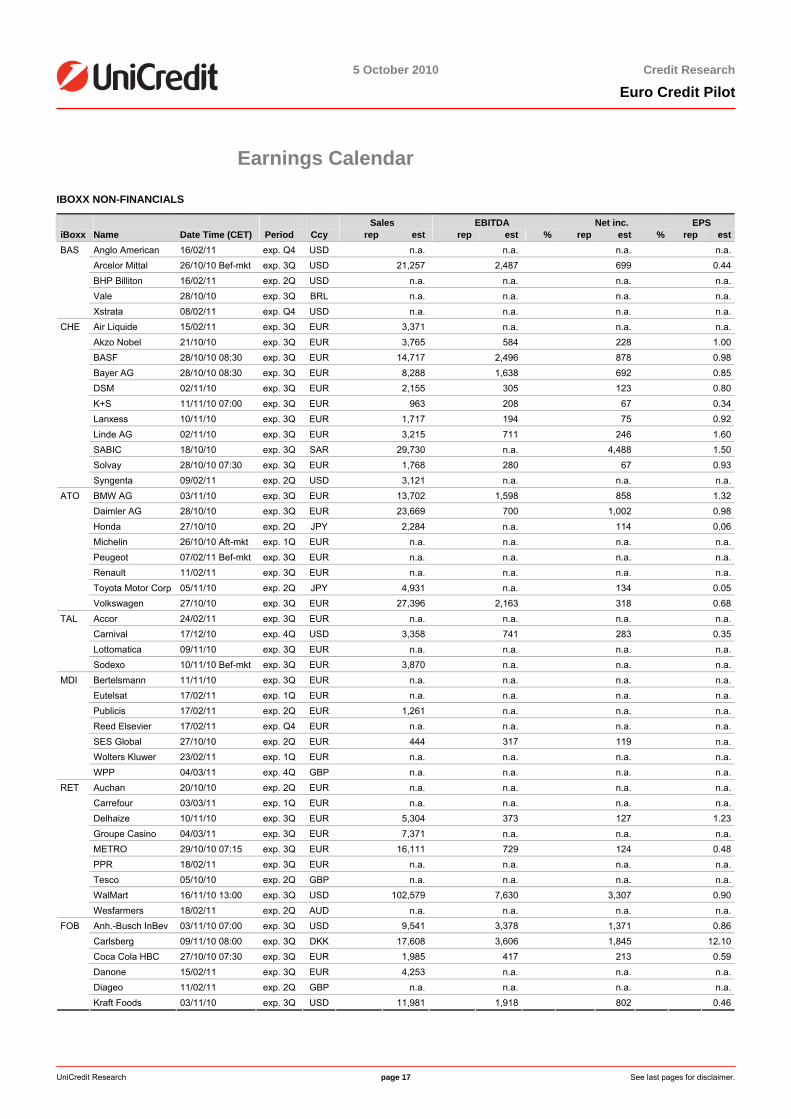
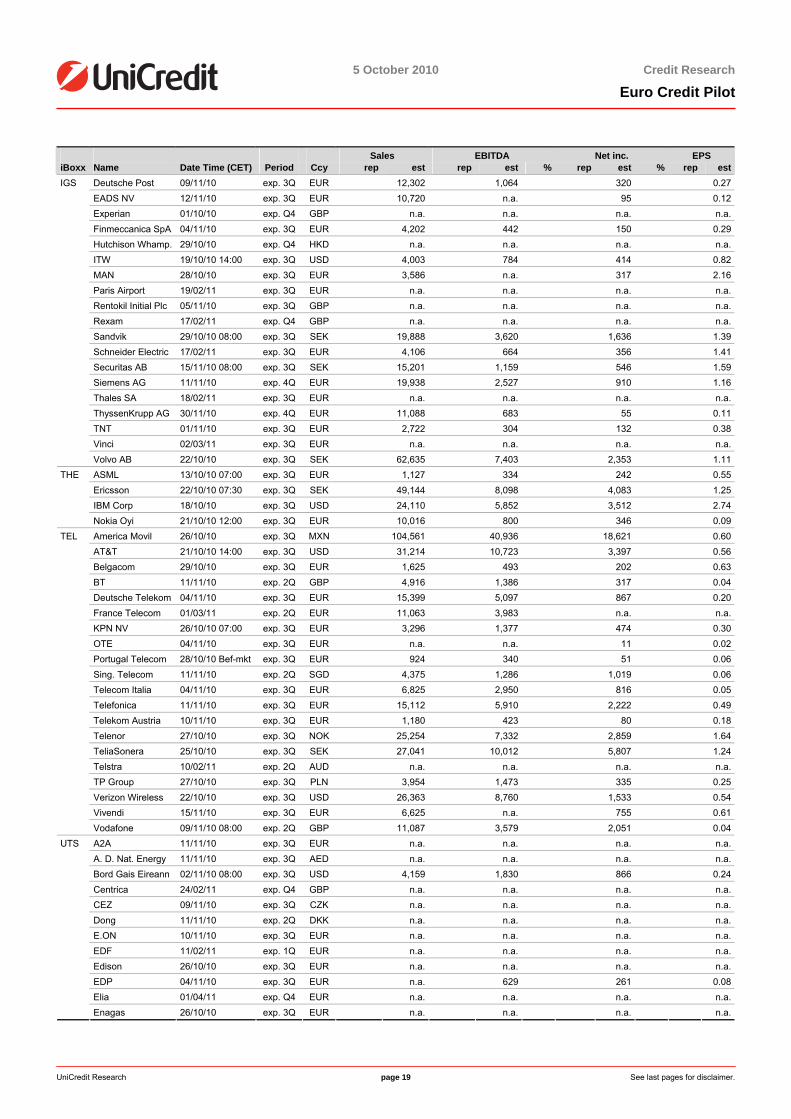
Earnings Calendar
IBOXX NON-FINANCIALS
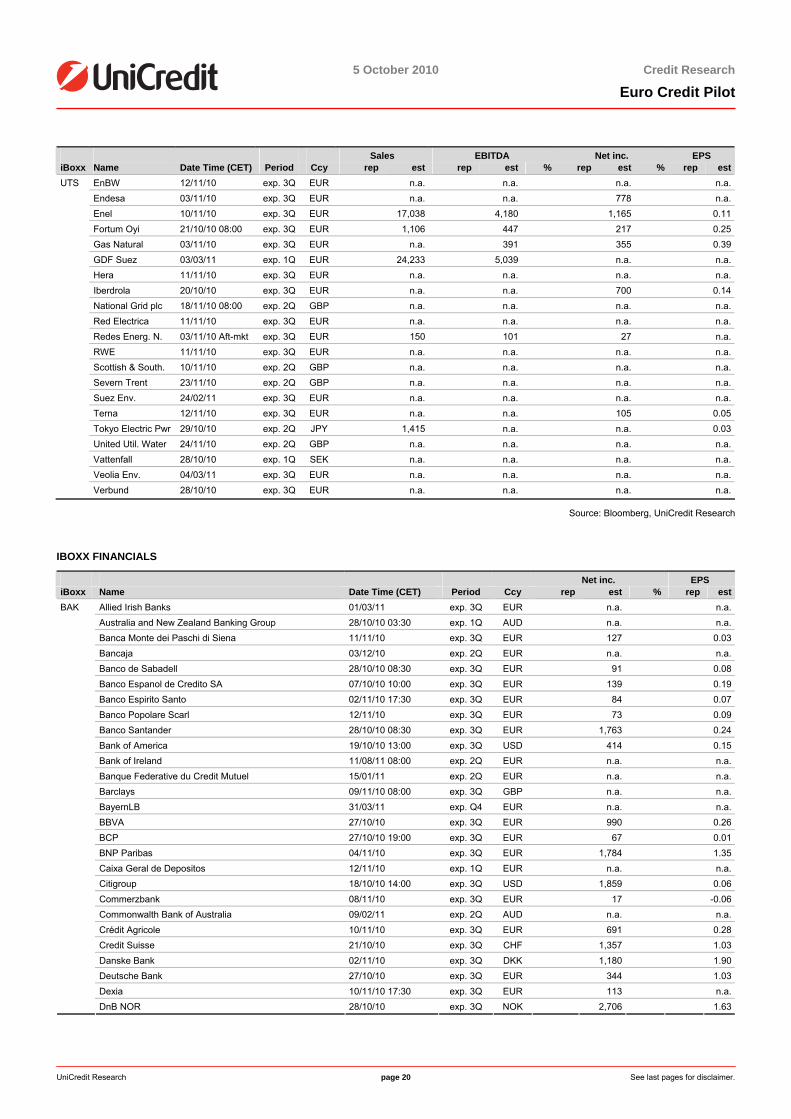
Sales EBITDA Net inc. EPS iBoxx Name Date Time (CET) Period Ccy rep est rep est % rep est % rep est
Anglo American 16/02/11 exp. Q4 USD n.a. n.a. n.a. n.a.Arcelor Mittal 26/10/10 Bef-mkt exp. 3Q USD 21,257 2,487 699 0.44BHP Billiton 16/02/11 exp. 2Q USD n.a. n.a. n.a. n.a.Vale 28/10/10 exp. 3Q BRL n.a. n.a. n.a. n.a.
BAS
Xstrata 08/02/11 exp. Q4 USD n.a. n.a. n.a. n.a.Air Liquide 15/02/11 exp. 3Q EUR 3,371 n.a. n.a. n.a.Akzo Nobel 21/10/10 exp. 3Q EUR 3,765 584 228 1.00BASF 28/10/10 08:30 exp. 3Q EUR 14,717 2,496 878 0.98Bayer AG 28/10/10 08:30 exp. 3Q EUR 8,288 1,638 692 0.85DSM 02/11/10 exp. 3Q EUR 2,155 305 123 0.80K+S 11/11/10 07:00 exp. 3Q EUR 963 208 67 0.34Lanxess 10/11/10 exp. 3Q EUR 1,717 194 75 0.92Linde AG 02/11/10 exp. 3Q EUR 3,215 711 246 1.60SABIC 18/10/10 exp. 3Q SAR 29,730 n.a. 4,488 1.50Solvay 28/10/10 07:30 exp. 3Q EUR 1,768 280 67 0.93
CHE
Syngenta 09/02/11 exp. 2Q USD 3,121 n.a. n.a. n.a.BMW AG 03/11/10 exp. 3Q EUR 13,702 1,598 858 1.32Daimler AG 28/10/10 exp. 3Q EUR 23,669 700 1,002 0.98Honda 27/10/10 exp. 2Q JPY 2,284 n.a. 114 0.06Michelin 26/10/10 Aft-mkt exp. 1Q EUR n.a. n.a. n.a. n.a.Peugeot 07/02/11 Bef-mkt exp. 3Q EUR n.a. n.a. n.a. n.a.Renault 11/02/11 exp. 3Q EUR n.a. n.a. n.a. n.a.Toyota Motor Corp 05/11/10 exp. 2Q JPY 4,931 n.a. 134 0.05
ATO
Volkswagen 27/10/10 exp. 3Q EUR 27,396 2,163 318 0.68Accor 24/02/11 exp. 3Q EUR n.a. n.a. n.a. n.a.Carnival 17/12/10 exp. 4Q USD 3,358 741 283 0.35Lottomatica 09/11/10 exp. 3Q EUR n.a. n.a. n.a. n.a.
TAL
Sodexo 10/11/10 Bef-mkt exp. 3Q EUR 3,870 n.a. n.a. n.a.Bertelsmann 11/11/10 exp. 3Q EUR n.a. n.a. n.a. n.a.Eutelsat 17/02/11 exp. 1Q EUR n.a. n.a. n.a. n.a.Publicis 17/02/11 exp. 2Q EUR 1,261 n.a. n.a. n.a.Reed Elsevier 17/02/11 exp. Q4 EUR n.a. n.a. n.a. n.a.SES Global 27/10/10 exp. 2Q EUR 444 317 119 n.a.Wolters Kluwer 23/02/11 exp. 1Q EUR n.a. n.a. n.a. n.a.
MDI
WPP 04/03/11 exp. 4Q GBP n.a. n.a. n.a. n.a.Auchan 20/10/10 exp. 2Q EUR n.a. n.a. n.a. n.a.Carrefour 03/03/11 exp. 1Q EUR n.a. n.a. n.a. n.a.Delhaize 10/11/10 exp. 3Q EUR 5,304 373 127 1.23Groupe Casino 04/03/11 exp. 3Q EUR 7,371 n.a. n.a. n.a.METRO 29/10/10 07:15 exp. 3Q EUR 16,111 729 124 0.48PPR 18/02/11 exp. 3Q EUR n.a. n.a. n.a. n.a.Tesco 05/10/10 exp. 2Q GBP n.a. n.a. n.a. n.a.WalMart 16/11/10 13:00 exp. 3Q USD 102,579 7,630 3,307 0.90
RET
Wesfarmers 18/02/11 exp. 2Q AUD n.a. n.a. n.a. n.a.Anh.-Busch InBev 03/11/10 07:00 exp. 3Q USD 9,541 3,378 1,371 0.86Carlsberg 09/11/10 08:00 exp. 3Q DKK 17,608 3,606 1,845 12.10Coca Cola HBC 27/10/10 07:30 exp. 3Q EUR 1,985 417 213 0.59Danone 15/02/11 exp. 3Q EUR 4,253 n.a. n.a. n.a.Diageo 11/02/11 exp. 2Q GBP n.a. n.a. n.a. n.a.
FOB
Kraft Foods 03/11/10 exp. 3Q USD 11,981 1,918 802 0.46

<date>
5 October 2010 Credit Research
Euro Credit Pilot
UniCredit Research page 18 See last pages for disclaimer.
Sales EBITDA Net inc. EPS iBoxx Name Date Time (CET) Period Ccy rep est rep est % rep est % rep est
SABMiller 18/11/10 08:00 exp. 2Q USD n.a. n.a. n.a. n.a.Südzucker 14/10/10 exp. 2Q EUR 1,616 n.a. n.a. 0.34
FOB
Unilever 04/11/10 08:00 exp. 3Q EUR 11,514 n.a. 1,261 0.43BAT 24/02/11 exp. 1Q GBP n.a. n.a. n.a. n.a.Fortune Brands 22/10/10 exp. 3Q USD 1,737 307 112 0.74Henkel 10/11/10 exp. 3Q EUR 3,789 422 283 0.64Imperial Tobacco 02/11/10 exp. Q4 GBP n.a. n.a. n.a. n.a.Japan Tobacco 28/10/10 08:00 exp. 2Q JPY 1,514 n.a. n.a. 5.66LVMH 04/02/11 exp. 2Q EUR 4,418 n.a. n.a. n.a.Philip Morris 21/10/10 exp. 3Q USD 6,917 3,250 1,859 1.01
PHG
Procter & Gamble 29/10/10 exp. 1Q USD 20,169 5,224 3,028 1.00BG Group plc 02/11/10 08:00 exp. 3Q USD 4,159 1,830 866 0.24BP P.L.C 02/11/10 08:00 exp. 3Q USD 73,702 10,833 4,824 0.26ENI 28/10/10 exp. 3Q EUR 21,487 5,611 1,533 0.47Gazprom 13/10/10 exp. 2Q RUB 724,916 294,293 176,268 n.a.OMV 10/11/10 07:30 exp. 3Q EUR 5,485 863 291 1.09Pemex 01/03/11 exp. 3Q MXN n.a. n.a. n.a. n.a.Repsol YPF 11/11/10 08:00 exp. 3Q EUR 11,670 2,127 499 0.39Schlumberger 22/10/10 12:00 exp. 3Q USD 6,546 1,770 891 0.71Shell 28/10/10 08:00 exp. 3Q USD 68,085 8,280 4,430 0.72StatoilHydro 03/11/10 exp. 3Q NOK 133,525 44,154 10,776 3.41Total 29/10/10 exp. 3Q EUR 36,292 7,705 2,563 1.24
OIG
Transneft 02/06/11 exp. 3Q RUB 96,489 40,138 16,129 2,271.2AstraZeneca 28/10/10 08:00 exp. 3Q USD 7,880 3,485 2,115 1.49Bristol-Myers Sq. 22/10/10 exp. 3Q USD 4,919 1,528 988 0.53GlaxoSmithKline 21/10/10 exp. 3Q GBP 6,956 2,433 1,509 0.29Johnson & Joh. 19/10/10 exp. 3Q USD 15,161 4,581 3,192 1.15Merck & Co. 22/10/10 exp. 3Q USD 11,195 3,432 2,552 0.82Merck KGaA 26/10/10 exp. 3Q EUR 2,434 458 277 1.36Novartis 21/10/10 exp. 3Q USD 12,637 2,770 2,621 1.19Pfizer 20/10/10 exp. 3Q USD 16,653 5,908 4,068 0.51Roche 03/02/11 exp. Q4 CHF n.a. n.a. n.a. n.a.
HCA
Sanofi-Aventis 28/10/10 exp. 3Q EUR 7,873 n.a. 2,301 1.73Bouygues 02/12/10 17:45 exp. 3Q EUR 16 n.a. -401 n.a.Ciments Francais 08/11/10 exp. 3Q EUR n.a. n.a. n.a. n.a.CRH 02/03/11 exp. Q4 EUR n.a. n.a. n.a. n.a.Holcim 10/11/10 07:00 exp. 3Q CHF 6,041 1,530 678 2.03Imerys 03/11/10 Aft-mkt exp. 3Q EUR 811 n.a. 68 n.a.Italcementi 03/11/10 exp. 3Q EUR 1,294 273 56 0.23Lafarge 05/11/10 exp. 3Q EUR 4,678 n.a. n.a. 1.81Saint-Gobain 25/02/11 exp. 3Q EUR 10,318 n.a. n.a. n.a.
CNS
Vinci 02/03/11 exp. 3Q EUR n.a. n.a. n.a. n.a.3M Company 28/10/10 15:00 exp. 3Q USD 6,783 1,912 1,093 1.51ABB 28/10/10 exp. 3Q USD 7,848 1,177 697 0.31Abertis 04/11/10 exp. 3Q EUR 1,098 n.a. 169 0.23Adecco S.A. 09/11/10 exp. 3Q EUR 4,861 223 126 0.66Alstom 04/11/10 exp. 2Q EUR 4,601 n.a. n.a. n.a.APRR 24/02/11 exp. 2Q EUR n.a. n.a. n.a. n.a.Areva 23/02/11 exp. 3Q EUR n.a. n.a. n.a. n.a.Atlantia 11/11/10 exp. 3Q EUR n.a. n.a. n.a. n.a.Atlas Copco 22/10/10 exp. 3Q SEK 17,344 3,744 2,260 1.92Brisa 02/11/10 exp. 3Q EUR 198 143 66 0.11Caterpillar 21/10/10 13:30 exp. 3Q USD 10,362 1,449 685 1.09Danaher 21/10/10 12:00 exp. 3Q USD 3,157 668 378 0.55
IGS
Deere & Co. 24/11/10 exp. 4Q USD 6,362 692 399 0.92
<date>
5 October 2010 Credit Research
Euro Credit Pilot
UniCredit Research page 19 See last pages for disclaimer.
Sales EBITDA Net inc. EPS iBoxx Name Date Time (CET) Period Ccy rep est rep est % rep est % rep est
Deutsche Post 09/11/10 exp. 3Q EUR 12,302 1,064 320 0.27EADS NV 12/11/10 exp. 3Q EUR 10,720 n.a. 95 0.12Experian 01/10/10 exp. Q4 GBP n.a. n.a. n.a. n.a.Finmeccanica SpA 04/11/10 exp. 3Q EUR 4,202 442 150 0.29Hutchison Whamp. 29/10/10 exp. Q4 HKD n.a. n.a. n.a. n.a.ITW 19/10/10 14:00 exp. 3Q USD 4,003 784 414 0.82MAN 28/10/10 exp. 3Q EUR 3,586 n.a. 317 2.16Paris Airport 19/02/11 exp. 3Q EUR n.a. n.a. n.a. n.a.Rentokil Initial Plc 05/11/10 exp. 3Q GBP n.a. n.a. n.a. n.a.Rexam 17/02/11 exp. Q4 GBP n.a. n.a. n.a. n.a.Sandvik 29/10/10 08:00 exp. 3Q SEK 19,888 3,620 1,636 1.39Schneider Electric 17/02/11 exp. 3Q EUR 4,106 664 356 1.41Securitas AB 15/11/10 08:00 exp. 3Q SEK 15,201 1,159 546 1.59Siemens AG 11/11/10 exp. 4Q EUR 19,938 2,527 910 1.16Thales SA 18/02/11 exp. 3Q EUR n.a. n.a. n.a. n.a.ThyssenKrupp AG 30/11/10 exp. 4Q EUR 11,088 683 55 0.11TNT 01/11/10 exp. 3Q EUR 2,722 304 132 0.38Vinci 02/03/11 exp. 3Q EUR n.a. n.a. n.a. n.a.
IGS
Volvo AB 22/10/10 exp. 3Q SEK 62,635 7,403 2,353 1.11ASML 13/10/10 07:00 exp. 3Q EUR 1,127 334 242 0.55Ericsson 22/10/10 07:30 exp. 3Q SEK 49,144 8,098 4,083 1.25IBM Corp 18/10/10 exp. 3Q USD 24,110 5,852 3,512 2.74
THE
Nokia Oyi 21/10/10 12:00 exp. 3Q EUR 10,016 800 346 0.09America Movil 26/10/10 exp. 3Q MXN 104,561 40,936 18,621 0.60AT&T 21/10/10 14:00 exp. 3Q USD 31,214 10,723 3,397 0.56Belgacom 29/10/10 exp. 3Q EUR 1,625 493 202 0.63BT 11/11/10 exp. 2Q GBP 4,916 1,386 317 0.04Deutsche Telekom 04/11/10 exp. 3Q EUR 15,399 5,097 867 0.20France Telecom 01/03/11 exp. 2Q EUR 11,063 3,983 n.a. n.a.KPN NV 26/10/10 07:00 exp. 3Q EUR 3,296 1,377 474 0.30OTE 04/11/10 exp. 3Q EUR n.a. n.a. 11 0.02Portugal Telecom 28/10/10 Bef-mkt exp. 3Q EUR 924 340 51 0.06Sing. Telecom 11/11/10 exp. 2Q SGD 4,375 1,286 1,019 0.06Telecom Italia 04/11/10 exp. 3Q EUR 6,825 2,950 816 0.05Telefonica 11/11/10 exp. 3Q EUR 15,112 5,910 2,222 0.49Telekom Austria 10/11/10 exp. 3Q EUR 1,180 423 80 0.18Telenor 27/10/10 exp. 3Q NOK 25,254 7,332 2,859 1.64TeliaSonera 25/10/10 exp. 3Q SEK 27,041 10,012 5,807 1.24Telstra 10/02/11 exp. 2Q AUD n.a. n.a. n.a. n.a.TP Group 27/10/10 exp. 3Q PLN 3,954 1,473 335 0.25Verizon Wireless 22/10/10 exp. 3Q USD 26,363 8,760 1,533 0.54Vivendi 15/11/10 exp. 3Q EUR 6,625 n.a. 755 0.61
TEL
Vodafone 09/11/10 08:00 exp. 2Q GBP 11,087 3,579 2,051 0.04A2A 11/11/10 exp. 3Q EUR n.a. n.a. n.a. n.a.A. D. Nat. Energy 11/11/10 exp. 3Q AED n.a. n.a. n.a. n.a.Bord Gais Eireann 02/11/10 08:00 exp. 3Q USD 4,159 1,830 866 0.24Centrica 24/02/11 exp. Q4 GBP n.a. n.a. n.a. n.a.CEZ 09/11/10 exp. 3Q CZK n.a. n.a. n.a. n.a.Dong 11/11/10 exp. 2Q DKK n.a. n.a. n.a. n.a.E.ON 10/11/10 exp. 3Q EUR n.a. n.a. n.a. n.a.EDF 11/02/11 exp. 1Q EUR n.a. n.a. n.a. n.a.Edison 26/10/10 exp. 3Q EUR n.a. n.a. n.a. n.a.EDP 04/11/10 exp. 3Q EUR n.a. 629 261 0.08Elia 01/04/11 exp. Q4 EUR n.a. n.a. n.a. n.a.
UTS
Enagas 26/10/10 exp. 3Q EUR n.a. n.a. n.a. n.a.
<date>
5 October 2010 Credit Research
Euro Credit Pilot
UniCredit Research page 20 See last pages for disclaimer.
Sales EBITDA Net inc. EPS iBoxx Name Date Time (CET) Period Ccy rep est rep est % rep est % rep est
EnBW 12/11/10 exp. 3Q EUR n.a. n.a. n.a. n.a.Endesa 03/11/10 exp. 3Q EUR n.a. n.a. 778 n.a.Enel 10/11/10 exp. 3Q EUR 17,038 4,180 1,165 0.11Fortum Oyi 21/10/10 08:00 exp. 3Q EUR 1,106 447 217 0.25Gas Natural 03/11/10 exp. 3Q EUR n.a. 391 355 0.39GDF Suez 03/03/11 exp. 1Q EUR 24,233 5,039 n.a. n.a.Hera 11/11/10 exp. 3Q EUR n.a. n.a. n.a. n.a.Iberdrola 20/10/10 exp. 3Q EUR n.a. n.a. 700 0.14National Grid plc 18/11/10 08:00 exp. 2Q GBP n.a. n.a. n.a. n.a.Red Electrica 11/11/10 exp. 3Q EUR n.a. n.a. n.a. n.a.Redes Energ. N. 03/11/10 Aft-mkt exp. 3Q EUR 150 101 27 n.a.RWE 11/11/10 exp. 3Q EUR n.a. n.a. n.a. n.a.Scottish & South. 10/11/10 exp. 2Q GBP n.a. n.a. n.a. n.a.Severn Trent 23/11/10 exp. 2Q GBP n.a. n.a. n.a. n.a.Suez Env. 24/02/11 exp. 3Q EUR n.a. n.a. n.a. n.a.Terna 12/11/10 exp. 3Q EUR n.a. n.a. 105 0.05Tokyo Electric Pwr 29/10/10 exp. 2Q JPY 1,415 n.a. n.a. 0.03United Util. Water 24/11/10 exp. 2Q GBP n.a. n.a. n.a. n.a.Vattenfall 28/10/10 exp. 1Q SEK n.a. n.a. n.a. n.a.Veolia Env. 04/03/11 exp. 3Q EUR n.a. n.a. n.a. n.a.
UTS
Verbund 28/10/10 exp. 3Q EUR n.a. n.a. n.a. n.a.
Source: Bloomberg, UniCredit Research
IBOXX FINANCIALS
Net inc. EPS iBoxx Name Date Time (CET) Period Ccy rep est % rep est
Allied Irish Banks 01/03/11 exp. 3Q EUR n.a. n.a.Australia and New Zealand Banking Group 28/10/10 03:30 exp. 1Q AUD n.a. n.a.Banca Monte dei Paschi di Siena 11/11/10 exp. 3Q EUR 127 0.03Bancaja 03/12/10 exp. 2Q EUR n.a. n.a.Banco de Sabadell 28/10/10 08:30 exp. 3Q EUR 91 0.08Banco Espanol de Credito SA 07/10/10 10:00 exp. 3Q EUR 139 0.19Banco Espirito Santo 02/11/10 17:30 exp. 3Q EUR 84 0.07Banco Popolare Scarl 12/11/10 exp. 3Q EUR 73 0.09Banco Santander 28/10/10 08:30 exp. 3Q EUR 1,763 0.24Bank of America 19/10/10 13:00 exp. 3Q USD 414 0.15Bank of Ireland 11/08/11 08:00 exp. 2Q EUR n.a. n.a.Banque Federative du Credit Mutuel 15/01/11 exp. 2Q EUR n.a. n.a.Barclays 09/11/10 08:00 exp. 3Q GBP n.a. n.a.BayernLB 31/03/11 exp. Q4 EUR n.a. n.a.BBVA 27/10/10 exp. 3Q EUR 990 0.26BCP 27/10/10 19:00 exp. 3Q EUR 67 0.01BNP Paribas 04/11/10 exp. 3Q EUR 1,784 1.35Caixa Geral de Depositos 12/11/10 exp. 1Q EUR n.a. n.a.Citigroup 18/10/10 14:00 exp. 3Q USD 1,859 0.06Commerzbank 08/11/10 exp. 3Q EUR 17 -0.06Commonwalth Bank of Australia 09/02/11 exp. 2Q AUD n.a. n.a.Crédit Agricole 10/11/10 exp. 3Q EUR 691 0.28Credit Suisse 21/10/10 exp. 3Q CHF 1,357 1.03Danske Bank 02/11/10 exp. 3Q DKK 1,180 1.90Deutsche Bank 27/10/10 exp. 3Q EUR 344 1.03Dexia 10/11/10 17:30 exp. 3Q EUR 113 n.a.
BAK
DnB NOR 28/10/10 exp. 3Q NOK 2,706 1.63
<date>
5 October 2010 Credit Research
Euro Credit Pilot
UniCredit Research page 21 See last pages for disclaimer.
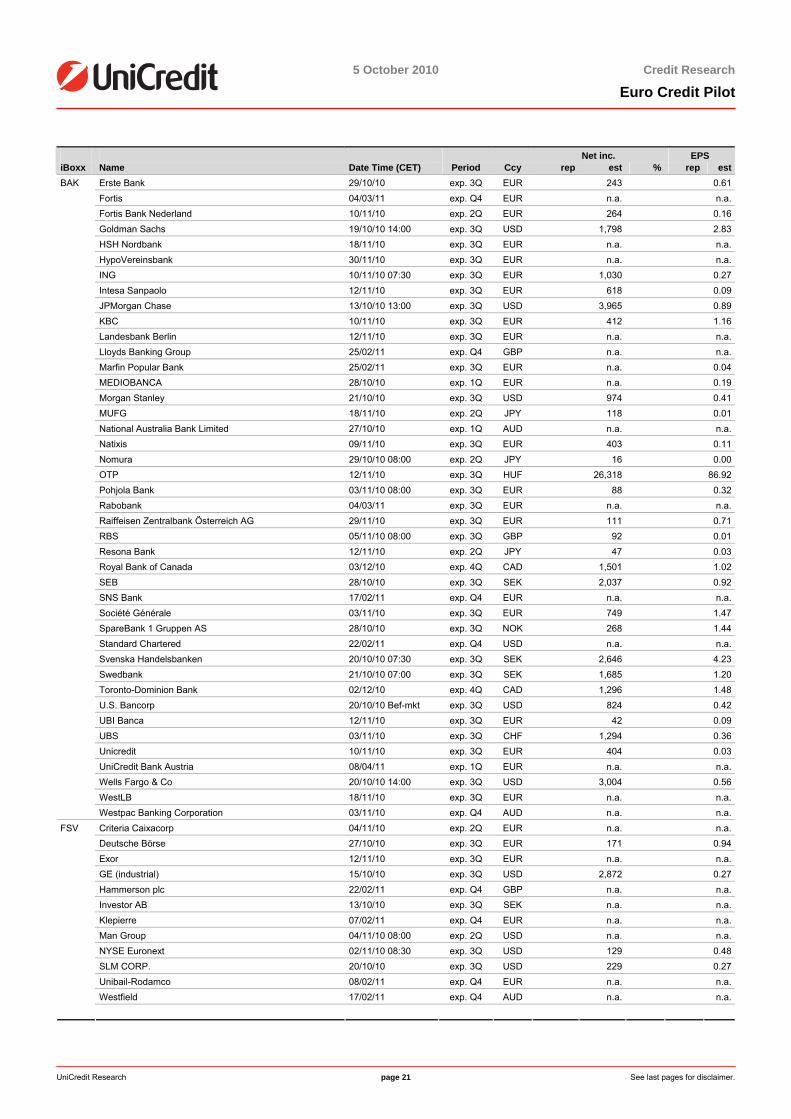
Net inc. EPS iBoxx Name Date Time (CET) Period Ccy rep est % rep est
Erste Bank 29/10/10 exp. 3Q EUR 243 0.61Fortis 04/03/11 exp. Q4 EUR n.a. n.a.Fortis Bank Nederland 10/11/10 exp. 2Q EUR 264 0.16Goldman Sachs 19/10/10 14:00 exp. 3Q USD 1,798 2.83HSH Nordbank 18/11/10 exp. 3Q EUR n.a. n.a.HypoVereinsbank 30/11/10 exp. 3Q EUR n.a. n.a.ING 10/11/10 07:30 exp. 3Q EUR 1,030 0.27Intesa Sanpaolo 12/11/10 exp. 3Q EUR 618 0.09JPMorgan Chase 13/10/10 13:00 exp. 3Q USD 3,965 0.89KBC 10/11/10 exp. 3Q EUR 412 1.16Landesbank Berlin 12/11/10 exp. 3Q EUR n.a. n.a.Lloyds Banking Group 25/02/11 exp. Q4 GBP n.a. n.a.Marfin Popular Bank 25/02/11 exp. 3Q EUR n.a. 0.04MEDIOBANCA 28/10/10 exp. 1Q EUR n.a. 0.19Morgan Stanley 21/10/10 exp. 3Q USD 974 0.41MUFG 18/11/10 exp. 2Q JPY 118 0.01National Australia Bank Limited 27/10/10 exp. 1Q AUD n.a. n.a.Natixis 09/11/10 exp. 3Q EUR 403 0.11Nomura 29/10/10 08:00 exp. 2Q JPY 16 0.00OTP 12/11/10 exp. 3Q HUF 26,318 86.92Pohjola Bank 03/11/10 08:00 exp. 3Q EUR 88 0.32Rabobank 04/03/11 exp. 3Q EUR n.a. n.a.Raiffeisen Zentralbank Österreich AG 29/11/10 exp. 3Q EUR 111 0.71RBS 05/11/10 08:00 exp. 3Q GBP 92 0.01Resona Bank 12/11/10 exp. 2Q JPY 47 0.03Royal Bank of Canada 03/12/10 exp. 4Q CAD 1,501 1.02SEB 28/10/10 exp. 3Q SEK 2,037 0.92SNS Bank 17/02/11 exp. Q4 EUR n.a. n.a.Société Générale 03/11/10 exp. 3Q EUR 749 1.47SpareBank 1 Gruppen AS 28/10/10 exp. 3Q NOK 268 1.44Standard Chartered 22/02/11 exp. Q4 USD n.a. n.a.Svenska Handelsbanken 20/10/10 07:30 exp. 3Q SEK 2,646 4.23Swedbank 21/10/10 07:00 exp. 3Q SEK 1,685 1.20Toronto-Dominion Bank 02/12/10 exp. 4Q CAD 1,296 1.48U.S. Bancorp 20/10/10 Bef-mkt exp. 3Q USD 824 0.42UBI Banca 12/11/10 exp. 3Q EUR 42 0.09UBS 03/11/10 exp. 3Q CHF 1,294 0.36Unicredit 10/11/10 exp. 3Q EUR 404 0.03UniCredit Bank Austria 08/04/11 exp. 1Q EUR n.a. n.a.Wells Fargo & Co 20/10/10 14:00 exp. 3Q USD 3,004 0.56WestLB 18/11/10 exp. 3Q EUR n.a. n.a.
BAK
Westpac Banking Corporation 03/11/10 exp. Q4 AUD n.a. n.a.Criteria Caixacorp 04/11/10 exp. 2Q EUR n.a. n.a.Deutsche Börse 27/10/10 exp. 3Q EUR 171 0.94Exor 12/11/10 exp. 3Q EUR n.a. n.a.GE (industrial) 15/10/10 exp. 3Q USD 2,872 0.27Hammerson plc 22/02/11 exp. Q4 GBP n.a. n.a.Investor AB 13/10/10 exp. 3Q SEK n.a. n.a.Klepierre 07/02/11 exp. Q4 EUR n.a. n.a.Man Group 04/11/10 08:00 exp. 2Q USD n.a. n.a.NYSE Euronext 02/11/10 08:30 exp. 3Q USD 129 0.48SLM CORP. 20/10/10 exp. 3Q USD 229 0.27Unibail-Rodamco 08/02/11 exp. Q4 EUR n.a. n.a.Westfield 17/02/11 exp. Q4 AUD n.a. n.a.
FSV
<date>
5 October 2010 Credit Research
Euro Credit Pilot
UniCredit Research page 22 See last pages for disclaimer.
Net inc. EPS iBoxx Name Date Time (CET) Period Ccy rep est % rep est
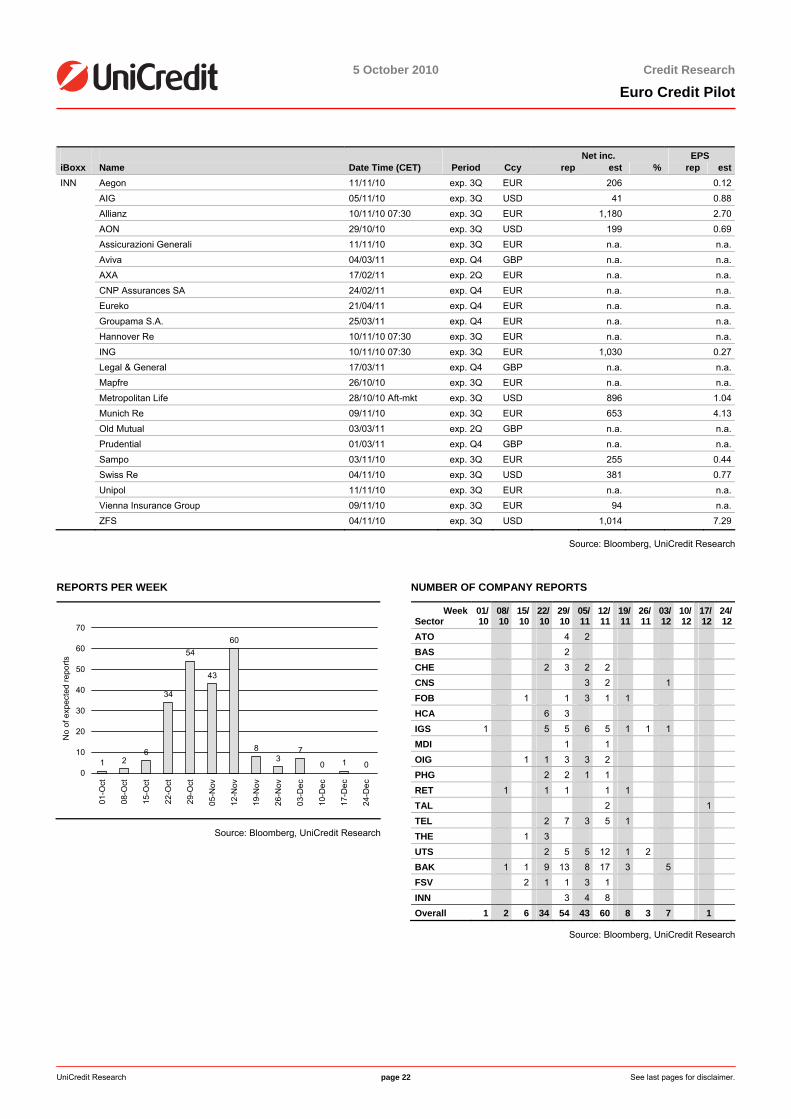
Aegon 11/11/10 exp. 3Q EUR 206 0.12AIG 05/11/10 exp. 3Q USD 41 0.88Allianz 10/11/10 07:30 exp. 3Q EUR 1,180 2.70AON 29/10/10 exp. 3Q USD 199 0.69Assicurazioni Generali 11/11/10 exp. 3Q EUR n.a. n.a.Aviva 04/03/11 exp. Q4 GBP n.a. n.a.AXA 17/02/11 exp. 2Q EUR n.a. n.a.CNP Assurances SA 24/02/11 exp. Q4 EUR n.a. n.a.Eureko 21/04/11 exp. Q4 EUR n.a. n.a.Groupama S.A. 25/03/11 exp. Q4 EUR n.a. n.a.Hannover Re 10/11/10 07:30 exp. 3Q EUR n.a. n.a.ING 10/11/10 07:30 exp. 3Q EUR 1,030 0.27Legal & General 17/03/11 exp. Q4 GBP n.a. n.a.Mapfre 26/10/10 exp. 3Q EUR n.a. n.a.Metropolitan Life 28/10/10 Aft-mkt exp. 3Q USD 896 1.04Munich Re 09/11/10 exp. 3Q EUR 653 4.13Old Mutual 03/03/11 exp. 2Q GBP n.a. n.a.Prudential 01/03/11 exp. Q4 GBP n.a. n.a.Sampo 03/11/10 exp. 3Q EUR 255 0.44Swiss Re 04/11/10 exp. 3Q USD 381 0.77Unipol 11/11/10 exp. 3Q EUR n.a. n.a.Vienna Insurance Group 09/11/10 exp. 3Q EUR 94 n.a.
INN
ZFS 04/11/10 exp. 3Q USD 1,014 7.29
Source: Bloomberg, UniCredit Research
REPORTS PER WEEK
1 26
34
54
43
60
83
7
0 1 00
10
20
30
40
50
60
70
01-O
ct
08-O
ct
15-O
ct
22-O
ct
29-O
ct
05-N
ov
12-N
ov
19-N
ov
26-N
ov
03-D
ec
10-D
ec
17-D
ec
24-D
ec
No
of e
xpec
ted
repo
rts
Source: Bloomberg, UniCredit Research
NUMBER OF COMPANY REPORTS
WeekSector
01/10
08/10
15/10
22/10
29/10
05/11
12/11
19/11
26/11
03/12
10/12
17/12
24/12
ATO 4 2 BAS 2 CHE 2 3 2 2 CNS 3 2 1FOB 1 1 3 1 1 HCA 6 3 IGS 1 5 5 6 5 1 1 1MDI 1 1 OIG 1 1 3 3 2 PHG 2 2 1 1 RET 1 1 1 1 1 TAL 2 1TEL 2 7 3 5 1 THE 1 3 UTS 2 5 5 12 1 2 BAK 1 1 9 13 8 17 3 5FSV 2 1 1 3 1 INN 3 4 8 Overall 1 2 6 34 54 43 60 8 3 7 1
Source: Bloomberg, UniCredit Research
5 October 2010
5 October 2010 Credit Research
Euro Credit Pilot
UniCredit Research page 23 See last pages for disclaimer.
Fundamental Credit Views
Telecommunications (Marketweight) Sector key figures Sector Wrap-Up Weight in iBoxx NFI: Current ASW spread: change mom/YTD: Euro STOXX TEL YTD:
16.8% 115.8bp +0.6/+23.7 -1.1%
Sector drivers: Currently, fundamentals are still taking a backseat in the assessment of telecom credits and the underlying sovereign debt crisis and macroeconomic environment are still the main drivers of spreads. For 4Q10, we mainly assume three possible scenarios: 1) The sovereign debt crisis appears more manageable and the related negative sentiment calms down. In this case, the telecom average sector bond spread should see a stronger recovery than the NFI average bond spread. 2) The sovereign debt crisis and austerity measures weigh more strongly on the economic development than expected and we face a so-called "double-dip" scenario. Then, telecom bonds are likely to benefit in general from their "safe-haven" status and low cyclicality compared to other sectors. 3) The situation remains basically unchanged. In this case, telecom bond spreads, in particular those of OTE, PT, TEF and TI will continue to stabilize at currently exaggerated levels. The 2Q10 earnings season indicated a positive development for telecom incumbents in 2H10. The vast majority of telecom operators reported better-than-expected results for 2Q10, showing stronger-than-expected top-line growth driven by the macroeconomic recovery, while all incumbents continue their cost reduction programs, i.e., EBITDA often also exceeded consensus estimates as the EBITDA margin remained stable or even improved or declined less than expected. With regard to shareholder remuneration, the trend towards longer-term direction continues (already announced by Telefonica, Vodafone and DT), i.e., France Telecom proposed a minimum dividend of EUR 1.40 p.a., as well as the trend to share buybacks (DT started its share buyback program and Telenor announced a new share buyback program; FT did not rule it out). On the M&A front, clearly the acquisition of PT's stake in Brasilcel/Vivo by Telefonica dominated the headlines. More recently, Vivendi clearly stated its willingness to acquire minorities in Canal+ France and SFR. However, so far, M&A was definitely not a major spread driver in 2010. The main spread driver currently remains the sovereign debt development and the macro environment, while in the last month the recovery in sovereign spreads benefited the telecom sector average spread. It currently seems that our scenario 1, which drove spreads in August and September, might take a backseat and scenario 2 might drive telecom spreads in October. Last month's recap: In September, the iBoxx average Telecoms sector spread tightened by around 4bp to 119bp, while the NFI spread also tightened by 4bp to 102bp. Hence, the telecom sector spread performed in line with the iBoxx NFI average spread. In absence of company-related newsflow during September, spreads were largely driven by the positive macroeconomic newsflow. High-beta bonds (OTE, TITIM, BRITEL) outperformed low-beta bonds in the Telecoms sector. Moreover, PORTEL and TELEFO bonds underperformed, driven by further sovereign concerns.
Current Ratings (Moody's/S&P/Fitch)
Credit Profile
Name (Ticker): Recommendation Weight in iBoxxComment Telecommunications sector
A2s/A-s/A-s Stable America Movil (AMXLMM): No recommendation (event-driven coverage) 1.6%In June, America Movil made its debut in the EUR and GBP bond markets, as it issued EUR 1.0bn (7Y), EUR 750mn (12Y) and GBP 650mn (20Y) notes. America Movil is Mexico's largest wireless operator with a market share of approximately 71%. In addition, it is positioned as a leading regional mobile telecom service provider in Latin America with over 206 million wireless subscribers. Globally, it ranks No. 8 in the global telecom universe in terms of revenues and EBITDA. It generated a strong operating cash flow of over USD 10bn in the last twelve months ending 31 March 2010, stand-alone, and should have a low leverage of 1.3x adjusted debt to EBITDA for year-end 2010 (expected by Moody's pro forma for the recent acquisitions of Telmex and Telint). The integration of recent acquisitions of Telmex and Telint (reason for the new issues: refinancing these acquisitions) will help America Movil to return its targeted leverage of adjusted debt-to-EBITDA back to its guidance of below 1x. The new issues were well received in the Eurobond market as a good diversification in the single A-rated telecom segment.
A2n/Awn/As Stable AT&T (T): Marketweight 2.4%AT&T reported better-than-expected 2Q10 results and revised its outlook up. Sales increased by 0.6% yoy to USD 30.81bn versus USD 30.53bn in 1Q10. The group EBITDA rose yoy by 5.6% and 1.3% qoq to USD 10.95bn. In 2Q10, FOCF generation fell to USD 3.7bn (USD 7.6bn in 1H10) from USD 3.8bn in 2Q09, mainly due to higher working capital-related cash outflows, while FFO exceeded last year's 2Q by USD 1.5bn, partially offset by yoy higher capex of USD 0.8mn. The company used USD 2.5bn of FOCF for dividend payments, while the remainder was not sufficient to offset cash outflows for the acquisition of Alltel assets from Verizon for USD 2.35bn. Net debt (derived from the reported balance sheet) increased yoy from USD 66.8bn to USD 68.6bn, according to our calculations. AT&T's reported annualized net debt-to-EBITDA (LTM) declined qoq to 1.5x from 1.6x (YE09: 1.7x). AT&T has updated its earnings outlook for full-year 2010 due to improved revenue trends and strong execution: Previously, the company expected stable-to-improved earnings per share, stable-to-improved consolidated operating income margins and free cash flow in line with 2008 results. The company now expects strong earnings per share growth for full-year 2010, improved consolidated operating income margins and FOCF above 2008 levels (USD 13.3bn). Capex is expected to rise to USD 18-19bn due to higher wireless capacity investments (USD 17.3bn in 2009). On 28 July 2010, S&P placed its single-A rating on AT&T on creditwatch with negative implications, as the company may not be able to achieve financial metrics (fully adjusted net debt to EBITDA ratio below 2.0x, i.e., reported net debt to EBITDA slightly above 1.0x) fully supportive of the current rating within a reasonable timeframe. The rating action followed a statement of the company during its 2Q10 earnings call that in the future it will consider using excess FCF for purposes other than debt reduction, including possibly for share repurchases. However, current spread levels of its euro-denominated bonds discount for these risks as well as for a potential downgrade to a low single A rating. (3Q10 results: 21 October)
5 October 2010
5 October 2010 Credit Research
Euro Credit Pilot
UniCredit Research page 24 See last pages for disclaimer.
Current Ratings (Moody's/S&P/Fitch)
Credit Profile
Name (Ticker): Recommendation Weight in iBoxxComment Telecommunications sector
A1s/A+s/--- Stable Belgacom (BELGBB): Underweight 1.6%Belgacom released solid 2Q and 1H10 results. In 1H10, revenues increased by 10.3% (2Q10: 10.7%) to EUR 3,305mn, excluding non-recurring revenue. The growth was driven by the full-consolidation of BICS, including MTN ICS, and a solid underlying business trend (organic revenue growth 0.3%). Group EBITDA in 1H10 rose by 0.5% yoy (organic growth: -2.1%) to EUR 999mn, with the EBITDA margin remaining stable at 30.2% as a result of a strong focus on overall cost efficiencies, including initiatives enhancing product profitability while maintaining strict control of expenses. FCF in 1H10 increased to EUR 598mn compared to EUR 362mn for 1H09, positively influenced by timing differences related to working capital and one-off items. The reported net debt to EBITDA ratio was up to approximately 0.8x from 0.7x in the previous quarter, mainly driven by dividend payments. Based on Belgacom's solid results so far, the company upgraded its revenue outlook for 2010: Group revenues are expected to increase now by 9%-10% versus the previously announced 8%-9% due to the consolidation of BICS as of 1 January 2010. EBITDA should be approximately 30% versus the previous 30%-31% and the capex-to-revenue ratio should be stable at 10% yoy. We keep our underweight recommendation for the name, despite the fact that the company is more than 50% owned by the Belgian government. Belgacom bond spreads continue to trade relatively tight compared to peers and we regard the downside risk, e.g. from M&A activities and shareholder remuneration, as higher than upside potential. (3Q10 results: 29 October)
Baa2n/BBB-s/BBBs Stable BT-Group (BRITEL): Marketweight 3.2%BT Group released slightly better-than-expected 1Q10/11 results and confirmed its outlook for FY10/11. Revenues decreased by 4% yoy to GBP 5,006mn and adjusted EBITDA post leaver costs rose by 6% yoy to GBP 1,399mn, as the Global Services EBITDA rose to GBP 130mn from GBP 62mn in 2Q09. Excluding the Global Services segment, EBITDA was flattish yoy, mainly thanks to cost reduction measures. The adjusted EBITDA margin was 27.9% compared to 28.2% in 4Q09/10 or 25.3% in 1Q09/10. FCF strongly increased yoy to GBP 415mn in 1Q10/11 from minus GBP 122mn, mainly due to lower W/C-related cash outflows (GBP 449mn), which benefited from the receipt of a major customer contract. In addition, FCF benefited from a capex decline (GBP 71mn) and improved profitability. We are still skeptical about the sustainability of FCF improvements, but admit that the company's FCF target for FY10/11 is achievable. Despite the usually weak first quarter FCF, reported net debt was reduced from GBP 9.3bn to GBP 8.9bn. According to our calculations, adjusted net debt to adjusted EBITDA declined to 2.9x qoq from 3.0x, which should be in line with a BBB- rating at S&P. The net pension deficit remained qoq stable at GBP 5.7bn. During the conference call, management was unable to provide additional details regarding the ongoing discussions with the pension regulator about the crown guarantee (not expected to have an impact on pension valuations nor payments) or the potential change in indexation (may lead to a reduction in pension liabilities). Further significant topics during the conference call included discussions with the UK government regarding potential measures to reduce public spending. BT stated that only 10% of its revenues are government-related and that these are mainly in the Global Services segment. Another point of concern was increasing competition from Sky and Virgin, signaled by their rising marketing spending. We keep our marketweight recommendation for BRITEL bonds based on the improving operating performance of the company. (2Q FY10/11 results: 11 November)
Baa1s/BBB+s/BBB+s Stable Deutsche Telekom (DT): Marketweight 13.8%Deutsche Telekom (DT) released strong 2Q10 results, which were slightly above consensus estimates, while net debt increased quite strongly qoq. The company confirmed its outlook for the full-year 2010. In 2Q10, net revenues decreased by 4.4% yoy to EUR 15.5bn. Adjusted EBITDA decreased yoy by 4.7% to EUR 5.01bn. The decline in international revenues and EBITDA was significantly impacted by the deconsolidation of T-Mobile UK. The company posted an adjusted net profit of EUR 814mn versus EUR 756mn in 2Q09. In 2Q10, FCF increased 6.1% to EUR 1.5bn and FCF was EUR 2.9bn in 1H10, indicating that the full-year target of EUR 6.2bn is achievable. Net debt increased strongly qoq from EUR 40.4bn to EUR 46.3 at the end of 2Q10 due to dividend payments of EUR 3.8bn, effects from corporate transactions totaling EUR 1.6bn, the acquisition of STRATO (EUR 0.3bn), and payments of EUR 1.3bn for spectrum purchases and exchange rate effects of EUR 1.4bn. The reported net debt to EBITDA (LTM) ratio increased to 2.26x from 2.06x at the end of 1Q10. DT reiterated its outlook for full-year 2010, expecting an EBITDA (of EUR 19.5-19.6bn) and FCF of EUR 6.2bn including the deconsolidation of T-Mobile UK as of 1 April 2010. The 2Q10 results announcement contained a couple of positive operating developments, while the qoq net debt increase was more pronounced than expected. We assume that DT's net debt to EBITDA ratio will moderately increase to 2.2x in 2010 and therefore remains in the middle of DT's target range of 2.0-2.5x. Fully adjusted for off-balance liabilities, the adjusted leverage is on average roughly one time higher at around 3.2x. Hence, we assume that the company's financial flexibility under current ratings is limited and makes its rating more sensitive to additional unexpected negative performance changes. However, given the decent operating performance and the fact that S&P recently affirmed DT's BBB+ rating with a stable outlook, we expect a stable rating development going forward. We keep our marketweight recommendation for DT bonds whose main strengths in the current market environment are the underlying sovereign background, its known shareholder remuneration policy and the fact that according to management, no major M&A activities are planned. (3Q10 results: 4 November)
A3s/A-s/A-s Stable France Telecom (FRTEL): Marketweight 14.3%France Telecom (FT) released 1H10 figures roughly in line with expectations and confirmed its outlook for 2010. Consolidated revenues fell by 1.2% to EUR 22,144mn on a historical basis, and 2.2% yoy on a comparable basis, mainly caused by regulatory measures. EBITDA dropped 3.7% on a historical basis to EUR 7,745mn, down 4.6% yoy on a comparable basis. The EBITDA margin was 35.0% in 1H10, a yoy 0.8pp decline on a comparable and 0.9% on an historical basis, largely due to regulatory measures and a new telecommunications tax. Capex declined 6.6%/7.5% yoy on a historical/comparable basis, reflecting poor weather conditions (causing capex deferrals) in Europe as well as a high level of capex in 4Q09. The capex-to-sales ratio was still low with 9.5% compared with the very low 8.0% in 1Q10. The net debt to EBITDA ratio was 1.86x at 30 June 2010, in line with the objective of a net debt to EBITDA ratio of 2.0x in the medium term to preserve the Group's independence and flexibility. France Telecom will propose a dividend of EUR 1.40 per share for the fiscal years 2010, 2011 and 2012, subject to a vote in favor of these payments by shareholders at the relevant AGM. This shareholder remuneration policy is in line with the company's FCF generation and its M&A policy. FT may spend as much as EUR 7bn on acquisitions in Africa & Middle East over the next three to five years, as part of a strategy to double revenues from emerging markets. In this context, FT announced that it had agreed on a strategic partnership to acquire an initial stake of 40% in Médi Télécom, Morocco's second largest telecoms operator, for EUR 640mn. An additional 9% stake will be acquired by 1 January 2015, which would lead to full consolidation in France Telecom accounts. We keep our marketweight recommendation for FRTEL bonds, as its bonds trade relatively tight compared to those of its peers, but in line with its low risk credit profile and sovereign risk. (3Q10 results: 28 October)
5 October 2010
5 October 2010 Credit Research
Euro Credit Pilot
UniCredit Research page 25 See last pages for disclaimer.
Current Ratings (Moody's/S&P/Fitch)
Credit Profile
Name (Ticker): Recommendation Weight in iBoxxComment Telecommunications sector
Baa2s/BBB+s/BBB+s Stable KPN NV (KPN): Marketweight 8.5%KPN reported solid 2Q10 results as revenues met consensus expectations, but EBITDA growth exceeded them. In 2Q10, revenues (and other income) decreased by 1.7% yoy to EUR 3,354mn. KPN's EBITDA increased yoy by 4.8% to EUR 1,386mn. The EBITDA margin strongly increased from 38.8% in 2Q09 to 41.3% in 2Q10 (40.4% in 1Q10). In 2Q10, FCF amounted to EUR 707mn, slightly down yoy from EUR 739mn, driven by a one-off tax receipt of EUR ~60mn in 2Q09. The reported net debt to EBITDA increased temporarily qoq from 2.2x to 2.3x at the end of 2Q10 due to the EUR 733mn final 2009 dividend payment, the accelerated share buyback program (EUR 431mn) and the acquisition of licenses in Germany (EUR 240mn). KPN confirmed its outlook for revenues, EBITDA and FCF for 2010. Despite an 1.8% organic revenue decline YTD, KPN is confident that it can achieve a flat yoy top-line result, as growth in Germany already started to revive. EBITDA could cope well with the lower top-line and actually benefited from cost reduction and efficiency measures, despite adverse regulatory measures such as declining mobile termination rates. KPN stated that the German spectrum auction was positive for KPN and allows for mobile data as an additional area of growth. KPN will continue to return excess FCF to shareholders, leaving little upside for debtholders to benefit from the solid operating performance of the company. Rating-wise, S&P stated in the past that the company has limited headroom for operating underperformance, increased shareholder returns, or more than modest incremental acquisitions or expenditure on spectrum. The rating agency might lower the ratings if KPN were to remain at the upper level of its financial policy, with unadjusted net debt to EBITDA of 2.5x (about 3.2x fully adjusted). However, as KPN currently is at 2.3x and as the company called this increase temporary (given FCF generation and debt reduction in 2H10), we expect that KPN's rating outlook should remain stable. We currently like KPN's underlying sovereign risk as well as its low affinity to acquisitions in the current market environment combined with solid operating performance, which is offset by its shareholder remuneration policy. (3Q10 results: 26 October)
Aa1n/AAs/NR Stable NTT (NTT): No recommendation (event-driven coverage) 0.0%Nippon Telegraph and Telephone Corporation (NTT) released better-than-expected 1Q FY10/11 results, but confirmed its full-year (FY10/11) forecast. In 1Q FY10/11, operating revenues decreased yoy by 0.2% to JPY 2,498.9bn and operating income increased by 4.3% yoy to JPY 339.7bn, as the negative impact from the traditional voice revenue decline was offset by cost reduction measures. The company confirmed its relatively stable forecast for FY10/11: operating revenues of JPY 10,160mn (-0.2% yoy), operating income of JPY 1,165mn (+4.2% yoy) and net income of JPY 500mn (+1.6% yoy). Moody's negative outlook reflects concerns regarding sustainable growth in revenue and earnings in the current economic environment and that the improvement to its key financial metrics may be delayed. Japan's telecom market is mature, and growth driven by the next generation network services might slow down. In addition, the penetration rate in the mobile telecom market is already high and the growth rate is slowing. Despite the increase in its subscriber base, NTT DoCoMo's market share is gradually declining. As a result, NTT's revenue may continue to decline, and earnings could be pressured further, if it fails to lower its operating costs. NTT should maintain or improve its financial metrics over the medium term via controlling its operating costs and capex to keep its ratings stable. Moody's and S&P regard the NTT group as a government-related entity, as the Japanese government (Aa2s/AAn/AA-s) holds 33.71% of NTT's shares as of YE09. NTT's euro-denominated bond spreads are impacted by the Japanese sovereign CDS and government bond spread development. (2Q FY10/11 results: 9 November)
Baa2s/BBB-s/BBBn Stable OTE (OTE): Overweight 2.9%OTE reported weaker-than-expected 2Q10 results driven by a tough economic and challenging market environment in which the company operates. The company indicated in its outlook statement that this situation will not change in FY10. In 2Q10, group revenues declined yoy by 8.3% to EUR 1,358.6mn. Pro-forma OIBDA (~EBITDA) decreased yoy by 13.0% to EUR 458.8mn in 2Q10, reflecting an OIBDA margin of 33.8% (1Q10: 36.6%). FOCF declined to minus EUR 28.7mn in 2Q10 from EUR 198.9mn, mainly due to special tax contributions and higher payments for the early retirement programs. Net debt was apparently moderately increased qoq to EUR 4,614.1mn. Taking reported net debt and pro-forma EBITDA LTM into account, the reported net debt to EBITDA ratio was at 2.2x (fully adjusted at around 2.8x). OTE's management intends to actively pursue initiatives aimed at a minimization of revenue erosion, cost reduction and cash preservation, but the company's outlook indicates that no improvement (from the 2Q10 level) can be expected in 2010. For the time being, we are confident with respect to OTE and its partnership with Deutsche Telekom, with OTE likely to receive refinancing support from DT. Moreover, we believe that the Greek government is likely to sell at least 10% of its remaining 20% stake in OTE in the foreseeable future, in an effort to reduce sovereign debt. Nevertheless, further rating pressure on OTE becomes increasingly likely the more OTE's operating performance suffers from the weak macroeconomic environment and the more rating pressure weighs on the Greek sovereign. We keep our overweight recommendation for short-dated OTE bonds. We are still confident that DT will continue to support OTE, even with intercompany loans. (3Q10 results: 4 November)
Baa2s/BBBs/BBBs Weakening Portugal Telecom (PORTEL): Underweight 3.5%Portugal Telecom released 2Q10 results above expectations. PT's Brazilian operations (Vivo – 50-50 JV with Telefonica) were the main "growth" driver in EUR-terms, offsetting weaker results from its domestic mobile operations. Net debt increased to EUR 6,092.8mn at the end of 2Q10 from EUR 5,659.8mn at the end of 1Q10, primarily due to expected dividend payments. The net debt to EBITDA LTM (company definition) increased qoq to 2.3x from 2.2x (fully adjusted at around 3.0x, according to our calculations). Given that PT's Brazilian operations are currently the main growth driver for PT, and given that PT (on 28 July) agreed to sell its stake in Vivo/Brasilcel for EUR 7.5bn to Telefonica, the company's development going forward contains an element of uncertainty. PT announced that it entered into a memorandum of understanding (MOU) which sets the principles for the development of a strategic partnership between PT and the Brazilian Oi Group. Through this MoU, PT expects to achieve a total direct and indirect economic ownership of 22.38% in Oi Group with a maximum estimated investment of BRL 8.4bn (EUR 3.7bn). Moreover, PT's reported net debt to EBITDA ratio will decline from 2.2x to 0.9x after both transactions (sale of Vivo/Brasilcel and acquisition of 22.38% in Oi Group). Moreover, given the partial consolidation of Oi Group, PT's revenues and EBITDA will only moderately decline, i.e., PT will largely keep its size. S&P, Fitch and Moody's already stated that they view both transactions as neutral or even credit positive and kept their ratings/outlooks unchanged (revised to stable from CW by S&P) for PT. We keep our underweight recommendation for PORTEL bonds. Despite the MoU to buy a stake in Oi Group, PT's dependence on its domestic operations increased significantly, in our view, with EBITDA continuing to decline by 5.2% in 1H10 (we note positively that the decline was not as strong with 3.7% in 2Q10). Moreover, the negative impact of the macroeconomic development from the underlying sovereign is another reason for concern. In addition, we see some execution risk with respect to the Oi transaction and the future use of the disposal proceeds. (3Q10 results: 16 November)
5 October 2010
5 October 2010 Credit Research
Euro Credit Pilot
UniCredit Research page 26 See last pages for disclaimer.
Current Ratings (Moody's/S&P/Fitch)
Credit Profile
Name (Ticker): Recommendation Weight in iBoxxComment Telecommunications sector
Aa2s/A+s/A+s Stable Singapore Telecom (SINTEL): No recommendation (event-driven coverage) 1.1%Singapore Telecommunications Limited (SingTel) reported weaker-than-expected net profit for 1Q10/11 results, as earnings contributions from associated regional mobile companies declined strongly (-14.8%) yoy. In 1Q10/11, the group's operating revenues increased by 11.5% yoy and declined 4.1% qoq to SGD 4,289mn. The operational EBITDA rose by 11.3% yoy and declined 6.0% qoq to SGD 1,255mn. The operational EBITDA margin remained stable yoy at 29.3%, but declined qoq from 29.9%. The Group EBITDA rose only by 1.2% yoy and declined 5.5% qoq to SGD 1,797mn. Net debt decreased qoq from SGD 6.3bn to SGD 5.6bn, as FCF increased yoy by 36% to SGD 776mn. The main credit protection ratios showed still healthy figures: EBITDA to net interest coverage of 21x and net debt to EBITDA of 0.8x (adjusted by Moody's: 1.2x). As SingTel continues to invest abroad, and receives an increasing contribution of dividends and earnings from overseas, it can no longer be viewed solely in the context of Singapore and Australia, according to Moody's. To incorporate this, Moody's also considers SingTel's metrics on a pro-rata consolidated basis, consolidating SingTel's associates proportionally for the company's ownership. As Bharti's acquisition of Zain assets is largely debt-financed, Moody's expects SingTel's proportionally consolidated leverage, pro-forma for the transaction, to rise closer to 2.0x debt/EBITDA. While this is high for the rating level, Moody's gains comfort from SingTel's strong market positions in Singapore and Australia, both of which provide a high degree of stability to underlying earnings. However, SingTel's CEO stated recently that he will continue to look for growth opportunities (in emerging markets), which might lead to a rating action by Moody's, which rates SingTel two notches better than S&P or Fitch. In early September, SingTel's wholly-owned subsidiary, SingTel Optus Pty Ltd (Optus) through its wholly-owned subsidiary, Optus Finance Pty Ltd issued a EUR 700mn bond due in 2020. The notes will only be guaranteed by Optus and certain of its subsidiaries, not by SingTel. Since 4Q09, SingTel issued an own EMTN program for its subsidiary Optus, to make Optus financing more independent. This might indicate that SingTel may want to reduce its stake in Optus to finance other growth opportunities. Moody's rates the Optus bond Aa3, one notch below SingTel bonds (Aa2). (2Q FY10/11 results: 11 November)
Baa2s/BBBs/BBBs Stable Telecom Italia (TITIM): Marketweight 9.3%Telecom Italia released 2Q10 results which showed modestly weaker-than-expected revenues, but a stronger-than-expected EBITDA. The company confirmed its full-year 2010 outlook. In 2Q10, organic revenues declined yoy by 5.3% (reported growth of 0.5%) to EUR 6,810mn and organic EBITDA remained almost flat yoy (-0.4% yoy, reported +3.5%) at EUR 2,907mn. The group organic EBITDA margin consequently improved by 2.1 pp. yoy to 42.8%. FCF defined as OCF minus capex was positive, with EUR 698mn in 2Q10 versus EUR 645mn in 2Q09. Given dividend payments of EUR 1.06bn, adjusted net debt increased from EUR 33.3bn at the end of 1Q10 to EUR 33.6bn at YE09, leading to a reportedly adjusted net debt to organic EBITDA ratio of 3.02x, up from 2.94x at the end of 1Q10. TI confirmed its 2010 outlook: Revenues (like-for-like) are expected to decline yoy by 2%-3%, while organic EBITDA should remain stable yoy. Capex should amount to EUR 4.3bn (EUR 4.5bn in FY09) and adj. net debt should be reduced to around EUR 32bn (FCF est. after dividends EUR >1.0bn). We keep our marketweight recommendation for TITIM bonds. We view TI's profitability improvements as credit positive, while its KPIs do not have a clear positive direction yet and reflect some uncertainty going forward. Moreover, some uncertainty stems from TI's statements regarding its indirect stake in Telecom Argentina (via Sofora). According to TI, the company has closed an agreement with W de Argentina-Inversiones SL Group (the Argentine Werthein family) to reinforce the existing partnership and end all disputes between the partners. The agreement reinforces the key principles of the partnership and Telecom Italia's role in Argentina. The renewed collaboration with W Group will enable Telecom Italia Group to explore all various options for its future presence in the country. Hence, this could trigger further investments instead of delivering disposal proceeds, as expected in the past. (3Q10 results: 4 November)
Baa1s/A-n/A-s Stable Telefonica (TELEFO): Overweight 13.5%On 29 July, Telefonica released better-than-expected 2Q10 results. Consolidated revenues increased by 9.0% yoy in reported terms to EUR 15,120mn (consensus estimate of EUR 14.53bn). Consolidated OIBDA rose by 4.0% in reported terms to EUR 5,791mn (consensus estimate EUR 5.52bn). The reported net debt to OIBDA ratio remained at 2.2x versus end-1Q10. The ratio of net debt (plus commitments) to OIBDA also remained stable qoq at 2.3x, in the middle of the company's target range (2x-2.5x). On 28 July, Telefonica announced that it reached an agreement with Portugal Telecom to purchase 50% of Brasilcel (which owns shares representing approximately 60% of the capital stock of Vivo) held by PT for EUR 7.5bn. In addition, Telefonica will make a public tender offer for the ordinary shares of Vivo that are not held by Brasilcel, and which represent approximately 3.8% of Vivo’s ordinary equity, for an estimated transaction volume of EUR 800mn. Altogether, the transaction represents an upfront increase in debt for Telefonica of around EUR 9bn. As Moody's indicated in the past, it has kept its Baa1 rating for Telefonica, while it changed the positive rating outlook to stable. Fitch confirmed its A- rating for Telefonica with a stable outlook. S&P affirmed its A- rating with a negative outlook, giving Telefonica time to reduce the expected fully adjusted leverage of 3.0x pro forma for the transaction to 2.5x by YE11. We keep our overweight recommendation for Telefonica bonds and we continue to recommend selling 5Y protection on the name. We continue to believe that Telefonica bonds and CDS spreads are trading too wide for the company's rating (development), especially after S&P's affirmation of the A- rating, and too wide compared to its peers. The major reason for TELEFO bonds being relatively cheap, in our opinion, is the underlying sovereign risk, while the above-mentioned transaction reduces the dependence on it. Moreover, headline risk regarding the sovereign debt crisis is currently diminishing. On 23 September, Brazil’s telecommunications agency Anatel approved the sale of PT's stake in Vivo/Brasilcel to Telefonica. (3Q10 results: 12 November)
A3s/BBBs/--- Weakening Telekom Austria (TKA): Underweight 1.9%Telekom Austria (TA) released weaker-than-expected 2Q10 results. Net income was EUR 68.7mn and below consensus expectations of EUR 74.8mn, and EBITDA of EUR 403.8mn was below consensus expectations of EUR 423mn. Revenues in 2Q10 (1H10) fell by 1.9% (-3.9%) yoy, EBITDA declined by 10.3% (-8.3%) to EUR 403.8mn (EUR 829.7mn) yoy. Net debt declined to EUR 3,590.3mn from EUR 3,614.8mn at FYE09 and net debt/EBITDA increased slightly to 2.1x vs. 2.0x in the same period. In its 2010 guidance, the company now reduced its capex budget by EUR 50mn and said that, given the macro environment in 2H10, it will not undertake any share buybacks in 2010. TA's outlook for 2H10 is impacted by weak economies, the unabated fixed-to-mobile substitution and continued price pressure in its major markets, regulatory-induced lower roaming prices as well as mobile termination rates; taxes levied on mobile communication services in Croatia and the Republic of Serbia pose an additional burden. For the financial year 2010, revenues are expected to amount to approximately EUR 4.7bn. Stringent cost control will mitigate the impact from lower revenues and is anticipated to result in an EBITDA of EUR 1.60-1.65bn. OCF remains the primary focus of management and is expected to amount to at least EUR 800mn. TA reiterated its intention to distribute the "higher" of 65% of the annual net income or at least EUR 0.75 per share as dividend until 2012. The Management Board remains committed to its capital allocation policy, including returning excess cash to shareholders via share buybacks within the 1.8x-2.0x net debt/EBITDA target balance sheet structure, provided there is stability in its main foreign currencies and

5 October 2010
5 October 2010 Credit Research
Euro Credit Pilot
UniCredit Research page 27 See last pages for disclaimer.
Current Ratings (Moody's/S&P/Fitch)
Credit Profile
Name (Ticker): Recommendation Weight in iBoxxComment Telecommunications sector operations. We keep our underweight recommendation on TA bonds in our sector portfolio due to circumstances the company has no control of, such as sentiment towards a company with significant activities in Eastern Europe, regulatory measures and costs from the merger of domestic operations. (3Q10 results: 10 November)
A3s/A-n/BBB+s Stable Telenor (TELNO): Overweight 2.2%Telenor released better-than-expected 2Q10 results. In 2Q10, Telenor’s revenues increased by 2.7% yoy to NOK 25.2bn on a reported basis (organic growth: 4.7%/4.2% incl./excl. India). Growth was driven by strong organic subscriber growth in Asia, where revenue growth benefited from an improving economic environment, and strong demand in mobile data in the Nordics (similar to TeliaSonera), despite negative currency effects (strengthening of the NOK). EBITDA before other income and expenses decreased by 11.0% yoy to NOK 7.0bn, while organic growth was -9.3%/+4.0% incl./excl. India. The EBITDA (before other income and expenses) margin declined yoy from 32.2% to 27.9% (2009: 31.87%), impacted by the start of its operations in India (high SACs), which contributed a negative EBITDA of NOK 1.13bn in 2Q10. Telenor lifted its outlook for 2010, which is still impacted (as expected) by investments in India. Based on the current group structure (including Uninor in India and excluding Kyivstar), using currency rates as of 30 June 2010, Telenor now expects 3%-5% revenue growth, compared to low single-digit organic revenue growth previously. The EBITDA margin before other income and expenses is still expected to be around 28%, while capital expenditure as a proportion of revenues, excluding licenses and spectrum, is expected to be lower at 12%-13% versus 13%-14%. Telenor announced a share buyback program for approximately 3% of its shares for roughly NOK 4.4bn (at current share price) until YE10, while it reiterated its commitment to maintaining its reported net debt to EBITDA ratio below 1.6x (currently 0.9x). Please note that Telenor currently has negative rating outlooks at S&P and Fitch. However, the share buyback program would, in a worst-case scenario, increase Telenor's leverage only by 0.15x. Given that Telenor is clearly below its own leverage threshold (1.6x), which, according to S&P, for example, is likely to be translated into acceptable adjusted metrics for the rating, we do not expect negative rating pressure nor bond spread pressure. The solid operating performance of the company, especially the revived organic revenue growth, combined with a "controlled" expansion in India, supports our overweight recommendation. Moreover, Telenor should continue to benefit from its strong underlying sovereign risk. (3Q10 results: 27 October)
A3s/A-s/A-s Stable TeliaSonera (TLIASS): Overweight 3.2%TeliaSonera released solid 2Q10 results and revised up its outlook regarding revenue development. Net sales decreased 1.7% to SEK 26,964mn, while organic revenues increased by 3.3% yoy, as the actual results were negatively impacted by exchange rate fluctuations (-5.3%). EBITDA, excluding non-recurring items, increased by 1.9% yoy to SEK 9,214mn, while organic growth was 6.5%. The EBITDA margin improved yoy to 34.2% (34.4% in 1Q10) versus 33.0% in 2Q09 due to still improving profitability in Eurasia and efficiency measures mainly in Sweden and Finland. In 2Q10, free cash flow rose to SEK 3,930mn (versus SEK 3,106mn in 2Q09), mainly due to higher EBITDA and lower working capital. Reported net debt increased from SEK 44,973mn at the end of 1Q10 to SEK 52,387mn at the end of June 2010, following the payment of ordinary dividends of SEK 10.1bn in April. The reported net debt to EBITDA (LTM, excluding non-recurring items) ratio was up qoq to 1.42x versus 1.22x at the end of 1Q10 and moderately down yoy from 1.45x. Adjusted by off-balance sheet liabilities, the leverage is, according to our calculations, closer to 1.7x versus 1.5x at the end of 1Q10. Full-year growth in net sales in local currencies and excluding acquisitions for 2010 is expected to be in line with 1H10 (+2.9%), while currency fluctuations may have a material impact on reported figures in SEK. The EBITDA margin in 2010 is still expected to be slightly higher compared to 2009, excluding non-recurring items. The capex-to-sales ratio is now anticipated to be approximately 14%-15% in 2010 compared to slightly below 15% in 2010 (and 12.8% in 2009). Some uncertainty currently stems from recent elections in Sweden, where the former government (intending to reduce stake in TeliaSonera) won, but lost the majority and now needs to enter a coalition. We keep our overweight recommendation for TLIASS bonds, which offer attractive value given its fairly defensive nature, taking the company's solid operating performance combined with moderate underlying sovereign risk into consideration. (3Q10 results: 25 October)
A2n/An/An Weakening Telstra (TELECO): Marketweight 3.3%Telstra reported FY09/10 results roughly in line with expectations, but its 2011 outlook was basically a profit warning. In FY09/10, total revenues fell by 2.3% yoy to AUD 24.9bn and EBITDA declined yoy by 0.9% to AUD 10.85bn. However, after cutting capex by 24.5% yoy, FCF (before finance costs paid) increased by 42.6% yoy to AUD 6.2bn. Net debt declined yoy by AUD 1.7bn to AUD 13.9bn despite dividend payments of AUD 3.5bn (and AUD 1.0bn in finance costs). The net debt to EBITDA ratio was 1.28x and the interest cover was 10.8x, which is below/above the company's targeted financial parameters (1.7-2.1x; >7x). Telstra gave a depressed profit outlook for FY10/11, as it intends to invest in customer service/satisfaction, business processes and cost reduction measures and into new revenue streams. Both S&P and Moody's stated that the revised earnings outlook does not have an immediate impact on the company's ratings. The rating agencies acknowledged that strategies to strengthen Telstra's market shares/positions and to improve the medium-term cost positions are supportive for the company's credit profile in the longer term (if well executed), despite the near-term earnings impact. More importantly, the group's current financial profile, which includes unadjusted gross debt to EBITDA of about 1.5x, should provide adequate capacity to accommodate the expected lower 2011 earnings, while retaining a financial profile commensurate with the A long-term rating (according to S&P). However, both agencies pointed to the expectation (of a single A rating) that, despite the weaker earnings outlook, the group continues to fund capex and dividends from internally generated cash flows in 2011. In June, Telstra announced that it had signed a non-binding heads of agreement (HOA) with the NBN Co. regarding Telstra's participation in the proposed national broadband network. All three rating agencies (Fitch, S&P and Moody's) released statements saying that this would have no immediate rating impact, as it is too early to estimate the potential impact. Telstra's ratings are currently on negative outlook at all big three rating agencies, reflecting concerns over the terms of any structural separation of Telstra. We currently regard the near-term downside rating impact to be limited to one notch. As this is currently largely discounted in Telstra's credit spreads, we keep our marketweight recommendation for the name. (1H FY10/11 results: 12 February)
A3s/BBB+s/BBB+s Stable TPSA (TPSA): Overweight 0.7%TPSA released better-than-expected 2Q10 results, as the sales decline was less pronounced than expected due to a stronger-than-expected development of the mobile business. In 2Q10, group revenues decreased yoy only by 4.7% to PLN 3,987mn (-7.4% in 2Q09, -10.2% in 1Q10), indicating that the revenue development might have turned around, as the company had anticipated. EBITDA (before provisions) declined yoy by only 5.4% (-21.6% in 2Q09, -14.3% 1Q10) to PLN 1,472mn. The resilient EBITDA margin slightly improved qoq to 36.9% (37.2% in 2Q09, 36.7% in 1Q10), down "only" 1.7pp yoy (full-year 2008: 42.1% versus FY09: 37.9%). In 2Q10, net FCF declined yoy by 25.6% to PLN 711mn (1Q10: -26.3%), which is above the cash flow run rate of full-year guidance of PLN 2.0bn despite a significant capex increase (+30.7% yoy). Net debt decreased qoq from PLN 3,959mn (YE09: PLN 4,382mn) to PLN 2,999mn at the end
5 October 2010
5 October 2010 Credit Research
Euro Credit Pilot
UniCredit Research page 28 See last pages for disclaimer.
Current Ratings (Moody's/S&P/Fitch)
Credit Profile
Name (Ticker): Recommendation Weight in iBoxxComment Telecommunications sector of 2Q10. The reported net debt to adjusted EBITDA (LTM) ratio was down qoq to 0.5x from 0.7x. However, TP paid dividends on 1 July of PLN 2.0bn, which will bring this ratio back to 0.8x, which is still well below the company's own threshold of 1.5x. The company largely confirmed its outlook for full-year 2010, while it increased its net FCF target. In early September, TPSA announced that an arbitration tribunal in Vienna ruled TPSA liable to pay PLN 1,568mn (around EUR 396mn) regarding the dispute (concerns the determination of traffic volumes carried via the NSL fibre optical telecommunications system in Poland) with the Danish Polish Telecommunications Group. We keep our overweight recommendation for TPSA bonds, as we continue to view the bonds as a means to improve the carry of a combined FT/TPSA investment. We note that the above-mentioned announcement negatively impacts the credit profile of TPSA, while we do not expect rating actions, as the company's leverage remains within its own communicated threshold. (3Q10 results: 27 October)
A2s/An/As Stable Verizon Wireless (VZW): No recommendation (event-driven coverage) 1.2%Verizon Wireless (Cellco Partnership) is the largest wireless service operator in the US and is owned by Verizon Communications Inc. (55%) and Vodafone (45%). The ratings of Verizon Wireless are mainly based on those of its majority owner and operator parent Verizon Communications Inc. (A3s/An/As) and reflect the rapid growth of Verizon's wireless segment, strong business position and cash generation, sizable local exchange operations capable of producing substantial free cash flow, as well as a modest financial risk profile. In 2009, total revenues of Verizon Wireless increased on a pro-forma basis by 6.1% yoy to USD 62.1bn. The EBITDA margin (EBITDA/service revenues) remained almost stable yoy at 45.9% (2008 pro forma for the Alltel acquisition: 46%). 4Q09 pro-forma revenue growth was only 3.1% and the EBITDA (USD 23.9bn in FY09) margin was 45.0%, indicating some weakness. However, given the strong subscriber growth of 2.236mn in 4Q09, we assume that most of the operating weakness stemmed from the subscriber development, which recovered in 1Q10. Revenues increased by 4.4% to USD 15.8bn in 1Q10 and the EBITDA margin returned to 46% (the same level as in 1Q09). In FY09, Verizon Wireless had a FCF (net cash provided by operating minus investing activities) of USD 9.9bn, while net debt amounted to USD 21.0bn. Verizon Wireless had a leverage of <1.0x. Recently, Verizon Communications' CFO John Killian said that Verizon would be interested in purchasing Vodafone’s 45% stake in Verizon Wireless. According to the press, Verizon held talks with Vodafone, discussing options including a merger, buyout and dividend payout from Verizon Wireless. Moreover, Verizon indicated that dividend payments from Verizon can only be expected after the full repayment of debt at Verizon Wireless, which might be the case sometime in mid-2011, according to our estimates. Hence, we expect a relatively positive development of Verizon Wireless' creditworthiness going forward.
Baa2s/BBBs/BBBs Stable Vivendi (VIVFP): Underweight 5.0%Vivendi released solid 1H10 results with higher-than-expected profitability. The company raised its full-year EBITA guidance. Revenues increased by 6.1% yoy (4.8% at constant currencies) to EUR 13,982mn. EBITA rose by 11.9% yoy (10.8% at constant currencies) to EUR 3,243mn and adjusted net income was up yoy by 4.0% to EUR 1,526mn, exceeding the consensus estimate of EUR 1.49bn. Vivendi now expects to increase its EBITA, while previously it expected only a "slight increase". Net debt increased to EUR 11.5bn from EUR 9.6bn at YE09 due to dividend payments (EUR 2.6bn) and share buybacks at Activision Blizzard. Vivendi confirmed its priority to pay its shareholders a "very high" dividend (at least EUR 1.40 for FY10, which is basically flat compared to EUR 1.40 per share for FY09) and reiterated its ongoing commitment to deliver dividends with a distribution rate of at least 50% of adjusted net income. In the past, Vivendi continuously reiterated that it is committed to its ratings, which might explain its moderate dividend guidance. However, Vivendi also stated that it will not issue shares or reduce dividends for the purpose of financing acquisitions. During the conference call, Vivendi reiterated its priority to achieve full ownership of its France-based entities: a) Lagardere's 20% minority stake in Canal+ France (purchase price: max EUR 1.5bn); b) Vodafone's 44% stake in SFR (estimated EV of this stake EUR 10-11bn). Assuming that Vivendi's net debt amounts to EUR 7.0bn at YE10 (incl. disposal proceeds for its 20% stake in NBC Universal) and adding the potential further indebtedness of EUR 8bn and EUR 1.5bn for the above-mentioned stakes in SFR and Canal+ France, total net debt would amount to EUR 16.5bn. The group Bloomberg consensus EBITDA estimate for FY10 is EUR 8.1bn. Taking into account the partial ownership of Maroc Telecom (53%), Activision (57%) and GVT (83%), the net debt to EBITDA ratio would be at around 2.4x after these potential acquisitions (fully adjusted for off-balance liabilities: around 2.8x). In our opinion, such leverage would still be commensurate with a BBB rating, given the improved business profile after such transactions. We keep our underweight recommendation for Vivendi bonds given the company's stated M&A ambitions. Even though we assume that Vivendi is likely to keep its BBB rating in case of the above-mentioned transactions, the related headline risk, uncertainty and refinancing pressure should offer better entry levels into VIVFP bonds. (3Q10 results: 15 November)
Baa1s/A-n/A-s Stable Vodafone (VOD): Marketweight 6.8%Vodafone released its 1Q FY10/11 interim statement, with stronger-than-expected top-line growth, but confirmed its full-year outlook for FY10/11. Group revenues increased organically by 0.9% to GBP 11.3bn and were 1.3% above consensus, while group service revenues increased organically by 1.1% to GBP 10.6bn, 1.5% above consensus expectations. The company reported robust growth in emerging markets. In particular, revenue growth in India and Turkey was unexpectedly positive, while the performance in Greece, Portugal and Spain continued to be as weak as expected, plus a stronger-than-expected revenue decline in Italy. In 1Q FY10/11, free cash flow was broadly stable yoy at GBP 1,767mn (GBP 1.8bn in 1Q FY09/10) after adjusting for foreign exchange, while capex was GBP 0.2bn lower yoy. Net debt at 30 June 2010 was GBP 32.7bn, slightly lower than at 31 March 2010 (GBP 33.3bn), reflecting free cash flow generated during the period and favorable foreign exchange movements, which together broadly offset spectrum payments in the period. Vodafone confirmed its conservative outlook for FY10/11: adjusted operating profit of GBP 11.2-12.0bn and FCF in excess of GBP 6.5bn. Vodafone stated that it intends to accelerate its strategy to drive shareholder value and take advantage of the widespread adoption of data. Vodafone will provide a strategy update in autumn, but indicated already that it may dispose of minority stakes if such a transaction increases shareholder value. In line with this strategy, Vodafone recently announced an agreement to sell its entire 3.2% interest in China Mobile Limited (A1p/A+s/A+s). Vodafone expects the cash consideration to be approximately GBP 4.3bn before tax and transaction costs. It is intended that approximately 70% of the net proceeds will be returned to shareholders by way of a share buybacks, with the remainder used to reduce the Group’s net debt. If the above-mentioned split between shareholder remuneration and debt reduction is a role model for further minority stake disposals, we would regard this as credit positive. For the time being, we keep our marketweight recommendation for Vodafone, as the benefits of the above-mentioned transaction only mitigate investment-related cash outflows in 2010. (1H10/11 results: 9 November)
Stephan Haber (UniCredit Bank) +49 89 378-15192 [email protected]
5 October 2010
5 October 2010 Credit Research
Euro Credit Pilot
UniCredit Research page 29 See last pages for disclaimer.
Media (Marketweight) Sector key figures Sector Wrap-Up Weight in iBoxx NFI: Current ASW spread: change mom/YTD: Euro STOXX MDI YTD:
1.6% 113.9bp -3.1/-21.3 +3.0%
Sector drivers: Major spread drivers are the cyclical recovery in advertising expenditures, consumer confidence and corporate expenditures. We believe that in the current environment, shareholder-friendly financial policies are not on the agenda. However, the sector also consists of less cyclical businesses like Pearson, WPP (market research businesses of subsidiary Kantar and acquired TNS), Wolters Kluwer, Reed Elsevier, SES and Eutelsat. More cyclical are Bertelsmann and Publicis. Nevertheless, WPP, RTL and Publicis saw a stabilization in their markets in 1H and expect this to continue in 2H10. Last month's recap: In September, the iBoxx average media sector spread tightened by 7bp to 116bp, with longer maturities such as EUTELS 17 and BERTEL 15 outperforming, while PUBFP 12 and WPPLN 13 underperformed. In the absence of company news in the past few weeks, tightening of spread levels was driven by the economic recovery.
Current Ratings (Moody's/S&P/Fitch)
Credit Profile
Name (Ticker): Recommendation Weight in iBoxxComment Media sector
Baa2s/BBBs/BBB+s Improving Bertelsmann (BERTEL): Overweight 28.1%Bertelsmann released strong 1H10 results and raised its full-year outlook for FY10. In 1H10, group revenues increased yoy by 3.9% due to the upturn in Europe’s advertising markets (adjusted for the deconsolidation of Channel Five, which was sold). Operating EBIT from continued operations rose to EUR 755mn, reflecting a new record for the company on the back of the cost-cutting measures over the last 12-18 months. Group net profit improved to EUR 246mn from a net loss of EUR 333mn in 1H09. Return on sales increased yoy to 10.3% from 7.0%. Economic debt declined yoy from EUR 6,834mn to EUR 6,016mn (YE09: EUR 6,024mn) and the economic debt/EBITDA ratio dropped to 2.8x from 3.2x at YE09 (Bertelsmann's own target <3x). Management raised its outlook for FY10. It now expects a year-on-year increase in revenues and operating EBIT compared to a stable outlook for both previously. The company increased the predicted Group result corridor from between EUR 400-500mn to over EUR 500mn. Given that Bertelsmann provided quite a conservative guidance in the past and as management pointed out that demand visibility in the advertising markets for the important fourth quarter is still low, we believe that this guidance still leaves some room for further outperformance in 2H10. We continue to have an overweight recommendation on Bertelsmann bonds in the iBoxx media sector given the cyclical recovery momentum, the conservative financial policy and strong liquidity situation. Some uncertainty may stem from potential M&A activities, but for the time being we assume that acquisitions take a backseat given the fragile economic outlook and given the company's commitment to keeping current ratings or even to return to a high BBB rating by Moody's and S&P. (9M10 results: 11 November)
Baa3-s/BBB-p/-- Stable Eutelsat (EUTELS): Marketweight 8.2%Eutelsat is 31.36%-owned by Abertis (--/BBB+wn/A-s), which is currently subject to a takeover bid by its two main shareholders and CVC Capital Partners. In addition, Eutelsat owns 28% in Hispasat, which is also controlled by Abertis. Eutelsat's bond spreads tightened significantly after the widening fueled by the takeover bid by Abertis in previous months, and rumored M&A risks concerning Hispasat have vanished. Eutelsat's FY10/11 (ending 30 June 2011) guidance is for revenues of EUR >1,120mn (+7%), EBITDA EUR >875mn p.a., capex: EUR 450mn p.a., dividends: 50%-75% of net income. The order backlog at 1H10 was high at EUR 4.9bn. The company's net debt/EBITDA target is to remain below 3.5x (1H10: 2.93x). Given the company's good earnings visibility from its order book and its subsequently quite detailed guidance, we believe that it will stay in the required debt leverage range for its ratings. Positive newsflow came from S&P, as the agency revised its rating outlook to watch positive, giving credit to the company's strong operating performance (upgrade will be limited to one notch). We change our recommendation to marketweight from underweight as the bond trades at fair value, given our expectations that the M&A risk concerning Hispasat has vanished. (FY10 results: February 17)
Baa1s/BBB+s/--- Stable Pearson (PSON): Marketweight 0.0%1H10 sales increased by 9% to GBP 2,342mn (underlying 7%, at constant exchange rates) with rapid growth in digital services. Adjusted operating profit increased to GBP 178mn vs. GBP 84mn. FCF improved to GBP -165mn vs. GBP -284mn yoy and net debt declined to GBP 1,746mn vs. GBP 1,860mn yoy. The company said that all its businesses performed well, with 1H10 operating profits doubling at Education, the FT Group and Penguin with good underlying progress. In addition, the shift to services and developing economies is accelerating. In addition, the sale of its stake in Interactive Data is expected to close in the next few weeks and the reinvestment of the disposal proceeds is under way, with acquisitions of Melorio in vocational training and SEB's Sistemas in Brazil. Pearson upgraded its outlook and expects to achieve adjusted EPS of around 70p for FY10 (65.4p in FY09), even after the earnings impact from the sale of Interactive Data on the back of the resilient performance of its businesses. Nevertheless, Pearson stated that market conditions remain uncertain and growth is still expected to slow in 2H10 on tougher comparables. The company has no euro bonds outstanding. Its CDS trades quite close to the resilient Media sector names. (FY10 results: 28 February)
Baa2s/BBB+s/--- Weakening Publicis (PUBFP): Underweight 4.9%Publicis' 1H10 revenues increased by 14.9%, with organic growth of +5.3% and an operating margin of 14.5%. Regarding its 2010 outlook, Publicis said that for the second time ZenithOptimedia has upgraded its forecasts of growth in global advertising expenditure for 2010, most recently to growth of 3.5%. The company said that growth is driven by its digital activities in many emerging economies, with China in particular returning to high growth, a recovering US economy (although flat since May), and certain European countries (including France and the UK) holding up well. FCF (after dividends, before net acquisitions) improved to EUR -4mn vs. EUR -315mn yoy. Net debt, however, increased to EUR 621mn from EUR 430mn at FYE09 due to EUR 249mn in share buybacks. Nevertheless, we calculated an improvement in FFO/total debt (adj.) in LTM 1H10 of 29% compared to 26% at FYE09. Recently, Publicis announced the acquisition of 20:20 Media and 2020Social, which will add 140 people to the company's workforce. We do not see any rating pressure from this acquisition, as the company has comfortable headroom for bolt-on acquisitions. Both companies will be integrated in the PR and events network of MS&L Group. As the PUBFP 01/12 bond trades at very tight levels, we continue to see no value in the bond for relative value reasons and we keep our underweight recommendation. (1H10 results: 17 February)
5 October 2010
5 October 2010 Credit Research
Euro Credit Pilot
UniCredit Research page 30 See last pages for disclaimer.
Current Ratings (Moody's/S&P/Fitch)
Credit Profile
Name (Ticker): Recommendation Weight in iBoxxComment Media sector
Baa1n/BBB+n/A-n Stable Reed Elsevier (REEDLN): Marketweight 6.2%Reed's net debt/adjusted EBITDA (co. definition) improved to 2.7x in 1H10 vs. 2.9x at FYE09, and is now in line with the company's target of 2-3x. Regarding its 2010 outlook, the company said that declines in customer activity levels and budgets over the last two years are constraining the development of subscription revenues in its core professional markets. Advertising and promotion markets are stabilizing although Reed remains cautious. Reed expects to report a modest reduction yoy in adjusted operating margin due to a weak revenue environment and increased investment in legal markets. Reed will continue to benefit from the actions it is taking in its businesses, but any sustained recovery remains dependent on improving economic conditions and is expected to be gradual. (FY10 results: 17 February)
Baa2s/BBBs/BBBs Stable SES (SESGLX): Marketweight 18.0%For FY10, SES continues to expect a recurring infrastructure EBITDA margin >82% and services business profitability of 11%-15% (normalized for start-up activities). For FY10, the company estimates recurring revenue growth of around 5%. Net debt/EBITDA is targeted at <3.3x (1H10: 3.23x) in order to maintain "a solid investment grade rating". SES had a significant contract backlog of EUR 7.1bn at 1H10. We think that the visibility of SES' utility-like business model is comparatively good. A risk for bondholders could be that the company's financial policy might become more aggressive (e.g., increasing dividend payments, capex, bolt-on acquisitions), which could lead to a downgrade to low-BBB, which would still be in line with its investment grade rating target. We still like SES' cash flow visibility due to a long-term order book, group EBITDA margins of around 70% and the 17%-ownership (1/3 voting rights; 20.1% cap on any ownership) by the Luxembourgian government, effectively prohibiting unfriendly takeovers, as well as the company's explicit leverage and investment grade rating target. Although SES aims to increase its dividend payment, we like the resilience of its business model and the explicit debt leverage target and now see fair value in the bonds given the more defensive character of the business. (3Q10 results: 22 October)
Baa1s/BBB+s/BBB+n Stable Wolters Kluwer (WKLNA): Overweight 15.5%1H10 revenues declined by 1% on constant currencies, and was flat at organic growth levels. FCF after dividends improved to EUR 27mn vs. EUR 10mn yoy. The company confirmed its 2010 guidance for FCF (before dividends) of EUR ≥ 400mn (FY09: EUR 424mn), an ordinary EBITA margin of 20%-21% (FY09: 19.9%), ROIC ≥ 8%, and diluted ordinary EPS of EUR 1.41-1.45 (FY09: EUR 1.45). The company's net debt/EBITDA (company definition) was unchanged at 2.9x, while its target is deleveraging to 2.5x over the medium term. We like Wolters Kluwer's absolutely resilient business profile with high visibility, its conservative financial policy with a transparent deleveraging target and good liquidity headroom above its EUR 500mn policy minimum. We continue to have an overweight recommendation on the name. (FY10 results: 23 February)
Baa3s/BBBn/BBBs Weakening WPP (WPPLN): Marketweight 19.2%WPP reported solid 1H10 results, beating consensus in terms of sales and headline EBITDA (adjusted EBITDA). 1H10 sales were up by 2.7% yoy at constant FX rates to GBP 4.4bn, while headline EBITDA improved to GBP 561mn from GBP 456mn in 1H09. Reported billings amounted to GBP 20.3bn (+7.3% yoy). Within the various segments, Advertising & Media Investment Management and Branding & Identity and Healthcare showed the strongest operating performance, where operating profit was up by 23% yoy to GBP 206mn and 74% yoy to GBP 104mn. Funds from operations on a reported basis improved from GBP 482mn to GBP 573mn. However, due to seasonal working capital swings, operating cash flow was only GBP 17.4mn (1H09: GBP -14.5mn). As a result, net debt increased to GBP 3.0bn vs. GBP 2.64bn at FYE09. However, given the improved operating performance supported by the worldwide economic recovery, credit metrics should have improved during 1H10 compared to 1H09 ratios. We see good chances that WPP will be able to keep its investment grade rating. However, given the risk of a weakening US economy during the coming months and the relatively large exposure to that market, we have only a marketweight recommendation on its bonds, although we believe that the company is working to maintain its investment grade rating. (3Q10 trading statement: end of October; FY10 results: 4 March)
Kai Zirwes, (UniCredit Bank) +49 89 378-11962 [email protected] Stephan Haber (UniCredit Bank) +49 89 378-15192 [email protected]
5 October 2010
5 October 2010 Credit Research
Euro Credit Pilot
UniCredit Research page 31 See last pages for disclaimer.
Technology (Marketweight) Sector key figures Sector Wrap-Up Weight in iBoxx NFI: Current ASW spread: change mom/YTD: Euro STOXX THE YTD:
0.8% 94.0bp -7.9/-7.3 -0.1%
Sector drivers: A gradually improving economy should result in better demand patterns for technology companies in 2010. However, the biggest threat to IT spending in 2010 is the fragile economy, particularly in Europe, and the weak recovery in the US, as well as the resulting impact on consumer and business confidence. Therefore, we have a stable but cautious technology sector outlook for 2010. Most issuers so far provided no or just vague guidance for 2010, indicating that market visibility is low despite the economic recovery and the positive impact on the particular industry. Low market visibility often indicates that high earnings volatility might continue. However, the rising number of positive indicators for an economic recovery, although a bumpy one, caused spreads in the technology sector to tighten strongly. We keep our marketweight recommendation for the technology sector, as we currently expect a further stabilization of results in 2010. This should also be reflected in relatively stable ratings. Last month's recap: In September, the iBoxx Technology sector spread tightened by around 9bp to 99bp and the non-financials index tightened by 4bp to 102bp. The tightening in the sector was spread across all bonds in the index.
Current Ratings (Moody's/S&P/Fitch)
Credit Profile
Name (Ticker): Recommendation Weight in iBoxxComment Technology sector
Baa3s/---/BBB-s Stable ASML (ASML): Marketweight 11.9%ASML reported better-than-expected 2Q10 results and lifted its full-year outlook. Total net sales increased almost fourfold yoy and by 44.1% qoq to EUR 1,069mn (consensus of EUR 1,025mn), while the company had earlier indicated an increase to around EUR 1.0bn. The gross margin was 43% in 2Q10 (consensus of 42.1%), above the company's guidance of about 42%. Operating profit strongly improved yoy from EUR -124mn to EUR +292mn in 2Q10 (1Q10: EUR 137mn). The operating margin increased to 27.4% (consensus of 25.9%) versus 18.5% in 1Q10. In 2Q10, the company generated a positive FCF (OCF minus capex) of EUR 175mn despite negative W/C changes of EUR 114mn. The company's cash position increased qoq from EUR 1,087mn at the end of 1Q10 to EUR 1,189mn at the end of 2Q10. In 2Q10, the company had strong net bookings of EUR 1,179mn (consensus of 1,040mn; 1Q10: EUR 1,004mn) and anticipates booking levels of around EUR 1.3bn in 3Q10, confirming the upturn of the semiconductor industry. ASML expects 3Q10 net sales of around EUR 1.1bn and gross margin of about 43%. The company now anticipates full-year 2010 sales to grow 10%-15% above historical peak sales of EUR 3.8bn in 2007 (versus "sales above the 2007 peak of EUR 3.8bn). This level of sales is expected to continue into 2011, in absence of a major macroeconomic downturn. Therefore, ASML will support this strong structural demand by adding flexible manufacturing capacity and by increasing R&D investments. Given this outlook, especially the strongly improved operating margin and the positive FCF development despite negative W/C changes, we view the rating outlook as stable currently. We keep our marketweight recommendation for ASML bonds, given the uncertain macroeconomic environment and the potentially negative impact of a double-dip scenario on cyclical bonds such as ASML. (3Q10 results: 13 October)
Baa1s/BBB+s/BBB+s Stable Ericsson (LMETEL): Marketweight 22.6%Ericsson's released 2Q10 results were once again below market expectations, as sales were impacted by continued industry component shortages and supply chain bottlenecks. In 2Q10, net sales decreased by 8% yoy and increased qoq by 6% to SEK 48.0bn (consensus estimate SEK 50.8bn), while on a like-for-like basis they fell by 15% yoy. Thanks to cost reduction measures, the gross margin (excluding restructurings) improved to 39% versus 36% in 2Q09 and remained stable qoq. The Group EBITA margin before JVs and excluding restructurings improved yoy and qoq to 14% versus 13% in 2Q09 as well as in 1Q10. Operating income before JVs and excluding restructurings fell by 12% yoy and increased by 17% qoq to SEK 5.3bn. Net income including JVs was only modestly negatively affected by the company's JVs Sony Ericsson and ST-Ericsson. Adjusted cash flow was SEK -2.0bn in the quarter, down sequentially from SEK 3.0bn, mainly due to increased working capital as a result of tight component supply conditions, which led to late deliveries in the quarter. Cash, cash equivalents and short-term investments amounted to SEK 67.6bn. The net cash position decreased sequentially by SEK 12.7bn to SEK 25.8bn due to the payout of dividends of SEK 6.4bn, the acquisition of Nortel’s part of LG-Nortel and negative cash flow from operations as a result of increased working capital. For the time being, we keep our marketweight recommendation for LMETEL bonds, despite weaker-than-expected 2Q10 results, as the company's profitability remains strong and as the top-line weakness appears to be short-lived. (3Q10 results: 22 October)
A1s/A+s/A+s Stable IBM Corp (IBM): Marketweight 27.8%IBM released weaker-than-expected 2Q revenues. Revenues only increased by 2% yoy to USD 23.7bn and missed the consensus estimate of USD 24.2bn. In addition, Global Services orders declined yoy by 12%, as corporate customers delayed projects even during the economic recovery, which spurs uncertainty regarding a slowdown in the economy. Management cautioned against viewing the rollover of deals from one quarter to another as a sign of a pull-back in spending. Profitability continued to improve further although only modestly. The gross margin increased to 45.6% from 45.5%. Net income increased yoy by 9.1% to USD 3.4bn, despite the negative influence from a strengthening USD. IBM lifted its full-year profit forecast to at least USD 11.25 per share (missing analysts’ average estimate of USD 11.28) compared to a previously projected profit of at least USD 11.20. FCF generation was still strong with USD 3.0bn, but down USD 0.4bn yoy. The company's liquidity remained very healthy, with cash and marketable securities of USD 12.2bn. Last quarter, IBM's management pointed to its high degree of financial flexibility and noted that acquisitions and share buybacks in 2010 will be more similar to 2008 than to 2009. Until 2015, IBM wants to double operating earnings to USD 20 per share by focusing on more profitable software and services businesses. The company plans to make acquisitions of about USD 20bn until 2015 to achieve its growth targets. Recently, IBM also announced that its board has authorized an incremental USD 8bn to its remaining USD 2bn share buyback program and increased its common dividend by 18%. In our opinion, the shareholder remuneration policy is in line with the company's FCF generation and still leaves some room for acquisitions, while in addition a more aggressive M&A policy, as mentioned above, could have an impact on credit metrics. However, we assume that IBM will continue to wisely combine its shareholder remuneration activity with its M&A ambitions, as demonstrated in the past. Hence, we think that IBM's rating will continue to be well positioned in its rating category. We keep our marketweight recommendation for euro-denominated IBM bonds. (3Q10 results: 18 October)

5 October 2010
5 October 2010 Credit Research
Euro Credit Pilot
UniCredit Research page 32 See last pages for disclaimer.
Current Ratings (Moody's/S&P/Fitch)
Credit Profile
Name (Ticker): Recommendation Weight in iBoxxComment Technology sector
A2s/An/A-s Weakening Nokia (NOKIA): Marketweight 37.7%Nokia released 2Q10 results roughly in line with expectations. In 2Q10, net sales increased by 1% yoy (-4% @coc) and (mainly) qoq seasonally by 5% (+2% @coc) to EUR 10.0bn (consensus estimate of EUR 10.0bn). However, reported operating profit decreased yoy to EUR 295mn (non-IFRS to EUR 660mn) from EUR 427mn (non-IFRS to EUR 775mn), mainly due to cost reduction measures undertaken in 2009. Nokia's reported operating margin was 2.9% (2Q09: 4.3%) and the non-IFRS operating margin was 6.6% (2Q09: 7.8%). Net income (attributable to equity holders of the parent company) amounted to EUR 227mn in 2Q10 (consensus estimate of EUR 287mn) versus EUR 380mn in 2Q09, non-IFRS income declined to EUR 419mn (consensus estimate of EUR 396mn) compared to EUR 552mn in 2Q09. Operating cash flow increased to EUR 944mn from EUR 717mn in 2Q09, primarily driven by lower working capital outflows, while FFO was down yoy by EUR 113mn to EUR 360mn. FCF (OCF minus capex) was EUR 772mn versus EUR 598mn in 2Q09. The company's cash and cash equivalents position decreased to EUR 9.5bn (from EUR 9.7bn in 1Q10) and the company's net cash position fell to EUR 4.1bn (from EUR 4.6bn), mainly due to FCF generation. The total debt to EBITDA (LTM, non-IFRS) ratio was unchanged qoq at around 1.0x, while adjusted by off-balance liabilities this ratio was almost unchanged at 1.5x. It is currently quite easy to be negative on Nokia, given the major problems the company is facing, in particular in the smartphone market and with NSN. In addition, the company's CEO is currently under pressure and the overall negative sentiment surrounding the name has not seen its turning point yet, i.e., it is likely that we will see further pressure on bond and CDS spreads, at least over the next 3-4 months. However, valuation-wise, Nokia paper is already trading wider than Ericsson's, which actually indicates that Nokia could be downgraded to a high BBB rating, something we do not foresee at this point in time, while further rating pressure to a low single A rating is likely. Bond-wise, Nokia bonds are still trading inside LMETEL bonds. Hence, we keep our marketweight recommendation on Nokia bonds and recommend selling protection in case of strong CDS spread widening in the coming months. (3Q10 results: 21 October)
Baa1n/BBB+s/A-n Stable STMicroelectronics (STM): Underweight 0.0%STMicroelectronics (ST) released 2Q10 results reflecting further financial improvements on the back of the global semiconductor market upturn. The 2Q10 results were in line with the company's own guidance as well as with the consensus. In 2Q10, net revenues increased 27.0% yoy and 8.9% qoq to USD 2,507mn. Growth yoy came mainly from its ACCI and IMS businesses (51% yoy and 16% qoq), while the ST-Ericsson JV disappointed (-18% yoy and -10% qoq). ST's gross margin further improved qoq to 38.3% (37.7% in 1Q10), which was in line with the company's guidance of 38.0% (plus/minus 1pp). The operating income amounted to USD 91mn in 2Q10 versus USD -428mn in 2Q09 and minus USD 20mn in 1Q10. However, excluding restructuring charges, ST had an adjusted operating income of USD 103mn in 2Q10 versus USD -342mn in 2Q09 and USD 13mn in 1Q10. The adjusted operating margin was 4.1% in 2Q10 versus 0.5% in 1Q10. FCF (net cash from operating activities minus net cash used in investing activities) amounted to USD 61mn in 2Q10 versus USD 148mn in 1Q10 or USD 267mn in 2Q09. At the end of 2Q10, ST's cash and cash equivalents, marketable securities (current and non-current), short-term deposits and restricted cash equaled USD 2.73bn versus USD 2.76bn at the end of March 2010. The company's liquidity was USD 2.38mn after deducting restricted cash as well as cash of the ST-Ericsson JV. The company's net cash position increased qoq from USD 566mn to USD 702mn. ST gave a promising 3Q10 outlook, which appears to be more towards the higher end of consensus expectations: Management expects sequential revenue growth of between 2% and 7%, which equates to solid yoy growth of 13% to 19%. The gross margin should further improve to about 38.8%, plus/minus 1pp. ST will continue to increase capacity in 2H10 to meet the strong demand of its customers, encouraged by the quality of its order backlog. Given the already promising results announcement of Texas Instruments and of ASML, it seems obvious that the semiconductor industry will continue to see strong demand during 2010. Hence, we expect that the operating performance of ST will continue to improve on the back of a strong cyclical upturn in the semiconductor industry. However, at current CDS and bond spread levels, we do not see value in STM bond and CDS spread levels. (3Q10 results: 20 October)
Stephan Haber (UniCredit Bank) +49 89 378-15192 [email protected]
5 October 2010
5 October 2010 Credit Research
Euro Credit Pilot
UniCredit Research page 33 See last pages for disclaimer.
Automobiles & Parts (Marketweight) Sector key figures Sector Wrap-Up Weight in iBoxx NFI: Current ASW spread: change mom/YTD: Euro STOXX ATO YTD:
9.3% 77.7bp -1.9/-20.0 +14.8%
Sector drivers: The major spread driver is the extent of the 2010 recovery, especially in 2H10 and 2011, as the inventory restocking cycle ends and the government's auto sales incentives expired in Europe. In addition, the auto sales environment remains difficult with weak consumer confidence, increased unemployment levels, slow global economic growth, and overcapacities leading to low profit margins. In addition, FCF generation is still difficult in FY10 in general given the necessary build-up in working capital, heavy investment in environmentally friendly cars (capex, R&D), increasing raw material cost headwind as well as potential support for auto suppliers and dealers. A risk factor for several companies, if the improvement in FY10 is not strong enough, is the achievement of the rating agencies' hurdle ratios in order to keep their ratings. We note that liquidity and refinancing risk declined significantly and that the companies are meanwhile sitting on heavy liquidity resources after their bond-prefunding and cash focus in 2009. In 2010, mass market manufacturers will experience a sales decline due to expiring scrappage incentive programs. Auto suppliers are suffering from low production levels and cost-cutting programs of OEMs. Last month's recap: In September, the spread of the automobiles & parts sector tightened by 2bp. There was basically no unexpected news and we saw limited bond issuance in the month. Outperformers were MICH 14, VW12, VW18 and underperformers were RCI Banque, Banque PSA and Daimler bonds.
Current Ratings (Moody's/S&P/Fitch)
Credit Profile
Name (Ticker): Recommendation Weight in iBoxxComment Automobiles & Parts sector
Baa1n/BBBs Improving Banque PSA (PEUGOT): Marketweight 7.4%Banque PSA issued EUR 600mn in 4Y bonds in September. At the beginning of September, the company repaid EUR 1bn of its State Loan early and S&P revised its outlook to stable from negative on both Peugeot and Banque PSA. Fitch already revised its rating outlook to stable from negative on 19 July on Peugeot. Peugeot expects the European market to be down by 7% in 2010 (at the release of FY09 results, the expectation was -9%), double-digit growth in China, and high single-digit growth in Latin America. Despite more difficult market conditions for 2H10 in Europe, as well as the usual seasonality, the automotive recurring operating income is expected to be close to break-even in 2H10. Peugeot expects to deliver a recurring operating income for the full year of around EUR 1.5bn (previous expectation was only "positive"). On 9 July, Peugeot agreed to share the capitalization of its new 50-50 JV with Chinese Chang'An Automobile Group with around EUR 225mn.We continue to have a marketweight recommendation for Banque PSA bonds (3Q10 results: 20 October)
A3s/A-n/--- Improving BMW AG (BMW): Overweight 25.3%Moody's changed its outlook to stable from negative on BMW ratings. With 2Q10 results, BMW raised the guidance for its adjusted automobile FCF (before dividends of EUR 197mn) to EUR 2bn from "at the level of FY09 of EUR 1,456mn" (1H10: EUR 1,199mn). The company intends to fund its external pension fund by another around EUR 1.5bn in FY10 (1H10: EUR 410mn). BMW recently raised its guidance for the automobile sales volume increasing by around 10% to >1.4mn vehicles (previous guidance was >1.3mn; FY09: 1.286mn). BMW said that the recovery of the worldwide markets and strong demand for new models such as the 5 Series and the X1 has had a positive impact on its business development. The Automobiles EBIT margin is now expected to reach >5% (previous guidance was a low single-digit percentage). BMW aims to achieve group EBT for FY10 that is significantly higher than that of FY09 (EBT: EUR 413mn). BMW's long-term profitability targets for 2012 remain unchanged, with an automotive EBIT margin of 8%-10%. We believe that FCF generation and the FY10 profitability guidance is positive, and a revision of BMW's rating outlook at Moody's and S&P to stable is more likely again now. BMW (as well as Daimler) trades at the tightest spread level among its European OEM peers and at a positive basis. We believe that given a potentially more difficult 2H10, this conservative credit, with a low debt leverage and a strong business risk profile, has the ability to outperform the sector. Therefore, we continue to see value in BMW bonds. (3Q10 results: 3 November)
A3n/BBB+s/BBB+p Improving Daimler AG (DAIGR): Overweight 19.9%At the end of August, S&P revised its rating outlook to stable from negative. With 2Q10 results, Daimler increased the guidance for group EBIT from ongoing business to EUR 6bn from previously EUR >4bn (FY09: EUR -779mn excl. special items) in view of the good business development in all divisions and supported by favorable FX rates. Despite increased R&D and capex requirements and a working capital build-up, Daimler expects industrial FCF in FY10 far above EUR 1bn (1H10: EUR 2.8bn). In addition, the expected improvement in group EBIT and the dividend cancellation will lead to improved industrial credit metrics in FY10, although the 2H10 development is likely to be weaker than in 1H10, in our view. Given the renewed guidance increase and the credit metrics improvement with the subsequent headroom under rating agencies' hurdle ratios, Daimler is clearly on its way to a stable rating outlook at both S&P and Moody's. On 19 July, Fitch changed its rating outlook on Daimler to positive. We continue to have an overweight recommendation on Daimler bonds in the automotive sector. Daimler's cash curve trades wider than that of its sector peers, especially at the shorter end, and the bond supply pressure seems to remain low for the time being. In addition, we believe that Daimler will take the appropriate measures to keep its credit metrics above the rating agencies' hurdle ratios and aims for a stable rating outlook at S&P and Moody's. (3Q10 results: 28 October)
A1s/A+s/As Stable Honda (HNDA): Marketweight 3.5%Honda's forecast for FY10/11 (ending March 2011) is for a sales increase of 6.1% to JPY 9.1tn, the operating income margin improving 4.9% vs. 4.2% yoy and net income of JPY 455bn vs. JPY 268.4bn yoy. The forecast is based on JPY to USD and EUR of JPY 87 and JPY 112 for FY10/11 (FY09/10: JPY 93 and JPY 130), respectively. We note that Honda has had a highly conservative debt leverage, even during the industry downturn in 2009. Honda's industrial net cash position increased further to JPY 788bn vs. JPY 690bn qoq. We continue to have marketweight recommendation on Honda bonds. (1Q10/11 results: 27 October)
5 October 2010
5 October 2010 Credit Research
Euro Credit Pilot
UniCredit Research page 34 See last pages for disclaimer.
Current Ratings (Moody's/S&P/Fitch)
Credit Profile
Name (Ticker): Recommendation Weight in iBoxxComment Automobiles & Parts sector
Baa2s/BBBn/BBB-s Improving Michelin (MICH): Marketweight 2.2%Michelin launched a EUR 1.2bn rights-offering plan at the end of September to fuel its significantly increased capex plan over the next few years and not to lose its current rating. Michelin's 1H10 operating margin improved to 9.8% vs. 4.0% yoy. FCF after dividends weakened to EUR -90mn vs. EUR 478 mn yoy on a significant working capital build-up of EUR 651mn yoy. FFO/net debt in LTM1H10 improved to 29%, now being close to S&P's rating hurdle ratio of 30%, with rating pressure therefore having eased. For FY10, the company said that the clear rebound in the tire markets is expected to continue in 2H10, although the pace of economic recovery will vary from one region to another. While rising raw material costs will have a negative impact on 2H10 consolidated results (and reduce full-year income by EUR 600-650mn), Michelin will benefit from the price increases introduced in 1H10. In addition, the Group is announcing an increase of around 3% in its passenger car and light truck replacement tire prices in Europe starting in September, thereby confirming its commitment to a responsive pricing policy. In this environment, Michelin reaffirms its FY10 targets of a sales volume increase of at least 10%, positive FCF and an operating margin before non-recurring items of close to 9%. We continue to have a marketweight recommendation on the name. (3Q10 revenues: 26 October)
Baa2s/BBB-s Improving RCI Banque (RENAUL): Marketweight 7.0%RCI Banque issued EUR 500mn in 2Y bonds at the end of August and Renault increased its 2015 bond by EUR 250mn in mid-September. Just like Peugeot, Renault also paid back EUR 1bn in State loans early. Renault expects the global automotive market to grow by approximately 8% in 2010 compared to 2009, despite an estimated 7%-9% decline in the European market (previous expectation for Europe: -10%). In an unusually uncertain environment in 2H10, Renault continues to focus on its action plan, while closely monitoring changes in the overall economic environment. 3Q10 will be important in determining visibility for FY10 and the start of 2011 in the automotive market. Renault’s objective for 2010 remains to generate positive FCF and increase market share in the Group’s main markets. Just like Peugeot, the company pointed to a more difficult 2H10. We continue to have a marketweight recommendation on RCI Banque. (3Q10 revenues: 27 October)
--/AA-s/-- Improving Robert Bosch GmbH (RBOSCH): Underweight 3.5%S&P revised its rating outlook to stable from negative in June. Bosch's 2010 outlook is for an increase of group sales >10% to EUR 42bn and a return to positive net income, but to stay significantly below its 7%-8% EBT margin target. The company stated that in regional terms Asia-Pacific and in sector terms automotive technology will make the greatest contribution to this growth given increased demand for vehicles, especially outside Europe. The company intends to spend around EUR 1-2bn p.a. on acquisitions, but said that in terms of financial resources, it could also stem a bigger acquisition. Given positive FCF in FY09, the still strong credit metrics (incl. non-current financial assets) and the stabilizing FY10 outlook, we believe that rating pressure has diminished. We believe that Bosch's FY09 results are well within S&P's hurdle ratios, also supported by the good performance of its securities position. We keep our underweight recommendation for Bosch. Although we believe that the credit metrics momentum is positive in FY10, there is some risk of debt-financed acquisitions, with the bonds trading at the tightest spread level in the iBoxx auto sector. (FY10 annual report: end of April 2011)
Aa2n/AAn/A+s Stable Toyota Motor Corp. (TOYOTA): Underweight 8.7%In mid-September, Fitch revised its outlook to stable from negative. For FY10/11, the company raised its guidance and now expects an increase in revenues by 2.8% to JPY 19.5bn (previously: +1.3% to JPY 19.2bn), operating income of JPY 330bn (previously: JPY 280bn), corresponding to an EBIT margin of 1.7%, and its net income to improve to JPY 340bn (previously: JPY 310bn). Compared with sector peers, this guidance is a clear underperformance. As seen with YTM 2010 sales figures, Toyota's unit sales momentum in the US and Europe and its profitability are under pressure due to recent headlines regarding its safety-related recalls. Given the weakened credit metrics in FY09/10 (ending March 31) and the comparatively weak FY10/11 outlook, we have an underweight recommendation for Toyota bonds. (1Q10/11: 5 November)
A3s/A-n/BBB+p Stable Volkswagen AG (VW): Overweight 22.4%VW Bank (A2s/A-s) issued EUR 500mn in FRNs. Recently, S&P stated that its current outlook reflects the potential risks related to the execution of the VW group's various strategic plans, which in S&P's view could weaken VW's financial position beyond its current expectations for the rating. These risks include potential delays or setbacks in executing significant capital increases at Porsche SE and necessary deleveraging of the company over 2010-11 to achieve adequate credit metrics for the rating from 2011; uncertainty over potential litigation risk regarding alleged stock manipulation in the context of the Porsche acquisition, which could potentially have a materially negative effect on credit quality; strategic uncertainties about management's future strategy regarding its participations in Scania and MAN; and the medium-term impact of this on VW's financial position. For details on VW's current credit profile, please refer to our Credit Flash dated 30 July 2010. We note that the execution risks mentioned by S&P clearly exist. Nevertheless, it has to be noted that VW at the end of 1H10 had an automotive net cash position of EUR 15.9bn and its LTM1H10 FFO/net debt (adj.) was a strong 111%. This prepares, in our view, VW well for the upcoming transactions, i.e. the purchase of Porsche Salzburg for an EV of EUR 3.55bn in 2011 (net price of around EUR 3bn), which enables at least the capital increase of Porsche SE on the side of the Porsche family. Nevertheless, we note that there is some litigation risk and legal disputes for VW and Porsche regarding their M&A activities during 2008, which might have increased the execution risk on the Porsche transactions. Nevertheless, we continue to have an overweight recommendation for VW bonds given that VW's 5Y CDS trade some 10bp wider than similar-rated BMW and Daimler. Given the heightened economic risks for 2H10, single-A credits should have outperformance potential. (9M10 results: 27 October)
Dr. Sven Kreitmair, CFA (UniCredit Bank) +49 89 378-13246 [email protected]
5 October 2010
5 October 2010 Credit Research
Euro Credit Pilot
UniCredit Research page 35 See last pages for disclaimer.
Utilities (Marketweight) Sector key figures Sector Wrap-Up Weight in iBoxx NFI: Current ASW spread: change mom/YTD: Euro STOXX UTS YTD:
25.5% 96.3bp +9.0/+21.6 -18.6%
Sector drivers: Major spread drivers of this sector are M&A activities, as well as regulatory risk and the development of fuel prices and emission certificates. The bulk of M&A transactions has already occurred (Enel/Endesa, Suez/GdF, National Grid/KeySpan, Iberdrola/Scottish Power/East Energy, RWE/Essent, Gas Natural/Union Fenosa). Nevertheless, for 2010 we expect M&A activities to continue, primarily driven by asset disposal programs (e.g., E.ON, EDF, Enel, Gas Natural, Veolia). Last month's recap: In September, the average spread level in the utility sector was stable. However, some names were still impacted by negative newsflow with respect to their sovereign (e.g., Bord Gais Eireann).
Current Ratings (Moody's/S&P/Fitch)
Credit Profile
Name (Ticker): Recommendation Weight in iBoxxComment Utilities sector
A3s/BBB+n/--- Stable A2A (AEMSPA): Marketweight 1.2%A2A reported improved 2Q10 results that were above consensus expectations, but did not fully offset the weak first quarter results. EBITDA in 2Q10 was up by EUR 16mn, mainly due to the recovery of certain items charged in the first quarter. Nevertheless, overall EBITDA for the first six months of 2010 of EUR 474mn is still EUR 66mn below the 1H09 figure. Most of this decrease stems from the gas business, which was affected by a time lag in the index adjustments of retail and procurement prices. Net debt decreased by EUR 0.3bn vs. YE09 to EUR 4.4bn, also affected by the disposal of the stake in Alpiq for EUR 0.3bn, and lower dividend payments. The credit profile therefore slightly improved, with adj. FFO to net debt reaching 14.6% in June 2010 (YE09: 12.2%). Credit ratios are still weak for the current rating category (S&P requires the group to reach FFO to net debt of at least 15%-16% in 2010). However, the credit profile should be supported by further disposals of non-core assets (e.g., 15.6% stake in Edison), and a positive business development. AEMSPA bonds are trading at fair levels. (9M10 results: 11 November)
A3s/---/--- Stable Abu Dhabi National Energy Company (TAQAUH): No recommendation (event-driven coverage) 0.4%TAQA, headquartered in Abu Dhabi, is the holding company, with majority stakes, in six of the nine Independent Water and Power Producers (IWPP) in the Emirates. It provides about 85% and 90% of Abu Dhabi's power generation and water desalination needs. TAQA was established in June 2005 to consolidate the government's shareholding in Abu Dhabi's domestic water and power generation assets. Since then, TAQA has grown as a global energy company and is the government's investment conduit in the global energy sector. TAQA's main goal is to own and invest in power generation, water desalination, oil and gas, and infrastructure sectors across the Middle East, North Africa, India, Europe and North America. TAQA is 75% owned by the government of Abu Dhabi, through the Abu Dhabi Water and Electricity Authority (ADWEA) and through the Farmer's Fund (51% and 24.9% stakes, respectively), the remaining capital is held by private shareholders (ownership limited to UAE nationals). In December 2009, Moody's put TAQA's rating on watch negative as the implicit government support currently implemented in the rating has to be re-validated.
Aa3s/As/--- Stable Alliander Finance BV (ALLRNV): Marketweight 1.1%Alliander reported weaker 1H10 results influenced by deconsolidation effects and regulatory decisions. Sales decreased by 24% yoy to EUR 730mn, whereas EBIT fell by 60% yoy to EUR 129mn. The 1H09 EBIT contained proceeds from the sale of the HV-grids to TenneT amounting to EUR 168mn before-tax. FFO to net debt stands unchanged at 30%, versus 43% at YE09. Moody's upgraded the ratings of Alliander from A2 to Aa3 with stable outlook. The upgrade is a consequence of the unbundling process, the sale of the generation and supply activities to Vattenfall, and the concentration on regulated activities. Furthermore, the new rating reflects a higher level of support from its municipal shareholders (Alliander is owned by 58 Dutch provinces and municipalities, with the four largest provinces holding 77% of the company's stock). Spread levels are tight, but should discount for all risks.
A3s/A-s/A-s Stable Anglian Water Services (AWLN): Overweight 0.7%UK water utility AWS is a subsidiary of AWG Plc, which was taken over by a consortium of financial investors. We think that the ringfenced structure as well as the existing high leverage of AWS provides sufficient protection for its bondholders. In October 2009, Moody's confirmed the rating with a stable outlook. In the past few weeks, AWLN bonds slightly outperformed the index. We still regard current spread levels as attractive.
A2s/A-n/-- Stable Bord Gais Eireann (BOGAEI): Underweight 0.3%In August 2010, S&P revised the outlook on its A- rating for Irish gas distributor Bord Gais Eireann (Irish Gas Board) from stable to negative. The rating action was triggered by a downgrade of the Republic of Ireland to AA-, but also by the group's expansion into competitive electricity generation and supply activities. This expansion puts some pressure on the stand-alone credit profile (SACP), which is BBB+ at S&P (given the strong link to the Irish government, which holds 98.5% in the company, BOGAEI receives a one-notch uplift). S&P expects adj. FFO to net debt of ca. 13% by FY11 (FY09: 12.4%). The BOGAEI 06/16/14, which is currently trading at around 430bp (ASW), strongly underperformed the index in the past few weeks due to the development of the sovereign spread. We remain cautious about the name, and assume that current levels do not fully discount all risks. Correlation between BOGAEI bonds and sovereign spreads will remain high.
A3s/A-s/As Stable Centrica (CENTRI): Marketweight 0.5%Centrica released improved 1H10 figures, with adjusted operating profit increasing by 65% yoy to GBP 1,563mn (despite no growth in revenues), due to consolidation effects (British Energy), but also a strong downstream performance, benefiting from higher volumes in a strong winter. Operating profit was significantly above the consensus of GBP 1,324mn. Cash-flow generation improved, with FFO rising by 77% to GBP 1,856mn. Net debt benefited from the strong cash-flow generation and now stands at GBP 2.8bn vs. GBP 3.2bn at YE09. Ratios should therefore be fully in line with the rating. Over the past few weeks, Centrica's EUR-denominated bond slightly outperformed the index, but is still trading at fair levels.
5 October 2010
5 October 2010 Credit Research
Euro Credit Pilot
UniCredit Research page 36 See last pages for disclaimer.
Current Ratings (Moody's/S&P/Fitch)
Credit Profile
Name (Ticker): Recommendation Weight in iBoxxComment Utilities sector
A2s/A-s/A-s Weakening CEZ (CEZCO): Marketweight 2.6%CEZ released weaker 2Q10 figures, below expectations. Sales in 2Q10 rose 3.9% yoy to CZK 44.8bn, but EBITDA fell by 8.1% yoy to CZK 19.9bn (EUR 0.8bn). EBITDA was below UniCredit estimates of CZK 20.7bn. The bulk of the decline is linked to the power production unit. Cash-flow generation was also weaker yoy, but credit ratios remained stable due to lower investments. FFO in 1H10 dropped by 7.4% yoy to CZK 41.9bn, whereas free cash flow was positive (also due to lower capex) and net debt rep. fell to CZK 123bn from CZK 130bn at YE09. This leads to a strong FFO to net ratio (adj.) of 48%, which is significantly above rating agencies' requirements under the current rating (35% at S&P). We regard 2Q earnings as still in line with the guidance. The financial headroom is not as big as in the past, and the company is exposed to price and regulatory risk, but it still enjoys a certain financial flexibility. Spreads of CEZCO bonds showed a sound performance in the past few weeks, but still trade at fair levels. (3Q10 results: 9 November)
Baa1s/A-s/BBB+n Weakening Dong (DANGAS): Marketweight (Senior)/Marketweight (Subordinated) 2.2%Dong published improved 1H10 results yoy, benefiting from higher power prices and timing differences related to volatile markets for oil, gas and coal. Revenue was down DKK 1.1bn yoy to DKK 27.7mn, while EBITDA was up DKK 2,853mn (+55%) to DKK 7,619mn. Cash flow generation also improved in 1H10, with FFO at DKK 6.2bn, up 41% yoy. Hence, net debt was down by DKK 0.6bn to DKK 26.6bn. We calculate an FFO to net debt ratio of 24%, which is almost in line with S&P's requirements (e.g., S&P expects FFO to net debt of 25% in 2010, and 25%-30% thereafter). With respect to the outlook for FY10, the company affirmed its guidance released earlier this year. As management expects a significant improvement of EBITDA yoy, we expect a slight improvement of credit ratios by YE10. Spreads of DANGAS senior bonds remained stable in the past few weeks (the hybrid bond underperformed) and are trading at fair levels.
A2s/As/As Improving E.ON (EOANGR): Marketweight 9.7%E.ON released 1H10 figures above expectations. Sales were up 7% yoy to EUR 44.3bn. Adj. EBITDA of EUR 7,870mn was 9% above the 1H09 figure. EBITDA strongly increased in the UK division and in Energy Trading, while the group also showed an improved performance in the gas business. The largest division, Central Europe, showed a significant decline in performance, affected by deconsolidation effects. Cash-flow generation improved in 1H10, with FFO up 45% yoy to EUR 7.3bn. We calculate an adj. net debt figure of EUR 48.5bn versus EUR 45.5bn at YE09. Leverage as measured by net debt/EBITDA (adj.) ratio is at 3.5x compared to 3.4x at YE09. FFO to net debt is at 22% compared to 18% at YE09, exceeding the S&P requirement of 20%. Credit ratios should further benefit from the completion of the disposal of the US activities for approximately EUR 6.2bn to PPL Corp. (closing expected for YE10). For 2011, we expect rating pressure due to the anticipated financial burden from a new nuclear regulation in Germany. However, we do not expect a downgrade of E.ON and still like the name. Bonds showed a stable performance in September.
Aa3s/A+s/A+s Weakening EDF (EDF): Marketweight 10.7%EDF released improved 1H10 figures, above expectations. Sales increased by 7.7% yoy to EUR 37.5bn, whereas EBTIDA was up 4.4% to EUR 10.4bn (market consensus of EUR 10.0bn). Around half of the revenue growth was related to consolidation effects, in particular the acquisition of SPE in Belgium and the 49.99% stake in Constellation Energy in the US. Excluding consolidation and currency effects, organic sales growth was positive at +2.1% yoy (had been negative in 1Q10). Net debt/EBITDA is 2.5x, which is at the lower end of the company's guidance. The group confirmed its FY10 guidance: 1. Organic EBITDA growth between 3% and 5%, and 2. Net debt between 2.5x and 3.0x. 3. Stable dividend. The group is very close to selling its UK electricity network business to a group led by Cheung Kong Infrastructure Holdings (owned by Honk Kong billionaire Li Ka-shing) for a price of GBP 5.8bn. EDF bonds showed a stable performance, in line with the market, and are trading at fair levels.
Baa2n/BBB+n/BBB+n Stable Edison (EDNIM): Overweight 0.7%Edison reported 1H10 results that were below market expectations in terms of EBITDA, suffering from a still weak gas market and a lower contribution of cheaper hydro generation. 1H10 sales were up by 11.2% yoy to EUR 5,355mn, while EBITDA dropped by 114.5% yoy to EUR 626mn (consensus: EUR 664mn). For 1H10, we calculate adj. net debt to EBITDA of 3.8x (FY09: 3.3x) and adj. FFO to net debt of 25.5% (26.9%). To keep the current rating at S&P, the agency requires a threshold of 20% at least for the latter ratio. Moody's, however, requires an RCF to net debt ratio of at least 20%, which was on the verge at 1H10 (20.8%). We learned that the disposal of a minority stake in gas field Abu Qir is not a priority for management anymore. To deleverage the balance sheet, the focus is the disposal of CIP6 contracts for around EUR 500mn. Excluding the one-off gain of EUR 150mn from EBITDA expected for FY10, we expect adjusted net leverage to stay at ca. 3.6x, which would be weak for the current rating category. In case of an unsuccessful (full) takeover of Edison by EDF (Aa3s/A+s/A+s), negative ratings cannot be ruled out anymore. However, the latest news regarding a potential takeover dates back to June 2010. In the past few weeks, Edison bonds showed a stable performance. There is still some tightening potential in case a full takeover by EDF materializes. We therefore keep our overweight recommendation for the name. (9M10 results: 26 October)
A3s/A-n/A-s Stable EDP (ELEPOR): Underweight 2.6%1H10 EBITDA of EDP increased by 14% yoy to EUR 1,830mn (UniCredit (E): EUR 1,756mn), supported by stronger Brazilian activities, and the higher installed capacities in its wind business. Furthermore, acquired network assets from Gas Natural also propelled 1H10 earnings as these activities were consolidated for the first time. FFO was EUR 1,439mn, +12% yoy. Free cash flow was negative, also due to extraordinary tax payments in Portugal. Net debt consequently rose by EUR 2.1bn to EUR 16.1bn. On a reported basis, net debt to EBITDA was 4.4x, unchanged versus YE09 and YE08. 5Y CDS trade at 155/165bp, slightly below those of Portugal (around 180bp). Given the economic uncertainties in the countries based in the European periphery and a potential reduction of the government stake, we keep our underweight recommendation. (9M10 results: 4 November)
---/A-n/--- Weakening Elia (ELIASO): Underweight 1.3%Elia reported a solid set of 1H10 results which were slightly influenced by the German transmission grid (Elia holds a 60% stake in 50Hertz Transmission), acquired in late May 2010. 1H10 sales were up by 7.8% yoy to EUR 385mn, while recurring EBITDA even improved by 18% yoy to EUR 187mn. EBITDA from the Belgian transmission grid contributed EUR 166.5mn or almost 90% of the company's EBITDA. With respect to the acquired German transmission grid, the company generated a recurring EBITDA of EUR 81mn (proportionate consolidation of 60%). Operating cash flow improved due to lower working capital and increased from EUR 13mn in 1H09 to EUR 101mn in 1H10. Despite acquisitions and capex totaling EUR 210mn and an implemented debt structure at the German transmission grid, the net debt position (EUR 2.5bn) was almost unchanged vs. June 2009 (EUR 2.4bn). We note that 50Hertz Transmission had EUR 350mn of structural bank debt and a cash position of EUR 166mn at 1H10. Despite the solid operating performance, we keep our underweight recommendation on the name due to relative value reasons.
5 October 2010
5 October 2010 Credit Research
Euro Credit Pilot
UniCredit Research page 37 See last pages for disclaimer.
Current Ratings (Moody's/S&P/Fitch)
Credit Profile
Name (Ticker): Recommendation Weight in iBoxxComment Utilities sector
A2s/AA-s/A+s Weakening Enagas (ENGSM): Underweight 0.6%1H10 results of Enagas were in line with market expectations in terms of EBITDA, which was up by almost 17% yoy to EUR 385mn, supported by additional assets coming into operation during 3Q09 and 4Q09, as well as cost efficiency measures. Total transported gas volume increased by 1.5% yoy to 200,903 GWh, whereby conventional demand for heating and industrial consumption was up by 10.5% yoy, while demand for power generation dropped by 14% yoy due to higher power generation through wind and hydro power plants. Net debt at the end of June 2010 was EUR 2.92bn compared to EUR 2.90bn at YE09. The credit profile therefore slightly improved during 1H10, with ratios being fully in line with the current rating. However, the planned capex of EUR 700mn in FY10 and the already acquired underground storage facilities from Repsol for EUR 71mn will result in negative free cash flow in FY10. Spreads of ENGSM bonds remained stable in the past few weeks, in line with the index, but we regard current spread levels as too tight. We therefore keep our underweight recommendation. (9M10 results: 27 October)
A2s/A-n/As Stable EnBW (ENBW): Overweight 3.2%EnBW released weaker 2Q10 figures, but positively revised its guidance. Adj. EBIT fell by 23% yoy to EUR 283mn, influenced by the deconsolidation of Geso in 1Q10, and the continuing weak performance of the gas business. On a six-month basis, adj. EBIT in 1H10 was still 8.6% higher than in 1H09 at EUR 1,159mn. Net debt adj. decreased by EUR 0.5bn to EUR 8.9bn as of June 2010. At the end of March 2010, FFO to net debt stood at 29%, up from 24% at YE09 and well above the 20% threshold required by S&P. We also calculate a net debt/EBITDA ratio of 2.9x. The company revised its guidance and now expects adj. EBIT in 2010 to rise by 1%-3% yoy (previously 0%). We keep our overweight recommendation for the name, for relative value reasons, and as we regard it as a safe haven in the current environment. Furthermore, the revised guidance supports our expectation of a gradual improvement of the company's credit profile over the next two years. There is some execution risk with regards to asset disposals but EnBW's investment program is quite flexible, especially as around 30% of the program is linked to acquisitions. EnBW bonds trade at fair levels.
A3n/A-s/A-s Stable Endesa (ELESM): Marketweight 0.4%1H results of Endesa were broadly in line with expectations. EBITDA was up 3.1% yoy to EUR 3,850mn versus UniCredit expectations of EUR 3,818mn. The group benefited from a sharp increase in electricity sold to customers and an improved output mix with a higher share of nuclear and hydro output (despite lower production yoy). Cash-flow generation was relatively stable yoy and net debt slightly increased from EUR 18.6bn to EUR 19.1bn. We calculate an FFO to net debt ratio of 25% (YE09: 26%), which would still be in line with the rating (the rating is primarily determined by that of its shareholder Enel). The ELESM 13 trades at fair levels.
A2n/A-s/A-s Improving Enel (ENEL): Marketweight 6.1%Enel reported a solid set of 1H10 results, above expectations in terms of EBITDA. 1H10 sales were up by 22% yoy to EUR 34.8bn, while EBITDA increased by 12% yoy to EUR 8,878mn (UniCredit: EUR 8,756mn), still influenced by the consolidation of Endesa (since 1 July 2009). Within the segments, the lower trading margin in the (Italian) Generation and Energy Management division was offset by a better operating performance at Endesa and the consolidation effects. Reported net debt was almost EUR 54bn vs. EUR 51bn at FYE09. Credit ratios show some stability: Net debt/EBITDA is around 3.9x, whereas FFO to net debt now is now around 17%, both ratios unchanged to YE09. Credit ratios are fully commensurate with the current A- rating at S&P and Fitch. Adjusted net leverage should decline to ca. 3.2x, once the asset disposal program is completed and proceeds from the securitization of the Spanish tariff deficit are booked. During the conference call, CEO Fulvio Conti was confident about meeting the EUR 45bn net debt target by YE10 (but net of exchange effects). We keep our marketweight recommendation for the name as the deleveraging story is still intact. (9M10 results: 10 November)
A2s/A-wn/--- Stable EWE (EWE): Underweight 1.3%EWE has decided to pay around EUR 100mn to 620,000 gas customers, in line with a proposal set by the intermediator Henning Scherf (the former mayor of Bremen) in an arbitration process. This payment was not unexpected, as there had already been a Supreme Court ruling forcing EWE to compensate its customers for too high gas prices charged in the past. The amount itself is at the upper end of expectations. As of 1H10, the company's credit ratios had been far from the 25% S&P requirement, but the group already withdrew its S&P rating on 2 September. Given the withdrawal of the ratings and the high payments to customers, we remain cautious about the name. Potential further negative news cannot be excluded. We do not see all risks reflected at current spread levels.
A2s/As/A-s Stable Fortum (FRTUM): Marketweight 1.8%Fortum reported weaker 1H10 figures yoy, which were slightly below the market consensus and UniCredit's forecast in terms of operating profit. 1H10 sales increased from EUR 2.8bn to EUR 3.2bn, while operating profit declined by EUR 12mn to EUR 990mn, the latter mainly affected by the Power segment. The drop in operating profit in the Power division was due to lower hydro and nuclear volumes and higher costs of associated nuclear generating companies. Operating cash flow dropped from EUR 1.5bn to EUR 943mn. However, the credit profile on a reported basis remained almost unchanged, with net debt to EBITDA of 2.7x (FYE09: 2.6x). With respect to hedging activities, the company already sold 80% of its 2010 production at EUR 44 per MWh and 60% of its 2011 production at the same price. Based on the expected annual capex volume of between EUR 1.0-1.2bn in 2010, we expect a stable credit profile as operating cash flows should be able to fully cover the payouts for capex and dividend. We keep our marketweight recommendation on the name. Spreads of Fortum bonds are tight but at fair levels. (9M10 results: 21 October)
Baa2s/BBB+n/A-n Improving Gas Natural (GASSM): Marketweight 4.1%Gas Natural reported 2Q10 results that were slightly below UniCredit forecasts in terms of EBITDA, but showed some progress in deleveraging the balance sheet. Furthermore, the company presented its strategic plan 2010-14, which is still focused on debt reduction and an A rating in the medium term. 1H10 results were still largely influenced by consolidation effects from the Union Fenosa (UF) acquisition, which was completed in mid-2009. While EBITDA was up by 48% yoy to EUR 2.4bn on a reported basis, EBITDA on a pro-forma basis only increased by 3.8% yoy. Operating cash flow was EUR 1.8bn, up from EUR 1.3bn. However, capex and dividend payouts led to a virtually unchanged net debt position vs. FY09. Due to asset disposals of EUR 1.4bn (out of a total of EUR 1.8bn announced) reported net debt fell from EUR 20.9bn at FYE09 to EUR 19.8bn. This figure still includes the group's share in the Spanish tariff deficit (EUR 1.5bn) of which a first tranche is supposed to be securitized this year. We calculate an FFO to net debt ratio (adj.) of 19.3%, up from 13.2% at YE09. Net debt to EBITDA is 4.1x versus 5.5x at YE09. We keep our marketweight recommendation for the name. Given the challenging environment for credits in the European periphery, we do not expect Gas Natural bonds will outperform the respective iBoxx index in the near future. However, we note that the deleveraging story of Gas Natural is still valid. (9M10 results: 3 November)

5 October 2010
5 October 2010 Credit Research
Euro Credit Pilot
UniCredit Research page 38 See last pages for disclaimer.
Current Ratings (Moody's/S&P/Fitch)
Credit Profile
Name (Ticker): Recommendation Weight in iBoxxComment Utilities sector
Aa3n/As/--- Stable GDF Suez (GSZFP): Overweight 6.8%GDF Suez released improved 1H10 figures above expectations while at the same time announcing that it has reached an agreement with International Power regarding a takeover of the UK company. In 1H10, sales of GDF Suez increased by 0.3% yoy to EUR 42.3bn, whereas EBITDA was 4.3% higher yoy at EUR 8.2bn. There had been a very positive contribution from the French and the International Energy business. FFO to net debt stands at 24% versus 27% at YE09. This is at the lower end of rating agencies' requirements but either way, the rating will be determined by the announced takeover of IPP. GDF Suez will combine its international energy activities with IPP in a cash/equity deal. The French group will transfer its subsidiary GDF Suez Energy International to IPP, in exchange for newly issued IPP shares. In addition, it will pay a EUR 1.7bn special dividend to the current shareholders of IPP. Post closing, GDF Suez will own 70% of the New IPP. We see some risk that S&P could lower the rating by one notch to A-, but GDF Suez should be able to avoid such a scenario if the announced asset disposals of EUR 4.0bn are realized quickly. We keep our overweight recommendation.
A3s/BBB+s/--- Stable Hera SpA (HERIM): Marketweight 0.6%Hera released improved 1H10 figures beating expectations. Revenues were down 15% yoy to EUR 2.4bn, whereas EBITDA rose by 16% yoy to EUR 314mn, above market consensus of EUR 300mn. Around one quarter of the increase is related to new power plants coming on stream, while the remainder was influenced by cost-cutting measures and organic growth from higher regulated tariffs and the market expansion strategy. Net financial debt amounted to EUR 1.97bn versus EUR 1.89bn at YE09. Operating cash flow was sufficient to cover capex but not the dividend payments of EUR 97mn. We calculate an FFO to net debt ratio of 13%, unchanged versus YE09. This is still below rating agencies' requirements (e.g., Moody's requires adj. FFO to net debt in the high teens). However, we expect an improvement of credit metrics in the course of the second half of the year and therefore do not regard ratings as endangered. We keep our marketweight recommendation for the name.
A3s/A-s/A-s Improving Iberdrola (IBESM): Overweight 4.9%Iberdrola released solid 1H10 results that were ahead of UniCredit expectations. 1H10 sales surged by 16.9% yoy to EUR 15.3bn while EBITDA was up "only" by 11.7% to EUR 3,836mn. Earnings benefited from stronger demand for electricity in Spain, the improved performance of the Spanish liberalized business, a better production mix and higher generation capacity at Iberdrola Renovables. Net debt increased from EUR 30bn at FYE09 to EUR 31.8bn at 1H10. The debt figure includes EUR 4.2bn stemming from the tariff deficit in Spain, which is still expected to be securitized by 4Q10. For 1H10, we calculate adj. net debt to EBITDA of 4.5x (FYE09: 4.4x) and adj. FFO to net debt of 14.7% (15.3%). Assuming that the existing tariff deficit will be securitized in September this year, the adj. FFO to net debt ratio should improve to ca. 17%. Hence, we see good chances for Iberdrola to maintain a single A rating. Spreads of Iberdrola are already trading at a BBB level. We keep our overweight recommendation for Iberdrola, as we regard it as the strongest name among Iberian utilities. Furthermore, more than 50% of its EBITDA is generated outside Spain.
Baa1s/A-s/BBBs Stable National Grid Plc (NGGLN): Marketweight 2.6%National Grid released improved results for FY09/10, while also announcing a rights issue of approximately GBP 3.2bn. This should explicitly stabilize the single A rating for the UK opcos. Operating profit in the period was GBP 3,121mn (+7% yoy), 2% above market expectations. While all UK activities showed a good performance, operating profit in US transmission and US gas distribution declined by 13% qoq (to GBP 153mn) and 32% yoy to GBP 414mn, respectively. Cash-flow generation strongly improved versus the prior year. FFO increased by 30% yoy to GBP 3,088mn. However, due to currency effects, net debt fell to GBP 23.0bn compared with GBP 23.9bn at the end of March 2009. FFO to net debt stands at 11.3% compared to 8.5% in FY08/09. For YE09/10, we expect the FFO/net debt ratio to stay close to the S&P short-term requirement of 10%. We see a good chance that National Grid could even reach the medium-term threshold, set by S&P at 12%, in the coming financial year. Regarding the rights issue, we do not see any real M&A ambitions behind the transaction, especially as the company has pulled out of the bidding process for EDF's regulated UK business. Bonds trade fair.
Aa2n/AA-s/-- Weakening Nederlandse Gas (NEDG): Marketweight 1.8%In September 2009, Moody's changed the outlook on the Aa2 issuer rating of Dutch gas transmission company Gasunie from stable to negative. The rating action reflects concerns that the combination of a possible further decrease in rates in Germany from 2010 onwards – based on current decisions by the German regulator – and an ongoing ambitious investment program may result in credit metrics weakly positioned within the current rating category. Moody's had previously indicated that it expects the company to demonstrate FFO to net debt at least in the low teens and FFO interest cover above 3.5x on a sustainable basis to support the current Aa2 ratings. As of 30 June 2009, this ratio was still 21.0% versus 21.5% at YE08. In March 2010, Gasunie withdrew from a bid for RWE's gas distribution network in Germany. The BEB network is geographically contiguous to that of Gasunie. NEDG bonds are trading at tight but fair levels.
A2n/AA-n/A+wn Weakening Red Electrica (REDELE): Underweight 0.5%Red Electrica released strong 1H10 results, beating UniCredit estimates, as well as consensus data. EBITDA increased 14.8% yoy to EUR 472mn (UniCredit (E) EUR 451mn). The earnings increase was mainly driven by inflation adjustments and growth in the regulated asset base. Net debt stood at EUR 3,064mn, down by 1.9% versus YE09. However, with the purely debt-financed acquisition of Endesa's Spanish transmission assets announced on 1 July, the credit profile of REDELE is expected to weaken. Based on a transaction volume of EUR 1.5bn, we expect adj. net leverage to increase to ca. 4.5x by FYE10, up from 3.8x at FYE09. Moody's and S&P immediately reacted to the transaction and changed their outlook to negative from stable. In addition to the transaction, the planned review of the electricity remuneration system announced by the Spanish government might result in a delay of the recovery of REDELE's credit profile. For FY10, S&P expects adj. FFO to net debt of 14%, down from a previously expected range of between 15% to 17%. The REDELE 9/13 bond showed a weak performance in the past few weeks, affected by the M&A news and the spread development of the Spanish sovereign. We expect spread pressure to continue and we keep our underweight recommendation on the name.

5 October 2010
5 October 2010 Credit Research
Euro Credit Pilot
UniCredit Research page 39 See last pages for disclaimer.
Current Ratings (Moody's/S&P/Fitch)
Credit Profile
Name (Ticker): Recommendation Weight in iBoxxComment Utilities sector
A3n/A-n/--- Stable REN Redes Energeticas (RENEPL): Marketweight 0.5%Following the downgrade of the state of Portugal by S&P by two notches to A-, S&P also downgraded RENEPL by two notches to A-, having a negative outlook on the name. The rating action reflects the ownership structure, with Portugal holding 51% of the company. Further negative rating actions at the government level would immediately result in lower ratings at RENEPL. For FY09, the company reported solid figures. However, given the huge capex program, net debt increased and the credit profile slightly weakened during FY09. As capex in FY10 will be close to the level of FY09, net debt should continue to increase, reaching a level of up to EUR 2.8bn-2.9bn by FYE14, with a leverage of 4.8x by FYE14. For FY09, we calculate net debt to EBITDA of 5.7x (FY08: 5.4x) on a reported basis. In September, the RENEPL 13 performed in line with the iBoxx Utilities. Bonds trade at fair values.
--/A+s/-- Weakening RTE EDF Transport SA (RTE): Marketweight 2.1%RTE, a 100% subsidiary of EDF, owns and operates the French transmission grid, which is by far the largest transmission network in Europe (100,000 km). S&P put the AA- rating of RTE on watch negative. This rating action reflects the negative impact of the new TURP 3 regulation on the financial profile of RTE. The new regulation is valid for the period 1 August 2009 to 31 July 2013 and will lead to weaker profitability, while on other hand huge capex obligations will increase leverage. In any case, the business profile could benefit from a more predictable regulatory framework. On a relative value basis, current pricing of RTE bonds appears fair (but not attractive), if compared to those of parent company EDF and those of other grid companies (e.g., REDELE, RENEPL).
A2n/An/A+s Weakening RWE (RWE): Marketweight 7.5%In 1H10, revenues of RWE increased by 9.8% yoy to EUR 14.5bn, while EBITDA surged by 21.9% to EUR 6,150mn (7% above UniCredit estimate). We note that around half of the total EBITDA increase was related to consolidation effects (Essent). FFO rose by 51% yoy to EUR 4.0 bn, but free cash flow was negative, affected by dividend payments (EUR 2.0bn) and continuing high capex of EUR 2.6bn. Net debt (as adjusted by the company) consequently went up by EUR 4.0bn to EUR 29.8bn, also influenced by higher provisions on pensions and nuclear waste disposal (change in interest rate). We calculate an FFO to net debt ratio of 25%, which is still above the 23% achieved in FY09. We regard the 1H earnings news as credit positive but we have concerns regarding the impact of nuclear regulation in Germany on the credit profile. There is huge rating pressure on the name, especially if Germany introduces a nuclear fuel tax in 2011. RWE CDS and cash bonds are already trading at a weak single A level. We therefore keep our marketweight recommendation despite the heightened downgrade risk.
A3s/A-s/An Weakening Scottish & Southern Energy (SSELN): Marketweight 0.7%Scottish & Southern reported slightly improved key figures for FY09/10 (ending 31 March). Adj. profit before tax increased by 2.9% yoy to GBP 1.29bn, reflecting improved performance across all major activities (generation, networks, retail). Around 37% of adj. PBT stems from regulated activities. Total capex of GBP 1.31bn had been in line with the 5Y investment plan of GBP 6.7bn until 2013, and brought net debt to GBP 5.3bn, up from GBP 4.8bn a year earlier. This results in a net debt/EBITDA ratio of 2.9x. Given the previously released capex plan, the increase in net debt does not come unexpected. As S&P had already lowered the rating in August 2009 following a deterioration in credit ratios, we assume the current financial headroom to be big enough to digest the increase in debt. In order to stabilize its credit ratios, the company issued a hybrid bond in September 2010. We still have some concerns about potential M&A risk, and the very ambitious capex plan of SSE. However, given the increased financial headroom following the hybrid issued, we change our recommendation from underweight to marketweight. The SSELN 07/13 outperformed the index in the past few weeks, and is trading at levels of around 70bp.
Baa1s/BBB-s/--- Stable Severn Trent Water Utilities Finance PLC (SEVTRE): No recommendation (event-driven coverage) 0.5%S&P downgraded Severn Trent by one notch too BBB+ with a stable outlook. This comes as no surprise. Following the initial announcement in July by British regulator Ofwat (Office of Water Services) regarding the conditions for the next regulatory period AMP5 (starting in April 2010), S&P had put the ratings of Severn Trent on watch negative (together with Sutton and East Surrey Water PLC and United Utilities. The rating agency viewed the proposal as more challenging than the conditions in the current period (AMP4) and the issuers affected by the rating action have the lowest financial headroom of all UK water utilities. The SEVTRE 03/16 bond trades at fair levels.
Baa1s/A-n/BBB+s Stable Statkraft (STATK): Marketweight 1.1%Statkraft released weaker 2Q10 results, but in line with its 2010 guidance, with earnings remaining at the prior-year level. In 2Q10, net revenues of the Norwegian power generator rose by 49% yoy to NOK 4.5bn, whereas underlying EBITDA was NOK 1,751mn, a 14% decrease versus 2Q09. On a six-month basis, underlying EBITDA was NOK 7,884mn in 1H10, still up by 18% (NOK 1,230mn) yoy. The company still benefits from relatively high prices in the Nordic region, which, however, have started to erode in 2Q. Production in 1H10 was stable yoy. Cash flow generation strongly improved in the first six months of 2010 (e.g., FFO up by 74% yoy to NOK 7,441mn). Net debt therefore decreased to NOK 30.9bn, down from NOK 39.0bn at YE09. This leads to an FFO to net debt ratio of 35%, well above rating agencies' requirements (e.g., Moody's expects this ratio to stay in the high teens/twenties). Bonds have performed quite well in the last few weeks, but we still regard spreads as attractive (bonds are still trading at a premium, no negative sovereign influence, growing diversification of activities will reduce cash flow volatility).
A3n/--/-- Improving Suez Environnement (SEVFP): Marketweight 2.5%Suez Environnement released improved 1H10 figures, beating expectations. EBITDA was EUR 1,042mn, representing a 9.6% increase yoy (+7.2% at constant FX rates) and beating UniCredit forecast of EUR 1,026mn. Growth was achieved in international activities and the European waste business, but profitability also benefited from cost efficiency measures. Reported net debt amounted to EUR 8.3bn versus EUR 6.3bn at YE09, leading to weaker credit ratios. The deterioration is due to the closing of the Agbar takeover, and FX effects. Although the leverage ratio is now highly above the target of 3.0x, we do not expect any further rating pressure, as Moody's already had reacted to the Agbar purchase on its announcement in October 2009 (which increased the group's share from 45.9% to 75%) and put the rating on negative outlook. The group wants to achieve a debt/EBITDA ratio of 3.0x again by 2012. EBITDA in 2010 is to grow at 9% (at constant forex), and a expected free cash flow of EUR 0.7bn should reduce the debt position. SEVFP bonds trade at fair levels. In order to stabilize its credit ratios, the company issued a hybrid bond in September 2010.
5 October 2010
5 October 2010 Credit Research
Euro Credit Pilot
UniCredit Research page 40 See last pages for disclaimer.
Current Ratings (Moody's/S&P/Fitch)
Credit Profile
Name (Ticker): Recommendation Weight in iBoxxComment Utilities sector
A3s/A-wn/A-n Weakening TenneT Holding B.V. (TENN): Marketweight 0.9%TenneT is the electricity transmission systems operator (TSO) in the Netherlands, and 100% government-owned. The company recently bought the German High-Voltage grid of E.ON (transpower) for EUR 885mn. The group enjoys a very stable business profile with stable cash-flows from its regulated activities. These strengths are offset by an expected high leverage following the purchase of the German assets, and the realization of the EUR 2.1bn investment program for the three years 2010-2012. Nevertheless, the company managed to stabilize its ratings, as part of the funding (EUR 0.5bn out of a total EUR 1.5bn in bond issues in 02/2010) had been realized via a hybrid issue. The new TenneT bonds have performed quite well since issuance, but trade at fair values.
--/--/A-s Stable Teollisuuden Voima Oyi (TVO) (TVO): No recommendation (event-driven coverage) 0.5%TVO is a Finnish nuclear operator that generates electricity at cost for its shareholders. The largest shareholder with a 58% stake is PVO, which itself is a power generator and owned by a consortium of Finnish industrials, municipal utilities and Fortum. TVO operates two nuclear power plants (OL1 & OL2 with 860 MW capacity each) and a smaller coal-fired plant. A third plant (OL3) with 1,600 MW is currently under construction and shall start operations by 2012. TVO has very low operating cost production (EUR 15.9/MWh in 2008), which compares favorably with the average price in Nord Pool (EUR 45/MWh in 2008). Credit ratios are weak as cash flow generation is limited and capex is very high due to the construction of OL3. Free cash flow consequently was a negative EUR 560mn in 2008, whereas FFO was just EUR 20mn. However, the figures are not very meaningful due to the full-cost pass-through mechanism. If any of the offtakers defaults, electricity could be sold at favorable prices at Nord Pool. Fitch assigns an A- rating to TVO, also due to the absence of dividend payments and M&A risk. The company issued a 7Y bond in June.
A2s/A+s/As Stable Terna (TRNIM): Marketweight 1.3%Terna reported 1H10 results beating UniCredit's forecast. 1H10 revenues were up by 14% yoy to EUR 761mn, supported by the higher tariffs charged for electricity transmission. Furthermore, the consolidation of Enel's transmission grid contributed to top-line growth. EBITDA improved by 12% yoy to EUR 569mn. FFO was 2.7% lower in 1H10 at EUR 390mn. Operating cash flow was only EUR 213mn, affected by huge swings in working capital (of which around EUR 140mn is permanent). Management provided a positive outlook for the rest of FY10, also driven by a recovery in energy demand, which is likely to continue (growth in electricity demand in Italy was +1.9% in 1H10). EBITDA is expected to show similar growth rates in 2H10 as during the first six months of the year. For the current year, we expect ratings stability. For 1H10, we calculate adj. net debt to EBITDA of 4.3x (YE09: 3.9x) and adj. FFO to net debt of 24.7% (29%), which is still fully commensurate with the current rating category. We recently changed our recommendation to marketweight from underweight given strong resilience to any volatility in the sovereign CDS and the stable nature of the business. (3Q10 results: 10 November)
A3s/--/--- Stable Thames Water Utilities (THAMES): No recommendation (event-driven coverage) 0.3%Thames Water Utilities (TWU) is the largest regulated water and sewerage company in the UK. The group's operating area is Greater London and the Thames Valley. The UK water sector benefits from a stable and transparent regulatory framework and limited exposure to competition. The EUR 500mn bond issued in February 2009 by Thames Water Utilities Cayman Finance Ltd. is guaranteed by Thames Water Utilities Finance Ltd. and Thames Water Utilities Ltd. These three companies are ringfenced from the rest of the group.
Aa2s/AAn/--- Stable Tokyo Electric Power (TOKELP): No recommendation (event-driven coverage) 0.6%Tokyo Electric Power is the largest electric power utility in Japan, supplying about one-third of the country's total electricity. It operates mainly in the Kanto region, Japan's largest economic zone, which includes the Tokyo metropolitan area. The company's core business is the electric power business, which includes electricity generation, transmission and distribution activities. Other strategic businesses are: 1. Information and Telecommunications, including telecommunication and data processing services, software development and maintenance and CATV broadcasting, 2. Energy and Environment: includes facility construction and maintenance, supply and shipping of gas and materials, equipment and energy and environment solutions, 3. Living Environment and Lifestyle-Related business: Real estate and property management and services; 4. Overseas Business, which includes power plant projects. We note as positive that the company started to generate electricity at the Kashiwazaki-Kariwa Nuclear Power Station in May 2009. The power plant had been shut down due to an earthquake in 2007, eventually leading to operating losses in the last two years.
A3s/BBB+s/BBB+s Stable United Utilities Water PLC (UU): Marketweight 0.3%As expected, S&P lowered the rating on United Utilities Water by one notch from A-wn to BBB+, but with a stable outlook. At the same time, the rating on the holding company United Utilities Plc was also downgraded by two notches to BBB- stable. The rating action follows the assessment of UU's draft business plan for the next regulatory period between 1 April 2010 and 31 March 2015 (asset management period 5, or AMP5). The rating action comes as no surprise, and was more or less announced by UU's management in the recent conference call. We still assume that the company should be able to keep its FFO/net debt ratio above the old S&P requirement of 13% (ratio was 15.2% at the end of September 2009). Nevertheless, the rating agency has changed its adjustment methodology and now expects this ratio to be in the range of 10%-11% for the upcoming regulatory period. UU spreads are trading at tight levels, but should discount all risks.
A2s/An/An Weakening Vattenfall (VATFAL): Overweight 4.9%Vattenfall released improved 2Q10 figures. Sales increased by 18% yoy to SEK 49.7bn, whereas reported EBIT was SEK 9.0bn, +52% yoy. Main drivers were the company's nuclear power plants, the Nordic hydro plants and the trading business of the newly acquired Dutch utility Nuon. These improvements offset the weak performance of the first quarter, which was primarily related to impairments on the sold German transmission grid. Credit ratios have improved versus 1Q10, and are now very close to the thresholds set by the agencies. The ratio of FFO/net debt adj. at the end of 2Q10 was 19.4% versus 13.8% at the end of March (YE09: 19.5%). Management is not satisfied with the current profitability, especially with the RoE of just 8.7% in 1H10 versus a target of 15%. The CMD in September has brought no big announcement with regards to asset disposals but it is clear that all subsidiaries outside the newly-defined core markets Sweden, Germany and the Netherlands are under scrutiny. Given stabilized cash flow generation, the improved credit metrics and very likely asset disposal, which could lead to a further improvement of the company's credit profile, we continue to regard current spread levels as attractive.
5 October 2010
5 October 2010 Credit Research
Euro Credit Pilot
UniCredit Research page 41 See last pages for disclaimer.
Current Ratings (Moody's/S&P/Fitch)
Credit Profile
Name (Ticker): Recommendation Weight in iBoxxComment Utilities sector
A3n/BBB+s/A-s Stable Veolia Environnement (VIEFP): Marketweight 5.9%Veolia published a solid set of 1H10 figures, only slightly below expectations. Furthermore, the company affirmed its targets for FY10. Revenues decreased by 1.2% yoy to EUR 17.2bn, whereas EBITDA (which the company calls operating cash flow) improved by 2.7% yoy to EUR 1,885mn. Earnings benefited from the higher recycled material prices, positively affecting the Environmental Division and the implemented efficiency plan, contributing cost savings of EUR 43mn. EBITDA in Veolia's second largest segment Water (EUR 788mn) declined by 4.4% yoy, inter alia due to the end of a contract with the city of Paris. Free cash flow in 1H10 was negative, resulting in a higher net debt of EUR 16.9bn vs. FYE09 (EUR 15.5bn) but also includes a negative effect from FX of EUR 674mn. The group confirmed its objectives for 2010: (1) To generate free cash flow after payment of recurring dividend, and (2) To achieve growth in recurrent operating income, (3) To realize cost reductions of EUR 250mn and to pursue an asset disposal program of EUR 3bn for the period 2009-2011. Additionally, Veolia affirmed its target to keep the net debt to operating cash flow ratio (before changes in working capital and principal payments on operating financial assets) in a range of between 3.5x and 4.0x (FY09: 3.4x). Veolia bonds trade at fair value.
A2n/A-s/--- Weakening VERBUND-International Finance BV (VERBND): Overweight 1.2%S&P has confirmed the rating of Austrian utility Verbund (A2n/A-s/--), also revising the outlook to stable from negative. This reflects the expectation that Verbund's operating performance and cash generation from its operating activities should improve in 2011. The agency also acknowledges that management is willing to reduce Verbund's financial leverage and improve credit metrics. S&P also indicated that the rating action was triggered by the decision of the Austrian government to participate in the EUR 1.0bn capital increase. The Republic of Austria holds a 51%-stake in the company and is required by law to keep a majority. This news confirms the positive trend in the company's credit profile. For 2Q10, we calculate adj. FFO/net debt of 19%. With the capital increase now to be realized, we expect this ratio to be clearly above the 20% threshold set by S&P at YE10. In addition to the planned capital increase, the financial profile of Verbund should also benefit from the potential sale of 330 MW of generation capacity (currently, there are talks between Verbund and its 13% shareholder Wien Energie regarding the purchase of four power plants). We continue to regard current spread levels as attractive. (3Q10 results: 28 October)
Christian Kleindienst (UniCredit Bank) +49 89 378-12650 [email protected] Susanne Reichhuber (UniCredit Bank) +49 89 378-13247 [email protected]
5 October 2010
5 October 2010 Credit Research
Euro Credit Pilot
UniCredit Research page 42 See last pages for disclaimer.
Oil & Gas (Overweight) Sector key figures Sector Wrap-Up Weight in iBoxx NFI: Current ASW spread: change mom/YTD: Euro STOXX OIG YTD:
7.3% 97.6bp +0.0/+11.1 -8.3%
Sector drivers: Although spreads are impacted by political risks, the recently rising oil and gas prices support the companies. In particular large issuers with global activities (e.g., Total) are able to offset political risks by geographic diversification of operations. Credit profiles of all companies will improve in the coming quarters if oil prices continue to rise. Moreover, the companies gained strong financial reserves in the past two years. If an IG-rated oil company refrains from excessive shareholder remuneration or large and risky debt-financed acquisitions, it has good chances of keeping its rating. Last month's recap: In September, spreads in the Oil & Gas sector tightened by 7bp on average. This was influenced by a strong performance of Gazprom and BP bonds, partially offset by continuing pressure on Southern European names (e.g., Repsol).
Current Ratings (Moody's/S&P/Fitch)
Credit Profile
Name (Ticker): Recommendation Weight in iBoxxComment Oil & Gas sector
A2s/As/A+s Stable BG Energy Holdings (BGGRP): Marketweight 2.6%BG Group plc, the parent company of BG Energy Holdings, released improved 1H10 figures, above expectations. (Underlying) operating profit in 2Q rose by 6% yoy to USD 1,532mn (market consensus: USD 1,252mn). The group strongly benefited from its LNG business, whereas the OP in the E&P segment was relatively flat. Production volumes in the E&P business fell by 2% in the second quarter. Cash-flow generation was strong in 2Q10, but net debt increased from USD 4.8bn at YE09 to USD 5.0bn. The two EUR-denominated bonds issued by BG Energy Holdings are trading at fair levels.
A2s/As/As Weakening BP (BPLN): Marketweight 2.1%In September, all rating agencies withdrew their respective rating of BP from creditwatch status. Fitch even upgraded the rating by three notches from BBB (where it had been put in June 2010) to As. Rating actions were influenced by the progress BP made in stopping the oil spill. The well was finally sealed on 20 September. In July, BP had released very weak figures for 2Q10, strongly below expectations, and influenced by a USD 32.2bn charge related to the Gulf of Mexico oil spill. Net sales in the second quarter have surged by 35% yoy to USD 73.8bn, while increasing qoq by just 0.9%. EBIT was a negative USD 24.1bn versus USD 7.1bn in 2Q09 (1Q10: USD 9.6bn). Reported production for the quarter was 3,846 kboe/d versus 4,010 kboe/d in 1Q10. Net debt is now at USD 23.2bn versus USD 26.2bn at YE09. The group intends to reduce net debt to USD 10-15bn within the next 18 months. The current cash position is USD 7.3bn. The BP 11/12 bonds showed a strong performance in the past few weeks. We assume that current levels should discount for most uncertainties.
Aa2n/A+s/AA-n Stable Eni (ENIIM): Marketweight 17.3%Moody's downgraded Eni by one notch to Aa3 from Aa2, with a stable outlook. The downgrade reflects Moody's expectation that the deleveraging process initiated by management and the recovery in the group's credit metrics will be gradual and unlikely to restore sufficient headroom to help underpin its BCA (baseline credit assessment = stand-alone rating) within the Aa range. Consequently, the BCA has been downgraded to an A1 level. Moody's still grants a one-notch upgrade to the rating for potential government support (rating of Italy is Aa2s/A+s/AA-s). Given Eni's strong cash-flow generation in the second quarter, this rating action comes as a surprise. However, Moody's rating is still one notch above the S&P rating. In 2Q10, the ratio RCF/net debt (adj.) improved to 41% from 27% at YE09, above the old Moody's requirement (40%). The new Moody's requirement for this ratio is in the mid-thirties, and we do not see any difficulties for the company to meet this hurdle. We like the name and see some recovery in its credit profile. Eni bonds trade at fair levels.
Baa1s/BBBs/BBBs Improving Gazprom (GAZPRU): Overweight 13.9%Gazprom increased this year's investment program by approx. 13% vs. its previous guidance to RUB 905.2bn (thereof RUB 751.8bn in capex) to cover "key" transportation projects and developments in Russia's east (i.e., spending on the Kirinsky field, Zapolyarnoye as well as increased investment for gas transportation projects). We now expect a maximum leverage of 1.2x (in terms of net debt/EBITDA) by YE10. The company guidance is 1.0x or slightly higher. Given this trend, we regard the rating as quite stable (the rating is linked to the sovereign anyway). Gazprom bonds have tightened in the past few weeks, but still trade at attractive levels.
A3s/--/A-s Stable OMV (OMV): Marketweight 3.3%OMV released sound 2Q10 figures, above expectations, influenced by a higher oil price, a stronger USD, but also improved refining margins. Sales increased by 39% yoy to EUR 5,730mn. Clean EBIT was EUR 706mn, 145% above the prior-year level, and clearly above UniCredit expectations (EUR 651mn). FFO in 2Q10 was a strong EUR 580mn versus just EUR 417mn a year before. Despite dividend payments of EUR 0.3bn, free cash flow was positive, and net debt consequently fell from EUR 3.2bn at FYE09 to EUR 3.1bn. Credit ratios therefore improved. The ratio of FFO to net debt (adj.) stood at 63% versus 48% at YE09. RCF to net debt is 55%, well above Moody's requirement for this ratio (low 30s). We expect the ratio of RCF/net debt to fluctuate around 40% in 2010, which is fully in line with Moody's requirement for the rating (low 30s). Our calculation takes into account that free cash flow is likely to be negative in 2010 at around EUR 0.5-0.7bn, and that margins remain volatile. OMV bonds trade at fair levels and performed in line with the index in the past few weeks.
Baa1s/--/--- Weakening Pemex Project Funding Master Trust (PEMEX): No recommendation (event-driven coverage) 7.0%Pemex (Petroleos Mexicanos) is the largest company in Mexico. The company has a monopoly status in the Mexican petroleum industry, and has fully integrated operations. It is also the leading crude oil exporter to the US (over 50% of its crude production is exported). Pemex still has sizable hydrocarbon reserves but the reserve replacement rate is very poor. The Mexican government wants to substantially increase the reserve replacement, potentially with the help of foreign oil companies. The company is 100% owned by the Mexican Federation and its rating is directly linked to that of the sovereign (also due to its significant contribution to government revenue). In September 2010, the company withdrew its rating at S&P (BBBs) and Fitch (BBBs), only keeping the Baa1 Moody's rating.
5 October 2010
5 October 2010 Credit Research
Euro Credit Pilot
UniCredit Research page 43 See last pages for disclaimer.
Current Ratings (Moody's/S&P/Fitch)
Credit Profile
Name (Ticker): Recommendation Weight in iBoxxComment Oil & Gas sector
Baa1n/BBBs/BBB+s Improving Repsol YPF (REPSM): Marketweight 8.4%Repsol successfully carried out the capital increase of its subsidiary Repsol Brazil. Chinese Sinopec agreed to pay USD 7.1bn for a 40% stake in the unit, which holds stakes in the newly-discovered pre-salt Tupi field (which may contain up to 8bn barrels of crude, according to co-owner Petrobras). Following the agreement with Sinopec, there is no need for an IPO of the Brazilian unit anymore. S&P published a note on Repsol confirming its rating (with Repsol's share in the proceeds at around USD 4.2bn). Although the agency admitted that the transaction is credit positive, it refrained from any positive rating actions but did not exclude such in the future. Repsol bonds slightly underperformed the index in the past few weeks but still trade at fair levels.
A1s/A+s/-- Improving Schlumberger (SLB): No recommendation (event-driven coverage) 3.2%Schlumberger N.V./Schlumberger Limited, incorporated in the Netherlands Antilles, is the biggest oilfield service company in the world. The group also has principal executive offices in the US (Houston, Texas) and Europe (Paris, The Hague). SLB operates two business segments (1) Oilfield Services (OFS), which supplies a wide range of technology services and solutions to the international petroleum industry in four market areas: North America, Latin America, Europe/CIS/Africa, Middle East & Asia; (2) Western Geco is the world's largest seismic company (reservoir imaging, monitoring and development services). In 2010, Schlumberger announced the takeover of its competitor Smith International Inc. (non-cash offer, purchase price of USD 11bn to be paid from the issuance of new shares).
Aa1s/AA+s/AA+s Improving Shell International (RDSALN): Marketweight 20.5%Shell's 2Q10 figures were strong, impacted by the higher oil price, and beat market expectations. Sales increased by 42% yoy to USD 90.6bn, whereas clean operating profit (CCS earnings) rose by 94% yoy to USD 4.6bn. Earnings were primarily influenced by higher oil prices and slightly improved production in the upstream business. There was also a positive earnings trend in the downstream segment, showing CCS earnings of USD 1.3bn in the second quarter after a loss in 2Q09. The segment benefited from stronger industry-wide refining margins, and improved conditions in the chemical business. Net debt increased to USD 28.3bn versus USD 25.3bn at YE09, due to continuing high capex. Shell bonds have slightly tightened in the past few weeks, in line with the index. Current levels still appear fair.
Aa2s/AA-s/--- Improving StatoilHydro (STOIL): Marketweight 5.8%StatoilHydro released sound 2Q10 results, however still below expectations. Revenues in 2Q rose by 23% yoy to NOK 129bn, whereas clean EBIT was 25% higher yoy at NOK 36.4bn (consensus of NOK 37.1bn). The increase was mainly due to a strong performance of the domestic E&P division, benefiting from higher crude prices as well as higher production. The company had a net debt position of NOK 85bn versus NOK 76bn at FYE09, hence financial ratios should still be in line with the rating. Production in 2Q10 increased by 4% yoy to 1,725 mboe/d. Management confirmed the production outlook for 2010 (production is to be at levels of 1,950 +/-15 mboe/d). The group benefits from a strong business profile and high support from the Kingdom of Norway. STOIL bonds trade at tight but fair levels.
Aa1s/AAn/AAs Weakening Total (TOTAL): Overweight 14.4%Total reported stronger 2Q10 results above expectations. Adj. operating profit was EUR 5,326mn, up by 85% yoy and beating UniCredit expectations of EUR 4,853mn. Earnings benefited from higher price levels (Total's average realized hydrocarbon price was up 24% to USD 54.8/boe). Upstream production also improved by 8% yoy to 2,359 kboe/d, benefiting from a higher contribution of the six start-ups announced in 2009 and recent acquisitions (UTS in Canada). Credit ratios are still strong, also benefiting from higher cash flow generation. Net debt increased to EUR 15.3bn from EUR 14.6bn at YE09. FFO to net debt (adj.) stood at 84% (YE09: 75%). Credit metrics and operational ratios are still commensurate with a AA rating level. Bond spreads (as well as CDS) of Total are trading in line with those of peers. However, we still prefer the French name due to its operational excellence. Total bonds outperformed the index in the past few weeks and we still regard current spreads as attractive.
Baa1s/BBBs/-- Weakening Transneft (TNEFT): Marketweight 1.5%Transneft released improved 1H10 results, benefiting from tariff indexation. Sales increased by 25% yoy to RUB 208bn, whereas EBITDA rose only by 6.1% to RUB 110bn, reflecting higher payments for using railway transport. Cash flow generation also improved. FFO in 1H10 was RUB 119bn, a 75% increase yoy. Net debt slightly increased from RUB 270bn at FYE09 to RUB 289bn, also due to currency effects. The ratio of FFO to net debt stands at 51% (YE08: 43%), which is strong for the rating. Credit ratios of Transneft might weaken due to further investments and higher operating costs related to the ESPO project, but this is already reflected in current ratings. Transneft is likely to benefit from higher transit fees (e.g., +3.5% from 1 July 2010), but the high investment levels are likely to persist for the next few years. The TNEFT 06/12 trades at fair levels.
Christian Kleindienst (UniCredit Bank) +49 89 378-12650 [email protected]
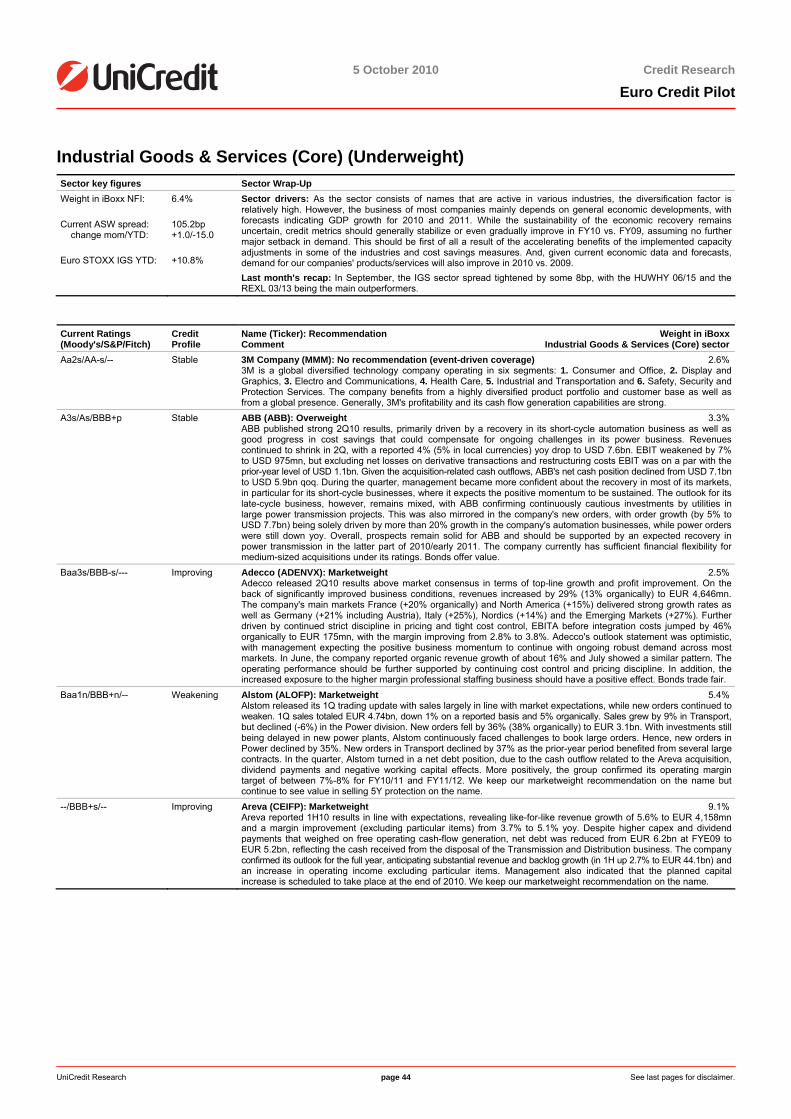
5 October 2010
5 October 2010 Credit Research
Euro Credit Pilot
UniCredit Research page 44 See last pages for disclaimer.
Industrial Goods & Services (Core) (Underweight) Sector key figures Sector Wrap-Up Weight in iBoxx NFI: Current ASW spread: change mom/YTD: Euro STOXX IGS YTD:
6.4% 105.2bp +1.0/-15.0 +10.8%
Sector drivers: As the sector consists of names that are active in various industries, the diversification factor is relatively high. However, the business of most companies mainly depends on general economic developments, with forecasts indicating GDP growth for 2010 and 2011. While the sustainability of the economic recovery remains uncertain, credit metrics should generally stabilize or even gradually improve in FY10 vs. FY09, assuming no further major setback in demand. This should be first of all a result of the accelerating benefits of the implemented capacity adjustments in some of the industries and cost savings measures. And, given current economic data and forecasts, demand for our companies' products/services will also improve in 2010 vs. 2009. Last month's recap: In September, the IGS sector spread tightened by some 8bp, with the HUWHY 06/15 and the REXL 03/13 being the main outperformers.
Current Ratings (Moody's/S&P/Fitch)
Credit Profile
Name (Ticker): Recommendation Weight in iBoxxComment Industrial Goods & Services (Core) sector
Aa2s/AA-s/-- Stable 3M Company (MMM): No recommendation (event-driven coverage) 2.6%3M is a global diversified technology company operating in six segments: 1. Consumer and Office, 2. Display and Graphics, 3. Electro and Communications, 4. Health Care, 5. Industrial and Transportation and 6. Safety, Security and Protection Services. The company benefits from a highly diversified product portfolio and customer base as well as from a global presence. Generally, 3M's profitability and its cash flow generation capabilities are strong.
A3s/As/BBB+p Stable ABB (ABB): Overweight 3.3%ABB published strong 2Q10 results, primarily driven by a recovery in its short-cycle automation business as well as good progress in cost savings that could compensate for ongoing challenges in its power business. Revenues continued to shrink in 2Q, with a reported 4% (5% in local currencies) yoy drop to USD 7.6bn. EBIT weakened by 7% to USD 975mn, but excluding net losses on derivative transactions and restructuring costs EBIT was on a par with the prior-year level of USD 1.1bn. Given the acquisition-related cash outflows, ABB's net cash position declined from USD 7.1bn to USD 5.9bn qoq. During the quarter, management became more confident about the recovery in most of its markets, in particular for its short-cycle businesses, where it expects the positive momentum to be sustained. The outlook for its late-cycle business, however, remains mixed, with ABB confirming continuously cautious investments by utilities in large power transmission projects. This was also mirrored in the company's new orders, with order growth (by 5% to USD 7.7bn) being solely driven by more than 20% growth in the company's automation businesses, while power orders were still down yoy. Overall, prospects remain solid for ABB and should be supported by an expected recovery in power transmission in the latter part of 2010/early 2011. The company currently has sufficient financial flexibility for medium-sized acquisitions under its ratings. Bonds offer value.
Baa3s/BBB-s/--- Improving Adecco (ADENVX): Marketweight 2.5%Adecco released 2Q10 results above market consensus in terms of top-line growth and profit improvement. On the back of significantly improved business conditions, revenues increased by 29% (13% organically) to EUR 4,646mn. The company's main markets France (+20% organically) and North America (+15%) delivered strong growth rates as well as Germany (+21% including Austria), Italy (+25%), Nordics (+14%) and the Emerging Markets (+27%). Further driven by continued strict discipline in pricing and tight cost control, EBITA before integration costs jumped by 46% organically to EUR 175mn, with the margin improving from 2.8% to 3.8%. Adecco's outlook statement was optimistic, with management expecting the positive business momentum to continue with ongoing robust demand across most markets. In June, the company reported organic revenue growth of about 16% and July showed a similar pattern. The operating performance should be further supported by continuing cost control and pricing discipline. In addition, the increased exposure to the higher margin professional staffing business should have a positive effect. Bonds trade fair.
Baa1n/BBB+n/-- Weakening Alstom (ALOFP): Marketweight 5.4%Alstom released its 1Q trading update with sales largely in line with market expectations, while new orders continued to weaken. 1Q sales totaled EUR 4.74bn, down 1% on a reported basis and 5% organically. Sales grew by 9% in Transport, but declined (-6%) in the Power division. New orders fell by 36% (38% organically) to EUR 3.1bn. With investments still being delayed in new power plants, Alstom continuously faced challenges to book large orders. Hence, new orders in Power declined by 35%. New orders in Transport declined by 37% as the prior-year period benefited from several large contracts. In the quarter, Alstom turned in a net debt position, due to the cash outflow related to the Areva acquisition, dividend payments and negative working capital effects. More positively, the group confirmed its operating margin target of between 7%-8% for FY10/11 and FY11/12. We keep our marketweight recommendation on the name but continue to see value in selling 5Y protection on the name.
--/BBB+s/-- Improving Areva (CEIFP): Marketweight 9.1%Areva reported 1H10 results in line with expectations, revealing like-for-like revenue growth of 5.6% to EUR 4,158mn and a margin improvement (excluding particular items) from 3.7% to 5.1% yoy. Despite higher capex and dividend payments that weighed on free operating cash-flow generation, net debt was reduced from EUR 6.2bn at FYE09 to EUR 5.2bn, reflecting the cash received from the disposal of the Transmission and Distribution business. The company confirmed its outlook for the full year, anticipating substantial revenue and backlog growth (in 1H up 2.7% to EUR 44.1bn) and an increase in operating income excluding particular items. Management also indicated that the planned capital increase is scheduled to take place at the end of 2010. We keep our marketweight recommendation on the name.

5 October 2010
5 October 2010 Credit Research
Euro Credit Pilot
UniCredit Research page 45 See last pages for disclaimer.
Current Ratings (Moody's/S&P/Fitch)
Credit Profile
Name (Ticker): Recommendation Weight in iBoxxComment Industrial Goods & Services (Core) sector
A3s/A-s/-- Stable Atlas Copco AB (ATCOA): Overweight 1.5%Atlas Copco released strong 2Q results. Driven by higher volumes and a slightly positive price effect, revenues advanced by 9% organically yoy to SEK 17,430mn. Operating profit even jumped by 50% (adjusted for the restructuring costs included in the prior year) to SEK 3,499mn, with the margin at a record 20.1% (vs. 14.4% adjusted in 2Q09). The strong improvement was mainly a result of the implemented cost reductions and efficiency measures during the crisis and was also supported by positive exchange rate, volume, price and sales mix effects. Credit metrics benefited from the strong profitability improvements, with adj. FFO to net debt at 70% (44% at 2Q09 and 57% at FYE09). In the short-term, Atlas Copco forecasts demand for its products and services to improve somewhat on the back of favorable demand in emerging markets and a gradual increase in North America and parts of Europe. In 2Q, the positive demand trend continued in all major regions and most customer segments. In total, new orders were up 33% organically (albeit compared to a still low prior basis) to SEK 19,221mn. Going forward, Atlas should continue to benefit from its adjusted cost base in a more favorable market environment. That said, the company's current financial profile is well above S&P's requirements (i.e., adjusted FFO to net debt above the 40% level) for the A- rating level, hence providing it with enhanced financial flexibility under its ratings for increased M&A activities and potentially increased shareholder remuneration. Bonds offer value.
A2n/As/As Improving Caterpillar (CAT): Underweight 1.2%2Q10 credit metrics improved further (LTM1H10 industrial net debt/EBITDA of 4.4x) and the company improved its 2010 guidance by raising the sales and revenue range and increasing profit expectations. Sales and revenues are now expected to be in a range of USD 39-42bn (previously: USD 38-42bn), with a midpoint of USD 40.5bn. The increased 2010 profit outlook is in a range of USD 3.15-3.85 per share (previously: USD 2.5-3.25). The company expects to increase production in 2H10 and is very positive about the longer-term prospects for many of the industries it serves (like mining, energy, infrastructure, electric power and rail). The announced strategic initiatives include the acquisition of Electro-Motive Diesel (EMD), which has the largest installed base of diesel-electric locomotives in the world, for USD 820mn. S&P noted that should the company demonstrate a lack of notable progress in credit metrics in 2010, e.g., EBITA/interest <3x, Debt/EBITDA >4x and FCF USD <2bn, a rating downgrade is likely. We do not see relative value in the CAT Eurobonds, although the necessary improvement to keep current ratings has continued (3Q10 results: 21 October).
A2s/A+s/--- Stable Danaher (DHR): No recommendation (event-driven coverage) 1.2%US-based Danaher is a diversified manufacturing company that designs, manufactures and markets professional instrumentation, industrial technologies and tools and components. The company has a strong free cash flow generation capability, but we also note the high level of event risk associated with its willingness to drive growth through debt-financed acquisitions.
Baa1/BBB+/--- Stable Experian (EXPNLN): Marketweight 1.2%Experian is a leading consumer credit reporting agency present in more than 65 countries. It provides data-based credit services (42% of sales), interactive services (25%), marketing solutions (20%), and decision analytics (13%), enabling its customers to prevent defaults, target marketing offers and automate decision making. The company, which had sales of USD 3.9bn as of FYE08/09, shows solid growth rates in the mid-single-digit range, especially in Latin America (12% of sales) and EMEA/Asia-Pacific (11%), while its operations in North America (55%) and the UK (22%) currently see declining growth rates. Experian boasts solid EBITDA margins in the mid-to-high twenties and generates strong free cash flow as a result of limited capex needs for its IP-driven business. We note that the majority of total assets (USD 6.1bn) comprises intangibles (goodwill USD 3.1bn, others USD 1.2bn), which more than offset equity of USD 1.9bn. Its rating could come under pressure if FFO to debt were to fall below 30% (43% by FYE08/09) as a result of accelerating M&A activity or if market conditions were to worsen. Bonds trade fair in our view.
A3cwn/A-cwn/A-s Stable Hutchison Whampoa (HUWHY): No recommendation (event-driven coverage) 9.8%Hong-Kong based Hutchison Whampoa is an industrial conglomerate with holdings ranging from some of the world's biggest port operators and retailers to property development and infrastructure to telecommunication operators. Hutchison is 49.9% owned by Cheung Kong Holdings, which, in turn, is 37% owned by a family trust of Mr. Li Ka-shing. The company's core businesses include ports and related services, property and hotels, retails, energy, infrastructure, investments and others, and telecommunication. In FY09, Hutchison generated revenues of HKD 300.5bn and an EBIT from established businesses of HKD 48.3bn. The company's operating performance continues, albeit at a slower pace, to be burdened by the weak performance of its third-generation (3G) operations (loss of HKD 5.3bn in FY09).
A1s/A+s/-- Stable Illinois Tool Works (ITW): No recommendation (event-driven coverage) 1.9%Illinois Tool Works is a diversified manufacturer of advanced industrial technology. It designs and produces an array of highly engineered fasteners and components, equipment and consumable systems, and specialty products and equipment for customers around the world. We note the company's relatively large exposure to cyclical end-markets (i.e., construction, automotive and general industrial).
A2s/As/-- Improving John Deere (DE): Marketweight 1.6%LTM 9M09/10 industrial net debt/EBITDA (adj.) improved to 3.3x from 3.9x qoq, which is still too high for the rating. FFO/net debt (adj.) improved to 25%, which is closer to S&P's expected 30% as a first step as of FYE09/10. Deere affirmed its FY09/10 (31 Oct) guidance and expects net sales in FY09/10 to be up by about 12% (previously: 11%-13%) and +32% in 4Q. This includes a favorable FX-translation impact of about 2pp. The company guides for a FY net income of approximately USD 1.8bn (previously: USD 1.6bn). We see fair value in the bond as Deere's more important and stable agricultural business somewhat offsets its construction-related business as a significant improvement in credit metrics is discounted in rather tight spread levels (FY09/10 results: 11 November).
A3s/BBB+s Improving MAN (MANAG): Overweight 3.9%MAN's 2010 outlook foresees a significant increase in new orders, revenue growth >10% and ROS is expected to remain stable at the 1H level (1H10: 6.0%). In Commercial Vehicles, a continued positive trend is expected for new orders, with revenue and earnings at MAN Latin America remaining a stable earnings driver. In Power Engineering, a higher order intake is expected than in the previous year, with a low but stable order situation and a double-digit ROS. Positive factors for debtholders are: (a) reduction of MAN's dividend cash-out by EUR 260mn in FY10 compared to FY09 and (b) potential disposal proceeds for the exercised put option on the remaining 30%-stake in Ferrostaal. MAN's goal for FY10 is to generate around EUR 800mn in FCF (before dividends) according to the 2Q10 conference call. We continue to have an overweight recommendation for MAN bonds in the iBoxx € Industrial Goods & Services model portfolio based on (a) the company's positive credit profile momentum, and (b) as we believe that if VW (A3s/A-n/BBB+p) were to increase its shareholding in MAN to a majority, this would mean a rating alignment with VW and tightening potential of MAN bond and CDS spreads by around 10-20bp. (3Q10 results: 28 October)

5 October 2010
5 October 2010 Credit Research
Euro Credit Pilot
UniCredit Research page 46 See last pages for disclaimer.
Current Ratings (Moody's/S&P/Fitch)
Credit Profile
Name (Ticker): Recommendation Weight in iBoxxComment Industrial Goods & Services (Core) sector
---/BBB-s/--- Improving Rentokil (RENTKL): Marketweight 1.2%Rentokil released 2Q10 results that revealed further operating improvements. Sales growth (for continuing operations) remained muted in the quarter, down at 0.8% (at constant exchange rates, CER) to GBP 627mn. Operating profit from continuing operations (before impairments, amortization and one-offs) improved by 18.3% at CER to GBP 61mn, positively influenced by cost savings that are materializing ahead of plan. Despite continuing challenging market conditions, as also reflected in strong price pressure, the company stuck to its full-year expectations, expecting continued profit enhancement, supported by its internal measures. Rentokil also repeated its commitment to reduce net debt to below GBP 1bn by YE (GBP 1bn at 1H) and to restore its credit metrics to a BBB flat rating. Rewarding Rentokil's progress in improving its operating performance in a challenging market environment and improved credit metrics as well as its updated financial policy, S&P changed its outlook for the company's BBB- rating from negative to stable. We keep our marketweight recommendation on the name.
Baa3s/BBB-s/--- Stable Rexam Plc (REXLN): Marketweight 1.7%Rexam released solid 1H10 results. Top-line growth was rather muted with organic sales up only 2% (reported sales GBP 2,491mn). However, driven by the company's restructuring and efficiency improvement measures as well as higher volumes and a better mix in Beverage Cans, underlying operating profit surged by 25% yoy to GBP 266mn. Cash generation was robust in 1H, with FOCF at GBP 123mn (vs. GBP 214mn in 1H09), despite a working capital related cash outflow of GBP 75mn (inflow of GBP 72mn in 1H09). It was further boosted by lower capex, with most spending skewed towards 2H. With net debt at GBP 1.9bn, we calculate adj. FFO/adj. net debt of about 26% at 1H. Rexam provided a stable outlook for the remainder of the year, with 2H results expected to be similar to 1H. This should be supported – given no economic setbacks – by an ongoing positive volume momentum. In 1H, Beverage Can volumes were up 2% globally, mainly thanks to a strong recovery of the specialty cans business, but also due to continued strong growth in South America (+15%). The Russian market, however, continued to be the weak spot. At Plastic Packaging, a good volume recovery in Personal Care (sales ex pass-through up by 11%) and a stable performance in Healthcare were able to largely offset the continuing top-line pressure (-9%) in the Closures business. Balance-sheet wise, Rexam remains committed to a net debt to EBITDA ratio of between 2.0x-2.5x (2.5x at 1H10). Management also reiterated its commitment to refrain from M&A activities in 2010 and 2011. Overall, we expect a stable credit profile and hence rating development. Bonds trade fair.
--/BBBs/-- Improving Sandvik (SANDVK): Marketweight 1.6%Sandvik released 2Q10 results above market consensus. In the quarter, sales rose by 15% on a like-for-like basis to SEK 20.6bn, while operating profit turned from a loss of SEK 1.99bn to a profit of SEK 3.5bn at a margin of 16.8%. The strong operating performance was mainly due to lower costs, higher volumes, a favorable product mix, positive metal prices and exchange rate effects. New orders surged by 43% on a like-for-like basis to SEK 23.2bn, with the book-to-bill ratio at a robust 1.1x. By region, new orders remained strong in Asia and improved in other markets. By sector, demand continued to be strong in the energy sector, while increases were visible in the automotive, mining and process industries. Cash generation was robust, despite fading support from working capital releases, with FOCF at SEK 1.95bn (vs. SEK 1.67bn). This was due to the stronger operating result and lower capex spending. Credit metrics further improved in the quarter. The bond trades fair.
A3n/A-s/A-s Weakening Schneider Electric SA (SUFP): Marketweight 6.9%Schneider released excellent 1H10 results. Sales increased by 10.5% (6.4% organically) to EUR 8.6bn, with top-line growth accelerating in 2Q. Mirroring the benefits of the company's efficiency initiatives and higher volumes, 1H EBITA (before restructuring costs and Areva Distribution integration costs) jumped by 44% to EUR 1.3bn, translating into a margin of 15.2% (11.6%). FOCF (after dividend payments) totaled EUR 214mn. Further reflecting the acquisition payment for Areva Distribution of EUR 1.2bn and negative currency impacts, net debt amounted to EUR 4bn, up from EUR 2.8bn at FYE, but largely stable compared to 1H09. More impressively, Schneider managed to keep its credit metrics at FYE09 levels, despite the acquisition cash outflow, with adj. FFO to net debt at 38% (40% at FYE09). The strong performance to date prompted Schneider to raise its full-year margin guidance from 14.0% to 15.5%. In 2H, top-line growth is expected to sustain the momentum of 1H, with an ongoing recovery of Industry and IT (although comparables will be getting tougher), but also a sequential rebound of later-cycle businesses Buildings and medium voltage. 2H figures will also reflect the first-time consolidation of Areva Distribution (since 7 July). Overall, we expect a stable credit profile trend. Despite the recent Areva Distribution acquisition, we would generally not exclude further M&A activity at the company. However, as the easy digestion of the latest acquisition proves, Schneider's strong cash generation capabilities provide it with a strong financial flexibility. Bonds trade fair.
--/BBB+s/-- Stable Securitas AB (SECURI): Marketweight 1.3%Securitas released 2Q10 results that were somewhat shy of Bloomberg consensus estimates. In the quarter, the company continued to show a stable operating performance with top-line growth being muted (i.e., 0% organic sales growth yoy), while margins could be improved slightly (5.6% vs. 5.5% yoy), mirroring Securitas' focus on cost control and lower bad debt. 2Q reported sales and operating income before amortization totaled SEK 15,424mn (-3% yoy) and SEK 859mn (-2%), respectively. By segment, Security Services North America's organic sales growth remained in negative territory (-4%), but Security Services Europe as well as Mobile and Monitoring showed slight improvements (+1%). Reflecting higher working capital needs as well as acquisition cash outflows (in particular for US-based Paragon Systems for an EV of SEK 267mn), net debt increased from the end of 1Q from SEK 7.8bn to SEK 9.7bn. The company repeated its intention to continue to exploit M&A opportunities, which should, however, be mainly limited to bolt-on transactions as in the past. We keep our marketweight recommendation on the name.
A1s/A+s/A+s Stable Siemens AG (SIEGR): Marketweight 23.0%Siemens released a promising 4Q trading update, saying that new orders and revenues at its Sectors will increase again qoq and yoy to more than EUR 20.1bn and above EUR 18.9bn, respectively. This should translate into a "very satisfactory" operating result, with Total Sector profit exceeding the prior-year figure of EUR 1.9bn. The company also confirmed that it is seeing the first positive signs in its long-cycle Industry businesses, while major new orders in Fossil and Renewable should boost Energy orders in the quarter. Earlier, Siemens announced that it will write down the goodwill in its Diagnostics division by up to EUR 1.4bn in 4Q10. Siemens' capital structure is very healthy, with its adj. industrial net debt to EBITDA ratio at 0.27x at the end of 3Q, well below its target of 0.8x-1.0x, indicating high financial and strategic flexibility. Overall, we anticipate a stable rating development in the near term. Bonds trade fair.
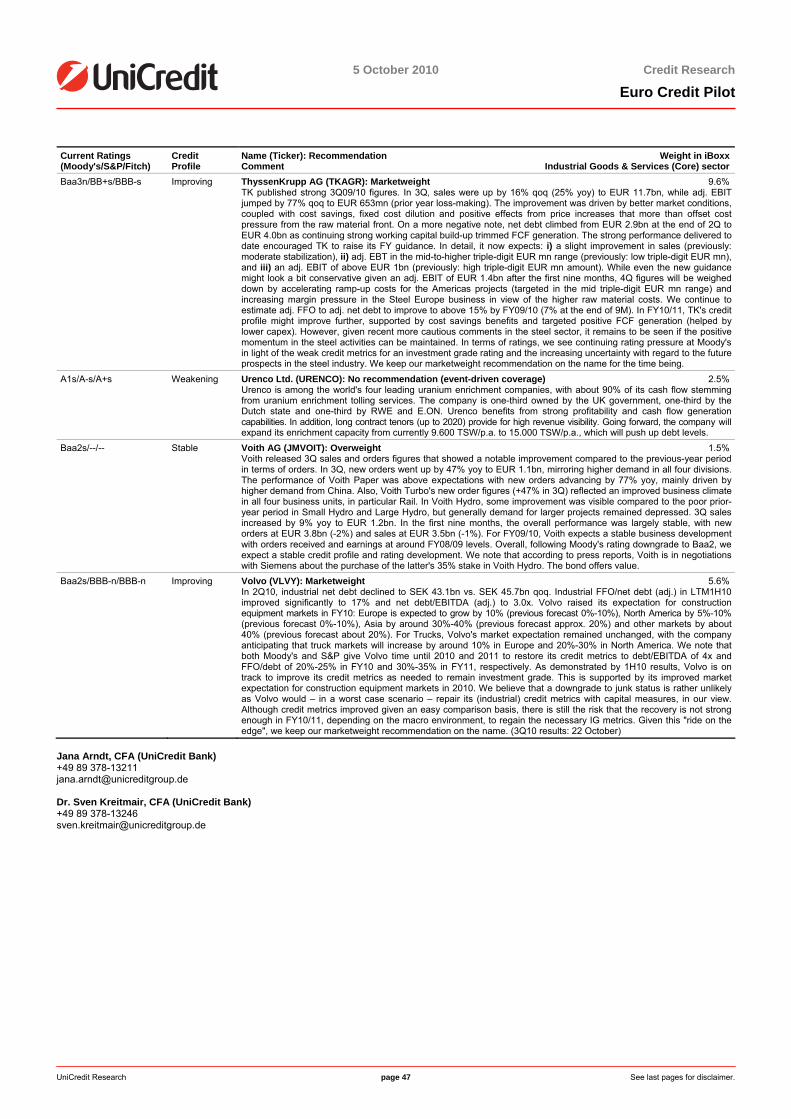
5 October 2010
5 October 2010 Credit Research
Euro Credit Pilot
UniCredit Research page 47 See last pages for disclaimer.
Current Ratings (Moody's/S&P/Fitch)
Credit Profile
Name (Ticker): Recommendation Weight in iBoxxComment Industrial Goods & Services (Core) sector
Baa3n/BB+s/BBB-s Improving ThyssenKrupp AG (TKAGR): Marketweight 9.6%TK published strong 3Q09/10 figures. In 3Q, sales were up by 16% qoq (25% yoy) to EUR 11.7bn, while adj. EBIT jumped by 77% qoq to EUR 653mn (prior year loss-making). The improvement was driven by better market conditions, coupled with cost savings, fixed cost dilution and positive effects from price increases that more than offset cost pressure from the raw material front. On a more negative note, net debt climbed from EUR 2.9bn at the end of 2Q to EUR 4.0bn as continuing strong working capital build-up trimmed FCF generation. The strong performance delivered to date encouraged TK to raise its FY guidance. In detail, it now expects: i) a slight improvement in sales (previously: moderate stabilization), ii) adj. EBT in the mid-to-higher triple-digit EUR mn range (previously: low triple-digit EUR mn), and iii) an adj. EBIT of above EUR 1bn (previously: high triple-digit EUR mn amount). While even the new guidance might look a bit conservative given an adj. EBIT of EUR 1.4bn after the first nine months, 4Q figures will be weighed down by accelerating ramp-up costs for the Americas projects (targeted in the mid triple-digit EUR mn range) and increasing margin pressure in the Steel Europe business in view of the higher raw material costs. We continue to estimate adj. FFO to adj. net debt to improve to above 15% by FY09/10 (7% at the end of 9M). In FY10/11, TK's credit profile might improve further, supported by cost savings benefits and targeted positive FCF generation (helped by lower capex). However, given recent more cautious comments in the steel sector, it remains to be seen if the positive momentum in the steel activities can be maintained. In terms of ratings, we see continuing rating pressure at Moody's in light of the weak credit metrics for an investment grade rating and the increasing uncertainty with regard to the future prospects in the steel industry. We keep our marketweight recommendation on the name for the time being.
A1s/A-s/A+s Weakening Urenco Ltd. (URENCO): No recommendation (event-driven coverage) 2.5%Urenco is among the world's four leading uranium enrichment companies, with about 90% of its cash flow stemming from uranium enrichment tolling services. The company is one-third owned by the UK government, one-third by the Dutch state and one-third by RWE and E.ON. Urenco benefits from strong profitability and cash flow generation capabilities. In addition, long contract tenors (up to 2020) provide for high revenue visibility. Going forward, the company will expand its enrichment capacity from currently 9.600 TSW/p.a. to 15.000 TSW/p.a., which will push up debt levels.
Baa2s/--/-- Stable Voith AG (JMVOIT): Overweight 1.5%Voith released 3Q sales and orders figures that showed a notable improvement compared to the previous-year period in terms of orders. In 3Q, new orders went up by 47% yoy to EUR 1.1bn, mirroring higher demand in all four divisions. The performance of Voith Paper was above expectations with new orders advancing by 77% yoy, mainly driven by higher demand from China. Also, Voith Turbo's new order figures (+47% in 3Q) reflected an improved business climate in all four business units, in particular Rail. In Voith Hydro, some improvement was visible compared to the poor prior-year period in Small Hydro and Large Hydro, but generally demand for larger projects remained depressed. 3Q sales increased by 9% yoy to EUR 1.2bn. In the first nine months, the overall performance was largely stable, with new orders at EUR 3.8bn (-2%) and sales at EUR 3.5bn (-1%). For FY09/10, Voith expects a stable business development with orders received and earnings at around FY08/09 levels. Overall, following Moody's rating downgrade to Baa2, we expect a stable credit profile and rating development. We note that according to press reports, Voith is in negotiations with Siemens about the purchase of the latter's 35% stake in Voith Hydro. The bond offers value.
Baa2s/BBB-n/BBB-n Improving Volvo (VLVY): Marketweight 5.6%In 2Q10, industrial net debt declined to SEK 43.1bn vs. SEK 45.7bn qoq. Industrial FFO/net debt (adj.) in LTM1H10 improved significantly to 17% and net debt/EBITDA (adj.) to 3.0x. Volvo raised its expectation for construction equipment markets in FY10: Europe is expected to grow by 10% (previous forecast 0%-10%), North America by 5%-10% (previous forecast 0%-10%), Asia by around 30%-40% (previous forecast approx. 20%) and other markets by about 40% (previous forecast about 20%). For Trucks, Volvo's market expectation remained unchanged, with the company anticipating that truck markets will increase by around 10% in Europe and 20%-30% in North America. We note that both Moody's and S&P give Volvo time until 2010 and 2011 to restore its credit metrics to debt/EBITDA of 4x and FFO/debt of 20%-25% in FY10 and 30%-35% in FY11, respectively. As demonstrated by 1H10 results, Volvo is on track to improve its credit metrics as needed to remain investment grade. This is supported by its improved market expectation for construction equipment markets in 2010. We believe that a downgrade to junk status is rather unlikely as Volvo would – in a worst case scenario – repair its (industrial) credit metrics with capital measures, in our view. Although credit metrics improved given an easy comparison basis, there is still the risk that the recovery is not strong enough in FY10/11, depending on the macro environment, to regain the necessary IG metrics. Given this "ride on the edge", we keep our marketweight recommendation on the name. (3Q10 results: 22 October)
Jana Arndt, CFA (UniCredit Bank) +49 89 378-13211 [email protected] Dr. Sven Kreitmair, CFA (UniCredit Bank) +49 89 378-13246 [email protected]
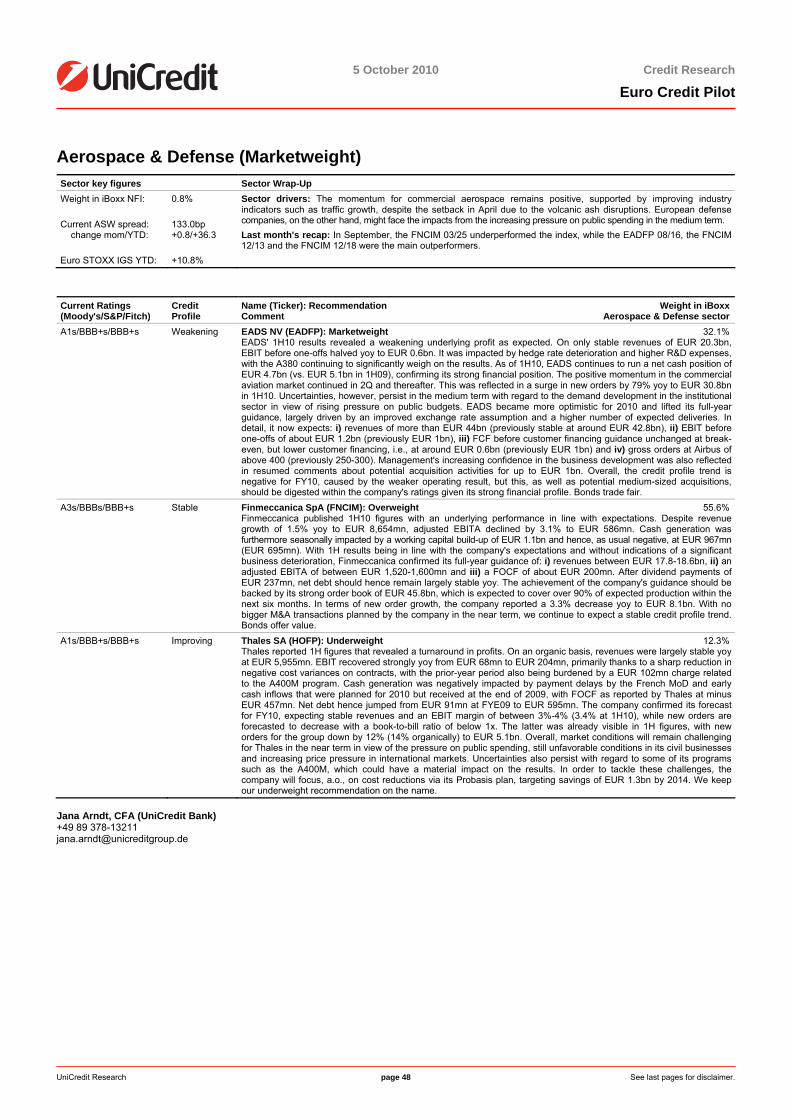
5 October 2010
5 October 2010 Credit Research
Euro Credit Pilot
UniCredit Research page 48 See last pages for disclaimer.
Aerospace & Defense (Marketweight) Sector key figures Sector Wrap-Up Weight in iBoxx NFI: Current ASW spread: change mom/YTD: Euro STOXX IGS YTD:
0.8% 133.0bp +0.8/+36.3 +10.8%
Sector drivers: The momentum for commercial aerospace remains positive, supported by improving industry indicators such as traffic growth, despite the setback in April due to the volcanic ash disruptions. European defense companies, on the other hand, might face the impacts from the increasing pressure on public spending in the medium term. Last month's recap: In September, the FNCIM 03/25 underperformed the index, while the EADFP 08/16, the FNCIM 12/13 and the FNCIM 12/18 were the main outperformers.
Current Ratings (Moody's/S&P/Fitch)
Credit Profile
Name (Ticker): Recommendation Weight in iBoxxComment Aerospace & Defense sector
A1s/BBB+s/BBB+s Weakening EADS NV (EADFP): Marketweight 32.1%EADS' 1H10 results revealed a weakening underlying profit as expected. On only stable revenues of EUR 20.3bn, EBIT before one-offs halved yoy to EUR 0.6bn. It was impacted by hedge rate deterioration and higher R&D expenses, with the A380 continuing to significantly weigh on the results. As of 1H10, EADS continues to run a net cash position of EUR 4.7bn (vs. EUR 5.1bn in 1H09), confirming its strong financial position. The positive momentum in the commercial aviation market continued in 2Q and thereafter. This was reflected in a surge in new orders by 79% yoy to EUR 30.8bn in 1H10. Uncertainties, however, persist in the medium term with regard to the demand development in the institutional sector in view of rising pressure on public budgets. EADS became more optimistic for 2010 and lifted its full-year guidance, largely driven by an improved exchange rate assumption and a higher number of expected deliveries. In detail, it now expects: i) revenues of more than EUR 44bn (previously stable at around EUR 42.8bn), ii) EBIT before one-offs of about EUR 1.2bn (previously EUR 1bn), iii) FCF before customer financing guidance unchanged at break-even, but lower customer financing, i.e., at around EUR 0.6bn (previously EUR 1bn) and iv) gross orders at Airbus of above 400 (previously 250-300). Management's increasing confidence in the business development was also reflected in resumed comments about potential acquisition activities for up to EUR 1bn. Overall, the credit profile trend is negative for FY10, caused by the weaker operating result, but this, as well as potential medium-sized acquisitions, should be digested within the company's ratings given its strong financial profile. Bonds trade fair.
A3s/BBBs/BBB+s Stable Finmeccanica SpA (FNCIM): Overweight 55.6%Finmeccanica published 1H10 figures with an underlying performance in line with expectations. Despite revenue growth of 1.5% yoy to EUR 8,654mn, adjusted EBITA declined by 3.1% to EUR 586mn. Cash generation was furthermore seasonally impacted by a working capital build-up of EUR 1.1bn and hence, as usual negative, at EUR 967mn (EUR 695mn). With 1H results being in line with the company's expectations and without indications of a significant business deterioration, Finmeccanica confirmed its full-year guidance of: i) revenues between EUR 17.8-18.6bn, ii) an adjusted EBITA of between EUR 1,520-1,600mn and iii) a FOCF of about EUR 200mn. After dividend payments of EUR 237mn, net debt should hence remain largely stable yoy. The achievement of the company's guidance should be backed by its strong order book of EUR 45.8bn, which is expected to cover over 90% of expected production within the next six months. In terms of new order growth, the company reported a 3.3% decrease yoy to EUR 8.1bn. With no bigger M&A transactions planned by the company in the near term, we continue to expect a stable credit profile trend. Bonds offer value.
A1s/BBB+s/BBB+s Improving Thales SA (HOFP): Underweight 12.3%Thales reported 1H figures that revealed a turnaround in profits. On an organic basis, revenues were largely stable yoy at EUR 5,955mn. EBIT recovered strongly yoy from EUR 68mn to EUR 204mn, primarily thanks to a sharp reduction in negative cost variances on contracts, with the prior-year period also being burdened by a EUR 102mn charge related to the A400M program. Cash generation was negatively impacted by payment delays by the French MoD and early cash inflows that were planned for 2010 but received at the end of 2009, with FOCF as reported by Thales at minus EUR 457mn. Net debt hence jumped from EUR 91mn at FYE09 to EUR 595mn. The company confirmed its forecast for FY10, expecting stable revenues and an EBIT margin of between 3%-4% (3.4% at 1H10), while new orders are forecasted to decrease with a book-to-bill ratio of below 1x. The latter was already visible in 1H figures, with new orders for the group down by 12% (14% organically) to EUR 5.1bn. Overall, market conditions will remain challenging for Thales in the near term in view of the pressure on public spending, still unfavorable conditions in its civil businesses and increasing price pressure in international markets. Uncertainties also persist with regard to some of its programs such as the A400M, which could have a material impact on the results. In order to tackle these challenges, the company will focus, a.o., on cost reductions via its Probasis plan, targeting savings of EUR 1.3bn by 2014. We keep our underweight recommendation on the name.
Jana Arndt, CFA (UniCredit Bank) +49 89 378-13211 [email protected]
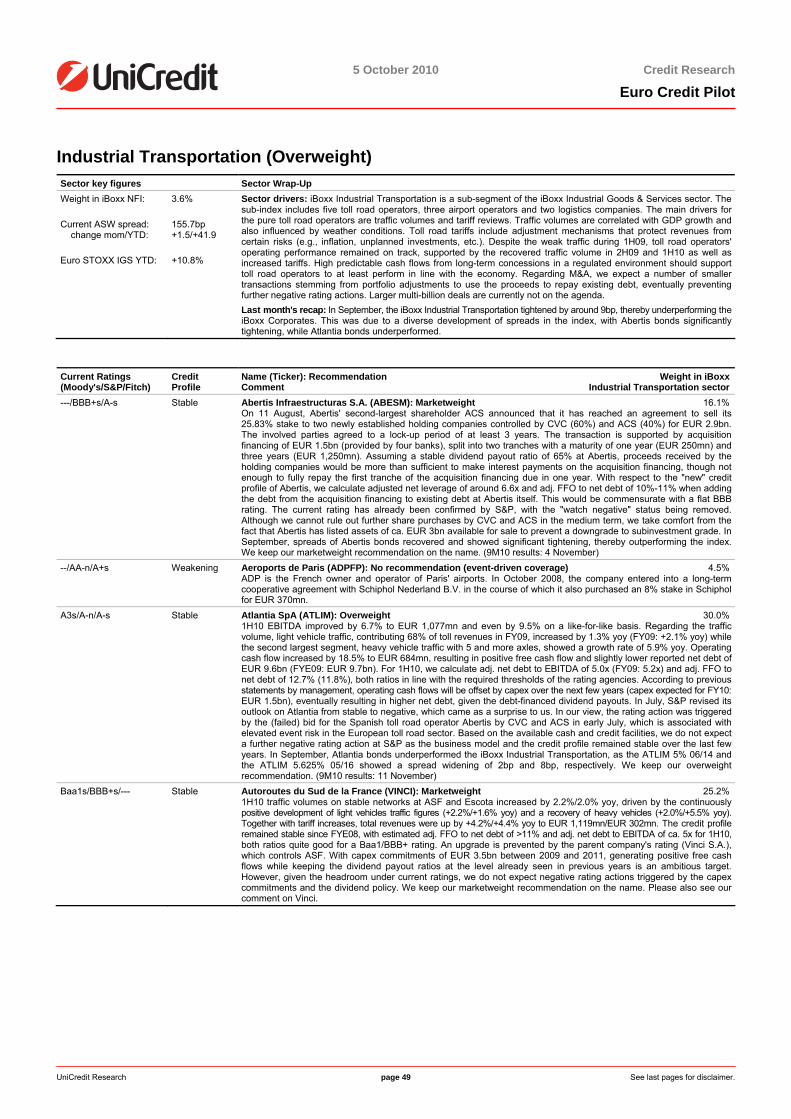
5 October 2010
5 October 2010 Credit Research
Euro Credit Pilot
UniCredit Research page 49 See last pages for disclaimer.
Industrial Transportation (Overweight) Sector key figures Sector Wrap-Up Weight in iBoxx NFI: Current ASW spread: change mom/YTD: Euro STOXX IGS YTD:
3.6% 155.7bp +1.5/+41.9 +10.8%
Sector drivers: iBoxx Industrial Transportation is a sub-segment of the iBoxx Industrial Goods & Services sector. The sub-index includes five toll road operators, three airport operators and two logistics companies. The main drivers for the pure toll road operators are traffic volumes and tariff reviews. Traffic volumes are correlated with GDP growth and also influenced by weather conditions. Toll road tariffs include adjustment mechanisms that protect revenues from certain risks (e.g., inflation, unplanned investments, etc.). Despite the weak traffic during 1H09, toll road operators' operating performance remained on track, supported by the recovered traffic volume in 2H09 and 1H10 as well as increased tariffs. High predictable cash flows from long-term concessions in a regulated environment should support toll road operators to at least perform in line with the economy. Regarding M&A, we expect a number of smaller transactions stemming from portfolio adjustments to use the proceeds to repay existing debt, eventually preventing further negative rating actions. Larger multi-billion deals are currently not on the agenda. Last month's recap: In September, the iBoxx Industrial Transportation tightened by around 9bp, thereby underperforming the iBoxx Corporates. This was due to a diverse development of spreads in the index, with Abertis bonds significantly tightening, while Atlantia bonds underperformed.
Current Ratings (Moody's/S&P/Fitch)
Credit Profile
Name (Ticker): Recommendation Weight in iBoxxComment Industrial Transportation sector
---/BBB+s/A-s Stable Abertis Infraestructuras S.A. (ABESM): Marketweight 16.1%On 11 August, Abertis' second-largest shareholder ACS announced that it has reached an agreement to sell its 25.83% stake to two newly established holding companies controlled by CVC (60%) and ACS (40%) for EUR 2.9bn. The involved parties agreed to a lock-up period of at least 3 years. The transaction is supported by acquisition financing of EUR 1.5bn (provided by four banks), split into two tranches with a maturity of one year (EUR 250mn) and three years (EUR 1,250mn). Assuming a stable dividend payout ratio of 65% at Abertis, proceeds received by the holding companies would be more than sufficient to make interest payments on the acquisition financing, though not enough to fully repay the first tranche of the acquisition financing due in one year. With respect to the "new" credit profile of Abertis, we calculate adjusted net leverage of around 6.6x and adj. FFO to net debt of 10%-11% when adding the debt from the acquisition financing to existing debt at Abertis itself. This would be commensurate with a flat BBB rating. The current rating has already been confirmed by S&P, with the "watch negative" status being removed. Although we cannot rule out further share purchases by CVC and ACS in the medium term, we take comfort from the fact that Abertis has listed assets of ca. EUR 3bn available for sale to prevent a downgrade to subinvestment grade. In September, spreads of Abertis bonds recovered and showed significant tightening, thereby outperforming the index. We keep our marketweight recommendation on the name. (9M10 results: 4 November)
--/AA-n/A+s Weakening Aeroports de Paris (ADPFP): No recommendation (event-driven coverage) 4.5%ADP is the French owner and operator of Paris' airports. In October 2008, the company entered into a long-term cooperative agreement with Schiphol Nederland B.V. in the course of which it also purchased an 8% stake in Schiphol for EUR 370mn.
A3s/A-n/A-s Stable Atlantia SpA (ATLIM): Overweight 30.0%1H10 EBITDA improved by 6.7% to EUR 1,077mn and even by 9.5% on a like-for-like basis. Regarding the traffic volume, light vehicle traffic, contributing 68% of toll revenues in FY09, increased by 1.3% yoy (FY09: +2.1% yoy) while the second largest segment, heavy vehicle traffic with 5 and more axles, showed a growth rate of 5.9% yoy. Operating cash flow increased by 18.5% to EUR 684mn, resulting in positive free cash flow and slightly lower reported net debt of EUR 9.6bn (FYE09: EUR 9.7bn). For 1H10, we calculate adj. net debt to EBITDA of 5.0x (FY09: 5.2x) and adj. FFO to net debt of 12.7% (11.8%), both ratios in line with the required thresholds of the rating agencies. According to previous statements by management, operating cash flows will be offset by capex over the next few years (capex expected for FY10: EUR 1.5bn), eventually resulting in higher net debt, given the debt-financed dividend payouts. In July, S&P revised its outlook on Atlantia from stable to negative, which came as a surprise to us. In our view, the rating action was triggered by the (failed) bid for the Spanish toll road operator Abertis by CVC and ACS in early July, which is associated with elevated event risk in the European toll road sector. Based on the available cash and credit facilities, we do not expect a further negative rating action at S&P as the business model and the credit profile remained stable over the last few years. In September, Atlantia bonds underperformed the iBoxx Industrial Transportation, as the ATLIM 5% 06/14 and the ATLIM 5.625% 05/16 showed a spread widening of 2bp and 8bp, respectively. We keep our overweight recommendation. (9M10 results: 11 November)
Baa1s/BBB+s/--- Stable Autoroutes du Sud de la France (VINCI): Marketweight 25.2%1H10 traffic volumes on stable networks at ASF and Escota increased by 2.2%/2.0% yoy, driven by the continuously positive development of light vehicles traffic figures (+2.2%/+1.6% yoy) and a recovery of heavy vehicles (+2.0%/+5.5% yoy). Together with tariff increases, total revenues were up by +4.2%/+4.4% yoy to EUR 1,119mn/EUR 302mn. The credit profile remained stable since FYE08, with estimated adj. FFO to net debt of >11% and adj. net debt to EBITDA of ca. 5x for 1H10, both ratios quite good for a Baa1/BBB+ rating. An upgrade is prevented by the parent company's rating (Vinci S.A.), which controls ASF. With capex commitments of EUR 3.5bn between 2009 and 2011, generating positive free cash flows while keeping the dividend payout ratios at the level already seen in previous years is an ambitious target. However, given the headroom under current ratings, we do not expect negative rating actions triggered by the capex commitments and the dividend policy. We keep our marketweight recommendation on the name. Please also see our comment on Vinci.
5 October 2010
5 October 2010 Credit Research
Euro Credit Pilot
UniCredit Research page 50 See last pages for disclaimer.
Current Ratings (Moody's/S&P/Fitch)
Credit Profile
Name (Ticker): Recommendation Weight in iBoxxComment Industrial Transportation sector
Baa3s/BBB-n/--- Stable Autoroutes Paris-Rhin-Rhone (ARRFP): Marketweight 3.3%With the acquisition of 14% in APRR from Elliott Management Corp. and Sandell AM Corp., Eiffarie now holds almost 95% in APRR, allowing Eiffarie to gain full access to APRR's cash flows. The transaction (valued at ca. EUR 1.1bn) was financed by additional equity provided by the ultimate shareholders Eiffage (not rated) and infrastructure funds of Macquarie. The combined entity (APRR and its holding company Eiffarie) had a net leverage of 9.0x at FYE09, which is weak for the current rating category. For 1H10, we calculate adj. net debt to EBITDA of 5.2x and FFO to net debt of 10.8% for APRR (excl. debt at the holding level). Assuming a declining capex volume over the next few years, APRR should be able to generate positive free cash flows and reduce debt at Eiffairie's and APRR's level. Based on the conservative financing of the above-mentioned transaction and the stable operating business (1H10 toll revenues were up by 5.2% yoy to approx. EUR 905mn due to recovering traffic volumes, reported EBITDA was up by 5.1% yoy to EUR 631mn), APRR should be able to keep its (low) investment grade rating. We keep our marketweight recommendation on the name.
Baa1wn/---/BBB+wd Stable Brisa (BRIPL): Marketweight 4.6%On 3 September, S&P affirmed the BBB- rating of Brisa (Baa1wn/--/BBB+wd), while at the same time withdrawing the rating at the issuer's request. The withdrawal comes as a surprise. However, we note that S&P's last rating (BBB-) was the weakest among all assigned ratings. For the time being, we keep our marketweight recommendation for the name because: (1) the underlying trend in past quarters had been positive, also supported by additional credit-positive measures such as the disposal of the 16.35% stake in Brazil-based toll road operator CCR for EUR 1.2bn. (2) The S&P note contains no hint about any potential threat to the current rating (stable outlook, strong business risk profile). (3) There are still two ratings remaining (Fitch & Moody's). On 23 September, the company announced that it has completed the sale of its 6% stake in Brazil-based toll road operator CCR for a consideration of EUR 430mn. The remaining 10.35% stake is to be sold through a private placement by the end of the year. Furthermore, the announced corporate reorganization should be completed by 4Q10. We keep our marketweight recommendation on the name.
---/BBB+s/--- Stable Cofiroute (VINCI): Marketweight 25.2%Cofiroute's principal shareholders are France's main construction companies, Vinci S.A. with 82% and Colas (part of Bouygues Group) with 17%. Traffic volume on stable networks in 1H10 was up by 2.5% yoy, with both light and heavy vehicles showing a positive development (+2.3%/+3.6% yoy). EBITDA increased by 4.1% yoy to EUR 377mn. On a stand-alone basis, Cofiroute's credit metrics are strong for the current rating. For 1H10, we calculate net debt to EBITDA of 4.0x (FY09: 4.1x) and adj. FFO to net debt of 18.3% (FY09: 17.3%). Both ratios are above the thresholds required for a flat single A rating. However, given the fact that Vinci holds more than two thirds of the voting rights of Cofiroute, the rating is capped by that of Vinci as long as the latter retains control of Cofiroute. S&P's stable outlook on Cofiroute is directly linked to that of Vinci. As Vinci is currently more focused on a stabilization of margins rather than on top-line growth, S&P is confident that Vinci will keep a credit profile in line with the current BBB+ rating. We keep our marketweight recommendation. Please also see our comment on Vinci.
Baa1s/BBB+s/-- Improving Deutsche Post Worldnet (DPW): Underweight 7.1%Deutsche Post released 2Q10 results with an underlying operating performance above consensus expectations. In 2Q, revenues advanced by 15.6% (10.3% organically) to EUR 12.8bn and underlying EBIT surged 95.7% to EUR 503mn. Organic top-line growth was particularly strong in Express (+13.3%) and Global Forwarding, Freight (+26.9%), while the decline in Mail was lower than expected. Underlying profit growth was boosted by higher volumes and continued cost discipline with all business units contributing. The company continued to report net liquidity of EUR 535mn at the end of 1H, down from EUR 1.7bn at FYE, reflecting dividend and restructuring payments as well as pension payments to civil servants in 1H. The strong performance prompted the company to raise its guidance for underlying EBIT from EUR 1.6-1.9bn to EUR 1.9-2.1bn. The higher profit guidance should be mainly driven by a better-than-expected performance of DHL. For relative value reasons, we keep our underweight recommendation on the name.
--/A-n/-- Weakening Dublin Airport (DAAFIN): No recommendation (event-driven coverage) 2.5%Dublin Airport Authority (DAA) is a state-owned company that currently owns, manages and develops Ireland's three main airports – Dublin, Shannon and Cork. The bond proceeds will be used to partly finance the company's EUR 2bn investment program (which includes the construction of a new passenger terminal, pier and runway). On the back of increasing capex and hence debt levels, credit metrics of the company should deteriorate going forward.
A1s/As/-- Weakening Luchthaven Schiphol (LUCSHI): No recommendation (event-driven coverage) 3.8%Luchthaven Schiphol (Schiphol) operates the Amsterdam, Rotterdam, Groningen, and Lelystad Airports in the Netherlands, and owns a stake in Eindhoven Airport NV. Schiphol also develops and maintains the airport infrastructure. The LUCSHI 01/14 will be used to finance part of the "super dividend" of EUR 500mn in FY08 and a second "super dividend" of EUR 500mn in FY09. These shareholder returns will put major pressure on the company's credit protection ratios, as they will be fully debt-financed.
A3n/BBB+s/--- Improving TNT (TNTNA): Underweight 2.9%TNT reported 2Q10 results below BB consensus in terms of net income. Underlying revenues of the group advanced by 5.1% in the quarter, while underlying EBIT increased by 5.0%. Reported revenues and EBIT stood at EUR 2,771mn and EUR 55mn, respectively. Top-line growth was driven by an ongoing volume recovery of the Express division (underlying revenues up by 10.3%), while Mail revenues continued to decline (-2.7%). The profit rebound in the Express division was held back by lower yields and cost inflation, with the company now addressing these challenges more intensively. The outlook for the remainder of the year remains unchanged: i) in Express: ongoing volume and revenue recovery, with the margin improvement being tempered by yield pressure and cost inflation; ii) in Mail: volume decline in the Netherlands of 7%-9% and Mail operating income below 2009 levels. With regard to its strategic roadmap, the company announced its intention to fully separate its Mail and Express businesses, with the internal separation expected to be implemented by 1 January 2011. At this stage, it remains unclear how the debt will be split, but bondholders should certainly suffer due to a loss of business diversification. We keep our underweight recommendation on the name.
Jana Arndt, CFA (UniCredit Bank) +49 89 378-13211 [email protected] Susanne Reichhuber (UniCredit Bank) +49 89 378-13247 [email protected]

5 October 2010
5 October 2010 Credit Research
Euro Credit Pilot
UniCredit Research page 51 See last pages for disclaimer.
Basic Resources (Marketweight) Sector key figures Sector Wrap-Up Weight in iBoxx NFI: Current ASW spread: change mom/YTD: Euro STOXX BAS YTD:
2.3% 160.9bp -24.1/+15.2 -9.7%
Sector drivers: Amid fears of a global economic slowdown and deflationary risks, the positive price momentum for commodities is at risk and might abate (in particular for industrial metals).Prospects for steel producers are also challenging in view of the increase in production costs and the accelerating ramp-up of capacities, while real end-user demand is only recovering slowly. This could imply margin pressure going forward. Nevertheless, the credit profiles of our covered steelmakers should improve, albeit from very weak levels. Last month's recap: In September, the BAS sector spread tightened by around 31bp, with the longer dated Glencore issues being the main outperformers.
Current Ratings (Moody's/S&P/Fitch)
Credit Profile
Name (Ticker): Recommendation Weight in iBoxxComment Basic Resources sector
Baa1s/BBBp/BBB+s Improving Anglo American (AALLN): Marketweight 17.5%S&P revised its rating outlook for Anglo's BBB rating from stable to positive, reflecting its view that the company will be able to maintain credit metrics commensurate with a higher rating on a sustained basis. The expected continuing improvement of Anglo's credit metrics should be supported by better market conditions and disposal proceeds of USD 2.1bn. The agency indicated that an upgrade could be possible in 2011. Earlier, Anglo published strong 1H10 results with revenues advancing by 35% to USD 15bn, while EBITDA surged 81% to USD 5.4bn. Besides improving trading conditions, the strong result was supported by benefits from the company's asset optimization and procurement programs with a run rate of USD 1bn in 1H. Owing to strong cash generation that could finance capex and the company's subscription to the De Beers rights issue, net debt declined from USD 11.3bn at FYE09 to USD 10.9bn. In view of the strong performance, the company's reinstatement of dividend payments is also of no concern. We keep our marketweight recommendation on the name.
Baa3s/BBBn/BBBn Improving ArcelorMittal (MTNA): Overweight 22.5%ArcelorMittal published 2Q10 results that matched the medium range of its EBITDA guidance. EBITDA rebounded by 59% qoq to USD 3bn, driven by higher shipments (+6%) and higher selling prices (+9%). In addition, EBITDA growth was supported by the ongoing cost containment measures. Cash generation continued to be impacted by the increased business activity (working capital related outflow of USD 2.3bn) that burdened FOCF (cash outflow of USD 0.3bn). Thanks to positive exchange rate effects, net debt nevertheless (and unexpectedly) declined sequentially from USD 20.7bn to USD 20.3bn. The outlook for 3Q remains rather downbeat, as the company is entering a seasonally slow period and as market conditions have softened recently. ArcelorMittal anticipates a sequential EBITDA drop to USD 2.1-2.5bn (vs. USD 1.6bn in 3Q09). Looking at 4Q, volumes should at least rebound seasonally, but price increases will be needed to recoup continuously rising input costs. By FYE10, we anticipate an improvement of credit metrics, with adj. FFO/adj. net debt trending towards 27% (24% at 1H10). Simultaneously, ArcelorMittal announced that it is currently assessing the spin-off of its stainless steel business to its shareholders. At this stage, we do not expect a significant impact on the company's credit profile from this transaction. Bonds offer value.
A1cwn/A+cwn/A+cwn Stable BHP Billiton Ltd. (BHP): Underweight 20.3%BHP made an unsolicited offer to acquire PotashCorp., the world's largest fertilizer company, valuing the company at about USD 40bn. The offer, which was unanimously rejected by the board of PotashCorp, is in line with BHP's recent diversification strategy. We expect that a fully debt-financed acquisition of this magnitude, even at the initial USD 130 per share, is likely to cause ratings to be lowered by one notch as leverage is likely to jump above 2.0x. All three rating agencies have placed BHP's A1/A+ ratings on review for downgrade – notwithstanding the positive impact on BHP's business profile from the enhanced diversification and the favorable prospects for the fertilizer industry as a whole. Bonds do not offer value.
Baa2n/BBB-s/--- Stable Glencore (GLEINT): Overweight 23.3%Glencore's 1H10 sales jumped 55% to USD 70bn as a result of higher prices for key commodities (copper, crude oil and aluminum). EBITDA reached EUR 2.6bn, up 69% yoy. Cash-flow generation was healthy, with operating cash flow of EUR 3.6bn covering capex as well as the exercise of the Prodeco call option. Despite the solid cash flow performance, leverage (net debt to EBITDA) rose slightly to 2.73x vs. 2.59x yoy. Liquidity also improved, with available cash sources increasing to USD 6.5bn by 1H10 (above the company's own USD 3bn target). The outlook for 2H remains solid, with Glencore expecting its production to benefit from the expansion of its coal operations (Prodeco expansion), the new gold mine Vasilkovskoje, the start of its Peruvian zinc mine and the ongoing expansion of its Katanga copper mine. Main spread driver in the medium term could be a potential IPO of the company, which is targeted within the next three years (base-case assumption), or a potential merger with Xstrata. Both scenarios – depending on the final structure – should have positive implications for bondholders.
Baa2s/BBB+s/BBB+s Stable Vale (VALEBZ): Marketweight 5.0%Vale released strong 2Q10 results, primarily reflecting higher sales prices for iron ore and pellets and higher shipment volumes in almost all of the company's products. 2Q EBITDA surged by 95% qoq to USD 5.58bn on a revenue increase by 45% qoq to USD 9.93bn. Despite the robust internal cash generation (FOCF of about USD 1.4bn), net debt increased from USD 12.4bn at the end of 1Q to USD 17.7bn, due to acquisition-related cash outflows of USD 5.2bn, mainly relating to the acquired fertilizer assets. Thanks to the strong operating performance, debt leverage nevertheless declined from 2.4x in 1Q to 1.8x. Vale also announced that it intends to buy the Brazilian copper producer Paranapanema for USD 1.1bn. Overall, the announcements underpin that the company's operating performance remains robust, while generated cash will continuously be used for M&A activities. However, Vale is apparently not interested in a bidding war with BHP for Potash Corp. We keep our marketweight recommendation on the name.
5 October 2010
5 October 2010 Credit Research
Euro Credit Pilot
UniCredit Research page 52 See last pages for disclaimer.
Current Ratings (Moody's/S&P/Fitch)
Credit Profile
Name (Ticker): Recommendation Weight in iBoxxComment Basic Resources sector
Baa2s/BBBn/-- Stable Xstrata (XTALN): Overweight 11.2%Xstrata released strong 1H10 results. Mirroring improved market conditions for commodity producers, 1H revenues increased by 43% yoy to USD 13.6bn, while operating profit rebounded by 67% to USD 4.5bn. Strong cash generation (free cash flow before acquisitions of USD 1.6bn) as well as the disposal cash inflow from the Prodeco mine (USD 2.25bn) allowed for a net debt reduction from USD 12.3bn from FYE09 levels to USD 8.4bn. Gearing hence declined to a low 19%. With respect to the short-term prospects, Xstrata sounded rather cautious given the mixed outlook for macroeconomic conditions, with the EU (with the exception of Germany) struggling and the developing economies remaining the growth engines. However, it remains very confident in the buoyant outlook for its commodities in the medium term. The company also confirmed that it is on track to deliver a 50% increase in volumes and 20% cost reduction from its industry-leading organic growth pipeline by 2014. Despite its strong focus on organic growth (with expected capex spending of USD 14bn from 2010-2012), the company will also continue to review acquisition opportunities. Overall, Xstrata's current strong financial profile enhances its financial flexibility regarding growth initiatives. Bonds offer value.
Jana Arndt, CFA (UniCredit Bank) +49 89 378-13211 [email protected]
Chemicals (Underweight) Sector key figures Sector Wrap-Up Weight in iBoxx NFI: Current ASW spread: change mom/YTD: Euro STOXX CHE YTD:
4.3% 79.0bp +0.2/-10.2 +7.0%
Sector drivers: The first half of 2010 was promising, with all companies reporting a significant recovery in volumes starting in 1Q and continuing in 2Q. Given the rigorous cost-cutting and efficiency measures earnings, too, showed a significant rebound despite pricing pressure in many value chains. However, persisting overcapacities will haunt the industry for the foreseeable future. Pricing power and thus margins will therefore remain under pressure in the medium term. Against this background, we expect all industry players to continue to focus on cash flow generation, while build-ups in working capital are expected to remain a use of cash in 2010. While companies are expected to control capex tightly, we expect overall capex budgets to rise in the next couple of quarters. For the full-year 2010, the outlook remains positive, with the VCI expecting chemical production to increase by 11% yoy. Against this background, M&A activity remains a key credit driver for the chemical industry. Shareholder remuneration may also come to the fore again if confidence in the sustainability of the favorable trading conditions improves. We do not expect rating pressure to re-emerge, absent any transformational acquisitions, given the expected strong volumes trend in 2H10. Last month's recap: In September, BASF and Lanxess issues were the main underperformers, while shorter-dated issues of Bayer, Linde and BASF outperformed the iBoxx Chemicals index.
Current Ratings (Moody's/S&P/Fitch)
Credit Profile
Name (Ticker): Recommendation Weight in iBoxxComment Chemicals sector
--/As/A+s Stable Air Liquide (AIFP): Underweight 6.4%Air Liquide showed continued growth, with sales in 1H10 increasing 6.3% (comparable basis), driven, among others, by start-ups and a good performance in emerging markets. For FY10, Air Liquide (AL) expects the start-up of 25 on-site projects (vs. 15 in 2009; 15-16 in 2011) as well as the continuing recovery in Emerging Markets. AL targets additional cost savings in excess of EUR 200mn under its ALMA program, which, together with the structural cost savings already realized, should support further margin expansion in the long term. Cash flow generation is expected to remain strong, while investment-related cash outflows are expected to accelerate going forward (probably reaching 15% of sales, FY09: EUR 2.0bn). Apart from capex related to its project portfolio (at EUR 4.7bn which is again at pre-crisis levels), we also expect continuing bolt-on acquisition activity (Healthcare) after around EUR 150mn were spent in 1H. Net debt levels rose to EUR 5.7bn at 1H10 (EUR 4.9bn at FYE09), translating into a gearing ratio of 68% (vs. 80% yoy; AL's "target range" is 50%-80%). (3Q10 results: 26 October)
Baa1s/BBB+s/BBB+s Stable Akzo Nobel (AKZANA): Marketweight 7.8%Akzo Nobel said it plans to grow sales to around EUR 20bn, while simultaneously increasing its EBITDA, with the margin remaining in the 13%-15% range. 2Q10 results were strong, with sales rising 13% to EUR 3.9bn on better volumes (+8%) and positive FX effects (+8%). Group EBITDA increased 21% to EUR 614mn at a margin of 15.7% (vs. 14.7% in 2Q09). On a rolling basis, the EBITDA margin reached 14% and Akzo hence achieved its FY11 margin target early. In June, Akzo announced the long-awaited disposal of its National Starch unit for USD 1.35bn, which should complete the divestment program following the ICI purchase. Earlier in the year, board member Frohn was quoted as saying that regaining a A-/A3 rating has priority over bigger purchases. From a debtholder perspective, key risks include the company's progressive dividend policy, potential M&A activities (with the company continuously looking for attractive opportunities) as well as Akzo's pension deficit (of EUR 1.8bn) with related top-up payments weighing on cash flow generation (EUR 350mn in top-ups both in 2010 and 2011). (3Q10 results: 21 October)
A1s/A+n/A+n Improving BASF (BASGR): Overweight 28.5%BASF announced its intention to acquire Cognis for an EV of EUR 3.1bn (expected closing in November). Synergies of at least EUR 130mn by 2012 (5% of FY09 sales) at a total cost of up to EUR 250mn are anticipated. While we expect credit metrics to remain largely stable in FY10, S&P downgraded BASF by one notch, with Moody's rating remaining on review for downgrade. RCF and FFO to net adj. debt stood at around 29% and 39% at 2Q10. Management remains committed to an "A rating" and announced that it would abstain from larger acquisitions for the foreseeable future ("beyond two years"). In 2Q10, sales and EBITDA rose by 30% and 82% yoy (to EUR 16.2bn and EUR 2,867mn, respectively), driven by a continuing volume recovery. For 2010, BASF's operating performance continued to improve in 3Q10, with the company raising its forecast now expecting a "strong gain" in sales and earnings. BASF is confident that it can earn its cost of capital again in 2010, which will likely cause the dividend to be increased. (3Q10 results: 28 October)
5 October 2010
5 October 2010 Credit Research
Euro Credit Pilot
UniCredit Research page 53 See last pages for disclaimer.
Current Ratings (Moody's/S&P/Fitch)
Credit Profile
Name (Ticker): Recommendation Weight in iBoxxComment Chemicals sector
A3s/A-n/A-s Stable Bayer (BAYNGR): Underweight (Senior)/Underweight (Subordinated) 19.9%Despite a disappointing 2Q10, Bayer confirmed its group outlook for FY10, aiming for sales growth of 5%, EBITDA before special items of more than EUR 7bn and core EPS growth of 15%. However, Bayer needed to reduce the earnings outlook for HealthCare (now expected to grow slightly) and CropScience (sales decline in 2010) for the second time in 2010. Bayer's 2Q10 sales increased 15% (EUR 9.2bn), but earnings fell short of expectations (underlying EBITDA up 9% to EUR 1,917mn). The weak spot remains HC, whose sales development is disappointing and below the average for the pharma sector (around 5% p.a.), in our view. Hence, a large-scale acquisition to foster growth in the unit remains on the agenda (Bayer failed to strengthen its animal health business in FY09). The new CEO Dekkers also hinted that a larger acquisition similar to that of Schering (equity value EUR ~17bn in 2006) remains possible. More positively, we believe that the MaterialScience business should attract interest from Middle East sovereign funds and that Bayer may use the business as "acquisition currency" at some point in the future. Bayer's bonds offer little value. (3Q10 results: 28 October)
A3s/A-s/A-n Stable DSM (DSM): Underweight 6.6%With the sale of its Citrique Belge business, DSM announced the completion of its portfolio transformation and the dawn of an "era of focused growth". Furthermore, DSM announced that it intends to increase its dividend by EUR 0.1 to EUR 1.3 per share and successively raise the payouts to EUR 1.5 per share – barring any shortfall under its new growth program or unforeseen events. The medium-term growth targets include an increase in its EBITDA to EUR 1.4-1.6bn and an ROCE of >15% by 2013, while longer term, i.e. by 2015, DSM expects to further increase sales in China to above USD 3bn, raise the share of emerging countries of total sales from 32% towards 50% of group sales and sales "from innovation" from ~12% to 20% of group sales. The rather vague outlook statement calling for 2010 to be "a strong year " was confirmed. DSM's 1H10 results were strong, with EBITDA doubling to EUR 655mn and a tripling of EBIT (rising 246%) to EUR 440mn, driven by improving business conditions in most geographic regions, further helped by re-stocking effects. At a gearing of 10%, DSM's balance sheet remains underleveraged, especially in light of the improving market conditions. (3Q10 results: 2 November)
Baa2n/BBBs/-- Stable K+S (SDFGR): Underweight 2.7%K+S is a leading European fertilizer (potash) and salt producer. In 2009, K+S generated sales of EUR 3.6bn, with around 18% being generated in Germany, 10% in France, 25% in the Rest of Europe, US 14%, Brazil 10% and 23% "Overseas". Following the acquisition of Morton Salt (USD 1.7bn), K+S' main business segments are Potash and Magnesium Products (40% of sales), Nitrogen Fertilizers (28%) and Salt (28%). In 1Q10, sales increased 43% yoy to EUR 1.5bn, supported by strong demand for deicing salt as a result of the harsh winter, while EBITDA rebounded to EUR 333mn. For 2010, K+S increased its potash volumes forecast of 6 mmt to 6.5 mmt but prices remain substantially below the peak levels of 2008. Given the M&A talk in the industry (BHP's USD 45bn bid for Potash Group pending), K+S' credit profile development largely depends on its participation in the consolidation. More positively, K+S announced its intention to dispose of its "home and garden" business Compo (EUR ~400mn in FY09 sales). Given the heightened event risk, we see little value in spreads. (3Q10 results: 11 November)
Baa2s/BBBs/BBBs Stable Lanxess AG (LXSGR): Marketweight 2.0%At its investor day, Lanxess announced a new long-term target of EUR 1.4bn in EBITDA by 2015. Half of the increase of EUR 600mn over Lanxess' EUR 800mn target for FY10 (which was confirmed) is expected to stem from M&A. We note management's strong track record of acquisition-driven growth in the past and are convinced that Lanxess will stick to its disciplined approach with a focus on bolt-on deals. In 2Q10, Lanxess benefited from a strong volume recovery driving sales (+48% yoy) to EUR 1,828mn and EBITDA pre exceptionals more than doubling to EUR 269mn. Cash generation remained strong and leverage was reduced to 1.3x (vs.1.8x in FY09 on an adjusted EBITDA basis) on net debt of EUR 955mn. Lanxess raised its outlook, now expecting an EBITDA of "roughly" EUR 800mn (up from EUR 650-700mn) for FY10. Capex is set to rise (up to EUR 470mn), with the focus being on emerging markets (plant in Singapore). Liquidity is safe, resting on EUR 437mn in cash and equivalents and an undrawn credit facility of EUR 1.4bn (leverage covenant of 3.5x). Near-term debt maturities are negligible. (3Q10 results: 10 November)
A3s/A-s/-- Stable Linde (LINGR): Marketweight (Senior)/ Overweight (Subordinated) 12.4%Linde raised its FY10 outlook, following a strong performance in 1H10, with operating profits rising 26% to EUR 1.4bn on sales of EUR 6.1bn, up 12% yoy. Previously, Linde expected FY10 results to improve relative to FY09, but due to the continuing recovery in demand in emerging markets operating profits are now expected to exceed the EUR 2,555mn in FY08. Linde's ratings are weakly positioned in their rating categories. Linde's net debt in 1Q10 was EUR 6.3bn (vs. EUR 6.0bn at 1Q10) with leverage standing at 2.6x, thus well within the target range of 2.5x-3.0x. Ratios of FFO and RCF to net adj. debt of around 29% and 24% fell short of the hurdle rates set for the ratings (30%-35% and around 27%, respectively). For FY10, earnings in Gases are expected to exceed the record levels of 2008 (EUR 2,417mn), while Engineering should show stable sales and margins, with the order book standing at EUR 4.3bn (margin target 8%; 1H10: 11%). Linde ruled out larger acquisitions but a selective strengthening of its portfolio in Healthcare as well as purchases in regions where it does not have a minimum 30% market share is likely. (3Q10 results: 2 November)
A1/A+/As Stable SABIC Europe BV (SABIC): Event driven coverage 2.7%SABIC, the parent company of SABIC Europe, set up SABIC Capital I B.V. and exchanged the outstanding EUR 750mn bond previously issued by SABIC Europe, with a bond with similar issues, in an effort to centralize its funding. As a result, the ratings on the new bond are aligned with those of the parent company at all three rating agencies. Our recommendation for the illiquid issue is mostly based on the implied parent support (the Kingdom of Saudi Arabia is 70% majority owner of the parent).
A3n/An/A-cwn Weakening Solvay (SOLBBB): Underweight (Senior)/ Underweight (Subordinated) 7.3%Following the closure of the disposal of its pharma unit (EV: EUR 5.2bn), Solvay announced a share buyback program for around 6% of its outstanding shares worth ca. EUR 360-400mn at current share prices. The remaining cash proceeds will be reinvested in internal and external growth, Solvay said. While management stressed that it will maintain its long-term financial discipline with leverage targets at conservative levels, the exit from the non-cyclical pharma business will evidently alter the business risk profile of the group to the downside, and might eventually result in a realignment of its financial profile, too. We note that some of Solvay's direct peers are currently rated in the BBB range. 1H10 sales recovered sharply, being up 25% to EUR 3.8bn (excl. pharmaceuticals) while REBITDA jumped 85% to EUR 300mn, driven by volume increases as well as cost savings measures initiated in response to the market downturn. Management announced that it will shed another 800 jobs for cost savings of EUR 65mn. The company continues to be on the lookout for small-to-mid-sized acquisitions. Overall, we remain reluctant to build exposure to Solvay. (1H10 results: 28 October)
5 October 2010
5 October 2010 Credit Research
Euro Credit Pilot
UniCredit Research page 54 See last pages for disclaimer.
Current Ratings (Moody's/S&P/Fitch)
Credit Profile
Name (Ticker): Recommendation Weight in iBoxxComment Chemicals sector
A2s/As/--- Stable Syngenta (SYNNVX): Marketweight 3.6%Syngenta had to lower its earnings guidance for FY10 (now expected to be stable yoy vs. growth yoy) on the back of continuing pricing pressure. Reported sales came in largely stable (+1%) yoy at USD 6.74bn, while sales were lower at constant exchange rates (-3% CER). Accelerating volume growth in 2Q in particular in emerging markets could not compensate for lower prices in Crop Protection, leading to a drop in group EBITDA by 9% (CER) to USD 1.9bn. Syngenta's business is cash flow generative, with 1H FCF after acquisitions reaching USD 74mn (USD 79mn) with a further inflow expected for 2H, in line with seasonal patterns. Alongside M&A activity, cash returns to shareholders continued to remain a key risk for debtholders, with Syngenta paying out USD 591mn (vs. USD 465mn yoy). Syngenta is currently pursuing a share repurchase up to 10% of share capital. Free cash flow generation in 1H was on par with that of the prior-year period at USD 74mn (USD 79mn). Shareholder remuneration totaled USD 591mn in 1H. For the remainder of 2010, Syngenta expects the positive volume momentum to continue. (FY10 results: 9 February)
Jochen Schlachter (UniCredit Bank) +49 89 378-13212 [email protected]
Construction & Materials (Underweight) Sector key figures Sector Wrap-Up Weight in iBoxx NFI: Current ASW spread: change mom/YTD: Euro STOXX CNS YTD:
3.4% 176.9bp -4.8/+36.3 -17.6%
Sector drivers: Despite the volume recovery witnessed over the past couple of months, there was little evidence so far that government infrastructure programs showed a meaningful impact on demand of heavy building material players. However, industry players expect stimulus programs to kick in this year, especially in the mature markets of North America and Europe. Still, it is unlikely that stimulus programs will lead to a significant increase in construction activity overall. For Europe, Euroconstruct expects construction output to fall by 4.0% in 2010 versus a decline of 8.8% in 2009. In the US, the Portland Cement Association has further reduced its construction spending forecast to minus 2.9% for 2010, while the cement intensity is expected to recover by 8.3%. In Asia, on the other hand, the building materials industry continues to benefit from buoyant demand, while the overall prospects for emerging markets in Latin America, Africa and the Middle East also remain broadly positive. Another key driver will remain pricing discipline in the industry. So far, prices have proved comparatively resilient overall, with weaknesses balanced out by strength in other regions. However, attempts to gain market share at the expense of pricing remains a key risk. Given that most industry participants entered the downturn with significant debt loads, we expect the industry to remain in deleveraging mode. M&A may become a topic for players with a strong balance sheet like Holcim. Last month's recap: In September, short-dated Saint Gobain as well as Lafarge issues outperformed the iBoxx, while CRH was the biggest underperformer in the sector.
Current Ratings (Moody's/S&P/Fitch)
Credit Profile
Name (Ticker): Recommendation Weight in iBoxxComment Construction & Materials sector
---/A-s/BBB+n Weakening Bouygues (BOUY): Underweight 24.7%Bouygues' operating performance benefits from its diversified business portfolio with assets in construction, real estate, telecom and media. 1H10 sales and operating profit were down 1% and 10% to EUR 14.7bn and EUR 698mn, respectively, as a result of weak trading of its road building unit Colas. As a result of the weak operating performance, Bouygues' net debt continued to be on the rise, reaching EUR 4.2bn, up from EUR 2.5bn at FYE09 (while being down EUR 2bn yoy). Leverage increased to 1.3x from 0.8x at FYE09 and 1.6x yoy. Looking ahead, Bouygues will work down its record order book in Construction (EUR 14bn +17% yoy or 96% of FY10 sales). In Colas, the order book remained stable at EUR 7.2bn, while Immobilier's order book slightly increased qoq to EUR 2.2bn by 1H10, with new orders from residential construction offsetting continuously weak commercial construction markets. All in all, Bouygues targets sales of EUR 30.4bn (-3%) in 2010. With regard to its solidly performing media and telecom operations, Bouygues has in the past repeatedly stated that it does not intend to sell either. It also owns a 30% stake in French capital goods giant Alstom.
Baa2n/BBB-s/-- Weakening Ciments Francais (CMFP): Marketweight 2.2%Ciments Francais is majority-owned by Italcementi of Italy. The stand-alone credit quality of CF is better than that of its parent, but weighed down by the latter's aggressively leveraged financial profile. CF's FY09 results reflected weakening construction activity in the key markets of France (together with Belgium 36% of FY09 sales), Spain (5%) and North America (10%), which could be offset by buoyant activities in emerging markets like Egypt (19%) or Morocco (8%). Recently, the company launched a tender offer for its USPP, presumably in an effort to centralize financing at the level of its Italian parent company Italcementi. (3Q10 results: 3 November)
Baa1n/BBB+n/BBB+n Stable CRH (CRHID): Marketweight 3.6%Moody's affirmed CRH's Baa1 rating but changed the outlook from stable to negative following the second profit warning in a few months, with CRH now expecting FY10 EBITDA to decline by 20% yoy (1H09: EUR 650mn) versus the initial 10%. Moody's rating affirmation is likely based on the expectation that management will curtail its acquisition spending in favor of its balance sheet profile for the time being. In addition, CRH targets to dispose of a couple of non-core businesses in the second half of 2010. Management reiterated its belief that CRH's balance sheet strength warrants an M&A "envelope" of around EUR 1.5bn over the next 12-18 months. With the development of CRH's leverage (2.8x at 1H10, up from 2.3x yoy and 2.1x at FYE09) largely linked to the company's M&A activity, ratings would be cut in case management opts for a bigger acquisition over the next couple of weeks and months. The ratings could also be lowered should trading conditions not recover and CRH's RCF/net debt ratio (Moody's) slip below the mid-twenties or FFO/net adj. debt of below 30%, combined with a limited likelihood of a recovery in the short term. (FY10 results: 2 March)
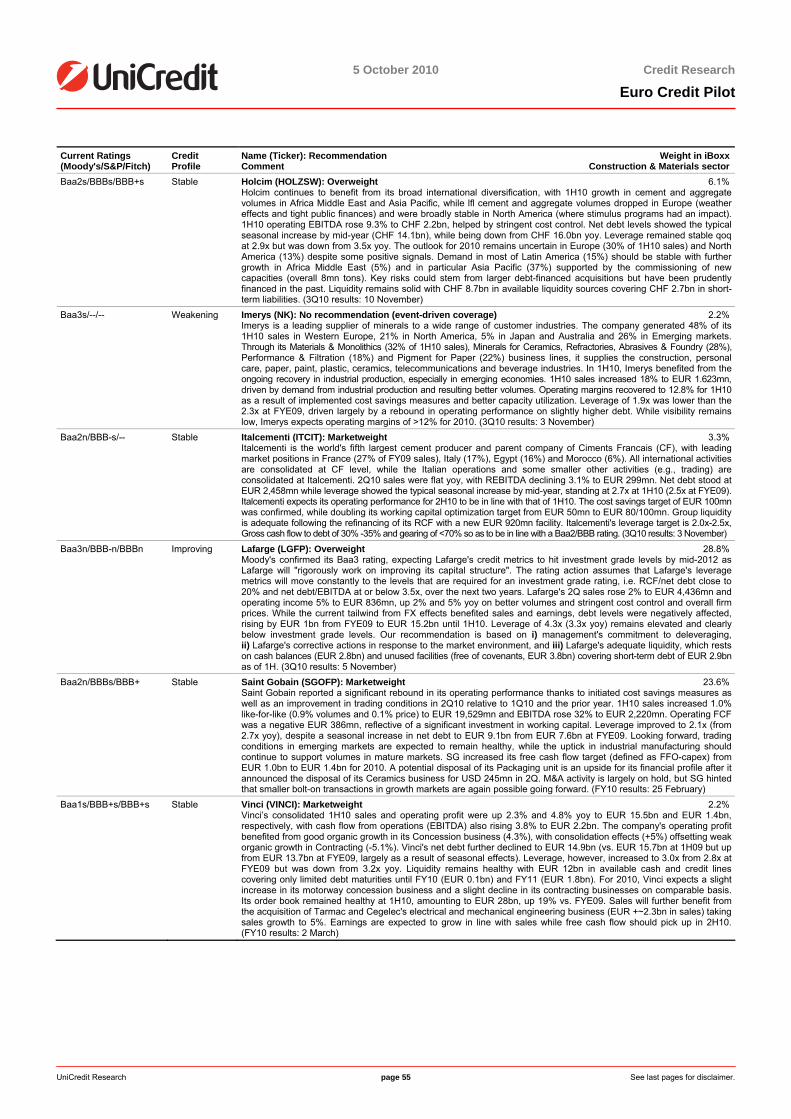
5 October 2010
5 October 2010 Credit Research
Euro Credit Pilot
UniCredit Research page 55 See last pages for disclaimer.
Current Ratings (Moody's/S&P/Fitch)
Credit Profile
Name (Ticker): Recommendation Weight in iBoxxComment Construction & Materials sector
Baa2s/BBBs/BBB+s Stable Holcim (HOLZSW): Overweight 6.1%Holcim continues to benefit from its broad international diversification, with 1H10 growth in cement and aggregate volumes in Africa Middle East and Asia Pacific, while lfl cement and aggregate volumes dropped in Europe (weather effects and tight public finances) and were broadly stable in North America (where stimulus programs had an impact). 1H10 operating EBITDA rose 9.3% to CHF 2.2bn, helped by stringent cost control. Net debt levels showed the typical seasonal increase by mid-year (CHF 14.1bn), while being down from CHF 16.0bn yoy. Leverage remained stable qoq at 2.9x but was down from 3.5x yoy. The outlook for 2010 remains uncertain in Europe (30% of 1H10 sales) and North America (13%) despite some positive signals. Demand in most of Latin America (15%) should be stable with further growth in Africa Middle East (5%) and in particular Asia Pacific (37%) supported by the commissioning of new capacities (overall 8mn tons). Key risks could stem from larger debt-financed acquisitions but have been prudently financed in the past. Liquidity remains solid with CHF 8.7bn in available liquidity sources covering CHF 2.7bn in short-term liabilities. (3Q10 results: 10 November)
Baa3s/--/-- Weakening Imerys (NK): No recommendation (event-driven coverage) 2.2%Imerys is a leading supplier of minerals to a wide range of customer industries. The company generated 48% of its 1H10 sales in Western Europe, 21% in North America, 5% in Japan and Australia and 26% in Emerging markets. Through its Materials & Monolithics (32% of 1H10 sales), Minerals for Ceramics, Refractories, Abrasives & Foundry (28%), Performance & Filtration (18%) and Pigment for Paper (22%) business lines, it supplies the construction, personal care, paper, paint, plastic, ceramics, telecommunications and beverage industries. In 1H10, Imerys benefited from the ongoing recovery in industrial production, especially in emerging economies. 1H10 sales increased 18% to EUR 1.623mn, driven by demand from industrial production and resulting better volumes. Operating margins recovered to 12.8% for 1H10 as a result of implemented cost savings measures and better capacity utilization. Leverage of 1.9x was lower than the 2.3x at FYE09, driven largely by a rebound in operating performance on slightly higher debt. While visibility remains low, Imerys expects operating margins of >12% for 2010. (3Q10 results: 3 November)
Baa2n/BBB-s/-- Stable Italcementi (ITCIT): Marketweight 3.3%Italcementi is the world's fifth largest cement producer and parent company of Ciments Francais (CF), with leading market positions in France (27% of FY09 sales), Italy (17%), Egypt (16%) and Morocco (6%). All international activities are consolidated at CF level, while the Italian operations and some smaller other activities (e.g., trading) are consolidated at Italcementi. 2Q10 sales were flat yoy, with REBITDA declining 3.1% to EUR 299mn. Net debt stood at EUR 2,458mn while leverage showed the typical seasonal increase by mid-year, standing at 2.7x at 1H10 (2.5x at FYE09). Italcementi expects its operating performance for 2H10 to be in line with that of 1H10. The cost savings target of EUR 100mn was confirmed, while doubling its working capital optimization target from EUR 50mn to EUR 80/100mn. Group liquidity is adequate following the refinancing of its RCF with a new EUR 920mn facility. Italcementi's leverage target is 2.0x-2.5x, Gross cash flow to debt of 30% -35% and gearing of <70% so as to be in line with a Baa2/BBB rating. (3Q10 results: 3 November)
Baa3n/BBB-n/BBBn Improving Lafarge (LGFP): Overweight 28.8%Moody's confirmed its Baa3 rating, expecting Lafarge's credit metrics to hit investment grade levels by mid-2012 as Lafarge will "rigorously work on improving its capital structure". The rating action assumes that Lafarge's leverage metrics will move constantly to the levels that are required for an investment grade rating, i.e. RCF/net debt close to 20% and net debt/EBITDA at or below 3.5x, over the next two years. Lafarge's 2Q sales rose 2% to EUR 4,436mn and operating income 5% to EUR 836mn, up 2% and 5% yoy on better volumes and stringent cost control and overall firm prices. While the current tailwind from FX effects benefited sales and earnings, debt levels were negatively affected, rising by EUR 1bn from FYE09 to EUR 15.2bn until 1H10. Leverage of 4.3x (3.3x yoy) remains elevated and clearly below investment grade levels. Our recommendation is based on i) management's commitment to deleveraging, ii) Lafarge's corrective actions in response to the market environment, and iii) Lafarge's adequate liquidity, which rests on cash balances (EUR 2.8bn) and unused facilities (free of covenants, EUR 3.8bn) covering short-term debt of EUR 2.9bn as of 1H. (3Q10 results: 5 November)
Baa2n/BBBs/BBB+ Stable Saint Gobain (SGOFP): Marketweight 23.6%Saint Gobain reported a significant rebound in its operating performance thanks to initiated cost savings measures as well as an improvement in trading conditions in 2Q10 relative to 1Q10 and the prior year. 1H10 sales increased 1.0% like-for-like (0.9% volumes and 0.1% price) to EUR 19,529mn and EBITDA rose 32% to EUR 2,220mn. Operating FCF was a negative EUR 386mn, reflective of a significant investment in working capital. Leverage improved to 2.1x (from 2.7x yoy), despite a seasonal increase in net debt to EUR 9.1bn from EUR 7.6bn at FYE09. Looking forward, trading conditions in emerging markets are expected to remain healthy, while the uptick in industrial manufacturing should continue to support volumes in mature markets. SG increased its free cash flow target (defined as FFO-capex) from EUR 1.0bn to EUR 1.4bn for 2010. A potential disposal of its Packaging unit is an upside for its financial profile after it announced the disposal of its Ceramics business for USD 245mn in 2Q. M&A activity is largely on hold, but SG hinted that smaller bolt-on transactions in growth markets are again possible going forward. (FY10 results: 25 February)
Baa1s/BBB+s/BBB+s Stable Vinci (VINCI): Marketweight 2.2%Vinci’s consolidated 1H10 sales and operating profit were up 2.3% and 4.8% yoy to EUR 15.5bn and EUR 1.4bn, respectively, with cash flow from operations (EBITDA) also rising 3.8% to EUR 2.2bn. The company's operating profit benefited from good organic growth in its Concession business (4.3%), with consolidation effects (+5%) offsetting weak organic growth in Contracting (-5.1%). Vinci's net debt further declined to EUR 14.9bn (vs. EUR 15.7bn at 1H09 but up from EUR 13.7bn at FYE09, largely as a result of seasonal effects). Leverage, however, increased to 3.0x from 2.8x at FYE09 but was down from 3.2x yoy. Liquidity remains healthy with EUR 12bn in available cash and credit lines covering only limited debt maturities until FY10 (EUR 0.1bn) and FY11 (EUR 1.8bn). For 2010, Vinci expects a slight increase in its motorway concession business and a slight decline in its contracting businesses on comparable basis. Its order book remained healthy at 1H10, amounting to EUR 28bn, up 19% vs. FYE09. Sales will further benefit from the acquisition of Tarmac and Cegelec's electrical and mechanical engineering business (EUR +~2.3bn in sales) taking sales growth to 5%. Earnings are expected to grow in line with sales while free cash flow should pick up in 2H10. (FY10 results: 2 March)

5 October 2010
5 October 2010 Credit Research
Euro Credit Pilot
UniCredit Research page 56 See last pages for disclaimer.
Current Ratings (Moody's/S&P/Fitch)
Credit Profile
Name (Ticker): Recommendation Weight in iBoxxComment Construction & Materials sector
Baa3/BBB/BBB- Stable Voto-Votorantim (VOTORA): No recommendation (event-driven coverage) 3.3%Brazilian Votorantim group ranks among the largest Brazilian conglomerates comprising industrial activities including cement, metals, steel, chemicals (accounting for 70% of sales) as well as financial services (30%). Voto Votorantim' notes are jointly and severally guaranteed by Votorantim, as well as its subsidiaries Votorantim Cimentos Brasil and Companhia Brasileira de Aluminio. Votorantim had BRL 22.8bn in adjusted debt at FY09, taking leverage (in terms of debt/EBITDA) to 4.9x from 4.7x yoy, a level which is considered high for the rating category. However, leverage is expected to improve in 2010 owing to new capacities and improved market conditions for commodities. Owing to management's focus on free cash-flow generation, Moody's expects leverage to trend towards 2.5x over the near term.
Jochen Schlachter (UniCredit Bank) +49 89 378-13212 [email protected]
Health Care (Underweight) Sector key figures Sector Wrap-Up Weight in iBoxx NFI: Current ASW spread: change mom/YTD: Euro STOXX HCA YTD:
6.4% 49.3bp +5.2/+2.2 -3.1%
Sector drivers: Overall, pharma companies reported 2Q10 results beating market expectations. However, we have concerns that reported earnings have a sustainable basis given the huge number of expiring patents in the near future. The phase of debtholder-friendly measures came to an end as AstraZeneca and Sanofi already started to repurchase own shares and should continue to do so in the course of 2010. Following several multi-billion USD transactions with a total deal volume of more than USD 150bn during 2009, it is very likely that we will see further mid-to-large size M&A deals during the year. Most prominent companies should be JNJ, BMY, AZN and SANFP. For example, Sanofi might consider a bid for such a "mid-sized" company as the board would support a bid of up to USD 18bn for Genzyme. Due to the fact that covered pharma iBoxx companies will lose USD 70bn in sales caused by expiring patents between 2010 and 2012, there is intense pressure on pharma players to keep up the pace of growth exhibited in the past or even to keep their current top-line. The impact of the initiated reform of the healthcare system in the US may not be substantial for pharma companies. Pharma companies (mainly US based companies) only slightly revised their guidance for FY10 due to the US healthcare reform. Besides aforementioned challenging factors, main drivers for further growth perspectives (e.g., the aging population and the often unhealthy lifestyle in the Western Hemisphere, growing GDP and wealth in emerging markets) are still valid. Last month's recap: In September, bonds of GSK outperformed the iBoxx Health Care (-4bp), while Merck KGaA bonds underperformed it. Despite the pending takeover of Genzyme, outstanding Sanofi bonds performed in line with the index.
Current Ratings (Moody's/S&P/Fitch)
Credit Profile
Name (Ticker): Recommendation Weight in iBoxxComment Health Care sector
A1s/AA-s/AA-s Stable AstraZeneca (AZN): Underweight 1.9%1H10 results beat market expectations in terms of sales and operating profit. Despite the large exposure to the US (41% of sales) and first visible impacts of the health-care reform on the pharma industry as well as generic competition, the company was able to report a solid operating performance in 1H10. Operating profit improved by 5% yoy to USD 7.5bn, resulting in an operating margin of an impressive 45%. In addition, the company raised its guidance for FY10. However the medium-term outlook provided in early 2010 is anything but rosy for bondholders. With expected sales of USD 28bn to USD 34bn by 2014, the top-line volume is close to that reported for FY09 (USD 32.8bn), making bolt-on acquisitions necessary to satisfy shareholders. We calculate adj. total debt to EBITDA of 0.9x (FY09: 1.0x) and adj. FFO to total debt of 80% (72%), which is quite good for the current ratings. However, we do not expect a further improvement of the credit profile given the existing share buyback program of USD 2bn in FY10 and looming (debt-financed) M&A activity. We keep our underweight recommendation on the name due to the tight spread levels and the elevated event risk. In September, the AZN 15 slightly outperformed the sector. (9M10 results: 28 October)
A2s/A+s/A+s Stable Bristol-Myers Squibb (BMY): Underweight 2.6%BMS released a solid set of 2Q10 results, beating the market forecast. 2Q10 sales increased by 2% yoy to USD 4.8bn, whereby the US health care reform had a negative effect of 1.5%. Thanks to the reduced cost basis, operating profit increased from USD 1.4bn to USD 1.5bn. The company affirmed its guidance for FY10, as it still expects an EPS (pre one-offs) in a range of USD 2.10 to USD 2.20. However, when comparing this guidance with that for FY13, the outlook is quite bleak based on the expected EPS of USD 1.95, which mainly reflects the expiring patent of BMS' major product Plavix which generated USD 6.1bn in FY09 or almost 33% of BMS' total sales in FY09. The credit profile remained stable during 1H10, with adj. total debt to EBITDA of 1.3x (FY09: 1.3x), well in line with the current rating category. Based on the current underleveraged balance sheet, BMS is an attractive target for other larger players in the pharma industry who would like to eventually gain access to BMS' pipeline and the huge amount of cash. At the same time, bolt-on acquisitions should arise in the near future given the bleak outlook provided for 2013 to its shareholders. In September, BMY bonds slightly outperformed the iBoxx Health Care. Due to the existing M&A risk (a transaction with BMY as a target and as an acquirer is possible), we keep our underweight recommendation on the name. (9M10 results: 22 October)
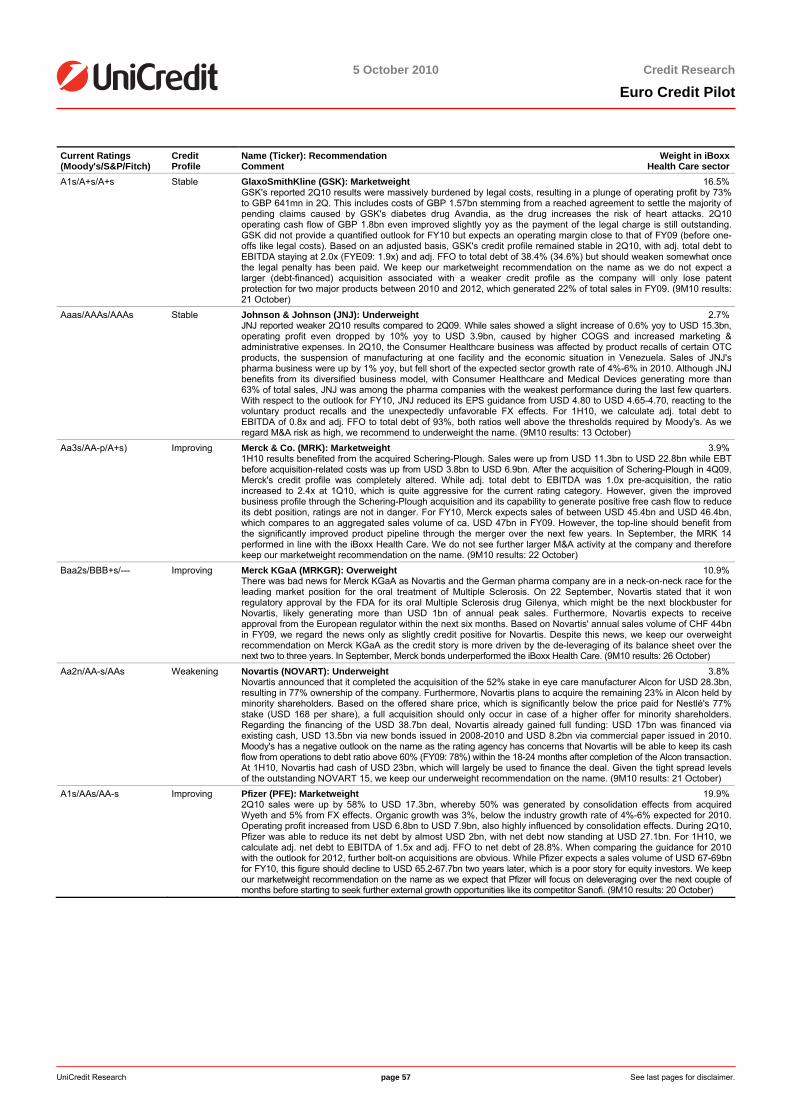
5 October 2010
5 October 2010 Credit Research
Euro Credit Pilot
UniCredit Research page 57 See last pages for disclaimer.
Current Ratings (Moody's/S&P/Fitch)
Credit Profile
Name (Ticker): Recommendation Weight in iBoxxComment Health Care sector
A1s/A+s/A+s Stable GlaxoSmithKline (GSK): Marketweight 16.5%GSK's reported 2Q10 results were massively burdened by legal costs, resulting in a plunge of operating profit by 73% to GBP 641mn in 2Q. This includes costs of GBP 1.57bn stemming from a reached agreement to settle the majority of pending claims caused by GSK's diabetes drug Avandia, as the drug increases the risk of heart attacks. 2Q10 operating cash flow of GBP 1.8bn even improved slightly yoy as the payment of the legal charge is still outstanding. GSK did not provide a quantified outlook for FY10 but expects an operating margin close to that of FY09 (before one-offs like legal costs). Based on an adjusted basis, GSK's credit profile remained stable in 2Q10, with adj. total debt to EBITDA staying at 2.0x (FYE09: 1.9x) and adj. FFO to total debt of 38.4% (34.6%) but should weaken somewhat once the legal penalty has been paid. We keep our marketweight recommendation on the name as we do not expect a larger (debt-financed) acquisition associated with a weaker credit profile as the company will only lose patent protection for two major products between 2010 and 2012, which generated 22% of total sales in FY09. (9M10 results: 21 October)
Aaas/AAAs/AAAs Stable Johnson & Johnson (JNJ): Underweight 2.7%JNJ reported weaker 2Q10 results compared to 2Q09. While sales showed a slight increase of 0.6% yoy to USD 15.3bn, operating profit even dropped by 10% yoy to USD 3.9bn, caused by higher COGS and increased marketing & administrative expenses. In 2Q10, the Consumer Healthcare business was affected by product recalls of certain OTC products, the suspension of manufacturing at one facility and the economic situation in Venezuela. Sales of JNJ's pharma business were up by 1% yoy, but fell short of the expected sector growth rate of 4%-6% in 2010. Although JNJ benefits from its diversified business model, with Consumer Healthcare and Medical Devices generating more than 63% of total sales, JNJ was among the pharma companies with the weakest performance during the last few quarters. With respect to the outlook for FY10, JNJ reduced its EPS guidance from USD 4.80 to USD 4.65-4.70, reacting to the voluntary product recalls and the unexpectedly unfavorable FX effects. For 1H10, we calculate adj. total debt to EBITDA of 0.8x and adj. FFO to total debt of 93%, both ratios well above the thresholds required by Moody's. As we regard M&A risk as high, we recommend to underweight the name. (9M10 results: 13 October)
Aa3s/AA-p/A+s) Improving Merck & Co. (MRK): Marketweight 3.9%1H10 results benefited from the acquired Schering-Plough. Sales were up from USD 11.3bn to USD 22.8bn while EBT before acquisition-related costs was up from USD 3.8bn to USD 6.9bn. After the acquisition of Schering-Plough in 4Q09, Merck's credit profile was completely altered. While adj. total debt to EBITDA was 1.0x pre-acquisition, the ratio increased to 2.4x at 1Q10, which is quite aggressive for the current rating category. However, given the improved business profile through the Schering-Plough acquisition and its capability to generate positive free cash flow to reduce its debt position, ratings are not in danger. For FY10, Merck expects sales of between USD 45.4bn and USD 46.4bn, which compares to an aggregated sales volume of ca. USD 47bn in FY09. However, the top-line should benefit from the significantly improved product pipeline through the merger over the next few years. In September, the MRK 14 performed in line with the iBoxx Health Care. We do not see further larger M&A activity at the company and therefore keep our marketweight recommendation on the name. (9M10 results: 22 October)
Baa2s/BBB+s/--- Improving Merck KGaA (MRKGR): Overweight 10.9%There was bad news for Merck KGaA as Novartis and the German pharma company are in a neck-on-neck race for the leading market position for the oral treatment of Multiple Sclerosis. On 22 September, Novartis stated that it won regulatory approval by the FDA for its oral Multiple Sclerosis drug Gilenya, which might be the next blockbuster for Novartis, likely generating more than USD 1bn of annual peak sales. Furthermore, Novartis expects to receive approval from the European regulator within the next six months. Based on Novartis' annual sales volume of CHF 44bn in FY09, we regard the news only as slightly credit positive for Novartis. Despite this news, we keep our overweight recommendation on Merck KGaA as the credit story is more driven by the de-leveraging of its balance sheet over the next two to three years. In September, Merck bonds underperformed the iBoxx Health Care. (9M10 results: 26 October)
Aa2n/AA-s/AAs Weakening Novartis (NOVART): Underweight 3.8%Novartis announced that it completed the acquisition of the 52% stake in eye care manufacturer Alcon for USD 28.3bn, resulting in 77% ownership of the company. Furthermore, Novartis plans to acquire the remaining 23% in Alcon held by minority shareholders. Based on the offered share price, which is significantly below the price paid for Nestlé's 77% stake (USD 168 per share), a full acquisition should only occur in case of a higher offer for minority shareholders. Regarding the financing of the USD 38.7bn deal, Novartis already gained full funding: USD 17bn was financed via existing cash, USD 13.5bn via new bonds issued in 2008-2010 and USD 8.2bn via commercial paper issued in 2010. Moody's has a negative outlook on the name as the rating agency has concerns that Novartis will be able to keep its cash flow from operations to debt ratio above 60% (FY09: 78%) within the 18-24 months after completion of the Alcon transaction. At 1H10, Novartis had cash of USD 23bn, which will largely be used to finance the deal. Given the tight spread levels of the outstanding NOVART 15, we keep our underweight recommendation on the name. (9M10 results: 21 October)
A1s/AAs/AA-s Improving Pfizer (PFE): Marketweight 19.9%2Q10 sales were up by 58% to USD 17.3bn, whereby 50% was generated by consolidation effects from acquired Wyeth and 5% from FX effects. Organic growth was 3%, below the industry growth rate of 4%-6% expected for 2010. Operating profit increased from USD 6.8bn to USD 7.9bn, also highly influenced by consolidation effects. During 2Q10, Pfizer was able to reduce its net debt by almost USD 2bn, with net debt now standing at USD 27.1bn. For 1H10, we calculate adj. net debt to EBITDA of 1.5x and adj. FFO to net debt of 28.8%. When comparing the guidance for 2010 with the outlook for 2012, further bolt-on acquisitions are obvious. While Pfizer expects a sales volume of USD 67-69bn for FY10, this figure should decline to USD 65.2-67.7bn two years later, which is a poor story for equity investors. We keep our marketweight recommendation on the name as we expect that Pfizer will focus on deleveraging over the next couple of months before starting to seek further external growth opportunities like its competitor Sanofi. (9M10 results: 20 October)
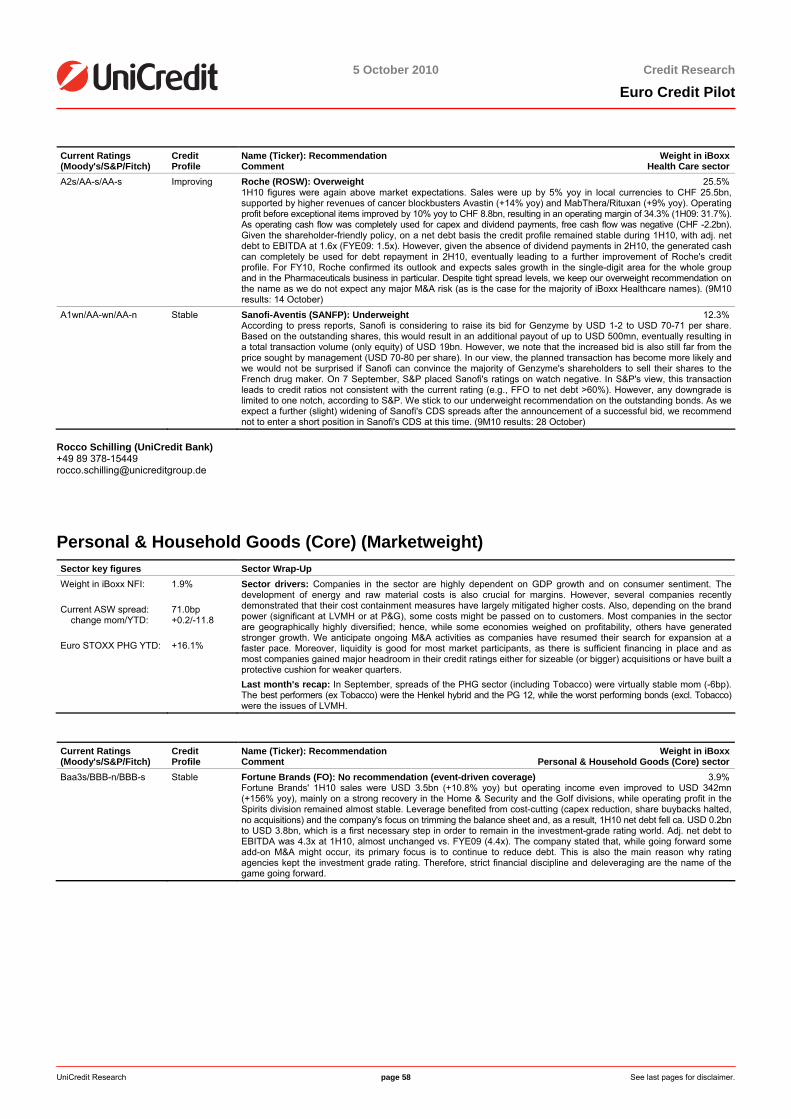
5 October 2010
5 October 2010 Credit Research
Euro Credit Pilot
UniCredit Research page 58 See last pages for disclaimer.
Current Ratings (Moody's/S&P/Fitch)
Credit Profile
Name (Ticker): Recommendation Weight in iBoxxComment Health Care sector
A2s/AA-s/AA-s Improving Roche (ROSW): Overweight 25.5%1H10 figures were again above market expectations. Sales were up by 5% yoy in local currencies to CHF 25.5bn, supported by higher revenues of cancer blockbusters Avastin (+14% yoy) and MabThera/Rituxan (+9% yoy). Operating profit before exceptional items improved by 10% yoy to CHF 8.8bn, resulting in an operating margin of 34.3% (1H09: 31.7%). As operating cash flow was completely used for capex and dividend payments, free cash flow was negative (CHF -2.2bn). Given the shareholder-friendly policy, on a net debt basis the credit profile remained stable during 1H10, with adj. net debt to EBITDA at 1.6x (FYE09: 1.5x). However, given the absence of dividend payments in 2H10, the generated cash can completely be used for debt repayment in 2H10, eventually leading to a further improvement of Roche's credit profile. For FY10, Roche confirmed its outlook and expects sales growth in the single-digit area for the whole group and in the Pharmaceuticals business in particular. Despite tight spread levels, we keep our overweight recommendation on the name as we do not expect any major M&A risk (as is the case for the majority of iBoxx Healthcare names). (9M10 results: 14 October)
A1wn/AA-wn/AA-n Stable Sanofi-Aventis (SANFP): Underweight 12.3%According to press reports, Sanofi is considering to raise its bid for Genzyme by USD 1-2 to USD 70-71 per share. Based on the outstanding shares, this would result in an additional payout of up to USD 500mn, eventually resulting in a total transaction volume (only equity) of USD 19bn. However, we note that the increased bid is also still far from the price sought by management (USD 70-80 per share). In our view, the planned transaction has become more likely and we would not be surprised if Sanofi can convince the majority of Genzyme's shareholders to sell their shares to the French drug maker. On 7 September, S&P placed Sanofi's ratings on watch negative. In S&P's view, this transaction leads to credit ratios not consistent with the current rating (e.g., FFO to net debt >60%). However, any downgrade is limited to one notch, according to S&P. We stick to our underweight recommendation on the outstanding bonds. As we expect a further (slight) widening of Sanofi's CDS spreads after the announcement of a successful bid, we recommend not to enter a short position in Sanofi's CDS at this time. (9M10 results: 28 October)
Rocco Schilling (UniCredit Bank) +49 89 378-15449 [email protected]
Personal & Household Goods (Core) (Marketweight) Sector key figures Sector Wrap-Up Weight in iBoxx NFI: Current ASW spread: change mom/YTD: Euro STOXX PHG YTD:
1.9% 71.0bp +0.2/-11.8 +16.1%
Sector drivers: Companies in the sector are highly dependent on GDP growth and on consumer sentiment. The development of energy and raw material costs is also crucial for margins. However, several companies recently demonstrated that their cost containment measures have largely mitigated higher costs. Also, depending on the brand power (significant at LVMH or at P&G), some costs might be passed on to customers. Most companies in the sector are geographically highly diversified; hence, while some economies weighed on profitability, others have generated stronger growth. We anticipate ongoing M&A activities as companies have resumed their search for expansion at a faster pace. Moreover, liquidity is good for most market participants, as there is sufficient financing in place and as most companies gained major headroom in their credit ratings either for sizeable (or bigger) acquisitions or have built a protective cushion for weaker quarters. Last month's recap: In September, spreads of the PHG sector (including Tobacco) were virtually stable mom (-6bp). The best performers (ex Tobacco) were the Henkel hybrid and the PG 12, while the worst performing bonds (excl. Tobacco) were the issues of LVMH.
Current Ratings (Moody's/S&P/Fitch)
Credit Profile
Name (Ticker): Recommendation Weight in iBoxxComment Personal & Household Goods (Core) sector
Baa3s/BBB-n/BBB-s Stable Fortune Brands (FO): No recommendation (event-driven coverage) 3.9%Fortune Brands' 1H10 sales were USD 3.5bn (+10.8% yoy) but operating income even improved to USD 342mn (+156% yoy), mainly on a strong recovery in the Home & Security and the Golf divisions, while operating profit in the Spirits division remained almost stable. Leverage benefited from cost-cutting (capex reduction, share buybacks halted, no acquisitions) and the company's focus on trimming the balance sheet and, as a result, 1H10 net debt fell ca. USD 0.2bn to USD 3.8bn, which is a first necessary step in order to remain in the investment-grade rating world. Adj. net debt to EBITDA was 4.3x at 1H10, almost unchanged vs. FYE09 (4.4x). The company stated that, while going forward some add-on M&A might occur, its primary focus is to continue to reduce debt. This is also the main reason why rating agencies kept the investment grade rating. Therefore, strict financial discipline and deleveraging are the name of the game going forward.
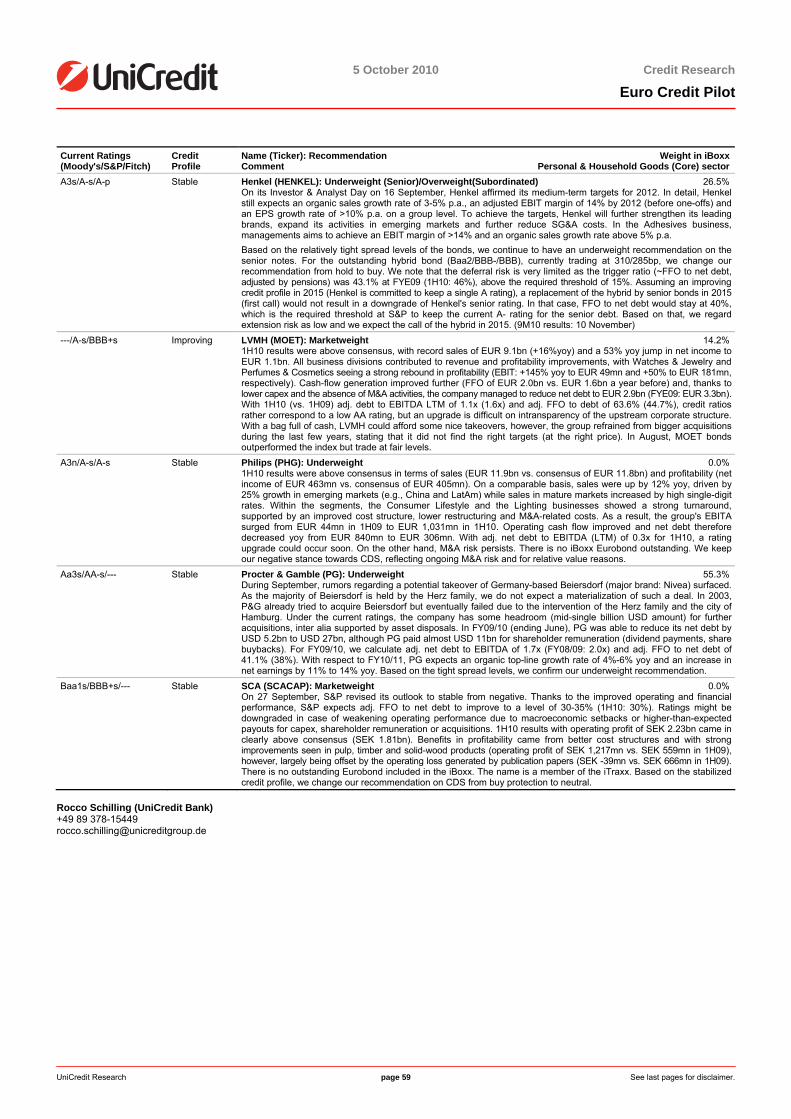
5 October 2010
5 October 2010 Credit Research
Euro Credit Pilot
UniCredit Research page 59 See last pages for disclaimer.
Current Ratings (Moody's/S&P/Fitch)
Credit Profile
Name (Ticker): Recommendation Weight in iBoxxComment Personal & Household Goods (Core) sector
A3s/A-s/A-p Stable Henkel (HENKEL): Underweight (Senior)/Overweight(Subordinated) 26.5%On its Investor & Analyst Day on 16 September, Henkel affirmed its medium-term targets for 2012. In detail, Henkel still expects an organic sales growth rate of 3-5% p.a., an adjusted EBIT margin of 14% by 2012 (before one-offs) and an EPS growth rate of >10% p.a. on a group level. To achieve the targets, Henkel will further strengthen its leading brands, expand its activities in emerging markets and further reduce SG&A costs. In the Adhesives business, managements aims to achieve an EBIT margin of >14% and an organic sales growth rate above 5% p.a. Based on the relatively tight spread levels of the bonds, we continue to have an underweight recommendation on the senior notes. For the outstanding hybrid bond (Baa2/BBB-/BBB), currently trading at 310/285bp, we change our recommendation from hold to buy. We note that the deferral risk is very limited as the trigger ratio (~FFO to net debt, adjusted by pensions) was 43.1% at FYE09 (1H10: 46%), above the required threshold of 15%. Assuming an improving credit profile in 2015 (Henkel is committed to keep a single A rating), a replacement of the hybrid by senior bonds in 2015 (first call) would not result in a downgrade of Henkel's senior rating. In that case, FFO to net debt would stay at 40%, which is the required threshold at S&P to keep the current A- rating for the senior debt. Based on that, we regard extension risk as low and we expect the call of the hybrid in 2015. (9M10 results: 10 November)
---/A-s/BBB+s Improving LVMH (MOET): Marketweight 14.2%1H10 results were above consensus, with record sales of EUR 9.1bn (+16%yoy) and a 53% yoy jump in net income to EUR 1.1bn. All business divisions contributed to revenue and profitability improvements, with Watches & Jewelry and Perfumes & Cosmetics seeing a strong rebound in profitability (EBIT: +145% yoy to EUR 49mn and +50% to EUR 181mn, respectively). Cash-flow generation improved further (FFO of EUR 2.0bn vs. EUR 1.6bn a year before) and, thanks to lower capex and the absence of M&A activities, the company managed to reduce net debt to EUR 2.9bn (FYE09: EUR 3.3bn). With 1H10 (vs. 1H09) adj. debt to EBITDA LTM of 1.1x (1.6x) and adj. FFO to debt of 63.6% (44.7%), credit ratios rather correspond to a low AA rating, but an upgrade is difficult on intransparency of the upstream corporate structure. With a bag full of cash, LVMH could afford some nice takeovers, however, the group refrained from bigger acquisitions during the last few years, stating that it did not find the right targets (at the right price). In August, MOET bonds outperformed the index but trade at fair levels.
A3n/A-s/A-s Stable Philips (PHG): Underweight 0.0%1H10 results were above consensus in terms of sales (EUR 11.9bn vs. consensus of EUR 11.8bn) and profitability (net income of EUR 463mn vs. consensus of EUR 405mn). On a comparable basis, sales were up by 12% yoy, driven by 25% growth in emerging markets (e.g., China and LatAm) while sales in mature markets increased by high single-digit rates. Within the segments, the Consumer Lifestyle and the Lighting businesses showed a strong turnaround, supported by an improved cost structure, lower restructuring and M&A-related costs. As a result, the group's EBITA surged from EUR 44mn in 1H09 to EUR 1,031mn in 1H10. Operating cash flow improved and net debt therefore decreased yoy from EUR 840mn to EUR 306mn. With adj. net debt to EBITDA (LTM) of 0.3x for 1H10, a rating upgrade could occur soon. On the other hand, M&A risk persists. There is no iBoxx Eurobond outstanding. We keep our negative stance towards CDS, reflecting ongoing M&A risk and for relative value reasons.
Aa3s/AA-s/--- Stable Procter & Gamble (PG): Underweight 55.3%During September, rumors regarding a potential takeover of Germany-based Beiersdorf (major brand: Nivea) surfaced. As the majority of Beiersdorf is held by the Herz family, we do not expect a materialization of such a deal. In 2003, P&G already tried to acquire Beiersdorf but eventually failed due to the intervention of the Herz family and the city of Hamburg. Under the current ratings, the company has some headroom (mid-single billion USD amount) for further acquisitions, inter alia supported by asset disposals. In FY09/10 (ending June), PG was able to reduce its net debt by USD 5.2bn to USD 27bn, although PG paid almost USD 11bn for shareholder remuneration (dividend payments, share buybacks). For FY09/10, we calculate adj. net debt to EBITDA of 1.7x (FY08/09: 2.0x) and adj. FFO to net debt of 41.1% (38%). With respect to FY10/11, PG expects an organic top-line growth rate of 4%-6% yoy and an increase in net earnings by 11% to 14% yoy. Based on the tight spread levels, we confirm our underweight recommendation.
Baa1s/BBB+s/--- Stable SCA (SCACAP): Marketweight 0.0%On 27 September, S&P revised its outlook to stable from negative. Thanks to the improved operating and financial performance, S&P expects adj. FFO to net debt to improve to a level of 30-35% (1H10: 30%). Ratings might be downgraded in case of weakening operating performance due to macroeconomic setbacks or higher-than-expected payouts for capex, shareholder remuneration or acquisitions. 1H10 results with operating profit of SEK 2.23bn came in clearly above consensus (SEK 1.81bn). Benefits in profitability came from better cost structures and with strong improvements seen in pulp, timber and solid-wood products (operating profit of SEK 1,217mn vs. SEK 559mn in 1H09), however, largely being offset by the operating loss generated by publication papers (SEK -39mn vs. SEK 666mn in 1H09). There is no outstanding Eurobond included in the iBoxx. The name is a member of the iTraxx. Based on the stabilized credit profile, we change our recommendation on CDS from buy protection to neutral.
Rocco Schilling (UniCredit Bank) +49 89 378-15449 [email protected]
5 October 2010
5 October 2010 Credit Research
Euro Credit Pilot
UniCredit Research page 60 See last pages for disclaimer.
Tobacco (Overweight) Sector key figures Sector Wrap-Up Weight in iBoxx NFI: Current ASW spread: change mom/YTD: Euro STOXX PHG YTD:
2.3% 81.1bp -1.0/-11.6 +16.1%
Sector drivers: During the last few quarters, tobacco companies were more or less in a position to offset declining cigarette volumes by price increases and cost cuts. Given the already initiated government measures to reduce tobacco consumption, it should become more challenging for tobacco firms to keep the current level of generated cash flows. However, we do not expect any material effects on credit profiles in the absence of class action lawsuits from smokers. The market expects sales to rise by ca. 2% in 2010 and by ca. 3% in 2011, which compares to an organic growth rate of 3.6% in 2009. As tobacco companies are faced with slowing growth and further government measures, Imperial together with Japan Tobacco and BAT announced their intention to seek a judicial review of the government's proposal to introduce a display ban in the UK as of October 2011. In our view, such a ban would be a further pin-prick for tobaccos' operating performance, which might be spread across other European countries in the medium term. Even if the protest of tobacco firms is successful, companies can't stop the initiated process of the European Commission to reduce the number of smokers by 10% in the EU until 2014. As a result, growth perspectives will suffer from further price increases, mainly driven by additional tax burdens in mature markets in the medium-to-long term. Nevertheless, tobacco companies are still in the comfortable position to steer their balance sheets as they want as cash flows are strong enough to finance capex and dividend payouts with ease. Furthermore, the almost fully consolidated sector does not offer potential larger acquisition targets anymore, eventually resulting in abating M&A risk in the tobacco sector. M&A risk might increase again if tobacco firms decide to diversify their activities into other sectors like food & beverages in the medium-to-long term. Last month's recap: In September, the iBoxx Personal & Household Goods tightened by ca. 6bp, with almost all outstanding bonds outperforming the index (except JAPTOB 14). Issues of Imperial showed the best performance within the tobacco sector, while BAT and PM underperformed the iBoxx PHG.
Current Ratings (Moody's/S&P/Fitch)
Credit Profile
Name (Ticker): Recommendation Weight in iBoxxComment Tobacco sector
Baa1s/BBB+s/BBB+s Stable BAT (BATSLN): Overweight 35.2%1H10 results were above market expectations in terms of sales and operating profit, with sales increasing by 8% yoy to GBP 7.3bn and operating profit before one-off items surging by 14% yoy to GBP 2,460mn, supported by favorable effects from FX, lower costs, better pricing and acquired businesses, offsetting declining cigarette volumes and an increase of illicit trading in some markets. In BAT's top 40 markets, sold cigarette volume was down by 3% yoy (348bn sticks sold in 1H10 vs. 349bn sticks in 1H09), slightly better than reported by Imperial Tobacco for 9M09/10 (-4.3% yoy). Reported net debt remained stable during 1H10 and was GBP 8,971mn (FYE09: GBP 8,842mn). For 1H10, we calculate adj. net debt to EBITDA of 1.9x (FYE09: 2.0x) and adj. FFO to net debt of 34.3% (33.2%). Credit metrics are strong for the current ratings as S&P requires an adj. FFO to net debt ratio of 25% to 30% to keep the current ratings. We keep our overweight recommendation on BAT's cash bonds given its defensive business model, its diversified product portfolio, its strong cash position and its BBB+ target rating. We have a neutral stance towards CDS. (9M10 results: 27 October)
Baa3s/BBBs/BBB-s Improving Imperial Tobacco (IMTLN): Overweight 41.6%In the trading statement for FY09/10 (ending 30 September), Imperial stated that tobacco net revenues increased by 3% yoy. However, stick equivalent volumes declined by 3% yoy, while the fine cut tobacco business should report 6% higher volumes vs.FY08/09. As stated earlier, the working capital outflow continues to unwind, which is reflected by a cash conversion ratio of 90-100%, likely supporting a further improvement of Imperial's credit profile. As the majority of its annual cash flows is usually generated in the second half of Imperial's fiscal year, debt should be reduced again in 2H09/10. We estimate an adj. net debt/EBITDA ratio of ca. 3.5x at FYE09/10, fully commensurate with the current ratings (1H09/10: 4.1x). We keep our overweight recommendation on the name. In our view, the most attractive bond is the IMTLN 16. (FY09/10 results: 2 November)
Aa3s/A+s/A+s Weakening Japan Tobacco (JAPTOB): Underweight 3.5%The outlook for FY10/11 is very cautious as the company expects a weaker EBITDA than reported for FY09/10 (JPY 513bn vs. JPY 527bn). For 1Q10/11, we calculate adj. net debt to EBITDA of 1.8x (FY08/09: 2.1x), similar to BAT's credit profile. In our view, credit metrics are more commensurate with a weak single A rating. Given the huge tax hike in Japan as of October 2010, we do not think that the credit profile is likely to improve in FY10/11. In May, Moody's assigned an A1 rating on a stand-alone basis, which might result in negative rating actions in case of a disposal of the 50% stake by the Japanese government. We keep our underweight recommendation on Japan Tobacco given the tight spread levels of the outstanding bonds, the expected weak operating performance in FY10/11 and the heightened M&A risk. In September, the JAPTOB 14 underperformed the iBoxx PHG. (1H10/11 results: 29 October)
A2s/As/As Stable Philip Morris International Inc. (PM): Marketweight 19.7%2Q10 results were above market expectations in terms of sales and operating profit. 1Q10 sales (before FX effects and M&A) were up by 5.3% yoy to USD 7.1bn, while operating profit before these items even improved by 13.3% yoy to USD 3.0bn. Organic growth was supported by a higher cigarette shipment volume, which was up from 223bn to 241bn sticks (+8% yoy), whereby 20bn additional sticks came from the Asia region while demand declined by 4bn sticks in the EU. Additionally, better pricing in the EMEA and the Asia regions supported the operating performance. The positive free cash flow in 2Q10 led to a reduced net debt of USD 15.2bn vs. USD 16.0bn in 1Q10. PM affirmed its guidance for FY10 and expects an EPS of between USD 3.75 to USD 3.85 (FY09: USD 3.24). For 1H10, we calculate adj. net debt to EBITDA of 1.3x (FY09: 1.5x). Since FY08, net leverage moved in a close range of between 1.2x and 1.5x, which is commensurate with the current rating. Based on the outstanding share buyback program of USD 11.2bn (originally: USD 12bn) which was commenced in May 2010, we do not expect any major improvements of PM's credit profile over the next few years. S&P assigns a moderate financial risk profile and allows a net leverage of 2.0x at maximum and adj. FFO to net debt of 40% at least. We keep our marketweight recommendation on the name. (9M10 results: 21 October)
5 October 2010
5 October 2010 Credit Research
Euro Credit Pilot
UniCredit Research page 61 See last pages for disclaimer.
Current Ratings (Moody's/S&P/Fitch)
Credit Profile
Name (Ticker): Recommendation Weight in iBoxxComment Tobacco sector
Baa2s/BBBs/--- Stable Swedish Match (SWEMAT): Overweight 0.0%1H10 results did not bear any surprises, with the operating result remaining stable at SEK 1.7bn whereby the Snuff segment was able to offset the weaker Chewing Tobacco and Cigars segments. Operating cash flow declined from SEK 1.3bn to SEK 1.1bn due to higher tax payments (unfavorable timing of payments), which was completely offset by capex and share buybacks. The credit profile remained stable with leverage now at 2.1x (FY09: 2.0x). Even if the company continues its share buybacks, ratings would not be endangered. In early 2010, Swedish Match announced its intention to establish a JV with privately held Scandinavian Tobacco Group, merging the cigar businesses of both groups into one company. In 2009, Swedish Match already established a JV with Philip Morris regarding smokeless products. Maybe the relationship between the smaller Swedish Match and much bigger tobaccos will become closer over time, possibly resulting in a full acquisition of Swedish Match by better-rated Philip Morris. There is no iBoxx Eurobond outstanding. We keep our positive stance towards SWEMAT CDS and recommend to sell protection on the name. (1H10 results: 27 October)
Rocco Schilling (UniCredit Bank) +49 89 378-15449 [email protected]
Food & Beverage (Overweight) Sector key figures Sector Wrap-Up Weight in iBoxx NFI: Current ASW spread: change mom/YTD: Euro STOXX FOB YTD:
2.8% 69.7bp -2.0/-19.5 +6.0%
Sector drivers: Food & Beverage belongs to the least cyclical sectors overall (after all, people need to eat). However, sector drivers are consumer sentiment and GDP growth. Concurrently, energy and raw material costs are crucial for margin developments. Currently, Eastern European markets, Asia and Latin America offer scope for growth while Western Europe is the most price-sensitive market and the US is currently naturally rather difficult for the industry. Market conditions for consumer products companies remain sound overall, despite the current market volatility and ongoing M&A activities. The latter will proceed as companies have resumed their search for expansion at a faster pace. Moreover, liquidity is good for most market participants, as there is sufficient financing in place and as many companies gained major headroom in their credit ratings either for sizeable (or bigger) acquisitions or have built a protective cushion for weaker quarters. Last month's recap: In September, spreads in the iBoxx Food & Beverage sector tightened. Despite the announced acquisition of Alberto-Culver, Unilever issues were the best performing bonds during the last month, besides Anheuser-Busch InBev bonds. The weakest performance was posted by Diageo and Coca-Cola Hellenic Bottling.
Current Ratings (Moody's/S&P/Fitch)
Credit Profile
Name (Ticker): Recommendation Weight in iBoxxComment Food & Beverage sector
Baa2p/BBB+p/- Improving Anheuser-Busch InBev (ABIBB): Overweight 17.0%Reported 1H10 results were above market expectations in terms of EBITDA and net profit, inter alia supported by the sponsorship of the FIFA World Cup. 1H10 sales were up by 3.1% yoy organically to USD 17.5bn, while normalized EBITDA improved by 5.4% yoy to USD 6,440mn (consensus: USD 6,385mn). Normalized EBITDA margin therefore improved from 36.1% to 36.8% yoy. Although operating cash flow was slightly down yoy (USD 4.1bn vs. USD 5.1bn due to timing effects of interest and tax payments), generation of positive free cash flow remained stable. Reported net debt declined by USD 3bn and reached a level of USD 42.1bn at 1H10. The company stated that it is still committed to its target to achieve a net debt to EBITDA ratio (on a reported basis) of 2.0x in the medium term (1H10: 3.3x; FYE09: 3.7x). ABI expects a further increase in EBITDA in 3Q and 4Q vs. 2Q. Until FYE10, S&P expects the group's fully adjusted FFO to debt to move close to 25% and debt to EBITDA to 3x, which should be feasible, given the company's focus on debt reduction. We have an overweight recommendation for the issuer as the ABIBB bonds offer value (9M10 results: 3 November)
Baa1s/BBBp/--- Stable Bacardi Ltd (BACARD): No recommendation (event-driven coverage) 3.9%While the Bacardi brand is very well known, hard facts referring to the company's strategy and financials are rather difficult to find. Regular public financial information is not available. Some "sobering" facts on Bacardi: it is a privately owned company (the Bacardi family) headquartered in the Bermudas and founded in 1892. Its brands include a.o. Martini & Rossi. Its main shareholders as well as senior management are people belonging to the Bacardi family. In FYE08/09 (ending March), sales totaled USD 4.4bn (FYE07/08: USD 4.5bn) and operating profit remained flat at ca. USD 1bn. Adj. net debt/EBITDA was 2.8x (2.5x), which is on the edge for the Baa1 ratings assigned by Moody's and for the BBB rating at S&P. In August 2010, S&P changed its outlook from stable to positive due to the expected improvement of Bacardi's financial profile in the short-to-medium term. Considering the restricted information flow, our coverage of the name is event-driven.
A2s/As/As Stable Cargill Inc. (CARGIL): No recommendation (event-driven coverage) 12.8%Cargill provides extremely limited information to the financial community, i.e., it restricts the utilization of information in such a manner that, to our understanding, an independent analysis is not possible. We do not have access to the company's financial reports. On its website, Cargill published its sales figures (FY09 ending May: -3% to USD 116.6bn vs. USD 120.4bn a year before) and net earnings excl. special items (-16% yoy to USD 3.3bn vs. USD 4.0bn). Referring to business developments, the company stated that FY09 was "a tale of two halves," including record results through November and with earnings having slowed considerably in the second half. No details referring to cash flow generation or debt development are public. In the absence of the availability of financial results, and as we do not like name-lending-based recommendations nor do we like to rely solely on the assessment of rating agencies, we have an event-driven coverage on the name.
5 October 2010
5 October 2010 Credit Research
Euro Credit Pilot
UniCredit Research page 62 See last pages for disclaimer.
Current Ratings (Moody's/S&P/Fitch)
Credit Profile
Name (Ticker): Recommendation Weight in iBoxxComment Food & Beverage sector
Baa3s/---/BBB-s Improving Carlsberg (CARLB): Marketweight 5.8%Carlsberg reported strong 1H10 results, beating market expectations in terms of operating profit. Despite an organic volume decline of 3% yoy to 55.8mn hectoliters, the company was able to increase its operating profit by 12% yoy to DKK 5.0bn, supported by strong organic growth in Asia and Eastern Europe (excl. Russia) and positive FX effects. Operating cash flow was DKK 4.7bn, down from DKK 6.0bn in 1H09, whereby the previous year's cash flow benefited from a higher cash inflow from lower working capital. However, reported net debt remained broadly unchanged vs. FYE09 and was DKK 35.3bn (FYE09: DKK 35.7bn). The credit profile improved during 2Q10, with adj. net debt to EBITDA at 2.8x (FY09: 3.0x). With respect to the outlook for FY10, the company raised its guidance and now anticipates an operating profit of DKK 10bn (previously, Carlsberg expected an operating profit in line with that reported in FY09: DKK 9.4bn). The guidance is mainly based on a slight decline in Northern & Western Europe, a high single-digit percentage decline in Russia and continued market growth in Asia. We are marketweight for the name as the CARLB 14 trades at fair levels. (9M10 results: 9 November)
A3s/As/--- Stable Coca Cola Hellenic (EEEKGA): Marketweight 3.0%1H10 sales of EUR 3.3bn (+1% yoy) were primarily affected by a 2% decline in volumes in the established markets, above all in Greece, where volumes fell by ca. 10% as a reaction to the economic crisis, which prompted a massive loss of consumer confidence and spending. Italy and Ireland suffered too, with volume declines in the single-digit percentage range. Profitability, however, held up well, with 1H10 EBIT of EUR 315mn (1H09: EUR 301mn) and cash flow was also strong (operating cash flow of EUR 426mn vs. EUR 378mn). Net debt of EUR 2.2bn was broadly flat compared to FYE09. Coca Cola Hellenic remains cautious for FY10, due to lower consumer purchasing power, while on the other hand, the initiated cost-cutting measures should offset the negatives and lead to further improved profitability margins. In July, S&P removed the company from its watch list (watch negative) and now has a stable outlook on the name. We are marketweight on the name, reflecting the solid credit which, however, trades quite tight.
A3s/A-s/--- Improving Danone (BNFP): Marketweight 8.2%1H10 results were above consensus with sales (EUR 8.4bn) increasing 7% yoy overall, again thanks to Baby Nutrition (like-for-like sales: +8.7% yoy) and Medical Nutrition (+10.1%). These two divisions are also generating the highest margins (EBIT margin at Baby Nutrition: 19.2%, Medical Nutrition: 21.2%). Cash-flow generation remained excellent, with FFO improving yoy to EUR 1.2bn (1H09: EUR 846mn), but net debt increased slightly to EUR 6.7bn (from EUR 6.6bn at FYE09), mainly on higher dividends (EUR 737mn vs. EUR 221mn) a year ago. Danone is more optimistic about the current year and thus raised its expectation for sales growth to at least +6% (previously: at least +5% p.a.), while it confirmed its expectation for an increase of free cash flow from operations of at least 10% on a reported basis (vs. FY09: EUR 1.6bn). The EBIT margin should remain stable yoy. With 1H10 (vs. 1H09) adj. FFO to debt (LTM) of 33.5% (24.1%), ratings are now safe. We regard the name as a safe-haven in the bond universe. However, we change our recommendation to marketweight from overweight due to relative value reasons.
A3s/A-s/A-s Weakening Diageo (DIAG): Underweight 12.6%FY09/10 results (ending June) were slightly above market expectations in terms of operating profit. FY09/10 sales and operating profit before one-off items increased by 2% yoy to GBP 9.8bn and 2.8bn, respectively. Operating cash flow was GBP 2.3bn, supported by lower working capital yoy. Although capex was almost doubled, the company was able to generate positive free cash flow of GBP 1.1bn (pre FX effects), bringing net debt down to GBP 7.3bn (FYE08/09: GBP 7.7bn). As a result, net leverage declined from 3.0x to 2.8x, which is still weak for the current single A rating. With respect to FY10/11, Diageo expects lower free cash flow (before dividend payments) than reported for FY09/10 due to higher capex in developing markets. However, management stated that it wants to maintain the dividend growth rate of 6% in FY10/11, likely resulting in free cash flow after dividends of ca. GBP 500mn. We confirm our underweight recommendation, reflecting the still existing rating pressure, profitability deterioration and reduced management commitment to an "A" rating. In September, Diageo bonds underperformed the iBoxx Food & Beverage. (1H10/11: 11 February)
Baa2n/BBBp/BBB-s Improving Kraft Foods (KFT): Marketweight 16.0%1H10 results were driven by the Cadbury acquisition (consolidation as of February 2010), with sales jumping 26% yoy to USD 24.3bn. On a pro-forma basis, sales were up 6% yoy. The operating result increased only slightly from USD 2.8bn to USD 2.9bn. At the same time, net debt surged to USD 27.1bn. We calculate 1H10 adj. net debt to EBITDA of 4.1x compared with 2.9x at FYE09. The group will have to strongly focus on debt reduction going forward in order to keep the current ratings. We anticipate FYE10 lease and pension adj. net debt to EBITDA of ca. 3.5x and adj. FFO to net debt of ca. 21%, which is in line with the requirements for a weak investment grade rating. Adj. net debt to EBITDA should be around 3.2x at FYE11 and ca. 2.9x at FYE12. Our assumption relies on Kraft's statement that no further M&A will occur during the next few years. Kraft bonds performed in line with the iBoxx Food & Beverage. We keep our marketweight recommendation on the name. (9M10 results: 3 November)
Aa1n/AAs/AA+s Stable Nestlé (NESTLE): Overweight 0.0%Nestlé's 1H10 results beat the market consensus. 1H10 sales (CHF 55.3bn) showed an organic growth rate of 6.1% yoy, while EBIT was up by 13.6% yoy to CHF 8.4bn. The largest segment, Food & Beverages, contributed an EBIT of CHF 6.7bn, benefiting from stronger growth in Asia, Oceania & Africa as well as in the Nutrition business. Operating cash flow declined to CHF 5.8bn from CHF 6.4bn in 1H09 due to higher working capital. Due to payouts for M&A (CHF 4.4bn) and shareholder remuneration (CHF 11bn, the company completed its 3-year CHF 25 bn share buyback program), net debt increased to CHF 29.7bn from CHF 18.1bn at FYE09. As a result, adj. net leverage increased to 1.7x, up from 1.2x at FYE09. However, ratings are not endangered. The completed disposal of the 52% stake in Alcon for USD 26bn to Novartis in August should support Nestlé's credit profile in the medium term, although the company already launched a new CHF 10bn share buyback program. Nestlé affirmed its outlook for FY10 and expects an organic top-line growth rate of 5% in the Food & Beverage segment and a further EBIT margin improvement vs. FY09. 5Y CDS still trade in line with those of weaker-rated Unilever (A1/A+s/A+s). We therefore keep our positive stance towards CDS. There are no Eurobonds outstanding.
5 October 2010
5 October 2010 Credit Research
Euro Credit Pilot
UniCredit Research page 63 See last pages for disclaimer.
Current Ratings (Moody's/S&P/Fitch)
Credit Profile
Name (Ticker): Recommendation Weight in iBoxxComment Food & Beverage sector
Baa1s/BBB+s/BBB+s Stable SABMiller (SABLN): Marketweight 5.6%FY09/10 results (ending March) were strong, with a 4% yoy sales increase to USD 26.4bn and with EBITA 6% higher (to USD 4.4bn) yoy, benefiting from strong improvements in Latin America and overall from cost synergies. Cash flow generation primarily benefited from working capital management and lower capex. Net debt decreased by USD 0.3bn to USD 8.4bn, as the strong cash flow was partly offset by adverse currency effects. For FY09/10, we calculated adj. debt to EBITDA of ca. 2.1x and adj. FFO to debt of 39.4%, which is fully in line with the rating requirements. In August, rumors of a potential offer for Australia-based Foster's Group emerged. In case of an acquisition of Foster's (excl. its wine activities), negative rating actions should be limited to one notch as SABMiller would benefit from the improvement of its geographical diversification. We note that net leverage would increase to ca. 3.7x, considering an acquisition price of USD 10bn. As the SABLN 15 trades at fair levels, we do not see any reason to change our marketweight recommendation. (1H10/11 results: 18 November)
Baa2s/BBBs/-- Stable Südzucker (SUEDZU): Marketweight 2.7%On 30 September, S&P changed its outlook on Südzucker back to stable from negative, now in line with Moody's. The rating action reflects S&P's anticipation of further improvement of Südzucker's credit profile. Assuming an FFO of ca. EUR 550mn for FY10/11, S&P expects a discretionary cash flow before working capital effects of EUR 180mn, which should be used to reduce outstanding debt. For FY10/11, the rating agency expects an adj. FFO to net debt ratio of between 30-35% (1Q10/11: 28%). At the German Investment Conference held at the end of September, Südzucker confirmed its increased full-year forecast for FY10/11 (ending February), i.e., group sales of EUR 5.7bn and EBIT of more than EUR 450mn. With 1Q10/11 LTM adj. net debt to EBITDA of 2.6x (FYE09/10: 2.9x) and adj. FFO to debt of 31.2% (30.2%), Südzucker is well positioned in the BBB rating range. We have a marketweight recommendation for the SUEDZU 02/12 and a neutral stance towards CDS.
A1s/A+s/A+s Stable Unilever (UNANA): Underweight 12.5%On 27 September, Unilever announced that it will acquire the US-based manufacturer of personal care products, Alberto-Culver (Baa1/BBBwp/BBB+wp), for USD 3.7bn in cash. During the last twelve months ending in June 2010, Alberto-Culver generated sales of USD 1.6bn and an EBITDA of USD 250mn. With the acquisition, Unilever will become the largest company in hair conditioning and the second largest in shampoo. Fitch immediately affirmed Unilever's rating as the new leverage of 1.8x (FY09: 1.4x) would still be acceptable for an A+ rating. We note that Unilever is explicitly committed to a "strong single-A credit rating". While from a fundamental standpoint we continue to like Unilever, we remain on underweight for relative-value reasons. In September, Unilever bonds outperformed the iBoxx Food & Beverage. (9M10 results: 4 November)
Rocco Schilling (UniCredit Bank) +49 89 378-15449 [email protected]
Travel & Leisure (Underweight) Sector key figures Sector Wrap-Up Weight in iBoxx NFI: Current ASW spread: change mom/YTD: Euro STOXX TAL YTD:
0.7% 155.6bp +7.7/-109.9 +10.3%
Sector drivers: The iBoxx Travel & Leisure sector is very small, consisting of six bonds issued by four companies (Accor, Sodexo, Carnival, and Lottomatica) which operate in various industries (e.g., food services, cruise travel, hotels). Major spread drivers of this sector are GDP growth prospects, consumer sentiment, fuel cost development as well as the development of global passenger traffic for airline companies. We continue to believe that spreads in the rather cyclical business of Travel & Leisure will face more pressure than other sectors in case of an intensifying global economic downturn. Last month's recap: In September, spreads of the iBoxx Travel & Leisure sector tightened by approximately 11bp, thereby outperforming the iBoxx Non-Financials, mainly driven by Accor and Lottomatica bonds.
Current Ratings (Moody's/S&P/Fitch)
Credit Profile
Name (Ticker): Recommendation Weight in iBoxxComment Travel & Leisure sector
---/BBB-wn/BBB-n Stable Accor (ACCOR): Marketweight 29.7%On 30 September, Fitch changed the outlook on Accor from stable to negative following the withdrawal of the IPO of Accor's 49% stake in Groupe Lucien Barriere. On 1 October, S&P placed the rating of Accor on creditwatch negative for the same reason. Both credit agencies now expect a slower-than-anticipated deleveraging process, as proceeds from the IPO, valued at EUR 575mn-700mn, were supposed to be part of the company's plan to reduce net debt by EUR 600mn-650mn in 2010. However, the company confirmed that it is still interested in divesting its stake. The rating actions do not come as a surprise, as Accor's credit profile is currently still weak for the current ratings (1H10 adj. net debt/EBITDA: 3.4x). Given the uncertainty whether the company can deleverage towards S&P's investment grade rating hurdle ratio of FFO/net debt (adj.) of >20% by FYE10 (FY09: 19.17%), and as the 5Y CDS and shorter cash maturities trade relatively expensive for the extent of the downgrade risk (although the 5Y CDS widened by 10bp after the announcement of the withdrawal of the IPO), we downgraded the name to marketweight from overweight. (3Q10 revenue update: 20 October)
A3s/BBB+s/--- Stable Carnival plc (CCL): No recommendation (event-driven coverage) 17.6%Carnival managed the economic downturn better than feared and kept a stable credit profile. The ratings of Carnival reflect its leading position in the global cruise industry, a solid operating track record, an experienced management team, a large cash flow base, very high barriers to entry, and the company's strong liquidity position, despite the re-installment of dividend payments. With 9M09/10 (vs. 9M08/09) adj. net debt to EBITDA (LTM) of 2.4x (2.6x) the company is nicely positioned in the current rating range. (FY09/1010 results: 17 December)

5 October 2010
5 October 2010 Credit Research
Euro Credit Pilot
UniCredit Research page 64 See last pages for disclaimer.
Current Ratings (Moody's/S&P/Fitch)
Credit Profile
Name (Ticker): Recommendation Weight in iBoxxComment Travel & Leisure sector
Baa3s/BBB-s/--- Stable Lottomatica (LTOIM): Senior: Marketweight; Subordinated: BUY 17.9%The Italian gaming regulatory body has awarded the new 9-year concession for Scratch & Win to the consortium CLN, in which Lottomatica holds a 63% stake, which is positive for the group's business and financial profile. In 2Q10, credit metrics slightly weakened mainly due to payments for the new Scratch & Win license of EUR 520mn, with LTM adj. net debt/EBITDA rising to 3.6x (2Q09: 3.4x). Based on the company's recently published FY10 guidance (and reflecting the cash-out in connection with the Scratch & Win license), leverage should reach a level of ca. 3.5-3.7x by FYE10 (FYE09: 2.9x). This, however, is still fully in line with the levels required for the current ratings, i.e., 3.5x-4.0x at S&P. The company reiterated that it intends to maintain its investment grade rating. We recently changed our recommendation for the LTOIM 12/16 to marketweight, as outperformance potential is limited at current spread levels, while keeping our buy recommendation for the LTOIM hybrid (Ba3s/BBs/---). In September, the LTOIM 5.375% 12/16 outperformed the iBoxx Travel & Leisure, tightening by around19bp vs. 11bp. (3Q10 results: 11 November)
---/BBB+s/BBB+s Stable Sodexo (EXHO): Overweight 34.8%Sodexo raised its FY09/10 guidance (ending August), now expecting organic revenue growth of 2% yoy (from 0.5%-1.0% yoy, which, in turn, was raised from an initially anticipated flat sales development) and operating profit of EUR 780-800mn (from EUR 770-790mn which was raised from EUR 750-770mn). For 9M09/10, Sodexo achieved organic sales growth of 1.9% yoy to EUR 11.5bn thanks to regional diversification (strong sales performance in North America and Rest of the World). No details were provided as regards profitability, cash-flow generation or debt developments. At the end of 1H09/10, debt totaled EUR 1.0bn (FYE08/09 was EUR 1.5bn). Sodexo's key credit ratios remain well in line with the rating requirements, with 1H09/10 (vs. 1H08/09) adj. net debt to EBITDA (LTM) of 1.9x (2.0x) and adj. FFO to net debt of 32.6% (33.4%). Sodexo has the least cyclical business model in the Travel & Leisure sector and it has demonstrated a reliable track record of keeping the balance between growth and rating stability. We thus remain on overweight for the name. (3Q FY09/1010 results: 10 November)
Susanne Reichhuber (UniCredit Bank) +49 89 378-13247 [email protected]
Retail (Underweight) Sector key figures Sector Wrap-Up Weight in iBoxx NFI: Current ASW spread: change mom/YTD: Euro STOXX RET YTD:
4.0% 81.9bp +1.5/-3.4 +15.4%
Sector drivers: Consumer sentiment and GDP growth are the main drivers in this sector. However, as iBoxx members of the Retail sector are mostly well diversified from a regional standpoint, stronger economies (Asia, Latin America) should offset the challenges in the Western countries and the most recent challenges in Eastern Europe. The iTraxx members from the UK also lack regional diversification (strong revenue dependence on the home market). Whenever LBO activities are rumored to be picking up again, spreads of UK retailers are the first to show inquietude in terms of spread development, reflecting the fact that an LBO is comparatively easy. Last month's recap: In September, the iBoxx Retail sector spread tightened slightly by 4bp, with Casino and Metro being the worst performers. Bonds of Carrefour outperformed the index.
Current Ratings (Moody's/S&P/Fitch)
Credit Profile
Name (Ticker): Recommendation Weight in iBoxxComment Retail sector
---/As/--- Stable Auchan (AUCHAN): Underweight 11.2%1H10 sales were organically up by 1% yoy to EUR 20bn while EBITDA (incl. effects from FX and sold petrol) improved by 9.8% yoy to EUR 1bn, eventually resulting in an EBITDA margin of 5.1% (1H09: 4.9%). Due to better cash flow-generation and lower capex, the company was able to reduce its net debt from EUR 4.6bn to EUR 4.2bn. Based on reported figures, we expect that Auchan's credit profile has remained stable during 1H10. For FY09 (FY08), we calculated adj. net debt to EBITDA of 1.6x (1.6x) and adj. FFO to net debt of 42.9% (43.5%). Quantified guidance for full FY10 was not provided. In April, S&P changed its outlook to stable from negative as the rating agency expects the FFO to debt ratio of 35% to be sustainable, and capex and dividend payments were already cut to keep the cash in the company. In August, the company signed a new EUR 1bn credit facility maturing in 2015. We note that Auchan is privately held, hence there is limited access to financial data. We thus remain on underweight.
A3n/A-s/A-s Stable Carrefour (CAFP): Underweight 26.4%On 16 September, Carrefour held its investor day in Lyon. According to the new business plan, Carrefour will invest EUR 1.5bn over the next two and half years to convert 245 of its 500 superstores to the Carrefour Planet model, as the company targets to increase market share and to improve cash-flow generation. The reinvention of the hypermarket is part of the 2010-2012 Transformation Plan which will contribute total yield gains of EUR 4.5bn, mainly stemming from France, Spain, Italy and Belgium. Thereby, EUR 3.1bn will come from cost savings and EUR 1.4bn from improved inventory management. For 2013, Carrefour expects sales (ex. petrol) of EUR 105bn (FY09: EUR 79bn) and an EBIT of EUR 5.2bn (FY09: EUR 2.8bn). Furthermore, capex will reach a level of EUR 3.2bn on average between 2010 and 2015. The credit profile should be partly supported by the proceeds from the disposal of Carrefour's assets located in Southeast Asia for ca. EUR 700mn but should not be enough to keep the credit metrics at current levels. We note that the rating at S&P (which downgraded the rating one notch to A- after the announcement of the share buyback increase) incorporates a flat dividend payout of EUR 900mn and a stable capex in FY10 vs. FY09 (EUR 2.1bn). We reiterate our underweight recommendation for the issuer due to rating pressure, which is not yet reflected in spread levels. (FY10 results: 10 March)
5 October 2010
5 October 2010 Credit Research
Euro Credit Pilot
UniCredit Research page 65 See last pages for disclaimer.
Current Ratings (Moody's/S&P/Fitch)
Credit Profile
Name (Ticker): Recommendation Weight in iBoxxComment Retail sector
---/BBB-s/BBB-s Stable Casino Guichard Perrachon (COFP): Marketweight 17.1%1H10 consolidated sales were 8.5% higher overall yoy (EUR 13.6bn), benefiting from the company's international positioning in South America and in Asia. Cost savings supported profit generation, leading to an EBITDA improvement of 8.2% yoy (EUR 868mn; EBITDA margin was unchanged at 6.0%), while further divestments were pursued for debt reduction. 1H10 net debt totaled EUR 5.4bn compared with EUR 6bn at FYE09. The company confirmed that it plans to divest of assets with a total value of EUR 1bn by FYE10 to achieve a recovery in its credit ratios, notably a ratio of reported net debt to EBITDA of 2.2x (from previously 2.5x). Ratings should remain stable, however, they remain on a razor's edge to a negative rating action. S&P recently (April 2010) stated that, while the group has a solid market position, its financial risk profile is "significant". To keep the rating, S&P requires the adj. FFO to debt ratio to be at least 25% (FY09: 26.9%). We remain on marketweight for the name, as we trust Casino's commitment to its investment grade ratings, which should be supported by the expected cash inflow of USD 600mn stemming from the nationalization of hypermarkets/supermarkets in Venezuela. (FY10 results: 4 March)
Baa3s/BBB-s/--- Stable Delhaize (DELH): Marketweight 2.0%Delhaize reported that 2Q10 results fell short of market expectations in terms of operating profit. Furthermore, the company cut its guidance for FY10 and expects a growth rate of operating profit between -2% to 2% compared to the previously announced 2% to 5%. 2Q10 sales were down by 0.1% yoy to EUR 5.3bn, while operating profit even dropped by 12.2% yoy to EUR 227mn, negatively influenced by lower sales in its main market, the US, where Delhaize generated 70% of its revenues. Operating cash flow remained strong and reached a level of EUR 613mn (2Q09: EUR 523mn). However, net debt slightly increased by EUR 106mn to EUR 2.2bn vs. FYE09. With respect to FY10, we expect Delhaize to be in a position to generate a positive free cash flow of ca. EUR 100mn, supported by the capex reduction (from EUR 800mn to EUR 700mn). Therefore, the credit profile should remain stable, with adj. net debt to EBITDA of ca. 2.1x (1Q10: 2.0x), which is fully commensurate with the current ratings. We keep our marketweight recommendation for the DELH06/14, which is quite illiquid. (9M10 results: 10 November)
Baa2n/BBBs/BBBs Stable METRO (METFNL): Marketweight 14.0%1H10 results were below consensus in terms of sales and EBIT, having benefited from the strong recovery in Asia (Cash & Carry) and Western Europe (Media Saturn). EBIT excluding extraordinary items improved by EUR 67mn to EUR 470mn, resulting in a better EBIT margin of 1.5% (1H09: 1.3%), supported by the implemented efficiency enhancement program "Shape 2012". We note that Metro has to build up working capital during the first half of the year, hence generating a significantly lower margin than in the second half when the majority of cash flows are generated. Operating cash flow was EUR -3.3bn due to higher working capital. Capex and dividend payments led to a higher net debt which increased by EUR 4.1bn to EUR 8.3bn during 1H10 but slightly declined vs. 1H09 (EUR 8.4bn). For 1H10 (1H09), we calculate adj. net debt/EBITDA of 3.4x (3.5x) and adj. FFO/net debt of 13.6% (18.8%), which should suffice for rating requirements, although Moody's might keep the negative outlook, reflecting the current transitional period. METRO confirmed the existing guidance, i.e. that FY10 sales should be above the FY09 level, however, the increase will not reach the group's medium-term growth target of 6%. FY10 EBIT (before one-off items) should be "tangibly" higher than in FY09 and should reach a level of EUR 2.2bn. In September, Metro bonds underperformed the iBoxx Retail.
---/BBB-s/--- Stable PPR (PRTP): Overweight 7.7%No relevant news following the release of 1H10 results that beat market expectations in terms of sales and EBITDA. 1H10 sales were up by 3.6% yoy to EUR 8.1bn (+1.7% on a comparable basis), while EBITDA surged by 14.1% to EUR 895mn (consensus: EUR 877mn), reflecting the recovery of its mature markets and the strong performance in Emerging Markets. Operating cash flow (adjusted by interest payments) improved from EUR 35mn to EUR 259mn, as cash flow in 1H09 was burdened by higher investments in working capital. Reported net debt increased from EUR 4.4bn to EUR 4.9bn, due to dividend payments and payouts for acquisitions. For 1H10, we calculated adj. net debt to EBITDA of 3.0x (1H09: 3.7x) and adj. FFO to net debt of 24.4% (17.9%), reflecting the massive reduction of net debt yoy (EUR 4.8bn vs. EUR 6.5bn). Rating pressure therefore further abated and credit metrics are now fully in line with S&P's requirements to keep the current rating. In May 2010, S&P affirmed PPR's rating. During the last few years, management has repeatedly stated that it is committed to keeping the investment grade rating, which, however, was not "bought" by the market when looking at spread developments (for example, in comparison with Groupe Casino). We remain on overweight for the issuer and have a positive stance towards CDS.
A3n/A-s/A-s Stable Tesco (TSCOLN): Marketweight 15.4%1Q10 sales (ending May) on a like-for-like basis (excl. petrol) reflected the still challenging market environment as sales remained broadly flat in Tesco's home market UK as well as in Asia (slightly negative) and Europe (slightly positive). For FY09/10, Tesco reported a GBP 1.7bn reduction in debt (to GBP 7.9bn), mainly on sale-and-lease back transactions (GBP 1.8bn achieved through proceeds from property divestments). Tesco intends to further reduce debt to GBP 7.5bn in the ongoing financial year, also driven by sale-and-lease backs. For FY09/10, we calculate adj. FFO to net debt of 24.5% (FY08/09: 18.8%), which is line with the ratio for FY10/11 expected by S&P. According to press reports, Carrefour has dropped Tesco from its bidder list for Carrefour's Southeast Asian assets, worth ca. EUR 700mn. Tesco bonds trade in line with other single-A rated retailers (e.g., Auchan, Carrefour). We keep our marketweight recommendation on the name. (1H10/11 results: 5 October)
Aa2s/AAs/AAs Stable Wal-Mart (WMT): Marketweight 4.3%2Q10/11 results were in line with the consensus in terms of operating profit, which was supported by the company's international activities. 2Q10/11 sales were up by 2.8% yoy to USD 103bn, while operating profit improved 4.4% yoy to USD 6.2bn. While the operating profit at Walmart US dropped by 0.2% yoy to USD 4.9bn, Walmart International (focused on Central & South America and Asia) showed a significant increase of 16.8% yoy to USD 1.1bn, generating 20% of the group's operating profit. Backed by the strong cash-flow generation, shareholder remuneration remained at a generous level. In 2Q10/11, the company paid dividends of USD 2.2bn and repurchased shares of USD 7.1bn, together almost offsetting the operating cash flow of USD 10bn. However, the credit profile was virtually unchanged vs. FYE09/10. For 1H10/11, we calculate adj. net debt to EBITDA of 1.4x (FYE09/10: 1.3x) and adj. FFO to net debt of 54.2% (57.4%), fully commensurate with the best-in-class rating in the retailer universe. For FY10/11, Walmart increased its guidance in terms of EPS and now anticipates EPS of USD 3.95-4.05, up from the previous range of USD 3.90-4.00. In September, the WMT 29 performed in line with the iBoxx Retail. We confirm our marketweight recommendation for the name. (9M10 results: 16 November)

5 October 2010
5 October 2010 Credit Research
Euro Credit Pilot
UniCredit Research page 66 See last pages for disclaimer.
Current Ratings (Moody's/S&P/Fitch)
Credit Profile
Name (Ticker): Recommendation Weight in iBoxxComment Retail sector
Baa1s/BBB+p/BBB+s Stable Wesfarmers (WESAU): Event-driven coverage 1.9%Wesfarmers is one of the largest companies in Australia, operating supermarkets, home improvement stores and coal mines and is also active in energy, chemicals and insurance. In FY09/10 (ending June), the company generated sales of AUD 49.8bn and an EBITDA of AUD 3.4bn, whereby supermarkets and home improvement stores contributed ca. 60%. For FY09/10, we calculate adj. net debt to EBITDA of 2.3x (FY08/09: 2.2x) and adj. FFO to net debt of 33.2% (31.7%). S&P's BBB rating is supported by the good diversification of Wesfarmers' business model, which could be upgraded if adj. FFO to net debt achieves a sustainable level of 30%. Rating pressure will occur if adj. total debt to EBITDA increases to 3.5x (FY09/10: 2.6x). The company entered the iBoxx Retail in April 2010. (1H10/11 results: 18 February)
Rocco Schilling (UniCredit Bank) +49 89 378-15449 [email protected]
Banks (Marketweight) Sector key figures Sector Wrap-Up Weight in iBoxx FIN: Current ASW spread: Euro STOXX BAK YTD:
82.0% SEN: 122.1bp LT2: 247.1bp UT2: 380.8bp T1: 551.6bp -20.1%
Sector drivers: The initiatives currently being discussed by regulators and lawmakers will result in more burden-sharing for all bank investors. As a result, investing in bank debt will be riskier going forward, with regulatory capital being of higher quality, and drafted restructuring laws foreseeing haircuts also for senior bondholders (at least in theory, as it remains to be seen whether a country would actually penalize its own financial sector). Hence, dated bank capital becomes more attractive given its bondholder-friendly features and the future scarcity value. On the other hand, recent newsflow, and we think this will continue short- and medium-term, is extremely positive for financials credit investors, providing final gifts before painful new rules are implemented. Both the outlook for more burden sharing and the final gifts have driven spreads tighter, with strong moves in the sub area. Given the expectation of continued positive newsflow, we maintain our recommendation structure unchanged: marketweight for the financials sector overall, overweight on deep subs, marketweight on LT2, and underweight on seniors. Last month's recap: Ireland was center-stage in September. The Irish government decided to inject up to EUR 5.4bn into Allied Irish Banks, EUR 6.4bn into Anglo Irish Bank (plus another EUR 5bn in a worst-case scenario), and EUR 5.4bn into Irish Nationwide. Moreover, the parliament approved the extension of the Eligible Liabilities Guarantee (ELG) scheme, i.e. for new debt issues until 31 December, as proposed by government three weeks ago. There guarantee for all default-triggering bonds (independent of their maturity) has expired on 29 September 2010. We think that the Irish government will later this year come up with a new guaranteed funding program effective as of FY11. Regarding Anglo Irish Bank, subordinated bondholders will share the losses of the bank, but senior bondholders will not. While these measures are a huge burden for the Irish budget, they heavily support senior bonds of Irish banks.
Current Ratings (Moody's/S&P/Fitch)
Credit Profile
Name (Ticker): Recommendation Weight in iBoxxComment Banks sector
Aa3s/As/A+s Stable ABN Amro (ABNANV): Marketweight 0.0%Fortis Bank (Nederland) N.V. has been absorbed by ABN AMRO Bank N.V. The merger of the two subsidiaries of Dutch State owned ABN AMRO Group N.V. was executed as scheduled on 1 July 2010. ABN Amro Bank assumed all rights and obligations of Fortis Bank Nederland, which ceased to exist. ABN AMRO Bank reported a net loss of EUR 968mn in 1H10. On an underlying basis, there was a 1H10 profit of EUR 325mn (+57%). The pro-forma Tier-1 and total capital ratios under Basel II were 12.3% and 17% and total assets were EUR 405bn as of June. The figures (positive in operating terms, good capitalization) and strategic prospects are credit positive. ABN AMRO Bank is a systemically important domestic player with decent international business, owned by the Dutch government: We like this credit; however, debt instruments (both cash and CDS) are rather illiquid (also due to the debt allocation measures), with one exception being the ABNANV 4.31% 3/16-49 T1 bond, whose good story is priced in (see HY Pacenotes of 6 August).
A1s/A-n/A-s Stable Allied Irish Banks (AIB): Marketweight 0.5%#2 Irish bank by assets. Its strategic focus is on retail and commercial clients in Ireland, the United Kingdom, Poland, and the United States, but it will have to sell most international activities in order to comply with EC impositions and to fulfill new regulatory capital requirements. The total capital requirement for AIB was increased by EUR 3bn to EUR 10.4bn, EUR 5bn of which are to be met by disposals and other capital generating measures, and EUR 5.4bn by equity capital raising. In November, with completion in FY10, this raising will be realized; the Irish government has committed to contribute up to EUR 3.7bn in new cash equity plus up to EUR 1.7bn by conversion of existing preference shares, in case AIB cannot fund sufficient capital from private sources. As a result, the government will become the majority shareholder, as announced months ago.
A1s/A-n/A-s Stable Banca Monte dei Paschi di Siena (MONTE): Marketweight 1.1%The Siena-based group is Italy's third-largest bank, providing a full range of banking services, mainly to SMEs and families. BMPS missed market expectations with weaker-than-expected net profits in 2Q10. Net profits declined by 16% qoq to EUR 119mn. Net interest income increased by 4.4% qoq to EUR 925mn and fees & commissions were stable. Another positive was the fact that costs of risk were not reduced (EUR 301mn vs. EUR 308mn in 1Q10). Thus, the bad loan coverage was increased by 70bp to 56.5%, containing the negative aftertaste of the relatively high gross bad loan ratio of 7.5%. BPM's Tier-1 ratio, which is quantitatively and qualitatively one of the weakest among domestic peers, improved slightly qoq to 7.8% due to a 1% RWA reduction in 2Q10. MPS's 2Q10 results are again credit neutral despite missing market consensus in the bottom-line result. Management adapted its guidance on cost containment, now forecasting opex to decline by 3.5% yoy in FY10. On the back of a slowdown of asset quality deterioration, lower-than-forecasted loan-loss provisioning should also support the full-year result.
5 October 2010
5 October 2010 Credit Research
Euro Credit Pilot
UniCredit Research page 67 See last pages for disclaimer.
Current Ratings (Moody's/S&P/Fitch)
Credit Profile
Name (Ticker): Recommendation Weight in iBoxxComment Banks sector
A3n/--/BBB+s Weakening Bancaja (CAVALE): Marketweight 0.2%Caja de Ahorros de Valencia, Castellon y Alicante (Bancaja) is the 6th largest bank in Spain (3rd largest savings bank). It has a solid presence across Spain with focus on the Valencian community. The caja follows a retail banking strategy complemented by the SME business. It reported net profit of EUR 65mn in 2Q10. Bancaja again provided an interesting set of data with two items catching one's eye: (i) trading income quadrupled qoq to EUR 0.5bn, and (ii) impairment charges increased by 175% qoq to EUR 526mn, driven by loan-loss provisions and provisions for real estate on the balance sheet. Asset quality stopped deteriorating. This was due to a marginal increase in NPLs to EUR 4,435mn from EUR 4,407mn in 1Q10, which let the NPL ratio nearly flat at 5.03%. Solvency ratios also declined, as particularly the Tier-1 ratio was down by 19bp to 7.9% (core Tier-1 down 1bp to 7.0%). Bancaja's 2Q10 results are credit negative. Bancaja benefits from the scheduled SIP with Caja Madrid and several other smaller cajas by gaining size, as the total consolidated assets of EUR 340bn will imply high implicit state support.
A2n/A-n/An Stable Banco Espirito Santo (BESPL): Marketweight 0.7%BES is the 3rd largest Portuguese bank with a 20% market share. Its business profile is dominated by the corporate segment followed by SME and retail units. Geographically, international profit contribution has strongly increased. BES reported better-than-expected 2Q10 results due to substantial provisioning reduction. Net profit increased by 37% qoq and 13% yoy to EUR 163mn in 2Q10 and was up 15% yoy to EUR 282mn in 1H10. On a quarterly comparison, strong domestic operations underlined the bottom-line result, while international activities were flat at EUR 48mn in the second quarter. The NPL ratio increasing marginally by 2bp qoq to 2.4%, mainly driven by the corporate loan exposure. The NPL coverage was also stable at a comfortable 131%. The core Tier-1 ratio of BES was qoq flat at 7.9% and the Tier-1 ratio increased by 30bp qoq to 8.4%. The narrow core Tier-1/Tier-1 ratios reflect the high quality of loss-absorbing capital, only including 11% hybrids. BES 2Q10 results are credit positive as domestic profit generation surprised positively, while international operations also performed well.
Aa2n/AAn/AAs Improving Banco Santander (SANTAN): Marketweight 1.9%#1 Spanish bank, internationally active in the UK and Latin America with solid positions in retail, corporate, private banking and asset management. Banco Santander reported a better-than-expected net profit of EUR 2.23bn in 2Q10, which was mainly driven by the bank's Latin American operations. Net profit in 1H10 was EUR 4.45bn, nearly in line with expected EUR 4.5bn. The NPL ratio was practically flat at 3.37% vs. 3.34% in 2Q10 and the coverage ratio declined slightly to 73% from 74%. Core capital declined by 20bp to a still strong 8.6% from 8.8% and the Tier-1 ratio decreased to 10.1% from 10.3%. The stressed Tier-1 ratio under the EU shock scenario was a very comfortable 10% and also adjusting mark-to-market losses of the bank's sovereign exposure in the banking book, the Tier-1 ratio would only be lowered to ca. 9.4%. According to the bank's presentation, FY10 earnings will be similar to those of FY09. Not only the outcome of the EU stress test but also the 2Q10 results demonstrated once again that Santander belongs to the fundamental outperformers in the European banking sector.
A2s/An/A+s Stable Bank of America (BAC): Marketweight 4.3%BAC, one of three U.S. banks with USD 2 trillion in assets, reported 2Q10 net income of USD 3.1bn, compared to net income of USD 3.2bn in 2Q09, but above market expectations. After preferred dividends, earnings were USD 0.27 per diluted share, compared to USD 0.33 in 2Q09. Results were driven by lower credit costs, which improved for the fourth straight quarter, and the sale of non-core assets as BAC focused on strengthening key business lines. These positives were partially offset by lower trading account profits, reduced mortgage banking income and increased costs associated with the UK payroll tax on certain year-end incentive payments. BAC says it continued to leverage its global franchise and increase the number of referrals. Approx 80,000 lending and deposit products were delivered to Merrill Lynch clients in 2Q10, up from 60,000 in 1Q10 and 35,000 in all of FY09. Referrals between Global Wealth and Investment Management and the company's commercial and corporate businesses increased 24% qoq. Credit quality continued to improve during the quarter. Capital ratios were positively impacted from 1Q10 primarily due to the sale of certain non-core assets and increased retained earnings, while it liquidity position strengthened further.
A1s/A-s/A-s Stable Bank of Ireland (BKIR): Marketweight 0.4%Largest Irish bank. Its core divisions are Irish retail banking including life assurance activities, and the provision of financial services in the UK. It reported EUR 140mn in 1H10 net attributable profit, down 66% yoy. There were several issues influencing this result. Revenues were much lower on a significant decline in net interest income, slightly mitigated by lower costs. Operating loan-loss provisions even declined slightly. The Tier-1 ratio is now 9.9%. As the Irish government supported that capital management, its stake increased to ca. 36%, including the 15.73% that government has owned since February 2010. While management did not provide a profit target for FY10, it said that ROE in the low- to mid-teens is targeted until 2013, driven by a higher net interest margin (1.75% vs. 1.41% in 1H10), better efficiency, normalized loan-loss provisions, lower Tier-1 ratio and lower loan/deposit ratio (below 125% vs. 143%). Bank of Ireland is the most viable among the Irish banks, albeit fundamental challenges (especially related to the net interest margin) remain. In addition, it benefits from strong implicit and explicit support.
Aa3s/AA-n/AA-s Stable Barclays (BACR): Marketweight 3.3%Barclays, with total assets of GBP 1.59tn as of June 2010, is the second largest bank in the world by total assets. Barclays has a strong franchise in UK Retail & Business Banking, engages in international retail and commercial banking activities, and is also a prominent global player in investment banking (Barclays Capital), credit cards (Barclaycard), and wealth management, while large parts of the asset management activities (Barclays Global Investors) have been sold. It reported GBP 2.4bn in 1H10 net attributable profit (+29% yoy and slightly above market expectations), which also means net profit of GBP 1.3bn in 2Q10, EUR 0.2bn more than in 1Q10. Total revenues increased by 8% yoy, driven by a strong surge in trading income. This was more than offset by a 21% cost increase, meaning a 6% decline in pre-provision income. The overall profit growth was hence caused by the 32% drop in loan-loss provisions. Capitalization ratios remained at a strong level of 13.2% (Tier-1 ratio) and 16.5% (total capital ratio). The figures are credit positive.
5 October 2010
5 October 2010 Credit Research
Euro Credit Pilot
UniCredit Research page 68 See last pages for disclaimer.
Current Ratings (Moody's/S&P/Fitch)
Credit Profile
Name (Ticker): Recommendation Weight in iBoxxComment Banks sector
A1s/--/A+wn Stable Bayerische LB (BYLAN): Marketweight 0.6%#2 German Landesbank. BayernLB and WestLB officially confirmed that they are exploring a merger, with the target of creating a savings banks-oriented, universal bank focused on corporate financing. A decision is expected by year-end, and both banks stated, "Given the number of complex issues, it remains open if the talks will ultimately be successful." In addition to the merger talks, WestLB will kick-off the disposal process on 30 September, as scheduled. This move comes after several calls by federal government officials as well as against the background of EC impositions regarding a mandatory change in ownership (WestLB in FY11, BayernLB in the coming years). Hence, in line with expectations, the proposed transaction would be an externally enforced deal rather than a marriage of love. The main dealbreakers are political disputes, the willingness to actually realize cost synergies, ongoing individual restructuring at both banks, and funding issues. Regarding the latter, nevertheless, there would be the advantage of being a large state-owned bank with respective implications on implicit support assumptions.
Aa2n/AAn/AA-p Stable BBVA (BBVASM): Marketweight 1.8%#2 Spanish bank; it is a well-diversified group in Spain, Latin America and the US with a good variety of products and retail banking focus. It enjoys a strong market share in its retail banking, asset management, private banking and insurance sectors.2Q10 results were in line with expectation despite voluntary generic provisions. Net profits increased by 4% qoq to EUR 1,287mn as the bottom-line result benefited from strong earnings power. Net interest income increased by 5% qoq. F&C were boosted by over 5% both qoq to EUR 490mn. The NPA ratio declined by 10bp to 4.2% with an NPL coverage of 61%. The core Tier-1 ratio was flat qoq and the Tier-1 ratio declined by 30bp to 9.2%. 2Q10 results are credit positive. The bank's earnings power has proven resilient. Real estate assets coverage was maintained at around 30%; hence, we do not expect any major negative impact from new provisioning on property assets. With regard to the new provisioning requirements, we believe that the bank will again be able to maintain enough earnings power to absorb the additional one-off impact on the P&L.
A3n/BBB+n/An Weakening BCP (BCPPL): Marketweight 0.3%#1 private banking group in Portugal. BCP has been expanding into Poland, Greece and Romania, which now weighs on the bank's performance. BCP reported 2Q/1H10 results in line with market expectations. The bank's bottom-line figure increased by 63% yoy to EUR 67mn in 2Q10. Despite qoq stronger consolidated top-line results, consolidated net profits declined on a quarterly comparison by 31%. Overall core income was strengthened, particularly as net interest income increased both 7% qoq to EUR 364mn. The NPL ratio increased by 30bp to 4.1%, with a coverage of 73% (vs. 95% in 1Q10). The core Tier-1 and the Tier-1 ratios deteriorated by 80bp and 70bp, respectively, to a meager 5.6% and 8.6% due to actuarial losses and a change in the pension fund corridor impacting negatively by 62bp. Regarding Portuguese banks' main issue – refinancing risk – there are only EUR 400mn maturities left in 2H10. BCP's 2Q10 results are credit negative. In direct comparison with BES, the weaker geographical diversification is the main difference, followed by the weaker quality of regulatory capital.
Aa2s/AAn/AA-s Improving BNP Paribas (BNP): Marketweight 3.0%The largest listed bank in France is a highly diversified group with a strong domestic franchise in retail, corporate, investment banking and asset management operations. It reported much better-than-expected 2Q10 results. Net profits in 2Q10 increased by 31% yoy to EUR 2,105mn and increased by 39% yoy to EUR 4,388mn in 1H10. The 2Q10 bottom-line result was 8% lower qoq due to a higher tax burden. In 1H10, net interest income was boosted 22% yoy to EUR 11,843mn and also f&c were up by 25% yoy to EUR 4,306mn, while trading gains declined by 10% yoy to EUR 3,704mn, adding up to a 17% yoy increase in total revenues. Asset quality was almost stable as doubtful loans increased to EUR 33.8bn from EUR 32.3bn in 1Q10 and EUR 31.3bn in 4Q09. The doubtful loan coverage declined slightly to a comfortable 85%. Solvency ratios improved qoq despite boosted RWAs (up 2.6% qoq): the equity Tier-1 ratio reached 8.4% and the Tier-1 ratio 10.6%, both up 10bp. BNP's 2Q10 results are credit positive. The high quality bottom-line result compares very well with international peers.
Aa3s/A+s/A+s Stable BPCE (CDEE): Marketweight 0.6%Groupe BPCE became the second largest banking group in France through the merger, on 31 July 2009, of 20 Banques Populaires and 17 Caisses d’Epargne, two complementary cooperative banking networks with 34mn customers, 110,000 employees and 8,000 branches. BPCE is the central body of the group, and now holds the assets transferred from the Caisses Nationale des Caisses d'Epargne (CNCE) and the Banque Fédérale des Banques Populaires (BFBP). It reported net profits of EUR 935mn in 2Q10 (down 7.4% qoq). The bottom-line result was mainly driven by very high reductions of costs of risk (down 10% qoq and 73% yoy to EUR 459mn). Asset quality was stable, with a NPL ratio of 3.8% and NPL coverage of 55%. The core Tier-1 ratio increased by 10bp to 7.4% and the Tier-1 ratio was up 10bp to 9.6% despite higher RWAs. BPCE's 2Q10 results are credit positive. Core business lines showed sustainability and stable asset quality. The reduced credit risk from its CIB unit Natixis impacts the overall credit profile of BPCE substantially.
A1n/Awn/An Weakening Caja Madrid (CAJAMM): Marketweight 0.1%#4 in Spain and the second biggest savings bank; it has a strong domestic retail franchise and its 1,920 branches remain concentrated in the Madrid region (20%+ market share). In the past ten years, the bank carried out a strong branch expansion, leaving it exposed to high overcapacity – still a major problem in the Spanish caja segment. Net profits increased by 67% to EUR 122mn (down 44% yoy) in 2Q10. Total revenues increased by 34% qoq to EUR 1,055mn (down 10% yoy), despite the continuation of the declining trend in net interest income (down 5% qoq to EUR 468mn) as particularly trading income was boosted (up 1.5x qoq and still 82% yoy to EUR 358mn). It reported a declining NPA ratio to 5.39% from 5.43% in 1Q10. Caja Madrid's core Tier-1 ratio declined by 30bp to 6.6%, while the Tier-1 ratio dropped by 20bp to 8.7%. The results are credit negative as the loss-absorption capacity of the P&L continues to weaken and the pressure from asset quality deterioration has not declined, despite the decreasing NPL ratio.
A3s/An/A+s Stable Citigroup (C): Marketweight 3.7%Citigroup, one of three U.S. banks with USD 2 trillion in assets, reported 2Q10 net income of USD 2.7bn, down 37% from net income of USD 4.3bn in 2Q09, but above market expectations. Revenues declined USD 3.4bn and net income was down USD 1.7bn from 1Q10, largely as a result of lower Securities and Banking and Special Asset Pool revenues. Other core businesses showed consistent strength, including Transaction Services with USD 929mn in net income and sequential revenue growth across all international regions. Provisions for credit losses and for benefits and claims declined USD 2.0bn sequentially to USD 6.7bn, the lowest level since 3Q07, reflecting continued improvement in credit quality. This helped increase Regional Consumer Banking’s net income by 16% sequentially to USD 1.2bn. It continues to improve its financial strength with USD 122.9bn in Tier-1 Capital and a Tier-1 Common ratio of 9.7%, while cash and deposits with banks were USD 185bn, or 9.6% of total assets (9.4% in 1Q10).
5 October 2010
5 October 2010 Credit Research
Euro Credit Pilot
UniCredit Research page 69 See last pages for disclaimer.
Current Ratings (Moody's/S&P/Fitch)
Credit Profile
Name (Ticker): Recommendation Weight in iBoxxComment Banks sector
Aa3n/An/A+s Stable Commerzbank (CMZB): Marketweight 1.2%#2 German bank by total assets; universal bank operating in all businesses; took over and absorbed Dresdner Bank in 2009. It reported a net attributable profit of EUR 352mn for 2Q10. The figure is 50% down qoq, less severe than expected, but marks a EUR 1.1bn turnaround yoy, being caused by three issues: (i) 36% lower loan-loss provisions; (ii) much lower restructuring expenses (EUR 33mn vs. EUR 216mn) and goodwill/brand names impairment (nil vs. EUR 70mn); (iii) a EUR 151mn tax credit compared to a EUR 269mn tax charge. The quarterly slowdown was driven by 60% lower trading income and 10% lower commission income, mitigated by the tax credit, while costs and loan-loss provisions were stable. The Tier-1 ratio remained at a high 10.8%, and all FY10 funding needs have been satisfied already. Based on the assumption of a stable environment, management forecasts profitability for FY10. The FY12 target of more than EUR 4bn in operating profits was also confirmed. The figures and statements are credit supportive.
Aa1n/AA-n/AA-s Stable Credit Agricole (CASA) (ACAFP): Marketweight 2.1%CASA is one of the four large mutual groups in France. Due to the dominant retail business in the country (2,573 local credit cooperatives or local banks) it is considered the #1 French bank. Moreover, it is Europe's 2nd largest banking group by equity. Crédit Agricole S.A. reported much better-than-expected 2Q10 results. The net profit of the central body of Crédit Agricole Group declined by 19% qoq, but was up 87% yoy to EUR 379mn in 2Q10. The bottom-line result was supported by resilient income generation from all business units except international retail banking due to Emporiki. For the entire group, the net attributable profit was EUR 897mn (down 5.5% qoq and up 35% yoy). Both the central body's and the entire group's bottom-line result reflect improved top-line revenues, which exceeded opex increases. The group's asset quality was stable. Solvency ratios continued to improve: the group's Tier-1 ratio increased by 10bp to 10.1%; the Tier-1 ratio was 9.7%. Crédit Agricole's 2Q10 results are credit positive. The main positive is that the bank showed the ability to absorb the negative impact of Emporiki.
Aa3s/A+s/AA-s Stable Crédit Mutuel (CM) (BFCM): Marketweight 1.4%Groupe CM is among the four largest mutual groups in France, however its structure is less cohesive and more complex than that of peers. The group includes almost 2,000 Caisses Locales (local cooperative banks) as well as 18 regional Fédérations, out of which 10 have decided to pool their interests (five within CM5-CIC group, three within Crédit Mutuel Arkea and two within Crédit Mutuel Sud Europe Méditerranéen), joining their central bodies (Caisse Fédérales). Within the CM, the Banque Fédérative du Crédit Mutuel, BFCM, is the holding company and refinancing center for the so called sub-group "CM5-CIC group" (on 1 January 2009, the "Fédération du Crédit Mutuel Midi-Atlantique" amended the existing CM4-CIC group). The other ungrouped Fédérations of Groupe CM establish more or less a particular form of partnership (e.g. IT & insurance). Besides CM5-CIC, the BFCM consolidates 100% of citibank Deutschland, and 51% of Cofidis. In 1H09, net profit increased by 25% yoy to EUR 340mn (BFCM only reports bi-annually). Moreover, on a like-for-like basis (excluding profit contribution from citibank Deutschland group, Cofidis group, CIC Iberbanco, Banca Popolare Milano, and CMCIC Leasing GmbH), net income even increased by 39% yoy to EUR 379mn. We point out that before the latest rush of banks to tap capital markets (in October), the group had already been successful in raising EUR 1,126mn from existing "stakeholders" during 1H09 to reinforce its solvency ratios (Tier-1 ratio was 10.44% as of 1H09 vs. 9.7% as of 1Q09 and 8.78% as of FY08). Already on 1 October 2009, it repaid the nominal of EUR 1,036mn of the super-subordinated hybrid securities (being the first French entity to do so), which had been issued to the French government in December 2008, and interest amounting to EUR 70.8mn.
Aa2n/As/AA-n Stable Credit Suisse (CS): Marketweight 4.0%#2 Swiss bank by assets and among the largest in Europe and worldwide. It reported CHF 1,593mn net attributable profit, stable yoy but down 22.5% qoq. The result was above market forecasts; however, it contains CHF 1,444mn in one-off gains which we think were not incorporated in market estimates, meaning that adjusted net profit is only 10% of forecasts. It continues to report a very strong capitalization level, with a Tier-1 ratio of 16.3% and total capital ratio of 21.8%. Segment-wise, Private Banking, which had CHF 13.8bn in net new assets, contributed CHF 0.9bn to pre-tax profits, Investment Banking CHF 0.8bn, and Asset Management was break-even, with net new assets of CHF 1.3bn. Regarding the latest proposals to substantially increase capital requirements, CS issued a statement saying that it appreciates the adequate transition period, and that it will be able to meet the new requirements by earnings retention and issuance of contingent core capital notes (CoCos), but without common equity injections.
Aa3s/An/A+s Stable Danske Bank (DANBNK): Marketweight 0.9%#1 Danish banking group, #2 Nordic banking group. Danske Bank reported DKK 937mn in 2Q10 net attributable profit, slightly above the consensus forecast. Operating figures were overall higher qoq, with lower loan-loss provisions being mitigated by lower revenues due to the weaker market environment. The positive news is that loan-loss provisions, albeit substantially above pre-crisis levels, continued to decline following the peak in 4Q08. Capitalization ratios were stable compared to March, and the yoy increase is explained by the government hybrid capital injection of DKK 26bn. Management did not provide a concrete profit outlook but said that the level of loan-loss provisions will remain high (albeit below the FY09 level). Peter Straarup, CEO, said he was looking at the rest of the year with "cautious optimism". The figures are credit supportive and confirm our positive view on the name given operating stability, strong capitalization, and government support.
A2n/A+s/A+s Stable Deutsche Apotheker- und Ärztebank (DAA): Marketweight 0.4%Deutsche Apotheker- und Ärztebank eG (DAPO) is the largest primary cooperative bank in Germany. The purpose of the bank is to cater to the needs of its members, who belong almost exclusively to the medical profession. Unlike other cooperative banks, DAPO is not bound by the regional principle, and can thus operate throughout Germany, where it focuses on the attractive niche of medical professionals and the health care sector. DAPO is a member of FinanzVerbund, the protection scheme of Germany's cooperative banks. FinanzVerbund protects 100% of deposits and bearer bonds of the non-bank customers of its associated banks, regardless of the amount. Before reliance on the deposit protection, banks in difficulties will first be supported by restructuring measures under the institutional protection ("Institutsschutz"). It reported EUR 25mn in 1H10 net profit, three times the figure from one year ago. Revenues were 12% higher, but this increase in revenues was mitigated by higher costs and higher loan-loss provisions. Management increased the internal target for FY10 revenue growth.

5 October 2010
5 October 2010 Credit Research
Euro Credit Pilot
UniCredit Research page 70 See last pages for disclaimer.
Current Ratings (Moody's/S&P/Fitch)
Credit Profile
Name (Ticker): Recommendation Weight in iBoxxComment Banks sector
Aa3s/A+s/AA-n Stable Deutsche Bank (DB): Marketweight 3.1%Deutsche Bank is the largest German bank and among the largest global banks by total assets. DB is a global investment bank with a top-tier franchise and leadership in fixed income products; it also has a strong and profitable private client and asset management (PCAM) franchise. Deutsche Bank made a public takeover offer for Deutsche Postbank, which will be entirely funded by a rights issue of ca. EUR 10bn. As the latter exceeds the expected takeover capital needs for Postbank, the bank also anticipates new regulatory capital requirements to maintain its level of capital (Deutsche Bank's Tier-1 ratio was 11.3% in 1H10, while Deutsche Postbank's was only 7.3%). Based on its current 29.9% stake in Deutsche Postbank and the mandatory exchangeable bonds, which will be fully exchanged into a further 27.4%, Deutsche Bank already intends to fully consolidate the Postbank group in FY10. As a result of the consolidation, Deutsche Bank has to revalue its current Postbank investment, which will likely lead to a fair value impairment charge of around EUR 2.4bn in 3Q10.
--/--/A+s Stable Dexia (DEXGRP): Marketweight 0.3%Dexia, which received a EUR 6.4bn capital increase from Belgian and French federal and regional governments as well as its major shareholders, has a solid franchise in public sector lending and project finance in Europe, while it agreed to sell the insurance business of FSA (Dexia's US monoline subsidiary). Dexia is also strong in retail banking in Belgium and Luxembourg. Another key subsidiary, DBIL, primarily offers private banking and asset management. Dexia reported EUR 248mn in 2Q10 net attributable profit, above market expectations. On a qoq comparison, net profit was up by 15% due to a beneficial tax effect, while pre-tax profits were down by 27%. Capitalization ratios were stable, with the Tier-1 ratio at 12.2%. All FY10 funding requirements have been met already, and the government-guaranteed funding program was exited on 30 June, four months ahead of schedule. Until end-2011, there will be no acquisitions of financial institutions, no cash dividends to equity-holders, no hybrid coupons unless legally required, and no utilization of hybrid calls. The figures are credit neutral.
Aa3s/A+s/A+s Stable DnB NOR Group (DNBNOR): Marketweight 1.1%#1 financial group in Norway (34% owned by the Kingdom of Norway). DnB NOR (Bank: Aa3s/A+s/A+s) reported NOK 3.26bn in 2Q10 net attributable profit, a strong increase yoy and also higher qoq, and above market expectations. The main driver of the qoq increase was lower loan-loss provisions. Capitalization ratios were stable compared to December. DnB NOR, despite obvious problems in ship finance and the Baltics (where the DnB NORD joint-venture with Nord/LB is in the restructuring process), remains a sound bank. The figures are credit positive, and DnB NOR remains a safe-haven in these stormy times.
Aa3n/An/As Stable Erste Bank (ERSTBK): Marketweight 0.5%Erste Bank is Austria's second largest bank. It is a universal bank operating in all banking businesses with particular strength in retail banking and SME clients. Two-thirds of group net profit is generated in CEE, where Erste Bank built up a strong network over recent years. EUR 217mn in net attributable profit for 2Q10 (down 17% qoq and 15% yoy) and pre-tax profits of EUR 363mn. On a yoy comparison, the bottom-line result declined by 4% to EUR 472mn. The result was driven by sound net interest income and higher fees & commissions (up 3% qoq or 6% yoy to EUR 1,361mn and 5% qoq or 11% yoy to EUR 494mn, respectively). The NPL ratio increased to 7.3%. The higher provisioning increased the NPL coverage, which reached 59.7%. Solvency ratios continued to improve, with the core Tier-1 ratio reaching 8.6%, up 30bp YTD, and the Tier-1 ratio increasing 20bp qoq and 40bp yoy to 9.6%. Management expects elevated risk costs for FY10 at similar levels of FY09, which means a substantial slowdown in 2H10 as LLPs in 1H10 were 22% higher yoy.
A1n/An/A+n Stable Goldman Sachs (GS): Marketweight 3.1%Goldman Sachs, the leading US investment firm, reported 2Q10 net earnings of USD 613mn (USD 0.78 per share), down 82% from USD 3.44bn (USD 4.93 per share) in 2Q09. GS results were below market expectations and were impacted by lower trading income, the USD 550mn settlement with the SEC and a one-time USD 600mn UK bank payroll tax. GS reports that its Tier-1 capital ratio (Basel I) was 15.2% as of 30 June 2010, and the Tier-1 common ratio was 12.5%. Operating expenses were USD 7.39bn. Total assets were USD 883bn, essentially unchanged from 31 March 2010. Level 3 assets were approximately USD 46bn and represented 5.2% of total assets. The firm’s global core excess liquidity averaged USD 163bn for 2Q10 and was USD 168bn as of 30 June 2010. GS' financial skills in these challenging times have been very impressive, although not as successful in this quarter as previously. Overall credit metrics remain strong. GS' settlement of SEC charges should greatly help in its reputational-damage-control – in fact, Moody's says this is credit positive.
Aa2n/AA-n/AAs Stable HSBC (HSBC): Marketweight 4.0%Largest European bank in terms of market value; it is one of the few truly world-class financial services groups, with long-established businesses in Europe, Asia, Middle East, North and Latin America. It reported USD 11.1bn in 1H10 attributable net profit, double last year's figure and far above market forecasts. This performance was due to much lower loan-loss provisions (-46% yoy); in addition, there was a strong turnaround in own debt fair valuation. The Tier 1 ratio stands at a very comfortable 11.5%, with the core T1 ratio being 9.9%. HSBC remains one of the strongest banks. Without any direct state support, HSBC continuously reports a superb capitalization despite absorption of many negative items. The bank is able to make and execute clear-cut decisions, and did not incur overall losses during the crisis. Hence, it remains a sound overall credit, in our view. Nevertheless, our impression of the 1H10 results is not as positive as a first glance might suggest. The earnings surprise was caused by own debt fair value gains, while the drop in loan-loss provisions in the run-down business was expected.
A3n/--/Awn Stable HSH Nordbank (HSHN): Marketweight 0.1%#5 German Landesbank. Within its domestic market, Germany's most northern states Hamburg and Schleswig-Holstein (whose initials are reflected in the acronym HSH), HSHN is the market leader in the sector of business clients; it is also the world's biggest financial service provider for shipping. HSH Nordbank reported a 1H10 net attributable loss of EUR 400mn, down from EUR 537mn one year ago. On the occasion of a teleconference, senior management made the following credit-relevant statements: 1. In 1H10, the net loss of the single-entity according to German GAAP (HGB) was higher than the IFRS group net loss, given general loan-loss provisions. For FY10, there will be a HGB loss. 2. In regard to the outlook, the following picture prevails (IFRS): 2H10 weaker than 1H10; loss in FY10; profitability in FY11; write-up of nominal values, payment of cumulative and current deep sub coupons based on FY12. 3. The EC decision is expected in the coming months. 4. Impositions for HSH Nordbank will include a change in ownership structure.
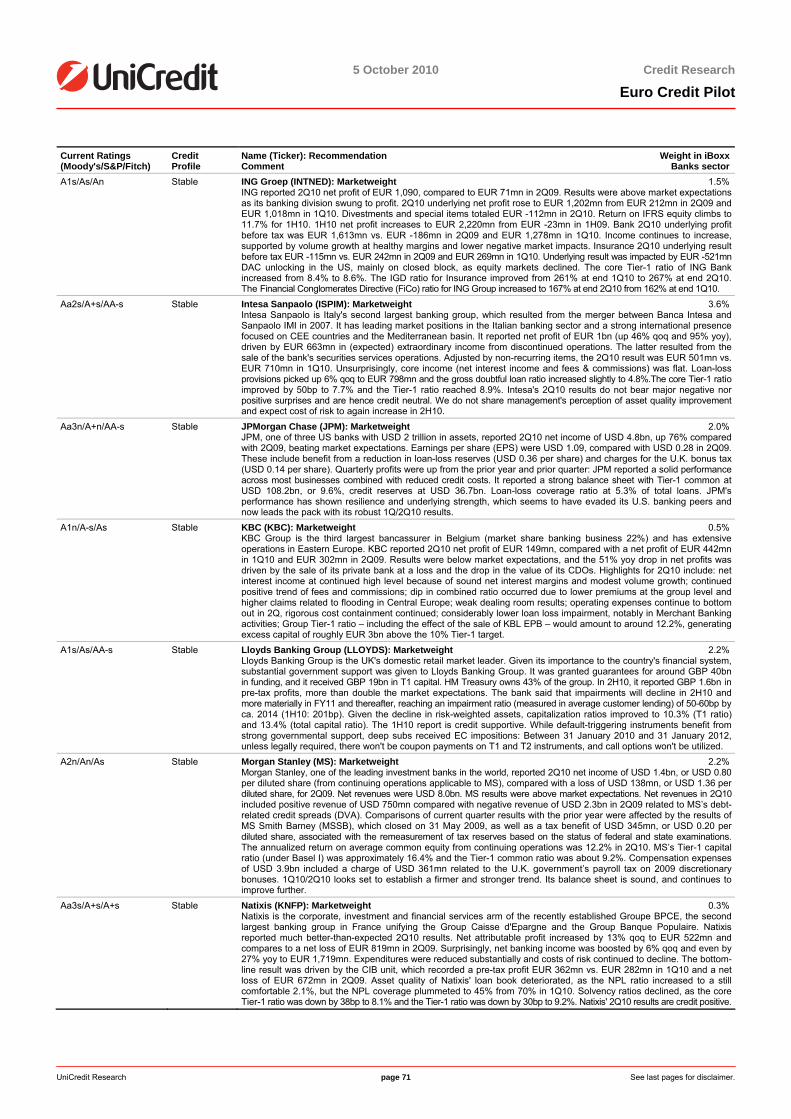
5 October 2010
5 October 2010 Credit Research
Euro Credit Pilot
UniCredit Research page 71 See last pages for disclaimer.
Current Ratings (Moody's/S&P/Fitch)
Credit Profile
Name (Ticker): Recommendation Weight in iBoxxComment Banks sector
A1s/As/An Stable ING Groep (INTNED): Marketweight 1.5%ING reported 2Q10 net profit of EUR 1,090, compared to EUR 71mn in 2Q09. Results were above market expectations as its banking division swung to profit. 2Q10 underlying net profit rose to EUR 1,202mn from EUR 212mn in 2Q09 and EUR 1,018mn in 1Q10. Divestments and special items totaled EUR -112mn in 2Q10. Return on IFRS equity climbs to 11.7% for 1H10. 1H10 net profit increases to EUR 2,220mn from EUR -23mn in 1H09. Bank 2Q10 underlying profit before tax was EUR 1,613mn vs. EUR -186mn in 2Q09 and EUR 1,278mn in 1Q10. Income continues to increase, supported by volume growth at healthy margins and lower negative market impacts. Insurance 2Q10 underlying result before tax EUR -115mn vs. EUR 242mn in 2Q09 and EUR 269mn in 1Q10. Underlying result was impacted by EUR -521mn DAC unlocking in the US, mainly on closed block, as equity markets declined. The core Tier-1 ratio of ING Bank increased from 8.4% to 8.6%. The IGD ratio for Insurance improved from 261% at end 1Q10 to 267% at end 2Q10. The Financial Conglomerates Directive (FiCo) ratio for ING Group increased to 167% at end 2Q10 from 162% at end 1Q10.
Aa2s/A+s/AA-s Stable Intesa Sanpaolo (ISPIM): Marketweight 3.6%Intesa Sanpaolo is Italy's second largest banking group, which resulted from the merger between Banca Intesa and Sanpaolo IMI in 2007. It has leading market positions in the Italian banking sector and a strong international presence focused on CEE countries and the Mediterranean basin. It reported net profit of EUR 1bn (up 46% qoq and 95% yoy), driven by EUR 663mn in (expected) extraordinary income from discontinued operations. The latter resulted from the sale of the bank's securities services operations. Adjusted by non-recurring items, the 2Q10 result was EUR 501mn vs. EUR 710mn in 1Q10. Unsurprisingly, core income (net interest income and fees & commissions) was flat. Loan-loss provisions picked up 6% qoq to EUR 798mn and the gross doubtful loan ratio increased slightly to 4.8%.The core Tier-1 ratio improved by 50bp to 7.7% and the Tier-1 ratio reached 8.9%. Intesa's 2Q10 results do not bear major negative nor positive surprises and are hence credit neutral. We do not share management's perception of asset quality improvement and expect cost of risk to again increase in 2H10.
Aa3n/A+n/AA-s Stable JPMorgan Chase (JPM): Marketweight 2.0%JPM, one of three US banks with USD 2 trillion in assets, reported 2Q10 net income of USD 4.8bn, up 76% compared with 2Q09, beating market expectations. Earnings per share (EPS) were USD 1.09, compared with USD 0.28 in 2Q09. These include benefit from a reduction in loan-loss reserves (USD 0.36 per share) and charges for the U.K. bonus tax (USD 0.14 per share). Quarterly profits were up from the prior year and prior quarter: JPM reported a solid performance across most businesses combined with reduced credit costs. It reported a strong balance sheet with Tier-1 common at USD 108.2bn, or 9.6%, credit reserves at USD 36.7bn. Loan-loss coverage ratio at 5.3% of total loans. JPM's performance has shown resilience and underlying strength, which seems to have evaded its U.S. banking peers and now leads the pack with its robust 1Q/2Q10 results.
A1n/A-s/As Stable KBC (KBC): Marketweight 0.5%KBC Group is the third largest bancassurer in Belgium (market share banking business 22%) and has extensive operations in Eastern Europe. KBC reported 2Q10 net profit of EUR 149mn, compared with a net profit of EUR 442mn in 1Q10 and EUR 302mn in 2Q09. Results were below market expectations, and the 51% yoy drop in net profits was driven by the sale of its private bank at a loss and the drop in the value of its CDOs. Highlights for 2Q10 include: net interest income at continued high level because of sound net interest margins and modest volume growth; continued positive trend of fees and commissions; dip in combined ratio occurred due to lower premiums at the group level and higher claims related to flooding in Central Europe; weak dealing room results; operating expenses continue to bottom out in 2Q, rigorous cost containment continued; considerably lower loan loss impairment, notably in Merchant Banking activities; Group Tier-1 ratio – including the effect of the sale of KBL EPB – would amount to around 12.2%, generating excess capital of roughly EUR 3bn above the 10% Tier-1 target.
A1s/As/AA-s Stable Lloyds Banking Group (LLOYDS): Marketweight 2.2%Lloyds Banking Group is the UK's domestic retail market leader. Given its importance to the country's financial system, substantial government support was given to Lloyds Banking Group. It was granted guarantees for around GBP 40bn in funding, and it received GBP 19bn in T1 capital. HM Treasury owns 43% of the group. In 2H10, it reported GBP 1.6bn in pre-tax profits, more than double the market expectations. The bank said that impairments will decline in 2H10 and more materially in FY11 and thereafter, reaching an impairment ratio (measured in average customer lending) of 50-60bp by ca. 2014 (1H10: 201bp). Given the decline in risk-weighted assets, capitalization ratios improved to 10.3% (T1 ratio) and 13.4% (total capital ratio). The 1H10 report is credit supportive. While default-triggering instruments benefit from strong governmental support, deep subs received EC impositions: Between 31 January 2010 and 31 January 2012, unless legally required, there won't be coupon payments on T1 and T2 instruments, and call options won't be utilized.
A2n/An/As Stable Morgan Stanley (MS): Marketweight 2.2%Morgan Stanley, one of the leading investment banks in the world, reported 2Q10 net income of USD 1.4bn, or USD 0.80 per diluted share (from continuing operations applicable to MS), compared with a loss of USD 138mn, or USD 1.36 per diluted share, for 2Q09. Net revenues were USD 8.0bn. MS results were above market expectations. Net revenues in 2Q10 included positive revenue of USD 750mn compared with negative revenue of USD 2.3bn in 2Q09 related to MS’s debt-related credit spreads (DVA). Comparisons of current quarter results with the prior year were affected by the results of MS Smith Barney (MSSB), which closed on 31 May 2009, as well as a tax benefit of USD 345mn, or USD 0.20 per diluted share, associated with the remeasurement of tax reserves based on the status of federal and state examinations. The annualized return on average common equity from continuing operations was 12.2% in 2Q10. MS’s Tier-1 capital ratio (under Basel I) was approximately 16.4% and the Tier-1 common ratio was about 9.2%. Compensation expenses of USD 3.9bn included a charge of USD 361mn related to the U.K. government’s payroll tax on 2009 discretionary bonuses. 1Q10/2Q10 looks set to establish a firmer and stronger trend. Its balance sheet is sound, and continues to improve further.
Aa3s/A+s/A+s Stable Natixis (KNFP): Marketweight 0.3%Natixis is the corporate, investment and financial services arm of the recently established Groupe BPCE, the second largest banking group in France unifying the Group Caisse d'Epargne and the Group Banque Populaire. Natixis reported much better-than-expected 2Q10 results. Net attributable profit increased by 13% qoq to EUR 522mn and compares to a net loss of EUR 819mn in 2Q09. Surprisingly, net banking income was boosted by 6% qoq and even by 27% yoy to EUR 1,719mn. Expenditures were reduced substantially and costs of risk continued to decline. The bottom-line result was driven by the CIB unit, which recorded a pre-tax profit EUR 362mn vs. EUR 282mn in 1Q10 and a net loss of EUR 672mn in 2Q09. Asset quality of Natixis' loan book deteriorated, as the NPL ratio increased to a still comfortable 2.1%, but the NPL coverage plummeted to 45% from 70% in 1Q10. Solvency ratios declined, as the core Tier-1 ratio was down by 38bp to 8.1% and the Tier-1 ratio was down by 30bp to 9.2%. Natixis' 2Q10 results are credit positive.
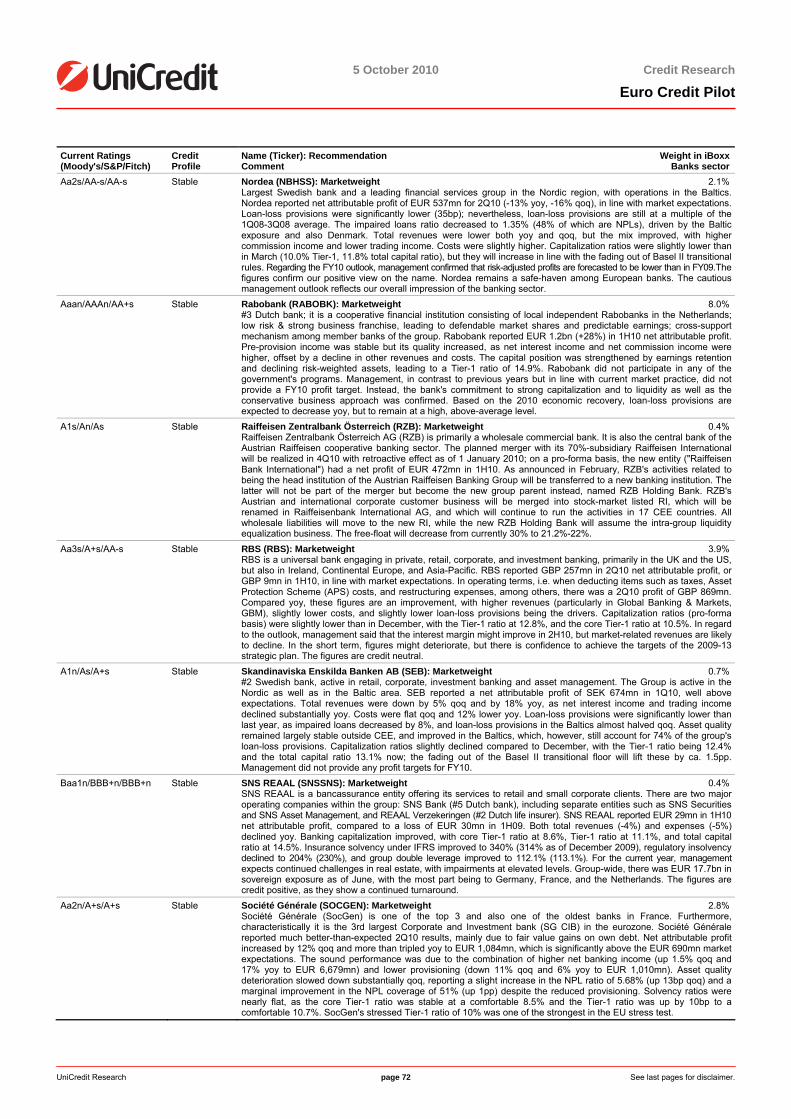
5 October 2010
5 October 2010 Credit Research
Euro Credit Pilot
UniCredit Research page 72 See last pages for disclaimer.
Current Ratings (Moody's/S&P/Fitch)
Credit Profile
Name (Ticker): Recommendation Weight in iBoxxComment Banks sector
Aa2s/AA-s/AA-s Stable Nordea (NBHSS): Marketweight 2.1%Largest Swedish bank and a leading financial services group in the Nordic region, with operations in the Baltics. Nordea reported net attributable profit of EUR 537mn for 2Q10 (-13% yoy, -16% qoq), in line with market expectations. Loan-loss provisions were significantly lower (35bp); nevertheless, loan-loss provisions are still at a multiple of the 1Q08-3Q08 average. The impaired loans ratio decreased to 1.35% (48% of which are NPLs), driven by the Baltic exposure and also Denmark. Total revenues were lower both yoy and qoq, but the mix improved, with higher commission income and lower trading income. Costs were slightly higher. Capitalization ratios were slightly lower than in March (10.0% Tier-1, 11.8% total capital ratio), but they will increase in line with the fading out of Basel II transitional rules. Regarding the FY10 outlook, management confirmed that risk-adjusted profits are forecasted to be lower than in FY09.The figures confirm our positive view on the name. Nordea remains a safe-haven among European banks. The cautious management outlook reflects our overall impression of the banking sector.
Aaan/AAAn/AA+s Stable Rabobank (RABOBK): Marketweight 8.0%#3 Dutch bank; it is a cooperative financial institution consisting of local independent Rabobanks in the Netherlands; low risk & strong business franchise, leading to defendable market shares and predictable earnings; cross-support mechanism among member banks of the group. Rabobank reported EUR 1.2bn (+28%) in 1H10 net attributable profit. Pre-provision income was stable but its quality increased, as net interest income and net commission income were higher, offset by a decline in other revenues and costs. The capital position was strengthened by earnings retention and declining risk-weighted assets, leading to a Tier-1 ratio of 14.9%. Rabobank did not participate in any of the government's programs. Management, in contrast to previous years but in line with current market practice, did not provide a FY10 profit target. Instead, the bank's commitment to strong capitalization and to liquidity as well as the conservative business approach was confirmed. Based on the 2010 economic recovery, loan-loss provisions are expected to decrease yoy, but to remain at a high, above-average level.
A1s/An/As Stable Raiffeisen Zentralbank Österreich (RZB): Marketweight 0.4%Raiffeisen Zentralbank Österreich AG (RZB) is primarily a wholesale commercial bank. It is also the central bank of the Austrian Raiffeisen cooperative banking sector. The planned merger with its 70%-subsidiary Raiffeisen International will be realized in 4Q10 with retroactive effect as of 1 January 2010; on a pro-forma basis, the new entity ("Raiffeisen Bank International") had a net profit of EUR 472mn in 1H10. As announced in February, RZB's activities related to being the head institution of the Austrian Raiffeisen Banking Group will be transferred to a new banking institution. The latter will not be part of the merger but become the new group parent instead, named RZB Holding Bank. RZB's Austrian and international corporate customer business will be merged into stock-market listed RI, which will be renamed in Raiffeisenbank International AG, and which will continue to run the activities in 17 CEE countries. All wholesale liabilities will move to the new RI, while the new RZB Holding Bank will assume the intra-group liquidity equalization business. The free-float will decrease from currently 30% to 21.2%-22%.
Aa3s/A+s/AA-s Stable RBS (RBS): Marketweight 3.9%RBS is a universal bank engaging in private, retail, corporate, and investment banking, primarily in the UK and the US, but also in Ireland, Continental Europe, and Asia-Pacific. RBS reported GBP 257mn in 2Q10 net attributable profit, or GBP 9mn in 1H10, in line with market expectations. In operating terms, i.e. when deducting items such as taxes, Asset Protection Scheme (APS) costs, and restructuring expenses, among others, there was a 2Q10 profit of GBP 869mn. Compared yoy, these figures are an improvement, with higher revenues (particularly in Global Banking & Markets, GBM), slightly lower costs, and slightly lower loan-loss provisions being the drivers. Capitalization ratios (pro-forma basis) were slightly lower than in December, with the Tier-1 ratio at 12.8%, and the core Tier-1 ratio at 10.5%. In regard to the outlook, management said that the interest margin might improve in 2H10, but market-related revenues are likely to decline. In the short term, figures might deteriorate, but there is confidence to achieve the targets of the 2009-13 strategic plan. The figures are credit neutral.
A1n/As/A+s Stable Skandinaviska Enskilda Banken AB (SEB): Marketweight 0.7%#2 Swedish bank, active in retail, corporate, investment banking and asset management. The Group is active in the Nordic as well as in the Baltic area. SEB reported a net attributable profit of SEK 674mn in 1Q10, well above expectations. Total revenues were down by 5% qoq and by 18% yoy, as net interest income and trading income declined substantially yoy. Costs were flat qoq and 12% lower yoy. Loan-loss provisions were significantly lower than last year, as impaired loans decreased by 8%, and loan-loss provisions in the Baltics almost halved qoq. Asset quality remained largely stable outside CEE, and improved in the Baltics, which, however, still account for 74% of the group's loan-loss provisions. Capitalization ratios slightly declined compared to December, with the Tier-1 ratio being 12.4% and the total capital ratio 13.1% now; the fading out of the Basel II transitional floor will lift these by ca. 1.5pp. Management did not provide any profit targets for FY10.
Baa1n/BBB+n/BBB+n Stable SNS REAAL (SNSSNS): Marketweight 0.4%SNS REAAL is a bancassurance entity offering its services to retail and small corporate clients. There are two major operating companies within the group: SNS Bank (#5 Dutch bank), including separate entities such as SNS Securities and SNS Asset Management, and REAAL Verzekeringen (#2 Dutch life insurer). SNS REAAL reported EUR 29mn in 1H10 net attributable profit, compared to a loss of EUR 30mn in 1H09. Both total revenues (-4%) and expenses (-5%) declined yoy. Banking capitalization improved, with core Tier-1 ratio at 8.6%, Tier-1 ratio at 11.1%, and total capital ratio at 14.5%. Insurance solvency under IFRS improved to 340% (314% as of December 2009), regulatory insolvency declined to 204% (230%), and group double leverage improved to 112.1% (113.1%). For the current year, management expects continued challenges in real estate, with impairments at elevated levels. Group-wide, there was EUR 17.7bn in sovereign exposure as of June, with the most part being to Germany, France, and the Netherlands. The figures are credit positive, as they show a continued turnaround.
Aa2n/A+s/A+s Stable Société Générale (SOCGEN): Marketweight 2.8%Société Générale (SocGen) is one of the top 3 and also one of the oldest banks in France. Furthermore, characteristically it is the 3rd largest Corporate and Investment bank (SG CIB) in the eurozone. Société Générale reported much better-than-expected 2Q10 results, mainly due to fair value gains on own debt. Net attributable profit increased by 12% qoq and more than tripled yoy to EUR 1,084mn, which is significantly above the EUR 690mn market expectations. The sound performance was due to the combination of higher net banking income (up 1.5% qoq and 17% yoy to EUR 6,679mn) and lower provisioning (down 11% qoq and 6% yoy to EUR 1,010mn). Asset quality deterioration slowed down substantially qoq, reporting a slight increase in the NPL ratio of 5.68% (up 13bp qoq) and a marginal improvement in the NPL coverage of 51% (up 1pp) despite the reduced provisioning. Solvency ratios were nearly flat, as the core Tier-1 ratio was stable at a comfortable 8.5% and the Tier-1 ratio was up by 10bp to a comfortable 10.7%. SocGen's stressed Tier-1 ratio of 10% was one of the strongest in the EU stress test.
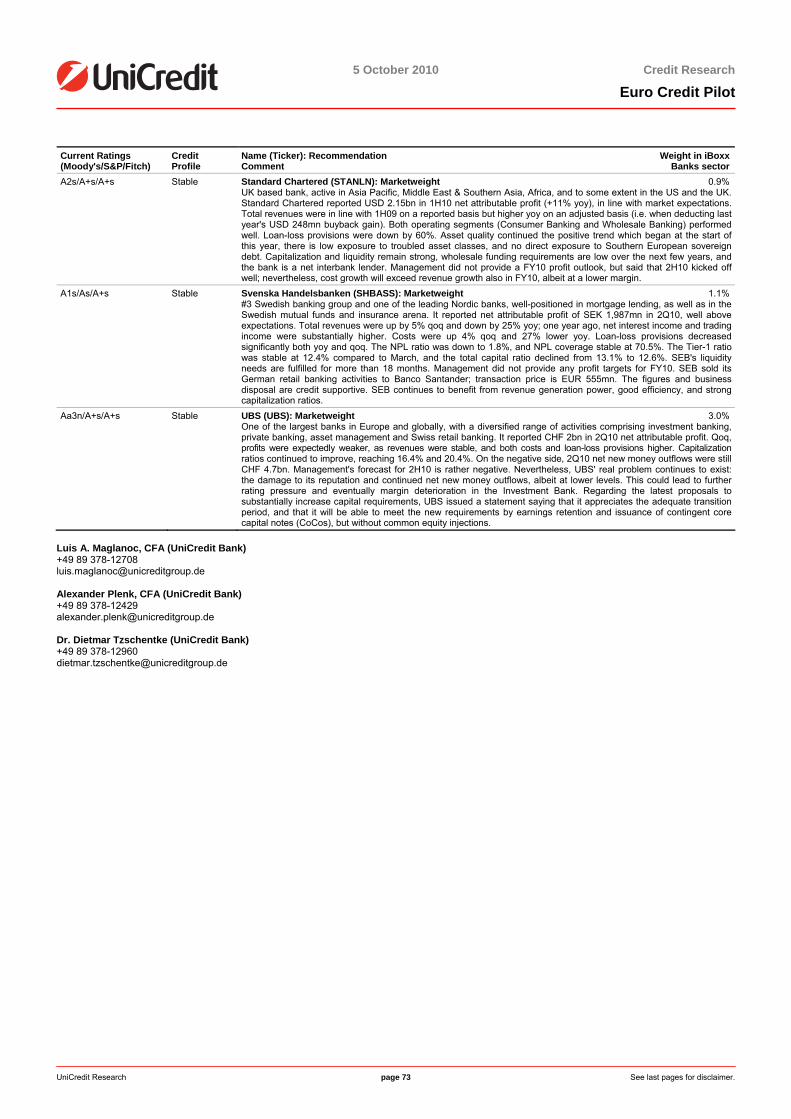
5 October 2010
5 October 2010 Credit Research
Euro Credit Pilot
UniCredit Research page 73 See last pages for disclaimer.
Current Ratings (Moody's/S&P/Fitch)
Credit Profile
Name (Ticker): Recommendation Weight in iBoxxComment Banks sector
A2s/A+s/A+s Stable Standard Chartered (STANLN): Marketweight 0.9%UK based bank, active in Asia Pacific, Middle East & Southern Asia, Africa, and to some extent in the US and the UK. Standard Chartered reported USD 2.15bn in 1H10 net attributable profit (+11% yoy), in line with market expectations. Total revenues were in line with 1H09 on a reported basis but higher yoy on an adjusted basis (i.e. when deducting last year's USD 248mn buyback gain). Both operating segments (Consumer Banking and Wholesale Banking) performed well. Loan-loss provisions were down by 60%. Asset quality continued the positive trend which began at the start of this year, there is low exposure to troubled asset classes, and no direct exposure to Southern European sovereign debt. Capitalization and liquidity remain strong, wholesale funding requirements are low over the next few years, and the bank is a net interbank lender. Management did not provide a FY10 profit outlook, but said that 2H10 kicked off well; nevertheless, cost growth will exceed revenue growth also in FY10, albeit at a lower margin.
A1s/As/A+s Stable Svenska Handelsbanken (SHBASS): Marketweight 1.1%#3 Swedish banking group and one of the leading Nordic banks, well-positioned in mortgage lending, as well as in the Swedish mutual funds and insurance arena. It reported net attributable profit of SEK 1,987mn in 2Q10, well above expectations. Total revenues were up by 5% qoq and down by 25% yoy; one year ago, net interest income and trading income were substantially higher. Costs were up 4% qoq and 27% lower yoy. Loan-loss provisions decreased significantly both yoy and qoq. The NPL ratio was down to 1.8%, and NPL coverage stable at 70.5%. The Tier-1 ratio was stable at 12.4% compared to March, and the total capital ratio declined from 13.1% to 12.6%. SEB's liquidity needs are fulfilled for more than 18 months. Management did not provide any profit targets for FY10. SEB sold its German retail banking activities to Banco Santander; transaction price is EUR 555mn. The figures and business disposal are credit supportive. SEB continues to benefit from revenue generation power, good efficiency, and strong capitalization ratios.
Aa3n/A+s/A+s Stable UBS (UBS): Marketweight 3.0%One of the largest banks in Europe and globally, with a diversified range of activities comprising investment banking, private banking, asset management and Swiss retail banking. It reported CHF 2bn in 2Q10 net attributable profit. Qoq, profits were expectedly weaker, as revenues were stable, and both costs and loan-loss provisions higher. Capitalization ratios continued to improve, reaching 16.4% and 20.4%. On the negative side, 2Q10 net new money outflows were still CHF 4.7bn. Management's forecast for 2H10 is rather negative. Nevertheless, UBS' real problem continues to exist: the damage to its reputation and continued net new money outflows, albeit at lower levels. This could lead to further rating pressure and eventually margin deterioration in the Investment Bank. Regarding the latest proposals to substantially increase capital requirements, UBS issued a statement saying that it appreciates the adequate transition period, and that it will be able to meet the new requirements by earnings retention and issuance of contingent core capital notes (CoCos), but without common equity injections.
Luis A. Maglanoc, CFA (UniCredit Bank) +49 89 378-12708 [email protected] Alexander Plenk, CFA (UniCredit Bank) +49 89 378-12429 [email protected] Dr. Dietmar Tzschentke (UniCredit Bank) +49 89 378-12960 [email protected]

5 October 2010
5 October 2010 Credit Research
Euro Credit Pilot
UniCredit Research page 74 See last pages for disclaimer.
Financial Services (Marketweight) Sector key figures Sector Wrap-Up Weight in iBoxx FIN: Current ASW spread: Euro STOXX FSV YTD:
7.6% SEN: 134.2bp T1: 450.6bp -8.2%
Sector drivers: Following many drop-outs in 2008, the iBoxx FSV is now an even smaller sector, including a weird mix of single names which do not have much in common, except for being in some way related to financials and not fitting into other sectors (according to the iBoxx committee members; we have a different view in some cases). Given this composition, we discontinue to provide a sector view, as this simply does not make any sense. Moreover, we focus our comment on the by far most important issuer in this sector. Last month's recap: n.a.
Current Ratings (Moody's/S&P/Fitch)
Credit Profile
Name (Ticker): Recommendation Weight in iBoxxComment Financial Services sector
Aa2s/AA+s/-- Stable GE Capital Corp (GE): Marketweight 59.1%GE Capital (GECC) and General Electric Co reported improved 2Q10 results that S&P says will not affect their ratings and outlooks. GE announced 2Q10 earnings from continuing operations (attributable to GE) of USD 3.3bn, with EPS of USD 0.30 per share, up 15% from the second quarter of 2009. Revenues were USD 37.4bn for the quarter, down 4% yoy, impacted by lower GE Capital assets, industrial dispositions and lower equipment sales as expected. GE reports total company orders of USD 19.2bn, up 8%; equipment orders up 17%; GE Capital losses have peaked and earnings are rebounding; Industrial cash flow from operations at USD 6.3bn YTD; USD 74bn consolidated cash and equivalents; and Industrial margins strong at 17.1%, up 70bp from 2Q09. S&P continues to view GECC's stand-alone credit profile as 'A'. Overall, 2Q10 results met the agency's expectations, as management worked to reduce the relative size of its financial-services business (assets declined almost 5% from year-end 2009) and non-real estate asset quality showed further signs of stabilization. General Electric Capital Services Inc. (GECS) – GECC's direct parent – reported consolidated net earnings from continuing operations of USD 809mn, more than doubling results from the previous year.
Luis A. Maglanoc, CFA (UniCredit Bank) +49 89 378-12708 [email protected]
Insurance (Marketweight) Sector key figures Sector Wrap-Up Weight in iBoxx FIN: Current ASW spread: Euro STOXX INN YTD:
10.4% SEN: 123.8bp T1: 407.6bp -7.9%
Sector drivers: In line with the banks, in August we changed our position on the insurance sector: overweight on sub-debt and underweight on senior debt, i.e. vice versa the previous recommendation. The outlook for the life sector is more bearish, hence we continue to underweight life. The European insurance sector has fared well relative to banks over the past two years. While insurers were not the cause of the financial turmoil, they still suffer some of its consequences. The highest degree of negative rating actions occurred in the life and health sector, followed by property & casualty, with reinsurance showing a greater level of rating stability. 2H09 and 1H10 results of the major insurers that we cover have overall been positive, showing recovery and/or continuing improvements in their operating performance and financial condition. Going forward, we expect the overall stabilization in capital market conditions to continue to ease valuation pressures on insurers' balance sheets, even put values back, while improving access to debt capital markets, despite elevated uncertainties in the course of this year. Stabilizing macroeconomic conditions should also support operating performance. We expect a stabilizing credit rating environment, and continued improvement in spreads, although we do not expect a marked increase in debt issuance. As regards Insurance Solvency II, it is difficult to estimate how much more capital would be required under draft QIS5 compared with QIS4, with the draft QIS5 viewed as a "halfway house". The EC has said that it does not want Solvency II to result in industry-wide capital raising. Still, incentives are strong for insurers to seek approval to use internal models for SCR under Solvency II. From an industry perspective, several companies, especially smaller ones with little business line diversity, may need to raise capital or alter their business or investment mix to meet the new, increased capital requirements. In the draft QIS5, changes to own funds and credit for liquidity premium is likely to increase available capital for insurers and a number of calibrations have been reduced, resulting in slightly less onerous capital requirements for the insurers affected. However, at a group level, the calculation of the risk margin has been changed to exclude diversification benefit between entities which will reduce available capital at the group level. In a recent report, Fitch said its stress-testing of European insurers based on their euro-zone sovereign exposures has resulted in no rating actions. The agency has applied a sovereign stress test to its rated portfolio of European insurers. The agency believes that all companies in this portfolio would be able to withstand an external shock derived from a hypothetical Greek sovereign default, including an assumption of ancillary stress for other key euro-zone nations. The agency has therefore not taken any rating actions on its European insurance portfolio as a result of this stress test. Insurance companies, as substantial investors in fixed-interest securities and as businesses that rely heavily on investment returns for a large part of their profitability, can be affected by difficulties facing sovereign issuers. In recent months, certain sovereigns have faced such difficulties. Fitch has implemented a stress test to gauge companies’ ability to withstand a deterioration of the credit quality of certain sovereigns and sharp changes in market values for the securities of these sovereigns. Last month's recap: After spiking in May, in line with general market nervousness on sovereign risk, and the perception of fragility of the worldwide economic recovery, both senior and sub-debt spreads recovered, then inched up in June and July, inching down in August and September, while sub-debt has been recovering over the same months.
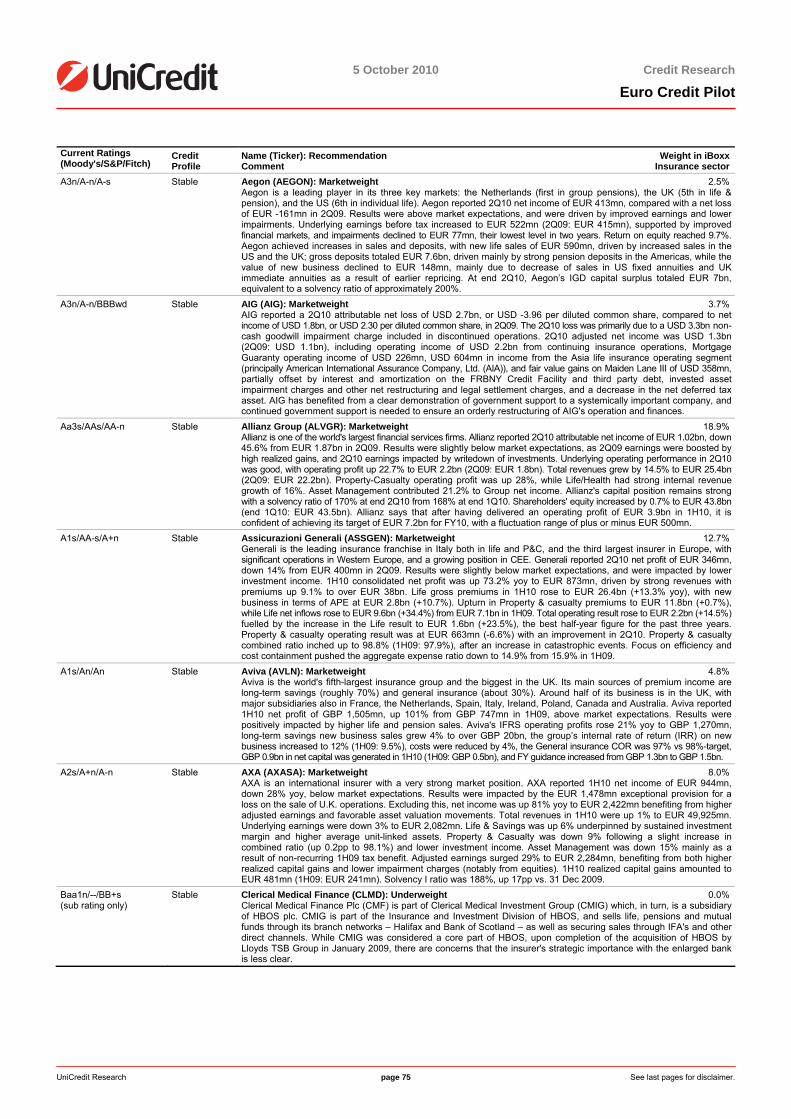
5 October 2010
5 October 2010 Credit Research
Euro Credit Pilot
UniCredit Research page 75 See last pages for disclaimer.
Current Ratings (Moody's/S&P/Fitch)
Credit Profile
Name (Ticker): Recommendation Weight in iBoxxComment Insurance sector
A3n/A-n/A-s Stable Aegon (AEGON): Marketweight 2.5%Aegon is a leading player in its three key markets: the Netherlands (first in group pensions), the UK (5th in life & pension), and the US (6th in individual life). Aegon reported 2Q10 net income of EUR 413mn, compared with a net loss of EUR -161mn in 2Q09. Results were above market expectations, and were driven by improved earnings and lower impairments. Underlying earnings before tax increased to EUR 522mn (2Q09: EUR 415mn), supported by improved financial markets, and impairments declined to EUR 77mn, their lowest level in two years. Return on equity reached 9.7%. Aegon achieved increases in sales and deposits, with new life sales of EUR 590mn, driven by increased sales in the US and the UK; gross deposits totaled EUR 7.6bn, driven mainly by strong pension deposits in the Americas, while the value of new business declined to EUR 148mn, mainly due to decrease of sales in US fixed annuities and UK immediate annuities as a result of earlier repricing. At end 2Q10, Aegon’s IGD capital surplus totaled EUR 7bn, equivalent to a solvency ratio of approximately 200%.
A3n/A-n/BBBwd Stable AIG (AIG): Marketweight 3.7%AIG reported a 2Q10 attributable net loss of USD 2.7bn, or USD -3.96 per diluted common share, compared to net income of USD 1.8bn, or USD 2.30 per diluted common share, in 2Q09. The 2Q10 loss was primarily due to a USD 3.3bn non-cash goodwill impairment charge included in discontinued operations. 2Q10 adjusted net income was USD 1.3bn (2Q09: USD 1.1bn), including operating income of USD 2.2bn from continuing insurance operations, Mortgage Guaranty operating income of USD 226mn, USD 604mn in income from the Asia life insurance operating segment (principally American International Assurance Company, Ltd. (AIA)), and fair value gains on Maiden Lane III of USD 358mn, partially offset by interest and amortization on the FRBNY Credit Facility and third party debt, invested asset impairment charges and other net restructuring and legal settlement charges, and a decrease in the net deferred tax asset. AIG has benefited from a clear demonstration of government support to a systemically important company, and continued government support is needed to ensure an orderly restructuring of AIG's operation and finances.
Aa3s/AAs/AA-n Stable Allianz Group (ALVGR): Marketweight 18.9%Allianz is one of the world's largest financial services firms. Allianz reported 2Q10 attributable net income of EUR 1.02bn, down 45.6% from EUR 1.87bn in 2Q09. Results were slightly below market expectations, as 2Q09 earnings were boosted by high realized gains, and 2Q10 earnings impacted by writedown of investments. Underlying operating performance in 2Q10 was good, with operating profit up 22.7% to EUR 2.2bn (2Q09: EUR 1.8bn). Total revenues grew by 14.5% to EUR 25.4bn (2Q09: EUR 22.2bn). Property-Casualty operating profit was up 28%, while Life/Health had strong internal revenue growth of 16%. Asset Management contributed 21.2% to Group net income. Allianz's capital position remains strong with a solvency ratio of 170% at end 2Q10 from 168% at end 1Q10. Shareholders' equity increased by 0.7% to EUR 43.8bn (end 1Q10: EUR 43.5bn). Allianz says that after having delivered an operating profit of EUR 3.9bn in 1H10, it is confident of achieving its target of EUR 7.2bn for FY10, with a fluctuation range of plus or minus EUR 500mn.
A1s/AA-s/A+n Stable Assicurazioni Generali (ASSGEN): Marketweight 12.7%Generali is the leading insurance franchise in Italy both in life and P&C, and the third largest insurer in Europe, with significant operations in Western Europe, and a growing position in CEE. Generali reported 2Q10 net profit of EUR 346mn, down 14% from EUR 400mn in 2Q09. Results were slightly below market expectations, and were impacted by lower investment income. 1H10 consolidated net profit was up 73.2% yoy to EUR 873mn, driven by strong revenues with premiums up 9.1% to over EUR 38bn. Life gross premiums in 1H10 rose to EUR 26.4bn (+13.3% yoy), with new business in terms of APE at EUR 2.8bn (+10.7%). Upturn in Property & casualty premiums to EUR 11.8bn (+0.7%), while Life net inflows rose to EUR 9.6bn (+34.4%) from EUR 7.1bn in 1H09. Total operating result rose to EUR 2.2bn (+14.5%) fuelled by the increase in the Life result to EUR 1.6bn (+23.5%), the best half-year figure for the past three years. Property & casualty operating result was at EUR 663mn (-6.6%) with an improvement in 2Q10. Property & casualty combined ratio inched up to 98.8% (1H09: 97.9%), after an increase in catastrophic events. Focus on efficiency and cost containment pushed the aggregate expense ratio down to 14.9% from 15.9% in 1H09.
A1s/An/An Stable Aviva (AVLN): Marketweight 4.8%Aviva is the world's fifth-largest insurance group and the biggest in the UK. Its main sources of premium income are long-term savings (roughly 70%) and general insurance (about 30%). Around half of its business is in the UK, with major subsidiaries also in France, the Netherlands, Spain, Italy, Ireland, Poland, Canada and Australia. Aviva reported 1H10 net profit of GBP 1,505mn, up 101% from GBP 747mn in 1H09, above market expectations. Results were positively impacted by higher life and pension sales. Aviva's IFRS operating profits rose 21% yoy to GBP 1,270mn, long-term savings new business sales grew 4% to over GBP 20bn, the group’s internal rate of return (IRR) on new business increased to 12% (1H09: 9.5%), costs were reduced by 4%, the General insurance COR was 97% vs 98%-target, GBP 0.9bn in net capital was generated in 1H10 (1H09: GBP 0.5bn), and FY guidance increased from GBP 1.3bn to GBP 1.5bn.
A2s/A+n/A-n Stable AXA (AXASA): Marketweight 8.0%AXA is an international insurer with a very strong market position. AXA reported 1H10 net income of EUR 944mn, down 28% yoy, below market expectations. Results were impacted by the EUR 1,478mn exceptional provision for a loss on the sale of U.K. operations. Excluding this, net income was up 81% yoy to EUR 2,422mn benefiting from higher adjusted earnings and favorable asset valuation movements. Total revenues in 1H10 were up 1% to EUR 49,925mn. Underlying earnings were down 3% to EUR 2,082mn. Life & Savings was up 6% underpinned by sustained investment margin and higher average unit-linked assets. Property & Casualty was down 9% following a slight increase in combined ratio (up 0.2pp to 98.1%) and lower investment income. Asset Management was down 15% mainly as a result of non-recurring 1H09 tax benefit. Adjusted earnings surged 29% to EUR 2,284mn, benefiting from both higher realized capital gains and lower impairment charges (notably from equities). 1H10 realized capital gains amounted to EUR 481mn (1H09: EUR 241mn). Solvency I ratio was 188%, up 17pp vs. 31 Dec 2009.
Baa1n/--/BB+s (sub rating only)
Stable Clerical Medical Finance (CLMD): Underweight 0.0%Clerical Medical Finance Plc (CMF) is part of Clerical Medical Investment Group (CMIG) which, in turn, is a subsidiary of HBOS plc. CMIG is part of the Insurance and Investment Division of HBOS, and sells life, pensions and mutual funds through its branch networks – Halifax and Bank of Scotland – as well as securing sales through IFA's and other direct channels. While CMIG was considered a core part of HBOS, upon completion of the acquisition of HBOS by Lloyds TSB Group in January 2009, there are concerns that the insurer's strategic importance with the enlarged bank is less clear.
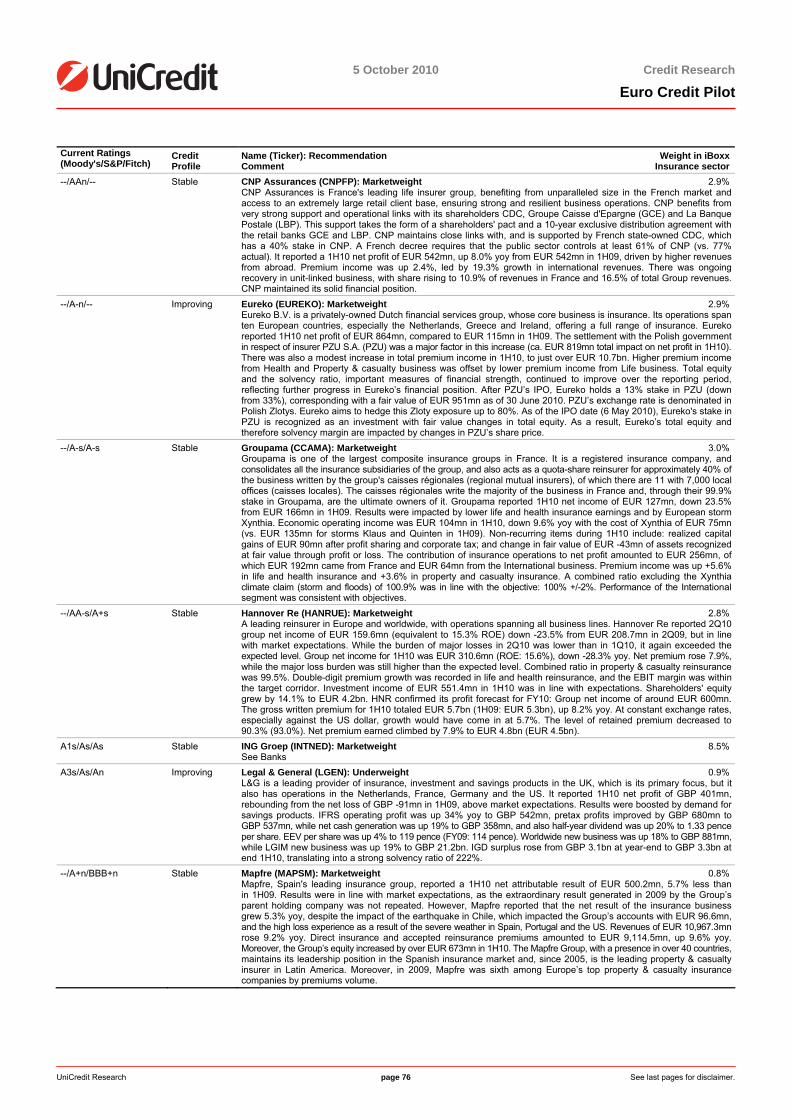
5 October 2010
5 October 2010 Credit Research
Euro Credit Pilot
UniCredit Research page 76 See last pages for disclaimer.
Current Ratings (Moody's/S&P/Fitch)
Credit Profile
Name (Ticker): Recommendation Weight in iBoxxComment Insurance sector
--/AAn/-- Stable CNP Assurances (CNPFP): Marketweight 2.9%CNP Assurances is France's leading life insurer group, benefiting from unparalleled size in the French market and access to an extremely large retail client base, ensuring strong and resilient business operations. CNP benefits from very strong support and operational links with its shareholders CDC, Groupe Caisse d'Epargne (GCE) and La Banque Postale (LBP). This support takes the form of a shareholders' pact and a 10-year exclusive distribution agreement with the retail banks GCE and LBP. CNP maintains close links with, and is supported by French state-owned CDC, which has a 40% stake in CNP. A French decree requires that the public sector controls at least 61% of CNP (vs. 77% actual). It reported a 1H10 net profit of EUR 542mn, up 8.0% yoy from EUR 542mn in 1H09, driven by higher revenues from abroad. Premium income was up 2.4%, led by 19.3% growth in international revenues. There was ongoing recovery in unit-linked business, with share rising to 10.9% of revenues in France and 16.5% of total Group revenues. CNP maintained its solid financial position.
--/A-n/-- Improving Eureko (EUREKO): Marketweight 2.9%Eureko B.V. is a privately-owned Dutch financial services group, whose core business is insurance. Its operations span ten European countries, especially the Netherlands, Greece and Ireland, offering a full range of insurance. Eureko reported 1H10 net profit of EUR 864mn, compared to EUR 115mn in 1H09. The settlement with the Polish government in respect of insurer PZU S.A. (PZU) was a major factor in this increase (ca. EUR 819mn total impact on net profit in 1H10). There was also a modest increase in total premium income in 1H10, to just over EUR 10.7bn. Higher premium income from Health and Property & casualty business was offset by lower premium income from Life business. Total equity and the solvency ratio, important measures of financial strength, continued to improve over the reporting period, reflecting further progress in Eureko’s financial position. After PZU’s IPO, Eureko holds a 13% stake in PZU (down from 33%), corresponding with a fair value of EUR 951mn as of 30 June 2010. PZU’s exchange rate is denominated in Polish Zlotys. Eureko aims to hedge this Zloty exposure up to 80%. As of the IPO date (6 May 2010), Eureko's stake in PZU is recognized as an investment with fair value changes in total equity. As a result, Eureko’s total equity and therefore solvency margin are impacted by changes in PZU’s share price.
--/A-s/A-s Stable Groupama (CCAMA): Marketweight 3.0%Groupama is one of the largest composite insurance groups in France. It is a registered insurance company, and consolidates all the insurance subsidiaries of the group, and also acts as a quota-share reinsurer for approximately 40% of the business written by the group's caisses régionales (regional mutual insurers), of which there are 11 with 7,000 local offices (caisses locales). The caisses régionales write the majority of the business in France and, through their 99.9% stake in Groupama, are the ultimate owners of it. Groupama reported 1H10 net income of EUR 127mn, down 23.5% from EUR 166mn in 1H09. Results were impacted by lower life and health insurance earnings and by European storm Xynthia. Economic operating income was EUR 104mn in 1H10, down 9.6% yoy with the cost of Xynthia of EUR 75mn (vs. EUR 135mn for storms Klaus and Quinten in 1H09). Non-recurring items during 1H10 include: realized capital gains of EUR 90mn after profit sharing and corporate tax; and change in fair value of EUR -43mn of assets recognized at fair value through profit or loss. The contribution of insurance operations to net profit amounted to EUR 256mn, of which EUR 192mn came from France and EUR 64mn from the International business. Premium income was up +5.6% in life and health insurance and +3.6% in property and casualty insurance. A combined ratio excluding the Xynthia climate claim (storm and floods) of 100.9% was in line with the objective: 100% +/-2%. Performance of the International segment was consistent with objectives.
--/AA-s/A+s Stable Hannover Re (HANRUE): Marketweight 2.8%A leading reinsurer in Europe and worldwide, with operations spanning all business lines. Hannover Re reported 2Q10 group net income of EUR 159.6mn (equivalent to 15.3% ROE) down -23.5% from EUR 208.7mn in 2Q09, but in line with market expectations. While the burden of major losses in 2Q10 was lower than in 1Q10, it again exceeded the expected level. Group net income for 1H10 was EUR 310.6mn (ROE: 15.6%), down -28.3% yoy. Net premium rose 7.9%, while the major loss burden was still higher than the expected level. Combined ratio in property & casualty reinsurance was 99.5%. Double-digit premium growth was recorded in life and health reinsurance, and the EBIT margin was within the target corridor. Investment income of EUR 551.4mn in 1H10 was in line with expectations. Shareholders' equity grew by 14.1% to EUR 4.2bn. HNR confirmed its profit forecast for FY10: Group net income of around EUR 600mn. The gross written premium for 1H10 totaled EUR 5.7bn (1H09: EUR 5.3bn), up 8.2% yoy. At constant exchange rates, especially against the US dollar, growth would have come in at 5.7%. The level of retained premium decreased to 90.3% (93.0%). Net premium earned climbed by 7.9% to EUR 4.8bn (EUR 4.5bn).
A1s/As/As Stable ING Groep (INTNED): Marketweight 8.5%See Banks
A3s/As/An Improving Legal & General (LGEN): Underweight 0.9%L&G is a leading provider of insurance, investment and savings products in the UK, which is its primary focus, but it also has operations in the Netherlands, France, Germany and the US. It reported 1H10 net profit of GBP 401mn, rebounding from the net loss of GBP -91mn in 1H09, above market expectations. Results were boosted by demand for savings products. IFRS operating profit was up 34% yoy to GBP 542mn, pretax profits improved by GBP 680mn to GBP 537mn, while net cash generation was up 19% to GBP 358mn, and also half-year dividend was up 20% to 1.33 pence per share. EEV per share was up 4% to 119 pence (FY09: 114 pence). Worldwide new business was up 18% to GBP 881mn, while LGIM new business was up 19% to GBP 21.2bn. IGD surplus rose from GBP 3.1bn at year-end to GBP 3.3bn at end 1H10, translating into a strong solvency ratio of 222%.
--/A+n/BBB+n Stable Mapfre (MAPSM): Marketweight 0.8%Mapfre, Spain's leading insurance group, reported a 1H10 net attributable result of EUR 500.2mn, 5.7% less than in 1H09. Results were in line with market expectations, as the extraordinary result generated in 2009 by the Group’s parent holding company was not repeated. However, Mapfre reported that the net result of the insurance business grew 5.3% yoy, despite the impact of the earthquake in Chile, which impacted the Group’s accounts with EUR 96.6mn, and the high loss experience as a result of the severe weather in Spain, Portugal and the US. Revenues of EUR 10,967.3mn rose 9.2% yoy. Direct insurance and accepted reinsurance premiums amounted to EUR 9,114.5mn, up 9.6% yoy. Moreover, the Group’s equity increased by over EUR 673mn in 1H10. The Mapfre Group, with a presence in over 40 countries, maintains its leadership position in the Spanish insurance market and, since 2005, is the leading property & casualty insurer in Latin America. Moreover, in 2009, Mapfre was sixth among Europe’s top property & casualty insurance companies by premiums volume.
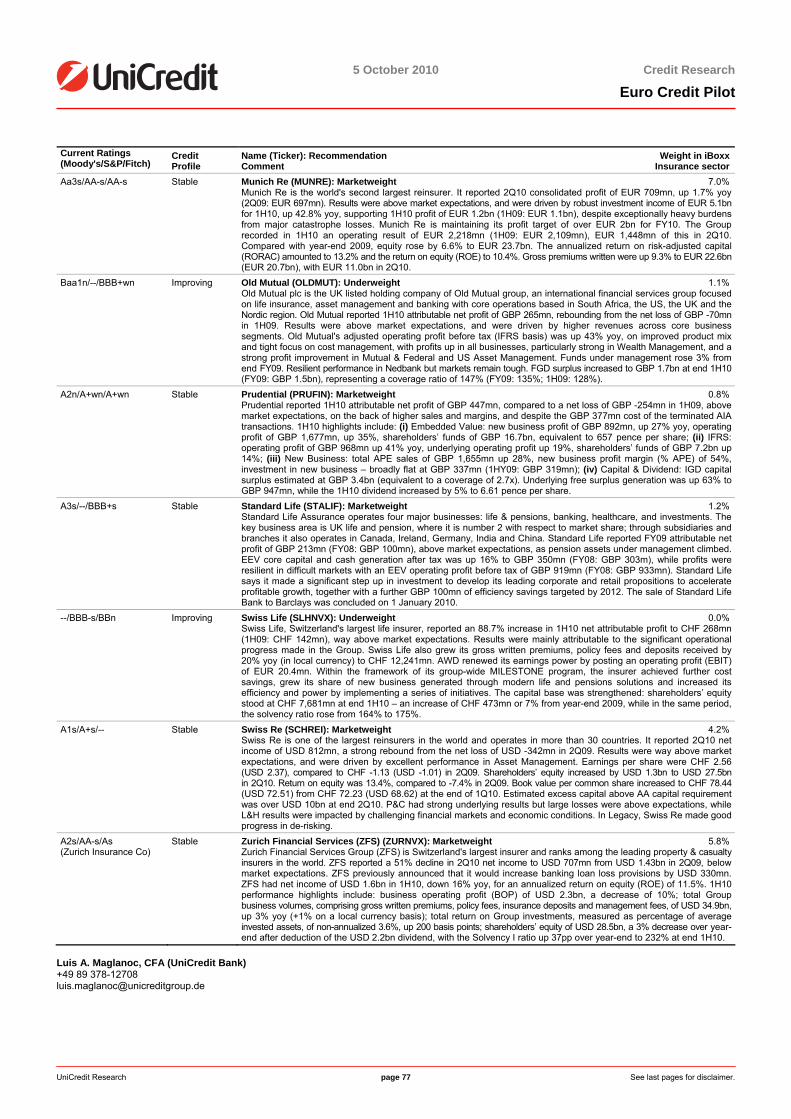
5 October 2010
5 October 2010 Credit Research
Euro Credit Pilot
UniCredit Research page 77 See last pages for disclaimer.
Current Ratings (Moody's/S&P/Fitch)
Credit Profile
Name (Ticker): Recommendation Weight in iBoxxComment Insurance sector
Aa3s/AA-s/AA-s Stable Munich Re (MUNRE): Marketweight 7.0%Munich Re is the world's second largest reinsurer. It reported 2Q10 consolidated profit of EUR 709mn, up 1.7% yoy (2Q09: EUR 697mn). Results were above market expectations, and were driven by robust investment income of EUR 5.1bn for 1H10, up 42.8% yoy, supporting 1H10 profit of EUR 1.2bn (1H09: EUR 1.1bn), despite exceptionally heavy burdens from major catastrophe losses. Munich Re is maintaining its profit target of over EUR 2bn for FY10. The Group recorded in 1H10 an operating result of EUR 2,218mn (1H09: EUR 2,109mn), EUR 1,448mn of this in 2Q10. Compared with year-end 2009, equity rose by 6.6% to EUR 23.7bn. The annualized return on risk-adjusted capital (RORAC) amounted to 13.2% and the return on equity (ROE) to 10.4%. Gross premiums written were up 9.3% to EUR 22.6bn (EUR 20.7bn), with EUR 11.0bn in 2Q10.
Baa1n/--/BBB+wn Improving Old Mutual (OLDMUT): Underweight 1.1%Old Mutual plc is the UK listed holding company of Old Mutual group, an international financial services group focused on life insurance, asset management and banking with core operations based in South Africa, the US, the UK and the Nordic region. Old Mutual reported 1H10 attributable net profit of GBP 265mn, rebounding from the net loss of GBP -70mn in 1H09. Results were above market expectations, and were driven by higher revenues across core business segments. Old Mutual's adjusted operating profit before tax (IFRS basis) was up 43% yoy, on improved product mix and tight focus on cost management, with profits up in all businesses, particularly strong in Wealth Management, and a strong profit improvement in Mutual & Federal and US Asset Management. Funds under management rose 3% from end FY09. Resilient performance in Nedbank but markets remain tough. FGD surplus increased to GBP 1.7bn at end 1H10 (FY09: GBP 1.5bn), representing a coverage ratio of 147% (FY09: 135%; 1H09: 128%).
A2n/A+wn/A+wn Stable Prudential (PRUFIN): Marketweight 0.8%Prudential reported 1H10 attributable net profit of GBP 447mn, compared to a net loss of GBP -254mn in 1H09, above market expectations, on the back of higher sales and margins, and despite the GBP 377mn cost of the terminated AIA transactions. 1H10 highlights include: (i) Embedded Value: new business profit of GBP 892mn, up 27% yoy, operating profit of GBP 1,677mn, up 35%, shareholders’ funds of GBP 16.7bn, equivalent to 657 pence per share; (ii) IFRS: operating profit of GBP 968mn up 41% yoy, underlying operating profit up 19%, shareholders’ funds of GBP 7.2bn up 14%; (iii) New Business: total APE sales of GBP 1,655mn up 28%, new business profit margin (% APE) of 54%, investment in new business – broadly flat at GBP 337mn (1HY09: GBP 319mn); (iv) Capital & Dividend: IGD capital surplus estimated at GBP 3.4bn (equivalent to a coverage of 2.7x). Underlying free surplus generation was up 63% to GBP 947mn, while the 1H10 dividend increased by 5% to 6.61 pence per share.
A3s/--/BBB+s Stable Standard Life (STALIF): Marketweight 1.2%Standard Life Assurance operates four major businesses: life & pensions, banking, healthcare, and investments. The key business area is UK life and pension, where it is number 2 with respect to market share; through subsidiaries and branches it also operates in Canada, Ireland, Germany, India and China. Standard Life reported FY09 attributable net profit of GBP 213mn (FY08: GBP 100mn), above market expectations, as pension assets under management climbed. EEV core capital and cash generation after tax was up 16% to GBP 350mn (FY08: GBP 303m), while profits were resilient in difficult markets with an EEV operating profit before tax of GBP 919mn (FY08: GBP 933mn). Standard Life says it made a significant step up in investment to develop its leading corporate and retail propositions to accelerate profitable growth, together with a further GBP 100mn of efficiency savings targeted by 2012. The sale of Standard Life Bank to Barclays was concluded on 1 January 2010.
--/BBB-s/BBn Improving Swiss Life (SLHNVX): Underweight 0.0%Swiss Life, Switzerland's largest life insurer, reported an 88.7% increase in 1H10 net attributable profit to CHF 268mn (1H09: CHF 142mn), way above market expectations. Results were mainly attributable to the significant operational progress made in the Group. Swiss Life also grew its gross written premiums, policy fees and deposits received by 20% yoy (in local currency) to CHF 12,241mn. AWD renewed its earnings power by posting an operating profit (EBIT) of EUR 20.4mn. Within the framework of its group-wide MILESTONE program, the insurer achieved further cost savings, grew its share of new business generated through modern life and pensions solutions and increased its efficiency and power by implementing a series of initiatives. The capital base was strengthened: shareholders’ equity stood at CHF 7,681mn at end 1H10 – an increase of CHF 473mn or 7% from year-end 2009, while in the same period, the solvency ratio rose from 164% to 175%.
A1s/A+s/-- Stable Swiss Re (SCHREI): Marketweight 4.2%Swiss Re is one of the largest reinsurers in the world and operates in more than 30 countries. It reported 2Q10 net income of USD 812mn, a strong rebound from the net loss of USD -342mn in 2Q09. Results were way above market expectations, and were driven by excellent performance in Asset Management. Earnings per share were CHF 2.56 (USD 2.37), compared to CHF -1.13 (USD -1.01) in 2Q09. Shareholders’ equity increased by USD 1.3bn to USD 27.5bn in 2Q10. Return on equity was 13.4%, compared to -7.4% in 2Q09. Book value per common share increased to CHF 78.44 (USD 72.51) from CHF 72.23 (USD 68.62) at the end of 1Q10. Estimated excess capital above AA capital requirement was over USD 10bn at end 2Q10. P&C had strong underlying results but large losses were above expectations, while L&H results were impacted by challenging financial markets and economic conditions. In Legacy, Swiss Re made good progress in de-risking.
A2s/AA-s/As (Zurich Insurance Co)
Stable Zurich Financial Services (ZFS) (ZURNVX): Marketweight 5.8%Zurich Financial Services Group (ZFS) is Switzerland's largest insurer and ranks among the leading property & casualty insurers in the world. ZFS reported a 51% decline in 2Q10 net income to USD 707mn from USD 1.43bn in 2Q09, below market expectations. ZFS previously announced that it would increase banking loan loss provisions by USD 330mn. ZFS had net income of USD 1.6bn in 1H10, down 16% yoy, for an annualized return on equity (ROE) of 11.5%. 1H10 performance highlights include: business operating profit (BOP) of USD 2.3bn, a decrease of 10%; total Group business volumes, comprising gross written premiums, policy fees, insurance deposits and management fees, of USD 34.9bn, up 3% yoy (+1% on a local currency basis); total return on Group investments, measured as percentage of average invested assets, of non-annualized 3.6%, up 200 basis points; shareholders’ equity of USD 28.5bn, a 3% decrease over year-end after deduction of the USD 2.2bn dividend, with the Solvency I ratio up 37pp over year-end to 232% at end 1H10.
Luis A. Maglanoc, CFA (UniCredit Bank) +49 89 378-12708 [email protected]
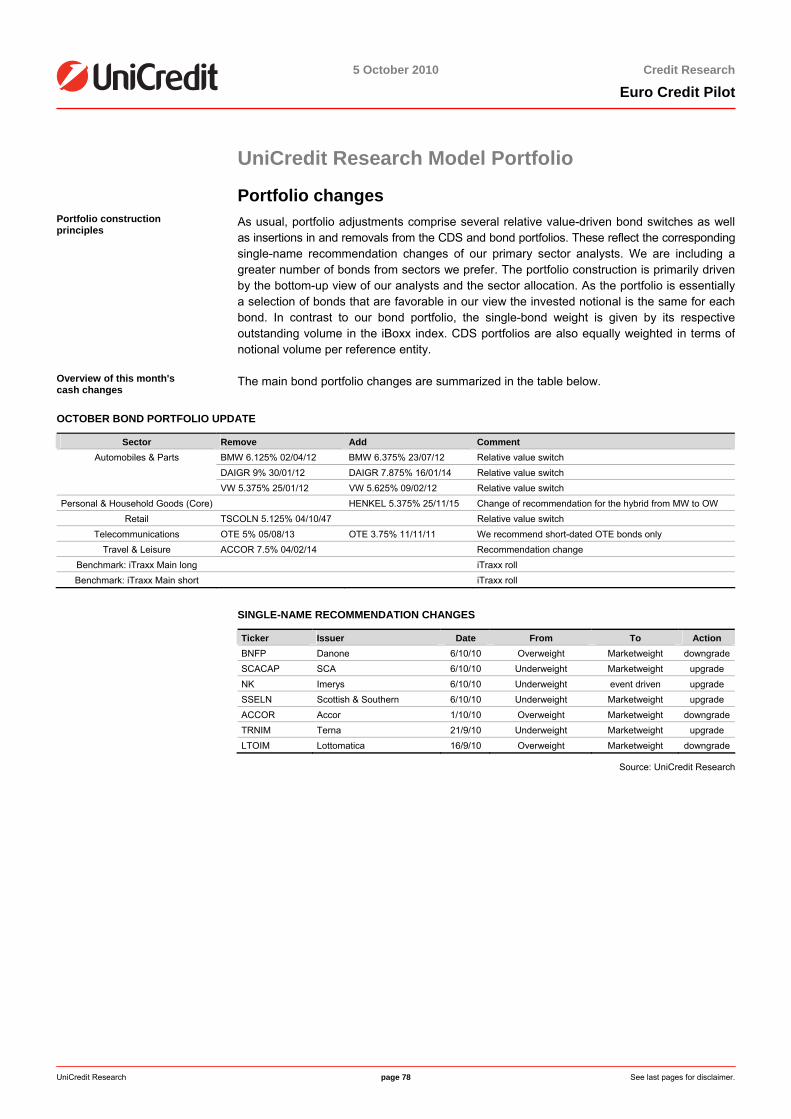
5 October 2010
5 October 2010 Credit Research
Euro Credit Pilot
UniCredit Research page 78 See last pages for disclaimer.
UniCredit Research Model Portfolio
Portfolio changes Portfolio construction principles
As usual, portfolio adjustments comprise several relative value-driven bond switches as well as insertions in and removals from the CDS and bond portfolios. These reflect the correspondingsingle-name recommendation changes of our primary sector analysts. We are including agreater number of bonds from sectors we prefer. The portfolio construction is primarily drivenby the bottom-up view of our analysts and the sector allocation. As the portfolio is essentiallya selection of bonds that are favorable in our view the invested notional is the same for eachbond. In contrast to our bond portfolio, the single-bond weight is given by its respective outstanding volume in the iBoxx index. CDS portfolios are also equally weighted in terms ofnotional volume per reference entity.
Overview of this month's cash changes
The main bond portfolio changes are summarized in the table below.
OCTOBER BOND PORTFOLIO UPDATE
Sector Remove Add Comment BMW 6.125% 02/04/12 BMW 6.375% 23/07/12 Relative value switch DAIGR 9% 30/01/12 DAIGR 7.875% 16/01/14 Relative value switch
Automobiles & Parts
VW 5.375% 25/01/12 VW 5.625% 09/02/12 Relative value switch Personal & Household Goods (Core) HENKEL 5.375% 25/11/15 Change of recommendation for the hybrid from MW to OW
Retail TSCOLN 5.125% 04/10/47 Relative value switch Telecommunications OTE 5% 05/08/13 OTE 3.75% 11/11/11 We recommend short-dated OTE bonds only
Travel & Leisure ACCOR 7.5% 04/02/14 Recommendation change Benchmark: iTraxx Main long iTraxx roll Benchmark: iTraxx Main short iTraxx roll
SINGLE-NAME RECOMMENDATION CHANGES
Ticker Issuer Date From To Action BNFP Danone 6/10/10 Overweight Marketweight downgrade SCACAP SCA 6/10/10 Underweight Marketweight upgrade NK Imerys 6/10/10 Underweight event driven upgrade SSELN Scottish & Southern 6/10/10 Underweight Marketweight upgrade ACCOR Accor 1/10/10 Overweight Marketweight downgrade TRNIM Terna 21/9/10 Underweight Marketweight upgrade LTOIM Lottomatica 16/9/10 Overweight Marketweight downgrade
Source: UniCredit Research
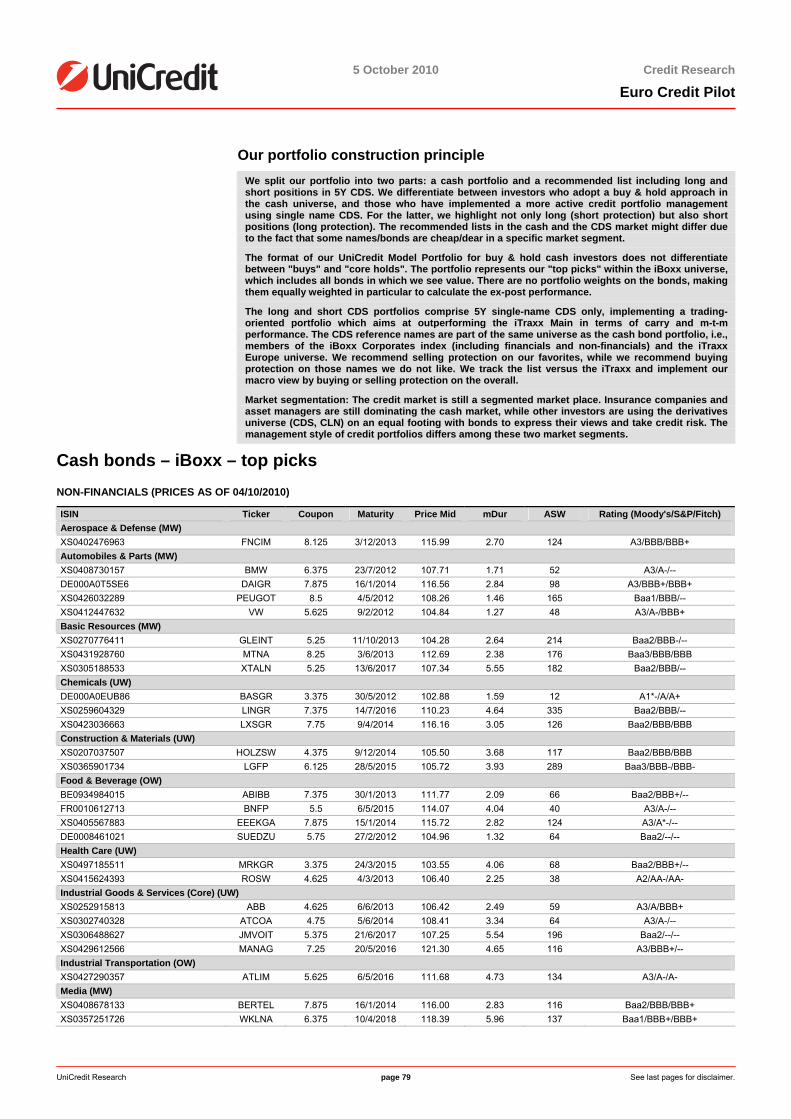
5 October 2010
5 October 2010 Credit Research
Euro Credit Pilot
UniCredit Research page 79 See last pages for disclaimer.
Our portfolio construction principle We split our portfolio into two parts: a cash portfolio and a recommended list including long and
short positions in 5Y CDS. We differentiate between investors who adopt a buy & hold approach in the cash universe, and those who have implemented a more active credit portfolio management using single name CDS. For the latter, we highlight not only long (short protection) but also short positions (long protection). The recommended lists in the cash and the CDS market might differ due to the fact that some names/bonds are cheap/dear in a specific market segment.
The format of our UniCredit Model Portfolio for buy & hold cash investors does not differentiate between "buys" and "core holds". The portfolio represents our "top picks" within the iBoxx universe, which includes all bonds in which we see value. There are no portfolio weights on the bonds, making them equally weighted in particular to calculate the ex-post performance.
The long and short CDS portfolios comprise 5Y single-name CDS only, implementing a trading-oriented portfolio which aims at outperforming the iTraxx Main in terms of carry and m-t-m performance. The CDS reference names are part of the same universe as the cash bond portfolio, i.e., members of the iBoxx Corporates index (including financials and non-financials) and the iTraxx Europe universe. We recommend selling protection on our favorites, while we recommend buying protection on those names we do not like. We track the list versus the iTraxx and implement our macro view by buying or selling protection on the overall.
Market segmentation: The credit market is still a segmented market place. Insurance companies and asset managers are still dominating the cash market, while other investors are using the derivatives universe (CDS, CLN) on an equal footing with bonds to express their views and take credit risk. The management style of credit portfolios differs among these two market segments.
Cash bonds – iBoxx – top picks NON-FINANCIALS (PRICES AS OF 04/10/2010)
ISIN Ticker Coupon Maturity Price Mid mDur ASW Rating (Moody's/S&P/Fitch) Aerospace & Defense (MW) XS0402476963 FNCIM 8.125 3/12/2013 115.99 2.70 124 A3/BBB/BBB+ Automobiles & Parts (MW) XS0408730157 BMW 6.375 23/7/2012 107.71 1.71 52 A3/A-/-- DE000A0T5SE6 DAIGR 7.875 16/1/2014 116.56 2.84 98 A3/BBB+/BBB+ XS0426032289 PEUGOT 8.5 4/5/2012 108.26 1.46 165 Baa1/BBB/-- XS0412447632 VW 5.625 9/2/2012 104.84 1.27 48 A3/A-/BBB+ Basic Resources (MW) XS0270776411 GLEINT 5.25 11/10/2013 104.28 2.64 214 Baa2/BBB-/-- XS0431928760 MTNA 8.25 3/6/2013 112.69 2.38 176 Baa3/BBB/BBB XS0305188533 XTALN 5.25 13/6/2017 107.34 5.55 182 Baa2/BBB/-- Chemicals (UW) DE000A0EUB86 BASGR 3.375 30/5/2012 102.88 1.59 12 A1*-/A/A+ XS0259604329 LINGR 7.375 14/7/2016 110.23 4.64 335 Baa2/BBB/-- XS0423036663 LXSGR 7.75 9/4/2014 116.16 3.05 126 Baa2/BBB/BBB Construction & Materials (UW) XS0207037507 HOLZSW 4.375 9/12/2014 105.50 3.68 117 Baa2/BBB/BBB XS0365901734 LGFP 6.125 28/5/2015 105.72 3.93 289 Baa3/BBB-/BBB- Food & Beverage (OW) BE0934984015 ABIBB 7.375 30/1/2013 111.77 2.09 66 Baa2/BBB+/-- FR0010612713 BNFP 5.5 6/5/2015 114.07 4.04 40 A3/A-/-- XS0405567883 EEEKGA 7.875 15/1/2014 115.72 2.82 124 A3/A*-/-- DE0008461021 SUEDZU 5.75 27/2/2012 104.96 1.32 64 Baa2/--/-- Health Care (UW) XS0497185511 MRKGR 3.375 24/3/2015 103.55 4.06 68 Baa2/BBB+/-- XS0415624393 ROSW 4.625 4/3/2013 106.40 2.25 38 A2/AA-/AA- Industrial Goods & Services (Core) (UW) XS0252915813 ABB 4.625 6/6/2013 106.42 2.49 59 A3/A/BBB+ XS0302740328 ATCOA 4.75 5/6/2014 108.41 3.34 64 A3/A-/-- XS0306488627 JMVOIT 5.375 21/6/2017 107.25 5.54 196 Baa2/--/-- XS0429612566 MANAG 7.25 20/5/2016 121.30 4.65 116 A3/BBB+/-- Industrial Transportation (OW) XS0427290357 ATLIM 5.625 6/5/2016 111.68 4.73 134 A3/A-/A- Media (MW) XS0408678133 BERTEL 7.875 16/1/2014 116.00 2.83 116 Baa2/BBB/BBB+ XS0357251726 WKLNA 6.375 10/4/2018 118.39 5.96 137 Baa1/BBB+/BBB+
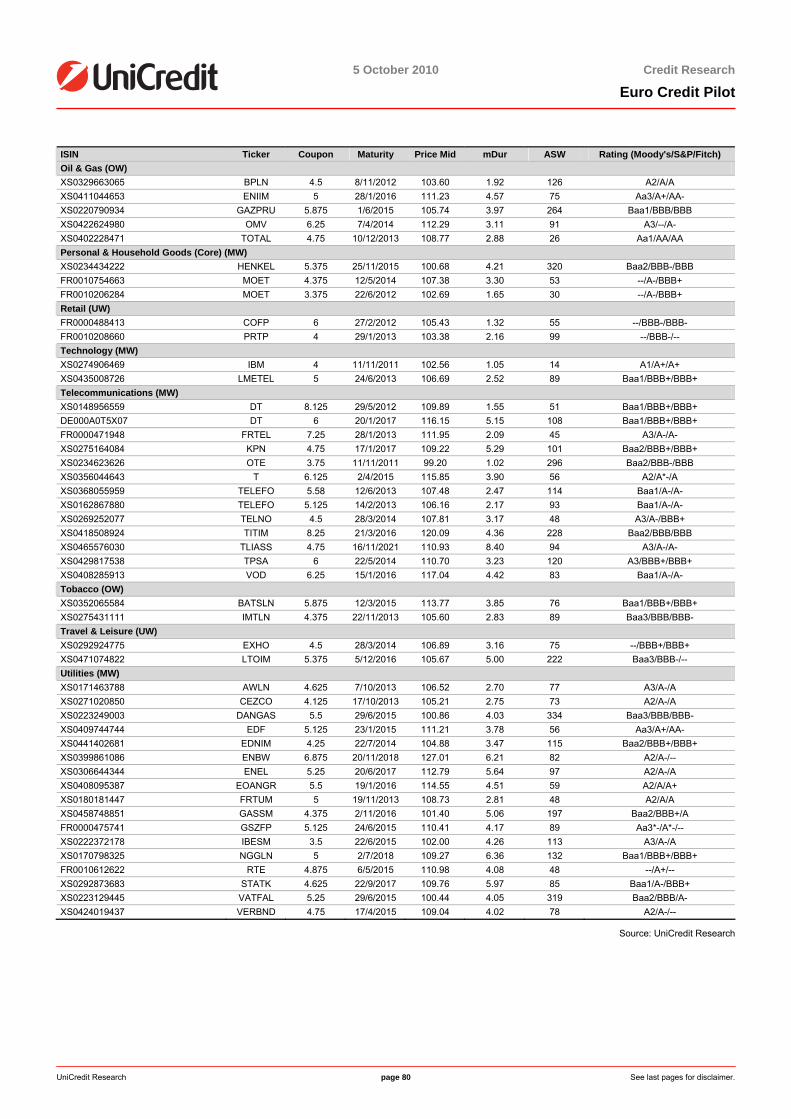
5 October 2010
5 October 2010 Credit Research
Euro Credit Pilot
UniCredit Research page 80 See last pages for disclaimer.
ISIN Ticker Coupon Maturity Price Mid mDur ASW Rating (Moody's/S&P/Fitch) Oil & Gas (OW) XS0329663065 BPLN 4.5 8/11/2012 103.60 1.92 126 A2/A/A XS0411044653 ENIIM 5 28/1/2016 111.23 4.57 75 Aa3/A+/AA- XS0220790934 GAZPRU 5.875 1/6/2015 105.74 3.97 264 Baa1/BBB/BBB XS0422624980 OMV 6.25 7/4/2014 112.29 3.11 91 A3/--/A- XS0402228471 TOTAL 4.75 10/12/2013 108.77 2.88 26 Aa1/AA/AA Personal & Household Goods (Core) (MW) XS0234434222 HENKEL 5.375 25/11/2015 100.68 4.21 320 Baa2/BBB-/BBB FR0010754663 MOET 4.375 12/5/2014 107.38 3.30 53 --/A-/BBB+ FR0010206284 MOET 3.375 22/6/2012 102.69 1.65 30 --/A-/BBB+ Retail (UW) FR0000488413 COFP 6 27/2/2012 105.43 1.32 55 --/BBB-/BBB- FR0010208660 PRTP 4 29/1/2013 103.38 2.16 99 --/BBB-/-- Technology (MW) XS0274906469 IBM 4 11/11/2011 102.56 1.05 14 A1/A+/A+ XS0435008726 LMETEL 5 24/6/2013 106.69 2.52 89 Baa1/BBB+/BBB+ Telecommunications (MW) XS0148956559 DT 8.125 29/5/2012 109.89 1.55 51 Baa1/BBB+/BBB+ DE000A0T5X07 DT 6 20/1/2017 116.15 5.15 108 Baa1/BBB+/BBB+ FR0000471948 FRTEL 7.25 28/1/2013 111.95 2.09 45 A3/A-/A- XS0275164084 KPN 4.75 17/1/2017 109.22 5.29 101 Baa2/BBB+/BBB+ XS0234623626 OTE 3.75 11/11/2011 99.20 1.02 296 Baa2/BBB-/BBB XS0356044643 T 6.125 2/4/2015 115.85 3.90 56 A2/A*-/A XS0368055959 TELEFO 5.58 12/6/2013 107.48 2.47 114 Baa1/A-/A- XS0162867880 TELEFO 5.125 14/2/2013 106.16 2.17 93 Baa1/A-/A- XS0269252077 TELNO 4.5 28/3/2014 107.81 3.17 48 A3/A-/BBB+ XS0418508924 TITIM 8.25 21/3/2016 120.09 4.36 228 Baa2/BBB/BBB XS0465576030 TLIASS 4.75 16/11/2021 110.93 8.40 94 A3/A-/A- XS0429817538 TPSA 6 22/5/2014 110.70 3.23 120 A3/BBB+/BBB+ XS0408285913 VOD 6.25 15/1/2016 117.04 4.42 83 Baa1/A-/A- Tobacco (OW) XS0352065584 BATSLN 5.875 12/3/2015 113.77 3.85 76 Baa1/BBB+/BBB+ XS0275431111 IMTLN 4.375 22/11/2013 105.60 2.83 89 Baa3/BBB/BBB- Travel & Leisure (UW) XS0292924775 EXHO 4.5 28/3/2014 106.89 3.16 75 --/BBB+/BBB+ XS0471074822 LTOIM 5.375 5/12/2016 105.67 5.00 222 Baa3/BBB-/-- Utilities (MW) XS0171463788 AWLN 4.625 7/10/2013 106.52 2.70 77 A3/A-/A XS0271020850 CEZCO 4.125 17/10/2013 105.21 2.75 73 A2/A-/A XS0223249003 DANGAS 5.5 29/6/2015 100.86 4.03 334 Baa3/BBB/BBB- XS0409744744 EDF 5.125 23/1/2015 111.21 3.78 56 Aa3/A+/AA- XS0441402681 EDNIM 4.25 22/7/2014 104.88 3.47 115 Baa2/BBB+/BBB+ XS0399861086 ENBW 6.875 20/11/2018 127.01 6.21 82 A2/A-/-- XS0306644344 ENEL 5.25 20/6/2017 112.79 5.64 97 A2/A-/A XS0408095387 EOANGR 5.5 19/1/2016 114.55 4.51 59 A2/A/A+ XS0180181447 FRTUM 5 19/11/2013 108.73 2.81 48 A2/A/A XS0458748851 GASSM 4.375 2/11/2016 101.40 5.06 197 Baa2/BBB+/A FR0000475741 GSZFP 5.125 24/6/2015 110.41 4.17 89 Aa3*-/A*-/-- XS0222372178 IBESM 3.5 22/6/2015 102.00 4.26 113 A3/A-/A XS0170798325 NGGLN 5 2/7/2018 109.27 6.36 132 Baa1/BBB+/BBB+ FR0010612622 RTE 4.875 6/5/2015 110.98 4.08 48 --/A+/-- XS0292873683 STATK 4.625 22/9/2017 109.76 5.97 85 Baa1/A-/BBB+ XS0223129445 VATFAL 5.25 29/6/2015 100.44 4.05 319 Baa2/BBB/A- XS0424019437 VERBND 4.75 17/4/2015 109.04 4.02 78 A2/A-/--
Source: UniCredit Research
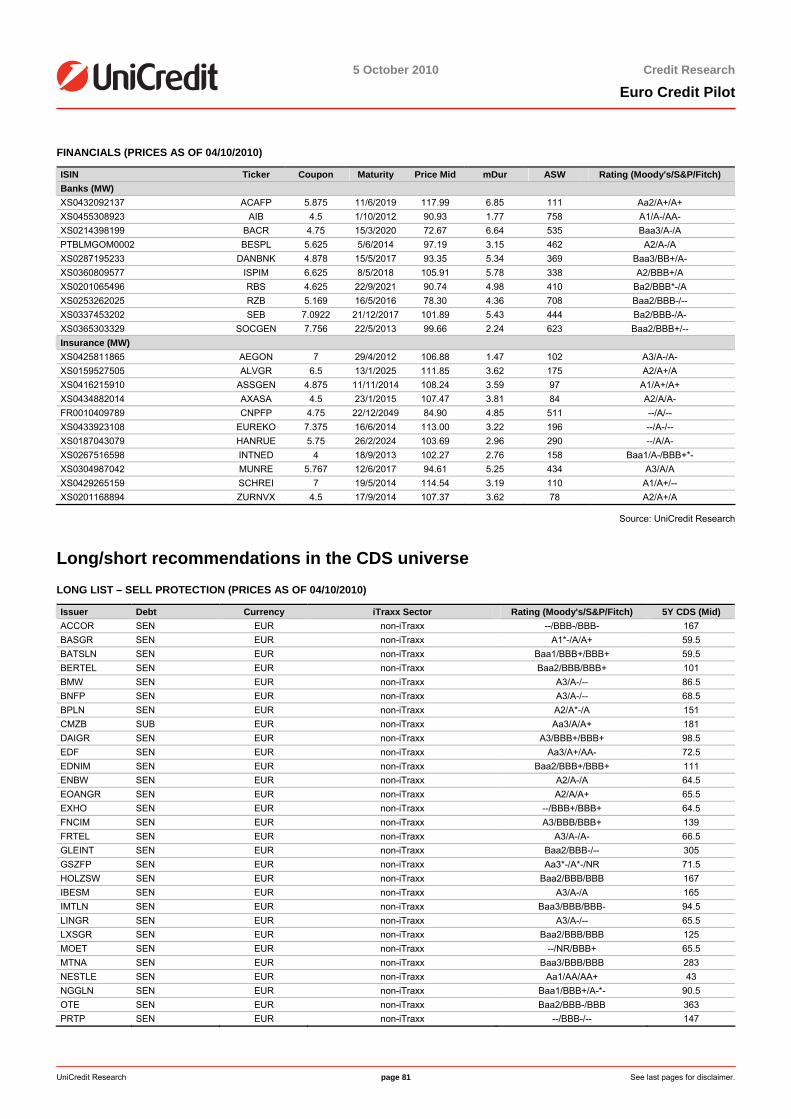
5 October 2010
5 October 2010 Credit Research
Euro Credit Pilot
UniCredit Research page 81 See last pages for disclaimer.
FINANCIALS (PRICES AS OF 04/10/2010)
ISIN Ticker Coupon Maturity Price Mid mDur ASW Rating (Moody's/S&P/Fitch) Banks (MW) XS0432092137 ACAFP 5.875 11/6/2019 117.99 6.85 111 Aa2/A+/A+ XS0455308923 AIB 4.5 1/10/2012 90.93 1.77 758 A1/A-/AA- XS0214398199 BACR 4.75 15/3/2020 72.67 6.64 535 Baa3/A-/A PTBLMGOM0002 BESPL 5.625 5/6/2014 97.19 3.15 462 A2/A-/A XS0287195233 DANBNK 4.878 15/5/2017 93.35 5.34 369 Baa3/BB+/A- XS0360809577 ISPIM 6.625 8/5/2018 105.91 5.78 338 A2/BBB+/A XS0201065496 RBS 4.625 22/9/2021 90.74 4.98 410 Ba2/BBB*-/A XS0253262025 RZB 5.169 16/5/2016 78.30 4.36 708 Baa2/BBB-/-- XS0337453202 SEB 7.0922 21/12/2017 101.89 5.43 444 Ba2/BBB-/A- XS0365303329 SOCGEN 7.756 22/5/2013 99.66 2.24 623 Baa2/BBB+/-- Insurance (MW) XS0425811865 AEGON 7 29/4/2012 106.88 1.47 102 A3/A-/A- XS0159527505 ALVGR 6.5 13/1/2025 111.85 3.62 175 A2/A+/A XS0416215910 ASSGEN 4.875 11/11/2014 108.24 3.59 97 A1/A+/A+ XS0434882014 AXASA 4.5 23/1/2015 107.47 3.81 84 A2/A/A- FR0010409789 CNPFP 4.75 22/12/2049 84.90 4.85 511 --/A/-- XS0433923108 EUREKO 7.375 16/6/2014 113.00 3.22 196 --/A-/-- XS0187043079 HANRUE 5.75 26/2/2024 103.69 2.96 290 --/A/A- XS0267516598 INTNED 4 18/9/2013 102.27 2.76 158 Baa1/A-/BBB+*- XS0304987042 MUNRE 5.767 12/6/2017 94.61 5.25 434 A3/A/A XS0429265159 SCHREI 7 19/5/2014 114.54 3.19 110 A1/A+/-- XS0201168894 ZURNVX 4.5 17/9/2014 107.37 3.62 78 A2/A+/A
Source: UniCredit Research
Long/short recommendations in the CDS universe LONG LIST – SELL PROTECTION (PRICES AS OF 04/10/2010)
Issuer Debt Currency iTraxx Sector Rating (Moody's/S&P/Fitch) 5Y CDS (Mid) ACCOR SEN EUR non-iTraxx --/BBB-/BBB- 167 BASGR SEN EUR non-iTraxx A1*-/A/A+ 59.5 BATSLN SEN EUR non-iTraxx Baa1/BBB+/BBB+ 59.5 BERTEL SEN EUR non-iTraxx Baa2/BBB/BBB+ 101 BMW SEN EUR non-iTraxx A3/A-/-- 86.5 BNFP SEN EUR non-iTraxx A3/A-/-- 68.5 BPLN SEN EUR non-iTraxx A2/A*-/A 151 CMZB SUB EUR non-iTraxx Aa3/A/A+ 181 DAIGR SEN EUR non-iTraxx A3/BBB+/BBB+ 98.5 EDF SEN EUR non-iTraxx Aa3/A+/AA- 72.5 EDNIM SEN EUR non-iTraxx Baa2/BBB+/BBB+ 111 ENBW SEN EUR non-iTraxx A2/A-/A 64.5 EOANGR SEN EUR non-iTraxx A2/A/A+ 65.5 EXHO SEN EUR non-iTraxx --/BBB+/BBB+ 64.5 FNCIM SEN EUR non-iTraxx A3/BBB/BBB+ 139 FRTEL SEN EUR non-iTraxx A3/A-/A- 66.5 GLEINT SEN EUR non-iTraxx Baa2/BBB-/-- 305 GSZFP SEN EUR non-iTraxx Aa3*-/A*-/NR 71.5 HOLZSW SEN EUR non-iTraxx Baa2/BBB/BBB 167 IBESM SEN EUR non-iTraxx A3/A-/A 165 IMTLN SEN EUR non-iTraxx Baa3/BBB/BBB- 94.5 LINGR SEN EUR non-iTraxx A3/A-/-- 65.5 LXSGR SEN EUR non-iTraxx Baa2/BBB/BBB 125 MOET SEN EUR non-iTraxx --/NR/BBB+ 65.5 MTNA SEN EUR non-iTraxx Baa3/BBB/BBB 283 NESTLE SEN EUR non-iTraxx Aa1/AA/AA+ 43 NGGLN SEN EUR non-iTraxx Baa1/BBB+/A-*- 90.5 OTE SEN EUR non-iTraxx Baa2/BBB-/BBB 363 PRTP SEN EUR non-iTraxx --/BBB-/-- 147

5 October 2010
5 October 2010 Credit Research
Euro Credit Pilot
UniCredit Research page 82 See last pages for disclaimer.
Issuer Debt Currency iTraxx Sector Rating (Moody's/S&P/Fitch) 5Y CDS (Mid) RBS SEN EUR non-iTraxx Aa3/A+/AA+ 167 SANTAN SUB EUR non-iTraxx Aa1/AA/AA 229 SIEGR SEN EUR non-iTraxx A1/A+/A+ 68.5 SUEDZU SEN EUR non-iTraxx Baa2/A-/WD 123 SWEMAT SEN EUR non-iTraxx WR/BBB+/-- 84.5 TELEFO SEN EUR non-iTraxx Baa1/A-/A- 153 TELNO SEN EUR non-iTraxx A3/A-/BBB+ 65.5 TITIM SEN EUR non-iTraxx Baa2/BBB/BBB 233 TLIASS SEN EUR non-iTraxx WR/A-/A- 65.5 TOTAL SEN EUR non-iTraxx Aa1/AA/AA 66.5 VATFAL SEN EUR non-iTraxx A2/A/A+ 65.5 VOD SEN EUR non-iTraxx Baa1/A-/A- 82.5 VW SEN EUR non-iTraxx A3/A-/BBB+ 96.5 WKLNA SEN EUR non-iTraxx Baa1/BBB+/BBB+ 73.5 WPPLN SEN EUR non-iTraxx Baa3/BBB/BBB 129 XTALN SEN EUR non-iTraxx Baa2/BBB/-- 185
SHORT LIST – BUY PROTECTION (PRICES AS OF 04/10/2010)
Issuer Debt Currency iTraxx Sector Rating (Moody's/S&P/Fitch) 5Y CDS (Mid) ADENVX SEN EUR non-iTraxx Baa3/BBB-/-- 139 AIFP SEN EUR non-iTraxx --/A/WD 52.5 AKZANA SEN EUR non-iTraxx Baa1/BBB+/BBB+ 66.5 AUCHAN SEN EUR non-iTraxx --/A/-- 55.5 BAYNGR SEN EUR non-iTraxx A3/A-/A- 60.5 BOUY SEN EUR non-iTraxx --/A-/BBB+ 89.5 CAFP SEN EUR non-iTraxx A2e/A-/A- 76.5 CBRYLN SEN EUR non-iTraxx Baa2*-/BBB-/BBB- 24.25 CMZB SEN EUR non-iTraxx Aa3/A/A+ 99.5 COFP SEN EUR non-iTraxx --/BBB-/BBB- 125 DIAG SEN EUR non-iTraxx A3/A-/A- 68.5 DPW SEN EUR non-iTraxx Baa1/BBB+/WD 75.5 DSM SEN EUR non-iTraxx A3/A-/A- 65.5 EADFP SEN EUR non-iTraxx A1/A-/BBB+ 98.5 HENKEL SEN EUR non-iTraxx A3/A-/A- 55.5 ISPIM SEN EUR non-iTraxx Aa2/A+/AA- 127 JAPTOB SEN EUR non-iTraxx Aa3/A+/A+ 43 LUFTHA SEN EUR non-iTraxx Ba1/BBB-/-- 169 MONTE SEN EUR non-iTraxx A1/A-/A- 203 PHG SEN EUR non-iTraxx A3/A-/A- 74.5 PORTEL SEN EUR non-iTraxx Baa2/BBB/BBB 235 RWE SEN EUR non-iTraxx A2/A/AA- 65.5 SANFP SEN EUR non-iTraxx WR/AA-*-/AA- 86.5 SCACAP SEN EUR non-iTraxx Baa1/BBB+/-- 81.5 SOLBBB SEN EUR non-iTraxx A3/A-/A- 85.5 STM SEN EUR non-iTraxx Baa1/BBB+/A- 77.5 TKA SEN EUR non-iTraxx A3/BBB/-- 107 TNTNA SEN EUR non-iTraxx A3/BBB+/-- 109 VIEFP SEN EUR non-iTraxx A3/BBB+/A- 99.5 VIVFP SEN EUR non-iTraxx Baa2/BBB/BBB 109
Source: UniCredit Research
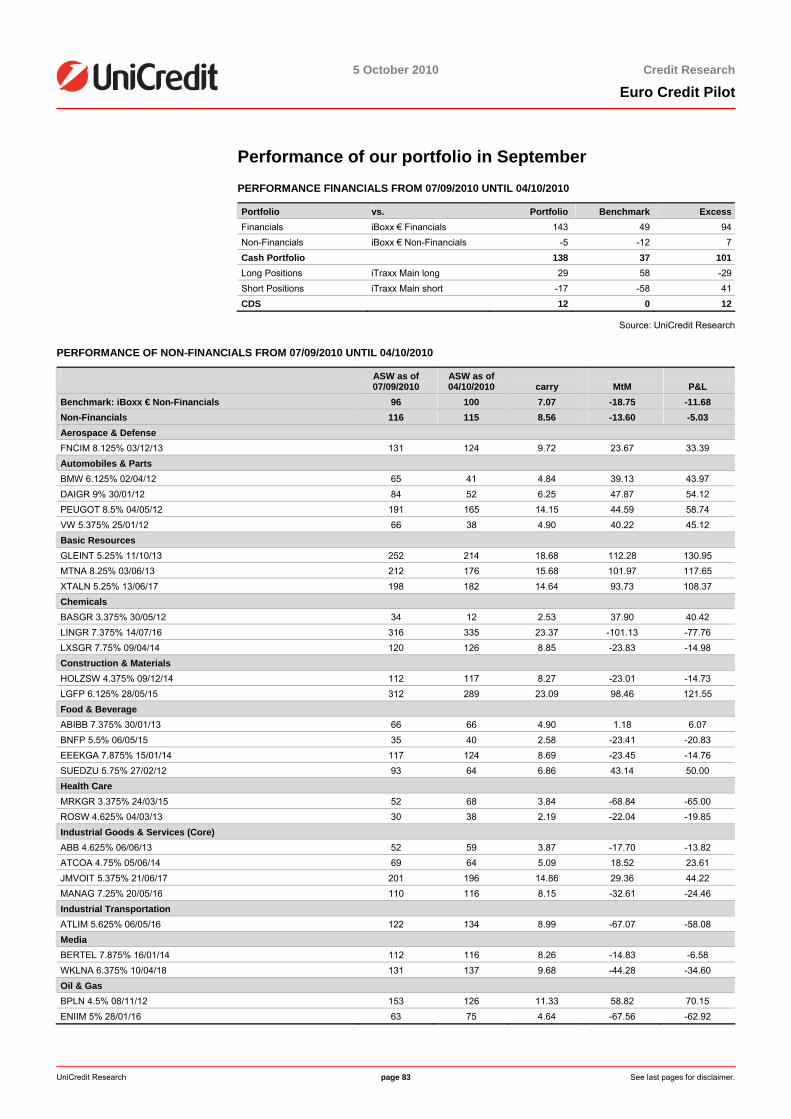
5 October 2010
5 October 2010 Credit Research
Euro Credit Pilot
UniCredit Research page 83 See last pages for disclaimer.
Performance of our portfolio in September PERFORMANCE FINANCIALS FROM 07/09/2010 UNTIL 04/10/2010
Portfolio vs. Portfolio Benchmark ExcessFinancials iBoxx € Financials 143 49 94Non-Financials iBoxx € Non-Financials -5 -12 7Cash Portfolio 138 37 101Long Positions iTraxx Main long 29 58 -29Short Positions iTraxx Main short -17 -58 41CDS 12 0 12
Source: UniCredit Research
PERFORMANCE OF NON-FINANCIALS FROM 07/09/2010 UNTIL 04/10/2010
ASW as of 07/09/2010
ASW as of 04/10/2010
carry
MtM
P&L
Benchmark: iBoxx € Non-Financials 96 100 7.07 -18.75 -11.68 Non-Financials 116 115 8.56 -13.60 -5.03 Aerospace & Defense FNCIM 8.125% 03/12/13 131 124 9.72 23.67 33.39 Automobiles & Parts BMW 6.125% 02/04/12 65 41 4.84 39.13 43.97 DAIGR 9% 30/01/12 84 52 6.25 47.87 54.12 PEUGOT 8.5% 04/05/12 191 165 14.15 44.59 58.74 VW 5.375% 25/01/12 66 38 4.90 40.22 45.12 Basic Resources GLEINT 5.25% 11/10/13 252 214 18.68 112.28 130.95 MTNA 8.25% 03/06/13 212 176 15.68 101.97 117.65 XTALN 5.25% 13/06/17 198 182 14.64 93.73 108.37 Chemicals BASGR 3.375% 30/05/12 34 12 2.53 37.90 40.42 LINGR 7.375% 14/07/16 316 335 23.37 -101.13 -77.76 LXSGR 7.75% 09/04/14 120 126 8.85 -23.83 -14.98 Construction & Materials HOLZSW 4.375% 09/12/14 112 117 8.27 -23.01 -14.73 LGFP 6.125% 28/05/15 312 289 23.09 98.46 121.55 Food & Beverage ABIBB 7.375% 30/01/13 66 66 4.90 1.18 6.07 BNFP 5.5% 06/05/15 35 40 2.58 -23.41 -20.83 EEEKGA 7.875% 15/01/14 117 124 8.69 -23.45 -14.76 SUEDZU 5.75% 27/02/12 93 64 6.86 43.14 50.00 Health Care MRKGR 3.375% 24/03/15 52 68 3.84 -68.84 -65.00 ROSW 4.625% 04/03/13 30 38 2.19 -22.04 -19.85 Industrial Goods & Services (Core) ABB 4.625% 06/06/13 52 59 3.87 -17.70 -13.82 ATCOA 4.75% 05/06/14 69 64 5.09 18.52 23.61 JMVOIT 5.375% 21/06/17 201 196 14.86 29.36 44.22 MANAG 7.25% 20/05/16 110 116 8.15 -32.61 -24.46 Industrial Transportation ATLIM 5.625% 06/05/16 122 134 8.99 -67.07 -58.08 Media BERTEL 7.875% 16/01/14 112 116 8.26 -14.83 -6.58 WKLNA 6.375% 10/04/18 131 137 9.68 -44.28 -34.60 Oil & Gas BPLN 4.5% 08/11/12 153 126 11.33 58.82 70.15 ENIIM 5% 28/01/16 63 75 4.64 -67.56 -62.92
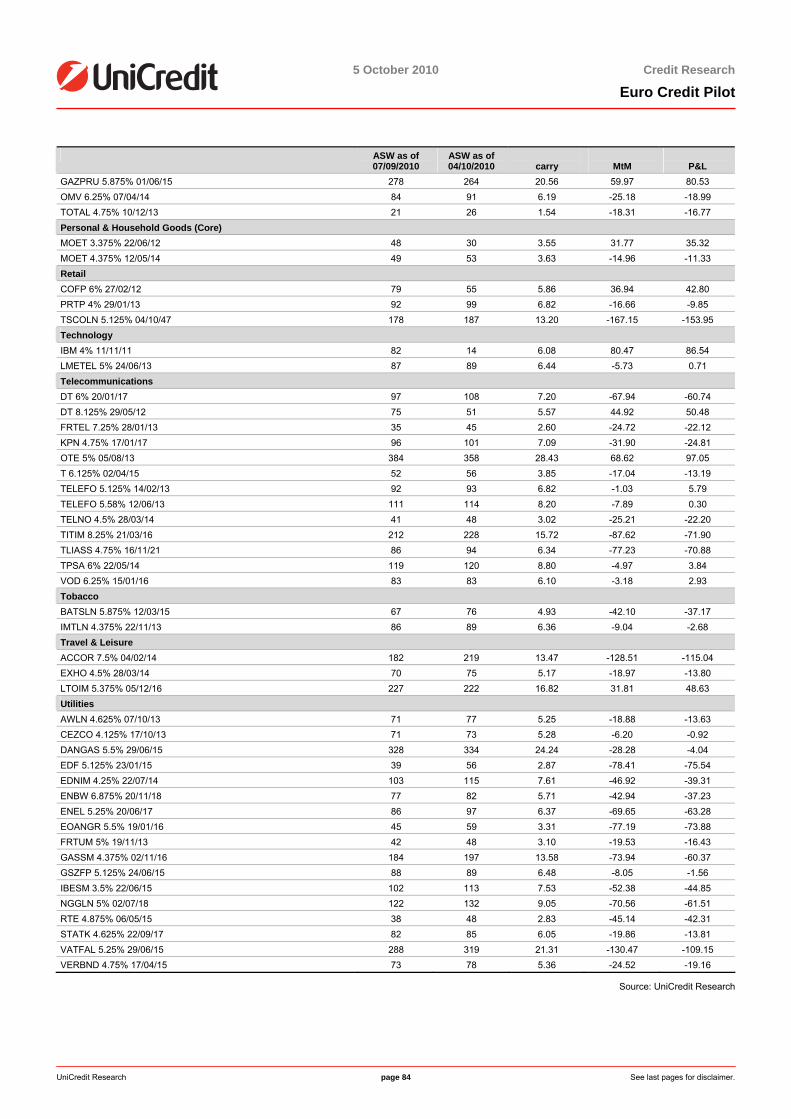
5 October 2010
5 October 2010 Credit Research
Euro Credit Pilot
UniCredit Research page 84 See last pages for disclaimer.
ASW as of 07/09/2010
ASW as of 04/10/2010
carry
MtM
P&L
GAZPRU 5.875% 01/06/15 278 264 20.56 59.97 80.53 OMV 6.25% 07/04/14 84 91 6.19 -25.18 -18.99 TOTAL 4.75% 10/12/13 21 26 1.54 -18.31 -16.77 Personal & Household Goods (Core) MOET 3.375% 22/06/12 48 30 3.55 31.77 35.32 MOET 4.375% 12/05/14 49 53 3.63 -14.96 -11.33 Retail COFP 6% 27/02/12 79 55 5.86 36.94 42.80 PRTP 4% 29/01/13 92 99 6.82 -16.66 -9.85 TSCOLN 5.125% 04/10/47 178 187 13.20 -167.15 -153.95 Technology IBM 4% 11/11/11 82 14 6.08 80.47 86.54 LMETEL 5% 24/06/13 87 89 6.44 -5.73 0.71 Telecommunications DT 6% 20/01/17 97 108 7.20 -67.94 -60.74 DT 8.125% 29/05/12 75 51 5.57 44.92 50.48 FRTEL 7.25% 28/01/13 35 45 2.60 -24.72 -22.12 KPN 4.75% 17/01/17 96 101 7.09 -31.90 -24.81 OTE 5% 05/08/13 384 358 28.43 68.62 97.05 T 6.125% 02/04/15 52 56 3.85 -17.04 -13.19 TELEFO 5.125% 14/02/13 92 93 6.82 -1.03 5.79 TELEFO 5.58% 12/06/13 111 114 8.20 -7.89 0.30 TELNO 4.5% 28/03/14 41 48 3.02 -25.21 -22.20 TITIM 8.25% 21/03/16 212 228 15.72 -87.62 -71.90 TLIASS 4.75% 16/11/21 86 94 6.34 -77.23 -70.88 TPSA 6% 22/05/14 119 120 8.80 -4.97 3.84 VOD 6.25% 15/01/16 83 83 6.10 -3.18 2.93 Tobacco BATSLN 5.875% 12/03/15 67 76 4.93 -42.10 -37.17 IMTLN 4.375% 22/11/13 86 89 6.36 -9.04 -2.68 Travel & Leisure ACCOR 7.5% 04/02/14 182 219 13.47 -128.51 -115.04 EXHO 4.5% 28/03/14 70 75 5.17 -18.97 -13.80 LTOIM 5.375% 05/12/16 227 222 16.82 31.81 48.63 Utilities AWLN 4.625% 07/10/13 71 77 5.25 -18.88 -13.63 CEZCO 4.125% 17/10/13 71 73 5.28 -6.20 -0.92 DANGAS 5.5% 29/06/15 328 334 24.24 -28.28 -4.04 EDF 5.125% 23/01/15 39 56 2.87 -78.41 -75.54 EDNIM 4.25% 22/07/14 103 115 7.61 -46.92 -39.31 ENBW 6.875% 20/11/18 77 82 5.71 -42.94 -37.23 ENEL 5.25% 20/06/17 86 97 6.37 -69.65 -63.28 EOANGR 5.5% 19/01/16 45 59 3.31 -77.19 -73.88 FRTUM 5% 19/11/13 42 48 3.10 -19.53 -16.43 GASSM 4.375% 02/11/16 184 197 13.58 -73.94 -60.37 GSZFP 5.125% 24/06/15 88 89 6.48 -8.05 -1.56 IBESM 3.5% 22/06/15 102 113 7.53 -52.38 -44.85 NGGLN 5% 02/07/18 122 132 9.05 -70.56 -61.51 RTE 4.875% 06/05/15 38 48 2.83 -45.14 -42.31 STATK 4.625% 22/09/17 82 85 6.05 -19.86 -13.81 VATFAL 5.25% 29/06/15 288 319 21.31 -130.47 -109.15 VERBND 4.75% 17/04/15 73 78 5.36 -24.52 -19.16
Source: UniCredit Research
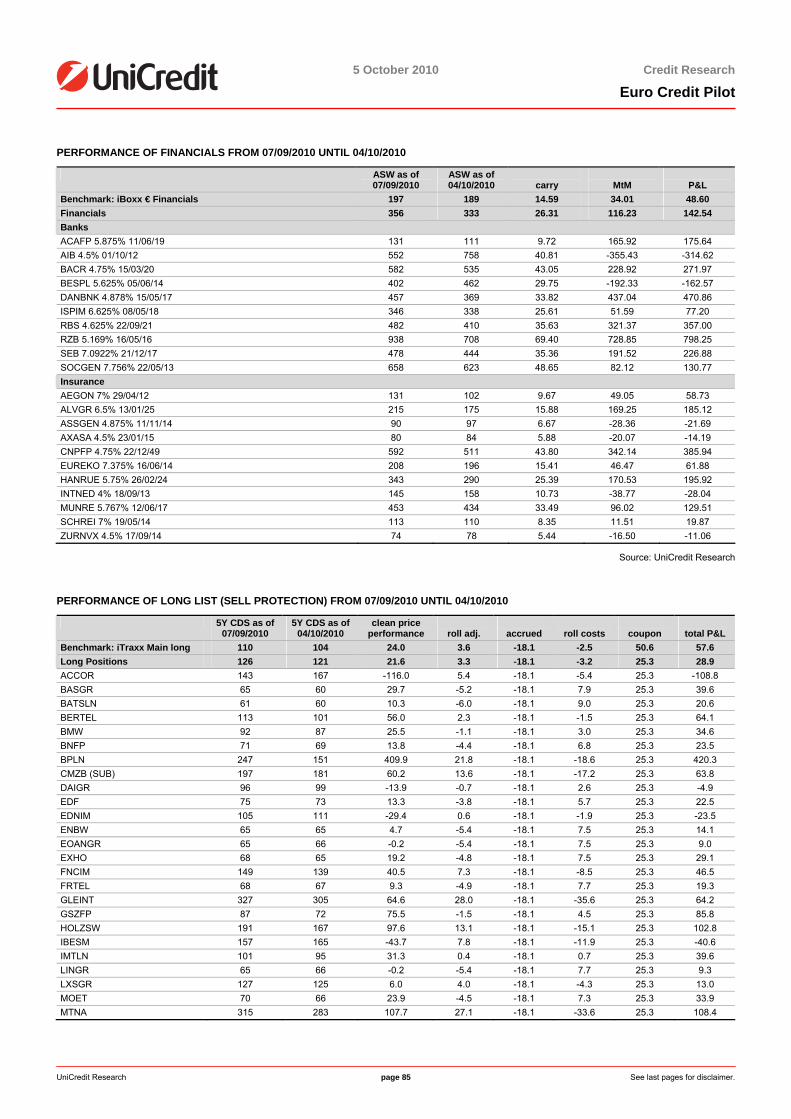
5 October 2010
5 October 2010 Credit Research
Euro Credit Pilot
UniCredit Research page 85 See last pages for disclaimer.
PERFORMANCE OF FINANCIALS FROM 07/09/2010 UNTIL 04/10/2010
ASW as of 07/09/2010
ASW as of 04/10/2010
carry
MtM
P&L
Benchmark: iBoxx € Financials 197 189 14.59 34.01 48.60 Financials 356 333 26.31 116.23 142.54 Banks ACAFP 5.875% 11/06/19 131 111 9.72 165.92 175.64 AIB 4.5% 01/10/12 552 758 40.81 -355.43 -314.62 BACR 4.75% 15/03/20 582 535 43.05 228.92 271.97 BESPL 5.625% 05/06/14 402 462 29.75 -192.33 -162.57 DANBNK 4.878% 15/05/17 457 369 33.82 437.04 470.86 ISPIM 6.625% 08/05/18 346 338 25.61 51.59 77.20 RBS 4.625% 22/09/21 482 410 35.63 321.37 357.00 RZB 5.169% 16/05/16 938 708 69.40 728.85 798.25 SEB 7.0922% 21/12/17 478 444 35.36 191.52 226.88 SOCGEN 7.756% 22/05/13 658 623 48.65 82.12 130.77 Insurance AEGON 7% 29/04/12 131 102 9.67 49.05 58.73 ALVGR 6.5% 13/01/25 215 175 15.88 169.25 185.12 ASSGEN 4.875% 11/11/14 90 97 6.67 -28.36 -21.69 AXASA 4.5% 23/01/15 80 84 5.88 -20.07 -14.19 CNPFP 4.75% 22/12/49 592 511 43.80 342.14 385.94 EUREKO 7.375% 16/06/14 208 196 15.41 46.47 61.88 HANRUE 5.75% 26/02/24 343 290 25.39 170.53 195.92 INTNED 4% 18/09/13 145 158 10.73 -38.77 -28.04 MUNRE 5.767% 12/06/17 453 434 33.49 96.02 129.51 SCHREI 7% 19/05/14 113 110 8.35 11.51 19.87 ZURNVX 4.5% 17/09/14 74 78 5.44 -16.50 -11.06
Source: UniCredit Research
PERFORMANCE OF LONG LIST (SELL PROTECTION) FROM 07/09/2010 UNTIL 04/10/2010
5Y CDS as of 07/09/2010
5Y CDS as of 04/10/2010
clean price performance
roll adj.
accrued
roll costs
coupon
total P&L
Benchmark: iTraxx Main long 110 104 24.0 3.6 -18.1 -2.5 50.6 57.6 Long Positions 126 121 21.6 3.3 -18.1 -3.2 25.3 28.9 ACCOR 143 167 -116.0 5.4 -18.1 -5.4 25.3 -108.8 BASGR 65 60 29.7 -5.2 -18.1 7.9 25.3 39.6 BATSLN 61 60 10.3 -6.0 -18.1 9.0 25.3 20.6 BERTEL 113 101 56.0 2.3 -18.1 -1.5 25.3 64.1 BMW 92 87 25.5 -1.1 -18.1 3.0 25.3 34.6 BNFP 71 69 13.8 -4.4 -18.1 6.8 25.3 23.5 BPLN 247 151 409.9 21.8 -18.1 -18.6 25.3 420.3 CMZB (SUB) 197 181 60.2 13.6 -18.1 -17.2 25.3 63.8 DAIGR 96 99 -13.9 -0.7 -18.1 2.6 25.3 -4.9 EDF 75 73 13.3 -3.8 -18.1 5.7 25.3 22.5 EDNIM 105 111 -29.4 0.6 -18.1 -1.9 25.3 -23.5 ENBW 65 65 4.7 -5.4 -18.1 7.5 25.3 14.1 EOANGR 65 66 -0.2 -5.4 -18.1 7.5 25.3 9.0 EXHO 68 65 19.2 -4.8 -18.1 7.5 25.3 29.1 FNCIM 149 139 40.5 7.3 -18.1 -8.5 25.3 46.5 FRTEL 68 67 9.3 -4.9 -18.1 7.7 25.3 19.3 GLEINT 327 305 64.6 28.0 -18.1 -35.6 25.3 64.2 GSZFP 87 72 75.5 -1.5 -18.1 4.5 25.3 85.8 HOLZSW 191 167 97.6 13.1 -18.1 -15.1 25.3 102.8 IBESM 157 165 -43.7 7.8 -18.1 -11.9 25.3 -40.6 IMTLN 101 95 31.3 0.4 -18.1 0.7 25.3 39.6 LINGR 65 66 -0.2 -5.4 -18.1 7.7 25.3 9.3 LXSGR 127 125 6.0 4.0 -18.1 -4.3 25.3 13.0 MOET 70 66 23.9 -4.5 -18.1 7.3 25.3 33.9 MTNA 315 283 107.7 27.1 -18.1 -33.6 25.3 108.4
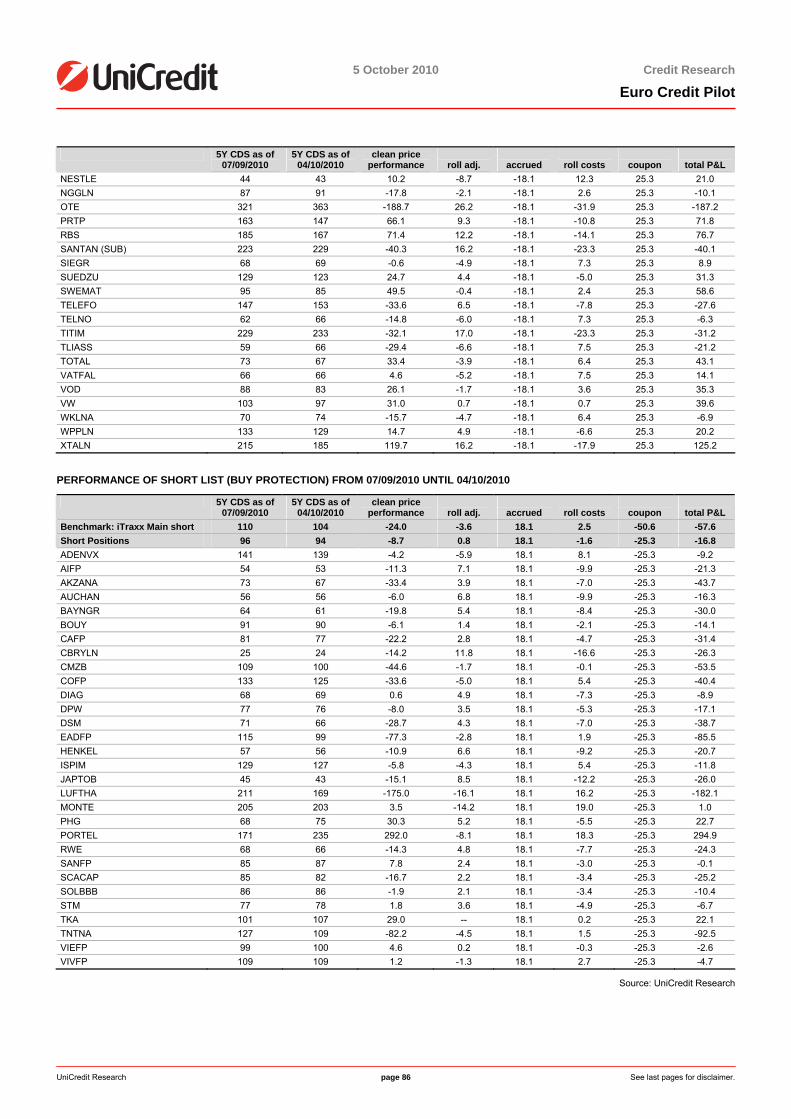
5 October 2010
5 October 2010 Credit Research
Euro Credit Pilot
UniCredit Research page 86 See last pages for disclaimer.
5Y CDS as of 07/09/2010
5Y CDS as of 04/10/2010
clean price performance
roll adj.
accrued
roll costs
coupon
total P&L
NESTLE 44 43 10.2 -8.7 -18.1 12.3 25.3 21.0 NGGLN 87 91 -17.8 -2.1 -18.1 2.6 25.3 -10.1 OTE 321 363 -188.7 26.2 -18.1 -31.9 25.3 -187.2 PRTP 163 147 66.1 9.3 -18.1 -10.8 25.3 71.8 RBS 185 167 71.4 12.2 -18.1 -14.1 25.3 76.7 SANTAN (SUB) 223 229 -40.3 16.2 -18.1 -23.3 25.3 -40.1 SIEGR 68 69 -0.6 -4.9 -18.1 7.3 25.3 8.9 SUEDZU 129 123 24.7 4.4 -18.1 -5.0 25.3 31.3 SWEMAT 95 85 49.5 -0.4 -18.1 2.4 25.3 58.6 TELEFO 147 153 -33.6 6.5 -18.1 -7.8 25.3 -27.6 TELNO 62 66 -14.8 -6.0 -18.1 7.3 25.3 -6.3 TITIM 229 233 -32.1 17.0 -18.1 -23.3 25.3 -31.2 TLIASS 59 66 -29.4 -6.6 -18.1 7.5 25.3 -21.2 TOTAL 73 67 33.4 -3.9 -18.1 6.4 25.3 43.1 VATFAL 66 66 4.6 -5.2 -18.1 7.5 25.3 14.1 VOD 88 83 26.1 -1.7 -18.1 3.6 25.3 35.3 VW 103 97 31.0 0.7 -18.1 0.7 25.3 39.6 WKLNA 70 74 -15.7 -4.7 -18.1 6.4 25.3 -6.9 WPPLN 133 129 14.7 4.9 -18.1 -6.6 25.3 20.2 XTALN 215 185 119.7 16.2 -18.1 -17.9 25.3 125.2
PERFORMANCE OF SHORT LIST (BUY PROTECTION) FROM 07/09/2010 UNTIL 04/10/2010
5Y CDS as of 07/09/2010
5Y CDS as of 04/10/2010
clean price performance
roll adj.
accrued
roll costs
coupon
total P&L
Benchmark: iTraxx Main short 110 104 -24.0 -3.6 18.1 2.5 -50.6 -57.6 Short Positions 96 94 -8.7 0.8 18.1 -1.6 -25.3 -16.8 ADENVX 141 139 -4.2 -5.9 18.1 8.1 -25.3 -9.2 AIFP 54 53 -11.3 7.1 18.1 -9.9 -25.3 -21.3 AKZANA 73 67 -33.4 3.9 18.1 -7.0 -25.3 -43.7 AUCHAN 56 56 -6.0 6.8 18.1 -9.9 -25.3 -16.3 BAYNGR 64 61 -19.8 5.4 18.1 -8.4 -25.3 -30.0 BOUY 91 90 -6.1 1.4 18.1 -2.1 -25.3 -14.1 CAFP 81 77 -22.2 2.8 18.1 -4.7 -25.3 -31.4 CBRYLN 25 24 -14.2 11.8 18.1 -16.6 -25.3 -26.3 CMZB 109 100 -44.6 -1.7 18.1 -0.1 -25.3 -53.5 COFP 133 125 -33.6 -5.0 18.1 5.4 -25.3 -40.4 DIAG 68 69 0.6 4.9 18.1 -7.3 -25.3 -8.9 DPW 77 76 -8.0 3.5 18.1 -5.3 -25.3 -17.1 DSM 71 66 -28.7 4.3 18.1 -7.0 -25.3 -38.7 EADFP 115 99 -77.3 -2.8 18.1 1.9 -25.3 -85.5 HENKEL 57 56 -10.9 6.6 18.1 -9.2 -25.3 -20.7 ISPIM 129 127 -5.8 -4.3 18.1 5.4 -25.3 -11.8 JAPTOB 45 43 -15.1 8.5 18.1 -12.2 -25.3 -26.0 LUFTHA 211 169 -175.0 -16.1 18.1 16.2 -25.3 -182.1 MONTE 205 203 3.5 -14.2 18.1 19.0 -25.3 1.0 PHG 68 75 30.3 5.2 18.1 -5.5 -25.3 22.7 PORTEL 171 235 292.0 -8.1 18.1 18.3 -25.3 294.9 RWE 68 66 -14.3 4.8 18.1 -7.7 -25.3 -24.3 SANFP 85 87 7.8 2.4 18.1 -3.0 -25.3 -0.1 SCACAP 85 82 -16.7 2.2 18.1 -3.4 -25.3 -25.2 SOLBBB 86 86 -1.9 2.1 18.1 -3.4 -25.3 -10.4 STM 77 78 1.8 3.6 18.1 -4.9 -25.3 -6.7 TKA 101 107 29.0 -- 18.1 0.2 -25.3 22.1 TNTNA 127 109 -82.2 -4.5 18.1 1.5 -25.3 -92.5 VIEFP 99 100 4.6 0.2 18.1 -0.3 -25.3 -2.6 VIVFP 109 109 1.2 -1.3 18.1 2.7 -25.3 -4.7
Source: UniCredit Research
5 October 2010
5 October 2010 Credit Research
Euro Credit Pilot
UniCredit Research page 87 See last pages for disclaimer.
Notes
5 October 2010 Credit Research
Euro Credit Pilot
UniCredit Research page 88
Disclaimer Our recommendations are based on information obtained from, or are based upon public information sources that we consider to be reliable but for the completeness and accuracy of which we assume no liability. All estimates and opinions included in the report represent the independent judgment of the analysts as of the date of the issue. We reserve the right to modify the views expressed herein at any time without notice. Moreover, we reserve the right not to update this information or to discontinue it altogether without notice. This analysis is for information purposes only and (i) does not constitute or form part of any offer for sale or subscription of or solicitation of any offer to buy or subscribe for any financial, money market or investment instrument or any security, (ii) is neither intended as such an offer for sale or subscription of or solicitation of an offer to buy or subscribe for any financial, money market or investment instrument or any security nor (iii) as an advertisement thereof. The investment possibilities discussed in this report may not be suitable for certain investors depending on their specific investment objectives and time horizon or in the context of their overall financial situation. The investments discussed may fluctuate in price or value. Investors may get back less than they invested. Changes in rates of exchange may have an adverse effect on the value of investments. Furthermore, past performance is not necessarily indicative of future results. In particular, the risks associated with an investment in the financial, money market or investment instrument or security under discussion are not explained in their entirety. This information is given without any warranty on an "as is" basis and should not be regarded as a substitute for obtaining individual advice. Investors must make their own determination of the appropriateness of an investment in any instruments referred to herein based on the merits and risks involved, their own investment strategy and their legal, fiscal and financial position. As this document does not qualify as an investment recommendation or as a direct investment recommendation, neither this document nor any part of it shall form the basis of, or be relied on in connection with or act as an inducement to enter into, any contract or commitment whatsoever. Investors are urged to contact their bank's investment advisor for individual explanations and advice. Neither UniCredit Bank AG, UniCredit Bank AG London Branch, UniCredit Bank AG Vienna Branch, UniCredit Bank AG Milan Branch, UniCredit Securities, UniCredit Menkul Değerler A.Ş., Zagrebačka banka and UniCredit Bulbank nor any of their respective directors, officers or employees nor any other person accepts any liability whatsoever (in negligence or otherwise) for any loss howsoever arising from any use of this document or its contents or otherwise arising in connection therewith. This analysis is being distributed by electronic and ordinary mail to professional investors, who are expected to make their own investment decisions without undue reliance on this publication, and may not be redistributed, reproduced or published in whole or in part for any purpose. Responsibility for the content of this publication lies with: a) UniCredit Bank AG, Am Tucherpark 16, 80538 Munich, Germany, (also responsible for the distribution pursuant to §34b WpHG). The company belongs to UCI Group. Regulatory authority: “BaFin“ – Bundesanstalt für Finanzdienstleistungsaufsicht, Lurgiallee 12, 60439 Frankfurt, Germany. b) UniCredit Bank AG London Branch, Moor House, 120 London Wall, London EC2Y 5ET, United Kingdom. Regulatory authority: “BaFin“ – Bundesanstalt für Finanzdienstleistungsaufsicht, Lurgiallee 12, 60439 Frankfurt, Germany and subject to limited regulation by the Financial Services Authority (FSA), 25 The North Colonnade, Canary Wharf, London E14 5HS, United Kingdom. Details about the extent of our regulation by the Financial Services Authority are available from us on request. c) UniCredit Bank AG Milan Branch, Via Tommaso Grossi 10, 20121 Milan, Italy, duly authorized by the Bank of Italy to provide investment services. Regulatory authority: “Bank of Italy”, Via Nazionale 91, 00184 Roma, Italy and Bundesanstalt für Finanzdienstleistungsaufsicht, Lurgiallee 12, 60439 Frankfurt, Germany. d) UniCredit Bank AG Vienna Branch, Julius-Tandler-Platz 3, 1090 Vienna, Austria Regulatory authority: Finanzmarktaufsichtsbehörde (FMA), Praterstrasse 23, 1020 Vienna, Austria and subject to limited regulation by the “BaFin“ – Bundesanstalt für Finanz-dienstleistungsaufsicht, Lurgiallee 12, 60439 Frankfurt, Germany. Details about the extent of our regulation by the Bundesanstalt für Finanzdienstleistungsaufsicht are available from us on request. e) UniCredit Securities, Boulevard Ring Office Building, 17/1 Chistoprudni Boulevard, Moscow 101000, Russia Regulatory authority: Federal Service on Financial Markets, 9 Leninsky prospekt, Moscow 119991, Russia f) UniCredit Menkul Değerler A.Ş., Büyükdere Cad. No. 195, Büyükdere Plaza Kat. 5, 34394 Levent, Istanbul, Turkey Regulatory authority: Sermaye Piyasası Kurulu – Capital Markets Board of Turkey, Eskişehir Yolu 8.Km No:156, 06530 Ankara, Turkey g) Zagrebačka banka, Paromlinska 2, HR-10000 Zagreb, Croatia Regulatory authority: Croatian Agency for Supervision of Financial Services, Miramarska 24B, 10000 Zagreb, Croatia h) UniCredit Bulbank, Sveta Nedelya Sq. 7, BG-1000 Sofia, Bulgaria Regulatory authority: Financial Supervision Commission (FSC), 33 Shar Planina str.,1303 Sofia, Bulgaria This report may contain excerpts sourced from UniCredit Bank Russia, UniCredit Tiriac Bank, Bank Pekao or Yapi Kredi all members of the UniCredit group. If so, the pieces and the contents have not been materially altered. POTENTIAL CONFLICTS OF INTERESTS Accor 3; A2A 3; Air Liquide 3; Allianz 1a, 1b, 3, 6a; Allied Irish Banks 3; Alstom 2; Arcelor Mittal 3; Assicurazioni Generali 2, 3; Aviva 6a; AXA 3; Banca Monte dei Paschi di Siena 3; Banco Espirito Santo 3; Banco Santander 3; Bank of America 2, 3; Barclays 2, 3; Bayer AG 1a, 2, 3; BayernLB 2, 3; BCP 2, 3; BMW AG 2, 3; BNP Paribas 3; Bouygues 3; Caja Madrid 2, 3; Carrefour 3; CEZ 3, 4; Citigroup 2; Commerzbank 2, 3; Crédit Agricole 2, 3; Credit Suisse 2; Daimler AG 3; Danone 3; Danske Bank 2, 3; Deutsche Bank 1a, 3; Deutsche Telekom 2, 3; Dexia 2, 3; DnB NOR 2, 3; E.ON 1a, 3; EADS NV 3; EDF 3; Edison 2, 3, 7; EDP 3; Endesa 3; Enel 2, 3, 6a, 7; ENI 2, 3, 7; Erste Bank 2, 3; Finmeccanica SpA 3, 7; France Telecom 3; Gas Natural 3; GDF Suez 3; GE (industrial) 2; Goldman Sachs 2, 3; Hera 7; Holcim 2; HSBC 2, 3; HSH Nordbank 2, 3; Iberdrola 3; ING 2, 3; Intesa Sanpaolo 3; Italcementi 2, 3, 6a; K+S 2; KPN NV 2; Linde AG 1a; Lloyds Banking Group 2, 3; Lottomatica 2, 3, 7; LVMH 3; METRO 4; Michelin 3; Morgan Stanley 2, 3; Munich Re 3; Nederlandse Gas 3; Nokia Oyi 3; Nordea 3; OMV 3; Peugeot 3; Philip Morris International 3; PPR 3; RBS 2; Renault 2, 3; Shell 3; Sanofi-Aventis 3; SEB 3; Société Générale 2, 3; STMicroelectronics N.V. 3; Svenska Handelsbanken 3; Telecom Italia 3; Telefonica 3; Telekom Austria 3; TP Group 3; Terna 3; Total 3; UBS 2, 3; Verbund 3; Vinci 3; Vivendi 3; Volkswagen 2, 3, 4; Caisses d'Epargne et de Prevoyance 3; Raiffeisen Zentralbank Österreich AG 3; Key 1a: UniCredit Bank AG, UniCredit Bank AG London Branch, UniCredit Bank AG Vienna Branch, UniCredit Bank AG Milan Branch, UniCredit Securities, UniCredit Menkul Değerler A.Ş., Zagrebačka banka and UniCredit Bulbank and/or a company affiliated with it (pursuant to relevant domestic law) owns at least 2% of the capital stock of the company. Key 1b: The analyzed company owns at least 2% of the capital stock of UniCredit Bank AG, UniCredit Bank AG London Branch, UniCredit Bank AG Vienna Branch, UniCredit Bank AG Milan Branch, UniCredit Securities, UniCredit Menkul Değerler A.Ş., Zagrebačka banka and UniCredit Bulbank and/or a company affiliated with it (pursuant to relevant domestic law). Key 2: UniCredit Bank AG, UniCredit Bank AG London Branch, UniCredit Bank AG Vienna Branch, UniCredit Bank AG Milan Branch, UniCredit Securities, UniCredit Menkul Değerler A.Ş., Zagrebačka banka and UniCredit Bulbank and/or a company affiliated with it (pursuant to relevant domestic law) belonged to a syndicate that has acquired securities or any related derivatives of the analyzed company within the twelve months preceding publication, in connection with any publicly disclosed offer of securities of the analyzed company, or in any related derivatives. Key 3: UniCredit Bank AG, UniCredit Bank AG London Branch, UniCredit Bank AG Vienna Branch, UniCredit Bank AG Milan Branch, UniCredit Securities, UniCredit Menkul Değerler A.Ş., Zagrebačka banka and UniCredit Bulbank and/or a company affiliated (pursuant to relevant domestic law) administers the securities issued by the analyzed company on the stock exchange or on the market by quoting bid and ask prices (i.e. acts as a market maker or liquidity provider in the securities of the analyzed company or in any related derivatives). Key 4: The analyzed company and UniCredit Bank AG, UniCredit Bank AG London Branch, UniCredit Bank AG Vienna Branch, UniCredit Bank AG Milan Branch, UniCredit Securities, UniCredit Menkul Değerler A.Ş., Zagrebačka banka and UniCredit Bulbank and/or a company affiliated (pursuant to relevant domestic law) concluded an agreement on services in connection with investment banking transactions in the last 12 months, in return for which the Bank received a consideration or promise of consideration. Key 5: The analyzed company and UniCredit Bank AG, UniCredit Bank AG London Branch, UniCredit Bank AG Vienna Branch, UniCredit Bank AG Milan Branch, UniCredit Securities, UniCredit Menkul Değerler A.Ş., Zagrebačka banka and UniCredit Bulbank and/or a company affiliated (pursuant to relevant domestic law) have concluded an agreement on the preparation of analyses. Key 6a: Employees of UniCredit Bank AG Milan Branch and/or members of the Board of Directors of UniCredit (pursuant to relevant domestic law) are members of the Board of Directors of the Issuer. Members of the Board of Directors of the Issuer hold office in the Board of Directors of UniCredit (pursuant to relevant domestic law).

5 October 2010 Credit Research
Euro Credit Pilot
UniCredit Research page 89
Key 6b: The analyst is on the supervisory/management board of the company they cover. Key 7: UniCredit Bank AG Milan Branch and/or other Italian banks belonging to the UniCredit Group (pursuant to relevant domestic law) extended significant amounts of credit facilities to the Issuer. RECOMMENDATIONS, RATINGS AND EVALUATION METHODOLOGY Company Date Rec. Company Date Rec. Company Date Rec. AALLN 01/02/2010 Marketweight EXPNLN 03/03/2010 Marketweight SCACAP 05/10/2010 Marketweight ABESM 23/07/2010 Marketweight FRTEL 04/11/2009 Marketweight SDFGR 26/11/2009 Underweight ABESM 06/07/2010 Underweight FRTEL 29/10/2009 Marketweight SDFGR 13/11/2009 Marketweight ABIBB 02/02/2010 Overweight GASSM 28/04/2010 Marketweight SDFGR 07/10/2009 Overweight ABNANV 07/07/2010 Marketweight GASSM 05/11/2009 Overweight SECURI 11/11/2009 Marketweight ACCOR 01/10/2010 Marketweight GASSM 04/11/2009 Overweight SESGLX 01/06/2010 Marketweight ACCOR 25/02/2010 Overweight GSK 05/02/2010 Marketweight SESGLX 05/05/2010 Underweight ADENVX 01/06/2010 Marketweight GSZFP 11/08/2010 Overweight SESGLX 07/10/2009 Marketweight AEMSPA 03/03/2010 Marketweight GSZFP 10/08/2010 Overweight SIEGR 04/11/2009 Marketweight AIFP 01/02/2010 Underweight HNDA 04/08/2010 Marketweight SLB 04/08/2010 event driven AIG 07/07/2010 Marketweight HNDA 07/07/2010 Underweight SLB 23/02/2010 Marketweight AIG 30/03/2010 no rec. HNDA 05/05/2010 Marketweight SLB 19/02/2010 Underweight AKZANA 04/08/2010 Marketweight HOFP 29/07/2010 Underweight SOLBBB 07/10/2009 Underweight AKZANA 26/04/2010 Underweight HOLZSW 01/06/2010 Overweight SSELN 05/10/2010 Marketweight AKZANA 03/03/2010 Marketweight HOLZSW 05/05/2010 Overweight SSELN 30/03/2010 Underweight AMXLMM 07/07/2010 event driven HOLZSW 04/11/2009 Marketweight STATK 19/02/2010 Marketweight ARRFP 29/06/2010 Marketweight HUWHY 05/05/2010 event driven SUEDZU 19/10/2009 Marketweight ASML 05/05/2010 Marketweight INTNED 02/02/2010 Marketweight SWEMAT 04/08/2010 Overweight ATCOA 04/11/2009 Overweight INTNED 04/11/2009 no rec. SYNNVX 02/02/2010 Marketweight ATLIM 04/08/2010 Overweight ITCIT 30/03/2010 Marketweight TELNO 06/05/2010 Overweight ATLIM 04/08/2010 Overweight JMVOIT 04/11/2009 Overweight TELNO 05/05/2010 Underweight AZN 29/01/2010 Underweight JNJ 04/11/2009 Underweight TELNO 05/05/2010 Underweight AZN 23/10/2009 Marketweight KFT 08/09/2010 Marketweight TELNO 10/02/2010 Marketweight BASGR 04/08/2010 Overweight LGFP 04/08/2010 Overweight TELNO 05/10/2009 Overweight BASGR 29/07/2010 Overweight LGFP 04/08/2010 Overweight TELNO 05/10/2009 Overweight BASGR 04/11/2009 Marketweight LINGR 02/02/2010 Marketweight TENN 03/03/2010 Marketweight BASGR 29/10/2009 Marketweight LMETEL 09/12/2009 Marketweight TITIM 30/04/2010 Marketweight BERTEL 07/10/2009 Overweight LTOIM 16/09/2010 Marketweight TITIM 13/04/2010 Overweight BHP 01/02/2010 Underweight LXSGR 11/05/2010 Marketweight TITIM 02/02/2010 Marketweight BMW 01/06/2010 Overweight MANAG 30/03/2010 Overweight TITIM 02/02/2010 Marketweight BMW 05/05/2010 Marketweight MANAG 02/02/2010 Marketweight TKA 11/12/2009 Underweight BMW 05/05/2010 Marketweight MANAG 30/11/2009 Overweight TKAGR 14/05/2010 Marketweight BMY 09/12/2009 Underweight MRK 09/12/2009 Marketweight TKAGR 03/03/2010 Overweight BNFP 05/10/2010 Marketweight MRKGR 18/03/2010 Overweight TKAGR 12/02/2010 Overweight BOGAEI 08/09/2010 Underweight MRKGR 01/03/2010 Underweight TLIASS 06/05/2010 Overweight BOGAEI 05/05/2010 Marketweight MTNA 01/02/2010 Overweight TOYOTA 08/09/2010 Underweight BOUY 04/11/2009 Underweight NK 05/10/2010 event driven TOYOTA 04/08/2010 Underweight BPLN 28/07/2010 Marketweight NK 04/11/2009 Underweight TOYOTA 07/07/2010 Marketweight BPLN 17/06/2010 Overweight NOKIA 09/12/2009 Marketweight TOYOTA 03/03/2010 Underweight BRITEL 30/07/2010 Marketweight NOVART 22/10/2009 Underweight TRNIM 21/09/2010 Marketweight CARGIL 07/07/2010 event driven OMV 09/12/2009 Marketweight UNANA 03/03/2010 Underweight CEIFP 07/10/2009 Marketweight OTE 02/02/2010 Overweight UNANA 04/02/2010 Underweight CEZCO 02/02/2010 Marketweight PEUGOT 24/11/2009 Marketweight VALEBZ 30/03/2010 Marketweight CEZCO 21/12/2009 Overweight PFE 23/10/2009 Marketweight VATFAL 29/07/2010 Overweight CEZCO 26/10/2009 Marketweight PG 08/09/2010 Underweight VERBND 31/08/2010 Overweight CRHID 09/07/2010 Marketweight PG 04/08/2010 Underweight VERBND 31/08/2010 Overweight DAIGR 27/04/2010 Overweight PORTEL 01/07/2010 Underweight VERBND 30/03/2010 Marketweight DAIGR 30/03/2010 Marketweight PORTEL 02/06/2010 Marketweight VERBND 03/03/2010 Overweight DAIGR 07/10/2009 Overweight PRUFIN 07/07/2010 Marketweight VERBND 02/03/2010 Marketweight DANGAS 02/11/2009 Marketweight PRUFIN 30/03/2010 no rec. VIEFP 10/05/2010 Marketweight DANGAS 07/10/2009 Marketweight RBOSCH 07/07/2010 Underweight VIVFP 15/04/2010 Underweight DSM 03/11/2009 Underweight RBOSCH 29/01/2010 Marketweight VIVFP 07/10/2009 Marketweight EADFP 01/06/2010 Marketweight RBOSCH 07/10/2009 Underweight VLVY 23/04/2010 Marketweight EADFP 14/05/2010 Marketweight RBOSCH 06/10/2009 Marketweight VLVY 23/04/2010 Marketweight EADFP 20/11/2009 Underweight REDELE 30/03/2010 Underweight VLVY 30/03/2010 Underweight EDF 25/01/2010 Marketweight RENAUL 01/06/2010 Marketweight VLVY 23/10/2009 Marketweight EDNIM 30/03/2010 Overweight RENAUL 05/05/2010 Overweight VLVY 23/10/2009 Marketweight ELEPOR 05/05/2010 Underweight RENAUL 06/04/2010 Underweight VOTORA 04/08/2010 event driven ELIASO 13/01/2010 Underweight RENEPL 05/05/2010 Marketweight VW 30/03/2010 Overweight ENBW 07/01/2010 Overweight RENEPL 30/03/2010 Overweight WKLNA 01/06/2010 Overweight ENEL 05/05/2010 Marketweight RENTKL 07/10/2009 Marketweight WMT 07/10/2009 Marketweight EOANGR 12/08/2010 Marketweight RWE 04/11/2009 Marketweight WPPLN 01/06/2010 Marketweight EUTELS 05/05/2010 Underweight RWE 02/11/2009 Marketweight WPPLN 09/12/2009 Overweight EUTELS 30/03/2010 event driven SABIC 01/06/2010 no rec. XTALN 03/03/2010 Overweight EWE 08/09/2010 Underweight SANDVK 05/05/2010 Marketweight XTALN 08/02/2010 Overweight EWE 03/09/2010 Underweight SANDVK 05/05/2010 Marketweight Overview of our ratings You will find the history of rating regarding recommendation changes as well as an overview of the breakdown in absolute and relative terms of our investment ratings on our websites www.research.unicreditgroup.eu and www.cib-unicredit.com/research-disclaimer under the heading “Disclaimer.” Note on what the evaluation of equities is based: We currently use a three-tier recommendation system for the stocks in our formal coverage: Buy, Hold, or Sell (see definitions below): A Buy is applied when the expected total return over the next twelve months is higher than the stock's cost of equity. A Hold is applied when the expected total return over the next twelve months is lower than its cost of equity but higher than zero. A Sell is applied when the stock's expected total return over the next twelve months is negative.
5 October 2010 Credit Research
Euro Credit Pilot
UniCredit Research page 90
We employ three further categorizations for stocks in our coverage: Restricted: A rating and/or financial forecasts and/or target price is not disclosed owing to compliance or other regulatory considerations such as blackout period or conflict of interest. Coverage in transition: Due to changes in the research team, the disclosure of a stock's rating and/or target price and/or financial information are temporarily suspended. The stock remains in the research universe and disclosures of relevant information will be resumed in due course. Not rated: Suspension of coverage. Company valuations are based on the following valuation methods: Multiple-based models (P/E, P/cash flow, EV/sales, EV/EBIT, EV/EBITA, EV/EBITDA), peer-group comparisons, historical valuation approaches, discount models (DCF, DVMA, DDM), break-up value approaches or asset-based evaluation methods. Furthermore, recommendations are also based on the Economic profit approach. Valuation models are dependent on macroeconomic factors, such as interest rates, exchange rates, raw materials, and on assumptions about the economy. Furthermore, market sentiment affects the valuation of companies. The valuation is also based on expectations that might change rapidly and without notice, depending on developments specific to individual industries. Our recommendations and target prices derived from the models might therefore change accordingly. The investment ratings generally relate to a 12-month horizon. They are, however, also subject to market conditions and can only represent a snapshot. The ratings may in fact be achieved more quickly or slowly than expected, or need to be revised upward or downward. Note on the bases of evaluation for interest-bearing securities: Our investment ratings are in principle judgments relative to an index as a benchmark. Issuer level: Marketweight: We recommend having the same portfolio exposure in the name as the respective reference index (the iBoxx index universe for high-grade names and the ML EUR HY index for sub-investment grade names). Overweight: We recommend having a higher portfolio exposure in the name as the respective reference index (the iBoxx index universe for high-grade names and the ML EUR HY index for sub-investment grade names). Underweight: We recommend having a lower portfolio exposure in the name as the respective reference index (the iBoxx index universe for high-grade names and the ML EUR HY index for sub-investment grade names). Instrument level: Core hold: We recommend holding the respective instrument for investors who already have exposure. Sell: We recommend selling the respective instrument for investors who already have exposure. Buy: We recommend buying the respective instrument for investors who already have exposure. Trading recommendations for fixed-interest securities mostly focus on the credit spread (yield difference between the fixed-interest security and the relevant government bond or swap rate) and on the rating views and methodologies of recognized agencies (S&P, Moody’s, Fitch). Depending on the type of investor, investment ratings may refer to a short period or to a 6 to 9-month horizon. Please note that the provision of securities services may be subject to restrictions in certain jurisdictions. You are required to acquaint yourself with local laws and restrictions on the usage and the availability of any services described herein. The information is not intended for distribution to or use by any person or entity in any jurisdiction where such distribution would be contrary to the applicable law or provisions. The prices used in the analysis are the closing prices of the appropriate local trading system or the closing prices on the relevant local stock exchanges. In the case of unlisted stocks, the average market prices based on various major broker sources (OTC market) are used. The MSCI sourced information is the exclusive property of Morgan Stanley Capital International Inc. (MSCI). Without prior written permission of MSCI, this information and any other MSCI intellectual property may not be reproduced, redisseminated or used to create any financial products, including any indices. This information is provided on an “as is” basis. The user assumes the entire risk of any use made of this information. MSCI, its affiliates and any third party involved in, or related to, computing or compiling the information hereby expressly disclaim all warranties of originality, accuracy, completeness, merchantability or fitness for a particular purpose with respect to any of this information. Without limiting any of the foregoing, in no event shall MSCI, any of its affiliates or any third party involved in, or related to, computing or compiling the information have any liability for any damages of any kind. MSCI, Morgan Stanley Capital International and the MSCI indexes are services marks of MSCI and its affiliates. The Global Industry Classification Standard (GICS) was developed by and is the exclusive property of Morgan Stanley Capital International Inc. and Standard & Poor’s. GICS is a service mark of MSCI and S&P and has been licensed for use by UniCredit Bank AG. Coverage Policy A list of the companies covered by UniCredit Bank AG, UniCredit Bank AG London Branch, UniCredit Bank AG Vienna Branch, UniCredit Bank AG Milan Branch, UniCredit Securities, UniCredit Menkul Değerler A.Ş., Zagrebačka banka and UniCredit Bulbank is available upon request. Frequency of reports and updates It is intended that each of these companies be covered at least once a year, in the event of key operations and/or changes in the recommendation. Companies for which UniCredit Bank AG Milan Branch acts as Sponsor or Specialist must be covered in accordance with the regulations of the competent market authority. SIGNIFICANT FINANCIAL INTEREST: UniCredit Bank AG, UniCredit Bank AG London Branch, UniCredit Bank AG Vienna Branch, UniCredit Bank AG Milan Branch, UniCredit Securities, UniCredit Menkul Değerler A.Ş., Zagrebačka banka and UniCredit Bulbank and/or a company affiliated (pursuant to relevant national German, Italian, Austrian, UK, Russian and Turkish law) with them regularly trade shares of the analyzed company. UniCredit Bank AG, UniCredit Bank AG London Branch, UniCredit Bank AG Vienna Branch, UniCredit Bank AG Milan Branch, UniCredit Securities, UniCredit Menkul Değerler A.Ş., Zagrebačka banka and UniCredit Bulbank may hold significant open derivative positions on the stocks of the company which are not delta-neutral. Analyses may refer to one or several companies and to the securities issued by them. In some cases, the analyzed issuers have actively supplied information for this analysis. ANALYST DECLARATION The author’s remuneration has not been, and will not be, geared to the recommendations or views expressed in this study, neither directly nor indirectly. ORGANIZATIONAL AND ADMINISTRATIVE ARRANGEMENTS TO AVOID AND PREVENT CONFLICTS OF INTEREST To prevent or remedy conflicts of interest, UniCredit Bank AG, UniCredit Bank AG London Branch, UniCredit Bank AG Vienna Branch, UniCredit Bank AG Milan Branch, UniCredit Securities, UniCredit Menkul Değerler A.Ş., Zagrebačka banka and UniCredit Bulbank have established the organizational arrangements required from a legal and supervisory aspect, adherence to which is monitored by its compliance department. Conflicts of interest arising are managed by legal and physical and non-physical barriers (collectively referred to as “Chinese Walls”) designed to restrict the flow of information between one area/department of UniCredit Bank AG, UniCredit Bank AG London Branch, UniCredit Bank AG Vienna Branch, UniCredit Bank AG Milan Branch, UniCredit Securities, UniCredit Menkul Değerler A.Ş., Zagrebačka banka and UniCredit Bulbank and another. In particular, Investment Banking units, including corporate finance, capital market activities, financial advisory and other capital raising activities, are segregated by physical and non-physical boundaries from Markets Units, as well as the research department. In the case of equities execution by UniCredit Bank AG Milan Branch, other than as a matter of client facilitation or delta hedging of OTC and listed derivative positions, there is no proprietary trading. Disclosure of publicly available conflicts of interest and other material interests is made in the research. Analysts are supervised and managed on a day-to-day basis by line managers who do not have responsibility for Investment Banking activities, including corporate finance activities, or other activities other than the sale of securities to clients. ADDITIONAL REQUIRED DISCLOSURES UNDER THE LAWS AND REGULATIONS OF JURISDICTIONS INDICATED Notice to Austrian investors This document does not constitute or form part of any offer for sale or subscription of or solicitation of any offer to buy or subscribe for any securities and neither this document nor any part of it shall form the basis of, or be relied on in connection with or act as an inducement to enter into, any contract or commitment whatsoever. This document is confidential and is being supplied to you solely for your information and may not be reproduced, redistributed or passed on to any other person or published, in whole or part, for any purpose. Notice to Czech investors This report is intended for clients of UniCredit Bank AG, UniCredit Bank AG London Branch, UniCredit Bank AG Vienna Branch, UniCredit Bank AG Milan Branch, UniCredit Securities, UniCredit Menkul Değerler A.Ş., Zagrebačka banka and UniCredit Bulbank in the Czech Republic and may not be used or relied upon by any other person for any purpose.

5 October 2010 Credit Research
Euro Credit Pilot
UniCredit Research page 91
Notice to Italian investors This document is not for distribution to retail clients as defined in article 26, paragraph 1(e) of Regulation n. 16190 approved by CONSOB on 29 October 2007. In the case of a short note, we invite the investors to read the related company report that can be found on UniCredit Research website www.research.unicreditgroup.eu. Notice to Russian investors As far as we are aware, not all of the financial instruments referred to in this analysis have been registered under the federal law of the Russian Federation “On the Securities Market” dated April 22, 1996, as amended, and are not being offered, sold, delivered or advertised in the Russian Federation. Notice to Turkish investors Investment information, comments and recommendations stated herein are not within the scope of investment advisory activities. Investment advisory services are provided in accordance with a contract of engagement on investment advisory services concluded with brokerage houses, portfolio management companies, non-deposit banks and the clients. Comments and recommendations stated herein rely on the individual opinions of the ones providing these comments and recommendations. These opinions may not suit your financial status, risk and return preferences. For this reason, to make an investment decision by relying solely on the information stated here may not result in consequences that meet your expectations. Notice to Investors in Japan This document does not constitute or form part of any offer for sale or subscription for or solicitation of any offer to buy or subscribe for any securities and neither this document nor any part of it shall form the basis of, or be relied on in connection with or act as an inducement to enter into, any contract or commitment whatsoever. Notice to UK investors This communication is directed only at clients of UniCredit Bank AG, UniCredit Bank AG London Branch, UniCredit Bank AG Vienna Branch, UniCredit Bank AG Milan Branch, UniCredit Securities, UniCredit Menkul Değerler A.Ş., Zagrebačka banka or UniCredit Bulbank who (i) have professional experience in matters relating to investments or (ii) are persons falling within Article 49(2)(a) to (d) (“high net worth companies, unincorporated associations, etc.”) of the United Kingdom Financial Services and Markets Act 2000 (Financial Promotion) Order 2005 or (iii) to whom it may otherwise lawfully be communicated (all such persons together being referred to as “relevant persons”). This communication must not be acted on or relied on by persons who are not relevant persons. Any investment or investment activity to which this communication relates is available only to relevant persons and will be engaged in only with relevant persons. Notice to U.S. investors This report is being furnished to U.S. recipients in reliance on Rule 15a-6 ("Rule 15a-6") under the U.S. Securities Exchange Act of 1934, as amended. Each U.S. recipient of this report represents and agrees, by virtue of its acceptance thereof, that it is such a "major U.S. institutional investor" (as such term is defined in Rule 15a-6) and that it understands the risks involved in executing transactions in such securities. Any U.S. recipient of this report that wishes to discuss or receive additional information regarding any security or issuer mentioned herein, or engage in any transaction to purchase or sell or solicit or offer the purchase or sale of such securities, should contact a registered representative of UniCredit Capital Markets, Inc. (“UCI Capital Markets”). Any transaction by U.S. persons (other than a registered U.S. broker-dealer or bank acting in a broker-dealer capacity) must be effected with or through UCI Capital Markets. The securities referred to in this report may not be registered under the U.S. Securities Act of 1933, as amended, and the issuer of such securities may not be subject to U.S. reporting and/or other requirements. Available information regarding the issuers of such securities may be limited, and such issuers may not be subject to the same auditing and reporting standards as U.S. issuers. The information contained in this report is intended solely for certain "major U.S. institutional investors" and may not be used or relied upon by any other person for any purpose. Such information is provided for informational purposes only and does not constitute a solicitation to buy or an offer to sell any securities under the Securities Act of 1933, as amended, or under any other U.S. federal or state securities laws, rules or regulations. The investment opportunities discussed in this report may be unsuitable for certain investors depending on their specific investment objectives, risk tolerance and financial position. In jurisdictions where UCI Capital Markets is not registered or licensed to trade in securities, commodities or other financial products, transactions may be executed only in accordance with applicable law and legislation, which may vary from jurisdiction to jurisdiction and which may require that a transaction be made in accordance with applicable exemptions from registration or licensing requirements. The information in this publication is based on carefully selected sources believed to be reliable, but UCI Capital Markets does not make any representation with respect to its completeness or accuracy. All opinions expressed herein reflect the author’s judgment at the original time of publication, without regard to the date on which you may receive such information, and are subject to change without notice. UCI Capital Markets may have issued other reports that are inconsistent with, and reach different conclusions from, the information presented in this report. These publications reflect the different assumptions, views and analytical methods of the analysts who prepared them. Past performance should not be taken as an indication or guarantee of future performance, and no representation or warranty, express or implied, is provided in relation to future performance. UCI Capital Markets and any company affiliated with it may, with respect to any securities discussed herein: (a) take a long or short position and buy or sell such securities; (b) act as investment and/or commercial bankers for issuers of such securities; (c) act as market makers for such securities; (d) serve on the board of any issuer of such securities; and (e) act as paid consultant or advisor to any issuer. The information contained herein may include forward-looking statements within the meaning of U.S. federal securities laws that are subject to risks and uncertainties. Factors that could cause a company’s actual results and financial condition to differ from expectations include, without limitation: political uncertainty, changes in general economic conditions that adversely affect the level of demand for the company’s products or services, changes in foreign exchange markets, changes in international and domestic financial markets and in the competitive environment, and other factors relating to the foregoing. All forward-looking statements contained in this report are qualified in their entirety by this cautionary statement. This document may not be distributed in Canada or Australia.
5 October 2010 Credit Research
Euro Credit Pilot
UniCredit Research page 92
UniCredit Research* Thorsten Weinelt, CFA Global Head of Research & Chief Strategist +49 89 378-15110 [email protected]
Dr. Ingo Heimig Head of Research Operations +49 89 378-13952 [email protected]
Credit Research
Luis Maglanoc, CFA, Head +49 89 378-12708 [email protected]
Credit Strategy & Structured Credit Research Dr. Philip Gisdakis, Head Credit Strategy +49 89 378-13228 [email protected]
Dr. Tim Brunne, Quantitative Credit Strategy +49 89 378-13521 [email protected]
Markus Ernst, Credit Strategy & Structured Credit +49 89 378-14213 [email protected]
Dr. Stefan Kolek, EEMEA Corporate Credits & Strategy +49 89 378-12495 [email protected]
Dr. Christian Weber, CFA, Credit Strategy +49 89 378-12250 [email protected]
Financials Credit Research Franz Rudolf, CEFA, Head Covered Bonds +49 89 378-12449 [email protected]
Alexander Plenk, CFA, Deputy Head Banks +49 89 378-12429 [email protected]
Amey Dyckmans Sub-Sovereigns & Agencies +49 89 378-12004 [email protected]
Florian Hillenbrand, CFA Covered Bonds +49 89 378-12961 [email protected]
Luis Maglanoc, CFA Insurance, Banks, RAS +49 89 378-12708 [email protected]
Natalie Tehrani Monfared Regulatory & Accounting Service +49 89 378-12242 [email protected]
Dr. Dietmar Tzschentke Banks +49 89 378-12960 [email protected]
Corporate Credit Research Stephan Haber, CFA, Co-Head Telecoms, Media, Technology +49 89 378-15192 [email protected]
Dr. Sven Kreitmair, CFA, Co-Head Automotive & Mobility +49 89 378-13246 [email protected]
Jana Arndt, CFA Basic Resources, Industrial G&S +49 89 378-13211 [email protected]
Christian Kleindienst Utilities, Oil & Gas +49 89 378-12650 [email protected]
Susanne Reichhuber Tollroads, Travel & Leisure, Utilities +49 89 378-13247 [email protected]
Rocco Schilling Consumers, Healthcare +49 89 378-15449 [email protected]
Jochen Schlachter Chemicals, Construction & Materials +49 89 378-13212 [email protected]
Kai Zirwes Media +49 89 378-11962 [email protected]
Publication Address
UniCredit Research Corporate & Investment Banking UniCredit Bank AG Arabellastrasse 12 D-81925 Munich Tel. +49 89 378-18927 Fax +49 89 378-18352
Bloomberg UCCR Internet www.research.unicreditgroup.eu
*UniCredit Research is the joint research department of UniCredit Bank AG (UniCredit Bank), UniCredit CAIB Group (UniCredit CAIB), UniCredit Securities (UniCredit Securities), UniCredit Menkul Değerler A.Ş. (UniCredit Menkul), Zagrebačka banka and UniCredit Bulbank.