eu meat export opportunities in the far east - wur
TRANSCRIPT

Electronic copy available at: http://ssrn.com/abstract=2022964
EU meat export opportunities in the Far East a quick scan of EU export opportunities of bovine and ovine products in China, South Korea, Taiwan and Japan in case these countries would lift their import ban
Siemen van Berkum LEI, part of Wageningen UR
Paper commissioned by the Dutch ministry of Economic Affairs, Agriculture and Innovation
February 2012

Electronic copy available at: http://ssrn.com/abstract=2022964
2
Table of content 1. Introduction 2. Key economic features of the four countries 3. Meat consumption and imports in the four Far East countriies
4. Major suppliers of meat at Far East markets and EU positions
5. Estimations of future growth of meat consumption in the four countries 6. EU export opportunities in case the import ban would be lifted 7. Conclusions References Annex 1 Imports of meat by Far East countries from major suppliers Annex 2 Questionnaires This research was commissioned by the Dutch Ministry of Economic Affairs, Agriculture and Innovation (Department Animal Supply Chains and Animal Welfare. Contact person: Jouke Knol). The author thanks his colleagues Ton de Kleijn (data) and Marie Luise Rau (comments) for their contributions to this study. The author gratefully acknowledges the support of the offices of the Dutch agricultural counsellors in Beijing, Seoul and Tokyo, and the UECBV, for contacting the business community to fill in a questionnaire and for collecting the information requested. Feedback of the Ministry’s staff on a draft report was very much appreciated.

1
1. Introduction Background South Korea, Japan, Taiwan and China have banned some EU bovine and ovine products since the outbreak of BSE in the Union in 1997. With regard to bovine products, all EU member states (except for Bulgaria and Romania) have a negligible or controlled BSE risk, according to the OIE (World Organisation for Animal Health), requiring the lift of third countries’ import ban on EU bovine products. The World Trade Organisation (WTO) agreement on the application of Sanitary and Phytosanitary Measures (SPS) considers that WTO members applying the OIE standards meet the obligations under the WTO Agreement. According to the WTO SPS agreement EU’s BSE status does not justify a third country import ban of EU bovine products. To support any future trade policy decision of the EU with regard to possible exports of EU bovine and ovine products to South Korea, Japan, Taiwan and/or China, insights into market potentials of these products in these four countries would be necessary. This study aims at providing these insights. Research question What is the export potential of EU beef and veal meat, edible and non-edible offal of bovine animals and edible and non-edible offal of sheep in South Korea, Japan, Taiwan and China in the case that these countries would lift their import ban on these products? Approach The study is a quick scan of market potential of EU beef and veal meat, edible and non-edible offal of bovine animals, and of edible and non-edible ovine offal in four Far East Asian countries. The study estimates the potential EU export value of these products to these countries, based on general economic trends, meat consumption and import trends (current and expected), and interviews with agribusiness’ and traders’ representatives (exporters in the EU as well as importers in the Asian countries concerned). The estimation is featured as a first round, comparative static analysis, which implies that the quick scan does not take into account competitors’ responses to changing market conditions (e.g. demand increases, price changes, EU suppliers appearing on the market) and possible substitution effects. Focus is on three groups of bovine products: veal meat, edible offal and non-edible offal of bovine animals, for which EU’s export potentials on each of the four markets (South Korea, Japan, Taiwan and China) will be estimated. As the import ban also effectively bans the imports of EU’s ovine offal, and the EU meat business has indicated to have an interest in its trade, export opportunities of edible and non-edible offal of sheep will be explored, too. 2. Key economic features of the four countries For a description of key (economic) features of the four countries of this study, we focus on two indicators: gross domestic product (or income) and the ease of doing business. The four countries of this study all rank in the top-25 world economies of the world. China is the second largest economy since 2010, after the USA. The economy of Japan is the third largest of the world, while South Korea ranks 15th and Taiwan as number 23. China has been a fast-growing economy with consistent annual growth rates of around 10 per cent over the past 30 years. Also South Korea and Taiwan – two ‘Asian tigers’ – achieved rapid economic

2
growth in the last three decades. The Japanese economy, on the other hand, showed double digit growth figures in the 1960s, followed by much lower growth rates in the 1970s and 1980s, and only modest growth rates since then. The country’s per capita income levels are yet very high, in nominal terms more than twice the levels in South Korea and Taiwan (42,800 euro, see table 2.1). The purchasing power adjusted income per capita of these three countries, though, is rather similar. According to the World Bank classification China is a developing and a upper-middle income country, whereas the other three countries qualify for the developed and high-income country criteria (see World Bank, World Development Indicators, on www.data.worldbank.org). The economic structure of these countries show a dominant role for services, followed by the industry sector. Agriculture adds almost 10 per cent to China’s national income, yet only 1.5-3 per cent in the other three countries. Table 2.1 Key economic data of China, South Korea, Taiwan and Japan China South Korea Taiwan Japan GDP nominal US$ (2010)
5878 trillion 1423 trillion 423 bn 5458 trillion
Population, million (2011)
1,336,718 48.7 23.1 126.5
GDP pc nominal US$ (2010)
4,382 20,265 18,300 42,820
GDP pc PPP US$ 1)
7,544 30,200 34,740 33,805
GDP growth % (2010)
10.3 6.1 10.5 3.9
GDP per sector (%)
Services 43.6 57.6 69.2 75.7 Industry 46.8 39.4 29.2 22.8 Agriculture 9.6 3.0 1.6 1.5 Exports US$ 1581 trillion 466 bn 308 bn 765 bn Imports US$ 1327 trillion 418 bn 282 bn 637 bn Source: CIA World Fact Book. Note 1) Purchasing Power Parities (PPPs) are currency conversion rates that both convert to a common currency and equalise the purchasing power of different currencies. In other words, they eliminate the differences in price levels between countries in the process of conversion. Doing business indicators are objective measures of business regulations for local firms in 183 economies, measures, assessed and ranked by the World Bank and IFC1 (World Bank/IFC, 2012). The indicators provide important information about the institutional environment in each of the countries included, pointing at the ‘ease’ of doing business in a comparative way. In the 2012 list, China ranks 91 (see table 2.2). This is slightly below the country’s 2011 ranking (87), which is mainly due to a decline in the ranking in the protecting investors’ indicator. However, over the longer period, i.e. since 2004, the score on the indicator for Trading across borders is declining, due to increasing costs of exports and imports (illustrative is that one needs 21 days to export and 24 days to go through all import procedures). Korea’s ranking improved significantly from rank 15 in 2011 to 8 in 2012.
1 Economies are ranked on their ease of doing business, from 1 – 183. A high ranking on the ease of doing business index means the regulatory environment is more conducive to the starting and operation of a local firm. This index averages the country's percentile rankings on 10 topics, made up of a variety of indicators, giving equal weight to each topic.
3
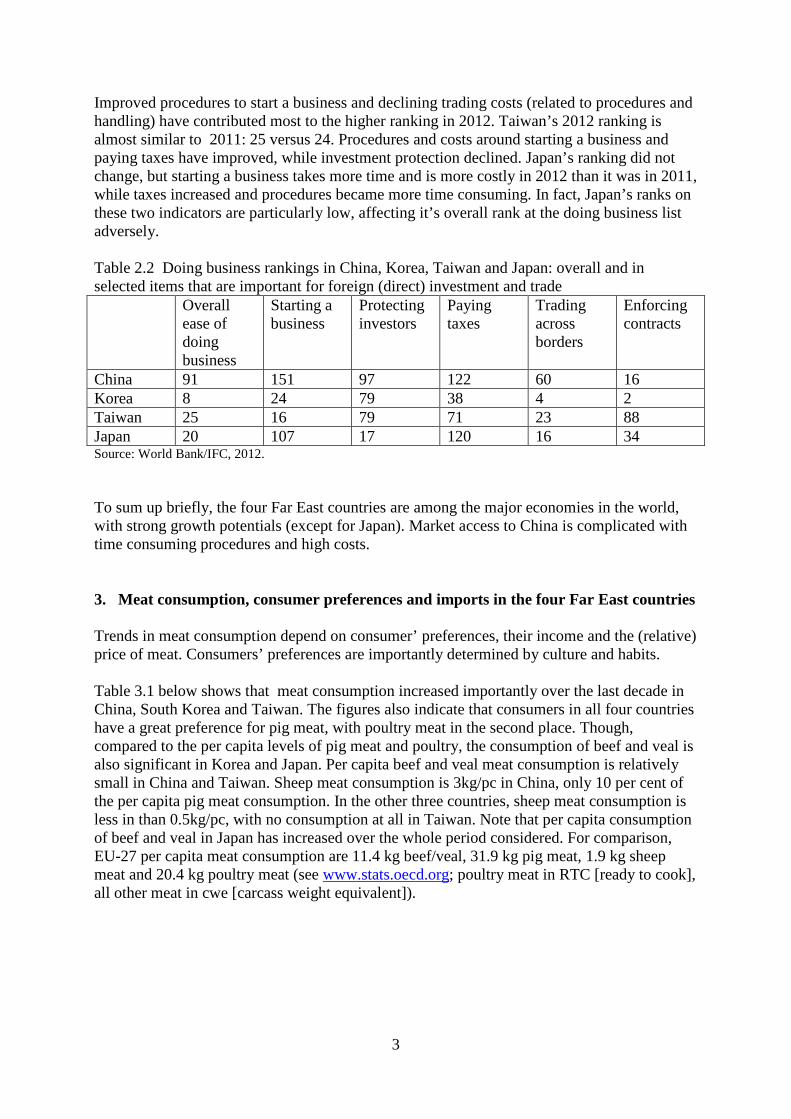
Improved procedures to start a business and declining trading costs (related to procedures and handling) have contributed most to the higher ranking in 2012. Taiwan’s 2012 ranking is almost similar to 2011: 25 versus 24. Procedures and costs around starting a business and paying taxes have improved, while investment protection declined. Japan’s ranking did not change, but starting a business takes more time and is more costly in 2012 than it was in 2011, while taxes increased and procedures became more time consuming. In fact, Japan’s ranks on these two indicators are particularly low, affecting it’s overall rank at the doing business list adversely. Table 2.2 Doing business rankings in China, Korea, Taiwan and Japan: overall and in selected items that are important for foreign (direct) investment and trade Overall
ease of doing business
Starting a business
Protecting investors
Paying taxes
Trading across borders
Enforcing contracts
China 91 151 97 122 60 16 Korea 8 24 79 38 4 2 Taiwan 25 16 79 71 23 88 Japan 20 107 17 120 16 34 Source: World Bank/IFC, 2012. To sum up briefly, the four Far East countries are among the major economies in the world, with strong growth potentials (except for Japan). Market access to China is complicated with time consuming procedures and high costs. 3. Meat consumption, consumer preferences and imports in the four Far East countries Trends in meat consumption depend on consumer’ preferences, their income and the (relative) price of meat. Consumers’ preferences are importantly determined by culture and habits. Table 3.1 below shows that meat consumption increased importantly over the last decade in China, South Korea and Taiwan. The figures also indicate that consumers in all four countries have a great preference for pig meat, with poultry meat in the second place. Though, compared to the per capita levels of pig meat and poultry, the consumption of beef and veal is also significant in Korea and Japan. Per capita beef and veal meat consumption is relatively small in China and Taiwan. Sheep meat consumption is 3kg/pc in China, only 10 per cent of the per capita pig meat consumption. In the other three countries, sheep meat consumption is less in than 0.5kg/pc, with no consumption at all in Taiwan. Note that per capita consumption of beef and veal in Japan has increased over the whole period considered. For comparison, EU-27 per capita meat consumption are 11.4 kg beef/veal, 31.9 kg pig meat, 1.9 kg sheep meat and 20.4 kg poultry meat (see www.stats.oecd.org; poultry meat in RTC [ready to cook], all other meat in cwe [carcass weight equivalent]).

4
Table 3.1 Meat consumption in kg/pc/year
Source: FAOStat (Food Balance Sheets); Food cap/year 2010 own calculations based on FAO for meat consumption and World Bank for population data. Import trends Table 3.2 showing the degree of self-sufficiency indicates that all countries but China are net importers of meat. Only China is more than self-sufficient in beef and veal and in pig meat. Although self-sufficient in beef and veal, China has not been traditionally a red-meat consuming country. Consumers are unfamiliar with beef and lamb as a main menu item. Beef and lamb have not been commonly available to Chinese consumer and so, domestic prices for beef and lamb remain almost double that of pork and poultry (chicken) (Redfern Associates, 2010). For beef and veal, Japan and Korea have a self-sufficiency rate of 40 per cent, while this is only a mere 4 per cent for Taiwan. Hence, these countries have to import a substantial share of domestic consumption of these types of meat. For sheep meat, China is almost self-sufficient, whereas Japan is importing all sheep meat consumed and Korea produces only a quarter of the domestic use. Table 3.2 Degree of self-sufficiency (in % as share of consumption that is produced domestically) in meat
Source: FAO/OECD Trends in imports of meat are presented in four graphs below. China’s imports of bovine and sheep meat are relatively low (in recent years on average 30,000 ton and 70,000 ton per annum, respectively), with sheep meat showing some consistent growth over the period and beef imports increasing again after it turned to practically zero between 2005 and 2007. Pig meat and poultry meat imports show great fluctuations over the period 2000-2010, with an overall declining trend in the first part of the decennium, followed by growing imports since then. The country’s 2010 import volumes of pig and poultry meat were 200,000 ton and almost 700,000 ton respectively (figure 3.1).
1990 2005 2010 1990 2005 2010 1990 2005 2010 1990 2005 2010
China 1.0 4.4 4.6 20.6 35.2 37.0 0.9 2.7 3.0 3.4 10.9 12.3
Japan 8.4 8.6 9.5 15.3 20.8 18.7 0.5 0.3 0.2 13.5 16.8 13.9
Korea 5.8 10.3 11.4 12.8 26.1 30.3 0.2 0.1 0.1 6.3 12.5 15.5
Taiwan 2.0 4.0 5.5 38.4 42.0 35.5 xx xx xx 17.7 28.0 28.2
Beef and veal Pigmeat Sheepmeat Poultry
1990 2005 2010 1990 2005 2010 1990 2005 2010 1990 2005 2010
China 110.3 98.8 100.8 101.3 100.5 100.4 98.9 98.7 98.4 97.0 97.4 98.9
Japan 53.4 45.9 42.3 82.7 47.1 54.5 0.6 0.6 0.0 83.6 59.4 76.3
Korea 51.4 39.7 42.2 99.7 72.6 76.0 10.4 50.8 24.5 98.0 90.1 86.3
Taiwan 9.8 5.9 4.4 128.7 96.5 93.2 xx xx xx 100.0 88.2 83.6
Beef and veal Pigmeat Sheepmeat Poultry

5
Figure 3.1 China’s imports of meat, 2000-2010, in ton (Source: OECD-FAO, 2011) South Korea’s imports of pig meat shows a strong increase over the period 2000-2010. The country’s imports of bovine and poultry meat increased continuously since 2004 to reach about 320,000 ton of beef and veal, and 375,000 ton of poultry meat in 2010 (Figure 3.2).
Figure 3.2 South Korea’s imports of meat, 2000-2010, in ton (Source: OECD-FAO, 2011) Japan imported 1-1.2 million ton of pigmeat annualy during the last decenium (figure 3.3). Compared to the early 2000s Japan imports of bovine meat is about one fifth less in recent years, but the trend is increasing again since 2004. Also the country’s poultry meat imports show a declining trend over the first half of the 2000s, stabilising around 400,000 ton in more recent years. Imports of sheep meat have been around 50,000 ton per annum over the period 2000-2010.

6
Figure 3.3 Japan’s imports of meat, 2000-2010 in ton (Source: OECD-FAO, 2011) Over the last decade Taiwanese imports of meat have been increasing for all but sheep meat. Poultry meat imports show the most rapid increase over the period 2000-2010. Imports of bovine meat shows an increasing trend too, reaching 130,000 ton in 2010 (Figure 3.4).
Figure 3.4 Taiwan’s imports of meat, 2000-2010, in 1000 ton (Source: Imundi, USDA/ERS) Summing up, meat consumption increased importantly over the last decade in China, South Korea and Taiwan, whereas it slightly decreased in Japan. Per capita consumption levels of beef and veal are growing in all four countries, yet these are still relatively low in China and Taiwan, while per capita consumption levels in Japan and Korea are close to average EU-27 levels. Except for China, these countries import a significant share of their total bovine meat consumption. In 2010 the four countries imported approximately 1.2 million ton of bovine meat. Chinese imports of edible offal of animals mostly refer to offal of swine, whereas Korea and Japan import largely offal from bovine animals.

7
4. Major foreign suppliers of bovine and ovine meat at Far East markets and EU positions
Major foreign meat suppliers at Far East markets In value terms, total bovine and ovine meat imports of these four countries add up to almost US$ 5 billion (or 3.8 billion euro)2 per annum – see totals per category, per country, in Table 4.1. Bovine meat is by far the major category, reaching about US$ 3.5 billion on average in 2008-2010. Sheep meat imports were about US$ 350 million and edible offal valued approximately US$ 1.1 billion. Note that the imports of beef/veal is largely in frozen form in China, Korea and Taiwan, whereas Japan imports more fresh/chilled beef/veal meat than frozen meat. Major suppliers of bovine and ovine meat products at the Far East market are Australia, New Zealand and the USA (see table 4.1). China’s imports of bovine products (0201 and 0202) are largely from Australia, Uruguay, Brazil and New Zealand, while the other three countries are largely supplied from Australia, New Zealand and the USA. Australia and New Zealand are practically the only countries exporting ovine meat to these four countries. Edible offal (0206) is largely supplied by the USA, Canada, next to Australia and New Zealand to these markets, yet China and Taiwan import significant amounts from EU countries (edible offal of swine, frozen). China’s imports of edible offal of animals (0206) mostly refer to offal of swine, whereas Korea and Japan import largely offal from bovine animals. Table 4.1. Major suppliers of bovine and ovine meat to China, South Korea, Japan and Taiwan (Total imports in million US$, share in percentage of total imports, average 2008-2010) Bovine meat,
fresh/chilled (0201)
Bovine meat, frozen (0202)
Meat of sheep and goats, fresh/chilled (0204)
Edible offal of bovine animals, swine, sheep, etc. (0206)
China Total: 7.4 Australia: 98% Brazil: 2%
Total: 41 Australia: 37% Uruguay: 30% Brazil: 22% New Zealand: 11%
Total: 134 New Zealand: 54% Australia: 44%
Total: 589 Denmark: 36% USA: 22% Canada: 18% France: 16%
Korea Total: 229 Australia: 85% USA: 13% New Zealand: 3%
Total: 716 Australia: 48% USA: 36% New Zealand: 14%
Total: 15 Australia:83% New Zealand:17%
Total: 108 Australia: 54% USA: 21% New Zealand: 11% Canada: 4%
Japan Total:1229 Australia: 75% USA: 19% New Zealand:3%
Total: 912 Australia: 67% USA: 16% New Zealand: 9% Mexico: 4%
Total: 122 Australia: 68% New Zealand: 31%
Total: 366 Australia: 38% USA: 36% Canada:10% New Zealand: 8%
Taiwan Total: 86 North America: 78% Australasia:21%
Total: 300 Australasia: 61% North America: 35% Central America: 3%
Total: 74 Australasia: 100%
Total: 37 North America: 66% Australasia: 16% Europe:10% Central America: 5%
Source: UN Comtrade; Taiwan: national statistics, at http://cus93.trade.gov.tw/ENGLISH/FSCE/.
2 Using an average 2010 euro/dollar exchange rate of 1 euro = 1.30 US dollar.

8
EU’s meat exports to the Far East markets Russia is EU’s major destination of its meat exports, and next Japan, South Korea and China are among EU’s major export markets outside the EU (see figure 4.1). Export of meat to Japan has varied between 650 and 790 million euro in the years 2007-2010. Exports to South Korea show a declining trend from 300 million euro in 2007 to 240 million in 2010, while exports to China increased in recent years to reach 200 million euro in 2010. Total meat export to Taiwan was only 4-7 million euro in 2007-2009 but then jumped to 23 million in 2010. EU meat exports to these countries are largely related to pig meat and edible offal of swine (see Table 4.2).
Figure 4.1 EU-27 major export destinations of meat (all products under HS-code 02), in million euro (Source: Eurostat) EU exports to China is mainly edible offal of bovine, swine etc. (HS-code 0206, with a value of 136 million euro in 2010 – see Table 4.2). In this category the product edible offal of swine frozen excluding liver (HS-code 020649) dominates. Also, the EU exports edible offal of beef (tongues, livers) to China, South Korea and Japan, yet these values are very small, accounting for about 600,000 euro to China and Korea, while EU’s export of bovine offal to and Japan was about 1.6 million euro. The major products in this 0206 category are ‘fresh or chilled edible bovine thick and thin skirt (02061095) for South Korea and ‘frozen edible bovine tongues’ (02062100) for Japan. In EU’s meat exports to South Korea, Japan and Taiwan the meat of swine (020329: frozen meat of swine etc) is by far the major type of meat traded at this moment. In the Annex Table A1. EU’s total meat export to the four Far East countries is compared with export flows from other major suppliers to these markets.

9
Table 4.2 EU meat exports (at 4 digit) to each of the four countries (1000 euro), 2010.
Source: Eurostat Summing up, in 2010 the EU exported about € 1.2 billion of meat per annum to the four countries, not being bovine and ovine products. The US, Australia, New Zealand and some other countries that are allowed to export bovine and ovine meat products to the four Asian countries were able to export per annum US$ 3.5 billion of beef and veal, US$ 350 million of sheep and goat meet and US$ 1.1 billion of edible offal of bovine animals, swine and sheep to these markets (in euro 2.7 billion, 270 million and 850 million respectively).3 In 2010, these countries supplied approximately 56 per cent of the total bovine meat market in Korea and Japan, and some 95 per cent of Taiwan’s total bovine meat market. 5. Estimation of future growth of meat consumption and imports in the four countries
Basic assumptions Next to consumers’ preferences, meat consumption levels are determined by income, population and (relative) prices of meat (among meat varieties and compared to meat substitutes). The level of meat consumption for the coming years, hence, will be affected by each of the four Far East countries’ income developments and the price developments of the various types of meat. Income and (own-) price elasticities of demand are being used to measure the changes in consumption when income and price change. Elasticity Muhammad et al. (2011) estimate income and price elasticities of demand for broad consumption categories—such as food, clothing, education, and other goods—and for food categories such as cereals, meats, and dairy across 114 countries. Estimates of these elasticities are widely used in economic models mostly applied in agricultural market and policy analyses, such as the USDA’s Baseline model, the Global Trade Analysis Project (GTAP) model, the International Food Policy Research Institute’s IMPACT model and the OECD-FAO Aglink-Cosimo model. One finds, however, several adjustments to the elasticities from the Muhammad et al. publication in each of the models mentioned. There are several reasons for doing so (among others because of ‘expert knowledge’), yet one important reason is that the models mentioned differ in terms of aggregation of countries and products (e.g. total meat or several types of meat, such as beef, pig meat etc.), that does not match the specification from Muhammad et al.. As we will refer to OECD-FAO projections for production and consumption projections in next part of this study (largely because the model has the advantage that results are presented in quantities, i.e. tons), we will use the income
3 Based on an average 2010 euro/dollar exchange rate of 1 euro = 1.30 US dollar.
China South Korea
Japan Taiwan Total
0201 - Meat of bovine animals, fresh or chilled 4 40202 - Meat of bovine animals, frozen 124 8 1320203 - Meat of swine, fresh, chilled or frozen 58967 212001 722336 17856 10111600204 - Meat of sheep or goats, fresh, chilled or frozen 75 165 4 2440205 - Meat of horses, asses, mules or hinnies, fresh, chilled or frozen 924 9240206 - Edible offal of bovine animals, swine, sheep, goats, horses, asses, mules or hinnies, fresh, chilled or frozen 136167 18543 7616 4046 1663720207 - Meat and edible offal of fowls of the species gallus domesticus, etc, fresh, chilled or frozen 6030 7028 36896 1559 515130208 - Meat and edible offal of rabbits, hares, pigeons and other animals n.e.s., fresh, chilled or frozen 241 1 687 7 9360209 - Pig fat, free of lean meat and poultry fat not rendered, fresh, chilled, frozen, salted, in brine, dried or smoked 1926 676 153 81 28360210 - Meat and edible offal, salted, in brine, dried or smoked; edible flours and meals of meat or meat offal 1296 572 20790 101 22759Total 204826 238829 789571 23654 1256880

10
elasticities of Aglink-Cosimo as the source for indicating the income sensitivity for the demand for meat in the countries of our study (see table 5.1). The income (or expenditure) elasticity for meat measures the percentage change in demand from a percentage change in overall income (or total spending). The income elasticities are less than 1, indicating that when income increases with 1 per cent, part of that increase will be used for more meat consumption – for example in table 4.1 China’s income elasticity of demand for meat is 0.675, indicating that with 1 per cent income growth, demand for beef will increase by 0.675 per cent. Income elasticities for meat are relatively high compared to income elasticities for cereals (rice) or potatoes, as meat is a more luxurious food item in household expenditures, consumed increasingly when incomes raise. Also, the income elasticity for meat is largest in the poorer countries and declines in magnitude with affluence. Table 5.1 Income elasticities of demand for meats Beef & veal Pig meat Sheep meat Poultry China 0.675 0.550 0.600 0.600 Korea 0.300 0.400 0.600 0.600 Taiwan 0.300 0.400 0.523 0.500 Japan 0.436 0.375 0.299 0.297 Source: OECD-FAO (Aglink-Cosimo model) Income Income developments are taken from the 2011 OECD/FAO Agricultural Outlook. Projections of GDP growth presented here cover the period up to 2015 and are based on OECD and World Bank macroeconomic projections (OECD-FAO’s Outlook presents projections up to 2020). GDP growth rates for the four Far East countries are presented in table 5.2. Table 5.2 Projections of real GDP growth rates Average
2009-10 2011 2012 2013 2014 2015 Average
2011-2015 China 9.7 9.7 9.7 8.5 8.6 8.3 8.9 Korea 2.9 4.3 4.8 4.0 3.3 3.0 3.9 Taiwan 1) 4.5 4.5 4.2 n.a n.a n.a 4.32) Japan -0.9 1.7 1.3 1.1 0.7 0.9 1.1 Source: OECD/FAO, 2011, p. 48; 1) Source data Taiwan: National Statistics Republic of China (Taiwan) (2011 and 2012 are projections); 2) assumed average income growth, based on average income growth 2011-2012. Estimations of meat consumption in the medium term We take GDP projections and income elasticities of demand for the four types of meat as a base, and use them to estimate the possible developments on the meat markets in the four Far East countries for the next years up to 2015. The results are presented in table 5.3.

11
Table 5.3 Projected meat consumption in Far East countries, in 2015 (kg per capita), based on income elasticities and economic growth Consumption in kg/pc
Beef &veal Pig meat Sheep meat Poultry
2010 2015 2010 2015 2010 2015 2010 2015
China 4.6 6.2 37 44.9 3 3.7 12.3 16.0
Korea 11.4 12.1 30.3 32.2 0.1 0.1 15.5 17.4
Taiwan 5.5 5.8 35.5 37.8 0.0 0.0 28.2 31.6
Japan 9.5 10.0 18.7 19.7 0.2 0.2 13.9 15.3
Source: 2010 levels from FAOStat, 2015 levels: own calculations The results in table 5.3 indicate that especially in China demand for meat would expand significantly, with an annual consumption growth of around 6 per cent for beef and 5 per cent for other meat types, which implies an increase per capita of 20-35 per cent over a five-year period depending on the meat type. Annual meat consumption growth is much more modest in Korea and Taiwan (1.2-2.4 per cent), and in Japan (0.3-0.4 per cent). Impact of consumption growth on import needs Perceptions of the scope of market opportunities in China might largely be based on the high income growth figures reported by the country’s responsible authority. However, projections of agricultural market developments published by OECD-FAO (2011) downplay the effects of high income growth on the agricultural markets, and hence on the meat markets. There are two reasons for that. One reason is that China has a high level of savings; only part of the income growth is spent on consumables such as food. This implies that the effect of the income elasticity of demand for meat is less than suggested by the number in table 5.2. The second reason is that consumption is not only affected by income (growth) but also by price (changes). Demand for beef is highly sensitive and responsive to price changes: the price elasticity for beef is -0.92, according to the Aglink-Cosimo database. In the case production and imports are not responding timely and adequately to an increased demand for beef (that is caused by income growth), prices may rise quickly, with the effect that demand decreases again. The crucial factor is, hence, to what extend supply can respond to increasing demand. Beef production in China is not a big sector and production growth has not been very dynamic in the last decade (see FAOStat). Next, China’s import policy is rather restrictive, being very strict on veterinary import regulations, applying a system of import licenses and allowing only a few countries to export to China (e.g. USDA/FAS, 2011). The results of the interplay between income and price developments as well as import policies and their effects on supply and demand are illustrated by OECD-FAO (2011) meat import projections for China and the other countries in this study. The model simulations point at a per capita consumption growth that is largely covered by domestic production growth. However, meat import needs do increase over the years up to 2015 as Table 5.4 shows. Although the increase in absolute amounts is not spectacularly high for China, the volume more than doubles within a five-year period from 31,000 ton up to 79,000 ton. Also the other three countries will import an additional 25-35,000 ton beef and veal meat in 2015 compared

12
to the 2010 levels4. China and Japan together will import an additional 10,000 ton of sheep meat in 2015, while Korea’s import is projected to decrease somewhat. Table 5.4 Projected meat imports in Far East countries, in 2010 and 2015 (1000 ton) Beef &veal Pig meat Sheep meat Poultry
2010 2015 2010 2015 2010 2015 2010 2015
China 31 79 190 243 75 79 677 622
Korea 315 336 371 417 3.7 3.5 120 89
Taiwan 130 160 60 n.a. 0.0 0.0 110 n.a.
Japan 711 747 1110 1160 31 37 428 377
Source: OECD-FAO, 2011 Note: Taiwan is not included in the projections: own estimations In value terms the projections of the increase of bovine and ovine meat imports might imply an expansion of the market of almost €450 million (see table 5.5). Additional imports are calculated by using an average import unit value (based on import values and quantities in the years 2008-2010), which is then multiplied by the additional import volume projected by the OECD-FAO (2015-2010 projected levels, see table 5.4). The estimated additional import value of beef and veal meat is almost similar for China and Japan (€130-140 million), followed by Taiwan and Korea. The 2015 import values for sheep meat have been calculated in a similar way, which leads to an estimated €30 million for these countries (note that, given the consumption pattern in that country, Taiwan’s import of sheep meat and other ovine products are assumed to remain close to zero in 2015). Furthermore, imports of edible/non edible animal products may increase in the coming years, too. Assuming a 5-10 per cent (as the overall average) increase of imports of such products (which are not in the OECD-FAO projections) would add another €50-100 million to the scope of the Far East market. Table 5.5 Estimated additional beef and ovine meat import values in Far East countries in 2015, compared to 2010 Beef &veal Sheep meat
2010 Unit value (€/ton)
Change in import volume (1000 ton)
Increase of import value 2015 compared to 2010 (million euro)
2010 Unit value (€/ton)
Change in import volume (1000 ton)
Increase of import value 2015 compared to 2010 (million euro)
China 2,700 48 128 2,700 4 6.8
Korea 3,100 21 66 2,900 -0.2 -0.6
Taiwan 3,100 30 93 0 0.0 0
Japan 3,400 36 124 4,200 6 25
Total 135 411 10 31
Source: UNComtrade. Notes: 2010 Unit values are the values per ton, calculated as import value divided by import quantity. In case of beef/veal, the unit value is weighted by the share of fresh/chilled and frozen beef/veal in the total quantity of beef/veal imported. Taiwan is assumed to have a similar unit import unit value for beef and veal as Korea has.
4 For Taiwan (not included in the OECD-FAO projections), we assume that the import increase follows the 2005-2010 trend, which would lead to an increase of some 30,000 ton of beef/veal.

13
In conclusion: the estimations of future growth of meat consumption of bovine and ovine meat in the four far East countries result in an imaginable import growth, that, in value terms, amounts to €500-€600 million by 2015. This would add to the current annual average (based on 2008-2010 data) import of around €3.8 bn (US$5 billion, see chapter 4)5. 6 EU export opportunities in case the import ban would be lifted Estimations of market opportunities are also based on a questionnaire sent to EU meat exporters and meat importers, restaurants and hotel chains in the four Far East countries. The questionnaires to the EU meat industry were channelled through the UECBV, the European Livestock and Meat Trading Union, and country representatives collected answers from the industry and reported the (summarised) findings from the questionnaires to the author of this study. Dutch agricultural counsellors based in/responsible for China, Japan, Taiwan and South Korea, reported findings from interviews and responses to the questionnaires from companies and/or traders in the Far East countries. Below these findings are summarised. 6.1 Interviews with EU exporters Observations reported below are from respondents from eight EU member states: Belgium, Denmark, France, Germany, Ireland, Netherlands, Spain and the UK. Chances on the Chinese market are estimated to be biggest, due to the size and assumed growth potentials of this market. One respondent estimates for the whole EU meat industry possible sales up to €400 million p.a. for beef and €90 million p.a. for beef by-products. These amounts of possible exports to China are based on own market evaluation, contacts with trade partners (including country visits) and reflections on import statistics of China. Adding up the estimations of export opportunities for individual EU member states (from those that responded to the questionnaire and indicated numbers) results into possible export values to China of about €100-120 million on beef and beef by-products. EU companies do see export opportunities to China for beef (Germany, France, Ireland, UK), veal (Netherlands, Spain), sheep meat (Ireland and UK) as well as for edible offal from bovine and ovine animals (all countries mentioned plus Belgium and Denmark), yet most of them find it very difficult to indicate specific volumes or values that can be sold on the market. Barriers to trade (after the BSE-ban would be lifted) are seen in animal health requirements and approval procedures. Respondents also indicate that import tariffs/duties are relatively high. For South Korea, respondents see export opportunities especially for beef and veal, with possible sales in the first one to three years up to €120 million p.a. (for beef only) from the whole EU. Respondents indicate opportunities for veal, especially in hotels and restaurants, and edible offal of bovine animals (feet, tails, bones, casings). The evaluation of market opportunities results from contacts with trade partners and based on (own) evaluations of import statistics. Respondents underline that the Korean market is very competitive, and requires a specific approach in order to comply with local consumers’ demand. Barriers to trade are seen in animal health requirements, especially the BSE-ban against EU and approval procedures.
5 Using an average 2010 euro/dollar exchange rate of 1 euro = 1.30 US dollar.

14
For Taiwan, opportunities are seen in principal for beef and beef by-products but respondents did not come up with an estimation of average turnover possible on this market (except for the UK and Ireland; together these countries would be able to export beef and beef by-products worth about €20 million p.a). Opportunities would exist for veal meat products to be sold in restaurants and hotels, based on personal visits. Barriers to trade are seen in animal health requirements, approval procedure and BSE-ban against EU. For Japan, opportunities are seen in principal for beef but respondents did not indicate an average turnover that would be possible for their industry in Japan, except for the UK and Ireland, from where bovine exports could reach about €35 million, and ovine products about €10 million in three years-time after the lift of the ban. The Dutch industry has been able to export (high-quality) bone-in and boneless meat products, and several by-products (e.g. veal bones used for soup) to Japan before the ban was introduced, and based on that assumes good market prospects in case Japan would allow market access again. Barriers to trade are seen in approval procedure and BSE-ban against EU. Japan is recognise to be a difficult market, where EU suppliers would face fierce competition from Australia and the USA. 6.2. Opinions of Far East business respondents about EU export opportunities China (4 responses) Two respondents reported they import pig meat by-products from the EU and the other two did not have (had) any contact with EU meat suppliers. Imports of beef and veal is now from Australia, New Zealand and from North and South America. Respondents did not have an opinion on EU export opportunities for beef and veal to China. Korea (12 responses): Few respondents see opportunities to sell EU beef (rib finger, chuck roll, short rib), yet most respondents point at important restraints for EU meat to enter the market. Opportunities might be low as EU meat has a negative imagine due to BSE (‘EU meat is not safe’). Moreover, it may not be able to compete with supply from the USA, Australia and Canada as prices are (thought to be) higher while the EU supplies would not match Korean demand in terms of taste (Korean consumers like marbled meat). There might be some opportunities for mutton but that market is particularly small. Taiwan (10 responses) Taiwanese companies are pretty reserved with regard to EU export opportunities, as they indicate that they/the consumers do not know the quality and taste of EU bovine meat well enough to make a good judgement of market perspectives. Companies point at the fact that little EU beef was shipped to Taiwan even before the import ban was implemented. Prices for EU products might be too high, also due to transportation costs (higher than for meat imported from the USA and Australia) and import tariffs. Japan (10 responses): Some companies say there is no opportunity for EU meat, but others see opportunities especially for certain bovine products e.g., beef offal, tongue and veal (although the veal market might be very small). Most companies indicated that the price is a major obstacle/bottleneck for EU meat. Other factors mentioned include (the lack of) flexibility to adapt to Japanese specifications (e.g. packaging), capacity to meet demand, quality of meat

15
(e.g., degree of marbling). The negative image of unsafe EU meat due to BSE is also mentioned as an important factor that may limit EU meat market opportunities in Japan. Brief evaluation of the answers from the questionnaires All responses from the EU meat industry are positive about the opportunities to (increase the) exports to the Far East, after the ban on bovine and ovine meat would be lifted. Most respondents find it difficult to indicate an export value that would be feasible in the one to three years that follow the lift of the ban. Yet, some do, sometimes on EU level and sometimes on a country-level, which all together would suggest a possible export market of € 500-600 million for the EU meat industry in these four Far East countries. The responses of the Far East business indicate, however, that this potential market may be limited to some extend by higher EU prices than those of competitors and doubts whether the EU products would be able to supply the Asian consumers according to the specifications demanded. 7 Conclusions Present market situation China is a highly populated, developing country with a fast-growing economy. Income growth in South Korea and Taiwan (both high-income countries) remains significant. Meat consumption increased importantly over the last decade in these three countries. Per capita consumption of beef and veal are increasing in all four countries, yet these are still relatively low in China and Taiwan, while per capita consumption levels in Japan and Korea are close to average EU-27 levels. Except for China, these countries import a significant share of their total bovine meat consumption. In 2010 the four countries imported approximately 1.2 million ton of bovine meat. Major suppliers of the four countries’ import needs of bovine and ovine meat are Australia, New Zealand and the USA, with some other countries (Canada, Brazil, Uruguay) playing a minor role. Currently the EU largely exports pig meat and edible offal of swine to these markets. Imports of bovine and ovine meat products and by-products from the EU are banned. Market outlook: expected future imports Expected consumption growth in these Far East countries will result in further increasing imports of beef, veal and ovine meat products with approximately € 500-600 million by 2015 (including edible offal), bringing the total market value of the bovine and ovine products imported to some € 4.3-4.4 billion in 2015. The additional imports projected for the coming years up to 2015 are estimated to consist of € 450 million of beef and veal meat products, around € 30 million sheep meat products and € 50-100 million of edible/non-edible animal products. EU export opportunities in perspective China’s income growth is impressive and meat demand increasing. However, consumers prefer pig and poultry meat, while the consumption of beef and veal is also very sensitive to price increases. South Korea, Japan and Taiwan are very competitive markets, where meat suppliers from Australia, New Zealand and the USA have strong market potions as they are able to respond to local demand in terms of taste and other specifications (e.g. adapt to packaging requirements, line-up with local distribution channels). These established foreign suppliers are well positioned to benefit from the increasing import needs in the Far East.

16
Based on personal contacts and own market surveys, EU exporters have identified substantial opportunities for exporting beef, veal and ovine meat and by-products to the four Far East countries, once the import ban would be lifted. Given the increase of imports expected for these markets, significant potential exports to these countries can be justified. However, respondents from the four Far East countries qualify the expectations of EU exporters, pointing at several weaknesses of the EU supply (e.g. inadequate match with local taste, little adaptive to local specifications, too expensive). Another issue is the perception of traders and consumers in these countries that EU beef meat is unsafe because of BSE. Because of this image, quick wins in terms of rapidly gained market shares may be difficult to achieve in case the import ban would be lifted. The lift of the import ban also implies only a first step in a process of gaining market access to the Far East. In order to enter these markets, the EU exporter has to comply with all veterinary and food safety requirements, and requirements of conformity assessment (e.g. health and export certificates, establishment approval). This might imply investments on the EU side, necessary to adapt to specifications of standards required for entering the Far East market. Furthermore, the technical discussions between country authorities and the process of administrative procedures and protocols before a shipment can take place may take quite some time (probably a few years). Additional note Market access, once allowed, turns into export opportunities only if EU suppliers can adapt to local demand and would be able to offer a competitive product. The responses of the EU meat industry to the questionnaires indicate that some of them have started to build up contacts in the Far East countries. However, the results of the questionnaire also learn that there is much uncertainty about EU’s prospects in the four Far East markets; these markets are relatively unknown while Far East importers may also have little knowledge of what the EU meat industry may offer them. This calls for more investments in (collecting and distributing) market intelligence information and promotion activities (e.g. by associations) on these specific markets, whereas companies should investments in marketing strategies specifically targeted to these Far East markets (e.g. focusing on specifications of demand, identifying local and foreign competitors and/or partners, exploring the state of the market infrastructure and distribution channels that can/should be used) in case a serious interest in these markets exist. There are opportunities for EU meat export to the Far East, yet for a balanced overall evaluation of the prospects of the EU meat industry in these countries, more solid information on (product-specific) market developments and specific requirements to enter these markets successfully is necessary.
17
References OECD-FAO, Agricultural Outlook 2011, Paris, 2011 Muhammad, Andrew, James L. Seale, Jr., Birgit Meade, and Anita Regmi. International Evidence on Food Consumption Patterns: An Update Using 2005 International Comparison Program Data. TB-1929. U.S. Dept. of Agriculture, Econ. Res. Serv. March 2011 Redfern Associates, New Zealand Trade & Enterprise, China Meat report 2010 (April 2010) UNDP (United Nations Development Programme) (2011), Human Development Report 2011. Sustainability and Equity: a better future for all. Palgrave MacMillan, New York. USDA/FAS, China Livestock and Products Annual 2011. Gain report number CH11042, Date 9/2/2011. World Bank (2012) Doing Business report 2012, Doing business in a more transparent world, World Bank /IFC, Washington.

18
ANNEX 1 Imports of meat by Far East countries from major suppliers Table A1. Imports of meat (HS-code 02) by China, South Korea, Taiwan and Japan from major suppliers (2010, in US$, rounded figures) Australia Canada New Zealand USA EU27 China 145 225 100 400 200 Korea 650 100 120 670 240 Taiwan Japan 1800 1200 210 2500 790 Source: UNComtrade

19
ANNEX 2 Questionnaires Questionnaire to EU meat exporters Company specific information, requested in question 1 and 2, will be treated confidentially, and will not be reported in the study in a way that it can be traced back to the individual firm. These questions are included in the questionnaire to (further) categorise the respondents. The study focuses on beef, veal, edible/non-edible offal of bovine animals and of lamb. Please answer the questions with these products in mind, and specify among these products if (you find) necessary. Only question 8 refers to (in principal) all kinds of meat, which you then are requested to specify. Company name and city/country of main office 1. What is the total sales of your company (approximately, range)? 2. What share of total sales is from exports? 3. Which meat products do you export? 4. What are your major markets in the EU? 5. What are your main markets outside the EU? 6. Do you see opportunities to export to China, Taiwan, South Korea, Japan in case these
countries lift the import ban. (Please provide arguments for your assessments and indicate the basis of your assessments (e.g. own market research, market research reports, contacts with clients, etc.). Clarifying the background of your assessments is essential to be useful for this report):
For China: a) Yes, I see opportunities, especially for (beef, veal, edible offal of bovine animals, non-
edible offal of bovine animals, edible offal of lamb, non-edible offal of lamb [pls make a choice]) meat and the possible sales in the first one to three years could be around …… euro per year
b) No, I do not see these opportunities. The major bottlenecks for EU meat to be sold in these countries are (tariffs, public standards and/or requirements [please specify], private standards [please specify], others……)
For Taiwan: a) Yes, I see opportunities, especially for ……..(pls specify the type of meat) meat and
the possible sales in the first one to three years could be around …… euro per year b) No, I do not see these opportunities. The major bottlenecks for EU meat to be sold in
these countries are (tariffs, public standards and/or requirements [please specify], private standards [please specify], others……).
For Japan: a) Yes, I see opportunities, especially for ……...(pls specify the type of meat) meat and
the possible sales in the first one to three years could be around …… euro per year b) No, I do not see these opportunities. The major bottlenecks for EU meat to be sold in
these countries are (tariffs, public standards and/or requirements [please specify], private standards [please specify], others……).
For South Korea:

20
a) Yes, I see opportunities, especially for …….…(pls specify the type of meat) meat and the possible sales in the first one to three years could be around …… euro per year
b) No, I do not see these opportunities. The major bottlenecks for EU meat to be sold in these countries are (tariffs, public standards and/or requirements [please specify], private standards [please specify], others……).
7. Do you have an interest in improved third country market access for (any) meat product in any other country than this study focuses on, and if yes, please indicate what market barrier you face to which country and what meat product(s) (tariff line or description) are affected. Please fill in the following table (extend if necessary) Country Market barrier Meat product(s)
Questionnaire to Asian importers This questionnaire is part of a study that explores the export potentials of EU bovine and ovine products in South Korea, Japan, Taiwan and China. The study is executed by the Dutch Agricultural Economics Research Institute LEI-Wageningen UR. Company name and city/country of main office 1. Which meat products do you import?
2. Where is your imported meat from? (per main meat product category, list two to three
most important countries of origin)
3. Do you have (had) contacts with EU meat suppliers? If so, from which EU countries and what kind of meat did they offer?
4. Do you see opportunities for EU meat of which import is currently banned (bovine and ovine products) to be imported by China, Taiwan, South Korea, Japan (pls indicate the country you are focusing on) in case the import ban for these products is being lifted c) Yes, I see opportunities, especially for ….. [specify] meat and the possible sales in the
first one to three years could be around …… euro or US dollar per year d) No, I do not see these opportunities. The major bottlenecks for EU meat to be sold in
my country are (tariffs, public standards and/or requirements [please specify if possible], private standards [if so, which standards?], other reasons [please specify]).
Next are two questions on company specific information. These are included in the questionnaire to (further) categorise the respondents. This information will be treated confidentially, and will not be reported in the study in a way that it can be traced back to the individual firm. 5. What has been (the range of) the total sales of your company in 2010/2011? 6. What has been (the range of) the total value of imported meat in 2010/2011?