eu bilateral agenda with strategic trade partners razeen sally european centre for international...
TRANSCRIPT
EU BILATERAL AGENDA WITH STRATEGIC TRADE PARTNERS
Razeen SallyEuropean Centre for International Political Economy/
London School of Economics

EU BILATERALS
Trade and FDI patterns
EU bilateral trade policy: Global Europe; Trade, Growth, World Affairs
FTAs in Asia
EU bilaterals: policy issues

EU BILATERALS
EU and strategic trade partners
-- Bilateral trade and FDI
-- Comparative trade barriers

Leading EU27 Import & Export Countries Merchandise trade - Excluding intra-EU trade (2010)
CountryEU Imports + Exports EU Imports from EU Exports to
Rank Mio euro % world Rank Mio euro % world Rank Mio euro % world
World 2 840 684 100.0 1 492 175 100,0 1 348 509 100,0
USA 1 411 649 14.5 2 169 297 11.3 1 242 353 18.0
China 2 395 106 13.9 1 281 996 18.9 2 113 111 8.4
Russia 3 241 424 8.5 3 154 909 10.4 4 86 515 6.4
Switzerland 4 189 556 6.7 5 84 123 5.6 3 105 432 7.8
Japan 6 108 554 3.8 4 64 845 4.3 6 43 709 3.2
Brazil 10 63 566 2.2 10 32 290 2.2 9 31 277 2.3
India 8 67 784 2.4 9 32 991 2.2 8 34 793 2.4
South Korea 9 66 584 2.3 8 38 602 2.6 10 27 981 2.1
Canada 11 46 609 1.6 15 20 045 1.3 14 26 564 2.0
Singapore 12 42 638 1.5 17 18 658 1.3 15 23 981 1.8
Malaysia 23 31 926 1.1 14 20 684 1.4 28 11 241 0.8
Thailand 25 27 172 1.0 19 17 188 1.2 32 9 985 0.7
Indonesia 33 20 065 0.7 23 13 690 0.9 38 6 375 0.5
Vietnam 38 14 072 0.5 32 9 401 0.6 45 4 671 0.3
Philippines 45 9 113 0.3 43 5 373 0.4 49 3 739 0.3
ASEAN - 6 144 986 5.1 84 994 5.8 59 992 4.4

Leading EU27 Import & Export Countries Services trade - excluding intra-EU trade (2009)
CountryEU Imports + Exports EU Imports from EU Exports to
Rank Bln euro % world Rank Bln euro % world Rank Bln euro % world
World 1194.6 100,0 542.9 100,0 651.7 100,0
USA 1 246.3 20.6 1 126.5 23.3 1 119.8 18.4
Canada - 19 1.6 - 8.2 1.5 - 10.8 1.7
China 2 32.4 2.7 2 13.6 2.5 2 18.8 2.9
Japan 3 29.9 2.5 3 13.3 2.4 3 16.6 2.5
Brazil - 15.7 1.3 - 6.5 1.2 - 9.2 1.4
India - 16.6 1.4 - 7.6 1.4 - 9 1.4
Korea* - 12.2 1.0 - 4.4 0.8 - 7.8 1.2
ASEAN - 38.7 3.2 - 18.3 3.4 - 20.4 3.1
* Services figures taken from 2006 and based on 2008 for % world figures.
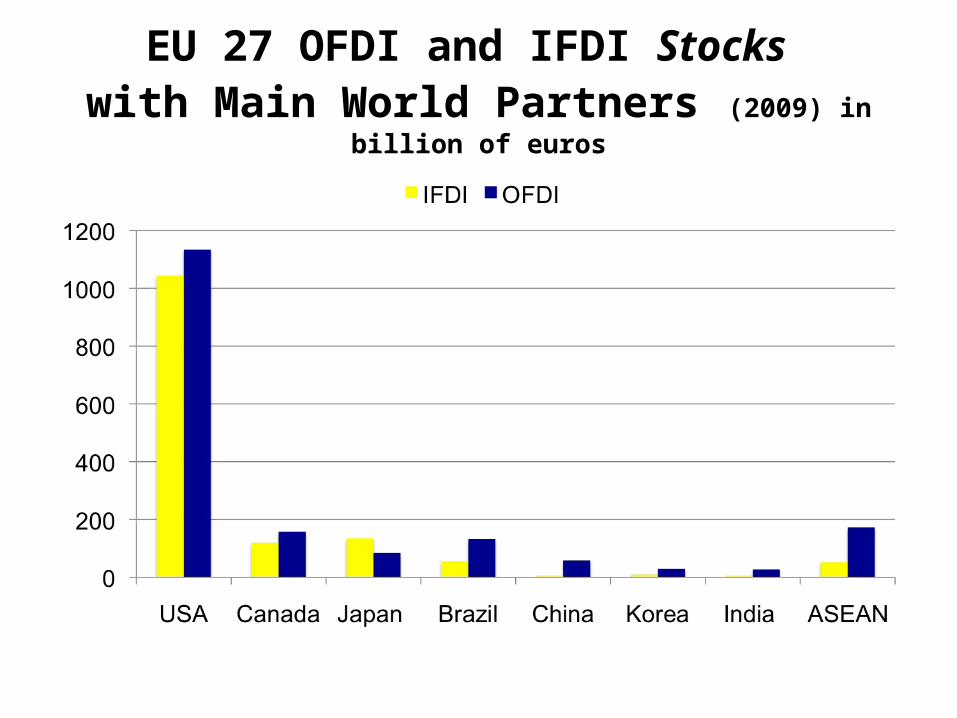
EU 27 OFDI and IFDI Stocks with Main World Partners (2009) in billion of euros

EU 27 OFDI and IFDI Flows with Main World Partners (2009) in billion of euros

Average MFN Applied Tariffs and Bound Rates by Major Sector (2009)
Country/ economy
Binding Coverage (All Goods)
Bound Tariff Rate (All Goods)
Applied Tariff Rate
(Manufactures)
Applied Tariff Rate
(Agriculture)
Overall Applied Tariff
(All Goods)
EU 100.0 5.2 4.0 13.5 5.3
US 100.0 3.5 3.3 4.1 3.5
Canada 99.7 6.7 3.5 10.7 4.5
Japan 99.7 5.1 2.5 21.0 4.9
Brazil 100.0 31.4 14.1 10.2 12.1
Korea 94.6 16.6 6.6 48.6 11.9
China 100.0 10.0 8.7 15.6 9.6
Hong Kong 45.6 0.0 0.0 0.0 0.0
Malaysia 84.3 24.0 7.6 13.5 8.4
Thailand 75.0 28.2 8.0 22.6 9.9
Indonesia 95.8 37.1 6.6 8.4 6.8
Philippines 67.0 25.7 5.8 9.8 6.3
Vietnam 100.0 11.4 9.7 18.9 10.9
Taiwan 100.0 6.4 4.5 16.6 6.1
Singapore 69.7 10.4 0.0 0.2 0.0
India 73.8 48.5 10.1 31.8 12.9
Pakistan 98.7 59.9 13.4 17.1 13.9
Bangladesh 15.5 169.2 14.3 17.6 14.7
Sri Lanka 38.1 30.2 9.2 24.8 11.2
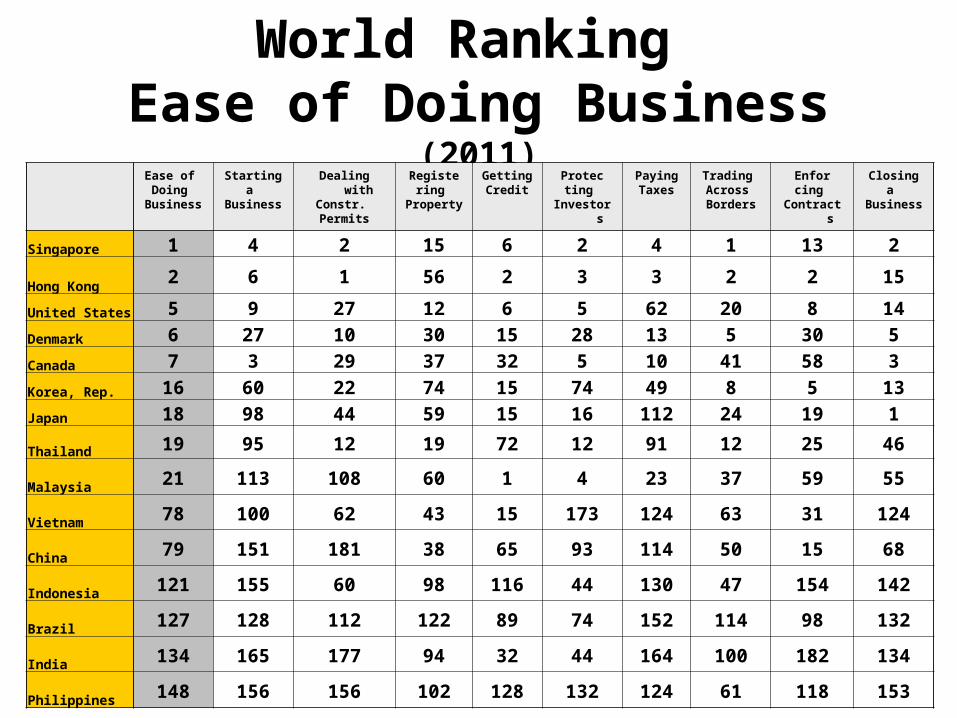
World Ranking Ease of Doing Business (2011)
Ease of Doing
Business
Starting a
Business
Dealing with Constr. Permits
Registering
Property
Getting Credit
Protecting
Investors
Paying Taxes
Trading Across Borders
Enforcing
Contracts
Closinga
Business
Singapore 1 4 2 15 6 2 4 1 13 2
Hong Kong2 6 1 56 2 3 3 2 2 15
United States 5 9 27 12 6 5 62 20 8 14
Denmark 6 27 10 30 15 28 13 5 30 5
Canada 7 3 29 37 32 5 10 41 58 3
Korea, Rep. 16 60 22 74 15 74 49 8 5 13
Japan 18 98 44 59 15 16 112 24 19 1
Thailand 19 95 12 19 72 12 91 12 25 46
Malaysia 21 113 108 60 1 4 23 37 59 55
Vietnam 78 100 62 43 15 173 124 63 31 124
China 79 151 181 38 65 93 114 50 15 68
Indonesia 121 155 60 98 116 44 130 47 154 142
Brazil 127 128 112 122 89 74 152 114 98 132
India 134 165 177 94 32 44 164 100 182 134
Philippines 148 156 156 102 128 132 124 61 118 153

Indicators for Trading Across Borders (2011)
Ease of Trading Across Borders (World
Ranking)
Documents for
export
(number)
Time for
export
(days)
Cost to
export
(US$ per container)
Documents for
Import
(number)
Time for
import
(days)
Cost to import
(US$ per container)
Singapore 1 4 5 456 4 4 439
Hong Kong 2 4 6 625 4 5 600
Korea, Rep. 8 3 8 790 3 7 790
Thailand 12 4 14 625 3 13 795
United States 20 4 6 1,050 5 5 1,315
Japan 24 4 10 1,010 5 11 1,060
Malaysia 37 7 18 450 7 14 450
Canada 41 3 7 1,610 4 11 1,660
Indonesia 47 5 20 704 6 27 660
China 50 7 21 500 5 24 545
Philippines 61 8 15 675 8 14 730
Vietnam 63 6 22 555 8 21 645
India 100 8 17 1,055 9 20 1,025
Brazil 114 8 13 1,790 7 17 1,730
OECD - 4.4 10.9 1,058.70 4.9 11.4 1,106.30

The Enabling Trade Index (2008)
Country
Overall Rank Market Access Border Administration
Transport and Communications
Infrastructre
Business Evironment
Rank Score Rank Score Rank Score Rank Score Rank Score
Singapore 1 6.06 1 5.97 1 6.56 7 5.74 2 6.00
Hong-Kong 2 5.70 16 5.12 6 5.96 5 5.79 5 5.94
Denmark(EU) 3 5.41 95 3.76 3 6,22 8 5.71 3 5.96
Canada 8 5.29 25 4.85 17 5.61 20 5.24 18 5.45
US 19 5.03 62 4.17 19 5.60 11 5.49 37 4.86
Japan 25 4.80 121 3.20 16 5.65 14 5.45 34 4.91
Korea 27 4.72 111 3.63 24 5.24 15 5.37 44 4.65
Malaysia 30 4.71 31 4.71 44 4.57 24 4.95 51 4.59
China 48 4.32 79 3.87 48 4.53 43 4.13 41 4.74
Thailand 60 4.13 113 3.48 41 4.61 40 4.19 71 4.24
Indonesia 68 3.97 60 4.21 67 3.99 85 3.28 60 4.42
Vietnam 71 3.96 50 4.41 88 46 68 3.62 64 4.34
India 84 3.81 115 3.42 68 3.98 81 3.24 58 4.48
Brazil 87 3.76 104 3.72 80 3.70 66 3.64 83 4.00
Philippines 92 3.72 64 4.13 74 3.82 83 3.31 103 3.61

EU BILATERALS EU bilateral trade policy
- Global Europe: economic/commercial rationale; WTO plus; but also non-trade motives; differences with EPAs/MENA
- Trade, Growth, World Affairs: Update and fleshing out; more emphasis on big trading partners, stronger provisions on regulatory market access in bilateral agreements and stronger trade enforcement- Benchmarks for (relatively) strong, clean FTAs and non-FTA frameworks with other strategic trade partners- How serious is the economic/commercial logic? - Market access and non-trade motives (labour/environmental standards; “sustainable development”; climate change etc.)- Comparisons with US FTAs on WTO plus issues; implications for EU
trade policy after the Lisbon Treaty- Overall context: no substitute for intra-EU reforms and multilateral
progress; otherwise narrow mercantilism, trade diversion, spaghetti/ noodle bowls

Status of EU FTAs and their share of EU trade (%)
REGIONS AND FTA STATUSIndustrial products* Agricultural products**
Imports (%) Exports (%) Imports (%) Exports (%)
OPERATIONAL FTAS 22.3 27.7 24.3 29.1
Chile, Mexico, South Africa
Developing country FTAs
2.5 3.4 5.7 2.2
Andorra, San Marino, Turkey, Iceland, Liechtenstein, Norway, Switzerland
EFTA and customs Unions
14.6 15.9 11.6 14.6
Caribbean ACP EPAs 0.3 0.3 1 0.6
Algeria, Egypt, Israel, Jordan, Lebanon, Morocco, Occupied Palestinian Territory, Tunisia
Mediterranean countries, FTAs
4 5.9 4.5 7.9
Albania, Bosnia and Herzegovina, Croatia, Former Yugoslav Republic of Macedonia, Montenegro, Serbia
Western Balkans, Stabilisation and Association Agreements
0.9 2.2 1.5 3.7
FTA NEGOTIATIONS CONCLUDED BUT NOT YET APPLIED, ONGOING AND PLANNED FTA NEGOTIATIONS
21.8 25.6 56.2 26.2
Bolivia, Ecuador, Peru, Colombia
Andean Community 0.4 0.6 5.3 0.4
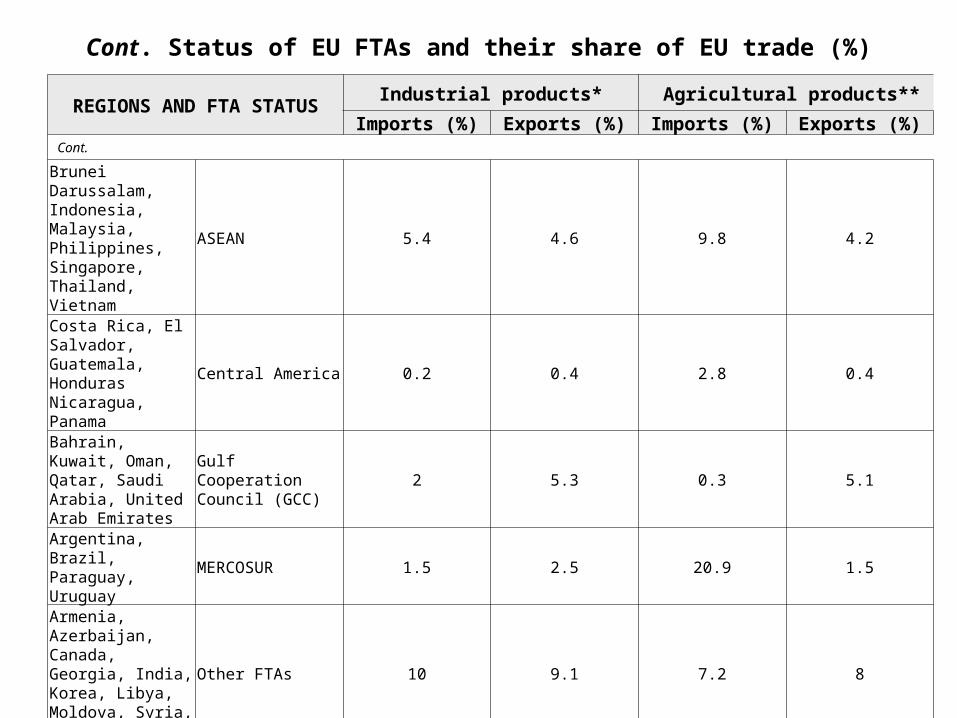
Cont. Status of EU FTAs and their share of EU trade (%)
REGIONS AND FTA STATUSIndustrial products* Agricultural products**
Imports (%) Exports (%) Imports (%) Exports (%)Cont.
Brunei Darussalam, Indonesia, Malaysia, Philippines, Singapore, Thailand, Vietnam
ASEAN 5.4 4.6 9.8 4.2
Costa Rica, El Salvador, Guatemala, Honduras Nicaragua, Panama
Central America 0.2 0.4 2.8 0.4
Bahrain, Kuwait, Oman, Qatar, Saudi Arabia, United Arab Emirates
Gulf Cooperation Council (GCC)
2 5.3 0.3 5.1
Argentina, Brazil, Paraguay, Uruguay
MERCOSUR 1.5 2.5 20.9 1.5
Armenia, Azerbaijan, Canada, Georgia, India, Korea, Libya, Moldova, Syria, Ukraine
Other FTAs 10 9.1 7.2 8
ACPs less Caribbean EPAs 2.3 3.2 10.5 6.6
NO FTAS 55.8 46.7 19.5 44.7
Australia, China, Japan, New Zealand, Russia, United States
Major trading partners 50.3 38.6 16.6 35.8
Rest of the World (~ 70 countries)
5.5 8.1 2.9 8.9

FTAs IN ASIA FTAs - Context: stalled liberalisation; creeping regulatory
protectionism (partly crisis-related); from non- discriminatory liberalisation to discriminatory FTAs- Proliferation in Asia; catch up with other regions- Motives: foreign policy; WTO stalled; building blocks to
regional and global economic integration?- Trade-lite FTAs (except with USA and EU?): focus on tariff
liberalisation/elimination – but neglect of non-tariff and regulatory barriers; risks of trade distortions but limits to trade/investment creation and dynamic gains

FTAs IN ASIA Asian FTA players
-- China: trade-lite (eg., China-ASEAN to partial-scope agreements)
-- Japan: also trade lite; unambitious on market access and big carve outs
-- South Korea: more serious, e.g. US and EU FTAs-- ASEAN: Singapore the exception, otherwise weak FTAs;
bilaterals take priority over ASEAN+1 FTAs-- India: v. weak FTAs; part of overall defensive trade policy

REGIONAL ECONOMIC INTEGRATION IN ASIA
Regional economic integration
- APEC: diverse, unwieldy, diffuse agenda; FTAAP unlikely
- ASEAN: Visions galore, but where’s the beef? CEPT progress; AFAS, AIA weak; little progress on regulatory barriers; AEC and ASEAN Charter: paper tigers?
- SAFTA: v. trade-light (excludes over half of trade); risks trade diversion; throttled Indo-Pak trade
- TPP: Building bloc to wider Asia-Pacific FTA?; odds against a deep-integration FTA; US demands on labour and
environmental standards; excludes China – divisive economically and geopolitically?

REGIONAL ECONOMIC INTEGRATION IN ASIA
• Regional economic integration (cont.)
- Wider regional integration initiatives: Northeast Asian FTA; ASEAN plus 3; ASEAN plus 6
- The case for a region-wide FTA: specialisation; economies of scale and
dynamic gains; reduce trade diversion from noodle bowl; all depends on a comprehensive, WTO-plus FTA
- But it could compromise global integration, esp. processing trade and extension of global supply chains
- Huge economic and political differences in Asia make clean, strong FTAs very unlikely; rather trade-light FTAs adding to noodle bowl
- Conclusion: FTAs unlikely to contribute much to regional economic integration; reliance on bilateral FTAs; disintegration dangers
EU BILATERALS
• EU bilaterals: policy issues
-- USA: tariffs and NTBs
-- Canada: FTA
-- Mercosur and other FTAs in Latin America
-- GCC
-- Russia and Ukraine
-- Low-income countries and LDCs (EPAs, GSP, GSP+, EBA)

EU-ASIA FTAs EU-Korea
-- Estimated effects: tackling NTBs-- Comprehensive tariff elimination; short transition periods-- Ban on export restraints-- Sector-specific agreements to tackle NTBs-- FDI, GATS-plus, govt. procurement, IPR enforcement, competition
(state aids), dispute settlement-- Trade and Sustainable Development-- Regulatory transparency
EU-ASIA FTAs EU-ASEAN
- Estimated FTA effects: crucial to tackle NTBs and have major services liberalisation- Existing bilateral cooperation framework: TREATI and PCAs- From TREATI to FTA- EU-ASEAN talks failed: v. low ASEAN common denominator and lack of common negotiating machinery- EU-Singapore FTA: strong FTA likely- EU-Malaysia/Vietnam/Indonesia/Philippines/Thailand: big challenge to negotiate strong FTAs- Limited gains from such bilateral FTAs; risks of trade distortions
EU-ASIA FTAs EU-India
- Estimated effects
- Extreme difficulty of negotiating strong FTA with India, esp. on NTBs and regulatory issues
- Issues: agriculture; NAMA; services; investment, other WTO plus issues, NTBs
- Indian concerns on labour and environmental standards

EU-ASIA FTAs
• EU-Japan
-- Tariffs and NTBs: views from both sides
-- Lack of Japanese ambition
-- Moving towards an FTA negotiation?

EU BILATERALS EU-China
- FTA not on the cards
- Existing bilateral cooperation framework (PCA, regulatory dialogues up to HLD): too soft; how to strengthen?
- Avoid non-trade linkages; don’t exaggerate macroeconomic issues (bilateral deficit and exchange
rate)
- Focus on market access, esp. regulatory issues
- Both EU and China have legitimate market-access issues
EU BILATERALS
• EU-China (cont.): issues-- Raw materials and export restraints
-- Services
-- Investment (both ways)
-- IPR
-- Government Procurement
-- Norms and standards (both ways)
-- Subsidies
-- MES and trade remedies
-- Better prioritising and constructing quid pro quos

EU BILATERALS
• EU-China: Conclusion
-- Better prioritising and constructing quid pro quos
-- Constructive reciprocity vs. destructive reciprocity (threatening punitive measures)
-- Better bilateral relations if stalled domestic reforms are revived