ettw klara foti - impact on public services - intra-eu mobility conference - riga -110515
TRANSCRIPT

Coordinating the Network of EU Agencies 2015
The social dimension of intra-EU mobility: Impact on public services
Klára Fóti, Research Manager, Eurofound, LCQL
‘How to Improve Intra-European Mobility and Circular Migration? Fostering Diaspora Engagement’
High-level expert conference
Riga, 11th -12th of May 2015

Coordinating the Network of EU Agencies 2015
Background• Research evidence on welfare dependency (migrants
relying more on welfare services than natives): it could be reduced when migrants are successfully included
• What is the situation with mobile EU citizens* in terms of their inclusion, especially in light of the fact that there are no inclusion measures in place in most of the EU15, targeted specifically at them?
• Initially, high employment rate, but this changed dramatically after the crisis – large job loss and more reliance on welfare services –
• The issue became politicised in some host countries, therefore high on the agenda
Coordinating the Network of EU Agencies 2015
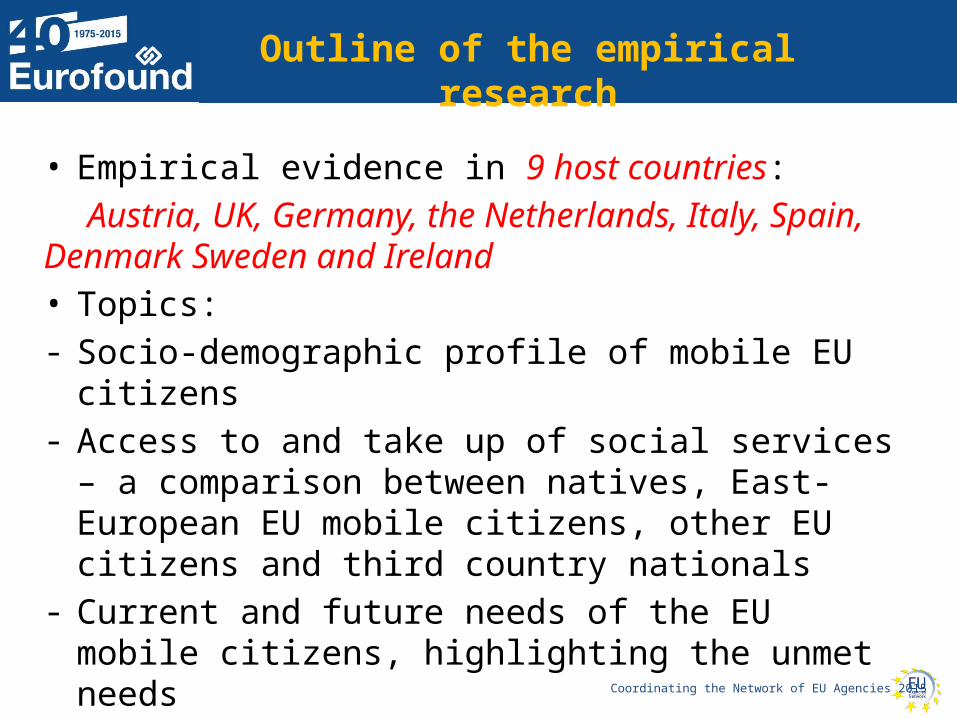
• Empirical evidence in 9 host countries:Austria, UK, Germany, the Netherlands, Italy,
Spain, Denmark Sweden and Ireland • Topics:- Socio-demographic profile of mobile EU citizens- Access to and take up of social services – a
comparison between natives, East-European EU mobile citizens, other EU citizens and third country nationals
- Current and future needs of the EU mobile citizens, highlighting the unmet needs
Outline of the empirical research

Coordinating the Network of EU Agencies 2015
Quantitative part- Data on socio-demographic
profile of East-European EU mobile citizens (EU10= EU8+2) – based on census and/or other (admin.) sources
- Data on take-up of services for this group (compared to the other groups) – based on administrative data and other sources
Qualitative part- Impact on and needs of
services: interviews with government representatives, service providers and their social partners
- Current and future needs of EU mobile citizens: interviews with migrant organisations and individual citizens
Methodology
Coordinating the Network of EU Agencies 2015
THE EXTENT OF IMMIGRATION OF EU10 CITIZENS INTO KEY HOST COUNTRIES OF EU15 AND THEIR COMPOSITION (AGE) -
DATA & EXAMPLES

Coordinating the Network of EU Agencies 2015
DK DE IE ES IT NL AT SE UK0
200000
400000
600000
800000
1000000
1200000
1400000
0
1
2
3
4
5
6
63898
1200000
225962
11751381128511
126643
158037 143075
1328250
1.1
1.6
5
2.5
1.9
0.8
2
1.5
2.1
Total
Their total share in popula-tion (%)
Number and share of EU10 citizens in the 9 host countries
Source: Own calculations, based on Eurostat data
Coordinating the Network of EU Agencies 2015
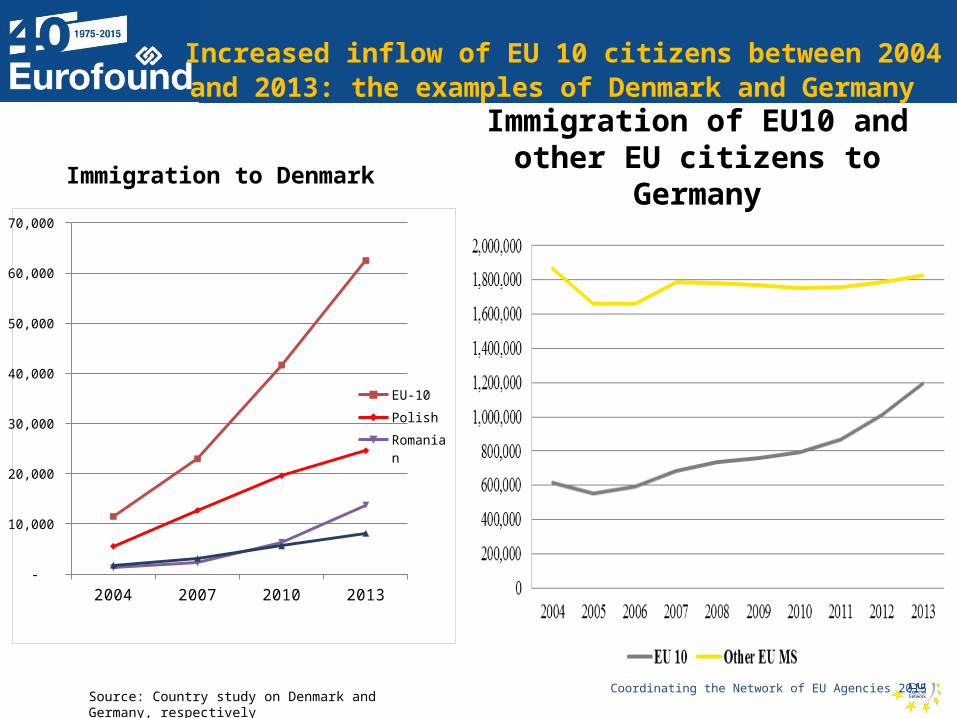
Increased inflow of EU 10 citizens between 2004 and 2013: the examples of Denmark and Germany
Immigration to Denmark Immigration of EU10 and other EU citizens to Germany
•
2004 2007 2010 2013 -
10,000
20,000
30,000
40,000
50,000
60,000
70,000
EU-10
Polish
Romanian
Lithuanian
Source: Country study on Denmark and Germany, respectively

Coordinating the Network of EU Agencies 2015
Age distribution of EU10 citizens, compared to natives other EU citizens and TCNs – the example of the UK
Age distribution of EU10 and UK native citizens
Age distribution of third country nationals and EU16 in the UK
Source: UK country study
Coordinating the Network of EU Agencies 2015
EMPLOYMENT LEVEL AND IMPACT OF CRISIS ON ITS TRENDS
Coordinating the Network of EU Agencies 2015
EU28 EU27 EU15 DK DE IE ES IT NL AT SW UK
0
10
20
30
40
50
60
70
80
90
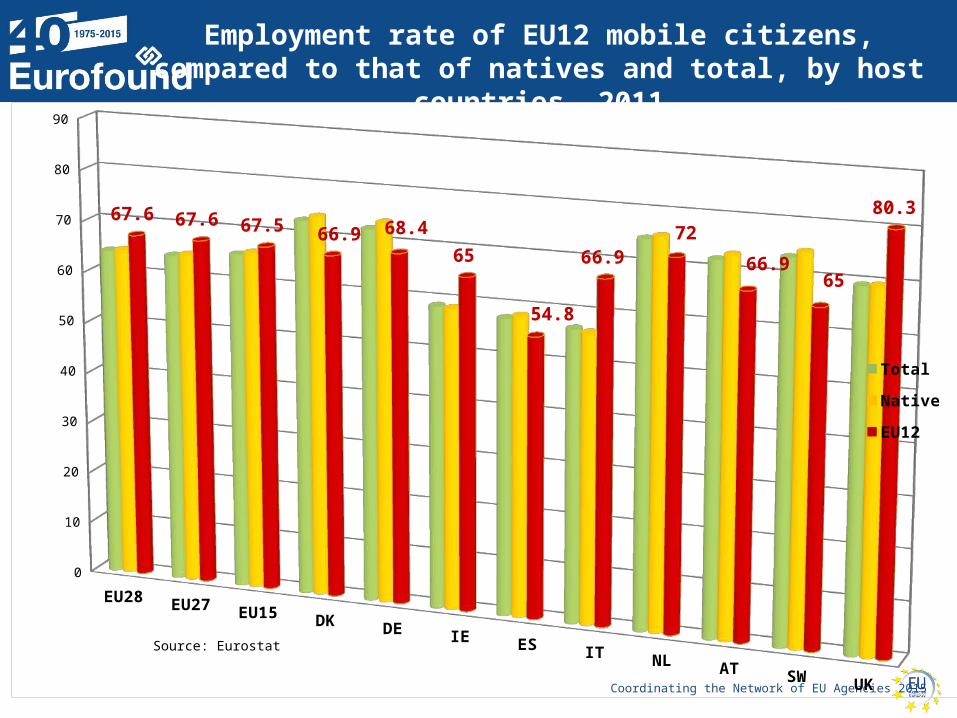
67.6 67.6 67.5 66.9 68.465
54.8
66.972
66.965
80.3
Total
Native
EU12
Source: Eurostat
Employment rate of EU12 mobile citizens, compared to that of natives and total, by host countries, 2011

Coordinating the Network of EU Agencies 2015
Native empl rate
EU12 empl rate Native empl rate
EU12 empl rate Native empl rate
EU12 empl rate Native empl rate
EU12 empl rate Native empl rate
EU12 empl rate
2007 2008 2009 2010 2011
62.0
64.0
66.0
68.0
70.0
72.0
74.0
Impact of the crisis on employment in EU15: declining rates both for natives and EU12 mobile citizens
Source: Own calculations, based on Eurostat data

Coordinating the Network of EU Agencies 2015
Native empl rate
EU12 empl rate Native empl rate
EU12 empl rate Native empl rate
EU12 empl rate Native empl rate
EU empl rate Native empl rate
EU12 empl rate
2007 2008 2009 2010 2011
55.0
60.0
65.0
70.0
75.0
Impact of the crisis on employment : the example of Germany
Source: Own calculations based on Eurostat data

Coordinating the Network of EU Agencies 2015
Impact of the crisis on employment: the examples of Ireland and the UK
Ireland’s example The UK’s example
Native empl rate
EU12 empl rate
Native empl rate
EU12 empl rate
Native empl rate
EU12 empl rate
Native empl rate
EU empl rate
Native empl rate
EU12 empl rate
2007 2008 2009 2010 2011
0.0
10.0
20.0
30.0
40.0
50.0
60.0
70.0
80.0
90.0
Native empl rate
EU12 empl rate
Native empl rate
EU12 empl rate
Native empl rate
EU12 empl rate
Native empl rate
EU empl rate
Native empl rate
EU12 empl rate
2007 2008 2009 2010 2011
60.0
65.0
70.0
75.0
80.0
85.0
Source: Own calculations based on Eurostat data

Coordinating the Network of EU Agencies 2015
Impact of the crisis on employment: the examples of Spain and Italy
Spain’s example Italy’s example
Native empl rate
EU12 empl rate
Native empl rate
EU12 empl rate
Native empl rate
EU12 empl rate
Native empl rate
EU empl rate
Native empl rate
EU12 empl rate
2007 2008 2009 2010 2011
0.0
10.0
20.0
30.0
40.0
50.0
60.0
70.0
80.0
Native empl rate
EU12 empl rate
Native empl rate
EU12 empl rate
Native empl rate
EU12 empl rate
Native empl rate
EU empl rate
Native empl rate
EU12 empl rate
2007 2008 2009 2010 2011
0.0
10.0
20.0
30.0
40.0
50.0
60.0
70.0
80.0
Coordinating the Network of EU Agencies 2015
IMPACT OF CRISIS ON ACCESS TO AND TAKE-UP OF SOCIAL SERVICES

Coordinating the Network of EU Agencies 2015
Increased number of unemployment benefit recipients in several host countries - Germany
Total German EU8 EU2 other EU mobile citizens TCN
-50%
0%
50%
100%
150%
200%
Number of beneficiaries of ALG I and/or AlgW Number of beneficiaries of ALG I Number of beneficiaries of AlgW
Growth of yearly average number of unemployment benefit recipients in Germany between 2007 and 2013
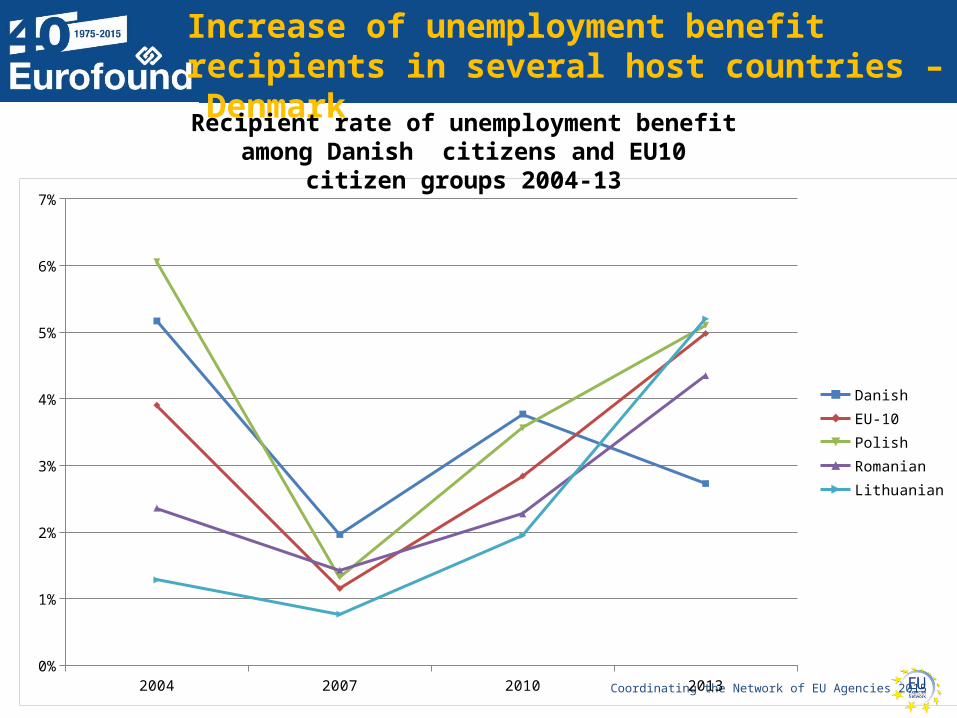
Coordinating the Network of EU Agencies 20152004 2007 2010 20130%
1%
2%
3%
4%
5%
6%
7%
DanishEU-10PolishRomanianLithuanian
Increase of unemployment benefit recipients in several host countries – Denmark
Recipient rate of unemployment benefit among Danish citizens and EU10 citizen groups 2004-13

Coordinating the Network of EU Agencies 2015
Higher unemployment benefit and employment measures recipient rate than natives: Sweden
Unemployment benefit
Employment measures
Lithuania 3.9% 3.6%
Poland 4.7% 4.7%
Romania 5.3% 5.9%
Sweden age 16-64 4.4% 4.5%EU10 age 16-64
5.3% 5.5%
Recipient rate of unemployment benefit and employment measures in Sweden among the top three EU10 nationalities, EU10 citizens and
natives in 2012
Coordinating the Network of EU Agencies 2015
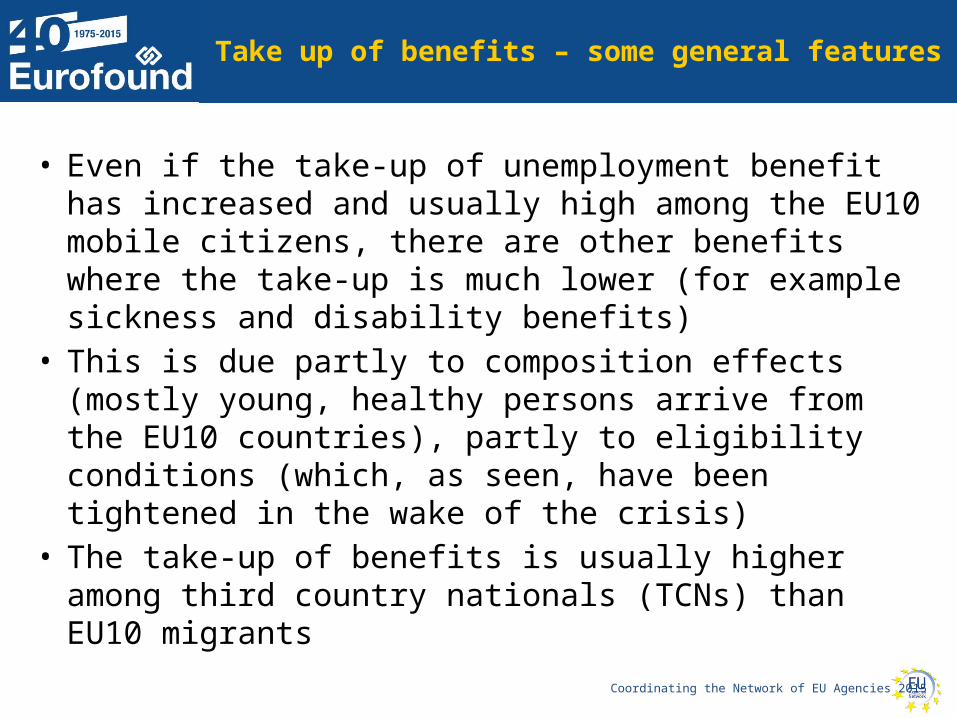
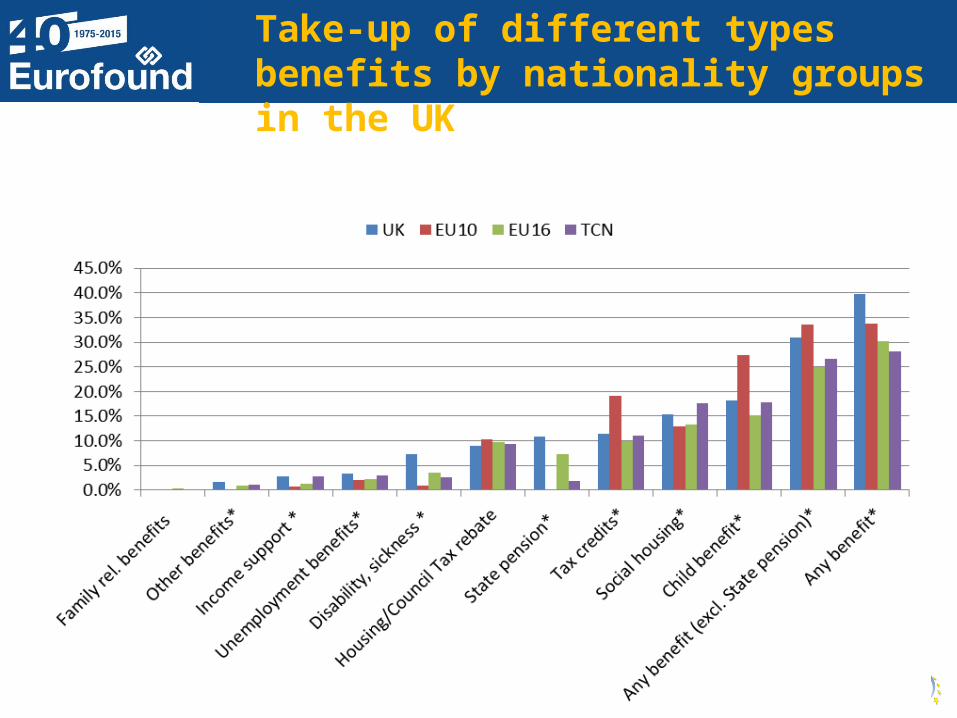
Take up of benefits – some general features
• Even if the take-up of unemployment benefit has increased and usually high among the EU10 mobile citizens, there are other benefits where the take-up is much lower (for example sickness and disability benefits)
• This is due partly to composition effects (mostly young, healthy persons arrive from the EU10 countries), partly to eligibility conditions (which, as seen, have been tightened in the wake of the crisis)
• The take-up of benefits is usually higher among third country nationals (TCNs) than EU10 migrants

Coordinating the Network of EU Agencies 2015
Natives EU-10 Poland Bulgaria Romania EU-15 Candidate member-states
0
2
4
6
8
10
12
Social assistanceUnemploymentOccupational disability
Take up of benefits by natives, EU10 mobile citizens and some other migrants groups:
The example of the Netherlands, 2012
Source: Country study, the Netherlands, Figure 4.2.,p. 21
Coordinating the Network of EU Agencies 2015
Take-up of different types benefits by nationality groups in the UK

Coordinating the Network of EU Agencies 2015
- Unmet needs can be found mostly in areas such as information provision and language services
- Tension arose at local level in the wake of EU citizens’ increased concentration in certain areas (UK, Germany)
- Staff in service providers need better and more training on the regulations concerning EU mobile citizens (some confusion was reported due e.g. to too many changes)
Key findings from interviews
Coordinating the Network of EU Agencies 2015
• There is a need to understand better the reasons behind perceptions of the impact of increased inflow of EU10 nationals. For example, the issue of “localisation” of tension in certain services (schools) should be explored in more detailed to find out how to address it – primarily by local measures with help of the central government and possibly EU funds
• More attention should be directed towards inclusion measures, for example language courses and information provision not only to facilitate better labour market and social integration, but also to prevent destitution
• More awareness is needed to tackle vulnerability at arrival and later at the work place (crucial role of trade unions), which could have serious implications for need for social services
• The issue of abuse of trafficking organisations/agencies has to be addressed
Some (draft) conclusions
Coordinating the Network of EU Agencies 2015
Future patterns
• Longer stay in the country and consequences of current composition: more demand on schooling, social housing and public employment services;
• However, in case of recovery (economic boom in some countries), less tension, may be less inflow;
• Consequences of further enlargement (e.g. end of transition period for Croatian nationals) – still unknown, but perceptions may depend partly on the prevailing economic conditions;
• In short/medium term, side effects of mobility will remain high on the agenda, and the EU, together with the Member States, should play a proactive role in addressing major challenges ahead, by facilitating inclusive measures