ethanol and soda pulping of tagasaste wood: … · proliferus l.f. ssp palmensis) trimming...
TRANSCRIPT
CELLULOSE CHEMISTRY AND TECHNOOGY
Cellulose Chem. Technol., 43 (7-8), 295-306 (2009)
ETHANOL AND SODA PULPING OF TAGASASTE WOOD:
NEURAL FUZZY MODELING
ASCENSIÓN ALFARO, ANTONIO PÉREZ,* JUAN C. GARCÍA,*
FRANCISCO LÓPEZ,* MINERVA A. M. ZAMUDIO* and ALEJANDRO RODRÍGUEZ**
Department of Agroforestry Sciences, Faculty of Experimental Sciences, University of Huelva, Huelva, Spain
*Department of Chemical Engineering, Faculty of Experimental Sciences, University of Huelva, Huelva, Spain
**Department of Chemical Engineering, Campus of Rabanales, C-3, University of Córdoba, Córdoba, Spain
Received July 29, 2009 A central composite experimental design, in conjunction with the ANFIS Edit Matlab 6.5 software (to develop a neural fuzzy model), was used in the study of the influence of ethanol and alkaline soda pulp process variables on the properties of pulps and paper sheets obtained from tagasaste (Chamaecytisus proliferus L.F. ssp palmensis) trimming residues. A variation range, involving three independent variables at three different (variation) levels, was established for each process variable (viz. temperature, cooking time and soda or ethanol concentration). The obtained models reproduced the experimental results of the dependent variables with errors below 8%. Under optimum experimental conditions, the yield of the ethanol process is 4% higher than that of the soda process. On the other hand, soda pulp has a higher α-cellulose content and a lower lignin content than ethanol pulp. The optimum conditions for the soda process involve a temperature of 180 ºC, a cooking time of 60 min and an active alkali concentration of 16%, while those of the ethanol process are: 185 ºC, 90 min and a 60% v/v ethanol concentration. The results obtained recommend the tagasaste trimmings as an effective raw material for obtaining paper pulp by ethanol and alkaline soda pulp processes. Keywords: ethanol pulping, neural fuzzy modeling, soda pulping, tagasaste INTRODUCTION
The pulp and paper industry is one of the most influential economic sectors in industrialized countries. In recent years, the European paper industry has turned over more than 70 billion euro and employed more than 250 000 workers in nearly one thousand companies and more than 1200 factories (CEPI, 2003). The world production of paper pulp in 2005 reached 188.15 million tons, of which 26% only in Europe (EU-15) (FAO forestry, 2007). The production of such pulp amounts in Europe (EU-15) required more than 34.96 million tons of raw materials, of which 98.5% were
obtained from tree species and 1.5% from other fibre sources (FAO forestry, 2007). The application of unsustainable forestry practices to obtain the wood needed for pulp and paper manufacturing has a strong environmental impact, such as deforestation and soil degradation. Thus, soil degradation has become an important problem in Europe: 12% of the total European land area has been affected by water erosion and 4% by wind erosion.1 The interactions between climate change and soil degradation are believed to be a primary cause of the frequent droughts, disastrous floods, and related environmental

Ascensión Alfaro et al.
296
problems.2 The possible solutions involve agricultural sustainability, namely utilization of natural resources to enhance progressively the productive capacity without jeopardizing future potential. For example, leguminous species help to the recovery of the already degraded grounds, as a result of biological nitrogen fixation, while the symbiosis between bacteria and plants is the main way of preserving nitrogen in the biosphere. Woody legumes can prevent erosion, increase soil fertility and facilitate the establishment and growth of other plant species.3,4
From this perspective, the use of tagasaste (Chamaecytisus proliferus L.F. ssp palmensis) in soil restoration has been studied in several countries, to assure protection against wind and erosion control,5 to improve soil salinity6 and increase soil fertility by nitrogen fixation or contribution of nutrients.7,8 Tagasaste, a fast-growing leguminous shrub from the Canary Islands (Spain), frequently used in agroforestry systems, can produce protein-rich foliage for livestock and pods bearing edible seeds, even in regions in which adverse climatological conditions might hinder the growth of other forage species.9,10 Tagasaste can grow in a wide range of soils, but preferentially in sandy, well-drained, moderately acidic (pH 5-7) surface soils rich in organic matter. It is quite resistant to the action of the wind. Finally, it forms root nodules with rhizobium bacteria present in the soil.11
Moreover, the use of fast-growing species for pulp production may offer some advantages if they could provide a solution for environmental problems associated with the industrial use of such vegetable species.12 These species are also important due to the shorter time required to activate production, in comparison with woody plants.
A central composite experimental design was used in the present investigation, in conjunction with the ANFIS Edit Matlab 6.5 software, to develop a fuzzy neural model for studying the influence of ethanol and alkaline soda pulp process variables on the properties of pulps (yield, kappa index, lignin, cellulose) and paper sheets (brightness) obtained from tagasaste
(Chamaecytisus proliferus L.F. spp palmensis) trimming residues. The only references on the use of tagasaste wood for pulp and papermaking are cited.13-15 Environmental issues and the need for economical, small-scale methods led to sulphur-free delignification methods, such as the soda semi-chemical and the ethanol-based organosolv method, regarded as the most promising alternatives to the existing sulphur-based chemical pulping methods.16-19
EXPERIMENTAL Raw material, pulping procedure
Branches and twigs, 0.5-5 cm in diameter, obtained by trimming tagasaste (Chamaecytisus proliferus L.F. ssp palmensis) plants from which leaves and non-wood twigs were removed prior to grinding in a hammer mill, were used in the experiments. The material was collected from several experimental lots in the municipality of Trigueros (Huelva, Spain).
In a previous step, tagasaste trimmings had been characterized chemically, and found to contain 80.3% holocellulose, 40.4% cellulose and 18.5% lignin, on a dry mass basis.15
The pulps were obtained in a batch digester wrapped in an electrically heated jacket with rotary agitation. The control unit included temperature and pressure gauges, as well as appropriate safety devices. The sequence of steps in the soda pulping process was as follows: after cooking, the pulp was filtered and washed with abundant water on a screening tray, defiberized to 1.5% consistency and passed through a Sprout-Waldrom refiner operating at 0.5% pulp consistency, on using a disk spacing of 0.1 mm. The uncooked material was removed by passage through a Steiner filter of 0.4 mm mesh size, while water was eliminated through centrifugation. The ethanol process involved the same steps, except for washing and disintegration. Thus, ethanol pulp was washed with a solution of ethanol at the same concentration as in the cooking liquor, on a grid tray, and subsequently disintegrated in an aqueous solution of ethanol, again at the same concentration as in the cooking liquor. Pulp characterization
The two types of pulp thus obtained were analysed for yield and kappa number, as well as for lignin and α-cellulose, according to Tappi standards T236 cm-85, T222 om-98 and T203 om-93, respectively. Pulp samples were previously prepared in accordance with Tappi

Wood
297
standard T220 sp-96. The resulting paper sheets were analysed for brightness (Tappi standard T525 om-92), following conditioning according to Tappi standard T218 sp-97. Experimental design for pulping conditions
To relate the independent variables (operating conditions) to the dependent ones (pulp and paper properties), using the smallest possible number experiments, a central composite design was ap-
plied to construct fuzzy neural models in terms of the independent variables.
First, the starting operating conditions were selected and their ranges of variation were
defined. Three independent variables were used at three different levels (viz. a lower value, a central one and an upper one, equidistant to one another) for both the soda process and the ethanol one. The ensuing empirical model should be able to predict the response of the pulping process to changes in the independent variables within the established limits.20
Table 1 lists the variables used in soda and ethanol processes, and their ranges of variation, selected from literature for various materials.13,14
The statistical study of the obtained results has been based on a neural fuzzy modeling application.
Table 1
Operation conditions and variation intervals
Operation conditions Soda Ethanol Temperature (ºC) 170-190 170-200 Process time (min) 30-90 45-135 Concentration (%), 12-20 40-80
The integration of fuzzy systems21 and neural
networks22 combines the advantages of the two systems and provides an especially powerful modeling tool, namely the neural fuzzy system, which uses neural networks as tools in fuzzy
systems. The generic equation23 is adapted to the variation of pulp properties as a function of the operational variables of the pulping process, with the following expression for three operational variables:
Ye = (c1R1+c2R2+…….+ c7R7+c8R8)/(R1+R2+…….+ R7+R8) (1) where Ye is the estimated value of the output variable (dependent variables), R1 to R8 – the fuzzy rules, c1 to c8 – constant terms (single defuzzifier). The eight fuzzy rules are: R1: low T, low t and low E; R1 = T1·t1·E1 R2: low T, low t and high E; R2 = T1·t1·E2 R7: low T, high t and high E; R7 = T1·t2·E2 R8: high T, high t and high E; R8 = T2·t2·E2 where T1 and T2, t1 and t2, and E1 and E2 stand for the low and high values of the linear membership function temperature, time, and soda or ethanol concentration, respectively. This linear membership function takes the form:
)XX()XX(
11X lowlowhigh
1 −⋅−
−=
)XX()XX(
1X lowlowhigh
2 −⋅−
= (2)
where X is the absolute value of temperature, time or soda/ethanol concentration; X1 – the value of T1, t1 or E1; X2 – the value of T2, t2 or E2, and xhigh and xlow – the extreme values of the variable involved.
When the neural fuzzy models obtained by linear membership functions for the three operational variables fail to acceptably predict the experimental results for the dependent variables, a Gaussian membership function at three levels (low, medium and high) can be employed for one of the variables, and a linear membership function at two levels (low and high) – for the other two. The resulting Eq. (1) thus comprises 12 terms in the numerator and 12 in the denominator. The Gaussian membership function will take the form:
(3)
where X is the absolute value of the variable concerned; xc – its minimum, medium, or maximum value, and L – the width of its Gaussian distribution.
The constants in Eq. (1) were estimated with the ANFIS (Adaptative Neural Fuzzy Inference System) Edit tool in the Matlab 6.5 software suite (The Mathworks, Inc., Natick, MA).
RESULTS AND DISCUSSION
Table 2 shows the values of the independent variables used in accordance

Ascensión Alfaro et al.
298
with the proposed experimental design, as well as the properties of the pulp and paper sheets obtained by soda and ethanol processes.
Each experimental datum was the average of 5 values for pulp chemical properties, and 12 for paper brightness. Deviations from the respective means never exceeded 5%.
Table 3 shows the maximum and minimum yield, kappa number, α-cellulose and lignin contents, and pulp brightness obtained using the experimental design for soda and ethanol processes, with the percent differences between the two given in brackets.
Generally, the yields were slightly higher for the soda than for the ethanol process. The increased delignification ability of soda was reflected in the small kappa numbers obtained by using this reagent in the cooking liquor.
Ethanol pulp contains less α-cellulose and slightly more lignin than soda pulp; therefore, the former should exhibit higher strength and slightly higher brightness than the latter. However, if the α-cellulose–yield and lignin–yield pairs are considered (Table 3), the results of the ethanol process are very close to those of the soda process as to the amount of pulp obtained and, even better, as to the lignin ratio.
As evidenced by the variation ranges of brightness in the paper sheets listed in Table 3, soda pulp led to slightly higher brightness values.
For the sake of comparison, Table 4 shows the results for the two types of pulp obtained under the optimum conditions of both processes. Under such conditions, the yield of the ethanol process was 4.1% higher than that of the soda one, possibly because ethanol is a more selective reagent than soda, reacting only to a very small extent with cellulose and hemicelluloses.17,24 In this respect,25 ethanol appeared as potentially acting as a cellulose protector during delignification of cotton lignocellulosic fibres cooked with a mixture of water and ethanol.
Thus, although the ethanol pulp obtained by the Alcell process has a higher kappa number than the kraft pulp, the amount of residual lignin remaining in the former is similar to that initially present in wood, so that bleaching to commercial brightness levels is easier.27
The kappa number for ethanol pulp was much higher than that for soda pulp; however, one should bear in mind that organosolv pulp is usually easier to bleach.26
Table 2 Values of independent variables used and pulp properties obtained in ethanol and soda processes
Ethanol process
Experiment Tª t c Yield (%)
Kappa index
Lignin (%)
Cellulose (%)
Brightness (%)
1 185 90 60 42.9 59.5 6.90 71.8 22.4 2 185 90 80 40.2 59.8 7.70 72.9 20.8 3 185 90 40 43.0 57.1 7.50 77.0 23.5 4 185 135 60 41.7 57.0 6.00 76.7 23.0 5 185 45 60 38.8 63.9 7.80 68.6 22.9 6 200 90 60 42.7 47.4 5.10 80.0 23.3 7 170 90 60 44.5 68.0 8.70 65.1 23.1 8 200 135 80 43.9 45.0 5.90 75.0 18.5 9 200 135 40 31.6 55.9 6.00 64.1 24.3
10 200 45 80 43.5 62.9 5.90 68.9 17.7 11 170 135 80 39.8 71.7 7.10 55.6 21.2

Wood
299
12 170 45 40 48.3 72.4 12.6 60.4 22.6 13 170 45 80 45.6 69.5 11.5 49.4 22.5 14 170 135 40 44.9 65.6 9.80 71.4 22.2 15 200 45 40 37.0 44.2 6.20 68.7 24.8
Soda process
Experiment Tª t c Yield (%)
Kappa index
Lignin (%)
Cellulose (%)
Brightness (%)
1 180 60 16 41.2 26.5 5.50 82.4 30.3 2 180 60 20 37.0 17.8 3.80 82.5 32.7 3 180 60 12 42.6 47.5 9.50 75.4 21.3 4 180 90 16 41.7 21.1 3.20 83.3 31.1 5 180 30 16 46.1 35.1 5.70 83.1 30.1 6 190 60 16 42.5 25.7 5.10 83.1 31.0 7 170 60 16 42.5 39.5 6.40 81.4 27.7 8 190 90 20 35.3 15.6 2.00 83.2 32.3 9 190 90 12 44.3 39.0 7.50 78.1 23.3
10 190 30 20 44.2 16.5 4.10 84.8 32.0 11 170 90 20 42.3 27.4 4.10 86.0 32.2 12 170 30 12 51.1 58.0 9.70 81.6 20.4 13 170 30 20 42.8 49.4 7.90 84.1 29.0 14 170 90 12 45.4 44.9 9.80 75.0 22.0 15 190 30 12 42.6 49.6 7.00 75.2 25.0 Tª – temperature, ºC; t – time, min; c – ethanol (% v/v) or soda (%) concentration
Table 3 Maximum and minimum yield, kappa number, α-cellulose and lignin contents, and pulp brightness
obtained using the experimental design for soda and ethanol processes
Parameters Soda Ethanol
Yield (%) 35.3-51.1 (44.8%) 31.6-48.3 (52.9%)
Kappa index 15.6-58.0 (272%) 44.2-72.4 (63.8%)
Lignin (%) 2.00-9.80 (390%) 5.10-12.6 (147%)
Cellulose (%) 75.0-86.0 (14.7%) 49.4-80.0 (61.9%)
Brightness (%) 20.4-32.7 (60.3%) 17.7-24.8 (40.1%)
Table 4 Chemical characteristics of pulp and brightness of paper sheets
obtained under optimum conditions in soda and ethanol pulping processes
Soda Ethanol Experimental conditions Temperature (ºC) 180 185 Time (min) 60 90 Concentration (%) 16 60 Results Yield (%) 41.2 42.9

Ascensión Alfaro et al.
300
Kappa index 26.5 59.5 Lignin (%) 5.50 6.90 Cellulose (%) 82.4 71.8 Brightness (%) 30.3 22.4
Likewise, organosolv pulp is of medium quality relative to the pulp obtained by conventional processes, but has the advantage of an easier bleaching, which can make it more competitive than the conventionally produced pulp.28
Based on these results, the tagasaste pulp and paper obtained by the soda method within the studied operational ranges shows better properties than the pulp obtained by the ethanol process. However, the potential advantages of the organosolv processes and the ability to refine the pulp for substantially improving the physical properties of the paper sheets, make the ethanol process an effective option for pulping tagasaste trimmings.
The properties of tagasaste pulp are similar to those of the pulps from some types of leafy plants, e.g. various acacia and eucalyptus species,29 alders and short, fast-growing trees such as Sterculia villosa30 subjected to the soda process. The useful yields for leafy wood range from 42 to 59%, and the kappa number from 24 to 40; the corresponding optimum values for tagasaste pulp are 41.2 and 26.5%.
A comparison of the results on tagasaste, obtained by the proposed mathematical models, with those reported for Eucalyptus globulus pulped under conditions similar to those of the ethanol process,31-34 reveals that tagasaste provides slightly lower yields and kappa numbers falling into the reported ranges. Table 5 lists the values for parameters ci in the fuzzy neural equations obtained using Gaussian membership functions at three different levels (low, medium and high) for temperature, and linear membership functions at two levels (low and high) for the other two variables, thus permitting to predict the kappa number and yield of the soda and ethanol processes, respectively.
Table 6 shows the ci values obtained from the equations of the fuzzy neural model with
Gaussian membership functions at three levels (low, medium and high) for the cook- ing time, and linear membership functions at two levels (low and high) for the other two variables, which permits to predict the yield of the soda process, and the kappa number and α-cellulose content of the pulp provided by the ethanol process.
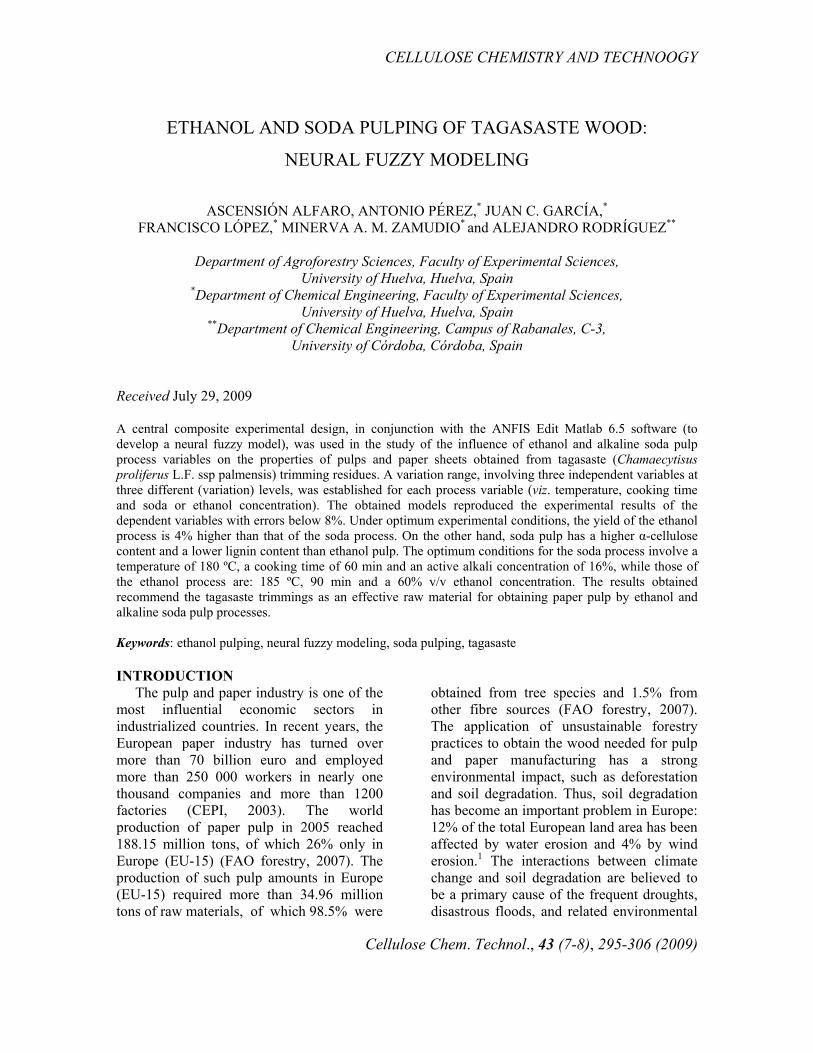
Table 7 shows the ci values obtained using the fuzzy neural model with Gaussian membership functions at three levels (low, medium and high) for the cooking time, and linear membership functions at two levels (low and high) for the other two variables, to predict the lignin and α-cellulose contents in soda pulp, the brightness of soda paper, and the lignin content in ethanol pulp and the brightness of ethanol paper. The mean errors of the estimates provided by the fuzzy neural models used were all below 8%. Therefore, the proposed models are effective for accurately predicting the results of tagasaste pulping with either soda or ethanol. A comparison of the errors obtained (Figs. 1 and 2) reveals that those for the soda process exceed those for the ethanol one, particularly as to yield (6.52) and lignin content (7.17%).
The proposed fuzzy neural model provides a physical interpretation of the constants (parameters) of the system, as they represent the average value of a property (a dependent variable) under the conditions defined by a particular fuzzy neural rule. Thus, a low temperature, time and ethanol concentration leads to an average yield of 48.53% (rule 1 in Table 5), which coincides with the parameter value in the equation. Therefore, fuzzy neural models allow assessing the influence of each operational variable on the specific properties. The equations for each dependent variable were plotted as a function of temperature, reagent concentration and cooking time (the dependent variables for both processes).
In each case, the most significant common independent variable (e.g., the coo-

Wood
301
king time for pulp yield, kappa number for the lignin content, and reagent concentration for the α-cellulose content) was kept constant.
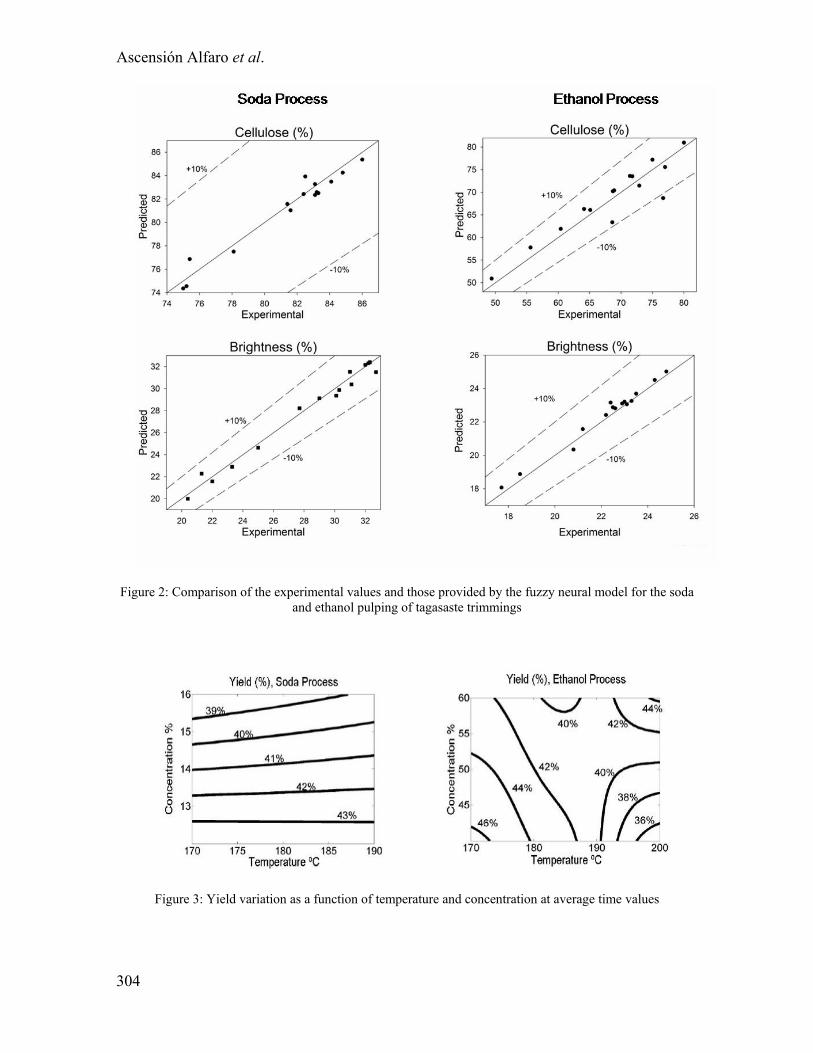
Figure 3 shows the contour surface for pulp yield in soda and ethanol processes as a function of temperature and concentration of the delignifying agent for a medium time within the studied range (viz. 60 and 80 min for the soda and ethanol process, respectively).
As one may observe, the ethanol process provides higher yields under extreme conditions [viz., low temperature (170 ºC)] and reagent concentration (40%), or a high value of both (200 ºC and 80%). The yield of soda pulp increases by the use of low concentrations (ca. 12%) of the active alkali.
The slopes of the plot given in Figure 3 reveal that changes in the operating conditions are much more influential on the ethanol process than on the soda one. As evidenced by the graphs for kappa number and lignin content (Figs. 4 and 5), both related to bleaching power, the kappa number of the ethanol pulp obtained at
medium cooking time values exceeds that of soda pulp obtained under similar conditions within the operational ranges. The lowest kappa number and lowest lignin content for soda pulp are obtained at a temperature close to 180 ºC and an active alkali concentration of 16-20%. The best results for both parameters in the ethanol process are obtained at a higher temperature (195 ºC).
At medium reagent concentrations, which constitute the optimum choices for both processes (viz. 16% active alkali and 60% ethanol, respectively), soda pulp contains more α-cellulose than ethanol pulp. The curves in Figure 6 show that the cooking time and temperature have a marked influence on the ethanol process, which gives the optimum results at a long cooking time (90-135 min) and high temperature (above 185 ºC). On the other hand, the α-cellulose content in the soda pulp obtained at medium concentrations of active alkali varies slightly with the cooking temperature and time, attaining 80.5-81.5% under the conditions described in Figure 6.
Table 5
Values of parameters ci in the fuzzy neural equations obtained using Gaussian membership functions at three different levels (low, medium and high) for the temperature and linear membership functions at two
levels (low and high) for time and reactive concentration
Operational variables Dependent variables of pulps Rule Temperature
(°C) Time(min)
Concentration(%)
Kappa index Soda
Yield Ethanol
1 low low low 57.47 48.53 2 low low high 50.08 45.88 3 low high low 44.40 44.69 4 low high high 27.50 39.48 5 medium low low 51.64 40.95 6 medium low high 20.24 37.30 7 medium high low 37.30 44.61 8 medium high high 5.960 41.18 9 high low low 48.73 37.34 10 high low high 15.09 44.47 11 high high low 38.36 31.37 12 high high high 15.13 44.66 Mean error (%) 6.52 1.74 L 4.25 6.37

Ascensión Alfaro et al.
302
Table 6 Values of parameters ci in the fuzzy neural equations as obtained using Gaussian membership functions at three different levels (low, medium and high) for the time and linear membership functions at two levels
(low and high) for temperature and reactive concentration
Operational variables Dependent variables of pulps
Rule TTemperature (°C) Time (min) Concentration
(%) Yield Soda
Kappa index
Ethanol
Cellulose Ethanol
1 low low low 51.58 73.22 61.44 2 low low high 43.13 69.98 50.09 3 low medium low 43.31 67.4 69.44 4 low medium high 37.45 69.94 64.06 5 low high low 45.3 65.10 73.86 6 low high high 42.37 71.42 57.40 7 high low low 42.52 44.57 69.37 8 high low high 44.570 64.27 69.76 9 high medium low 43.69 46.27 83.75 10 high medium high 38.09 49.12 80.87 11 high high low 44.11 56.12 65.21 12 high high high 34.89 44.35 76.97 Mean error, % 1.17 1.12 3.35
L 12.74 19.11 19.11
Table 7 Values of parameters ci in the fuzzy neural equations obtained using Gaussian membership functions at
three different levels (low, medium and high) for the reactive concentration and linear membership functions at two levels (low and high) for time and temperature
Operational variables Dependent variables of pulps
Rule Temperature (°C)
Time (min)
Concentration (%)
Lignin Soda
Cellulose Soda
Brightness Soda
Lignin Ethanol
Brightness Ethanol
1 low low low 10.4 81.0 19.5 12.6 22.80 2 low low medium 6.90 81.6 27.9 9.54 23.09 3 low low high 7.81 83.6 29.2 11.7 22.86 4 low high low 10.3 73.9 21.1 9.71 22.37 5 low high medium 4.14 81.7 29.2 7.51 23.19 6 low high high 3.96 85.6 32.5 7.11 21.47 7 high low low 7.27 74.0 24.2 5.99 25.12 8 high low medium 5.73 83.5 31.6 5.79 23.36 9 high low high 3.88 84.3 32.2 5.93 17.74 10 high high low 7.90 77.1 22.3 5.87 24.57 11 high high medium 3.10 84.0 32.4 4.22 23.59 12 high high high 1.81 82.5 32.4 6.04 18.58 Mean error ,% 7.17 0.80 1.78 1.82 1.32
L 1.70 1.70 1.70 8.49 8.49

Wood
303
Figure 1: Comparison of the experimental values and those provided by the fuzzy neural model for the soda and ethanol pulping of tagasaste trimmings
Ascensión Alfaro et al.
304
Figure 2: Comparison of the experimental values and those provided by the fuzzy neural model for the soda
and ethanol pulping of tagasaste trimmings
Figure 3: Yield variation as a function of temperature and concentration at average time values

Wood
305
Figure 4: Kappa number as a function of concentration and temperature at average time values
Figure 5: Lignin as a function of concentration and temperature average time values
Figure 6: α-cellulose as a function of temperature and time at average reactive concentration values
CONCLUSIONS
The results obtained show that the soda process provides tagasaste pulp and paper sheets with better properties than the ethanol one. However, the potential advantages of the organosolv processes and the ability to refine the pulp for substantially improving the physical properties of the resulting paper sheets make the ethanol process an effective choice for pulping tagasaste trimmings.
The optimum conditions for the soda
process are as follows: temperature – 180 ºC, cooking time – 60 min and active alkali concentration – 16%, while those for the ethanol process are: 185 ºC, 90 min and an ethanol concentration – 60% v/v.
Under optimum conditions, the ethanol process provides a 4% higher yield, a 25% higher lignin content and a 12.9% lower α-cellulose content than the soda one.

Ascensión Alfaro et al.
306
Whichever the pulping process used, the agroforestry residues obtained from tagasaste trimmings appear as an effective alternative to the traditional woody raw materials used for pulp and paper production. ACKNOWLEDGEMENT: The authors acknowledge the financial support from ENCE, S.A. (San Juan del Puerto Factory, Huelva, Spain) and CICYT-FEDER (Science and Technology Inter Ministerial Commi-ssion, Spanish Government – European Regional Development Fund), project number CTQ2004-06564-C0404/PPQ and CTQ2006-10329/PPQ, as well as Ramón y Cajal and Juan de la Cierva programmes (Spain’s Ministry of Education and Science) for additional funding. REFERENCES 1 J. Ananda and G. Heart, J. Environ. Manag., 68, 343 (2003). 2 F. Tao, M. Yokozawa, Y. Hayashi and E. Lin, Climatic Change, 68 169 (2005). 3 A. F. Cross and W. H. Schlesinger, Plant Ecol., 145, 11 (1999). 4 S. Rodriguez-Echevarría, M. A. Pérez-Fernández and S. Vlaar, J. Appl. Microbiol., 95, 1367 (2003). 5 B. J. Wills, J. S. C. Begg and J. S. S. Sheppard, in “Association Française pour la Production Fourragere, Centre National de Recherche Agronomique”, Nice, France, 1998, p. 62. 6 J. Eastham, P. R. Scott and R. A. Steckis, Land Degrad. Rehabil., 4, 113 (1993). 7 M. J. Unkovich, J. S. Pate, E. C. Lefroy and D. J. Arthur, Aust. J. Plant Physiol., 27, 921 (2000). 8 B. A. McKenzie, G. D. Hill, V. Ganeshan, E. Yamoah, M. E. Andrews and D. R. Humphry, Aspects of Applied Biology, 63, 53 (2001). 9 R. J. Kaitho, N. N. Umunna, I. V. Nsahlai, S. Tamminga, J. Van Bruchem and J. Hanson, Anim. Feed Sci. Tech., 65, 151 (1997). 10 C. Ovalle, J. Aroson, A. D. Pozo and J. Avendano, Arid Soil Research Rehabilitation, 13, 369 (1999). 11 M. C. Vega Hernández, G. R. Pérez, F. B. Dazzo, L. A. Jarabo, M. C. Alfayate and B. M. León, New Phytol., 150, 707 (2001). 12 N. Oggiano, L. G. Angelini and P. Cappelletto, Ind. Crop. Prod., 7, 59 (1997).
13 F. López, A. Alfaro, M. M. García, M. J. Díaz, A. M. Calero and J. Ariza, Chem. Eng. Res. Des., 82, 1029 (2004). 14 M. J. Díaz, A. Alfaro, M. García, M. E. Eugenio, J. Ariza and F. López, Ind. Eng. Chem. Res., 43, 1875 (2004). 15 A. Alfaro, Ph.D. Thesis, Universidad de Huelva, España, 2005, 234 pp. 16 R. B. Kinstrey, Tappi J., 76, 105 (1993). 17 J. Bendzala and B. V. Kokta, Wood Sci. Technol., 29, 467 (1995). 18 J. M. Martínez, J. Reguant, J. Salvadór and X. Farriol, Biores. Technol., 60, 161 (1997). 19 E. Muurinen, Ph.D. Thesis, University of Oulu, Finland, 2000, 314 pp. 20 G. E. Box, W. G. Hunter and J. S. Hunter, “Estadística para investigadores”, Reverté, Barcelona, 1993, 629 pp. 21 L. A. Zadeh, Information and Control, 8, 338 (1965). 22 G. Works, Procs. AUTOFACT’89, 29 (1989). 23 J. S. R. Jan, C. T. Sun and E. Mizutani, “Neuro-fuzzy and soft computing: a computational approach to learning and machine intelligence”, Prentice Hall, New York, USA, 1997, 614 pp. 24 L. Paszner and H. J. Cho, Tappi J., 72, 135 (1989). 25 T. Kleinert, Cellulosechemie, 18, 114 (1940). 26 Y. Ni, C. Dixon and T. Ooi, Can. J. Chem. Eng., 75, 48 (1997). 27 H. L. Hergert, in “Environmental friendly technologies for the pulp and paper industry”, edited by R. A. Young and M. Akhtar, Willey, New York, USA, 1998, pp. 5-67. 28 L. Paszner and N. C. Behera, Holzforschung, 39, 51 (1985). 29 P. Khristova and I. Karar, Biores. Technol., 68, 209 (1999). 30 S. R. Ghosh and P. P. Baruah, Biores. Technol., 62, 43 (1997). 31 M. A. Gilarranz, M. Oliet, F. Rodríguez and J. Tijero, Can. J. Chem. Eng., 76, 253 (1998). 32 M. Oliet, Ph.D. Thesis, Universidad Complutense, Madrid, Spain, 1999, 193 pp. 33 J. I. Botello, M. A. Gilarranz, F. Rodríguez and M. Oliet, J. Chem. Technol. Biotechnol., 74 141 (1999). 34 M. Oliet, F. Rodríguez, A. Santos, M. A. Gilarranz, S. García Ochoa and J. Tijero, Ind. Eng. Chem. Res., 39, 34 (2000).