ethane emissions estimates from oil and … · methane emissions estimates from oil and natural gas...
TRANSCRIPT

METHANE EMISSIONS ESTIMATES FROM OIL AND NATURAL GAS PRODUCTION USING ATMOSPHERIC MEASUREMENTS Anna Karion, Colm Sweeney, Eric Kort, Paul Shepson, Mackenzie Smith, M. Obie Cambaliza, Tegan Lavoie, Sonja Wolter, Stephen Conley, Gabrielle Pétron, Tim Newberger, Scott Herndon, Tara Yacovitch, Chris Rella, Mike Hardesty, Alan Brewer, Jon Kofler
Photo: sunset over the Denton airport, by Sonja Wolter

Why (continue to) study US oil and gas CH4 emissions?
Methane (CH4) is the principal component of natural gas and a powerful greenhouse gas (GWP 100 yrs = 28)
Methane is released in fugitive emissions from oil and natural gas production, processing, etc.
Emissions of methane from natural and anthropogenic sources are not well quantified (globally or regionally).
Recent studies and overviews (Brandt et al., Science, 2014) show high emissions but they generally cover only a small fraction of US production.
NOAA Global Monitoring Division Annual Conference, May 21 2014 2

So what are the CH4 emissions from natural gas?
0
1
2
3
1 2 3
% C
H4
Leak
age
Report
DistributionTransmissionProcessingProduction2013 2011 2010
02468
1012
2004 2009
Tg C
H4/
yr
Year
2010Report2011Report2013Report
0
5
10
15
1 2 3
Tg C
H4/
yr
Report
DistributionTransmissionProcessingProduction
2013 2011 2010
EPA Inventory of GHG Sources and Sinks
NOAA Global Monitoring Division Annual Conference, May 21 2014 3

Mass Balance Approach for Emissions Estimation
∫ ∫+
−
∆=
b
b
z
zairCHCH dxdznXVn
PBL
gnd
44cosθ
Perpendicular wind speed
Wind
emissions
Wind
Background CH4
Downwind CH4
CH4 flux Molar CH4 enhancement in PBL
mixing height (PBL)
NOAA Global Monitoring Division Annual Conference, May 21 2014 4

TEXas Methane EXperiment
NOAA Global Monitoring Division Annual Conference, May 21 2014 6
Barnett Shale: 7% of US gas production; one of top 3 shale plays in US

Texas Methane Experiment Phase I: March 2013
University of Colorado NOAA/ESRL (GMD, CSD) Picarro Shell / Sanders Geophysics Aerodyne Penn State (Davis group)
Phase II: October 2013 Purdue (Shepson group) University of Michigan (Kort) University of Cincinnati (Townsend-Small) UC Irvine (Blake group) University of Houston West Virginia University Duke Princeton & UT Dallas LI-COR
NOAA Global Monitoring Division Annual Conference, May 21 2014 7

Texas Methane Experiment: Aircraft
Purdue Duchess
Scientific Aviation Mooney
NOAA Global Monitoring Division Annual Conference, May 21 2014 8

19 Oct 2013 Upwind (Duchess)
Downwind (Mooney)
NOAA Global Monitoring Division Annual Conference, May 21 2014 10
wind

19 Oct 2013
CH4 C2H6
Methane (left) and ethane (right) in five separate downwind transects show consistency of plume. They also indicate that a portion of the methane enhancement does not correspond with an ethane enhancement.
5 downwind transects
NOAA Global Monitoring Division Annual Conference, May 21 2014 12

NOAA Global Monitoring Division Annual Conference, May 21 2014 13

Total CH4 Emission
NOAA Global Monitoring Division Annual Conference, May 21 2014 14
Mean of nine flights

Attribution to oil and gas
NOAA Global Monitoring Division Annual Conference, May 21 2014 17
10172014
Oil producing wells
Dry gas producing wells

Ethane to Methane Ratio: 19 Oct 2013
NOAA Global Monitoring Division Annual Conference, May 21 2014 18
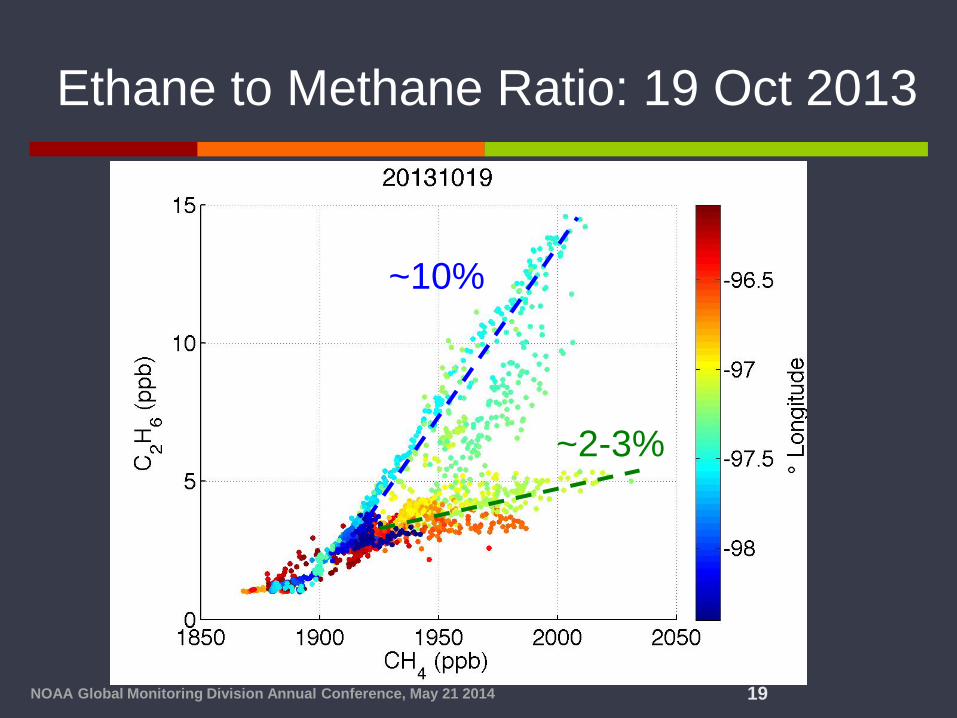
Ethane to Methane Ratio: 19 Oct 2013
~10%
~2-3%
NOAA Global Monitoring Division Annual Conference, May 21 2014 19

NOAA Global Monitoring Division Annual Conference, May 21 2014 20
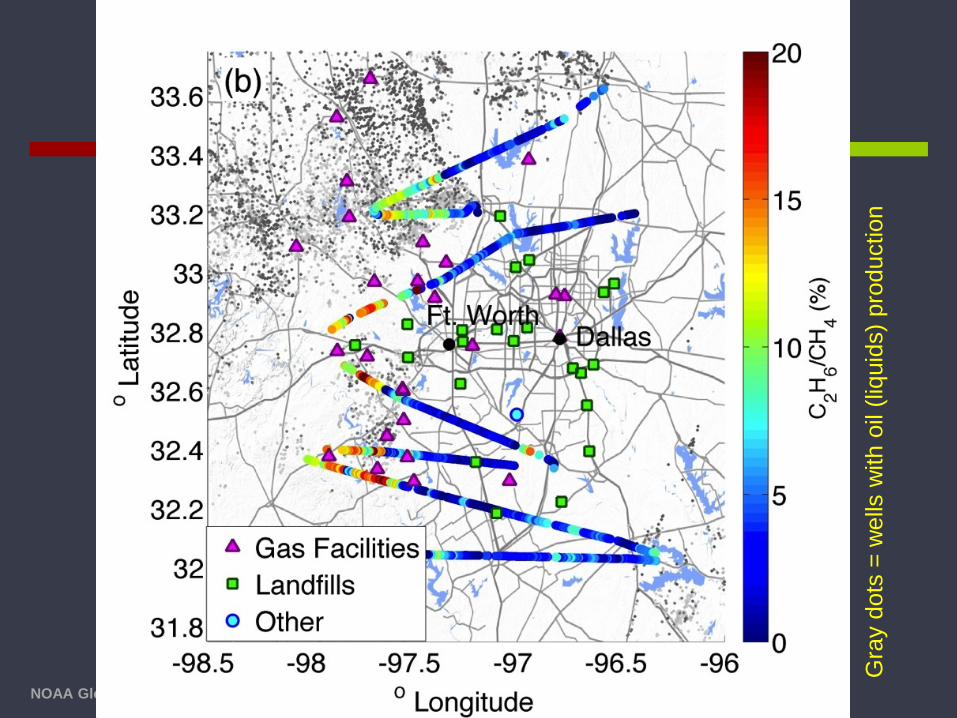
Wells with Gas Production
Gra
y do
ts =
wel
ls w
ith g
as p
rodu
ctio
n
NOAA Global Monitoring Division Annual Conference, May 21 2014 21
Gra
y do
ts =
wel
ls w
ith o
il (li
quid
s) p
rodu
ctio
n

NOAA Global Monitoring Division Annual Conference, May 21 2014 22
Gra
y do
ts =
wel
ls w
ith o
il (li
quid
s) p
rodu
ctio
n

Correlations of C2H6 with CH4
NOAA Global Monitoring Division Annual Conference, May 21 2014 23
Survey Flight 10172013
Significant correlation
No correlation
Use the sum of CH4 that does NOT correlate with C2H6 (blue) to establish contribution from biogenic sources: ~25%.

Conclusions & Future Work
NOAA Global Monitoring Division Annual Conference, May 21 2014 24
Methane emissions for several other basins are going to be published in the next year Barnett Fayetteville, Haynesville, Marcellus (Peischl, in prep.) Bakken, San Juan, Marcellus – upcoming
measurements planned
Work is still needed to reconcile inventories with estimates based on atmospheric measurements.
More work is going to focus on attribution using ethane (U Mich, Aerodyne) and 13CH4 (Picarro).

NOAA Global Monitoring Division Annual Conference, May 21 2014 25

Utah, 2012
Distance perpendicular to wind (km) C
H4 (
ppb)
downwind
upwind
Karion, A., C. Sweeney, et al. (2013). Methane emissions estimate from airborne measurements over a western United States natural gas field. Geophysical Research Letters.
NOAA Global Monitoring Division Annual Conference, May 21 2014 26
High emissions, but this field only represents ~1% of US production.

Denver-Julesburg, May 2012
Pét
ron
et a
l., 2
014.
NOAA Global Monitoring Division Annual Conference, May 21 2014 27

Summary of Results for O&G Emissions in the D-J Basin
28
1. Top-down oil and gas emission estimates based on flight data in May 2012 are ~2 times larger than state inventory estimates for NMHCs and 7 times larger for the carcinogen benzene (C6H6).
2. CH4 emissions are close to 3 times larger than an estimate based on EPA GHGRP data.
C6H6 CH4 NMHC
cars
Pétron et al., 2014

Average Daily NG Production
5/22/2014 29
Barnett Shale natural gas comprises 7% of US total production.

19 Oct 2013
NOAA Global Monitoring Division Annual Conference, May 21 2014 30

27 March 2013
Methane (CH4) Ethane (C2H6)
NOAA Global Monitoring Division Annual Conference, May 21 2014 31
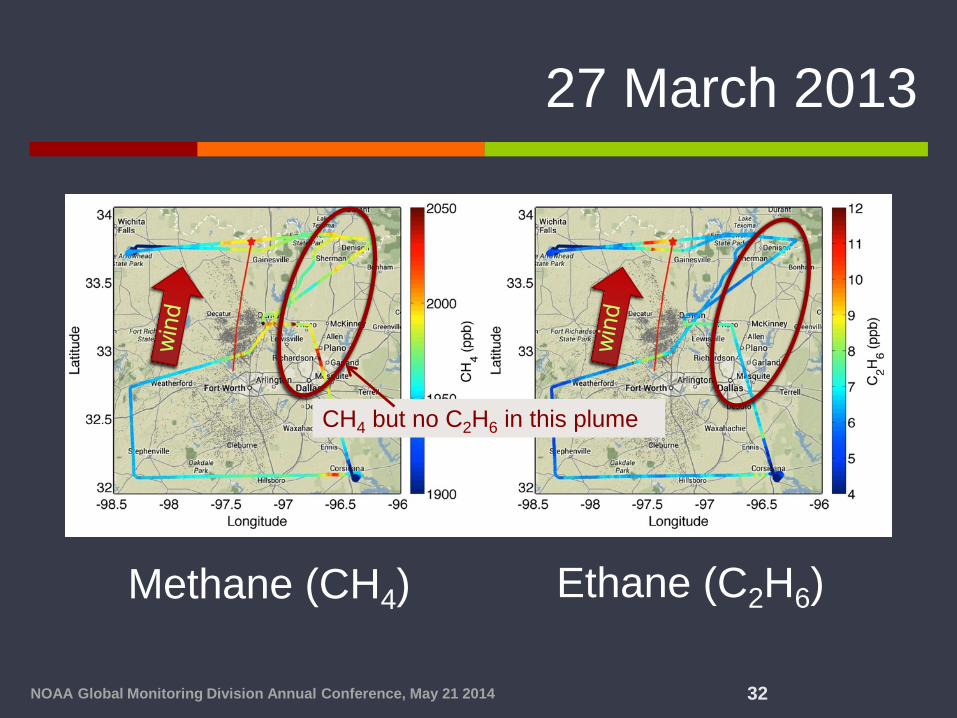
27 March 2013
Methane (CH4) Ethane (C2H6)
CH4 but no C2H6 in this plume
NOAA Global Monitoring Division Annual Conference, May 21 2014 32

27 March 2013
CH4
C2H6
CO
CH4 and C2H6 are both components of natural gas; CO is not.
Downwind Transect 1 Downwind Transect 2
NOAA Global Monitoring Division Annual Conference, May 21 2014 33

27 March 2013
Downwind Transect 1
CH4 but no C2H6 in this plume
Downwind Transect 2
CH4
C2H6
CO
NOAA Global Monitoring Division Annual Conference, May 21 2014 34

Average Daily NG Production
NOAA Global Monitoring Division Annual Conference, May 21 2014 35

Well Count
NOAA Global Monitoring Division Annual Conference, May 21 2014 36