estimation of solar panel orientation with different tilt
TRANSCRIPT

International Journal of Sustainable Energy and Environment Vol. 3, No. 2, November 2015, pp. 1-23, ISSN: 2327- 0330 (Online) Available online at www.ijsee.com
1
Research article
Estimation of Solar Panel Orientation with Different
Tilt Angles at Haramaya University
Yirga Belay1, Gelana Amente2, Girma Goro3
1 Aksum University, Aksum, P.O.box =1010, [email protected], Ethiopia
2 Haramaya University, Dire Dawa, P.O.box =138, Ethiopia 3 Dire Dawa University, Dire Dawa, [email protected] , Ethiopia
_________________________________________________________________________
Abstract
This study evaluated the performance of the solar panels at different North – South tilt angles and East – West
Orientation angles during spring of 2013. The three solar panels of 4 Watts capacity each were placed on manual
tracker to facilitate changing tilt and orientation angles independently. The experiment was done for one week in
each month, and each first day was devoted to measure voltages for different tilt angles by changing the angles
from 0° to 45° in steps of 3o, zero indicating horizontal position. During the remaining six days of the week of
every month, the middle solar panel was fixed at tilt angle that yielded maximum power while the orientations of
both east-facing and west panels were changed from 0o to 90o in steps of 5oangle with respect to middle solar
panel, zero indicating same plane position with respect to middle solar panel. A digital multi-meter was used to
record the circuit voltage of the solar panels with 10Ω resistor serving as a load. Data collection was done every
15 minutes, from 8:00 am till 5:00 pm. The study revealed that the maximum power output was obtained at the
tilt angle of 3o in March and May, and 0o in April and the seasonal average tilt was found to be 3o. Maximum
solar power outputs were obtained when solar panels facing east and west were oriented between 0o and 5o. This
suggests that tilt angle of 3o and 0o to 5o is considered as suitable orientation angle for optimum seasonal power
production at this geographical location. Copyright © IJSEE, all rights reserved.
Key words: Solar Panel, Tilt Angle, East/West Orientation Angle, Solar Power
_________________________________________________________________________
1. Introduction A photovoltaic (PV) system should be installed to maximize the solar contribution to a particular load. Optimum
PV inclination and orientation depends on local climate, load consumption temporal profile and latitude (Jayanta
et al., 2006). Generally, a surface with tilt angle equal to the latitude of a location receives maximum insolation.
However, some locations experience a weather pattern where winter is typically cloudier than summer or the
average morning and afternoon insolation is not symmetric. The maximum available energy may then be

International Journal of Sustainable Energy and Environment Vol. 3, No. 2, November 2015, pp. 1-23, ISSN: 2327- 0330 (Online) Available online at www.ijsee.com
2
received by a surface whose azimuth angle is either east or west of due south (in the Northern hemisphere). The
optimum tilt angle is thus site dependent and calculation of this angle requires solar radiation data for that
particular site for the whole year. Normally, during summer, the incident insolation is maximized for a surface
with an inclination 10–15o less than and during winter, 10–15omore than the latitude (Duffie and Beckman,
1991).
Ethiopia is rapidly increasing its energy consumption and is short on energy supplies. Ethiopia is one of the Horn
of African countries located between 33o and 48o East longitudes and between 3o and 15o North latitude. It has a
diverse climatic condition due to the contrasting altitude, which ranges from the highest point of 4650 meters
above sea level at Ras Dashen Mountain to 420 meters below sea level at Dallol Depression. Fortunately,
Ethiopia is located in that part of the world where sun shines for maximum number of hours (Sharew, 2007). It
is, therefore, a matter of interest to assess the significance of solar energy and its utilization in different fields of
applications.
The amount of solar energy incident on a solar panel in various time scales is a complex function of many
factors including the local radiation latitude, longitude, location of the earth with respect to the sun at different
time of year, the orientation and tilt of the exposed solar panel surface and the ground reflection properties. The
performance of a solar panel is highly influenced by its East – West orientation and its North – south angle of
tilt. This is due to the fact that both the orientation and tilt angle change the solar radiation reaching the surface
of the panel. This study tried to estimate the orientations of solar panel with different tilt angles in the spring
season to maximize the amount of solar power. Specifically;
To find out north-south tilt angle that results in maximum daily solar panel power in spring
season of the year.
To find out east-west orientations that result in maximum PV solar power output for the
location in spring season of the year.
To determine the east-west and north-south orientation that result in maximum daily solar
panel power output during the season.
To determine the east-west orientations that result in nearly equal power output during the
season.
3. Methodology
3.1. Description of the Study Area
The study was conducted at Haramaya University, which is located at 515 km east of Addis Ababa, Ethiopia, at
an average altitude of 1950 meter above sea level with latitude of 9o25'22''N and longitude of 42o2'6''E. The
place has a mean maximum temperature of 28.50C and mean minimum temperature of 12.6oC. It is situated in
the semi-arid tropical belt of eastern Ethiopia and is characterized by a sub-humid type of climate with an
average annual rainfall of about 790 mm.

International Journal of Sustainable Energy and Environment Vol. 3, No. 2, November 2015, pp. 1-23, ISSN: 2327- 0330 (Online) Available online at www.ijsee.com
3
Figure 1. Map of the study area
During days when the data were collected the values of the Julian Day number, declination, hour, and solar
altitude angle and day length are summarized in Table 1. Atmospheric conditions in terms of pollution and cloud
movement have a bearing on a given day but they were not determined during this research work.
Table 1. Declination angle on each day measurements were taken
Month Day Julian Day No Declination Day length
March
16/03/2013 75 -2.49645 11.99471 17/03/2013 76 -2.09400 11.97988 18/03/2013 77 -1.69094 11.88085 19/03/2013 78 -1.28737 12.05799 20/03/2013 79 -0.88342 12.02450 21/03/2013 80 -0.47922 12.01394 22/03/2013 81 -0.07486 12.00722
April
14/04/2013 104 8.99084 12.01309 15/04/2013 105 9.36312 12.00702 16/04/2013 106 9.73262 12.00128 17/04/2013 107 10.09925 11.99400 18/04/2013 108 10.46288 11.98044 19/04/2013 109 10.82342 11.91914 20/04/2013 110 11.18075 12.08679
May
14/05/2013 134 18.53716 12.01097 15/05/2013 135 18.78300 12.00709 16/05/2013 136 19.02329 12.00343

International Journal of Sustainable Energy and Environment Vol. 3, No. 2, November 2015, pp. 1-23, ISSN: 2327- 0330 (Online) Available online at www.ijsee.com
4
17/05/2013 137 19.25794 11.99954 18/05/2013 138 19.48690 11.99489 19/05/2013 139 19.71008 11.98851 20/05/2013 140 19.92743 11.97794
From Table 1 declination angle of the sun with respect to earth during the date of tilt angle measured is -
2.49645o in March, 8.99084o in April, and 18.53716o in May. This shows the sun was in the southern hemisphere
in March, over head in April and nearly inclined towards North from the area where data was collected in May.
Thus, the tilt angle of solar panel decreased from March to May. The tilt of the earth's axis of rotation causes one
hemisphere to be illuminated more than the other. This result in differences in the length of day compared to the
length of night. On the day when the day is longest in the northern hemisphere it is shortest in the southern
hemisphere and vice versa.
3.2. Experimental Setup
Figure 9 shows a photographic illustration of the experimental setup. Three identical solar panels of monocrystal
silicon type solar cells (Europe Panneau Solaire solar module), identified as SR01216253 (middle), SR01216488
(east facing) and SR01216758 (west facing) each with dimensions of 294x184x23mm were used. Individual
module had the following specifications. Maximum power 4W, open circuit voltage (Voc) = 22V, short circuit
current (Isc) =0.52A, voltage at maximum power (Vpmax) =17.8V, current at maximum power (Ipmax) =0.23A and
conditions STC for the normal solar radiation intake intensity of 1000 W/m2, 1.5Aat temperature T= 25°C. Each
Module was used in the experiment and installed on the same altitude (place), as shown figure 9. The three
modules were installed on a revolving pedestal, with the rotational axis, which enables changing of the position
of the solar module from North to South and East to West. The gap between the two panels was 0.046m and the
bottom row of panels (rack) was raised 0.55m above the ground.
(a)
International Journal of Sustainable Energy and Environment Vol. 3, No. 2, November 2015, pp. 1-23, ISSN: 2327- 0330 (Online) Available online at www.ijsee.com
5
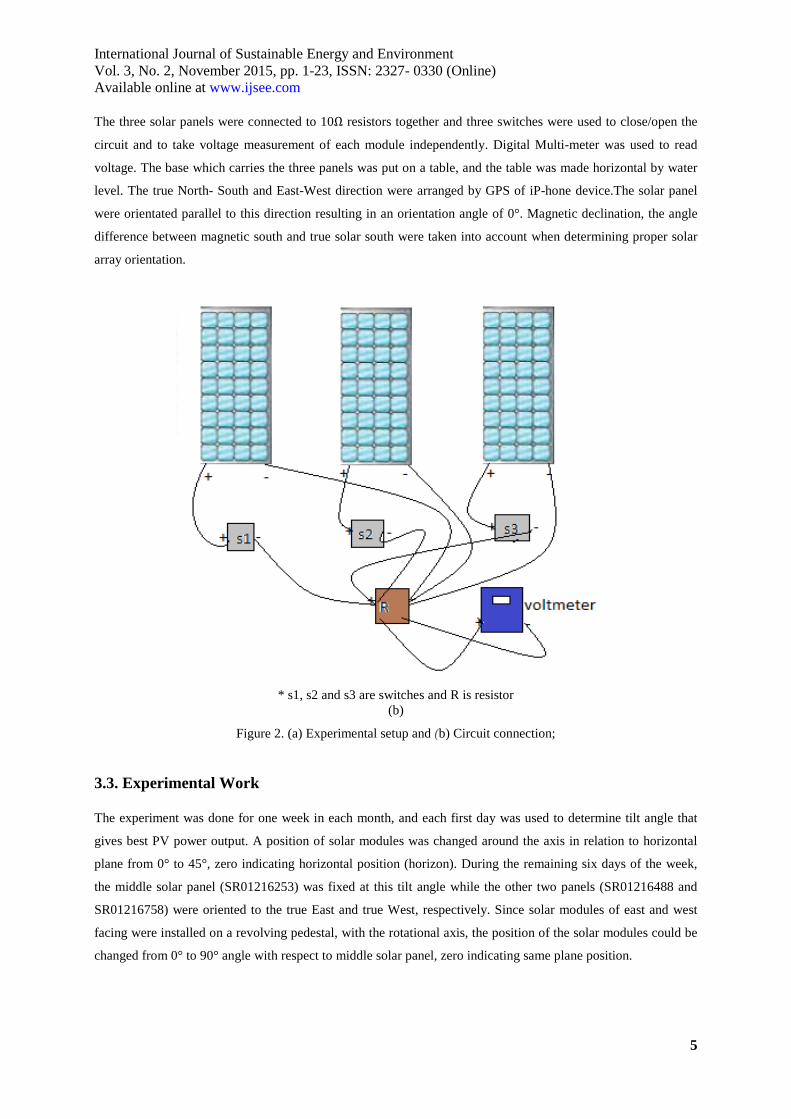
The three solar panels were connected to 10Ω resistors together and three switches were used to close/open the
circuit and to take voltage measurement of each module independently. Digital Multi-meter was used to read
voltage. The base which carries the three panels was put on a table, and the table was made horizontal by water
level. The true North- South and East-West direction were arranged by GPS of iP-hone device.The solar panel
were orientated parallel to this direction resulting in an orientation angle of 0°. Magnetic declination, the angle
difference between magnetic south and true solar south were taken into account when determining proper solar
array orientation.
* s1, s2 and s3 are switches and R is resistor
(b)
Figure 2. (a) Experimental setup and (b) Circuit connection;
3.3. Experimental Work The experiment was done for one week in each month, and each first day was used to determine tilt angle that
gives best PV power output. A position of solar modules was changed around the axis in relation to horizontal
plane from 0° to 45°, zero indicating horizontal position (horizon). During the remaining six days of the week,
the middle solar panel (SR01216253) was fixed at this tilt angle while the other two panels (SR01216488 and
SR01216758) were oriented to the true East and true West, respectively. Since solar modules of east and west
facing were installed on a revolving pedestal, with the rotational axis, the position of the solar modules could be
changed from 0° to 90° angle with respect to middle solar panel, zero indicating same plane position.

International Journal of Sustainable Energy and Environment Vol. 3, No. 2, November 2015, pp. 1-23, ISSN: 2327- 0330 (Online) Available online at www.ijsee.com
6
3.4. Calibration of Solar Panels
The three solar panels were calibrated using standard light sensors LX-1010B Digital Lux Meter with its general
specifications:-Ranges: 1-50,000Lux, Calibrated to standard incandescent lamp at color temperature 2856K,
Dimension: 106×57×26mm (photo detector), 230×72×30mm (meter body), 150cm (photo detector lead). For a
meaningful and accurate measurement of efficiency the irradiance is measured with a solar panel whose power is
calibrated with respect to a standard device. Natural sunlight intensity measured by LX-1010B Lux meter and
intensity from solar panel is plotted as follows;
Figure 3. Calibration curve (Power by Luxmeter versus power by Multimeter)
Calibration of the Solar panels with LX-1010B showed positive linear correlation with R2= 0.7779, 0.7918 and
0.7496 for East, Middle and West solar panels, respectively. This indicates agreement between powers estimated
by lux-meter and voltage measured by multi-meter.
3.5. Data Collection
Data collection was done every 15 minutes, from 8:00 am till 5:00 pm. The tilt angles were varied between 0o-
45o with intervals of 3o (zero indicating horizontal position). During the first day of each week measurement
made power outputs of the solar panel. This measurement was done on the first day of each of the three week.
The tests were made in three replications.
During the remaining six days of each week, the east-west orientation tests were conducted. For this test, three
panels were used. The middle panel (SR01216253) was fixed at north-south tilt angle that has resulted in
0 0.2 0.4 0.6 0.8 1 1.2 1.4
0.1
0.2
0.3
0.4
0.5
0.6
0.7
0.8
0.9
1
1.1
Power by Digital meltimeter [W]
Pow
er b
y Lu
xMet
er [W
]
Calibration of Solar Panels
Eastlux vs. East East Solar PanelMiddlelux vs. Middle Middle Solar PanelWestlux vs. West West Solar panel

International Journal of Sustainable Energy and Environment Vol. 3, No. 2, November 2015, pp. 1-23, ISSN: 2327- 0330 (Online) Available online at www.ijsee.com
7
maximum power output during the tilt angle measurement. The East facing panel (SR01216488) was attached to
the fixed panel with a hinge and allowed to rotate from 0o-90o only in the east direction. Hence, this panel always
faced east direction. Similarly, the West facing panel (SR01216758) was allowed to rotate from 0o-90o. Both
panels (East and West facing) was allowed to rotate from 0o-90o. Both panels were rotated intervals of 5o, zero
indicating same plane position with respect to middle solar panel. Power (voltage) outputs from the three panels
were recorded with their respective times and angles. Measurements were conducted every 15 minutes. The
same procedure was repeated for the remaining two weeks of the two months.
3.6. Data Analysis Power output of each angle was determined first by plotting power against time of the day for each tilt and
orientation angles from which the figure that yielded maximum power output was selected. Data computation
was done by MS-EXCEL and MATLAB. The power was computed using Equation (32).
𝑃𝑃 = 𝑉𝑉𝑉𝑉 = 𝑉𝑉2
𝑅𝑅 (32)
Where V is the voltage measured and R is the resistance (fixed at 10Ω). The results of tilt angle and East - West
orientation angle were analyzed separately based on the power outputs of the three panels.
4. Results and Discussions
4.1. North – South Tilt Angle Result (voltage) obtained from experiment are shown in Appendix I and graphs of power versus time of a
specific day for sample tilt angles are shown in figure 11. Only 6 of the 16 tilt angles are shown in order to
reduce congestion. Visually 0o and 3o tilt angles show maximum power compared to the other angles. The power
in each tilt angle is average value of each week of the corresponding month. The marked or bold graph in each
figure is the tilt angle for which maximum power was obtained. The figure shows that the maximum powers
were recorded at 3o during March and May and at 0o in April. It is often practicable to orient the solar collector at
an optimum tilt angle, and to correct the tilt from time to time. In the northern hemisphere, the solar panel is
south facing and the optimum tilt angle depends only on the latitude. No definite value is given by researchers
for the optimum tilt angle (Amita and Yogesh, 2013).

International Journal of Sustainable Energy and Environment Vol. 3, No. 2, November 2015, pp. 1-23, ISSN: 2327- 0330 (Online) Available online at www.ijsee.com
8
Figure 4. Power versus Time Graph of different Tilt Angles on 16/03/2013. P0, P3, P6, P15, P30 and P45 in the legend represent tilt angles of 0, 3, 6, 15, 30 and 45 degrees, respectively. The lines are all fitted lines.
Figure 5. Power versus Time Graph of different Tilt Angles shown on 14/04/2013. P0, P3, P6, P15, P30 and P45 in the legend represent tilt angles of 0, 3, 6, 15, 30 and 45 degrees, respectively. The lines are all fitted lines.
8:00 9:00 10:00 11:00 12:00 13:00 14:00 15:00 16:00 17:000
0.2
0.4
0.6
0.8
1
1.2
1.4
Local Time [h]
Pow
er [W
]
Power Vs Time Graph for March
P0 vs. t ZeroP3 vs. t ThreeP6 vs. t SixP15 vs. t FifteenP30 vs. t ThirtyP45 vs. t Fortyfive
8:00 9:00 10:00 11:00 12:00 13:00 14:00 15:00 16:000
0.2
0.4
0.6
0.8
1
1.2
Local Time [h]
Pow
er [w
]
Power Vs Time Graph for April
P0 vs. t 0oP3 vs. t 3oP6 vs. t 6oP15 vs. t 15oP30 vs. t 30P45 vs. t 45

International Journal of Sustainable Energy and Environment Vol. 3, No. 2, November 2015, pp. 1-23, ISSN: 2327- 0330 (Online) Available online at www.ijsee.com
9
Figure 6. Power versus Time Graph of different Tilt Angles shown on 14/05/2013. P0, P3, P6, P15, P30 and P45 in the legend represent tilt angles of 0, 3, 6, 15, 30 and 45 degrees, respectively. The lines are all fitted lines.
In order to make objective comparison between the different tilt angles, area under each curve was calculated
and the results are summarized in Table 2.
Table 2. Area under the curve for Power versus Time of each tilt angle
Tilt Angle March April May Season average 0o 6.04279 4.8836 5.87493 5.60044 3o 6.59546 4.53177 6.59996 5.90906 6o 6.58848 4.02515 6.5314 5.72292 9o 6.43165 4.39043 6.24169 5.68792
12o 5.82009 4.21153 5.92736 5.31966 15o 5.31801 4.22848 5.65403 5.06684 18o 6.03987 3.47881 5.42387 4.98085 21o 5.28005 3.4445 5.95702 4.89385 24o 5.29157 3.45322 5.20627 4.65035 27o 5.59848 3.52828 5.12429 4.75035 30o 5.53335 3.16095 5.26575 4.65335 33o 5.04858 2.94018 4.74409 4.24428 36o 4.3593 2.73799 4.57308 3.89012 39o 4.24617 2.27625 4.31662 3.61301 42o 4.05656 2.13912 4.06631 3.42066 45o 3.68364 1.92117 3.77932 3.12804
As seen in the table, maximum area was observed at 3o in March, 0o in April and again 3o in May. Seasonal
average shows 3o as the best tilt angle for the location. The results obtained from the experiment indicated that
no constant optimal tilt angle was observed over the three months. This is because of the daily and monthly
variability in tilt angle, however small. Table 2 shows that the maximum power was recorded during March and
8:00 9:00 10:00 11:00 12:00 13:00 14:00 15:00 16:00 17:000
0.2
0.4
0.6
0.8
1
1.2
Local Time [h]
Pow
er [W
]
Power Vs Time Graph for May
P0 vs. t ZeroP3 vs. t ThreeP6 vs. t SixP15 vs. t FifteenP30 vs. t ThirtyP45 vs. t FortyFive

International Journal of Sustainable Energy and Environment Vol. 3, No. 2, November 2015, pp. 1-23, ISSN: 2327- 0330 (Online) Available online at www.ijsee.com
10
May. The lowest recorded performance for all the angles considered occurred during April. This is due to the
cloudy nature of the month.
As example, the next figure shows that the results obtained from the first day which was in 16/03/2013 of 3o tilt
angle. The figure indicated that measured solar power versus time graph of solar panels with their cumulative
sum area, which was obtained using MATLAB. In similar fashion, the cumulative sum area of each North –
South tilt angle and East – West orientation angle is found.
Figure 7: Power versus time graph of 3o tilt angle and its cumulative sum (16/03/2013)
The Solar panel with 3o tilt angle is therefore more perpendicular to the sun’s light than the one with horizontal
installation angle (0o) and thus received more solar power in spring season. From this, the seasonal optimum tilt
angle (3o) at the location is small, or nearly horizontal. This, in general, is in agreement with the results of many
other researchers (e.g. Jamil and Tiwari, 2009). It is generally known that in the northern hemisphere, the solar
panel is south facing and the optimum tilt depends upon the latitude and the day of the year. In winter months,
the optimum tilt is greater, whilst in summer months the optimum tilt is less. But in autumn and spring season
the optimum tilt angle is nearly equal to the latitude of the area (Jamil and Tiwari, 2009). Compared to the
latitude of the experimental area of about 9o, the experiment revealed a lower tilt angle of only 3o for the season.
If the solar panel surface were tilted 3o towards south to collect maximum power in spring season, the seasonal
total power would be increased by 5.51% from the solar panel's maximum total power for a panel installed
horizontally (0o tilt angle) (Table 2). Since changing the tilt angle to its daily and monthly optimum values
throughout the year does not seem to be practical, a better alternative is changing the tilt angle once every season
(Murat et al., 2004). Table 2 reveals that this location received higher amount of solar radiation in the months of
0
0.5
1
1.5
Pow
er [w
]
Power Vs. Time Graph of 3o Tilt Angle and its cumulative sum area
Power Vs. Time at 3o tilt angle
8:00 9:00 10:00 11:00 12:00 13:00 14:00 15:00 16:00 17:000
2
4
6
8
Cum
ulat
ive
Ener
gy [w
h]
Local Time [h]
Cumulative sum area under the curve

International Journal of Sustainable Energy and Environment Vol. 3, No. 2, November 2015, pp. 1-23, ISSN: 2327- 0330 (Online) Available online at www.ijsee.com
11
March and May compared to April. The reduction in power in the month of April could be due to more cloud
cover during the experimental days of the month.
Murat et al. (2004) reported that the output of the PV arrays could be increased by 20–25% at almost no
investment if they could be installed at a slope equal to the mean monthly slope for the site of application and the
slope adjusted once a month. Yakup and Malik (2001) recommended that the solar collectors should be mounted
at the monthly average tilt angle and the slope adjusted every month. Their study indicated that such installation
would allow an increase in the efficiency of the collector more than 4.4% over that of a similar collector fixed at
the annual tilt angle.
Figure 8. Energy [wh] versus tilt angle[o] of the season
Table 3. Coefficients of Linear trends of Energy versus tilt angle shown in figure 15.
a b R2 March -0.0581 6.6763 0.8407 April -0.0607 4.8241 0.9447 May -0.0568 6.61 0.8887 Season -0.0585 6.087127 0.9451
Thus, an analysis was performed to correlate the dependence of total energy received versus tilt angle shown in
figure 15. The corresponding regression constants obtained at 95% confidence intervals are given in Table 3.
The result shows that optimum energy of a solar panel could be easily obtained as a function of tilt angle by
means of the coefficients of a linear regression (𝑦𝑦 = 𝑎𝑎𝑎𝑎 + 𝑏𝑏). The negative slope for each day of the month
shows that energy decreased while tilt angle increased. In the figure, the curve increased between 0o to 3o and
International Journal of Sustainable Energy and Environment Vol. 3, No. 2, November 2015, pp. 1-23, ISSN: 2327- 0330 (Online) Available online at www.ijsee.com
12
decreased thereafter. When solar panel is set at the monthly optimum tilt angle (Table 2), there is increasing
power of 9.15 %, 12.34% in March and May, respectively as compared to 0o tilt angle. Similarly there is an
increase of 5.51% of PV power when PV is set at seasonal tilt angle. This indicates that the efficiency of solar
collection at the optimum tilt angle is increased compared to the horizontal position (0o tilt angle). It can be
pointed out that the optimum tilts angle increases towards the beginning and end of season.
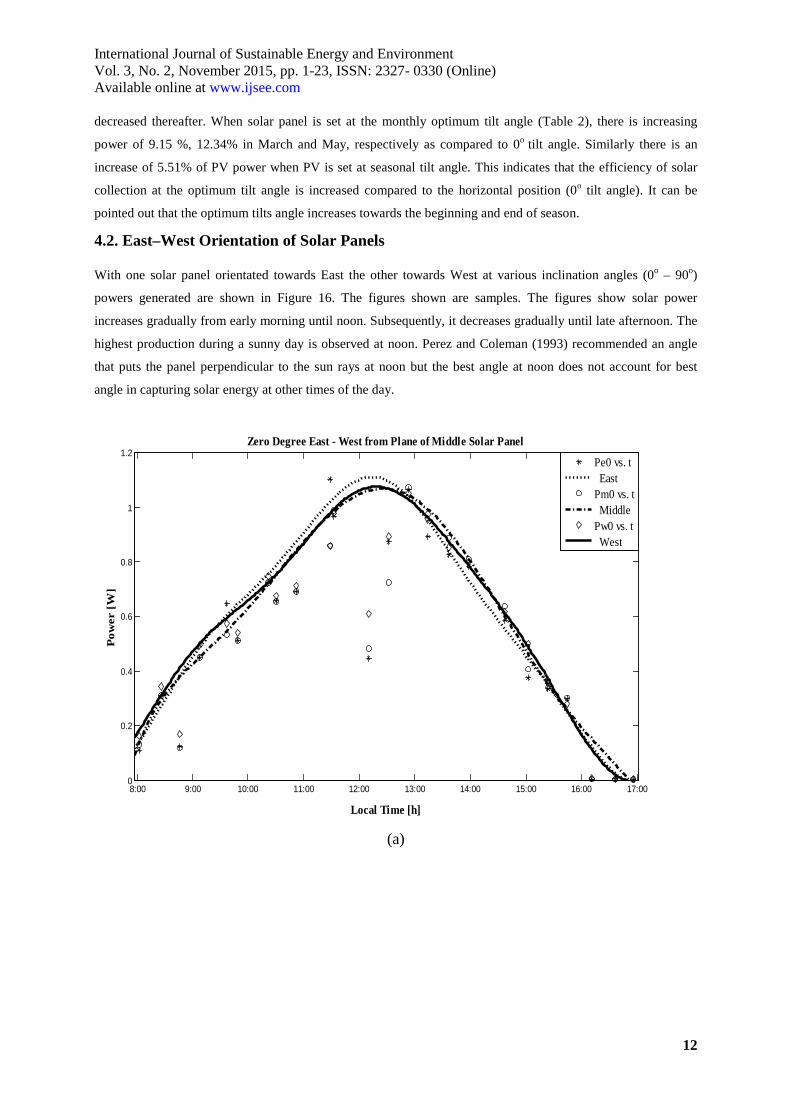
4.2. East–West Orientation of Solar Panels
With one solar panel orientated towards East the other towards West at various inclination angles (0o – 90o)
powers generated are shown in Figure 16. The figures shown are samples. The figures show solar power
increases gradually from early morning until noon. Subsequently, it decreases gradually until late afternoon. The
highest production during a sunny day is observed at noon. Perez and Coleman (1993) recommended an angle
that puts the panel perpendicular to the sun rays at noon but the best angle at noon does not account for best
angle in capturing solar energy at other times of the day.
(a)
8:00 9:00 10:00 11:00 12:00 13:00 14:00 15:00 16:00 17:000
0.2
0.4
0.6
0.8
1
1.2
Local Time [h]
Pow
er [
W]
Zero Degree East - West from Plane of Middle Solar Panel
Pe0 vs. t EastPm0 vs. t MiddlePw0 vs. t West

International Journal of Sustainable Energy and Environment Vol. 3, No. 2, November 2015, pp. 1-23, ISSN: 2327- 0330 (Online) Available online at www.ijsee.com
13
(b)
(c)
Figure 9. Power versus Time graph of East –West Orientation on 17/03/2013 shown as sample. (a) All the three panels on the same plane; (b) East – West facing panels oriented at 25o from their respective references; (c) East and West facing panels oriented at 90o from their respective references.
Values of energies (cumulative sums) obtained from power versus time graph, for the East/West for all
predefined angles (0o - 90o) are given in Appendix II Table 3 and 4 for the months of March, April and May,
respectively. The result depicted that best orientation angles that resulted in maximum power generated varied in
8:00 9:00 10:00 11:00 12:00 13:00 14:00 15:00 16:00 17:000
0.2
0.4
0.6
0.8
1
1.2
Local Time [h]
Pow
er [w
]Twenty five Degree East - West from Middle Solar Panel
Pe25 vs. t EastPm25 vs. t MiddlePw25 vs. t West
8:00 9:00 10:00 11:00 12:00 13:00 14:00 15:00 16:00 17:000
0.2
0.4
0.6
0.8
1
1.2
Local Time [h]
Pow
er [w
]
Ninety Degree East - West from Plane of Middle Solar Panel
Pe90 vs. t EastPm90 vs. t MiddlePw90 vs. t West

International Journal of Sustainable Energy and Environment Vol. 3, No. 2, November 2015, pp. 1-23, ISSN: 2327- 0330 (Online) Available online at www.ijsee.com
14
each day but mostly ranged between ranged 0 and 10o. In figure 16a all the three panels recorded identical
powers. This is not surprising since orientations were the same for all the three and the panels are also of
identical make. Figure 16b showed that East and West facing panels had significant contribution in the morning
and afternoon hours, respectively. Their midday contributions were subdued. In figure 16c only early morning
and late afternoon contribution were observed for East and West facing panels, respectively. The three together
reveal that change in orientation is good to evenly distribute the power throughout the day.
4.2.1. East Facing Solar Panel
For the week of 17-22/03/2013, for East facing solar panel maximum powers were generated at 5o, 10o, 0o, 10o,
5o, and 5o, respectively. For the week of 15-20/04/2013, for East facing panel maximum powers were generated
at 5o, 0o, 0o, 10o, 0o, and 5o, respectively (see Appendix II Table3). In March and April maximum powers were
observed for orientation angles ranging between 0o and 10o. In May maximum powers were at higher angles of
up to 20o. Over all, the seasonal average ranged between 0o and 10o with more frequencies occurring between 0o
and 5o.
Table 4. Cumulative power of P-t graph of east-oriented panel with orientation angles 0-90o for the selected
week of each month
Orientation Angle
March April May Season average
0o 6.2410 5.7828 4.5166 5.5135 5o 6.4651 5.7543 4.5289 5.5827 10o 6.3598 5.7420 4.4762 5.5260 15o 6.1976 5.6963 4.4397 5.4445 20o 6.1915 5.3365 4.3052 5.2777 25o 6.1029 5.2770 4.2344 5.2048 30o 5.7534 5.1217 3.9463 4.9405 35o 5.1512 4.6768 3.5888 4.4723 40o 4.9360 4.4675 3.4687 4.2907 45o 4.9461 4.1278 3.1566 4.0769 50o 4.2311 3.8277 2.9313 3.6633 55o 3.9638 3.4866 2.5695 3.3400 60o 3.4373 2.9565 2.3721 2.9220 65o 3.2585 2.7678 2.1104 2.7122 70o 2.7226 2.4473 1.7566 2.3088 75o 2.5108 2.0430 1.5911 2.0483 80o 1.9488 1.8353 1.2502 1.6781 85o 1.5782 1.4385 1.0374 1.3513 90o 1.1838 1.1485 0.6977 1.0100
Again in the summary table (Table 4) maximum power for East orientation were observed at 5o more frequently
during the season. Plots of energy versus orientation angles drawn for East oriented panel (figure 17) reveal that
the energy linearly decreased with increase in orientation angle. It is clear from these graphs that a unique value
exists for each month of the season for which the solar power is at a peak for the given month. Similar trend has
been observed for the selected days of the months selected under present study (see Appendix IV figure 2).

International Journal of Sustainable Energy and Environment Vol. 3, No. 2, November 2015, pp. 1-23, ISSN: 2327- 0330 (Online) Available online at www.ijsee.com
15
Figure 10. Graph of energy versus orientation angles and their trends for east-orientated panel
Analysis was performed to correlate the dependence of total energy received versus East orientation angles
shown in figure 17.
Table 5. Trend coefficients and R2 values of Energy versus angle graph
a b R2 March -0.0619 7.1625 0.9581 April -0.056 6.4097 0.9738 May -0.0458 5.0596 0.9726 Season average
-0.0545 6.2106 0.9692
The corresponding regression constants obtained at 95% confidence intervals are given in Table 5. The result
shows that optimum energy of a solar panel could be easily obtained as a function of east orientation angle by
means of the coefficients and of a linear regression (𝑦𝑦 = 𝑎𝑎𝑎𝑎 + 𝑏𝑏). The negative slope for each day of the month
shows that the energy decreased while east orientation angle increased. In the figure, the curve increased
between 0o to 5o and decreased thereafter.
4.2.2. West oriented solar panel As in the case of east-oriented solar panel, west-oriented panel yielded maximum energy when the orientation
angle was between 0o and 5o. For the week of 15-20/05/2013, for west facing panel maximum powers were
generated at 5o, 5o, 0o, 15o, 20o and 0o, respectively (see Appendix II Table 4). In March and April maximum
powers were observed for orientation angles ranging between 0o and 10o. In May maximum powers were

International Journal of Sustainable Energy and Environment Vol. 3, No. 2, November 2015, pp. 1-23, ISSN: 2327- 0330 (Online) Available online at www.ijsee.com
16
observed even when orientation angles increased up to 20o. Over all, the seasonal averages were observed
between 0o and 10o with height of frequencies occurring between 0o and 5o.
Table 6. Cumulative power under P-t graph in west-oriented for orientation angles of 0-90o for the selected week
of each month
Orientation Angle
March April May Seasonal average
0o 6.3513 5.8183 4.5964 5.5887 5o 6.2104 5.6585 4.6985 5.5225
10o 6.1329 5.7662 4.4466 5.4486 15o 5.8592 5.4897 4.4907 5.2798 20o 5.7637 5.0712 4.2900 5.0416 25o 5.4678 5.2921 4.1187 4.9595 30o 5.3130 4.9358 3.8058 4.6849 35o 4.9113 4.7586 3.6561 4.4420 40o 4.5654 4.7091 3.4249 4.2331 45o 4.2797 4.1648 3.2457 3.8967 50o 4.1304 3.9372 3.1278 3.7318 55o 3.4686 3.4135 2.5807 3.1543 60o 3.2024 3.0556 2.5935 2.9505 65o 2.9435 2.8385 2.0667 2.6162 70o 2.4729 2.4357 1.8567 2.2551 75o 2.1627 2.2090 1.5778 1.9831 80o 1.9105 1.9375 1.1874 1.6785 85o 1.5729 1.6184 0.8703 1.3539 90o 1.4923 1.4499 0.8624 1.2682
Plots of energy versus orientation angles drawn for west-oriented panel (figure 18) reveal that the energy linearly
decreased with increase in orientation angle. It is clear from these graphs that a unique value exists for each
month of the season for which the solar power is at its peak for the given month. Similar trend has been observed
for the selected days of months selected under present study (see Appendix IV figure 3).
Figure 11. Graph of energy versus time and its trends of west orientation angles.
International Journal of Sustainable Energy and Environment Vol. 3, No. 2, November 2015, pp. 1-23, ISSN: 2327- 0330 (Online) Available online at www.ijsee.com
17
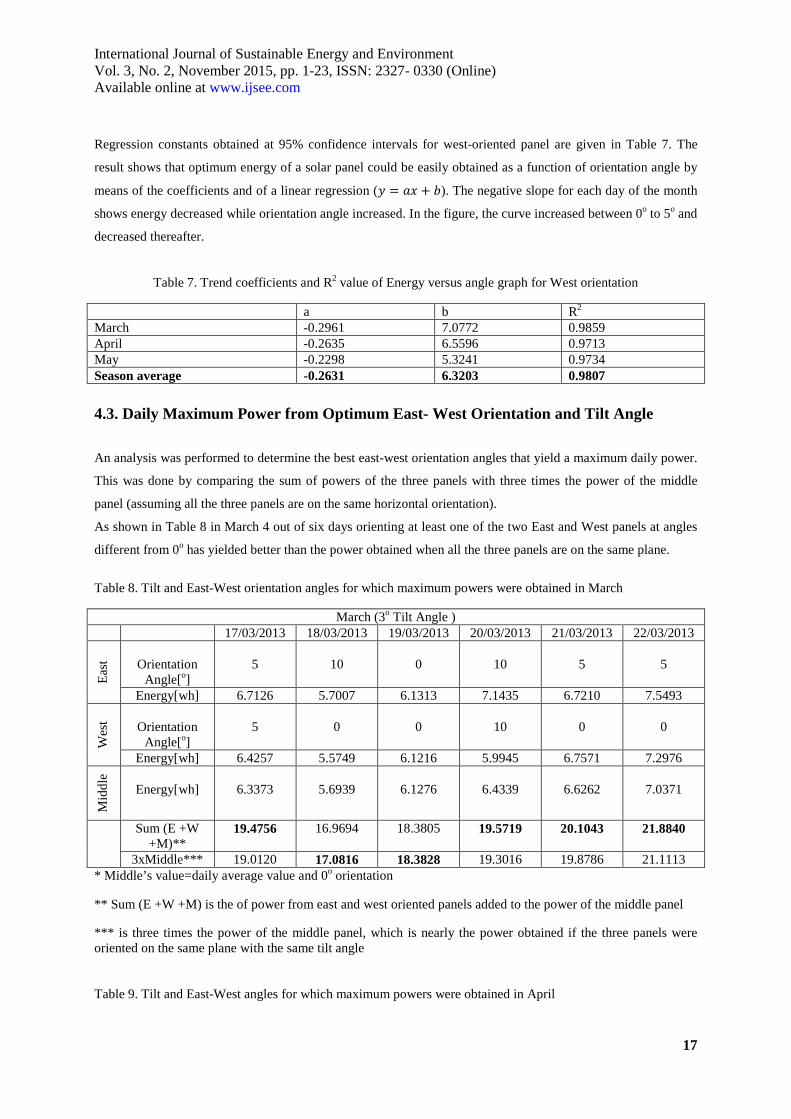
Regression constants obtained at 95% confidence intervals for west-oriented panel are given in Table 7. The
result shows that optimum energy of a solar panel could be easily obtained as a function of orientation angle by
means of the coefficients and of a linear regression (𝑦𝑦 = 𝑎𝑎𝑎𝑎 + 𝑏𝑏). The negative slope for each day of the month
shows energy decreased while orientation angle increased. In the figure, the curve increased between 0o to 5o and
decreased thereafter.
Table 7. Trend coefficients and R2 value of Energy versus angle graph for West orientation
a b R2 March -0.2961 7.0772 0.9859 April -0.2635 6.5596 0.9713 May -0.2298 5.3241 0.9734 Season average -0.2631 6.3203 0.9807
4.3. Daily Maximum Power from Optimum East- West Orientation and Tilt Angle An analysis was performed to determine the best east-west orientation angles that yield a maximum daily power.
This was done by comparing the sum of powers of the three panels with three times the power of the middle
panel (assuming all the three panels are on the same horizontal orientation).
As shown in Table 8 in March 4 out of six days orienting at least one of the two East and West panels at angles
different from 0o has yielded better than the power obtained when all the three panels are on the same plane.
Table 8. Tilt and East-West orientation angles for which maximum powers were obtained in March
March (3o Tilt Angle ) 17/03/2013 18/03/2013 19/03/2013 20/03/2013 21/03/2013 22/03/2013
East
Orientation
Angle[o]
5
10
0
10
5
5
Energy[wh] 6.7126 5.7007 6.1313 7.1435 6.7210 7.5493
Wes
t
Orientation
Angle[o]
5
0
0
10
0
0
Energy[wh] 6.4257 5.5749 6.1216 5.9945 6.7571 7.2976
Mid
dle
Energy[wh]
6.3373
5.6939
6.1276
6.4339
6.6262
7.0371
Sum (E +W +M)**
19.4756 16.9694 18.3805 19.5719 20.1043 21.8840
3xMiddle*** 19.0120 17.0816 18.3828 19.3016 19.8786 21.1113 * Middle’s value=daily average value and 0o orientation
** Sum (E +W +M) is the of power from east and west oriented panels added to the power of the middle panel
*** is three times the power of the middle panel, which is nearly the power obtained if the three panels were oriented on the same plane with the same tilt angle Table 9. Tilt and East-West angles for which maximum powers were obtained in April

International Journal of Sustainable Energy and Environment Vol. 3, No. 2, November 2015, pp. 1-23, ISSN: 2327- 0330 (Online) Available online at www.ijsee.com
18
April (0o Tilt Angle) 15/04/2013 16/04/2013 17/04/2013 18/04/2013 19/04/2013 20/04/2013
East
Orientation
Angle[o]
5
0
0
10
0
5
Energy[Wh] 6.4887 5.5872 5.7191 5.7337 5.4155 6.6248
Wes
t
Orientation
Angle[o]
10
0
0
10
0
10
Energy[Wh] 6.3391 5.3181 5.7339 5.6610 5.6506 6.6944
Mid
dle
Energy[Wh]*
6.2031
5.3261
5.9856
5.6439
5.6132
6.3022
Sum (E+W+M)**
19.0309 16.2314 17.4386 17.0386 16.6793 19.6214
3xMiddle*** 18.6094 15.9783 17.9567 16.9316 16.8396 18.9065 * Middle’s value=daily average value and 0o orientation
** Sum (E +W +M) is the of power from east and west oriented panels added to the power of the middle panel
*** is three times the power of the middle panel, which is nearly the power obtained if the three panels were oriented on the same plane with the same tilt angle Table 10. Tilt and East-West angles for which maximum powers were obtained in May
May (from 3o Tilt Angle) 15/05/2013 16/05/2013 17/05/2013 18/05/2013 19/05/2013 20/05/2013
East
Orientation Angle[o]
5
5
0
5
0
0
Energy[Wh] 4.6770 4.8459 4.8175 4.7622 4.2512 4.3290
Wes
t Orientation Angle[o]
5
5
0
15
20
0
Energy[Wh] 5.4548 4.7854 4.9401 5.0126 4.2441 4.4177
Mid
dle
Energy[Wh]*
4.7005
4.6851
4.7706
5.0134
4.2015
4.2446
Sum (E+W+M)**
14.8323 14.3164 14.5281 14.7883 12.6969 12.9912
3xMiddle*** 14.1014 14.0553 14.3117 15.0403 12.6045 12.7337 * Middle’s value=daily average value and 0o orientation
** Sum (E +W +M) is the of power from east and west oriented panels added to the power of the middle panel
*** is three times the power of the middle panel, which is nearly the power obtained if the three panels were oriented on the same plane with the same tilt angle
In April and May, as shown in Table 9 and 10 four and three out of six days orienting at least one of the two
panels at angles different from 0o has yielded better than the power obtained when all the three panels are on the
same plane, respectively. The maximum solar panel's output vary for the East and West orientation which is due
to an asymmetric distribution of power before and after the midday. The orientation and tilt of the panels directly
relates to the seasonal energy yield of the panels determined optimum tilt angle and orientation for solar
photovoltaic arrays in order to maximize incident solar irradiance exposed on the array, for a specific period of
time.

International Journal of Sustainable Energy and Environment Vol. 3, No. 2, November 2015, pp. 1-23, ISSN: 2327- 0330 (Online) Available online at www.ijsee.com
19
Table 11 shows in March, the maximum solar power output is for a solar panel with tilt 3o and orientation angles
of 5o East and 0o West, respectively. In April, the maximum solar power output is for a solar panel with tilt 0o
and orientation angles of 0o East and 0o West, respectively. In May, the maximum solar power output is for a
surface with tilt 3o and orientation angles of 5o East and 5oWest, respectively. When the optimum orientation and
tilt angle for March and May is considered, increase in the solar power output is 0.34% and 0.16% respectively
compared with three times of Middle solar panel's output. Similarly for April, the reduction is 0.51%. In spring
season, the solar power output is maximised for a surface with tilt angle of 3o oriented 5o east and 0o West. When
the optimum orientation and tilt for this season is considered, decline in the solar power output is 0.27%
compared with Middle solar panel's output.
Table 11. Seasonal Tilt and East-West angles for which average maximum power were obtained
March (3o Tilt Angle) April (0o Tilt Angle) May(3o Tilt Angle) Season
East
Orientation Angle[o]
5
0
5
5
Energy[Wh] 6.4651 5.7828 4.5289 5.5827
Wes
t Orientation Angle[o]
0
0
5
0
Energy[Wh] 6.3513 5.8183 4.6985 5.5887
Mid
dle
Energy[Wh]*
6.3760
5.8457
4.6026
5.6081
Sum(E+M+W)** 19.1924 17.4468 13.8300 16.7795 3xMiddle*** 19.1280 17.5370 13.8078 16.8243
* Middle’s value=daily average value and 0o orientation ** Sum (E +W +M) is the of power from east and west oriented panels added to the power of the middle panel *** is three times the power of the middle panel, which is nearly the power obtained if the three panels were oriented on the same plane with the same tilt angle
In March and May, one or both of East and West facing solar panels orientated at angle different from 0o yielded
maximum daily power when compared to all three panels oriented on the same plane. In spring, the PV output is
maximised for a surface with tilt angle of 3o oriented 5o east. The maximum PV output is for the orientation
slightly east of due south which is due to an asymmetric distribution of insolation before and after the midday
during this season. However, the PV output varies only by 1.5% from the maximum PV output in this season,
when the PV surface orientation lies within 30o east or west from due south. For south-facing horizontal and
vertical surfaces, PV outputs are 7.3% and 53% lower, respectively, than the maximum PV output in spring
(Jayanta et al., 2006).
4.4. Daily Distribution of Solar Energy
Analysis performed to determine daily distribution in solar energy received by the three solar panels at the
monthly optimum tilt angles and East–West orientation angle indicate that difference in orientation of east and
west panels from the middle panel improved solar energy reception during early morning and late afternoon
(Fig.19a). However, it did not improve the total energy received during the day (Fig.19a). Detailed figures are
given in Appendix IV figure 4. Although the voltage of the east/west solar panel deviates by up to 0.27% from
the voltages of the solar panel with middle panel, the energy differences are very small, as can be seen in Table

International Journal of Sustainable Energy and Environment Vol. 3, No. 2, November 2015, pp. 1-23, ISSN: 2327- 0330 (Online) Available online at www.ijsee.com
20
8-11. This is because the voltage of the east/west solar panel follows the voltage of the east solar panel in the
morning and the voltage of the west panel in the afternoon.
(a)
*sum = sum of East, Middle and West
(b)
Figure 12. Daily Distribution of Solar Power
Table 12. East - West Angles for Daily distribution of Power
March
April
May Seasonally

International Journal of Sustainable Energy and Environment Vol. 3, No. 2, November 2015, pp. 1-23, ISSN: 2327- 0330 (Online) Available online at www.ijsee.com
21
Date Angle Date Angle Date Angle
17/03/2013 90 15/04/2013 85 15/05/2013 75 18/03/2013 85 16/04/2013 90 16/05/2013 75 19/03/2013 80 17/04/2013 90 17/05/2013 70 20/03/2013 80 18/04/2013 85 18/05/2013 85 21/03/2013 85 19/04/2013 85 19/05/2013 85 22/03/2013 85 20/04/2013 85 20/05/2013 90
Mean 80 85 80 85
Solar power obtained by 3xmiddle is generally higher between 09:00 and 15:00 hours. But assuming that
batteries can only store energy that can last a couple of hours with 3x middle solar panel power the battery is
exploited for about 18 hours. However, if the solar power can kick in before 9:00 and also contribute after 15:00
hours the loss on the battery reduces and Photovoltaic panels can operate for longer hours. For East - West
orientation between 75o and 90o early and late contribution of east and west panels respectively increase. But,
this happens at the expense of power loss between 9:00 and 15:00 hours. The trade-off must be decided based on
the capacity of the battery and the device that uses photovoltaic power.
5. Summary and Conclusion The study was conducted to determine the optimal North – South tilt angle and East – West orientation angles
for solar PV systems at Haramaya University. A total of sixteen tilt angles ranging between 0 and 45 (with 3o
intervals) and 19 orientation angles 0 to 90o (with intervals of 5o were used). Measurements were made for three
weeks with one week from every month over three months of the spring season. The result shows that the tilt
angle at which the solar panel generated maximum power output was 3o in March and May and 0o in April. The
maximum solar power output is for a solar panel with orientation angles of 5o East and 0o West, 0o East and 0o
West and 5o East and 5o West in March, April and May, respectively. The seasonal average of the North – South
optimum tilt angle is 3o, and East - West optimum orientation angle is 5o East and 0o West. When Solar panel set
at the monthly tilt angle, there is increase of 9.15 %, 12.34% in March and May, respectively as compared to 0o
tilt angle. Similarly there is increase of 5.51% the PV array power output when the PV is set at seasonal tilt
angle.
The power generated by a solar panel is dependent on the angle at which it is tilted and the orientation of the
solar panel. Improper orientation of the solar panel would eventually lead to loss in power and poor return on
investment. By implication, this means that solar energy conversion designed based on monthly average daily
solar and weather data should be designed to track the solar radiation at the above mentioned angles for the
months of March, April and May for optimum system performance. For maximum energy gain, solar panels
should be inclined at optimal tilt angle and seasonal adjustment of the panel may lead to considerable gain in
power obtained from solar energy. The optimum North – south tilt angle and East- West orientation angle is
different for each months of the season and shows variation in the direction of sun with time of day and month of
the season. The collected solar energy will be greater if we choose the optimum panel tilt for the season. For
higher efficiency, the solar panel should be designed such that the angle of tilt can easily be changed at least on a
seasonal basis, if not monthly.

International Journal of Sustainable Energy and Environment Vol. 3, No. 2, November 2015, pp. 1-23, ISSN: 2327- 0330 (Online) Available online at www.ijsee.com
22
ACKNOWLEDGEMENT First and foremost, I thank the Almighty God who gave me the health, the stamina and strength to go through the
rigor of graduate study and helped me to finish the research work, thesis write-up and to successfully complete
my study.
I would like to express my heart-felt appreciation and special gratitude to all persons who, in one way or the
other contributed to the accomplishment of the study. Special appreciation and deepest thanks go to the thesis
research advisors Dr. Gelana Amente and Dr. Girma Goro (Haramaya University) for their continued guidance,
inspiration, encouragement and support throughout the study period, which made completion of this study
smooth and successful. All comments made by both advisors have improved the thesis substantially.
The welcome and kind-hearted treatment of the staff of the Physics Department of Haramaya University is
sincerely acknowledged. I would like to thank Haramaya University staffs for their dedicated help in mobilizing
and organizing all the necessary facilities that enabled me to accomplish this work successfully.
I would like also to acknowledge the Ministry of Education (MOE) and Aksum University for the support
offered in paying the research budget during his study.
My particular gratitude and appreciations go to my mother Addis Yimesigen, my father Belay Muna, my sister
Etayehu Belay and Alemtsehay Aynalem for her love.
Last, but not the least, I remain sincere, grateful and indebted to Takele Zimale who helped me in carpentry work
of the experimental set up and my beloved friends, Zelalem Shelemew for his daily advice and help as a real
friend, Wondafrash Abebe who made me patient and strong, and all my other friends and neighbors for their
words of encouragement and support, which served me as a source of strength throughout the course of study.
6. REFERENCES
[1] Amita, C. and T. Yogesh, 2013. Optimization of Solar Power by varying Tilt Angle/Slope [2] Duffie, J.A. and W.A. Beckman, 1991. Solar engineering of thermal processes, 2nded.Wiley. [3] Jamil Ahmad, M. and G.N. Tiwari, 2009. Optimization of Tilt Angle for Solar Collector to Receive Maximum Radiation; Centre for Energy Studies, Indian Institute of Technology Delhi, HauzKhas, New Delhi-11 00 16, India [4] Jayanta, D., Deb Mondol, Yigzaw, G. Yohanis and Brian Norton, 2006. The impact of array inclination and orientation on the performance of a grid-connected photovoltaic system, Dublin 2, Ireland. [5] Murat Kacira, Mehmet Simsek, Yunus Babur and Sedat Demirkol, 2004. Determining optimum tilt angles and orientations of photovoltaic panels in Sanliurfa, Turkey. [6] Perez, R. and S. Coleman, 1993. Survey on Solar irradiation, Power Generation and Optimum inclined Angle of Cell module. Home Power; n.34 p.14-16; London

International Journal of Sustainable Energy and Environment Vol. 3, No. 2, November 2015, pp. 1-23, ISSN: 2327- 0330 (Online) Available online at www.ijsee.com
23
[7] Sharew Anteneh, 2007. Solar Energy Assessment in Ethiopia: Modelling and Measurement. Msc thesis; Addis Ababa University. [8] Yakup, M., A.Q. Malik, 2001. Optimum tilt angle and orientation for solar collector in Brunei Darussalam. Renewable Energy: 24:223–34