estimation of diurnal cycle of land surface temperature at
TRANSCRIPT

Remote Sens. 2014, 6, 3247-3262; doi:10.3390/rs6043247
remote sensing ISSN 2072-4292
www.mdpi.com/journal/remotesensing
Article
Estimation of Diurnal Cycle of Land Surface Temperature
at High Temporal and Spatial Resolution from Clear-Sky
MODIS Data
Si-Bo Duan 1,2
, Zhao-Liang Li 3,4,
*, Bo-Hui Tang 1, Hua Wu
1, Ronglin Tang
1, Yuyun Bi
3
and Guoqing Zhou 5
1 State Key Laboratory of Resources and Environment Information System, Institute of Geographic
Sciences and Natural Resources Research, Chinese Academy of Sciences, Beijing 100101, China;
E-Mails: [email protected] (S.D.); [email protected] (B.T.); [email protected] (H.W.);
[email protected] (R.T.) 2
University of Chinese Academy of Sciences, Beijing 100049, China 3
Key Laboratory of Agri-Informatics, Ministry of Agriculture/Institute of Agricultural Resources and
Regional Planning, Chinese Academy of Agricultural Sciences, Beijing 100081, China;
E-Mail: [email protected] 4
ICube, UdS, CNRS, 300 Bld Sebastien Brant, CS10413, F-67412 Illkirch, France 5 Guangxi Key Laboratory of Spatial Information and Geomatics, Guilin University of Technology,
Guangxi 541004, China; E-Mail: [email protected]
* Author to whom correspondence should be addressed; E-Mail: [email protected];
Tel.: +86-10-8210-5077.
Received: 3 March 2014; in revised form: 2 April 2014 / Accepted: 4 April 2014 /
Published: 10 April 2014
Abstract: The diurnal cycle of land surface temperature (LST) is an important element of
the climate system. Geostationary satellites can provide the diurnal cycle of LST with low
spatial resolution and incomplete global coverage, which limits its applications in some
studies. In this study, we propose a method to estimate the diurnal cycle of LST at high
temporal and spatial resolution from clear-sky MODIS data. This method was evaluated
using the MSG-SEVIRI-derived LSTs. The results indicate that this method fits the diurnal
cycle of LST well, with root mean square error (RMSE) values less than 1 K for most pixels.
Because MODIS provides at most four observations per day at a given location, this method
was further evaluated using only four MSG-SEVIRI-derived LSTs corresponding to the
MODIS overpass times (10:30, 13:30, 22:30, and 01:30 local solar time). The results show
that the RMSE values using only four MSG-SEVIRI-derived LSTs are approximately two
OPEN ACCESS

Remote Sens. 2014, 6 3248
times larger than those using all LSTs. The spatial distribution of the modeled LSTs at the
MODIS pixel scale is presented from 07:00 to 05:00 local solar time of the next day with an
increment of 2 hours. The diurnal cycle of the modeled LSTs describes the temporal
evolution of the LSTs at the MODIS pixel scale.
Keywords: land surface temperature (LST); diurnal temperature cycle (DTC); MODIS;
MSG-SEVIRI
1. Introduction
Land surface temperature (LST) and its diurnal variation are crucial for the physical processes of land
surface energy and water balance at regional and global scales [1–6]. The diurnal cycle of LST is
closely related to solar insolation, the state of the atmosphere, and surface characteristics, e.g., soil type,
soil moisture, and vegetation cover [7]. Satellite remote sensing provides the unique way to measure the
diurnal cycle of LST over extended regions [8–10].
The diurnal cycle of LST has been used for a wide variety of applications. For example, the diurnal
cycle of LST was used to analyze the urban thermal environment [11–14]. In addition, the diurnal cycle
of LST was used to normalize the satellite-derived LSTs at different times to the same time [15,16]. Jin
and Treadon [17] used the diurnal cycle of LST to correct the orbit drift effects on the National Oceanic
and Atmospheric Administration (NOAA) Advanced Very-High-Resolution Radiometer (AVHRR)
LST measurements. Schroedter-Homscheidt et al. [18] retrieved total water vapor column from
Meteosat Second Generation -Spinning Enhanced Visible and Infrared Imager (MSG-SEVIRI) data
with the aid of the diurnal cycle of LST.
Geostationary satellites with high temporal resolution have become increasingly attractive for their
ability to fully characterize the diurnal cycle of LST. However, the diurnal cycle of LST with low
spatial resolution (e.g., 3 km at nadir for MSG-SEVIRI) and incomplete global coverage limits its
applications in some studies, e.g., urban heat island [14]. Compared with geostationary satellite data,
polar-orbiting satellite data (e.g., MODIS and NOAA-AVHRR) have high spatial resolution of
approximately 1 km at nadir. Therefore, various methods have been developed to estimate the diurnal
cycle of LST at high temporal and spatial resolution from polar-orbiting satellite measurements. Jin and
Dickinson [19] estimated the diurnal cycle of LST by interpolating NOAA-AVHRR twice-per-day
measurements into the typical patterns of the diurnal cycle of LST, which were derived from climate
models. Sun and Pinker [20] performed work similar to that of Jin and Dickinson [19], but the typical
patterns of the diurnal cycle of LST were derived from Geostationary Operational Environmental
Satellite (GOES) measurements. Inamdar et al. [21] developed an algorithm to disaggregate the diurnal
cycle of LST at the GOES pixel scale to that at the MODIS pixel scale. Zhou et al. [14] used a diurnal
temperature cycle generic algorithm to estimate the diurnal cycle of LST at the MODIS pixel scale with
the aid of the diurnal cycle of the FY-2C-derived LST.
The methods described above can be used to estimate the diurnal cycle of LST at high temporal and
spatial resolution from polar-orbiting satellite measurements. Nevertheless, these methods require the
typical patterns of the diurnal cycle of LST, which are derived from climate models or geostationary
Remote Sens. 2014, 6 3249
satellite measurements. Therefore, a simple and straightforward method for estimating the diurnal cycle
of LST at high temporal and spatial resolution only using polar-orbiting satellite data is needed. The
objective of this study is to develop a method to estimate the diurnal cycle of LST at high and spatial
resolution only using MODIS LST measurements. This paper is organized as follows: Section 2
describes the study area and the data used in this study. Section 3 describes the method for estimating the
diurnal cycle of LST from MODIS LST measurements. The results and discussion are presented in
Section 4. Conclusions are presented in the last section.
2. Study Area and Data
2.1. Study Area
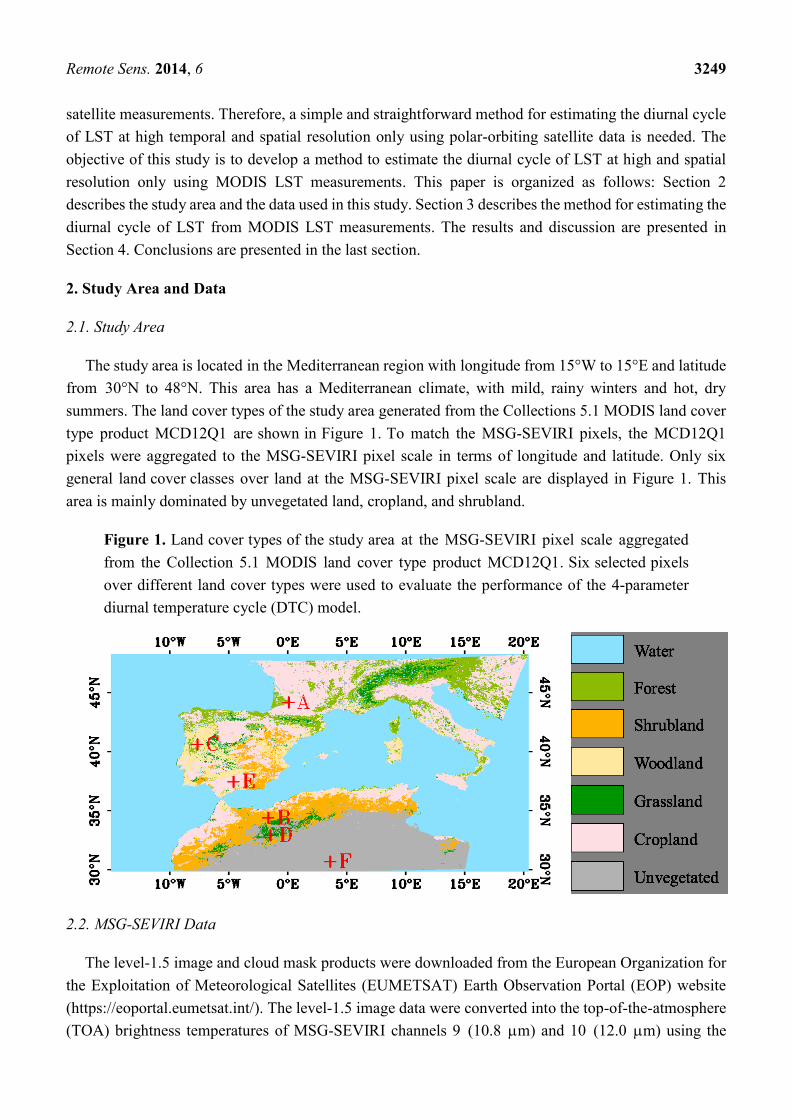
The study area is located in the Mediterranean region with longitude from 15°W to 15°E and latitude
from 30°N to 48°N. This area has a Mediterranean climate, with mild, rainy winters and hot, dry
summers. The land cover types of the study area generated from the Collections 5.1 MODIS land cover
type product MCD12Q1 are shown in Figure 1. To match the MSG-SEVIRI pixels, the MCD12Q1
pixels were aggregated to the MSG-SEVIRI pixel scale in terms of longitude and latitude. Only six
general land cover classes over land at the MSG-SEVIRI pixel scale are displayed in Figure 1. This
area is mainly dominated by unvegetated land, cropland, and shrubland.
Figure 1. Land cover types of the study area at the MSG-SEVIRI pixel scale aggregated
from the Collection 5.1 MODIS land cover type product MCD12Q1. Six selected pixels
over different land cover types were used to evaluate the performance of the 4-parameter
diurnal temperature cycle (DTC) model.
2.2. MSG-SEVIRI Data
The level-1.5 image and cloud mask products were downloaded from the European Organization for
the Exploitation of Meteorological Satellites (EUMETSAT) Earth Observation Portal (EOP) website
(https://eoportal.eumetsat.int/). The level-1.5 image data were converted into the top-of-the-atmosphere
(TOA) brightness temperatures of MSG-SEVIRI channels 9 (10.8 m) and 10 (12.0 m) using the

Remote Sens. 2014, 6 3250
SEVIRI Pre-processing Toolbox (SPT) software. The LST retrieval algorithms [22,23] were used to
derive LST from the TOA brightness temperatures of MSG-SEVIRI channels 9 and 10. Only the pixels
identified as clear sky over land in the cloud mask product were used in this study. To evaluate the
performance of the proposed method, MSG-SEVIRI data on 28 January, 9 April, 31 July, and 1
October 2010 were used in this study. These four days are the days with the most cloud-free pixels in
January, April, July, and October 2010, which represent four seasons of the year.
2.3. MODIS Data
The MODIS/Terra and MODIS/Aqua Land Surface Temperature and Emissivity Daily L3 Global
1-km SIN Grid products (MOD11A1 and MYD11A1, Collection 5) downloaded from the Reverb
website (http://reverb.echo.nasa.gov/) were used in this study. The MOD11A1 and MYD11A1 products
provide per-pixel LST and emissivity values at 1-km resolution using the generalized split-window
algorithm [24]. LST, observation time (local solar time), and quality control (QC) were extracted from
the MOD11A1 and MYD11A1 products. Only the pixels flagged as good quality (i.e., QC = 0) were
used in this study.
3. Methodology
Inamdar et al. [21] developed a two-part, semi-empirical diurnal temperature cycle (DTC) model to
describe the diurnal variations of LST. This DTC model uses a cosine function to predict the evolution of
the daytime LST and a hyperbolic function to describe the decay of the LST at night. Duan et al. [25]
improved this DTC model by deducing the width ω over the half-period of the cosine term from the
thermal diffusion equation. This model is described as:
m0
m0
cos ,
cos ,
ds a s
ns a s s
s
T t T T t t t t
kT t T T T t t T t t
k t t
(1)
with
1 1
m mtan sins s
a
Tk t t t t
T
(2)
m
4
3srt t (3)
All of the meanings of the parameters in the DTC model are illustrated in Figure 2, where and
are the LSTs of the daytime and night-time parts, respectively, t is the time, T0 is the residual temperature
around sunrise, Ta is the temperature amplitude, ω is the width over the half-period of the cosine term, tm is
the time at which the temperature reaches its maximum, tsr is the time of sunrise, ts is the start time of free
attenuation, δT is the temperature difference between T0 and T(t→∞), and k is the attenuation constant.
There are five free parameters in the DTC model, i.e., T0, Ta, δT, tm, and ts. Nevertheless, MODIS
provides at most four observations per day at a given location. To fit the DTC model to MODIS four
observations, at least one of the five DTC model parameters requires to be known as a priori knowledge

Remote Sens. 2014, 6 3251
or as a constraint to the DTC model. Statistical analyses indicate that ts is approximate to be 1 hour
before the time of sunset (tss), which can be seen from Figure 2. Fixing ts at 1 hour before tss cannot
introduce large error into the DTC model, which will illustrate in Section 4.1. We assume that the value
of ts is approximately equal to the value of tss-1. Therefore, there are only four free parameters in the
DTC model, i.e., T0, Ta, δT, and tm. ω and k are calculated using Equations (2) and (3), respectively. tsr
and tss are calculated from solar geometry. In this study, the DTC model with ts treated as a free
parameter is referred to as the 5-parameter model; and the DTC model with ts estimated from tss-1 is
called the 4-parameter model.
Figure 2. Illustration of the DTC model parameters. d
sT and n
sT are the land surface
temperatures (LSTs) of the daytime and night-time parts, respectively, t is the time, T0 is the
residual temperature around sunrise, Ta is the temperature amplitude, ω is the width over the
half-period of the cosine term, tm is the time at which the temperature reaches its maximum,
tsr is the time of sunrise, tss is the time of sunset, ts is the start time of free attenuation, δT is
the temperature difference between T0 and T(t→∞), and k is the attenuation constant.
4 7 10 13 16 19 22 1 4 7285
295
305
315
325
Local solar time (h)
Ts (
K)
0T
aT
T
k
srt sstmt st srt
d
sT t n
sT t
One should keep in mind that (1) these two models have been developed under clear-sky conditions
without significant changes in wind speed; (2) these two models assume the temperature decays freely
after “thermal sunset” at time ts; and (3) these two models cannot be used with satellite observations less
than four times for each day, which is the case encountered in many regions of the world.
4. Results and Discussion
4.1. Evaluation of the 4-parameter DTC Model
Before evaluating the performance of the 4-parameter DTC model, we compared the values of ts
obtained from model fitting (i.e., ts treated as a free parameter) and those of ts estimated from tss-1.
Histograms of the differences between ts obtained from model fitting and ts estimated from tss-1 for all
cloud-free pixels on 28 January, 9 April, 31 July, and 1 October 2010 are shown in Figure 3. The root

Remote Sens. 2014, 6 3252
mean square error (RMSE) values of the ts differences are 0.76 h, 0.87 h, 1.05 h, and 0.40 h on
28 January, 9 April, 31 July, and 1 October 2010, respectively.
Figure 3. Histograms of the differences between ts obtained from model fitting
(i.e., ts treated as a free parameter) and ts estimated from tss-1 for all cloud-free pixels on
(a) 28 January, (b) 9 April, (c) 31 July, and (d) 1 October 2010.
As an example, six pixels over different land cover types on 31 July 2010 were selected to evaluate
the performance of the 4-parameter DTC model. The location of the six selected pixels is shown in
Figure 1 and summarized in Table 1. The 4-parameter DTC model was used to fit the diurnal cycle of the
MSG-SEVIRI-derived LST over the six selected pixels. To avoid the influences of the previous
night-time cooling and of the next day solar heating on the fitting of LST [26,27], the diurnal cycle of the
MSG-SEVIRI-derived LST from 2 hour after sunrise to 1 hour before sunrise of the following day were
used in this study. The fitting results are shown in Figure 4. The RMSE values of the fitting errors are
0.21 K, 0.31 K, 0.32 K, 0.43 K, 0.39 K, and 0.50 K for forest, shrubland, woodland, grassland, cropland,
and unvegetated land, respectively.
Table 1. Detailed information of the six selected pixels.
Site Latitude Longitude Elevation Land Cover Type
A 43.909°N 0.235°E 153.1 m Forest
B 34.161°N 1.677°W 1134.2 m Shrubland
C 40.030°N 7.166°W 381.7 m Woodland
D 33.941°N 0.769°W 1080.4 m Grassland
E 37.405°N 4.326°W 746.2 m Cropland
F 30.642°N 3.564°E 347.6 m Unvegetated

Remote Sens. 2014, 6 3253
Figure 4. Fitting the 4-parameter DTC model to the diurnal cycle of the
MSG-SEVIRI-derived LST on 31 July 2010 for the six selected pixels over different land
cover types: (a) forest, (b) shrubland, (c) woodland, (d) grassland, (e) cropland, and
(f) unvegetated land. Fitting errors of LST are also shown.
We used all cloud-free pixels on 28 January, 9 April, 31 July, and 1 October 2010 to statistically
evaluate the performance of the 4-parameter DTC model. Figure 5 shows the histograms of the RMSE
values of the 4-parameter DTC model fitting the diurnal cycle of the MSG-SEVIRI-derived LST on
these four days. The fitting accuracy of the 4-parameter model is achieved with RMSE values less than
1 K for most pixels. The performance of the 4-parameter model depends on the quality of LST as well
as on atmospheric and surface-wind conditions.
To compare the performance of the 5-parameter DTC model (i.e., the DTC model with ts treated as a
free parameter) and the 4-parameter DTC model (i.e., the DTC model with ts estimated from tss-1), all
cloud-free pixels on 28 January, 9 April, 31 July, and 1 October 2010 were used in this study. The
histograms of the RMSE values of the 5-parameter DTC model fitting the diurnal cycle of the

Remote Sens. 2014, 6 3254
MSG-SEVIRI-derived on these four days are shown in Figure 6. The fitting accuracy of the
5-parameter DTC model is also achieved with RMSE values less than 1 K for most pixels. Comparing
Figure 5 with Figure 6, the fitting accuracy of the 4-parameter DTC model is slightly less than that of
the 5-parameter DTC model. These results demonstrate that fixing ts at tss-1 has no significant influences
on the fitting accuracies of the 4-parameter DTC model.
Figure 5. Histograms of the RMSE values of the 4-parameter DTC model fitting the
diurnal cycle of the MSG-SEVIRI-derived LST for all cloud-free pixels on (a) 28 January,
(b) 9 April, (c) 31 July, and (d) 1 October 2010.
Figure 6. Histograms of the RMSE values of the 5-parameter DTC model fitting the
diurnal cycle of the MSG-SEVIRI-derived LST for all cloud-free pixels on (a) 28 January,
(b) 9 April, (c) 31 July, and (d) 1 October 2010.

Remote Sens. 2014, 6 3255
Figure 6. Cont.
4.2. Fitting the 4-Parameter DTC Model to Four Observations
As mentioned previously, MODIS provides at most four observations per day at a given location. We
assume that only four MSG-SEVIRI-derived LSTs corresponding to the MODIS overpass times (10:30,
13:30, 22:30, and 01:30 local solar time) for each day are available. The remaining MSG-SEVIRI-derived
LSTs were used to evaluate the performance of the 4-parameter DTC model fitting only four observations.
The fitting results over the six selected pixels (see Table 1) on 31 July 2010 are shown in Figure 7. The
RMSE values of the fitting errors are 0.57 K, 0.66 K, 0.66 K, 0.91 K, 0.79 K, and 0.75 K for forest,
shrubland, woodland, grassland, cropland, and unvegetated land, respectively. Comparing Figure 7 with
Figure 4, the RMSE values using only four LSTs are approximately two times larger than those using all
LSTs. Relatively larger fitting errors can be observed between approximately 18:00 and 21:00 local solar
time (see Figure 7a,c,d) as well as the periods before 09:00 local solar time (see Figure 7d–f), due to the
lack of LST measurements over these periods.
Figure 7. Fitting the 4-parameter DTC model to only four MSG-SEVIRI-derived LSTs on
31 July 2010 for the six selected pixels over different land cover types: (a) forest,
(b) shrubland, (c) woodland, (d) grassland, (e) cropland, and (f) unvegetated land. Fitting
errors of LST are also shown. Filled squares represent the LSTs corresponding to the
MODIS overpass times (10:30, 13:30, 22:30, and 01:30 local solar time).

Remote Sens. 2014, 6 3256
Figure 7. Cont.
All cloud-free pixels on 28 January, 9 April, 31 July, and 1 October 2010 were used to statistically
analyze the RMSE values of the 4-parameter DTC model fitting only four LSTs. Histograms of the
RMSE values on these four days are shown in Figure 8. The RMSE values of the 4-parameter DTC
model fitting only four MSG-SEVIRI-derived LSTs are less than 2 K for most pixels. Comparing
Figure 8 with Figure 5, the RMSE values using only four LSTs are approximately two times larger than
those using all LSTs.
Figure 8. Histograms of the RMSE values of the 4-parameter DTC model fitting only four
MSG-SEVIRI-derived LSTs for all cloud-free pixels on (a) 28 January, (b) 9 April,
(c) 31 July, and (d) 1 October 2010.

Remote Sens. 2014, 6 3257
Figure 8. Cont.
4.3. Application to MODIS Data
The 4-parameter DTC model was used to fit four MODIS LSTs for each day (MOD11A1 and
MYD11A1, daytime and night-time). As an example, the diurnal cycle of LST at the MODIS pixel scale
over the six selected pixels (see Table 1) on 31 July 2010 is shown in Figure 9. The accuracy of the
modeled LSTs depends on those of the four MODIS LSTs. Fitting the 4-parameter DTC model to the
LSTs with errors may lead to large errors on the modeled LSTs due to numerical computation.
Figure 9. Fitting the 4-parameter DTC model to four MODIS LSTs (filled squares) on
31 July 2010 for the six selected pixels over different land cover types: (a) forest,
(b) shrubland, (c) woodland, (d) grassland, (e) cropland, and (f) unvegetated land.

Remote Sens. 2014, 6 3258
Figure 9. Cont.
The modeled LSTs are not validated due to the lack of in situ measurements or remotely sensed data
from another source. Validation of LST at the satellite pixel scale is challenging because LST can vary
significantly within a pixel and change within relatively short time periods [28]. In theory, the four
MODIS LSTs should be normalized to the same view angle (e.g., at nadir) before fitting the 4-parameter
DTC model to the four MODIS LSTs. Although the directional effects (angular anisotropy) in the LST
have been demonstrated at the satellite pixel scale [29–32], there is not any practical way to perform
angular normalization of satellite-derived LST, because of the complexity of this normalization.
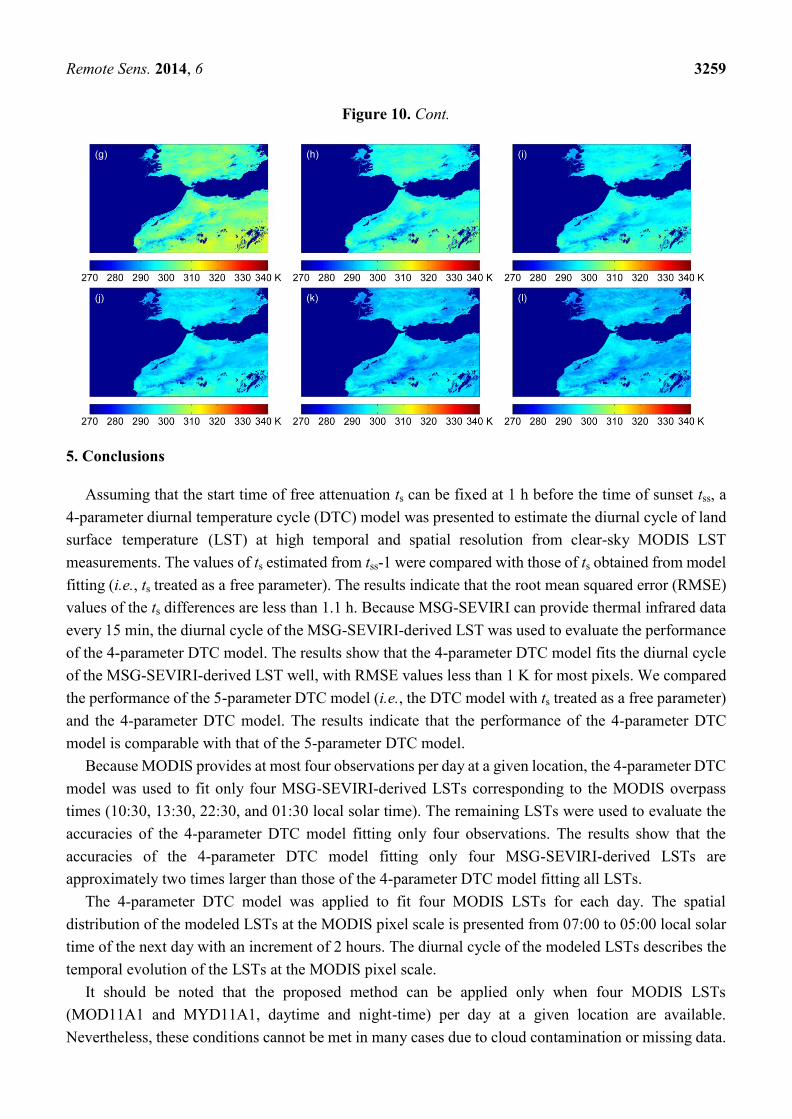
An area covered by the MODIS sinusoidal tile H17V05 was selected as an example to display the
spatial distribution of the modeled LSTs at the MODIS pixel scale. We modeled the LSTs spanning
from 07:00 to 05:00 local solar time of the next day with an increment of 2 h. The LSTs between 05:00
and 07:00 local solar time of the next day were not modeled due to large model error over these
periods. The modeled LSTs are shown in Figure 10. These maps describe the temporal evolution of the
LSTs at the MODIS pixel scale.
Figure 10. Spatial distribution of the modeled LSTs at the MODIS pixel scale spanning
from 07:00 to 05:00 local solar time of the next day with an increment of 2 h.
Remote Sens. 2014, 6 3259
Figure 10. Cont.
5. Conclusions
Assuming that the start time of free attenuation ts can be fixed at 1 h before the time of sunset tss, a
4-parameter diurnal temperature cycle (DTC) model was presented to estimate the diurnal cycle of land
surface temperature (LST) at high temporal and spatial resolution from clear-sky MODIS LST
measurements. The values of ts estimated from tss-1 were compared with those of ts obtained from model
fitting (i.e., ts treated as a free parameter). The results indicate that the root mean squared error (RMSE)
values of the ts differences are less than 1.1 h. Because MSG-SEVIRI can provide thermal infrared data
every 15 min, the diurnal cycle of the MSG-SEVIRI-derived LST was used to evaluate the performance
of the 4-parameter DTC model. The results show that the 4-parameter DTC model fits the diurnal cycle
of the MSG-SEVIRI-derived LST well, with RMSE values less than 1 K for most pixels. We compared
the performance of the 5-parameter DTC model (i.e., the DTC model with ts treated as a free parameter)
and the 4-parameter DTC model. The results indicate that the performance of the 4-parameter DTC
model is comparable with that of the 5-parameter DTC model.
Because MODIS provides at most four observations per day at a given location, the 4-parameter DTC
model was used to fit only four MSG-SEVIRI-derived LSTs corresponding to the MODIS overpass
times (10:30, 13:30, 22:30, and 01:30 local solar time). The remaining LSTs were used to evaluate the
accuracies of the 4-parameter DTC model fitting only four observations. The results show that the
accuracies of the 4-parameter DTC model fitting only four MSG-SEVIRI-derived LSTs are
approximately two times larger than those of the 4-parameter DTC model fitting all LSTs.
The 4-parameter DTC model was applied to fit four MODIS LSTs for each day. The spatial
distribution of the modeled LSTs at the MODIS pixel scale is presented from 07:00 to 05:00 local solar
time of the next day with an increment of 2 hours. The diurnal cycle of the modeled LSTs describes the
temporal evolution of the LSTs at the MODIS pixel scale.
It should be noted that the proposed method can be applied only when four MODIS LSTs
(MOD11A1 and MYD11A1, daytime and night-time) per day at a given location are available.
Nevertheless, these conditions cannot be met in many cases due to cloud contamination or missing data.

Remote Sens. 2014, 6 3260
To obtain the diurnal cycle of LST at the MODIS pixel scale with global coverage, it is necessary to
reconstruct the LST before applying the proposed method to the MODIS LSTs. Although several LST
reconstruction methods have been developed [33–35], further investigation is still required.
Acknowledgments
This work was supported by the Chinese 973 Program under Grant 2013CB733402 and by the
National Natural Science Foundation of China under Grants 41231170 and 41162011.
Author Contributions
Si-Bo Duan wrote the manuscript and was responsible for the research design, data preparation and
analysis. Zhao-Liang Li, Bo-Hui Tang, and Hua Wu conceived and designed the research. Ronglin Tang,
Yuyun Bi, and Guoqing Zhou collected, processed, and analyzed the remotely sensed data.
Conflicts of Interest
The authors declare no conflict of interest.
References and Notes
1. Scarino, B.; Minnis, P.; Palikonda, R.; Reichle, R.H.; Morstad, D.; Yost, C.; Shan, B.; Liu, Q.
Retrieving clear-sky surface skin temperature for numerical weather prediction application from
geostationary satellite data. Remote Sens. 2013, 5, 342–366.
2. Wan, Z.; Li, Z.-L. A physics-based algorithm for retrieving land surface emissivity and
temperature from EOS/MODIS data. IEEE Trans. Geosci. Remote Sens. 1997, 35, 980–996.
3. Li, Z.-L.; Tang, R.; Wan, Z.; Bi, Y.; Zhou, C.; Tang, B.; Yan, G.; Zhang, X. A review of current
methodologies for regional evapotranspiration estimation from remotely sensed data. Sensors 2009,
9, 3801–3853.
4. Li, Z.-L.; Tang, B.-H.; Wu, H.; Ren, H.; Yan, G.; Wan, Z.; Trigo, I.F.; Sobrino, J.A.
Satellite-derived land surface temperature: Current status and perspectives. Remote Sens. Environ.
2013, 131, 14–37.
5. Cho, A.-R.; Suh, M.-S. Evaluation of land surface temperature operationally retrieved from
Korean geostationary satellite (COMS) data. Remote Sens. 2013, 5, 3951–3970.
6. Li, Z.-L.; Wu, H.; Wang, N.; Qiu, S.; Sobrino, J.A.; Wan, Z.; Tang, B.-H.; Yan, G. Land surface
emissivity retrieval from satellite data. Int. J. Remote Sens. 2013, 34, 3084–3127.
7. Ignatov, A.; Gutman, G. Monthly mean diurnal cycles in surface temperatures over land for global
climate studies. J. Climate 1999, 12, 1900–1910.
8. Aires, F.; Prigent, C.; Rossow, W. Temporal interpolation of global surface skin temperature
diurnal cycle over land under clear and cloudy conditions. J. Geophys. Res. 2004, 109, 1–18.
9. Duan, S.-B.; Li, Z.-L.; Wang, N.; Wu, H.; Tang, B.-H. Evaluation of six land-surface diurnal
temperature cycle models using clear-sky in situ and satellite data. Remote Sens. Environ. 2012,
124, 15–25.

Remote Sens. 2014, 6 3261
10. Duan, S.-B.; Li, Z.-L.; Tang, B.-H.; Wu, H.; Tang, R. Direct estimation of land-surface diurnal
temperature cycle model parameters from MSG-SEVIRI brightness temperatures under clear sky
conditions. Remote Sens. Environ. 2014, in press.
11. Keramitsoglou, I.; Kiranoudis, C.T.; Weng, Q. Downscaling geostationary land surface
temperature imagery for urban analysis. IEEE Geosci. Remote Sens. Lett. 2013, 10, 1253–1257.
12. Zhan, W.; Chen, Y.; Voogt, J.; Zhou, J.; Wang, J.; Liu, W.; Ma, W. Interpolating diurnal surface
temperatures of an urban facet using sporadic thermal observations. Build. Environ. 2012, 57,
239–252.
13. Bechtel, B.; Zakšek, K.; Hoshyaripour, G. Downscaling land surface temperature in an urban
area: A case study for Hamburg, Germany. Remote Sens. 2012, 4, 3184–3200.
14. Zhou, J.; Chen, Y.; Zhang, X.; Zhan, W. Modelling the diurnal variations of urban heat islands with
multi-source satellite data. Int. J. Remote Sens. 2013, 34, 7568–7588.
15. Duan, S.-B.; Li, Z.-L.; Tang, B.-H.; Wu, H.; Tang, R. Generation of a time-consistent land surface
temperature product from MODIS data. Remote Sens. Environ. 2014, 140, 339–349.
16. Jiang, G. Retrieval of Land Surface Emissivity and Land Surface Temperature from MSG1-SEVIRI
Data. Ph.D. Dissertation, University of Strasbourg, Strasbourg, France, 2007.
17. Jin, M.; Treadon, R.E. Correcting the orbit drift effect on AVHRR land surface skin temperature
measurements. Int. J. Remote Sens. 2003, 24, 4543–4558.
18. Schroedter-Homscheidt, M.; Drews, A.; Heise, S. Total water vapour column retrieval from
MSG-SEVIRI split window measurements exploiting the daily cycle of land surface temperature.
Remote Sens. Environ. 2008, 112, 249–258.
19. Jin, M.; Dickinson, R.E. Interpolation of surface radiative temperature measured from polar
orbiting satellites to a diurnal cycle 1. Without clouds. J. Geophys. Res. 1999, 104, 2105–2116.
20. Sun, D.; Pinker, R. Implementation of GOES-based land surface temperature diurnal cycle to
AVHRR. Int. J. Remote Sens. 2005, 26, 3975–3984.
21. Inamdar, A.K.; French, A.; Hook, S.; Vaughan, G.; Luckett, W. Land surface temperature retrieval
at high spatial and temporal resolutions over the southwestern United States. J. Geophys. Res. 2008,
113, D07107, doi:10.1029/2007JD009048.
22. Jiang, G.; Li, Z.-L. Split-window algorithm for land surface temperature estimation from
MSG1-SEVIRI data. Int. J. Remote Sens. 2008, 29, 6067–6074.
23. Jiang, G.; Li, Z.-L.; Nerry, F. Land surface emissivity retrieval from combined mid-infrared and
thermal infrared data of MSG-SEVIRI. Remote Sens. Environ. 2006, 105, 326–340.
24. Wan, Z.; Dozier, J. A generalized split-window algorithm for retrieving land-surface temperature
from space. IEEE Trans. Geosci. Remote Sens. 1996, 34, 892–905.
25. Duan, S.-B.; Li, Z.-L.; Wu, H.; Tang, B.-H.; Jiang, X.; Zhou, G. Modeling of day-to-day temporal
progression of clear-sky land surface temperature. IEEE Geosci. Remote Sens. Lett. 2013, 10,
1050–1054.
26. Göttsche, F.-M.; Olesen, F.-S. Modelling of diurnal cycles of brightness temperature extracted from
METEOSAT data. Remote Sens. Environ. 2001, 76, 337–348.
27. Göttsche, F.-M.; Olesen, F.-S. Modelling the effect of optical thickness on diurnal cycles of land
surface temperature. Remote Sens. Environ. 2009, 113, 2306–2316.

Remote Sens. 2014, 6 3262
28. Frey, C.M.; Kuenzer, C.; Dech, S. Quantitative comparison of the operational NOAA-AVHRR
LST product of DLR and the MODIS LST product V005. Int. J. Remote Sens. 2012, 33,
7165–7183.
29. Pinheiro, A.C.T.; Privette, J.L.; Guillevic, P. Modeling the observed angular anisotropy of land
surface temperature in a savanna. IEEE Trans. Geosci. Remote Sens. 2006, 44, 1036–1047.
30. Pinheiro, A.C.T.; Privette, J.L.; Mahoney, R.; Tucker, C.J. Directional effects in a daily AVHRR
land surface temperature dataset over Africa. IEEE Trans. Geosci. Remote Sens. 2004, 42,
1941–1954.
31. Rasmussen, M.O.; Göttsche, F.-M.; Olesen, F.-S.; Sandholt, I. Directional effects on land surface
temperature estimation from Meteosat Second Generation for savanna landscapes. IEEE Trans.
Geosci. Remote Sens. 2011, 49, 4458–4468.
32. Rasmussen, M.O.; Pinheiro, A.C.T.; Proud, S.R.; Sandholt, I. Modeling angular dependences in
land surface temperature from the SEVIRI instrument onboard the Geostationary Meteosat Second
Generation satellites. IEEE Trans. Geosci. Remote Sens. 2010, 48, 3123–3133.
33. Neteler, M. Estimating daily land surface temperature in mountainous environment by
reconstructed MODIS LST data. Remote Sens. 2010, 2, 333–351.
34. Ke, L.; Ding, X.; Song, C. Reconstruction of time-series MODIS LST in central Qinghai-Tibet
Plateau using geostatistical approach. IEEE Geosci. Remote Sens. Lett. 2013, 10, 1602–1606.
35. Hengl, T.; Heuvelink, G.B.M.; Perčec Tadić, M.; Pebesma, E.J. Spatio-temporal prediction of
daily temperatures using time-series of MODIS LST images. Theor. Appl. Climatol. 2012, 107,
265–277.
© 2014 by the authors; licensee MDPI, Basel, Switzerland. This article is an open access article
distributed under the terms and conditions of the Creative Commons Attribution license
(http://creativecommons.org/licenses/by/3.0/).