estimating the health benefits of cycling - itrn and caulfield 2014 itrn.pdf · estimating the...
TRANSCRIPT

Proceedings of the
ITRN2014 4-5th September, University of Limerick
Deenihan and Caulfield: Health Benefits of Cycling
ESTIMATING THE HEALTH BENEFITS OF CYCLING
Gerard Deenihan Trinity College Dublin Brian Caulfield Assistant Professor Trinity College Dublin Abstract
This paper examines the health and economic benefits from the construction of a new segregated cycle way in Ireland. The health economic benefits were estimated using the World Health Organisation’s (WHO) Health Economic Assessment Tool (HEAT). This tool can be used to calculate the health economic benefits from an intervention (construction of a new cycling facility). The data used for this tool was retrieved from the survey that was undertaken in the study area in 2012 and 2013. In total there were 845 responses to this survey. The results of the paper show that the construction of the proposed cycle way would yield significant health and economic benefits if constructed.
INTRODUCTION AND BACKGROUND
Internationally many countries and cities are reporting increases in cycling. Cycling has many benefits, which have been well documented including reducing emissions and congestion, and the health benefits from cycling. This paper seeks to examine the impacts of the health benefits of new cycling infrastructure using a case study of a cycle way, which is being planned in Ireland.
To quantify the economic benefits of the new cycling infrastructure being proposed the WHO HEAT tool was used. The HEAT tool was developed by the WHO in 2011 (1). This tool was specifically developed to measure the health benefits of cycling and to place an economic value on these benefits (1). The purpose of this tool is to create an economic assessment of cycling infrastructure and policies. This tool can be used to examine both existing infrastructure and policies, and analyse the potential benefits of proposed infrastructure and policies.
In many cases, the financial benefits derived from increased cycling from a new policy or new piece of cycling infrastructure may not have direct tangible financial benefits. The calculation of the return on a potential investment from increased health can be a very difficult issue to assess, however HEAT provides a methodology to measure these economic impacts. Increasing the health of a population as a whole usually leads to several marked improvements in many areas. For instance, if the working population is healthier, then there are less sick days taken annually and therefore the population becomes more productive (1). Another aspect is a reduced mortality rate. By reducing the mortality rate, more people are living (longer) and working longer. This healthier population also results in a decrease in the cost of running the health services, as there will be less demand from a healthier population (1). The HEAT tool factors these benefits into the financial analysis of an investment in infrastructure or policy.
It is well documented at both government and academic levels that cycling has a very positive impact on both personal and public health. Many of these studies conclude that any form of increase in the cycling mode share for commuting and for other purposes would result in a corresponding improvement in the health of an individual who cycles. This also results in an increase of the health of a country as a whole where there is a reduction in mortality rate of the population who cycle. From the World Health Organisation (1), it is known that physical inactivity in the world is one of the leading causes of ill health. The

AUTHORS’ SURNAMES: Brief Title 4-5th September, University of Limerick
Proceedings of the
ITRN2014
promotion of active travel behaviour is a “Win-Win” approach as it not only increases everyday activity of individuals, it also has a positive impact on the environment.
Cavill et al (2) found that physical activity was a fundamental way of improving mental and physical health of individuals; however there are many where daily physical activity is not present with very negative consequences on their health. The authors also demonstrate how increased physical activity leads to a reduction in the cardiovascular Disease, Stroke, Cancer, and Type II Diabetes. Increased activity also leads to a reduction in anxiety and depression. Rojas-Rueda et al (3) and de Hartog et al (4) both found that the gains in health from increased activity from a higher level of cycling far outweigh the potential negatives from the increased risk from a traffic accident and the increased exposure to pollution.
Anderson et al (5) documented 13,375 women and 17,265 men over a 14 and a half-year period. Over this period 2,881 women and 5,668 men died. This research found that those who cycle to and from their places of work and education had 40% reduction in their mortality rate. This reduction in mortality rate was the same for both men and women, with no statistically significant difference between the genders. Mindell et al (6) looked at how various different transport modes affect human health in an urban environment. It was found that the benefits of transport (access to work, leisure, education, social contacts) were most experienced by the healthy and the affluent. The harmful effects (air pollution, community severance, injuries) of transport are mostly experienced by the poor, young and old in society. It surmised that a modal shift away from cars in favour of walking and cycling would reduce the harmful aspects of transport and improve the health of individuals in society and would also improve the environment and society.
Hendrikson et al (7) investigated the levels of absenteeism amongst cyclists and non-cyclists. It was discovered that those that cycled to and from their places of work had one day less of absenteeism than those that did not cycle. The authors believe that this reduction is due mainly to the better health of those that cycle and results in a financial gain for an employer. Unwin (8) found that there was a very large potential for improvement in the health of the Britain just from increased levels of cycling. It was found in a study of male civil servants that regular cyclists (those who cycled for at least an hour every week) had less than half the coronary attack rates than non-cyclists. It is known from the Nichols et al (9) that Heart Disease in Britain cost the country £9 Billion. Therefore, it can be deduced that there could be a potentially large reduction in the cost to the British economy from any marked uptake in cycling.
The results presented in this paper examine the potential health economic benefits from the construction of a new cycle way in Ireland. Currently in the field of economic analysis of investment in cycling infrastructure the industry is seeking to demonstrate to policymakers and the general public of the benefits of cycling. The findings of the paper add to the research on estimating the benefits of investment of cycling infrastructure and to show how including health benefits can demonstrate the positive economic benefits of investing in cycling infrastructure.
RESEARCH METHODOLOGY
This section of the paper details the steps used to conduct the HEAT analysis. Specific information regarding cycling in the area needs to be gathered before the HEAT analysis can commence. The basic process and formulas upon which HEAT is as follows:
Step 1. Volume of Cycling Per Person:
• This step requires information on duration, distance, and frequency of cycling trips.
Step 2. Protective Benefit: • This step looks to calculate the present reduction in mortality rate from those
cycling. The reduction in mortality rate as a result of cycling is calculated using Equation 7.1.

Proceedings of the
ITRN2014 4-5th September, University of Limerick
Deenihan and Caulfield: Health Benefits of Cycling
Eq (7.1)
Step 3. Population that Stands to Benefit:
• This step repeats Step 1 and Step 2, except adjusted for the predicted levels of the population that stands to benefit from an intervention.
Step 4. General Parameters: • This step requires information on the intervention such as the buildup
period, the present mortality rate in the country, and over what time frame the benefits are to be measured.
Step 5. Estimate of Economic Savings: • This step combines the results of the previous steps and outputs the
estimated benefits from an intervention. These benefits include: i. A benefit cost ratio based on the input costs of the intervention ii. Reduction in mortality rate iii. The value of a reduction in mortality rate iv. Total value of all benefits from the intervention
The HEAT tool uses estimates of the relative risk of death from any cause among regular cyclists, compared to people who do not cycle regularly. It is based on relative risk data from studies from around the world. The relative risks are applied to the amount of cycling entered by the analyst and a log-linear relationship is assumed between cycling and mortality. In order to prevent inflated values and to keep the analysis accurate, the risk reduction is capped at approximately 50%. The tool uses the mortality rate to calculate the number of people who would normally be expected to die in any given year in the study population. Succeeding this, the reduction in expected deaths in the study population that cycle is calculated from the adjusted relative risk. The tool produces an estimate of economic savings from this calculated reduction in deaths.
Cycle way examined
The HEAT analysis conducted in this study was applied to the area surrounding the proposed cycle route. The cycle route that is planned is along a disused towpath of a canal. The cycle route will be fully separated from any vehicular traffic. The proposed route is approximately 60km long and varies greatly in condition. Some sections of the route are presently used as local roads whereas other sections are overgrown and have become flooded by the canal.
A map indicating outlining the study area can be seen in Figure 1. The specific course of the cycle route is displayed in blue. A buffer zone of 5km was placed around the preferred route. The edges of this zone are displayed in red. This zone encompasses most of the major settlements in the area. The population densities of each electoral district in the area can also be seen. Each green dot represents two people. As expected, the population density increases with proximity to Dublin City. It can be observed how there are many settlements along the preferred route that have high densities relative to the surrounding countryside. The road infrastructure is shown in yellow on the map.

AUTHORS’ SURNAMES: Brief Title 4-5th September, University of Limerick
Proceedings of the
ITRN2014
FIGURE 1 Indicative Map of Preferred Route with Buffer Zone, Population Density, and Roads
Applying HEAT
This section looks at the process that was used to determine the health economic benefits of an intervention. The information required, how it was attained and the analysis performed on the information is outlined. As seen in the steps outlined previously before the HEAT analysis could be performed, specific information regarding cycling in the study area needed to be gathered. A survey was distributed in December of 2012 amongst the National University of Ireland, Maynooth, Intel Ireland and Hewlett Packard offices in Leixlip and to the local Business Association. These institutions and groups were located within 1km of a proposed high quality cycle route. Extensive analysis was also conducted into the 2011 census statistics of the electoral districts located within the buffer zone of 5km.
The design and layout of the HEAT tool was studied and the logic behind the process was mapped. For the present day evaluation of cycling benefits, information was required on the number of trips per day, per person, and the number of days on average a person cycles. The average distance of these trips, and the number of people undertaking these trips also needed to be identified. From this, a baseline was established, from which, the benefits of an intervention (new cycling infrastructure) could be determined. Following from the establishment of a baseline, information on the potential and predicted usage from an intervention is necessary. The information required is the same as the pre-intervention data, except that this data is what is predicted and therefore determines the potential benefits.
In Figure 2, the questions used to extract the necessary information can be seen. The questions posed were in relation to the regularity of present day cycling of the cycling, and commute distance and time. The respondents were presented with “What if” questions in relation to the creation of a high quality cycling facility along the proposed cycle route.

Proceedings of the
ITRN2014 4-5th September, University of Limerick
Deenihan and Caulfield: Health Benefits of Cycling
FIGURE 2 Screenshot of Questions Pertaining to the HEAT Analysis
Data Gathered
There were in total 845 valid responses to the survey. In Table 1, a selection of the responses from the survey undertaken in 2012 and 2013 can be viewed. It can be seen that 27% of the respondents cycled to and from their place of work and education. Presently at a national level in Ireland, the percentage of people cycling to and from their place of work and education is 2.2 % (10). In Dublin, the percentage of people commuting to and from their place of education and work is 5%. Therefore, it can be seen how there is a bias in the sample of people surveyed. However, the section containing the means of travel of those who do not cycle to and from work provides a reasonably good representation of the country with the percentages matching approximately with the national figures. The numbers and

AUTHORS’ SURNAMES: Brief Title 4-5th September, University of Limerick
Proceedings of the
ITRN2014
percentages of those that said they would use a cycle route constructed along the Royal Canal towpath are shown in Table 1. It can be seen that 56% said that they would use the cycle route to commute from their place of work/education and 29% said they wouldn’t.
TABLE 1 Selection of Information Gathered from the Survey Information from Survey Numbers Percentage People who cycle to and from their place of work/education 229 27 People who do not cycle to and from their place of work/education 616 73 Total 845 100 People who to not cycle to and from their place of work/education, what were their means of travel Motor Vehicle (Driver) 214 35 Motor Vehicle (Passenger) 29 5 Walk 128 21 Bus 77 12 Train 63 10 Missing (Excluding Cyclists) 105 17 Total 616 100 If a high quality cycling facility was constructed along the Royal Canal Towpath, would you use the facility to commute to and from your place of work/education Yes 472 56 No 199 24 Missing 174 21 Total 845 100
The personal information of the respondents and the demographic information from the census data from the study area and the national census statistics can be viewed in Table 2. The census statistics were gathered from the POWSCAR dataset which is produced by the Central Statistics Office in Ireland (10). The census statistics from the study area in Table 2 compares favorably to the national census statistics in terms of providing a representation of the country. It can then be seen that many of the categories from the survey are comparable to the census statistics from the local study area and the national census statistics.

Proceedings of the
ITRN2014 4-5th September, University of Limerick
Deenihan and Caulfield: Health Benefits of Cycling
TABLE 2 Data from the survey, Census Statistics from the Study Area, and the National Census Statistics
Demographics from Survey Census Statistics From Study Area
Census Statistics for the Entire Country
Gender Number % Gender Number % Gender Number % Male 304 36 Male 73,616 52 Male 144,6963 52 Female 327 39 Female 68,161 48 Female 133,6973 48 Missing 214 25 Missing 0 0 Missing 0 0 Total 845 100 Total 141,777 100 Total 278,3936 100 Education Primary, Secondary 253 30
Primary, Secondary 43,372 31
Primary, Secondary 822,363 30
Third Level 374 44 Third Level 8,581 6 Third Level 190,929 7 Missing 218 26 Missing 89,824 63 Missing 1,770,644 63 Total 845 100 Total 141,777 100 Total 2,783,936 100 Age 15-24 214 25 15-24 6,524 5 15-24 126,592 5 25-34 256 30 25-34 28,523 20 25-34 518,514 19 35-44 111 13 35-44 26,596 18 35-44 475,689 17 45-54 122 15 45-54 17,918 13 45-54 383,247 14 55-64 93 11 55-64 8,986 6 55-64 222,100 8 65+ 35 4 65+ 1,276 1 65+ 44,502 2 Missing 15 2 Missing 51,954 37 Missing 101,3292 35 Total 845 100 Total 141,777 100
2,783,936 100
Marital Status Single 430 51 Single 31,880 22 Single 680,216 25 Married 193 23 Married 57,943 41 Married 1,090,428 39 Missing 222 26 Missing 51,954 37 Missing 1,013,292 36 Total 845 100 Total 141,777 100 Total 2,783,936 100 Means of Travel – Commute Drive 312 37 Drive 66,163 47 Drive 1,255,699 46 Drive (Passenger) 32 4
Drive (Passenger) 23,297 17
Drive (Passenger) 508,338 18
Walk 129 15 Walk 21,481 15 Walk 414,938 15 Cycle 228 27 Cycle 2,443 2 Cycle 61,177 2 Bus 77 9 Bus 15,841 11 Bus 288,562 10 Rail 64 8 Rail 5,181 4 Rail 70,976 3 Other 0 0 Other 4,065 4 Other 104,853 3 Missing 3 0 Missing 3,206 3 Missing 79,393 3 Total 845 100 Total 141,777 100 Total 2,783,936 100
HEAT EVALUTION
The HEAT analysis undertaken in this study looks solely at commute trips. As the census statistics do not gather information on non-utility related trips, it would be inaccurate to
AUTHORS’ SURNAMES: Brief Title 4-5th September, University of Limerick
Proceedings of the
ITRN2014
formulate HEAT estimation for non-utility trips. Therefore, this section looks solely at work and education related trips. As commuting trips represent typically only 25% of trips in Ireland, the benefits estimated in this section are likely to underestimate the true economic benefits of introducing the new cycling facility (11).
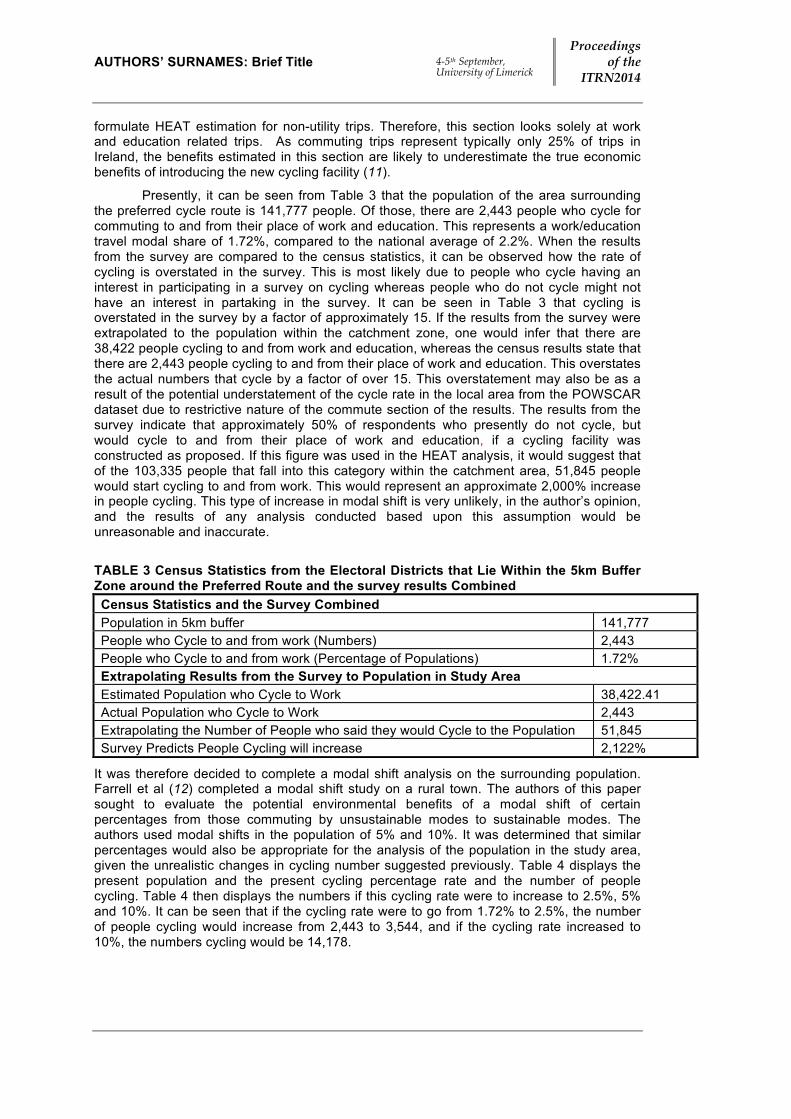
Presently, it can be seen from Table 3 that the population of the area surrounding the preferred cycle route is 141,777 people. Of those, there are 2,443 people who cycle for commuting to and from their place of work and education. This represents a work/education travel modal share of 1.72%, compared to the national average of 2.2%. When the results from the survey are compared to the census statistics, it can be observed how the rate of cycling is overstated in the survey. This is most likely due to people who cycle having an interest in participating in a survey on cycling whereas people who do not cycle might not have an interest in partaking in the survey. It can be seen in Table 3 that cycling is overstated in the survey by a factor of approximately 15. If the results from the survey were extrapolated to the population within the catchment zone, one would infer that there are 38,422 people cycling to and from work and education, whereas the census results state that there are 2,443 people cycling to and from their place of work and education. This overstates the actual numbers that cycle by a factor of over 15. This overstatement may also be as a result of the potential understatement of the cycle rate in the local area from the POWSCAR dataset due to restrictive nature of the commute section of the results. The results from the survey indicate that approximately 50% of respondents who presently do not cycle, but would cycle to and from their place of work and education, if a cycling facility was constructed as proposed. If this figure was used in the HEAT analysis, it would suggest that of the 103,335 people that fall into this category within the catchment area, 51,845 people would start cycling to and from work. This would represent an approximate 2,000% increase in people cycling. This type of increase in modal shift is very unlikely, in the author’s opinion, and the results of any analysis conducted based upon this assumption would be unreasonable and inaccurate.
TABLE 3 Census Statistics from the Electoral Districts that Lie Within the 5km Buffer Zone around the Preferred Route and the survey results Combined Census Statistics and the Survey Combined Population in 5km buffer 141,777 People who Cycle to and from work (Numbers) 2,443 People who Cycle to and from work (Percentage of Populations) 1.72% Extrapolating Results from the Survey to Population in Study Area Estimated Population who Cycle to Work 38,422.41 Actual Population who Cycle to Work 2,443 Extrapolating the Number of People who said they would Cycle to the Population 51,845 Survey Predicts People Cycling will increase 2,122%
It was therefore decided to complete a modal shift analysis on the surrounding population. Farrell et al (12) completed a modal shift study on a rural town. The authors of this paper sought to evaluate the potential environmental benefits of a modal shift of certain percentages from those commuting by unsustainable modes to sustainable modes. The authors used modal shifts in the population of 5% and 10%. It was determined that similar percentages would also be appropriate for the analysis of the population in the study area, given the unrealistic changes in cycling number suggested previously. Table 4 displays the present population and the present cycling percentage rate and the number of people cycling. Table 4 then displays the numbers if this cycling rate were to increase to 2.5%, 5% and 10%. It can be seen that if the cycling rate were to go from 1.72% to 2.5%, the number of people cycling would increase from 2,443 to 3,544, and if the cycling rate increased to 10%, the numbers cycling would be 14,178.

Proceedings of the
ITRN2014 4-5th September, University of Limerick
Deenihan and Caulfield: Health Benefits of Cycling
TABLE 4 Population and Cycling Rates Cycling Rate Percentage Numbers Presently Cycling in Study Area at 1.72% 2 2,443 If the cycle rate was to increase to 2.5% 3 3,544 If the cycle rate was to increase to 5% 5 7,089 If the cycle rate was to increase to 10% 10 14,178
Another important factor for the HEAT analysis is travel distance and the days travelled. Presently in Ireland, the Central Statistics Office does not compile information on travel distance. For the HEAT analysis, the average distance commuted by cyclists in the survey was used. The number of days per year cycled is also required for the HEAT analysis. This figure again is not in the Census statistics, and therefore the figure from the survey was used. The number of days that people cycle on average in a year by those sampled is displayed in Table 5. This is accompanied by the potential increase if the Greenway were constructed. It can be seen in Table 5 that if the Greenway were constructed, the number of days cycled could potentially increase from 48 days per year to 78 days per year. This represents an increase of 30 days or approximately 63% from present day figures. This was calculated by firstly establishing the average days commuted by those who presently commute by bicycle only. The average days that would be commuted by those that stated they would commute by bicycle was then calculated. This allowed the potential increase in days cycled to then be estimated. This was repeated for the average distance. The average distance commuted by those who presently cycle was calculated first by omitting the responses of the other modes. The responses of those who said they would cycle if the proposed cycling facility were built were then detached from the overall group. The average distance commuted by this group was then calculated. It can be seen that presently the average distance commuted by those presently cycling is approximately 8km. The average distance commuted by those who presently do not cycle but would if the proposed cycle infrastructure was built is approximately 12km. We can see in Table 5 that this represents a growth in the cycling commute distance of 4km or 50%.
TABLE 5 Days and Distances Presently Cycled and Predicted Number of Days Cycled on Average Per Year 48 Days/year If the Greenway were built, Number of Days Cycled on Average Per Year 78 days/year Increase in Days Cycled on Average Per Year 30 63% Average Distance Commuted by those who Cycle 8km Average Distance Commuted by those who Don’t Cycle and Would Cycle 12km Increase in Distance Cycled on average per year 4km 50%
The information from Tables 4 and 5 were inputted into the HEAT tool. Presently, the population that cycles has reduced their risk of mortality by 16%. If the facility was built and the predicted increase in cycling was to occur, the reduction in the risk of mortality would be 35%. This represents an average decrease in mortality in the population who cycle of 18%. As shown in Table 6 that if the cycle route were constructed, the numbers commuting by bike and the distances commuted would increase substantially and lead to a major increase in health benefits for those presently not cycling. Depending on the modal shift, the increased numbers that would stand to benefit from this would vary from 1,101 for a modal share of 2.5% and up to 11,735 for a modal share of 10%. The results of the cycling summary can be viewed in Table 6.

AUTHORS’ SURNAMES: Brief Title 4-5th September, University of Limerick
Proceedings of the
ITRN2014
TABLE 6 Cyclist Summary from HEAT
Summary of cycling data 2.5% Modal Shift
5% Modal Shift
10% Modal Shift
Pre-intervention cycling data
Average number of cycling trips per person per year: 96 96 96
Average distance cycled per cycling trip (km): 8 8 8 Average distance cycled per person per year (km): 803 803 803 This level of cycling is likely to lead to a reduction in the risk of mortality of: 16% 16% 16% Total number of individuals regularly doing this amount of cycling: 2,443 2,443 2,443
Post-intervention cycling data
Average number of cycling trips per person per year: 156 156 156
Average distance cycled per cycling trip (km): 12 12 12 Average distance cycled per person per year (km): 1,933 1,933 1,933 This level of cycling is likely to lead to a reduction in the risk of mortality of: 34% 34% 34% Total number of individuals regularly doing this amount of cycling: 3,544 7,089 14,178 Average amount of cycling per person per year increased between pre and post data. This change results in a decrease in the average mortality risk for your population of cyclists of: 18% 18% 18% Number of individuals cycling increased between pre and post data. Additional individuals regularly cycling, compared to the baseline 1,101 4,646 11,735
The proposed cycle route is planned to be of a very high standard and therefore in order to prevent an overestimation of the benefits, a conservative figure of €200,000 per km was used for the estimation of the construction costs of the cycle route. This cost was based on the cost of another cycle way in Ireland (13 and 14). This would lead to a total construction cost of €12,000,000. This was the figure that was used for the estimation of the cost of intervention for the HEAT analysis and was used in the calculation of the benefit cost ratio. The statistical value of life used in the estimation was €1,574,000 which is the average statistical value of life in the European Union. This value is the suggested value from the WHO for the HEAT estimation.
From Table 7, the decreased mortality risks can be seen for the varying modal shifts. The number of deaths reduced per year from the decreased mortality rate varies between 3.39 and 17.93, depending on the modal shift. The HEAT model assumes that once the facility is constructed, that it would take two years for the uptake in cycling to expand and it would take five years before the benefits of this uptake would apply. Therefore, for an assessment over a ten year period, HEAT estimates that the benefits are between €37,080,000 and €196,163,000 over ten years or between €3,708,000 and €19,616,000 per year dependent on modal switch. HEAT estimates that the benefits are maximized in year 7 when the health benefits have fully accrued and the rate of cycling has been maximized. The HEAT model is able to calculate the maximum financial health benefits from year 7 on. After year 7, the annual financial health benefits are between €5,335,000 and €28,225,000, dependent on the modal switch. As this analysis is undertaken over a ten year period, it is important to take inflation into consideration. The WHO suggested a discounted rate of 5% per annum for HEAT estimation. Therefore, with the discounted rate applied to the benefits

Proceedings of the
ITRN2014 4-5th September, University of Limerick
Deenihan and Caulfield: Health Benefits of Cycling
over ten years, the benefits vary between €26,695,000 and €141,222,000 or on average between €2,669,000 and €14,122,000 per annum. Therefore, with an initial investment of €12,000,000, this represents benefit cost ratios of between 2.22:1 and 11.77:1. It is important to remember when viewing these results that HEAT does not calculate risk reductions for individual persons, but an average across the population under study. The results should not be misunderstood to represent individual risk reductions.
Table 7 HEAT Estimate
HEAT estimate 2.5% Modal Shift
5% Modal Shift
10% Modal Shift
This change results in an decreased in the average mortality risk for your population of cyclists of: 18% 18% 18% The number of individuals cycling has increased between your pre and post data. Additional individuals regularly cycling compared to the baseline. 1,101 4,646 11,735 Taking this into account, the number of deaths per year that are prevented by this change in cycling is: 3.39 8.19 17.93 Financial savings as a result of cycling
The value of statistical life applied is: €1,574,000 €1,574,000 €1,574,000 Based on a 5 year build up for benefits, a 2 year build up for uptake of cycling, and an assessment period of 10 years:
Average annual benefit over 10 years is: €3,708,000 €8,964,000 €19,616,000 Total benefits over 10 years are: €37,080,000 €89,640,000 €196,163,000
The maximum annual benefit reached by this level of cycling, per year, is: €5,335,000 €12,898,000 €28,225,000 This level of benefit is realised in year 7 when both health benefits and uptake of cycling have reached the maximum levels.
When future benefits are discounted by 5 % per year:
Current value of the average annual benefit, averaged across 10 years is: €2,669,000 €6,453,000 €14,122,000
The current value of the total benefits accumulated over 10 years is: €26,695,000 €64,534,000 €141,222,000 Benefit–Cost Ratio
The total costs of: €12,000,000 €12,000,000 €12,000,000 Total savings over 10 years of: €26,695,000 €64,534,000 €141,222,000 Assuming 5 year build up of benefits, 2 years build up of uptake, discounting 5 % per year
The benefit to cost ratio is therefore: 2.22:1 5.38:1 11.77:1
The HEAT analysis was also performed on the predicted group from the survey alone where approximately 50% was to switch commute travel mode. This predicted group led to a benefit cost ratio of over 45:1, and over 10 years, would produce approximately €500,000,000 in health benefits. From reviewing other economic appraisals of cycling facilities it is known that a figure of this level is extremely unusual and to utilize this figure in the appraisal of the route would be inaccurate.

AUTHORS’ SURNAMES: Brief Title 4-5th September, University of Limerick
Proceedings of the
ITRN2014
CONCLUSIONS
The results presented in this paper show that if the cycle route was constructed along the canal towpath, the economic health benefits from present day non cycling commuters switching their travel mode for commuting to cycling, would reduce their mortality rate as a group by 18%. It was investigated how if the modal share of cycling was to increase from 1.72% to 2.5%, 5% and 10% would impact the health of the population in the study area. The increase in cycling rates would reduce the number of deaths per year by between 3.39 and 17.93, depending on the modal switch. Using the European Union’s statistical value of life at €1,574,000, it can be inferred that over a 10 year period with a 2 year uptake of cycling and 5 years for the buildup of the health benefits, that the benefits accumulated over 10 years would be between €26,695,000 and €141,222,000, dependent on the modal switch. These benefits would results from an initial investment of €12,000,000. This would lead to benefit cost ratios of between 2.22:1 and 11.77:1, dependent on the mode switch. For a transport facility, the ratios are very favourable and indicate that this would be a very worthwhile infrastructure project for the area. More indepth analysis is presented in Deenihan and Caulfield (15).
REFERENCES
1. World Health Orgainisation (2011). Health economic assessment tools (HEAT) for
walking and for cycling. Copenhagen, WHO Regional Office for Europe, 2011 2. Cavill, N., Kahlmeier, S., Rutter, H., Raccioppi, F., and Oja, P. (2007). Economic
Assessment of Transport Infrastructure and Policy. World Health Organisation 3. Rojas-Rueda, D., de Nazelle, A., Taino, M., and Nieuwenhuijsen, M. (2011). The
Health Risks and Benefits of Cycling in Urban Environments compared with Car Use: Health Impact Assessment Study. In British Medical Journal, 2011, No. 343, pp 4521
4. de Hartog, J., Boogard, H., Nijland, H., and Hoek, G. (2010). Do the Health Benefits Outweigh the Risk. In Environmental Health Perspectives, 2010, No. 118, pp 1109-1116
5. Anderson, L., Schnohr, P., Schroll, M., and Hein, H. (2000). All-Cause Mortality Associated With Physical Activity During Leisure Time, Work, Sports, and Cycling to Work. In Archives of Internal Medicine, 2000, No.160, pp 1621–1628.
6. Mindell, J., Rutter, H., Watkins, S. (2011). Urban Transportation and Human Health. In Encyclopedia of Environmental Health, 2011, pp 578-589
7. Hendrikson, I., Simons, M., Garre, F., and Hildebrant, V. (2010). The Association Between Commuter Cycling and Sickness Absence. In Preventative Medicine, 2010, No 51, pp 132-135
8. Unwin, N. C. (1995). Promoting the Public Health Benefits of Cycling. In Public Health, 1995, No. 109, pp 41-46
9. Nichols, M., Townsend, N., Luengo-Fernandez, R., Leal. J., Grey, A., Scarborough, P., and Rayner, M. (2012). European Cardiovascular Disease Statistics 2012. European Heart Network, Brussels, European Society of Cardiology
10. Central Statistics Office (2011) Place of Work, School or College – Census of Anonymised Records. Dublin, Ireland.
11. Central Statistics Office (2009) Household Travel Survey. Dublin, Ireland. 12. Farrell, S., McNamara, D. and Caulfield, B, Estimating the Potential Success of
Sustainable Transport Measures for a Small Town, Transportation Research Record: Journal of the Transportation Research Board, 2163, 2010, p97 – 102.
13. Deenihan, G., Caulfield, B., O'Dwyer, D., Measuring the success of the Great Western Greenway in Ireland, Tourism Management Perspectives, 7, 2013, p73 – 82.
14. Deenihan, G., Caulfield, B., Do tourists value different levels of cycling infrastructure?, Tourism Management, 46, 2015, p92 – 101

Proceedings of the
ITRN2014 4-5th September, University of Limerick
Deenihan and Caulfield: Health Benefits of Cycling
15. Deenihan, G., Caulfield, B. , Estimating the Health Benefits of Cycling, Journal of Transport & Health, 1, (2), 2014, p141 - 149