estimating the contribution of smoke and its fuel … · estimating the contribution of smoke and...
TRANSCRIPT

Estimating the Contribution of
Smoke and Its Fuel Types to Fine
Particulate Carbon using a Hybrid-
CMB Model
Bret A. Schichtel and William C. Malm - NPS Air
Resource Division
Jeffrey L. Collett, Jr., Amy P. Sullivan, Leigh A.
Patterson and Amanda S. Holden – Colorado State
University
Supported by the Joint Fire Science Project (JFSP)
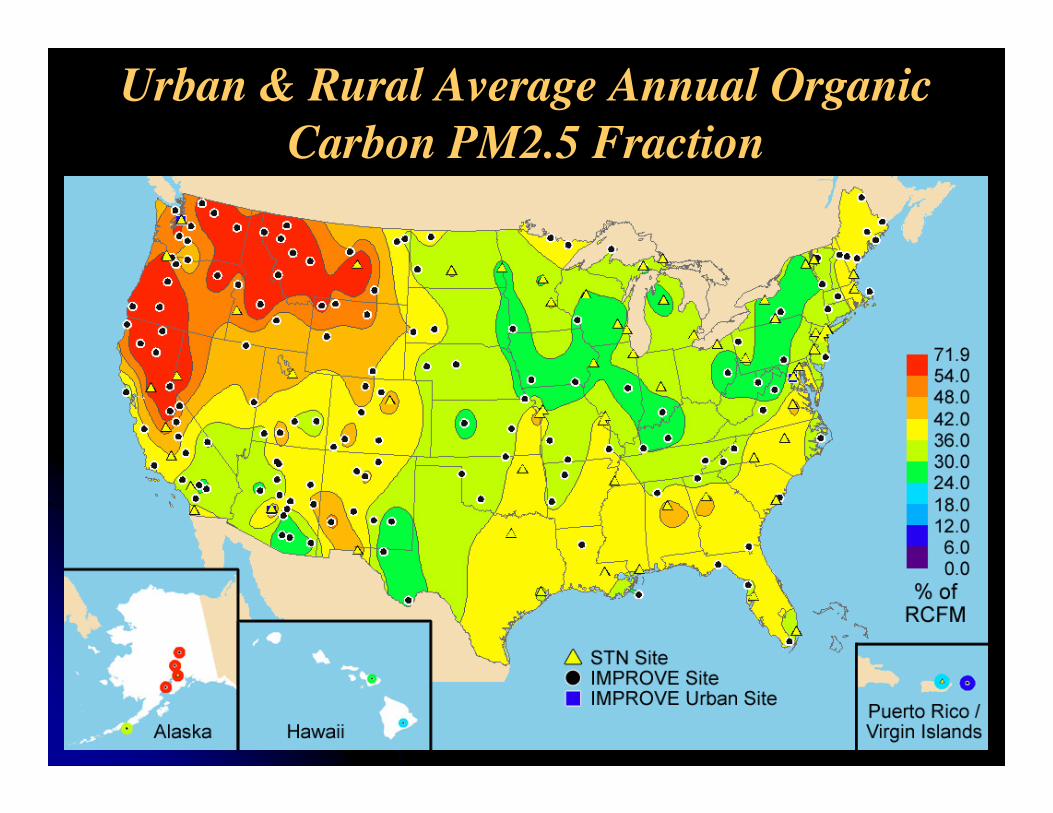
Urban & Rural Average Annual Organic
Carbon PM2.5 Fraction

Natural and Anthropogenic Biomass Burning
Wildfire
Prescribed Fire Residential Wood Burning
Agricultural Fire

Jeameen Baek et al., - Georgia Institute of Technology
Hybrid Source Apportionment Model
Meteorology
Air Quality
Source-compositions (F)
Source-oriented Model(3D Air-quality Model)
(CMAQ, CAMx)
Receptor (monitor)
Receptor Model(CMB, PMF)
Source Impacts
Chemistry
Receptor model C=f(F,S)

Single Source CMB Modeling
� Biomass burning has relatively
unique and stable organic
molecular marker species
� Anhydrosugars: levoglucosan,
mannosan, and galactosan
SpeciesMar
SpeciesMar
smokePM cSrc
Srcker
ker
Re*rat Recepto PM/TCsmoke =
Smoke
particle
Marker as fraction
of smoke particle
� Issues
� Primary smoke marker species can’t apportion secondary matter
� Biomass burning source profiles vary with fires
� Can’t apportion contributions from individual fires or types of
fire

Hybrid-CMB Integrating Source and Receptor Model Results
DispersionPhysio-Chem
ProcessesFire & Other
Emissions
Chem. Trans
ModelSource Profiles
Vary by Fire
Primary SmokeMarker Species
Secondary SmokeMarker Species
CMB
Primary Smoke
Biomass Burning Weighted
Source Profiles
AgriculturalFire
PrescribedFire
Wild Fire
ContributionsBy Src Region
Secondary Smoke
• CTM modeling results
• Derive fire weighted source profiles
• Apportion smoke contributions to fire types and source regions

Variation of Primary Biomass Burning
Marker Species Profiles
� Profile dependence on fuel type /cellulose
content (Sullivan et. al. 2008)
Levoglucosan source profiles

Source Profiles
Spatial Variation
due to Fuel
Types
Patterson et al., 2009
� Levoglucosan/TC varies
by a factor of 2
� Mannosan/TC varies by
more than a factor of 10
� Each species has a
unique spatial variation
Levoglucosan/TC
Mannosan/TC

“Chemical” Transport Model to Apportion TC
� WRAP 2002 emission
� NCAR fire emissions
� Six-day airmass histories
� Kinetics
� Wet Removal
� Dry Removal
� First order SOA formation
� Tuned Rate Coeff.
� Simple chemical transport model using Capita Monte Carlo model
particle dispersion model and back airmass histories
� Primary and secondary contributions from fire, mobile, vegetation,
point, area and other sources simulated
� Model was tuned for 4 sites using 2002 WRAP emissions
Great Smoky Mnt, TN
Sula, MT
Rocky Mtn,
Tonto, AZ

2008 Biomass Burning Marker Species
Measurement Campaign
� Hi-Vols samplers collecting 24-h PM2.5 samples daily
� Samples analyzed for OC/EC, levoglucosan, mannosan, galactosan
Upper Buffalo, 3/12–5/4
Monture, 7/8–10/6
Sequoia, 9/13–10/276
Agricultural Fires

Mcarlo Model Source Apportionment
Upper Buffalo, AR
Northern Rockies

Simulation of Smoke Marker Species
as Upper Buffalo
� 24-hour average concentrations at Upper Buffalo, AR in
March and April 2008
� Smoke marker species emissions were simulated by scaling
the OC biomass burning emission rate by the spatially variable
smoke source profiles

Biomass Burning Total PM2.5 Carbon
Estimated using the Hybrid-CMB
Upper Buffalo, AR Sequoia, CA Monture, MT
� Comparisons of biomass burning TC estimated using levoglucosan,
mannosan and galactosan do not display “edges” at Upper Buffalo
and Monture
� The two edges at Sequia, still exist indicating errors in the source
profiles

Agricultural and Other Biomass Burning
Contribution to TC
Upper Buffalo, AR
Monture, MTSequoia, CA

Questions?Questions?

Biomass Burning Air
Quality Issues
� Reduced visibility
� Regional Haze Rule – reduce
haze in class I areas to natural
conditions by 2064
� Adverse health effects
� Fine particulate matter
� Ozone
� Ecosystem effects
� Are fires a source of reactive
nitrogen?
� Plant damage from ozone
Prescribed Fire in Grand Can
Wildfire at Glacier, MT
What is causing the haze at
Big Bend, TX ?


Smoke Management Needs for
Air Quality Regulations
� Develop an unambiguous routine and cost effective
methodology for apportioning primary and secondary
carbonaceous compounds in PM2.5 retrospectively to
prescribed, wildfire, agricultural fire, and residential
wood burning activities
� Daily and long term data are needed for air quality assessments
� Similar needs for ozone and reactive nitrogen deposition
issues

Spatial Variability in Smoke Weighted
Source Profiles at IMPROVE Sites, 2008
Lev/TC Man/TC Gal/TC
Min 0.043 0.001 0.004
Max 0.076 0.026 0.014
Average 0.059 0.009 0.007
Std Dev 0.006 0.006 0.002
Max/Min 1.8 19 3.7
Lev/TC Man/TC Gal/TC
Min 0.054 0.004 0.005
Max 0.065 0.018 0.010
Average 0.059 0.009 0.007
Std Dev 0.003 0.003 0.001
Max/Min 1.2 4.8 2.1
24-hr averages at all sites
Average profiles at each site
DispersionPhysio-Chem
ProcessesFire & Other
Emissions
Chem. Trans
ModelSource Profiles
Vary by Fire
Biomass Burning Weighted
Source Profiles

Measured Source Profile Variability
� “Edges” in scatter plots of smoke marker species are indications of
contributions from two or more fires with different source profiles
smoke mixed from
both fires

Upper Buffalo, AR Monture, MT Sequoia, CA
Measured Source Profile Variability

Biomass Burning Total PM2.5 Carbon
Estimated using the Hybrid-CMBUpper Buffalo, AR Sequoia, CAMonture, MT

Simulation of Smoke Marker Species
� 24-hour average concentrations at Upper Buffalo, AR in
March and April 2008
� Smoke marker species emissions were simulated by scaling
the OC biomass burning emission rate by the spatially variable
smoke source profiles

Simulated vs. Measured TC, 2008
� Aggregated over all IMPROVE monitoring sites for
each sample day from January – September 2008
� The model captures the temporal variability in the
IMPROVE network

Simulated vs. Measured TC
Central Great
Plains
Colorado
Plateau
Mid South
EastDeath Valley

Swanquarter, NC

Simulation of Ratios of Smoke
Marker Species
� 24-hour average concentrations at Upper
Buffalo, AR in March and April 2008

Simulation of Smoke Marker Species
� 24-hour average concentrations at Monture,
MT in July – September 2008

Radiocarbon (14C)
Distinguishing
Between
Contemporary and
Fossil Carbon
Winter
Summer
� Fraction Contemporary C
� 80-100% - rural sites
� 70-80% - near urban sites
� 50% - urban sites
� 60-75% in industrial Midwest
� Similar fraction contemporary carbon in winter and summer

Biomass Burning
Emission Inventory
� Daily MODIS (Terra and
Aqua) derived biomass
burning emissions
(Wiedinmyer et al., 2006)
� Data are aggregated to a 36
km grid
� Fires are tagged as
agricultural and other
Daily 36-km PM2.5 Fire Emission
1-km Fire detects over agricultural land, 2005

Averaged Over all Rural IMPROVE Sites –
National Temporal Evaluation
Model vs Model

Averaged Over all Rural IMPROVE Sites –Spatial Evaluation
Sites are sorted west to east

Spearman r Model TC vs.
IMPROVE TC
CMAQ 2006
Mcarlo 2006

Up
per
Bu
ffal
o,
AR
Mo
ntu
re, M
TS
equ
oia
, C
A

Up
per
Bu
ffal
o,
AR
Mo
ntu
re, M
TS
equ
oia
, C
A

Smoke Source Profiles for Fuel Types (FLAME II Study)
Biome
Vegetation
type
Levoglucosan
/TC
Mannosan/
TC
Galactosan/
TCK+/TC OC/TC
Grassland Grass0.12 ± 0.11
0.006 ±0.004
0.008 ±0.006
0.067 ±0.050
0.94 ± 0.06
Softwood Forest
Branches -
Fresh0.07 ± 0.03
0.017 ±0.006
0.013 ±0.005
0.032 ±
0.0330.98 ± 0.03
Softwood Forest
Branches -
Dead0.05 ± 0.03
0.013 ±
0.008
0.007 ±
0.006
0.015 ±
0.0130.52 ± 0.10
Softwood Forest Needles0.06 ± 0.03
0.033 ±0.019
0.015 ±0.008
0.027 ±0.062
0.97 ± 0.05
Softwood Forest Duff0.07 ± 0.01
0.050 ±0.015
0.022 ±0.002
0.004 ±0.001
0.99 ± 0.00
Hardwood
Forest Leaves0.05 ± 0.01
0.005 ±0.001
0.010 ±0.002
0.042 ±0.014
0.96 ± 0.03
Scrub brush Branches0.11 ± 0.01
0.016 ±0.001
0.013 ±0.006
0.020 ±0.005
1.00 ± 0.00
Scrub brush Leaves0.04 ± 0.02
0.004 ±
0.002
0.005 ±
0.003
0.088 ±
0.0610.81 ± 0.23
Floral shrublands Leaves 0.09 0.008 0.007 0.028 0.909
Southeastern
shrublands Leaves0.04 ± 0.02
0.004 ±0.003
0.003 ±
0.001
0.103 ±0.208
0.77 ± 0.19

Variation of Primary Biomass Burning
Marker Species Profiles
� Profile dependence on combustion
temperature
(Kuo et. al. 2008)
� Profile dependence on
fuel/cellulose content
(Sullivan et. al. 2008)
Levoglucosan source profiles

Urban & Rural Average Annual Organic
Carbon PM2.5 Fraction

Apportionment Methods� Chemical transport models CTM)
� Subject to large errors in inputs� Current CTM model simulations estimate little to no smoke SOA
� Results are unconstrained by measured data
� Receptor Models
� Chemical Mass Balance
� Can’t apportion secondary aerosols
� Factor Analysis e.g. Positive Matrix Factorization (PMF)
� Non-unique source factors
PMF modeling appears to have combined SOC from vegetation in with fire

• Speciated PM2.5 and PM10 mass monitoring network, > 160 sites
• Using the Mcarlo CTM 24-h PM2.5 total carbon simulated at all IMPROVE sites for 2006 - 2008

Spatial distribution of smoke source profiles