estimating energy saving potential from transformers...
TRANSCRIPT
Estimating energy saving potential from transformers and evaluating their impact on the feasibility of renewable energy systems Atkins A research report completed for the Department for Environment, Food and Rural Affairs
DATE: March 2013

Published by the Department for Environment, Food and Rural Affairs
Department for Environment, Food and Rural Affairs Nobel House 17 Smith Square London SW1P 3JR Tel: 020 7238 6000 Website: www.defra.gov.uk © Queen's Printer and Controller of HMSO 2007 This publication is value added. If you wish to re-use this material, please apply for a Click-Use Licence for value added material at: http://www.opsi.gov.uk/click-use/value-added-licence-information/index.htm Alternatively applications can be sent to Office of Public Sector Information, Information Policy Team, St Clements House, 2-16 Colegate, Norwich NR3 1BQ; Fax: +44 (0)1603 723000; email: [email protected] Information about this publication is available from: SCP&W Evidence Base Defra Zone 5D, 5th Floor, Ergon House c/o Nobel House, 17 Smith Square London SW1P 3JR Email: [email protected]
Estimating energy saving potential from transformer and evaluating their impact on the feasibility of renewable energy systems
Interim Report to the Department for Environment, Food and Rural Affairs
Date: March 2013 Final Authors Elizabeth Birchenough and Hugh Falkner Checked Mike Hales
This research was commissioned and funded by Defra. The views expressed reflect the research findings and the authors‟ interpretation; they do not necessarily reflect Defra policy or opinions.
Atkins mantra is to Plan, Design and Enable infrastructure projects. Our skills lie in the expansive area of infrastructure – the wiring of society –
encompassing buildings, transport and utilities (including energy and water) as well as work for national and local governments and other industrial clients. The social and environmental framework is crucial and we view all our projects in the context of the communities and in which they will be undertaken
1
Table of Contents
Executive Summary ................................................................................................. 5
1 The UK Transformer Market ............................................................................ 7
1.1 The UK Transformer population ..................................................................... 7
1.2 Transformer asset life ...................................................................................... 7
1.2.1 Factors impacting transformer life ................................................................. 8
1.2.2 Transformer failure mechanisms .................................................................... 8
1.3 Transformer purchasers .................................................................................. 9
1.4 Typical UK transformer specifications ........................................................... 9
1.5 UK Transformer manufacturing capacity ..................................................... 11
2 Transformer design considerations ............................................................. 13
2.1 Fundamental transformer design relationships .......................................... 13
2.2 Conductor material selection ........................................................................ 15
2.3 Transformer ratings ....................................................................................... 16
2.4 Dry (cast resin) and Oil filled transformers .................................................. 16
2.5 Transformer efficiency trends ....................................................................... 18
2.6 Losses from Harmonic currents ................................................................... 18
2.7 Technology for improved efficiency ............................................................. 19
2.7.1 Improvements in steel laminations .............................................................. 20
2.7.2 Amorphous core transformers ..................................................................... 20
2.7.3 Hexaformer transformer design topology .................................................... 21
3 Proposed Regulations for Distribution transformers ................................. 23
3.1 General Scope ................................................................................................ 23
3.2 Maximum power loss basis for distribution transformers ......................... 24
3.3 Proposed methodology for regulating large power transformers ............. 25
4 Renewable Energy Applications ................................................................... 26
4.1 Utilisation Considerations for Renewable Energy transformers ............... 26
4.2 Transformer De-energisation ........................................................................ 28
4.3 Wind Energy ................................................................................................... 28
4.4 Solar Photovoltaic .......................................................................................... 30
4.5 Tidal Generation ............................................................................................. 30
4.6 Wave Energy ................................................................................................... 31
4.7 Hydro – run of the river .................................................................................. 32
2
4.8 Hydro – stored power .................................................................................... 32
4.9 Biomass .......................................................................................................... 33
4.10 Biogas ............................................................................................................. 33
5 Economics of transformer ownership in the UK ......................................... 34
5.1 Economic Selection of Transformers ........................................................... 34
5.2 Transformer loss recovery mechanism ....................................................... 34
5.3 Cost benefit analysis methodologies ........................................................... 34
5.4 Who pays for Renewable Energy transformer losses? .............................. 35
6 Optimising transformer design for renewable energy applications .......... 37
6.1 Distribution transformer losses when used in different applications ....... 37
6.2 Losses by application .................................................................................... 38
6.2.1 Interpretation of results ................................................................................. 38
6.2.2 Solar ................................................................................................................ 38
6.2.3 Wind ................................................................................................................ 39
6.2.4 Biomass .......................................................................................................... 40
6.2.5 Methodology – Worked Example (Solar) ...................................................... 40
7 References ...................................................................................................... 42
3
List of Abbreviations
Abbreviation Definition
BS British Standards
CMR Continuous Maximum Rating
csa Cross Section Area
DER Distributed Energy Resources
DLAF Distribution Loss Adjustment Factor
DNC Declared Net Capacity
DNO Distribution Network Operator
ENA Energy Networks Association
EU-27 27 Member States of the European Union
EuP Energy Using Product Directive
HVDC High Voltage Direct Current
IEC International Electrotechnical Commission
IEEE Institute of Electrical and Electronic Engineers
MEEUP Methodology for the Ecodesign of Energy-using Products
MEPS Minimum Energy Performance Standards
MWh Mega Watt hour
NEMA National Electrical Manufacturers Association (US)
NETA New Electricity Trading Arrangements
NGET National Grid Electricity Transmission
OFAF Oil Forced, Air Forced (transformer cooling arrangements)
ONAF Oil Natural, Air Forced (transformer cooling arrangements)
ONAN Oil Natural, Air Natural (transformer cooling arrangements)
PTO Power Take Off
RE Renewable Energy
rms Root Mean Square
TCO (or TOC) Total Cost of Ownership (Total Ownership Cost)
TLAF Transmission Loss Adjustment Factor
TSO Transmission System Operator
TWh Terra Watt hours
UoSC Use of System Charge
VA Volt.Amperes (Apparent power)
4
Glossary of terms
A0Ck, C0Ck, ... etc: Indication of transformer losses class influenced by its design. The first two letters refer to the no load losses, and the latter to the load losses. These values are explained in detail in the EUP Preparatory study.
Auxiliary Losses (Paux): The active power consumed by the auxiliary components of the transformer (e.g. fans, pumps). Availability factor (AF): Assumed fraction of time (usually taken over a year) that the plant is available for operation, here assumed for simplicity to be 100%.
K-factor: A de-rating factor for a standard transformer used to supply non-linear loads, such that the total loss on harmonic load does not exceed the fundamental design loss of the transformer. For these applications, specially constructed or K-rated transformers should be used (EN 50464-3). Load Factor (a): The ratio of the energy generated by a unit during a given period of time to the energy it would have generated if it had been running at its maximum capacity for the operation duration within that period of time (IEC 60050 International Electrotechnical Vocabulary). The Load Factor is a specific transformer parameter, and should not be confused with the Utilisation Factor. Utilisation factor refers to the percentage availability that a complete system is operating. For example, the utilisation factor for a wind turbine may be 25% for 2 hours. The load factor on the transformer associated with that same wind turbine over the same time window may be 30%, because the transformer will be powering auxiliary circuits even if the turbine is stationary. Load form factor (Kf): The ratio of the root mean squared (rms) power to the average power (= Prms / Pavg). Load loss multiplier (ae x ae): This multiplier allows for direct calculation of conductor losses, (which is proportional to current squared). Load losses (Pk): The absorbed active power at rated frequency and reference temperature, associated with a pair of windings when rated current is flowing through the line terminals of one of the windings, and the terminals of the other winding are short-circuited. Further windings, if existing, are open-circuited. (IEC 60076-1). No load losses (Po): The active power absorbed when a given voltage at rated frequency is applied to the terminals of one of the windings, the other winding(s) being open-circuited (IEC 60076-1). Power factor (PF): The ratio of the active power (kW) to the apparent power (kVA).
Rated Power (S): The value of apparent power assigned to a winding which, together with the rated voltage of the winding, determines its rated current. The rated power refers to continuous loading. This is a reference value for guarantees and tests concerning load losses and temperature rises (IEC 60076-1: Power Transformers – Part1: General). Transformer availability factor (AF): This determines the availability of the transformer on a given instant of time (usually considered on a yearly basis).
5
Executive Summary
The Proposed EUP regulations and DER transformers
Distribution transformers within the EU-27 have combined annual energy losses estimated at 38TWhpa, and so represent an interesting target for improving energy efficiency and hence reducing carbon emissions. A 2011 European Commission Energy Using Product (EUP) Preparatory study1 reported on the basis of possible regulations to reduce the losses in new distribution transformers. These regulations are now (March 2013) being considered for introduction as early as July 2014.
Within the UK, it is estimated that 46,000 distribution transformers will be purchased over the next five years, of which 40,000 will be replacements to existing systems, and 6,000 for Distributed Energy Resource (DER) applications. These transformers will have a lifetime of 25 - 50 years, and so purchasing decisions made now will have a growing impact on total energy losses from the UK and European transformer stock.
The current EU installed capacity of Distribution transformers in DER applications is only very small (50,000 units total), but represents an important and growing part of sales. The draft regulations for Distribution transformers published in the October 2012 Consultation forum draft2 exclude DER transformers as a special category.
Transformer losses
Transformer losses comprise two components, the no load and no load losses:
No load (core) losses, which occur for the whole time that the transformer is energised. These are constant and independent of load. The majority of these losses are related to hysteresis, which is proportional to flux density, and therefore dependent on the construction and materials used in the core.
Load (resistive) losses, which is proportional to the square of the load current.
The proposed regulations for distribution transformers state maximum power losses for each of these components, not the total combined loss, hence limiting the design flexibility available to the designer.
Utilisation factors of DER in the UK and the impact of the proposed EUP regulations
Transformer Utilisation factors vary widely with application. For high utilisation sources such as hydro or biomass, transformer load losses are particularly important. But for low utilisation sources such as solar, then no load losses are proportionately more important.
Ideally, distribution transformers should be available that are optimised for these very different duties, as this would both reduce energy losses and give a better return on investment. However, it is found that the costs of type testing and the need to produce high volumes mean that such special designs are not cost effective. Without external intervention, such as through regulation, suppliers will continue not to offer these designs,
6
and the User will not specify them.
In practice, the fundamental equations governing the design and performance of transformers means that any changes to one of the loss components will have an impact on the other. In addition, it is essential to maintain the correct short circuit impedance, as this is a network requirement in order to limit the prospective fault current and related protection equipment. There is therefore only limited scope for altering designs without incurring excessive costs.
It is observed that the proposed regulations will not worsen the situation regarding energy losses from distribution transformers used in DER applications. However, the regulation of these two loss components separately rather than on a total efficiency basis could preclude the development of transformers designed specifically for some DER applications. It is such a total efficiency approach that is being considered for large power transformers, a market where custom designs are the norm.
A distinction should be made between those transformers that are connected to the DNO network and those within privately owned renewable energy system. Whereas transformers connected to the DNO network need to comply with DNO specifications, those that are privately owned do not. This gives flexibility for optimising secondary voltages to match that of the energy source, selection of dimensions to fit limited space in for example wind turbine towers, and in the selection of prospective fault levels and hence impedances. Although not explicitly excluded from the proposed EUP regulations, it is assumed that because they may have non-standard impedances, such privately owned transformers may be excluded from the regulations. This report focuses on the use of DER transformers that are connected to the DNO network.
A new methodology for regulating large power transformers
It is proposed that large power transformers are regulated on the basis of total efficiency, rather than the separate Minimum Energy Performance Standards (MEPS) for load and no-load losses methodology proposed for smaller distribution transformers. This “total losses” approach is currently only applicable to these larger transformers, as these are the only types that are currently custom designed for each application.
The importance of harmonic currents on DER transformers
Many Renewable Energy sources have a power electronic interface to the electricity network, which will generate harmonics. Harmonics lead to additional heating through core losses and in the conductors through eddy currents and the skin effect. These lead to a de-rating of the transformer, known as the “K” factor, which is explained in more detail later on within the report. As with the Energy Using Product (EUP) Preparatory Study, this is considered to be application rather than product specific, and so is outside the scope of any regulations and not considered further.
7
1 The UK Transformer Market
1.1 The UK Transformer population
The population of distribution transformers in the UK is estimated to be 684,000 units, with an average rating of 234kVA3. The vast majority of these are installed on Distribution Network Operator (DNO) networks and are of oil-filled construction. Dry (also called cast resin) distribution transformers are used primarily in buildings where the perceived fire hazard of transformer oil precludes their use.
The UK has a higher redundancy built into the design of both the transmission and distribution networks than much of the rest of Europe (EU-27), and so has a lower average load factor. Consequently no load losses are relatively of more importance in the UK than for the rest of the Europe.
The UK is characterised by a higher proportion of pole mounted transformers than many other countries, which are found particularly in remote rural areas. As the rural load has increased, many pole mounted transformers are being upgraded to a traditional three phase supply with ground mounted transformers. More generally, DNO‟s are moving towards ground mounted transformers because it allows for larger units, and improved access for maintenance.
1.2 Transformer asset life
The typical average asset life for transformers in the UK is estimated as follows;
40 to 50 years for transmission system transformers
40 years for distribution transformers
20 to 25 years for light industrial transformers 20 to 50 years for DER applications
The SEEDT3 report also states that approximately 6% of the installed transformers are over 40 years old and therefore technically at the end of their asset life. It is common practice for transmission and distribution transformers to be monitored and replaced on the basis of age and condition. Atkins internal data on DNO planned asset replacements shows that 40,000 units of the current stock will need replacing over the next 5 years. It is projected that there will be an increase in installed renewable generation capacity from the current 6.1GW, to an estimated peak of 82GW, with the majority being associated with wind energy4 . It is always difficult to predict growth in demand, but there are infrastructure plans in place for major improvements in rail electrification, and the prospect of increased use of electric vehicles and heat pumps. To estimate the potential number of transformers needed in the next 5 years, an average rating of 4.5MVA is suggested as a typical size for a wind turbine, giving a new market exceeding 6300 units. There will of course be many other technologies contributing to the renewable energy mix, but in the short term wind will dominate, as it is an established technology.
8
On this basis, the future UK market for new distribution transformers will be in the order of 46,000 over the next 5 years.
1.2.1 Factors impacting transformer life Lifespan can be affected by a number of factors, such as the number of times the transformer has been switched on and off, fluctuation of the demand on the transformer terminals, its local environment (dusty and hot environment for example) and the transformer loading. Expected lifetimes of renewable energy sources will vary, up to 25 years for a wind farm or solar installation to perhaps twice this or more for a large hydro or biomass scheme. However, there is insufficient data to understand whether the life of transformers in renewable energy applications will be any different from those in conventional distribution applications. It is likely that at end of life a wind-farm will be re-powered with higher rated turbines, and so the transformers would also be replaced. Many transformers are also mounted in the nacelle or the tower as an integral part of the power system package, and so would have a lifetime the same as the wind turbine. In addition there is a growing second hand market for reconditioned wind turbines, in which case the transformers may also have an extended lifetime. Some early offshore wind turbine applications suffered failures, but lessons have been learnt and this is no longer such an issue.
1.2.2 Transformer failure mechanisms For all types of transformers, failure and hence replacement may be required for any of the following reasons5: Insulation Failures – Insulation failures are the leading cause of failure. This category excludes those failures where there was evidence of a lightning or line surge. There are actually four factors that are responsible for insulation deterioration: pyrolosis (heat), oxidation, acidity, and moisture. From studies in the US, it was found that the average age of the transformer that failed due to insulation failure was 18 years.
Design / Manufacturing Errors – This category includes conditions such as: loose or unsupported leads, loose blocking, poor brazing, inadequate core insulation, and inferior short circuit strength. This is the second most common cause of transformer failures. Oil Contamination – This category relates to cases where oil contamination can be established as the cause of failure. This includes sludging and carbon tracking, which is caused by ingress of water or other pollutants, and by internal arcing. Fire / Explosion – Internal failures that result in a fire or explosion. This is a very rare event and requires a number of safety measures to have failed. There are also some recorded incidents of catastrophic failures arising from external damage or vandalism. The attempted theft of metals has increased significantly in the last five years, with substations being seen as an easy target.
9
Line surge – This category includes switching surges, voltage spikes, line faults / flashovers and other network abnormalities. Attention should be given to external surge protection, such as spark gaps and surge arrestors, or to adequate coil clamping and short circuit strength. Maintenance / Operation – Inadequate or improper maintenance and operation can be a major cause of transformer failures, which includes overloading, loose connections and moisture. This category also includes disconnected or improperly set controls, loss of coolant, accumulation of dirt and oil, and corrosion. All solar and many wind energy and ocean energy machines use inverters to synthesise a sinusoidal “mains” frequency waveform. The performance of modern inverters is excellent, but transformers need to be de-rated according to the harmonic content present. Active or passive filters can be used to help mitigate generated harmonics, but these come at a cost and they will have a small energy loss. The faster rate of voltage change from the use of inverters puts additional stress on the transformer insulation, which may lead to premature failure on transformers with old or already compromised insulation systems.
1.3 Transformer purchasers
Different purchaser groups have different approaches to specifying transformer losses:
Utilities will use some variant on the total lifetime costs as discussed in chapter 5, and so do have an interest in transformer losses to a greater or lesser extent.
Research for this work showed that with a few notable exceptions, renewable energy developers do not pay much attention to transformer losses.
Building developers, especially of speculative developments, are concerned primarily with lowest first cost, and so show little interest in losses.
1.4 Typical UK transformer specifications
The UK distribution transformer market is characterised by manufacturers offering almost identical ranges of standard transformers to specified technical standards. Any significant variations from these standard types would themselves need type testing, and so would be very costly. Offering just these standard ranges, which are made in relatively large numbers, is also critical in keeping costs low in this price competitive market.
Within the UK market6, the primary and secondary voltage levels and MVA ratings are generally standard across the various networks, (with the exception of some parts of London, the industrial Midlands and Northern Ireland).
400/132kV – 240MVA (GB)
275/132kV – 240MVA (GB)
132/66kV – 30, 45, 75MVA (typical in London and the industrial Midlands)
132/33kV – 30, 60, 90MVA (GB)
10
132/22kV – 60MVA (London, typically for the Underground network)
110/33kV – 60, 90MVA (Northern Ireland)
132/11kV – 60, 45, 30, 15MVA (GB)
66/22kV – 25, 36, 45MVA (London, typically for the Underground network)
66/11kV – 30 (2x15MVA), 28, 17, 15MVA (typical in London and in the industrial Midlands)
33/11kV – 40, 24, 20, 15, 12, 10, 8MVA (UK)
33/6.6kV – 20, 24MVA (typical in London and in the industrial Midlands)
Ground mounted transformers (11000/420V) – three phase – 100, 200, 315, 500, 800, 1000kVA (UK)
Pole mounted transformers (11000/420V) – three phase – 50, 100, 200, 315kVA (UK)
Note: it is common practice to define the primary and secondary voltages at the “no load” condition. Hence for the distribution transformers the “no load” secondary voltage above is given as 420V. This will drop to 400V under normal load conditions, which is the declared load at LV consumer terminals in the UK. The primary voltage is normally the “source” winding, the secondary voltage being the “load” winding. For transformers used within the renewables industry, the rating will usually be determined by the nameplate rating of the generation equipment. Therefore typical values for wind turbine transformers are 250kVA, 500kVA, 750kVA, 1MVA, 1.5MVA, 2MVA, 2.5MVA, 4MVA. With smaller transformers, DER developers will select the nearest available transformer to match their turbine, rather than incurring the expense of designing and type testing a bespoke transformer. UK transformers historically were constructed in compliance with BS171, which has been obsolete since approx 1980. Transmission transformers were designed to ENA BEBS T2 which was a bespoke CEGB standard. These standards have been replaced with the introduction of IEC EN 60076 – Power Transformers. All new transformers are constructed using this standard as the basis of their design for the UK market. Oil in transformers may be replaced with a synthetic ester-based dielectric coolant. Although this has beneficial properties, being far less flammable than traditional transformer oil, and less polluting in the event of a spillage, it is less efficient as a cooling medium. Therefore synthetic coolant filled transformers are larger than the equivalent oil filled type, and may require additional pumps and fans. The bespoke CEGB standards called for many unique design features related to installation, testing and maintenance. For example, the exact way in which terminal blocks were made in control panels were defined precisely, down to the thread on the brass locking nuts. The CEGB specifications naturally favoured traditional UK manufacturers who had a guaranteed market with the CEGB. These transformers tended to be more expensive to manufacture than equivalent units manufactured in Europe and elsewhere. With the deregulation, the UK supply industry could no longer justify bespoke designs, which opened up the market to European manufacturers working to the new IEC standard. Unfortunately, the UK manufacturers were not able to compete, leading to a sharp decline apart from the very specialist quality market seen today. The IEC standard is perfectly respectable, however it does allow the manufacturer some flexibility relating to the quality and robustness of construction, which has resulted in much lighter tanks for example. For the DER market, where the expected life may only be 20 years, this may not be an issue, but for transmission transformers, located outdoors for 40+ years, issues may develop relating to rusting and leakage.
11
The existing constraints on the network operators are very heavily skewed towards minimising capital costs, which has opened up the market to imported transformers from outside Europe.
1.5 UK Transformer manufacturing capacity Few standard distribution transformers are now manufactured in the UK, with DNO‟s typically buying high volumes of a few models made to standard specifications. By contrast there are many small to medium manufacturers of specialist types.
Historically the UK had several manufacturers of large transformers (greater than 36kV), but with the exception of Brush transformers, these were all closed in the late 1990‟s and early 2000‟s. Now Alstom (Stafford) is the only recognised transformer manufacturer in the UK that constructs specialist power transformers. In addition there are a number of smaller companies who manufacture specialist transformers below 36kV.
As part of the evidence collecting process for this report, contact was made with 12 UK distribution transformer manufacturers. It was found that the majority of these transformer manufacturers produce specialist transformers for specific applications such as traction transformers and generator neutral earthing transformers. Critically there is no capacity for the production of standard distribution transformers of the type used within the renewable energy or power distribution sectors. This means that UK manufacturers will not be impacted the forthcoming EC Energy Using Product Directive on transformers. As part of this project, the major transformer producers were contacted for market information, but with notable exceptions there was disappointingly little response. This was taken as a reflection of the fact that most transformer activity in the UK is either relating to specialist types outside the scope of the regulations, and the large amount of refurbishment activity.
ABB Power Technology Products Dundee Transformer Division is the focal point for all ABB transformer projects in the UK. Products made include various ranges of both TrafoStar power transformers for transmission networks and distribution transformers for local supply networks.
Eaton (Cutler-Hammer) can supply a wide range of power and distribution transformers. Included are low temperature rise energy efficient single- and three-phase energy efficient types. All are NEMA TP-1-1996 compliant.
Square D offers a complete line of transformers that can significantly reduce energy losses. The Type EE energy efficient transformers are optimised for maximum efficiency at the most common loading levels.
The company's Watchdog 115°C or 80°C rise transformers offer significant energy savings in less common applications where the average daily loading exceeds 50% of nameplate rating.
Another interesting product from Square D is its Type EE NEMA TP-17 compliant ENERGY STAR transformers. These comply with TP-1 for optimum energy efficiency at 35% load, are more efficient than standard 150°C rise transformers at all load levels, have identical dimensions to standard 150°C rise general purpose transformers, and are reported to have been cost optimised to allow an energy savings payback in 3 - 5 years.

12
Merlin Gerin hermetically sealed transformers giving reduced maintenance have been added to the Fast Trans range. Once installed, these transformers will operate without further attention required to the fluid, making them ideal for petrochemical complexes, water plants and sewage treatment works, as well as many industrial applications.
13
2 Transformer design considerations
2.1 Fundamental transformer design relationships
The transformer designer is able to adjust the design for best efficiency at different load points. But any changes might impact other parameters, and so there is only limited scope for change. In particular, any reduction in the impedance of a transformer will increase the fault level on the secondary side. The control of fault level is essential for the correct operation of the network protection schemes. Maintaining a correct fault level is also crucial in maintaining the stability of voltage at the consumer‟s terminals as the network load varies, especially for large motors and rail traction supplies. Key variables are:
Footprint
Weight
Voltage regulation and short circuit capability
Cost
Materials used in the core and windings
Insulation and cooling medium The formula governing transformer design, which is called the EMF Equation of Transformer, is: E = 4.44 BANf Where E = Electromotive Force induced in the transformer winding B = flux density A = Cross Section Area (csa) of core N = Number of turns f = Frequency Some key relationships flow from this and additional physical considerations, which explain why in practice transformers for the same duty are all very similar;
Higher frequency enables a smaller transformer. This is why US 60Hz regulations are not appropriate for EU 50Hz applications.
The steel core has a definite knee-point around 1.6-1.8Tesla, above which the Watt/kg losses get rapidly much higher, and so there is in practice little room for changing the flux density without using alternative materials.
The number of turns is determined by the voltage ratio, and also the flux, giving a V/turn for the selected core.
The area of the core is fixed through the relationship Φ (flux) = B.A, where B and A are already constrained as mentioned above.
14
The following table gives a summary of the impacts of measures to change load or no-load losses.
To decrease no-load losses Impact on Load losses
Total cost
Use lower loss core material No change but could increase if lower flux density
Higher
Decrease flux density by increasing core cross sectional area
Higher Higher
Decrease flux density by decreasing volts per turn
Higher Higher
Decrease flux path length by decreasing conductor cross sectional area
Higher Lower
To decrease load losses Impact on No load losses
Total cost
Use lower loss conductor materials No change Higher
Decrease current density by increasing conductor cross sectional area
Higher Higher
Decrease current path length by decreasing core cross sectional area
Higher Lower
Decrease current path length by increasing volts per turn
Higher Higher
Table 1: The impact of measures to reduce load or no load losses
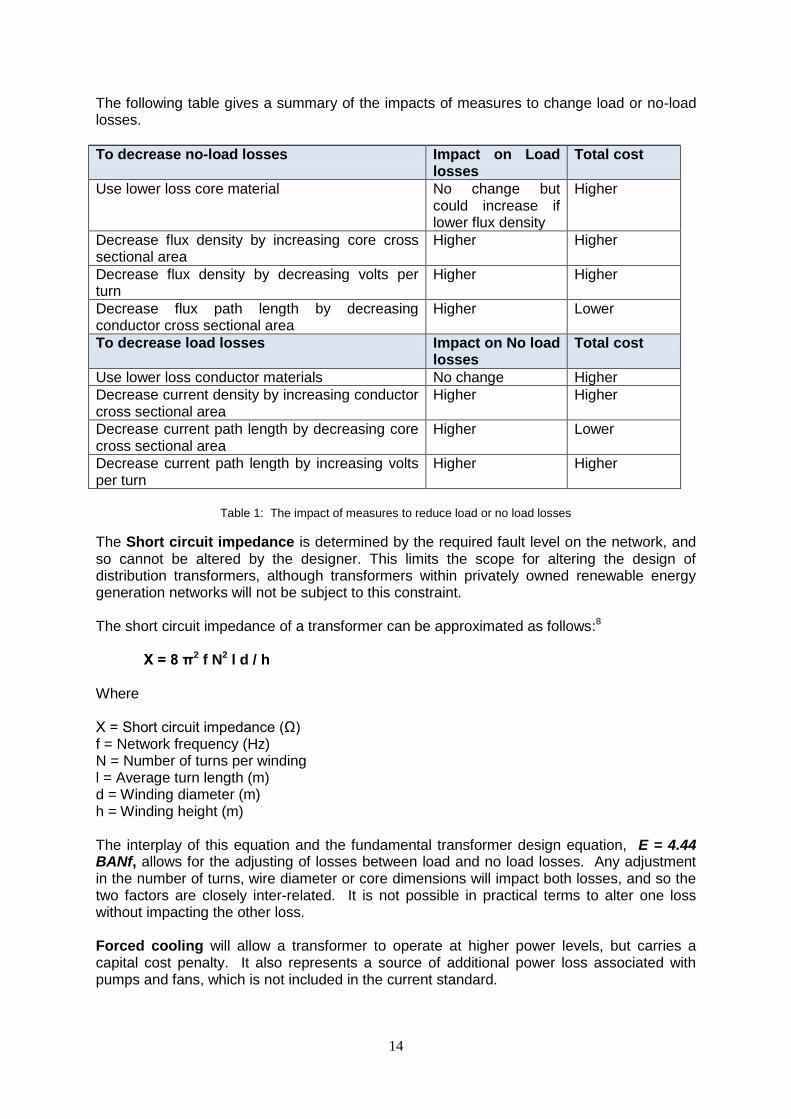
The Short circuit impedance is determined by the required fault level on the network, and so cannot be altered by the designer. This limits the scope for altering the design of distribution transformers, although transformers within privately owned renewable energy generation networks will not be subject to this constraint. The short circuit impedance of a transformer can be approximated as follows:8
X = 8 π2 f N2 l d / h
Where X = Short circuit impedance (Ω) f = Network frequency (Hz) N = Number of turns per winding l = Average turn length (m) d = Winding diameter (m) h = Winding height (m) The interplay of this equation and the fundamental transformer design equation, E = 4.44 BANf, allows for the adjusting of losses between load and no load losses. Any adjustment in the number of turns, wire diameter or core dimensions will impact both losses, and so the two factors are closely inter-related. It is not possible in practical terms to alter one loss without impacting the other loss. Forced cooling will allow a transformer to operate at higher power levels, but carries a capital cost penalty. It also represents a source of additional power loss associated with pumps and fans, which is not included in the current standard.
15
Where transformers are located within buildings, generally in densely populated city centres, there is an additional load associated with air handling to ventilate the transformers. This load is considered as part of the building services, and is therefore covered by building regulations. Alternatively, in some cases the losses will be used during cooler months to provide some heating for the buildings.
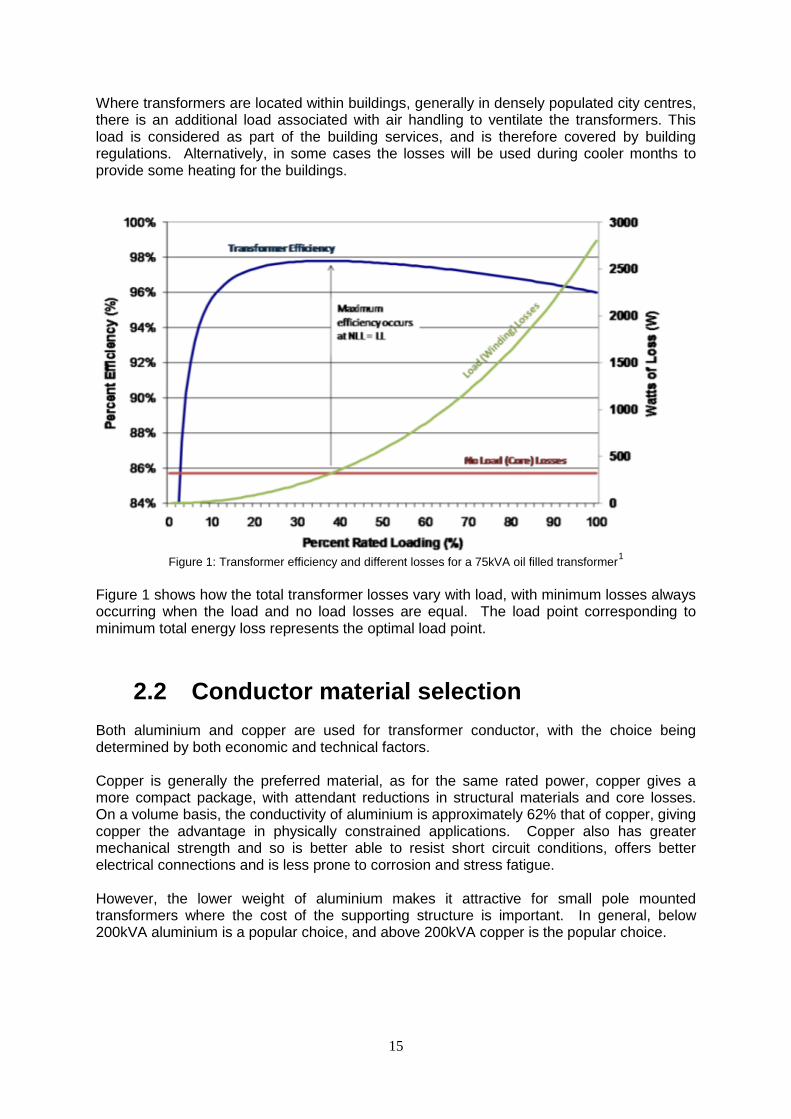
Figure 1: Transformer efficiency and different losses for a 75kVA oil filled transformer
1
Figure 1 shows how the total transformer losses vary with load, with minimum losses always occurring when the load and no load losses are equal. The load point corresponding to minimum total energy loss represents the optimal load point.
2.2 Conductor material selection
Both aluminium and copper are used for transformer conductor, with the choice being determined by both economic and technical factors. Copper is generally the preferred material, as for the same rated power, copper gives a more compact package, with attendant reductions in structural materials and core losses. On a volume basis, the conductivity of aluminium is approximately 62% that of copper, giving copper the advantage in physically constrained applications. Copper also has greater mechanical strength and so is better able to resist short circuit conditions, offers better electrical connections and is less prone to corrosion and stress fatigue. However, the lower weight of aluminium makes it attractive for small pole mounted transformers where the cost of the supporting structure is important. In general, below 200kVA aluminium is a popular choice, and above 200kVA copper is the popular choice.
16
2.3 Transformer ratings The nameplate continuous rating of a transformer, which is defined in the IEC standard, is based on the output power corresponding to a 65K temperature rise above ambient temperature, known as Continuous Maximum Rating (CMR). In addition, it will have a short term overload capacity of typically 20% above CMR for 8 hours, and an even higher short term emergency rating. It is accepted practice to design a transformer to regularly go into the overload region for short periods of time, but this additional thermal stress will reduce the life of the transformer. A poor load power factor will adversely impact transformer losses through additional current flow for the same output power, (VA). However, as with harmonic heating, this is a load impact that will apply to all transformers irrespective of their rated efficiency. In theory, users could chose to circumvent new regulations by deliberately buying under-sized transformers and running them at higher loads than intended. Given that a transformer is effectively specified in terms of a temperature rise, deliberately under-sizing a transformer in order to be able to select a transformer that has a rated efficiency below the MEPS legislation may start to occur.
2.4 Dry (cast resin) and Oil filled transformers
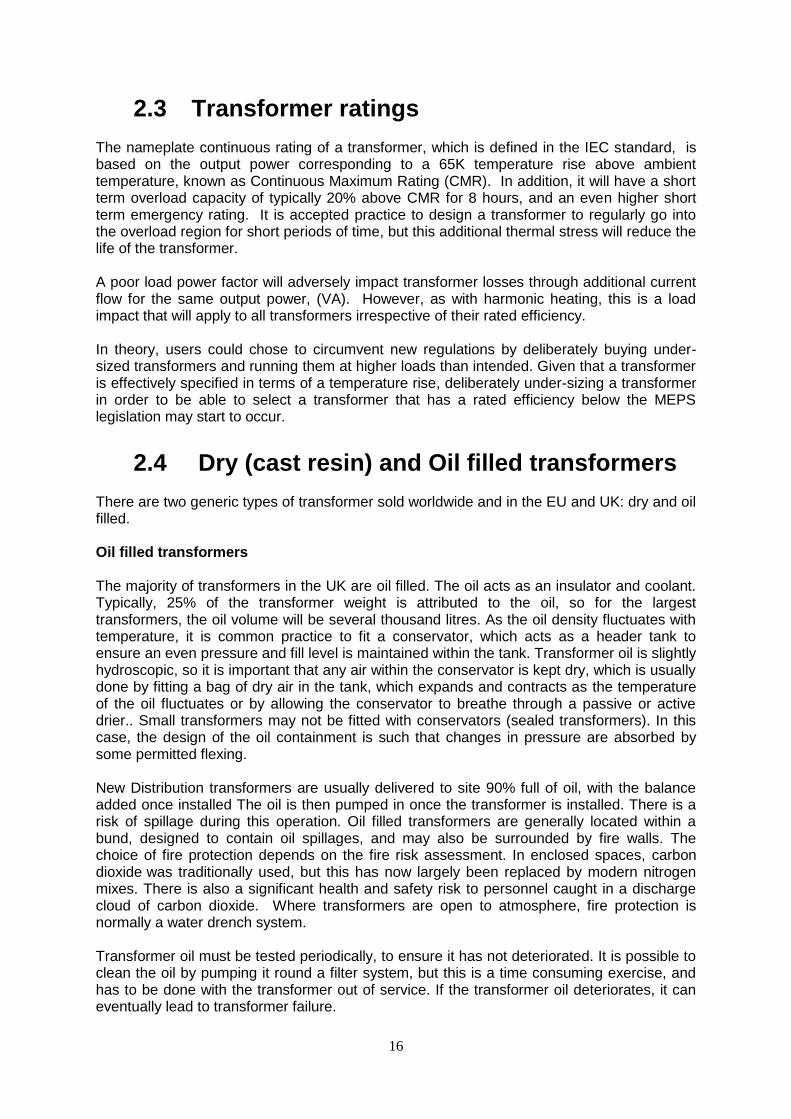
There are two generic types of transformer sold worldwide and in the EU and UK: dry and oil filled. Oil filled transformers The majority of transformers in the UK are oil filled. The oil acts as an insulator and coolant. Typically, 25% of the transformer weight is attributed to the oil, so for the largest transformers, the oil volume will be several thousand litres. As the oil density fluctuates with temperature, it is common practice to fit a conservator, which acts as a header tank to ensure an even pressure and fill level is maintained within the tank. Transformer oil is slightly hydroscopic, so it is important that any air within the conservator is kept dry, which is usually done by fitting a bag of dry air in the tank, which expands and contracts as the temperature of the oil fluctuates or by allowing the conservator to breathe through a passive or active drier.. Small transformers may not be fitted with conservators (sealed transformers). In this case, the design of the oil containment is such that changes in pressure are absorbed by some permitted flexing. New Distribution transformers are usually delivered to site 90% full of oil, with the balance added once installed The oil is then pumped in once the transformer is installed. There is a risk of spillage during this operation. Oil filled transformers are generally located within a bund, designed to contain oil spillages, and may also be surrounded by fire walls. The choice of fire protection depends on the fire risk assessment. In enclosed spaces, carbon dioxide was traditionally used, but this has now largely been replaced by modern nitrogen mixes. There is also a significant health and safety risk to personnel caught in a discharge cloud of carbon dioxide. Where transformers are open to atmosphere, fire protection is normally a water drench system. Transformer oil must be tested periodically, to ensure it has not deteriorated. It is possible to clean the oil by pumping it round a filter system, but this is a time consuming exercise, and has to be done with the transformer out of service. If the transformer oil deteriorates, it can eventually lead to transformer failure.
17
Oil filled transformers are generally fitted with additional instrumentation, which provides alarms under a range of conditions, such as oil level low, oil temperature high, winding temperature high, gas bubbles in oil (this is detected by a Buchholtz relay) or pressure relief valves.
Figure 2. Oil filled transformer (Voltimum)
Oil filled transformers are cooled by heat transfer from the oil to atmosphere. Traditionally, transformers are fitted with banks of radiators. The oil circulates by natural convection, which can be augmented with pumps when the oil temperature reaches a predefined level. The effectiveness of heat loss from the radiators can be enhanced by the use of fans to increase the air speed across the radiators. Transformers in hot climates are frequently shaded from direct sunlight to reduce solar gain, and may be fitted with larger radiators. It is also frequently necessary to surround transformers and radiators with fencing to prevent unauthorised access, and reduce the possibility of wildlife attempting to nest on the convenient warm ledges. Birds nests are a particular hazard, as bird droppings are corrosive, and the nesting materials can cause short circuits across the transformer terminations. Altering the design of fire walls or enclosures would enhance the natural flow of air around the transformers, and hence reduce the need for auxiliary cooling. There are a number of synthetic oil substitutes available, which are widely used where the fire risk is considered high. However these fluids are not as efficient cooling media as traditional mineral oil, and therefore the transformers are physically larger for the same rating. Synthetic oils may also be specified where there is a significant environmental risk, such as water pumping stations, as they are less polluting in the event of spillage. Both dry and oil filled transformers on load emit a low pitched noise, arising from the vibrations in the core and windings. This can be reduced to some extent by the use of anti-vibration mounts, but where noise is likely to cause an environmental nuisance, additional screening has to be installed. This may degrade the natural flow of cooling air, requiring the possible use of auxiliary cooling. Dry (cast resin) transformers
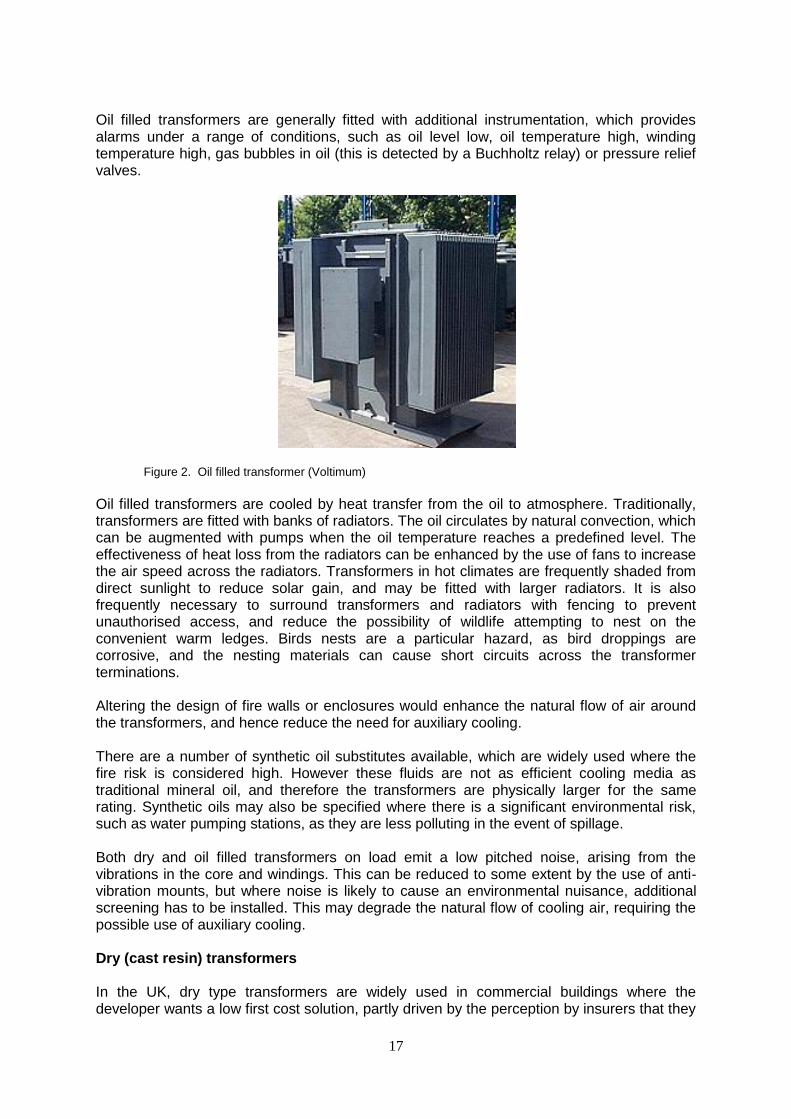
In the UK, dry type transformers are widely used in commercial buildings where the developer wants a low first cost solution, partly driven by the perception by insurers that they
18
are less of a fire risk. There are also reduced civil works costs, as this type of transformer does not require bunding or fire protection. Dry type transformers can suffer from an increase in electrical stresses within their windings if there is frequent switching in and out of the transformer. This is because partial discharges occur within the void between the coil and the cast resin. For liquid filled transformers, the electrical stresses are reduced during frequent switching on and off due to the insulating liquid‟s ability to regenerate after a discharge has occurred within it.
Figure 3. Dry Type Transformer, (R&B Switchgear Services)
2.5 Transformer efficiency trends From 1970 to 2000, the general efficiency for liquid filled transformers improved by approximately 0.5%, while that for dry type transformers has actually decreased by approximately 0.9% for a unit size of 250kVA. The reason for the decrease in efficiency of dry type transformers is that purchasers of dry type transformers do not consider losses as part of their evaluation criteria when purchasing new transformers. It has been reasoned in a number of technical papers that the efficiency of dry type transformers could have been improved by a further 1.3% on its 1970 efficiency value if manufacturers had the incentive to improve the dry type transformer efficiency. This would have made dry type transformers comparable with oil filled types in efficiency terms9.
2.6 Losses from Harmonic currents
Many RE sources have a power electronic network interface, which will generate harmonics. Most standards only consider the fundamental sinusoidal waveform, but in real life a transformer will be subject to harmonic currents. These increase the losses by the following mechanisms:
Additional core losses
Eddy current losses in conductors
19
Skin effect losses in conductors The significance of harmonics in power systems has increased substantially due to the use of power electronic devices. An important consideration when evaluating the impact of harmonics is their effect on power system components and loads. The increased losses due to harmonic distortion can cause excessive winding loss and hence abnormal temperature rise. Existing standards give a procedure to determine the capability of an existing transformer subject to non-sinusoidal load currents based on conservative assumptions. The eddy current loss generated by the electromagnetic field is assumed to vary with the square of the RMS current and the square of the frequency (harmonic order h). Due to the skin effect, the electromagnetic flux may not totally penetrate the strands in the winding at high frequencies. A standard solution for reducing the skin-effect problem is therefore to use multiple parallel conductors. The temperature rise due to harmonics is estimated based on constant harmonic load currents, and the average daily or monthly temperatures to which a transformer would be subjected while in service. When a non-linear load is supplied from a transformer, it is sometimes necessary to de-rate the transformer capacity to avoid overheating and subsequent insulation failure. The „K‟ factor is used to de-rate transformers subject to harmonic distortion. The K-factor is a weighting of the harmonic load currents according to their effects on transformer heating. A K-factor of 1.0 indicates a linear load (no harmonics). The higher the K-factor, the greater the harmonic heating effects. It is noted that the EUP Preparatory Study reasonably states that this does not need taking account of in any regulations, as it applies uniformly to all transformers and so there is no room for further regulatory intervention. The use of inverters on many types of RE generation plant means that harmonic losses are becoming more of an issue. In the same way that IEC 60034-2-3 is now looking at testing induction motors under harmonic distortion from VSDs, it is suggested that transformer tests should consider these losses. However, more work is needed in the transformer community before it will be timely to make any suggestions.
2.7 Technology for improved efficiency
It has been stated by a number of key transformer manufacturers in both Europe and the US that the losses associated with distribution transformers can technically be reduced by between 30% and 40% below current levels. This increase in energy efficiency has a big impact on the cost per unit for the transformer.
On average, 70% of all losses associated with transformers are no-load losses, and so this is the focus of improving efficiencies for transformers. Fortunately, improved core technologies are available that allow for cost effective reductions in no load losses.
20
2.7.1 Improvements in steel laminations
Developments in conventional steels have reduced losses through the following changes:
Improved magnetic permeability
Magnetic domain refinement
Reduced core steel sheet thickness,
Increased lamination stacking factors through increased perfection in steel surface quality
Thickness uniformity
Inter-laminar insulation.
In practice, the regulations as currently stated are effectively dictating the use of these lower loss laminations, as it will be hard to achieve the specified minimum no load losses with older lamination designs.
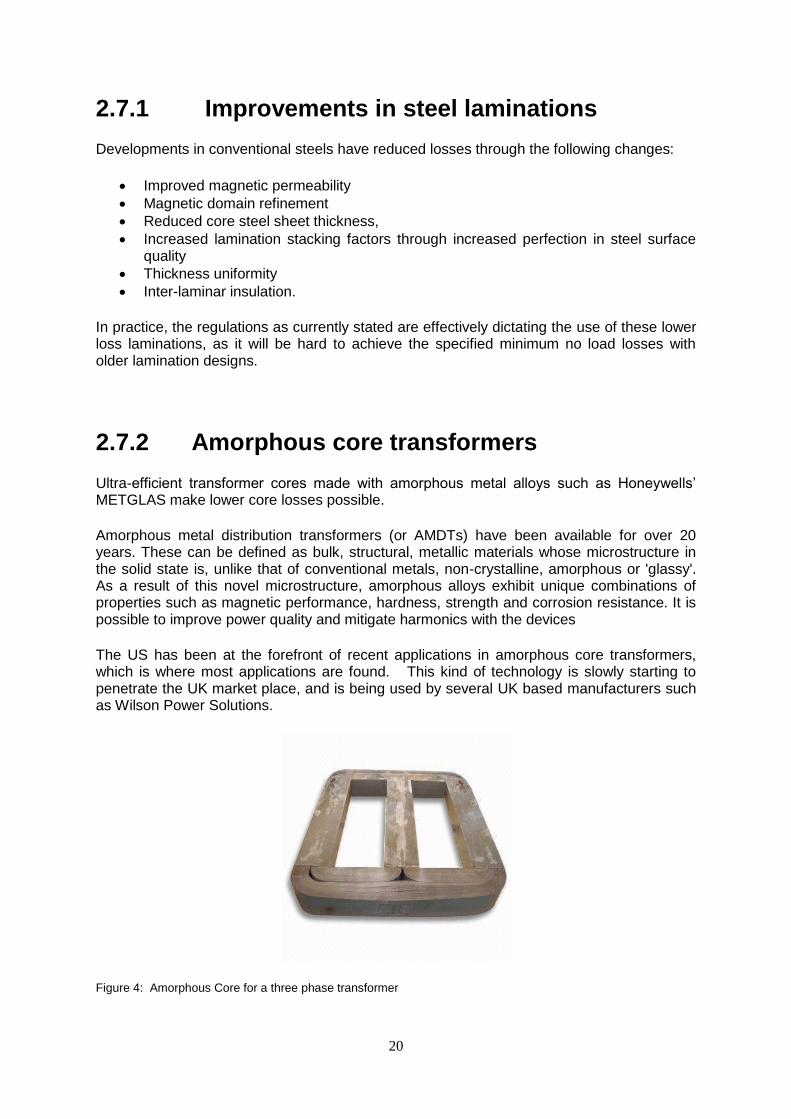
2.7.2 Amorphous core transformers
Ultra-efficient transformer cores made with amorphous metal alloys such as Honeywells‟ METGLAS make lower core losses possible.
Amorphous metal distribution transformers (or AMDTs) have been available for over 20 years. These can be defined as bulk, structural, metallic materials whose microstructure in the solid state is, unlike that of conventional metals, non-crystalline, amorphous or 'glassy'. As a result of this novel microstructure, amorphous alloys exhibit unique combinations of properties such as magnetic performance, hardness, strength and corrosion resistance. It is possible to improve power quality and mitigate harmonics with the devices
The US has been at the forefront of recent applications in amorphous core transformers, which is where most applications are found. This kind of technology is slowly starting to penetrate the UK market place, and is being used by several UK based manufacturers such as Wilson Power Solutions.
Figure 4: Amorphous Core for a three phase transformer
21
Amorphous core technology does have some disadvantages that have historically limited its impact:
The cost of high efficiency rated equipment can be twice as great as a standard efficiency transformer.
Availability in UK currently is not as good as for conventional types. Amorphous metal cores are up to 30% bigger than conventional cores Brittle, and so careful handling required during manufacture, installation and
servicing. Improved high frequency performance, so better if subject to high harmonic currents. Only available in sizes up to 20MVA.
An important consideration is that AMDT transformers are generally designed with a utilisation factor of around 50% as this is the most efficient value for AMDT materials.
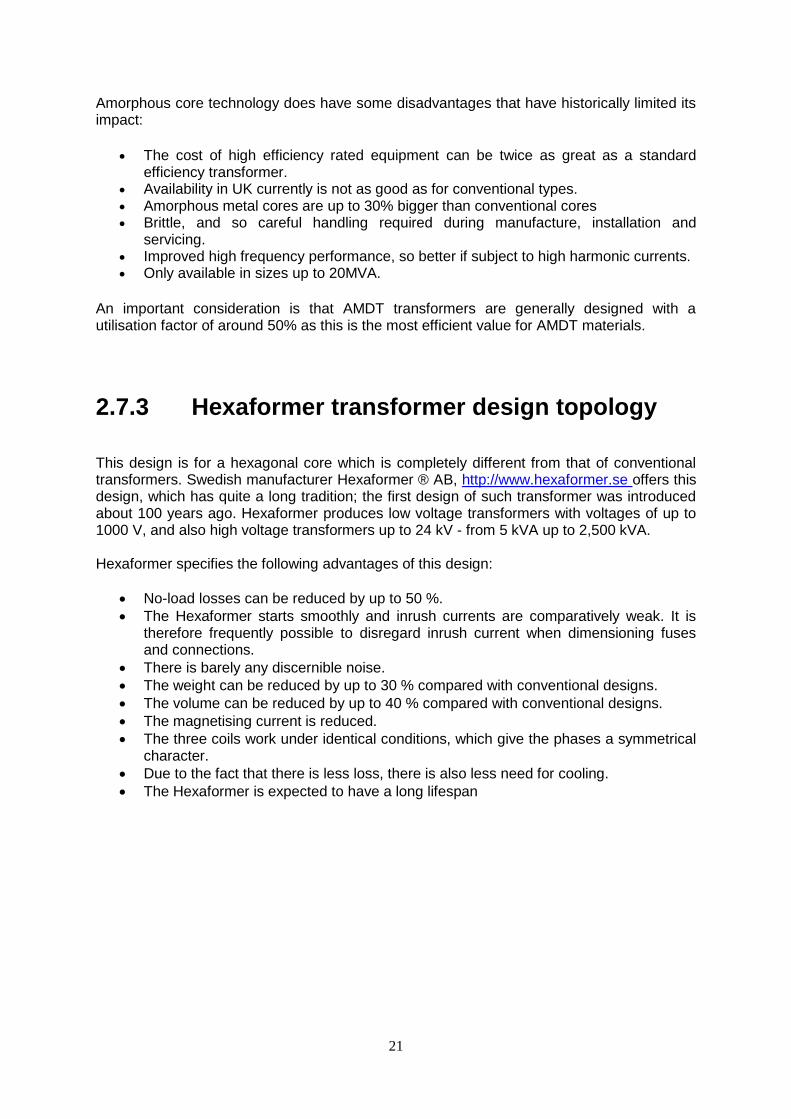
2.7.3 Hexaformer transformer design topology
This design is for a hexagonal core which is completely different from that of conventional transformers. Swedish manufacturer Hexaformer ® AB, http://www.hexaformer.se offers this design, which has quite a long tradition; the first design of such transformer was introduced about 100 years ago. Hexaformer produces low voltage transformers with voltages of up to 1000 V, and also high voltage transformers up to 24 kV - from 5 kVA up to 2,500 kVA. Hexaformer specifies the following advantages of this design:
No-load losses can be reduced by up to 50 %.
The Hexaformer starts smoothly and inrush currents are comparatively weak. It is therefore frequently possible to disregard inrush current when dimensioning fuses and connections.
There is barely any discernible noise.
The weight can be reduced by up to 30 % compared with conventional designs.
The volume can be reduced by up to 40 % compared with conventional designs.
The magnetising current is reduced.
The three coils work under identical conditions, which give the phases a symmetrical character.
Due to the fact that there is less loss, there is also less need for cooling.
The Hexaformer is expected to have a long lifespan
22
Figure 5. Hexaformer transformer, (ABB)
These transformers are quite popular in Sweden, other Nordic countries and increasingly in Spain. A recent development (June 2012) has been the introduction of Amorphous materials being used for the core which reduces the losses associated with the Hexaformer even further. This type of transformer should be considered for smaller scale renewable projects where generation may be very intermittent due to its low no-load loss characteristics. If and when the maximum kVA size of the transformer increases, then the number of potential applications for this type of transformer will increase. Market impact is also limited by the longer construction time needed to build these transformers. There are around 2,000 Hexaformer transformers installed today on the distribution power grid. These are found mainly in Northern Europe, however a number of units have just been ordered by ESB Ireland.
23
3 Proposed Regulations for Distribution transformers
3.1 General Scope The scope of the “Working document on a Commission Regulation implementing Directive 2009/125/EC with regard to small, medium and large power transformers” comprises the following: “This working document pursuant to Directive 2009/125/EC establishes ecodesign requirements related to small, medium and large power transformers with a minimum power rating of 1 kVA used in 50Hz electricity transmission and distribution. This Regulation shall not apply to the following categories of transformers:
Instrument transformers.
Traction transformers on rolling stock.
Starting transformers
Testing transformers
Welding transformers
Explosion-proof and underground mining transformers.
Transformers for deep water (submerged) applications. Definitions Transformers are considered as energy related products within the meaning of Article 2 (1) of Directive 200 9/125/EC. For the purpose of this working document and its annexes the following definitions shall apply. (1) “Power transformer” means a static piece of apparatus with two or more windings which, by electromagnetic induction, transforms a system of alternating voltage and current into another system of alternating voltage and current usually of different values and at the same frequency for the purpose of transmitting electrical power. (2) “General purpose s mall power transformer” means a power transformer with a highest voltage for equipment not exceeding 1 kV .. (3) “Medium power transformer” means a power transformer with a high voltage winding with a rated voltage higher than 1 kV, but not exceeding 36 kV.” (Additional note for clarification: Large power transformers may be used in any one of the following applications:
Generator step up transformer
Transmission transformer, including interbus transformers
Primary substation transformers, which for the UK market are Bulk Supply Points and Grid Supply Points)
24
It is of note that while the Preparatory Study on which these proposed regulations are based included DER (Distributed Energy Resource or Renewable Energy) transformers as a separate type, in the draft regulations this distinction is not made. DER transformers will therefore be subject to the same regulations as standard Distribution transformers. An important distinction should be made between those transformers that are connected to the DNO network and those within privately owned renewable energy system. Whereas transformers connected to the DNO network need to comply with DNO specifications, those that are privately owned do not. This gives flexibility for optimising secondary voltages to match that of the energy source, selection of dimensions to fit limited space in for example wind turbine towers, and in selection of prospective fault levels and hence impedances. Although not explicitly excluded from the proposed EUP regulations, it is assumed that because they may have non-standard impedances, such privately owned transformers may be excluded from the regulations.
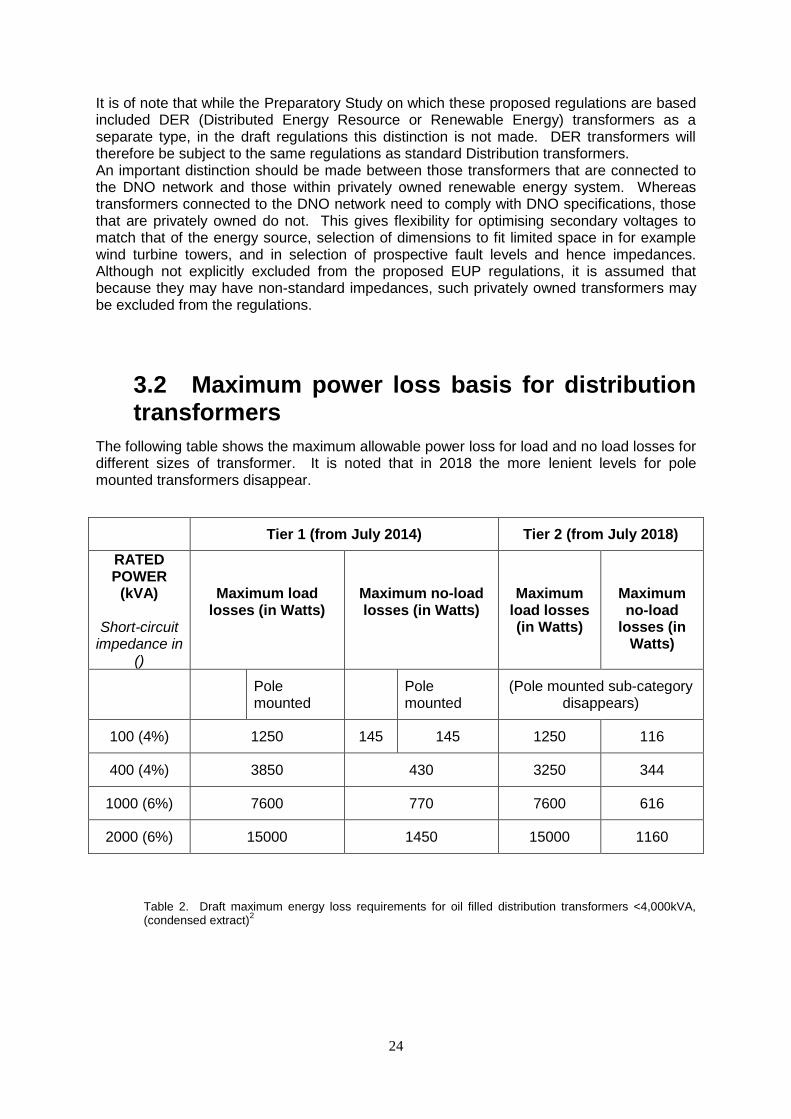
3.2 Maximum power loss basis for distribution transformers
The following table shows the maximum allowable power loss for load and no load losses for different sizes of transformer. It is noted that in 2018 the more lenient levels for pole mounted transformers disappear.
Tier 1 (from July 2014) Tier 2 (from July 2018)
RATED POWER
(kVA)
Short-circuit impedance in
()
Maximum load losses (in Watts)
Maximum no-load losses (in Watts)
Maximum load losses (in Watts)
Maximum no-load
losses (in Watts)
Pole mounted
Pole mounted
(Pole mounted sub-category disappears)
100 (4%) 1250 145 145 1250 116
400 (4%) 3850 430 3250 344
1000 (6%) 7600 770 7600 616
2000 (6%) 15000 1450 15000 1160
Table 2. Draft maximum energy loss requirements for oil filled distribution transformers <4,000kVA, (condensed extract)
2
25
3.3 Proposed methodology for regulating large power transformers
This proposal for the basis of regulation of large power transformers offers an interesting alternative to the proposed method of regulation to be used for small and medium distribution transformers. In this alternative method, regulation is effectively based on the combined total losses of the transformer, rather than separate MEPS of both the load and no load losses. There is also a suggestion that MEPS could be defined at different load points according to the category of application, not just their generic type. Both options enable the optimisation of transformers to be based on their actual operating conditions.
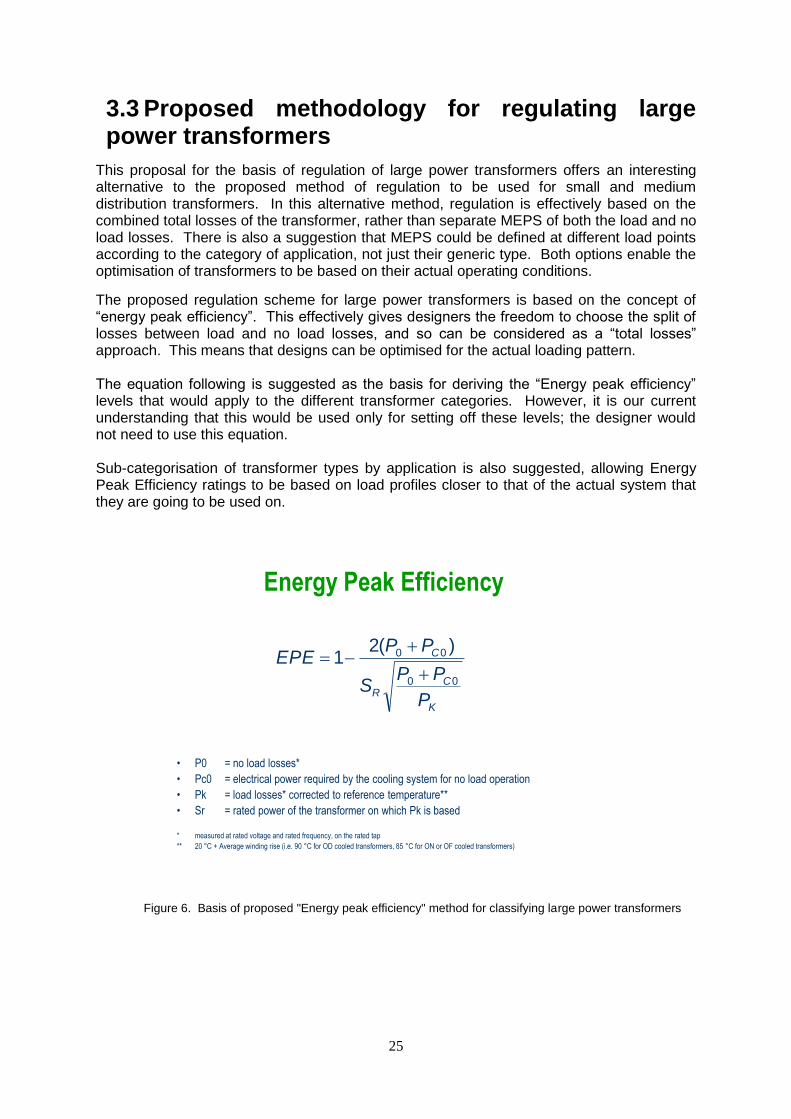
The proposed regulation scheme for large power transformers is based on the concept of “energy peak efficiency”. This effectively gives designers the freedom to choose the split of losses between load and no load losses, and so can be considered as a “total losses” approach. This means that designs can be optimised for the actual loading pattern. The equation following is suggested as the basis for deriving the “Energy peak efficiency” levels that would apply to the different transformer categories. However, it is our current understanding that this would be used only for setting off these levels; the designer would not need to use this equation. Sub-categorisation of transformer types by application is also suggested, allowing Energy Peak Efficiency ratings to be based on load profiles closer to that of the actual system that they are going to be used on.
Energy Peak Efficiency
• P0 = no load losses*
• Pc0 = electrical power required by the cooling system for no load operation
• Pk = load losses* corrected to reference temperature**
• Sr = rated power of the transformer on which Pk is based
* measured at rated voltage and rated frequency, on the rated tap
** 20 °C + Average winding rise (i.e. 90 °C for OD cooled transformers, 85 °C for ON or OF cooled transformers)
K
CR
C
P
PPS
PPEPE
00
00 )(21
Figure 6. Basis of proposed "Energy peak efficiency" method for classifying large power transformers
26
4 Renewable Energy Applications
4.1 Utilisation Considerations for Renewable Energy transformers
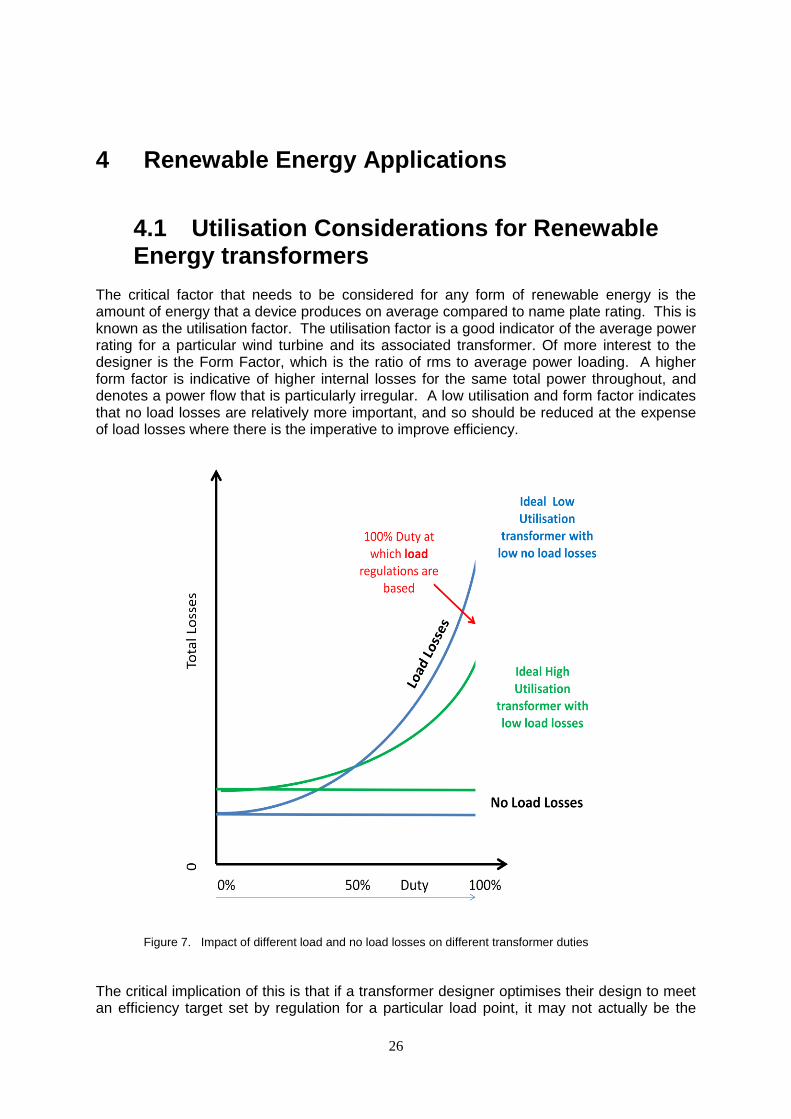
The critical factor that needs to be considered for any form of renewable energy is the amount of energy that a device produces on average compared to name plate rating. This is known as the utilisation factor. The utilisation factor is a good indicator of the average power rating for a particular wind turbine and its associated transformer. Of more interest to the designer is the Form Factor, which is the ratio of rms to average power loading. A higher form factor is indicative of higher internal losses for the same total power throughout, and denotes a power flow that is particularly irregular. A low utilisation and form factor indicates that no load losses are relatively more important, and so should be reduced at the expense of load losses where there is the imperative to improve efficiency.
Figure 7. Impact of different load and no load losses on different transformer duties
The critical implication of this is that if a transformer designer optimises their design to meet an efficiency target set by regulation for a particular load point, it may not actually be the
27
most economic solution in terms of life cycle losses and financial costs when used in a renewable energy application with a very different load profile. It should be noted that the EUP Preparatory study considered only wind energy transformers, which have a utilisation factor similar to the utility distribution transformers assumed in the techno-economic analysis behind the regulations. Applications at the high and low extremes of duties were not taken account of in the analysis.
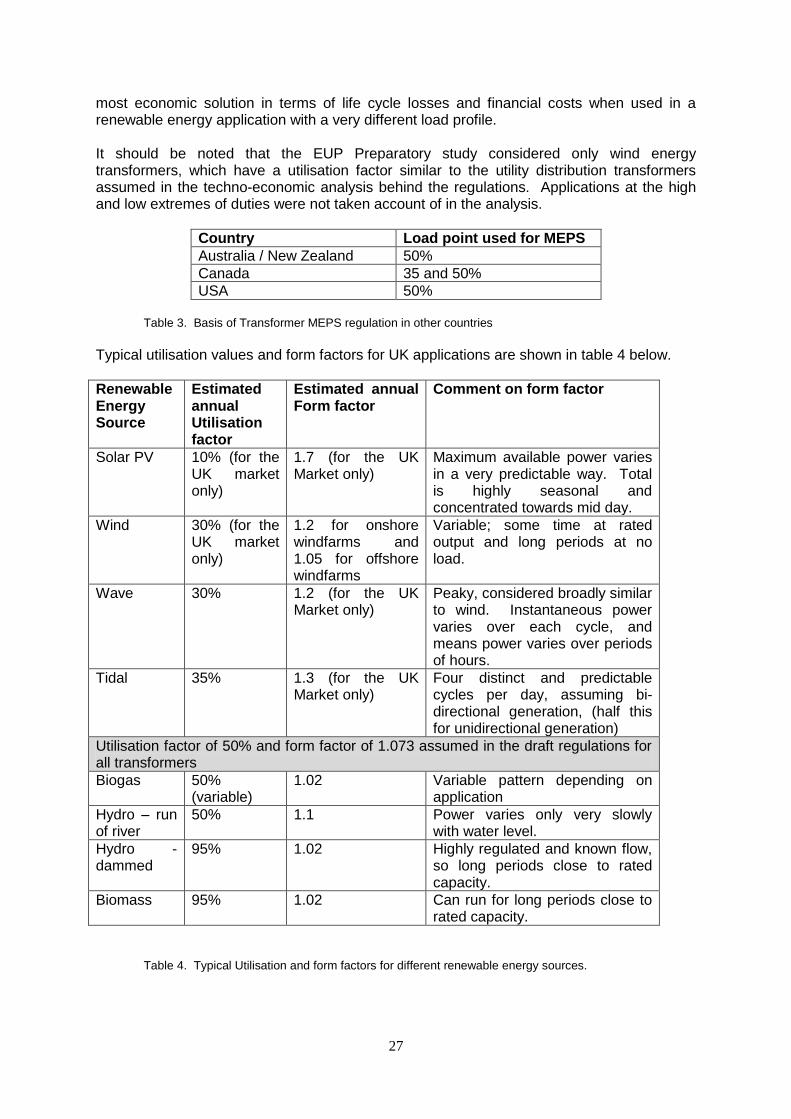
Country Load point used for MEPS
Australia / New Zealand 50%
Canada 35 and 50%
USA 50%
Table 3. Basis of Transformer MEPS regulation in other countries
Typical utilisation values and form factors for UK applications are shown in table 4 below.
Renewable Energy Source
Estimated annual Utilisation factor
Estimated annual Form factor
Comment on form factor
Solar PV 10% (for the UK market only)
1.7 (for the UK Market only)
Maximum available power varies in a very predictable way. Total is highly seasonal and concentrated towards mid day.
Wind 30% (for the UK market only)
1.2 for onshore windfarms and 1.05 for offshore windfarms
Variable; some time at rated output and long periods at no load.
Wave 30% 1.2 (for the UK Market only)
Peaky, considered broadly similar to wind. Instantaneous power varies over each cycle, and means power varies over periods of hours.
Tidal 35% 1.3 (for the UK Market only)
Four distinct and predictable cycles per day, assuming bi-directional generation, (half this for unidirectional generation)
Utilisation factor of 50% and form factor of 1.073 assumed in the draft regulations for all transformers
Biogas 50% (variable)
1.02 Variable pattern depending on application
Hydro – run of river
50% 1.1 Power varies only very slowly with water level.
Hydro - dammed
95% 1.02 Highly regulated and known flow, so long periods close to rated capacity.
Biomass 95% 1.02 Can run for long periods close to rated capacity.
Table 4. Typical Utilisation and form factors for different renewable energy sources.
28
It should be noted that these values are reasonable UK averages, with actual values varying from site to site, and averages varying between countries. For example solar favours countries in southern Europe, wind favours those on the northern coastal fringes of Europe.
4.2 Transformer De-energisation No load energy losses could in theory be removed completely by de-energising the transformer during times of no power production. However, energisation of a transformer involves very high inrush current, and so repeated action will reduce the life expectancy of the machine. Damage from partial discharges are a particular problem in dry transformers. This is not therefore a practical option.
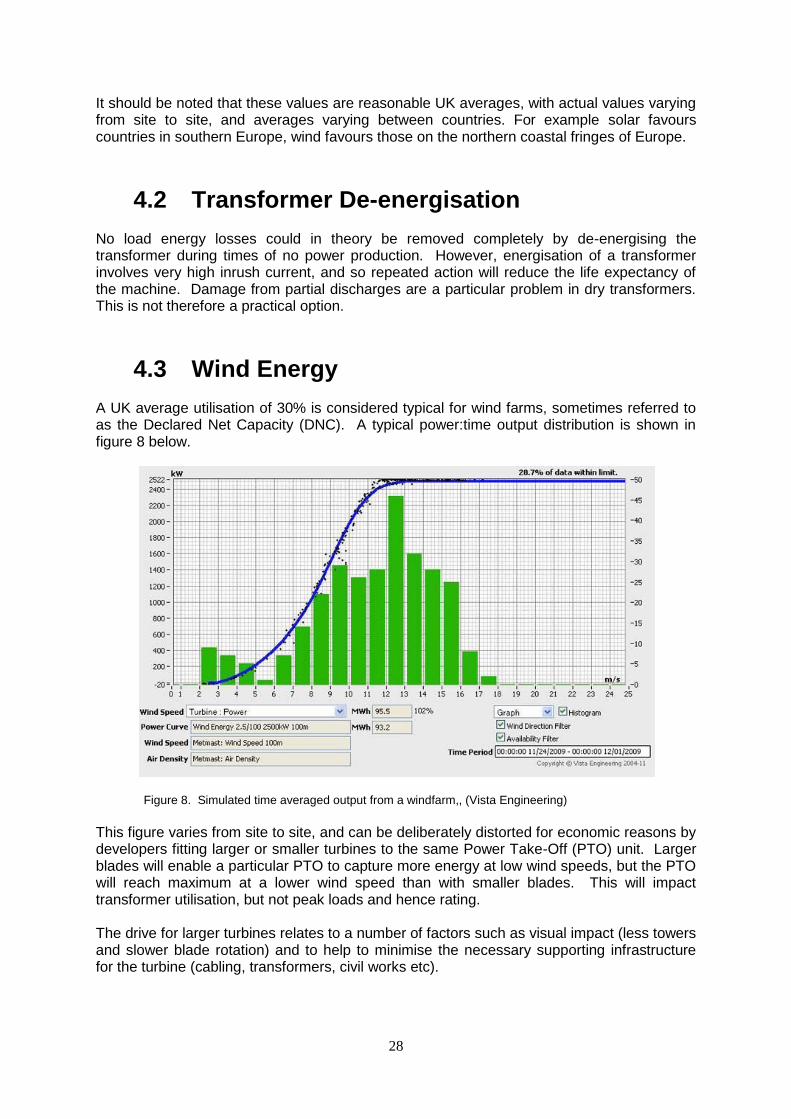
4.3 Wind Energy A UK average utilisation of 30% is considered typical for wind farms, sometimes referred to as the Declared Net Capacity (DNC). A typical power:time output distribution is shown in figure 8 below.
Figure 8. Simulated time averaged output from a windfarm,, (Vista Engineering)
This figure varies from site to site, and can be deliberately distorted for economic reasons by developers fitting larger or smaller turbines to the same Power Take-Off (PTO) unit. Larger blades will enable a particular PTO to capture more energy at low wind speeds, but the PTO will reach maximum at a lower wind speed than with smaller blades. This will impact transformer utilisation, but not peak loads and hence rating. The drive for larger turbines relates to a number of factors such as visual impact (less towers and slower blade rotation) and to help to minimise the necessary supporting infrastructure for the turbine (cabling, transformers, civil works etc).
29
A significant proportion of the transformer population for wind turbines are dry type transformers, primarily because of their minimal environmental impact and fire retardant properties12. Offshore wind For offshore wind transformers there is often a space constraint, which will limit design options. For arrays there will typically be a single step up transformer on a special platform which forms the interface with the connection to the mainland. The cost of the platform means that it is not feasible to have a standby transformer, and instead a spare transformer will be kept on shore for immediate deployment in the event the duty transformer fails. First generation wind turbines were typically 2MW, but more recent installations vary from 3MW (Enercon turbine E-82 E3) up to 10MW (AMSC Windtec turbine SeaTitan).
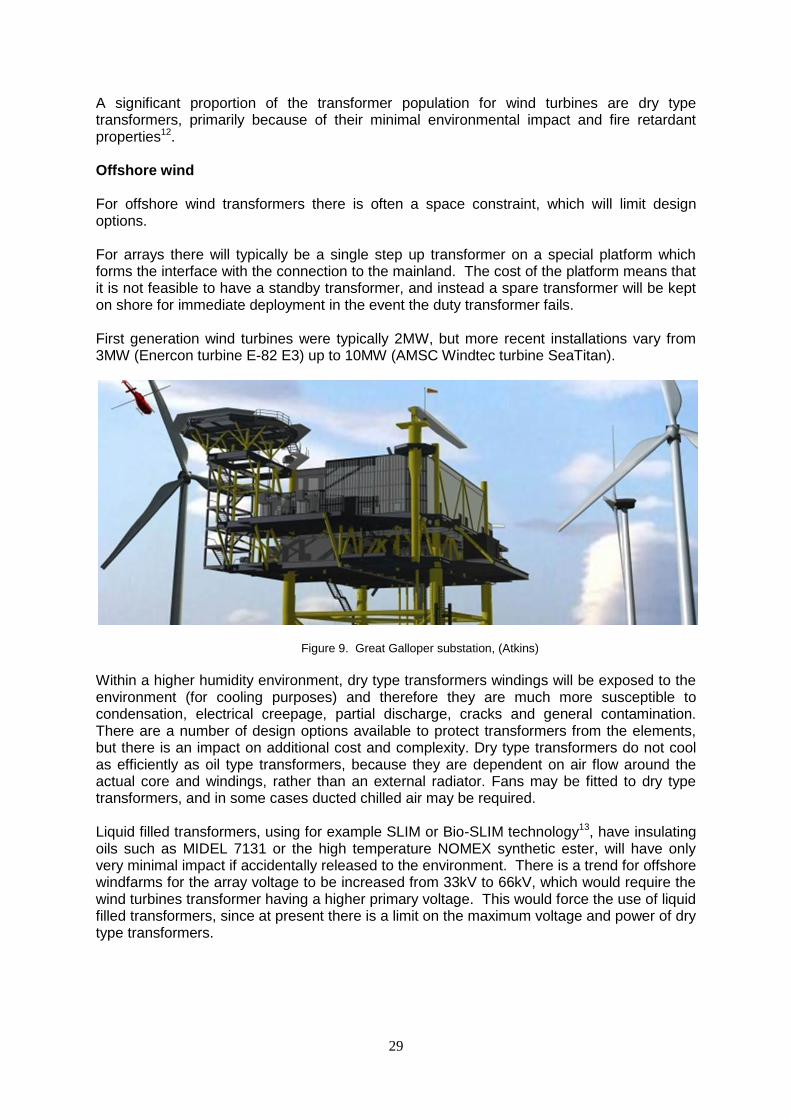
Figure 9. Great Galloper substation, (Atkins)
Within a higher humidity environment, dry type transformers windings will be exposed to the environment (for cooling purposes) and therefore they are much more susceptible to condensation, electrical creepage, partial discharge, cracks and general contamination. There are a number of design options available to protect transformers from the elements, but there is an impact on additional cost and complexity. Dry type transformers do not cool as efficiently as oil type transformers, because they are dependent on air flow around the actual core and windings, rather than an external radiator. Fans may be fitted to dry type transformers, and in some cases ducted chilled air may be required. Liquid filled transformers, using for example SLIM or Bio-SLIM technology13, have insulating oils such as MIDEL 7131 or the high temperature NOMEX synthetic ester, will have only very minimal impact if accidentally released to the environment. There is a trend for offshore windfarms for the array voltage to be increased from 33kV to 66kV, which would require the wind turbines transformer having a higher primary voltage. This would force the use of liquid filled transformers, since at present there is a limit on the maximum voltage and power of dry type transformers.
30
4.4 Solar Photovoltaic
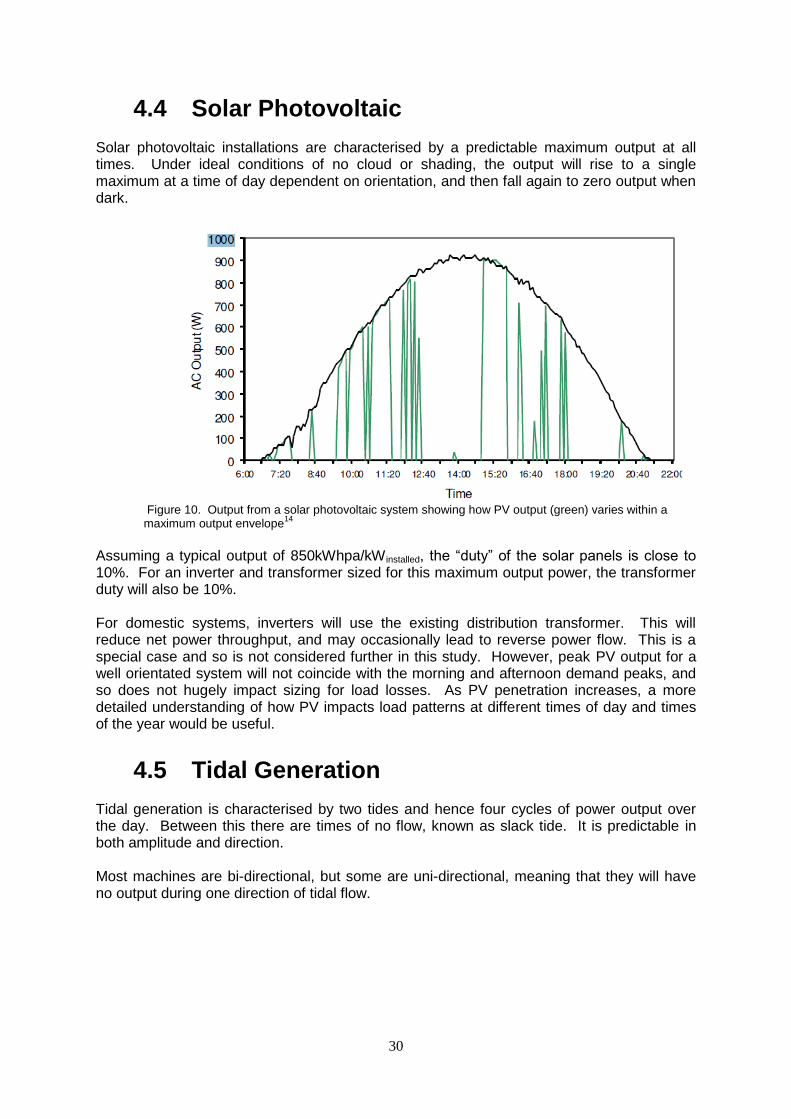
Solar photovoltaic installations are characterised by a predictable maximum output at all times. Under ideal conditions of no cloud or shading, the output will rise to a single maximum at a time of day dependent on orientation, and then fall again to zero output when dark.
Figure 10. Output from a solar photovoltaic system showing how PV output (green) varies within a maximum output envelope
14
Assuming a typical output of 850kWhpa/kW installed, the “duty” of the solar panels is close to 10%. For an inverter and transformer sized for this maximum output power, the transformer duty will also be 10%. For domestic systems, inverters will use the existing distribution transformer. This will reduce net power throughput, and may occasionally lead to reverse power flow. This is a special case and so is not considered further in this study. However, peak PV output for a well orientated system will not coincide with the morning and afternoon demand peaks, and so does not hugely impact sizing for load losses. As PV penetration increases, a more detailed understanding of how PV impacts load patterns at different times of day and times of the year would be useful.
4.5 Tidal Generation Tidal generation is characterised by two tides and hence four cycles of power output over the day. Between this there are times of no flow, known as slack tide. It is predictable in both amplitude and direction. Most machines are bi-directional, but some are uni-directional, meaning that they will have no output during one direction of tidal flow.
31
Figure 11. Tidal flow power output
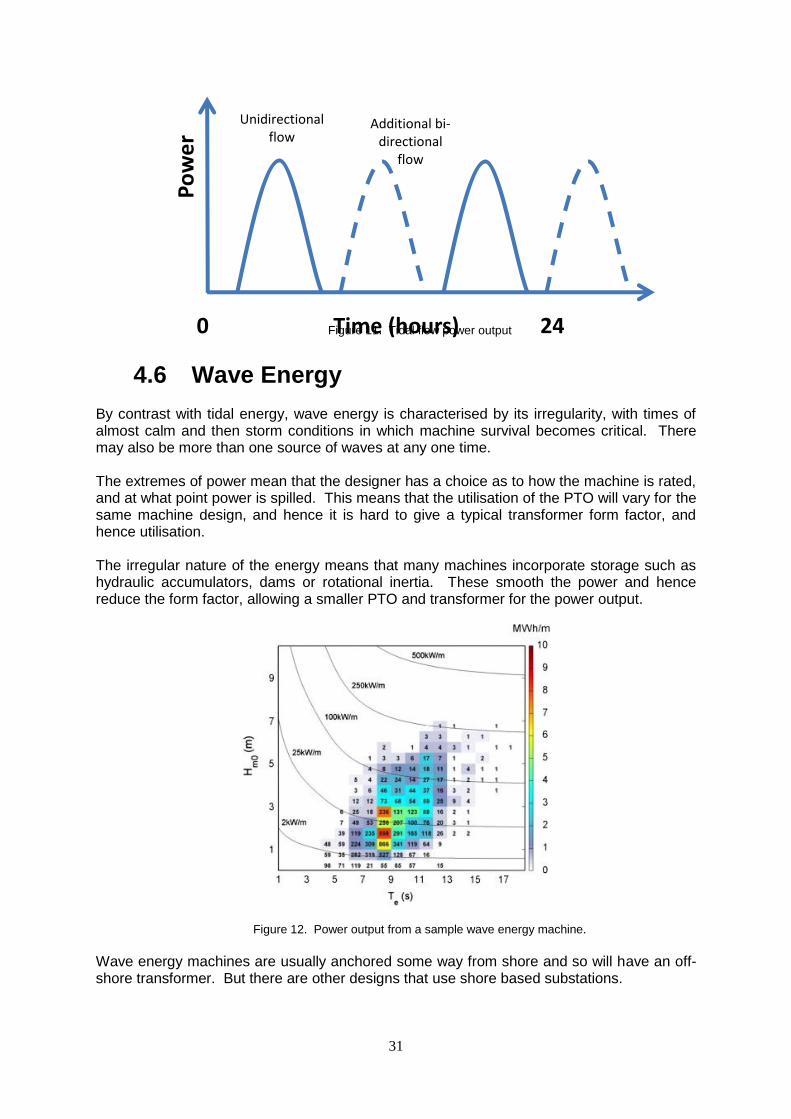
4.6 Wave Energy By contrast with tidal energy, wave energy is characterised by its irregularity, with times of almost calm and then storm conditions in which machine survival becomes critical. There may also be more than one source of waves at any one time. The extremes of power mean that the designer has a choice as to how the machine is rated, and at what point power is spilled. This means that the utilisation of the PTO will vary for the same machine design, and hence it is hard to give a typical transformer form factor, and hence utilisation. The irregular nature of the energy means that many machines incorporate storage such as hydraulic accumulators, dams or rotational inertia. These smooth the power and hence reduce the form factor, allowing a smaller PTO and transformer for the power output.
Figure 12. Power output from a sample wave energy machine.
Wave energy machines are usually anchored some way from shore and so will have an off-shore transformer. But there are other designs that use shore based substations.
0 Time (hours) 24
Po
we
r
Unidirectional flow
Additional bi-directional
flow
32
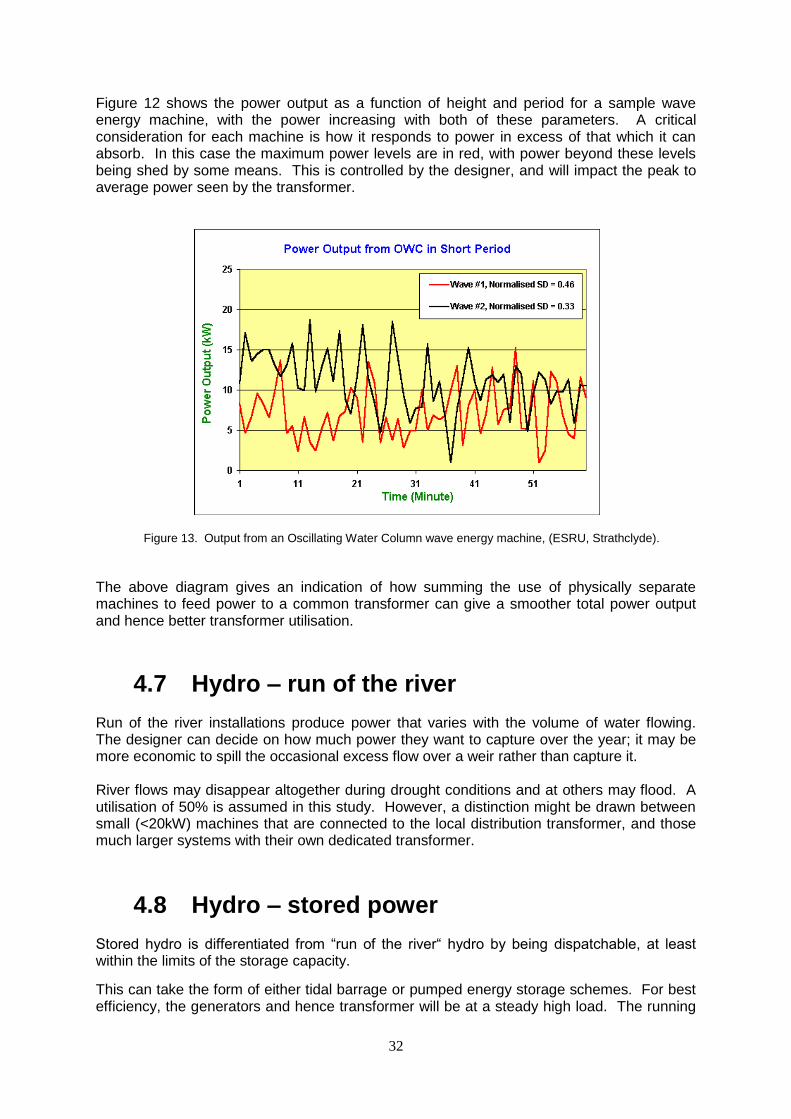
Figure 12 shows the power output as a function of height and period for a sample wave energy machine, with the power increasing with both of these parameters. A critical consideration for each machine is how it responds to power in excess of that which it can absorb. In this case the maximum power levels are in red, with power beyond these levels being shed by some means. This is controlled by the designer, and will impact the peak to average power seen by the transformer.
Figure 13. Output from an Oscillating Water Column wave energy machine, (ESRU, Strathclyde).
The above diagram gives an indication of how summing the use of physically separate machines to feed power to a common transformer can give a smoother total power output and hence better transformer utilisation.
4.7 Hydro – run of the river
Run of the river installations produce power that varies with the volume of water flowing. The designer can decide on how much power they want to capture over the year; it may be more economic to spill the occasional excess flow over a weir rather than capture it. River flows may disappear altogether during drought conditions and at others may flood. A utilisation of 50% is assumed in this study. However, a distinction might be drawn between small (<20kW) machines that are connected to the local distribution transformer, and those much larger systems with their own dedicated transformer.
4.8 Hydro – stored power
Stored hydro is differentiated from “run of the river“ hydro by being dispatchable, at least within the limits of the storage capacity.
This can take the form of either tidal barrage or pumped energy storage schemes. For best efficiency, the generators and hence transformer will be at a steady high load. The running
33
hours will depend on the installation, but may be closer to 30% than 100%. As an example, the Dinorwig pumped storage plant has generators rated 350MVA and transformers rated 360MVA.
4.9 Biomass
When being used, for best efficiency the plant will be working at or near rated capacity.
Co-firing and even full conversion of large coal fired power stations is growing in popularity, but this will just offset coal use, and so the transformer specification will not be effected.
By contrast, biomass for heating is different in that it will track the heating season, and so annual utilisation will only be low.
4.10 Biogas
For Waste Water Treatment works, many will not produce sufficient to run the engine continuously. This is an economic calculation, as otherwise biogas may need to be spilled if it cannot be used before the storage tanks are full.
Instead, generators may be run for just a few hours per day in order to use that days' biogas production. This will usually be at times of peak system load. An alternative is to run the machine for longer periods at part load, but this is less efficient and so gives less energy in total.
The transformers may be owned either by the site or the DNO.
34
5 Economics of transformer ownership in the UK
5.1 Economic Selection of Transformers The economically optimum design of a transformer depends on the investment approach of the User. The Total Lifetime Cost of Ownership sums the purchase, installation, maintenance, energy and de-commissioning costs over the lifetime of the asset. The outcomes of the analysis for similar applications will vary according to the critical assumptions of future energy costs and discount rates, and so the financially optimum transformer design will vary. Given the continuous duty and long lifetimes of distribution transformers, the cost of energy losses over the lifetime will be a major determinant The EUP regulations give maximum allowable values of loss for both the load and no load losses. These values have been calculated from the comprehensive Preparatory Study that considers both the typical loading of distribution transformers, and the cost of losses and methods to reduce these losses.
5.2 Transformer loss recovery mechanism Each DNO (Distribution Network Operators) and TSO (Transmission System Operators) recover transformer losses via a mechanism called the Distribution or Transmission Loss Adjustment Factor (DLAF or TLAF). This factor forms part of the Use of System Charge (UoSC) mechanism, which is the main way in which they get compensated for the use of the transmission and distribution systems. DLAFs are a method which regulators use to assess the losses associated with the transmission and distribution networks, and targets are set to reduce these figures through commercial incentives below15. The DLAF includes in most cases the load losses associated with the transformers on its network, but each DNO can come up with their own methodology for calculating DLAFs, as long as they comply with the rules set out in BSCP12816. The level of losses is calculated by deducting the number of units distributed across the distribution network from the number of units entering the network. Distribution Network Operators (DNOs) are rewarded or penalised based on performance against a target allowed loss percentage.
5.3 Cost benefit analysis methodologies
Information on the preferred method of evaluating the cost benefit of the transformer over its lifetime from the Distributed Network Operators (DNO‟s) is commercially sensitive. However, Levels of load and no-load losses are usually determined by the Total Cost of Ownership (TCO) analysis in the (often public) procurement processes, as follows:
35
TCO = PP + A*Po + B*Pk
where PP = purchase price
A = cost of no-load losses per Watt (€/Watt)
Po = rated no-load loss in Watts
B = cost of load losses per Watt (€/Watt)
Pk = rated load loss in Watts
The A and B factors incorporate a number of parameters, including the avoided cost of system capacity, avoided cost of energy, and the discount rate.
The preparatory study refers to the German DIN 42508 standard to specify mandatory maximum levels of load and no-load losses for different ratings and voltage levels of the HV winding.
Customers who pay for electricity on a per unit basis can easily calculate their operating costs and determine how long it takes to recover the price premium associated with the purchase of higher-efficiency transformers.
5.4 Who pays for Renewable Energy transformer losses?
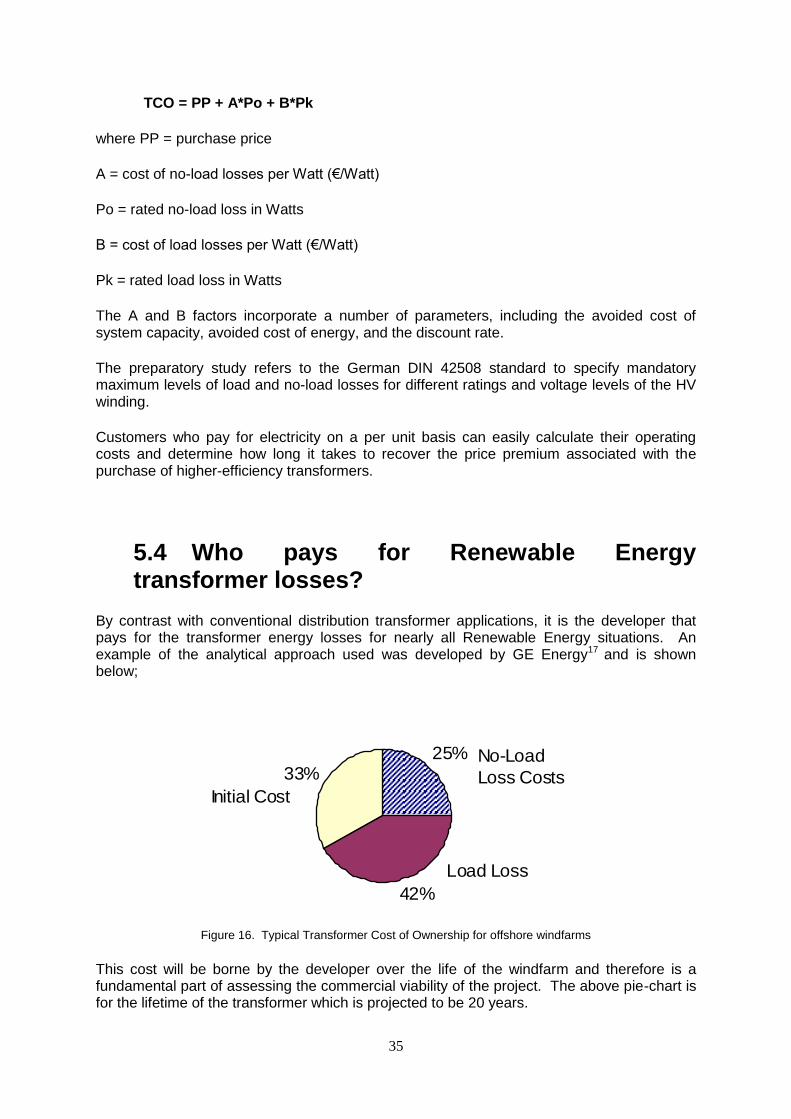
By contrast with conventional distribution transformer applications, it is the developer that pays for the transformer energy losses for nearly all Renewable Energy situations. An example of the analytical approach used was developed by GE Energy17 and is shown below;
Figure 16. Typical Transformer Cost of Ownership for offshore windfarms
This cost will be borne by the developer over the life of the windfarm and therefore is a fundamental part of assessing the commercial viability of the project. The above pie-chart is for the lifetime of the transformer which is projected to be 20 years.
25%
42%
33%No-Load
Loss Costs
Load Loss
Costs
Initial Cost
36
In some equipment the transformer will be an integral part of the generation equipment, for example a wind turbine with nacelle mounted transformer, and so the manufacturer will specify it, with the purchaser usually just accepting it as representing the best design option. In theory it can be considered that the designer is rational and will have looked at the costs and losses in each part of the machine, but in practice the costs of such a custom design remains a deterrent. Any variation from this would therefore represent a weakening in the Total Costs of Ownership of the machine.
In other devices the transformer is separate and can still be specified by the developer. Some will also operate and take profit from the performance of the scheme, others will sell it as a turnkey operation to a third party, and so there is less incentive to select the best transformer.
Whereas the TSO and DNOs are broadly supportive of the Transformer regulations, in part because costs can be passed on to the consumer, renewable energy developers for small scale renewable projects may take a less positive view because they carry the full purchase price of the transformer up front.
In summary the small scale renewable energy developer will be less inclined to pay extra for a more efficient transformer than a network operator. They will therefore be impacted more by demanding regulations than network operators.
The Operator should consider the type of connection to the grid connection point and the losses associated with that system, which includes cables, switchgear and transformers. This would include the capital cost and operational and maintenance costs for the system. This would normally add an additional 10 to 15% on the MWh cost from the terminals of the wind turbine. This will give the operator the overall cost of producing a single MWh. The operator could then add a small contingency sum to cover errors in calculation, unforeseen expenses and so on. This will then provide the operator with a cost true overall of producing a single MWh.
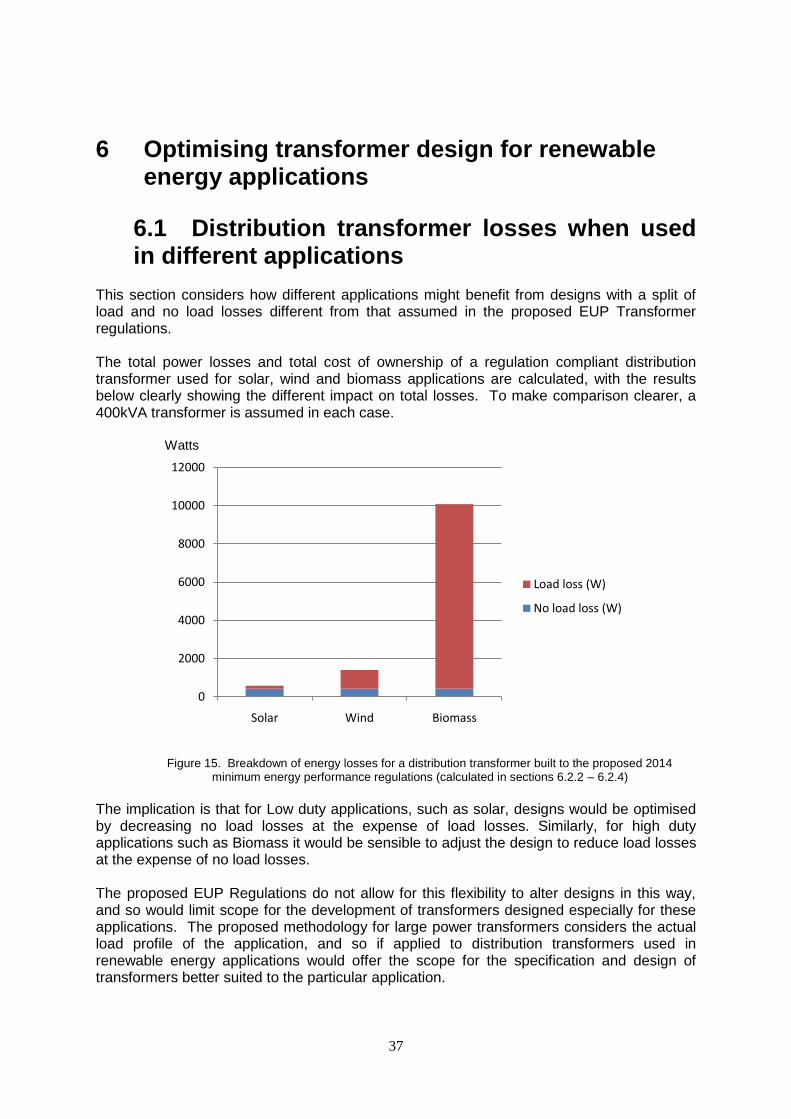
37
6 Optimising transformer design for renewable energy applications
6.1 Distribution transformer losses when used in different applications
This section considers how different applications might benefit from designs with a split of load and no load losses different from that assumed in the proposed EUP Transformer regulations. The total power losses and total cost of ownership of a regulation compliant distribution transformer used for solar, wind and biomass applications are calculated, with the results below clearly showing the different impact on total losses. To make comparison clearer, a 400kVA transformer is assumed in each case. Watts
Figure 15. Breakdown of energy losses for a distribution transformer built to the proposed 2014 minimum energy performance regulations (calculated in sections 6.2.2 – 6.2.4)
The implication is that for Low duty applications, such as solar, designs would be optimised by decreasing no load losses at the expense of load losses. Similarly, for high duty applications such as Biomass it would be sensible to adjust the design to reduce load losses at the expense of no load losses. The proposed EUP Regulations do not allow for this flexibility to alter designs in this way, and so would limit scope for the development of transformers designed especially for these applications. The proposed methodology for large power transformers considers the actual load profile of the application, and so if applied to distribution transformers used in renewable energy applications would offer the scope for the specification and design of transformers better suited to the particular application.
0
2000
4000
6000
8000
10000
12000
Solar Wind Biomass
Load loss (W)
No load loss (W)
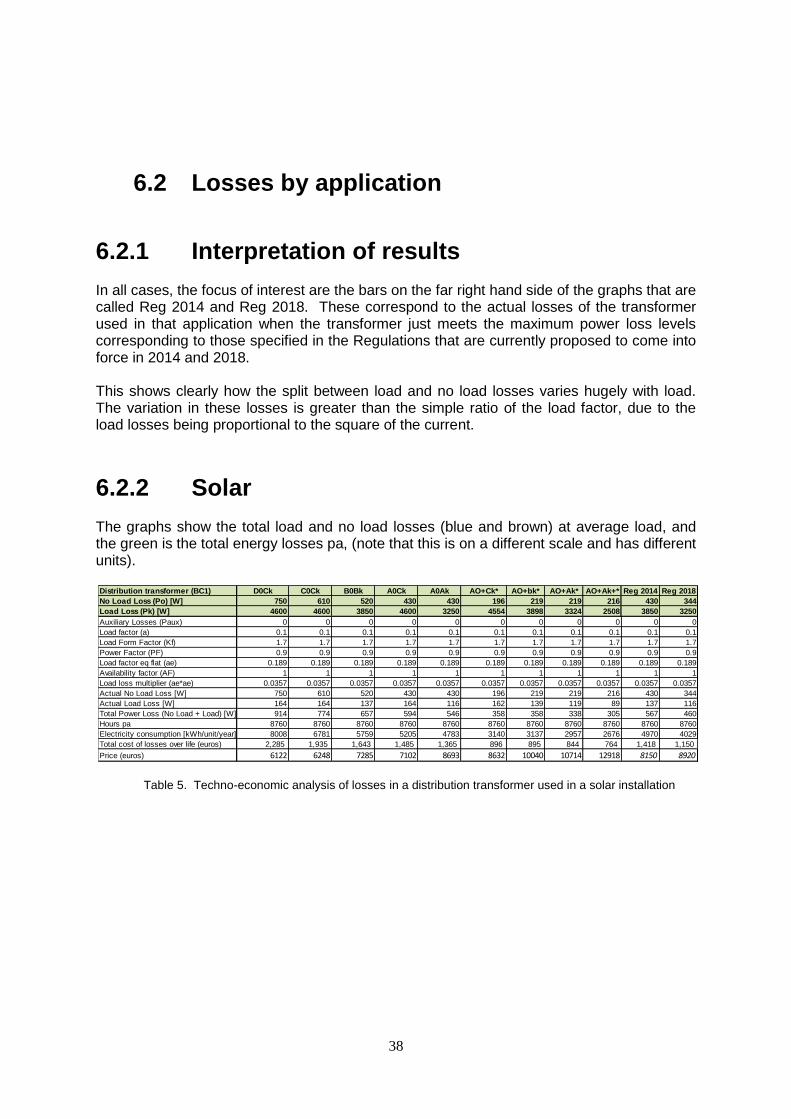
38
6.2 Losses by application
6.2.1 Interpretation of results In all cases, the focus of interest are the bars on the far right hand side of the graphs that are called Reg 2014 and Reg 2018. These correspond to the actual losses of the transformer used in that application when the transformer just meets the maximum power loss levels corresponding to those specified in the Regulations that are currently proposed to come into force in 2014 and 2018. This shows clearly how the split between load and no load losses varies hugely with load. The variation in these losses is greater than the simple ratio of the load factor, due to the load losses being proportional to the square of the current.
6.2.2 Solar The graphs show the total load and no load losses (blue and brown) at average load, and the green is the total energy losses pa, (note that this is on a different scale and has different units).
Table 5. Techno-economic analysis of losses in a distribution transformer used in a solar installation
Distribution transformer (BC1) D0Ck C0Ck B0Bk A0Ck A0Ak AO+Ck* AO+bk* AO+Ak* AO+Ak+* Reg 2014 Reg 2018
No Load Loss (Po) [W] 750 610 520 430 430 196 219 219 216 430 344
Load Loss (Pk) [W] 4600 4600 3850 4600 3250 4554 3898 3324 2508 3850 3250
Auxiliary Losses (Paux) 0 0 0 0 0 0 0 0 0 0 0
Load factor (a) 0.1 0.1 0.1 0.1 0.1 0.1 0.1 0.1 0.1 0.1 0.1
Load Form Factor (Kf) 1.7 1.7 1.7 1.7 1.7 1.7 1.7 1.7 1.7 1.7 1.7
Power Factor (PF) 0.9 0.9 0.9 0.9 0.9 0.9 0.9 0.9 0.9 0.9 0.9
Load factor eq flat (ae) 0.189 0.189 0.189 0.189 0.189 0.189 0.189 0.189 0.189 0.189 0.189
Availability factor (AF) 1 1 1 1 1 1 1 1 1 1 1
Load loss multiplier (ae*ae) 0.0357 0.0357 0.0357 0.0357 0.0357 0.0357 0.0357 0.0357 0.0357 0.0357 0.0357
Actual No Load Loss [W] 750 610 520 430 430 196 219 219 216 430 344
Actual Load Loss [W] 164 164 137 164 116 162 139 119 89 137 116
Total Power Loss (No Load + Load) [W] 914 774 657 594 546 358 358 338 305 567 460
Hours pa 8760 8760 8760 8760 8760 8760 8760 8760 8760 8760 8760
Electricity consumption [kWh/unit/year] 8008 6781 5759 5205 4783 3140 3137 2957 2676 4970 4029
Total cost of losses over life (euros) 2,285 1,935 1,643 1,485 1,365 896 895 844 764 1,418 1,150
Price (euros) 6122 6248 7285 7102 8693 8632 10040 10714 12918 8150 8920
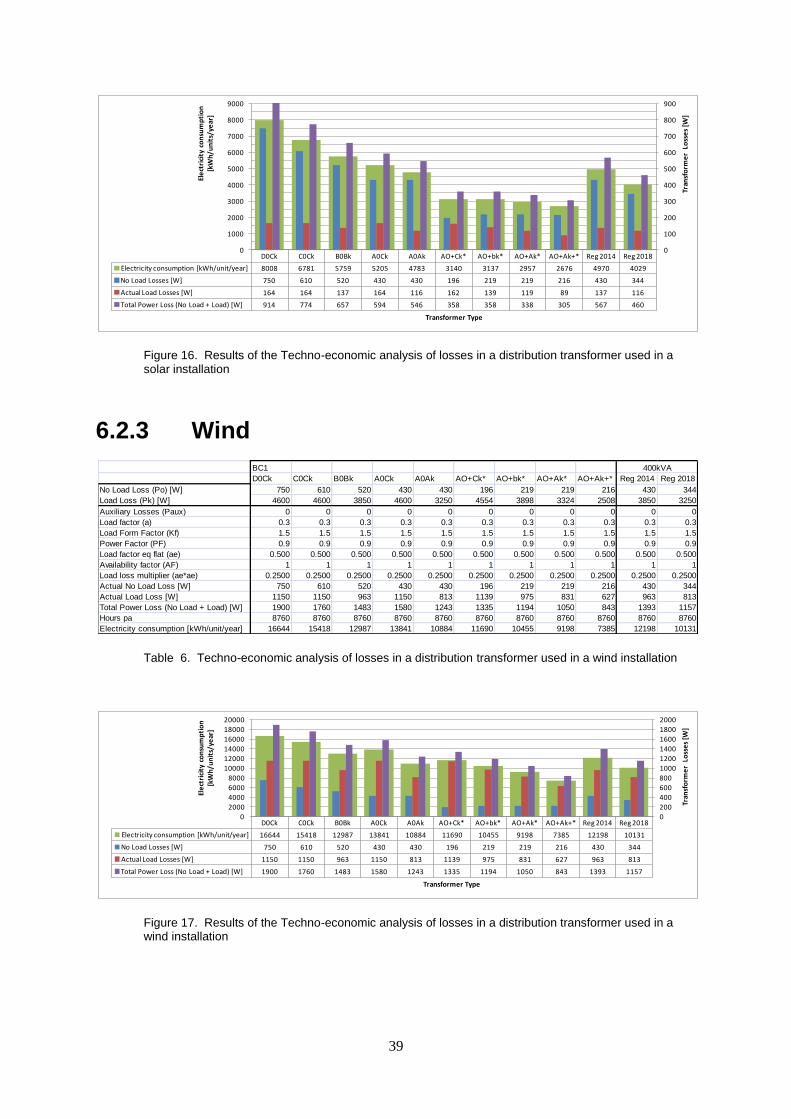
39
Figure 16. Results of the Techno-economic analysis of losses in a distribution transformer used in a solar installation
6.2.3 Wind
Table 6. Techno-economic analysis of losses in a distribution transformer used in a wind installation
Figure 17. Results of the Techno-economic analysis of losses in a distribution transformer used in a wind installation
D0Ck C0Ck B0Bk A0Ck A0Ak AO+Ck* AO+bk* AO+Ak* AO+Ak+* Reg 2014 Reg 2018
Electricity consumption [kWh/unit/year] 8008 6781 5759 5205 4783 3140 3137 2957 2676 4970 4029
No Load Losses [W] 750 610 520 430 430 196 219 219 216 430 344
Actual Load Losses [W] 164 164 137 164 116 162 139 119 89 137 116
Total Power Loss (No Load + Load) [W] 914 774 657 594 546 358 358 338 305 567 460
0
100
200
300
400
500
600
700
800
900
0
1000
2000
3000
4000
5000
6000
7000
8000
9000
Tran
sfo
rme
r L
oss
es
[W]
Ele
ctri
city
co
nsu
mp
tio
n[k
Wh
/un
its/
year
]
Transformer Type
BC1
D0Ck C0Ck B0Bk A0Ck A0Ak AO+Ck* AO+bk* AO+Ak* AO+Ak+* Reg 2014 Reg 2018
No Load Loss (Po) [W] 750 610 520 430 430 196 219 219 216 430 344
Load Loss (Pk) [W] 4600 4600 3850 4600 3250 4554 3898 3324 2508 3850 3250
Auxiliary Losses (Paux) 0 0 0 0 0 0 0 0 0 0 0
Load factor (a) 0.3 0.3 0.3 0.3 0.3 0.3 0.3 0.3 0.3 0.3 0.3
Load Form Factor (Kf) 1.5 1.5 1.5 1.5 1.5 1.5 1.5 1.5 1.5 1.5 1.5
Power Factor (PF) 0.9 0.9 0.9 0.9 0.9 0.9 0.9 0.9 0.9 0.9 0.9
Load factor eq flat (ae) 0.500 0.500 0.500 0.500 0.500 0.500 0.500 0.500 0.500 0.500 0.500
Availability factor (AF) 1 1 1 1 1 1 1 1 1 1 1
Load loss multiplier (ae*ae) 0.2500 0.2500 0.2500 0.2500 0.2500 0.2500 0.2500 0.2500 0.2500 0.2500 0.2500
Actual No Load Loss [W] 750 610 520 430 430 196 219 219 216 430 344
Actual Load Loss [W] 1150 1150 963 1150 813 1139 975 831 627 963 813
Total Power Loss (No Load + Load) [W] 1900 1760 1483 1580 1243 1335 1194 1050 843 1393 1157
Hours pa 8760 8760 8760 8760 8760 8760 8760 8760 8760 8760 8760
Electricity consumption [kWh/unit/year] 16644 15418 12987 13841 10884 11690 10455 9198 7385 12198 10131
400kVA
D0Ck C0Ck B0Bk A0Ck A0Ak AO+Ck* AO+bk* AO+Ak* AO+Ak+* Reg 2014 Reg 2018
Electricity consumption [kWh/unit/year] 16644 15418 12987 13841 10884 11690 10455 9198 7385 12198 10131
No Load Losses [W] 750 610 520 430 430 196 219 219 216 430 344
Actual Load Losses [W] 1150 1150 963 1150 813 1139 975 831 627 963 813
Total Power Loss (No Load + Load) [W] 1900 1760 1483 1580 1243 1335 1194 1050 843 1393 1157
0
200
400
600
800
1000
1200
1400
1600
1800
2000
0
2000
4000
6000
8000
10000
12000
14000
16000
18000
20000
Tran
sfo
rme
r L
oss
es
[W]
Ele
ctri
city
co
nsu
mp
tio
n[k
Wh
/un
its/
year
]
Transformer Type
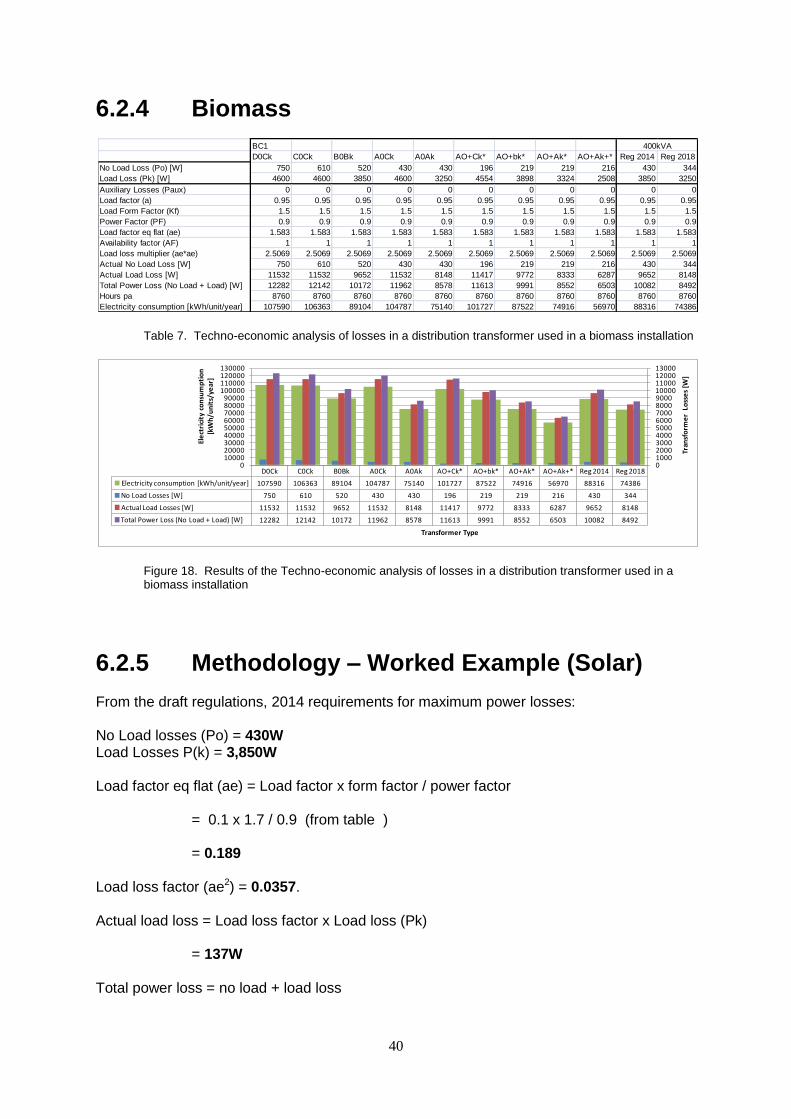
40
6.2.4 Biomass
Table 7. Techno-economic analysis of losses in a distribution transformer used in a biomass installation
Figure 18. Results of the Techno-economic analysis of losses in a distribution transformer used in a biomass installation
6.2.5 Methodology – Worked Example (Solar) From the draft regulations, 2014 requirements for maximum power losses: No Load losses (Po) = 430W Load Losses P(k) = 3,850W Load factor eq flat (ae) = Load factor x form factor / power factor
= 0.1 x 1.7 / 0.9 (from table )
= 0.189 Load loss factor (ae2) = 0.0357. Actual load loss = Load loss factor x Load loss (Pk)
= 137W Total power loss = no load + load loss
BC1
D0Ck C0Ck B0Bk A0Ck A0Ak AO+Ck* AO+bk* AO+Ak* AO+Ak+* Reg 2014 Reg 2018
No Load Loss (Po) [W] 750 610 520 430 430 196 219 219 216 430 344
Load Loss (Pk) [W] 4600 4600 3850 4600 3250 4554 3898 3324 2508 3850 3250
Auxiliary Losses (Paux) 0 0 0 0 0 0 0 0 0 0 0
Load factor (a) 0.95 0.95 0.95 0.95 0.95 0.95 0.95 0.95 0.95 0.95 0.95
Load Form Factor (Kf) 1.5 1.5 1.5 1.5 1.5 1.5 1.5 1.5 1.5 1.5 1.5
Power Factor (PF) 0.9 0.9 0.9 0.9 0.9 0.9 0.9 0.9 0.9 0.9 0.9
Load factor eq flat (ae) 1.583 1.583 1.583 1.583 1.583 1.583 1.583 1.583 1.583 1.583 1.583
Availability factor (AF) 1 1 1 1 1 1 1 1 1 1 1
Load loss multiplier (ae*ae) 2.5069 2.5069 2.5069 2.5069 2.5069 2.5069 2.5069 2.5069 2.5069 2.5069 2.5069
Actual No Load Loss [W] 750 610 520 430 430 196 219 219 216 430 344
Actual Load Loss [W] 11532 11532 9652 11532 8148 11417 9772 8333 6287 9652 8148
Total Power Loss (No Load + Load) [W] 12282 12142 10172 11962 8578 11613 9991 8552 6503 10082 8492
Hours pa 8760 8760 8760 8760 8760 8760 8760 8760 8760 8760 8760
Electricity consumption [kWh/unit/year] 107590 106363 89104 104787 75140 101727 87522 74916 56970 88316 74386
400kVA
D0Ck C0Ck B0Bk A0Ck A0Ak AO+Ck* AO+bk* AO+Ak* AO+Ak+* Reg 2014 Reg 2018
Electricity consumption [kWh/unit/year] 107590 106363 89104 104787 75140 101727 87522 74916 56970 88316 74386
No Load Losses [W] 750 610 520 430 430 196 219 219 216 430 344
Actual Load Losses [W] 11532 11532 9652 11532 8148 11417 9772 8333 6287 9652 8148
Total Power Loss (No Load + Load) [W] 12282 12142 10172 11962 8578 11613 9991 8552 6503 10082 8492
010002000300040005000600070008000900010000110001200013000
0100002000030000400005000060000700008000090000
100000110000120000130000
Tran
sfo
rme
r L
oss
es
[W]
Ele
ctri
city
co
nsu
mp
tio
n[k
Wh
/un
its/
year
]
Transformer Type

41
= 430W + 137W
= 567W Electricity consumption (kWh pa) = Total power loss x Annual running hours
= 567W x 8,760 hrs
= 4,970 kWhpa
42
7 References
1. EUP Lot 2 study Distribution transformers, tasks 1-7, Vito for European Commission, 2010/ETE/R/106, January 2011,Page IV.
2. European Commission Transformer Working Document for Consultation Forum, October 2012.
3. SEEDT, Selecting Energy Efficient Distribution Transformers. ECI, 2005 4. National Grid – Transmission Network Quarterly Connections Update – August
2012 OR GB Electricity Demand – Context and 2010 Baseline Data – Gill Owen – October 2011
5. Analysis of Transformer Failures by W H Bartley 6. UK DNO Long Term Development Statements 2011 7. Ref to NEMA TP-1 2002; Guide for determining energy efficiency for distribution
transformers. Provides basis for determining the energy efficiency performance of certain single- and three-phase dry-type and liquid-filled distribution transformers and assist with the proper selection of such equipment.
8. Submission by European Copper Institute to EUP Preparatory study, April 2012. 9. Determination analysis of energy conservation standards for distribution
transformers – Oak Ridge National Laboratory – P R Barnes 10. IEC 60034 Rotating electrical machines – Part 2-1: Standard methods for
determining losses and efficiency from tests (excluding machines for traction vehicles)
11. Supporting material for 2012 EUP Consultation forum 12. Transformers for offshore multi-megawatt turbines: Discussion on specifications,
safety, and environment – J.Declerq and R. Van Sccheevensteen, Pauwels International NV.
13. CG Distribution Transformers – Bio-SLIM Transformer - www.cgglobal.com – Accessed 17th September 2012
14. DTI Solar Photovoltaic Domestic Field Trials Good Practice Guide Part 2: System performance issues.
15. BSCP128 – Production, submission, audit and approval of line loss factors version 3 – Elexon Limited
16. Losses incentive mechanism from OFGEM - http://www.ofgem.gov.uk/Networks/ElecDist/Policy/losses-incentive-mechanism/Pages/index.aspx - Accessed 20th September 2012
17. Large scale integration of wind power and transmission networks for offshore windfarms, 7-8 April 2005 by GE Energy

43