establishing a relationship between serum …
TRANSCRIPT

i
ESTABLISHING A RELATIONSHIP BETWEEN
SERUM HOMOCYSTEINE LEVELS AND
DISEASE SEVERITY IN ADULTS WITH
SICKLE CELL ANAEMIA IN LAGOS
UNIVERSITY TEACHING HOSPITAL (LUTH),
LAGOS, NIGERIA
BY
DR. ALI ADEBUKOLA KHAIRAT (MBBS, ILORIN)
DEPARTMENT OF HAEMATOLOGY AND BLOOD TRANSFUSION,
LAGOS UNIVERSITY TEACHING HOSPITAL,
IDI-ARABA, LAGOS, NIGERIA.
A DISSERTATION SUBMITTED TO THE NATIONAL
POSTGRADUATE MEDICAL COLLEGE OF NIGERIA,
FACULTY OF PATHOLOGY IN PARTIAL FULFILLMENT
OF THE REQUIREMENTS FOR THE AWARD OF
FELLOWSHIP OF THE MEDICAL COLLEGE IN
PATHOLOGY (FMCPATH)
NOVEMBER 2015.

ii
ATTESTATION
This research project titled “Establishing a relationship between serum homocysteine
levels and disease severity in adults with sickle cell anaemia in Lagos University Teaching
Hospital, Lagos, Nigeria” is the original work of Dr. A.K Ali of the Department of
Haematology and Blood transfusion, Lagos University Teaching Hospital, Idi-Araba,
Lagos, Nigeria.
Candidate’s Signature: _ ______________________

iii
SUPERVISORS
DR. A. S. AKANMU MBBS (Ibadan), FMCPath.
Professor and Head of Department,
Department of Haematology and Blood Transfusion,
College of Medicine, University of Lagos,
Lagos, Nigeria.
Signature:__________________ Date: ________________
DR. T. A. ADEYEMO MBBS (Lagos), FMCPath.
Consultant Haematologist,
Department of Haematology and Blood Transfusion,
College of Medicine, University of Lagos,
Lagos, Nigeria.
Signature: _________________ Date: ________________

iv
DEDICATION
I dedicate this research to Almighty Allah, in whom I have my being. I also dedicate it to
my husband, Dr. Muyideen Olayemi Orolu and my wonderful children, Khadijat Omosolape
Orolu and Khaleel Olasubomi Orolu, my sources of joy.

v
ACKNOWLEDGEMENT
The utmost gratitude is to Almighty Allah for making this research possible. I am
sincerely grateful for the prompt and dedicated attention of my supervisors, teachers,
trainers and mentors Prof A.S. Akanmu and Dr. T.A. Adeyemo towards the timely
completion of this research work.
I wish to acknowledge the scholarly and practical advice of my consultants Dr. Osunkalu,
Dr. Adediran, Dr. Obgenna and Dr. Bello during the course of my training and from
conception to final execution of this research.
I also want appreciate and acknowledge the immense support given to me by my
colleagues Dr. Banjoko, Dr. Davies, Dr. Akinwande and Dr. Bolarinwa.
I thank Mr. Dosu, Mr. Akin, Mr. Tunde, Mrs. Christy, Mr. Dotun and Mr. Bala for
their technical support; and Dr. Ephrein for his invaluable assistance with the statistical
analysis.
Finally, I am grateful to my husband Muyideen for his support and encouragement; and to
our children Khadijat and Khaleel, for their patience and forbearance while I worked on the
project and deprived them of valuable family time together.

vi
TABLE OF CONTENTS
Title Page i
Attestation ii
Supervisor iii
Dedication iv
Acknowledgement v
Table of Contents vi
List of Tables viii
List of Figures ix
List of Abbreviations x
Summary xiii
CHAPTER ONE
INTRODUCTION 1
CHAPTER TWO
LITERATURE REVIEW 4
CHAPTER THREE
AIM AND OBJECTIVES 37
CHAPTER FOUR
MATERIALS AND METHODS 38
CHAPTER FIVE
RESULTS 64
CHAPTER SIX
DISCUSSION 89
vii
CHAPTER SEVEN
CONCLUSION 95
CHAPTER EIGHT
LIMITATIONS OF THE STUDY 96
CHAPTER NINE
RECOMMENDATION 97
REFERENCES 98
APPENDICES
i: Informed consent form 120
ii: Questionnaire 123
Iii: Health Research and Ethics Committee (LUTH) and NPGMC research approval 129

viii
LIST OF TABLES
Table 1: Calculation of disease severity score 25
Table 2: Age and sex distribution of subjects and controls 65
Table 3: Comparison of mean haematological parameters of subjects and controls 67
Table 4: Comparison of mean values of red cell indices in Hb SS subjects and
Controls 69
Table 5: Comparison of mean homocysteine (hcy), folate and B12 levels of
Subjects and controls 72
Table 6: Comparison of proportion of Groups B and C subjects
With hyperhomocysteinaemia and normal homocysteine levels 73
Table 7: Comparing mean folate and vitamin B12 levels in hyperhomocysteinaemic
And normohomocysteinaemic subjects in Group B 75
Table 8: Comparing mean folate levels in hyperhomocysteinaemic and
Normohomocysteinaemic subjects in Group C 78
Table 9: Mean serum homocysteine levels and pain severity scores in Group B
Subjects 81
Table 10: Comparison of disease severity scores and mean homocysteine level in
Group A subjects 83
Table 11: Comparison of mean values of markers of haemolysis in subjects and
Controls 85
Table 12: Relationship between folic acid compliance and mean serum folate and
Homocysteine levels in subjects 88

ix
LIST OF FIGURES
Figure 1: Sickle cell endothelial adhesion and obstruction to blood flow in sickle
Cell anaemia 8
Figure 2: Summary of the pathophysiology of haemolysis in sickle cell anaemia 10
Figure 3: The metabolic pathways of homocysteine 28
Figure 4: The relationship between homocysteine and vascular endothelium,
Nitric oxide and red blood cell 36
Figure 5: Correlation between serum homcysteine and serum folate in subjects
In Group B 76
Figure 6: Correlation between serum homcysteine and serum folate in subjects in
Group C 79
Figure 7: Compliance level of subjects to Folic Acid supplementation 87

x
LIST OF ABBREVIATIONS
ACS Acute Chest Syndrome
ACTIVE B12 Holocobalamin
AD Alzheimer’s disease
ADMA Asymmetrical di-methyl arginine
ATP Adenosine Triphosphate
CβS Cystathione β synthase
CSSCD Co-operative Study of Sickle Cell Disease
CVA Cerebrovascular Accidents
ELISA Enzyme Linked Immunosorbent Assay
FSGS Focal and Segmental Glomerulosclerosis
GFR Glomerular Filtration Rate
GP Glutathione Peroxidase
GSH Reduced Glutathione
Hb Haemoglobin
Hb A Haemoglobin A
Hb C Haemoglobin C
Hb F Haemoglobin F
Hb S Haemoglobin S
Hct Haematocrit
Hcy (hcy) Homocysteine
HRP Horseradish Peroxidase
ISC Irreversibly Sickled Cell
K3 EDTA Tripotassium ethylenediamine tetra-acetic acid
LDH Lactate Dehydrogenase
xi
LUTH Lagos University Teaching Hospital
LYMPH Lymphocyte
MCHC Mean Cell Haemoglobin Concentration
MCV Mean Cell Volume
MCH Mean Cell Haemoglobin
MET-HB Methemoglobin
mRNA Messenger Ribonucleic acid
MTHFR Methyltetrahydrofolate reductase
N Neutrophil
NO Nitric Oxide
NO3- Nitrate
NDMA N-methyl-D-aspartic acid
NRBC Nucleated Red Blood Cell
NRS Numeric Rating Scale
MRI Magnetic Resonance Imaging
O--/O2- Superoxide
OD Optical Density
OH- Hydroxyl ion
ONOO Peroxynitrite
PCV Packed Cell Volume
PG Prostaglandins
Plt Platelets
RBC Red Blood Cell
RDW Red Cell Distribution Width
RNA Ribonucleic acid
xii
SAH S- adenosyl homocysteine
SAM S- adenosyl methionine
SCD Sickle Cell Disease
SCA Sickle Cell Anaemia
SOD Superoxide Dismutase
THF Tetrahydrofolate
TNF Tumor Necrotic Factor
USA United States of America
VITAMIN B9 Folic Acid
VITAMIN B12 Cyanocobalamin
VOC Vaso-occlusive Crisis
WBC White Blood Cells
TIA Transient Ischemic Attack
TCD Trans Cranial Doppler Ultrasound
VRS Verbal Rating Scale
VAS Visual Analog Scale

xiii
SUMMARY
The aim of this study was to determine serum homocysteine levels in Nigerian adults
with sickle cell anaemia (SCA), evaluate the relationship between serum homocysteine and
folate and vitamin B12 levels as well as to assess the effects of homocysteine on sickle cell
disease (SCD) severity, frequency of painful (vaso-occlusive) crisis and markers of
haemolysis.
This was a cross-sectional study conducted on adult subjects with SCA in Lagos
University Teaching Hospital, Lagos, Nigeria; from December 2014 to April 2015.
Sickle cell anaemic subjects were recruited purposively from the adult haematology out-
patient clinic and the emergency unit of the hospital. One hundred and ten (110)
participants consisting of 84 subjects with SCA and 26 Hb AA controls were recruited into
the study. Of subjects with SCA, 25 were in the steady state (Group A), 30 in vaso-occlusive
crisis (Group B) and 29 in hyperhaemolytic crisis (Group C). Serum homocysteine, folate
and vitamin B12 levels of all participants were determined using ELISA test kits. Full
blood count including red cell indices and reticulocyte count together with serum
bilirubin and lactate dehydrogenase (LDH) were determined. The statistical package for
social science software (SPSS) 2012, version 21 was used to assess the means and perform
correlation analysis. The level of statistical significance was defined as p - value ≤ 0.05.
The mean age of participants in the control group was 27.5 ± 6.6 years (14 males, 12
females), that of Group A was 24.9 ± 5.2 years (10 males, 15 females), Group B was 24.8
± 5.9 years (17 males, 13 females) and Group C was 24.9 ± 5.3 years (16 males, 13
females). There was no significant difference between the mean age of controls and that of
the subjects (Groups A, B and C had p-values of 0.116, 0.142 and 0.110 respectively).
The mean serum homocysteine level of group A (10.3 ± 2.3 µmol/L) and group B (11.9 ± 4.5
µmol/L) were not significantly different from that of controls (10.2 ± 2.9 µmol/L) but, Group

1
C (13.1 ± 5.5 µmol/L) was significantly higher (p < 0.01). In addition, the mean
serum homocysteine of Group C was significantly higher than that of Group A (p < 0.01).
The mean serum folate level of Group C (9.9 ± 5.5 nmol/L) was significantly lower than that
of controls (12.9 ± 6.8 nmol/L; p = 0.042), however, there was no demonstrable difference
in the mean serum folate level of Groups A and B (A = 11.8 ± 4.1 nmol/L, B = 12.7 ± 2.1
nmol/L) when compared with controls. The mean serum vitamin B12 level in each of the
three groups (A = 99.1 ± 30.3 pmol/L; B = 104.9 ± 51.2 pmol/L; C = 91.2 ± 38.5 pmol/L)
was not significantly different from that of controls (97.8 ± 29.5 pmol/L; p > 0.05). There
was a significant negative correlation between serum homocysteine level and serum folate
level in Groups B and C (r = - 0.705; p < 0.001 and r = - 0.747; p < 0.001) respectively.
There was no significant correlation between serum vitamin B12 and serum homocysteine
in each of the groups; (A= r -0.346; B = r -0.214; C = r -0.081; p > 0.05). The mean values
for markers of haemolysis for subjects were: reticulocyte production index (RPI) (A = 2.2 ±
1.1; B = 2.2 ± 1.1; C = 4.6 ± 1.0), absolute reticulocyte count (A = 198.3 ± 93.2 x 10⁹/L;
B = 197.4 ± 83.9 x 10⁹/L; C = 471 ± 103.5 x 10⁹/L), LDH (A = 688.8 ± 238.5 U/L; B =
569.7 ± 325.1 U/L; C = 863.3 ± 98.0 U/L) and indirect bilirubin (A = 21.9 ± 23.1 mg/dl; B
= 31.1 ± 12.6 mg/dl; C = 47.9 ± 23.6 mg/dl). The mean disease severity score for subjects
in Group A was 3.0 ± 1.4. There was no significant correlation between serum
homocysteine and markers of haemolysis (RPI- r = -0.240; absolute reticulocyte count- r = -
0.241; LDH- r = 0.016; indirect bilirubin- r = 0.145) and between serum homocysteine and
disease severity score (rs = 0.102) in Group A (p > 0.05). The mean value for severity of
VOC and frequency of VOC per year in Group B were 6.6 ± 1.4 and 2.5 ± 1.6
respectively. There was no significant correlation between serum homocysteine and
severity of VOC and between serum homocysteine frequency of painful crisis per year
in Group B (rs = 0.116; p > 0.05 and rs = 0.181; p > 0.05 respectively). There was no

2
significant difference in mean serum folate and mean serum homocysteine levels of
compliant subjects (A = folate -11.4 ± 4.7 nmol/L, homocysteine- 10.5 ± 2.5 µmol/L; B =
folate -12.8 ± 6.2 nmol/L, homocysteine- 13.4 ± 5.3 µmol/L; C = folate -10.3 ± 5.6
nmol/L, homocysteine- 11.0 ± 4.2 µmol/L) and non-compliant subjects (A = folate -11.9 ±
2.5 nmol/L, homocysteine- 9.8 ± 1.7 µmol/L; B = folate -12.6 ± 7.4 nmol/L,
homocysteine- 12.8 ± 5.7 µmol/L; C = folate -9.5 ± 5.7 nmol/L, homocysteine- 12.7 ± 4.8
µmol/L; p > 0.05).
This study demonstrated that the mean serum homocystene level in hyperhaemolytic crisis
was significantly higher when compared with those of the steady state and controls
respectively. However, the significant negative relationship between serum homocysteine
and serum folate in both vaso-occlussive and hyperhaemolytic crises was not mirrored in
the steady state. Therefore, the use of higher doses of folate supplement is being advocated
in subjects with these types of crises.

3
CHAPTER ONE
INTRODUCTION
Sickle cell anaemia (SCA) is an inherited disease of haemoglobin (Hb) caused by a
point mutation in which there is a substitution of adenine for thymine (GTG→GAG) in
the sixth codon of the β-globin gene. This mutation results in replacement of glutamic
acid with the amino acid valine at the sixth position of the β-globin chain in
haemoglobin1,2 leading to the production of a defective form of haemoglobin- (haemoglobin
S). At conditions of low oxygen tension, haemoglobin S (Hb S) polymerizes and this is
central to the pathophysiology of the disease.
Sickle cell anaemia (SCA) is thought to have originated in tropical regions as a result of
its protective advantage against malaria. Nigeria by virtue of its large population, has the
largest burden of SCA in the world with a sickle cell carrier rate of 15- 30%.3,4 The
world health organization estimates that 2% of newborns in Nigeria have sickle cell
anaemia giving a total of 150,000 annual births with sickle cell anaemia.3 However,
due to the disease related increased mortality, only about one million persons have SCA
in Nigeria.4
SCA patients suffer from vaso-occlusive complications and chronic haemolysis that
results from recurrent red blood cell sickling and loss of elasticity. Haemolysis causes an
accelerated drop in haemoglobin concentration with rapid bone marrow turnover, thus
increasing the demand for folate and predisposing them to higher risk of folate deficiency.5
Folate and vitamin B12 (cyanocobalamin) are required for re-methylation of homocysteine
to methionine. Hyperhomocysteinaemia is typically caused either by genetic defects in the
enzymes involved in homocysteine metabolism or by nutritional deficiencies of certain
4
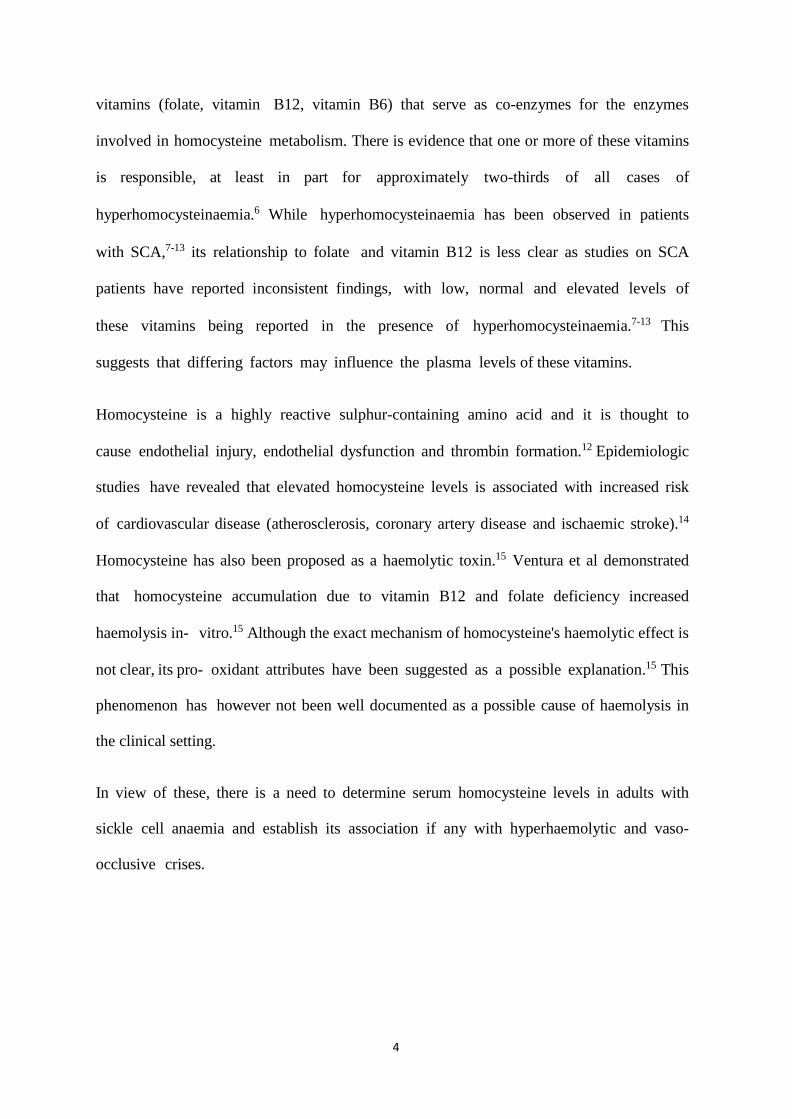
vitamins (folate, vitamin B12, vitamin B6) that serve as co-enzymes for the enzymes
involved in homocysteine metabolism. There is evidence that one or more of these vitamins
is responsible, at least in part for approximately two-thirds of all cases of
hyperhomocysteinaemia.6 While hyperhomocysteinaemia has been observed in patients
with SCA,7-13 its relationship to folate and vitamin B12 is less clear as studies on SCA
patients have reported inconsistent findings, with low, normal and elevated levels of
these vitamins being reported in the presence of hyperhomocysteinaemia.7-13 This
suggests that differing factors may influence the plasma levels of these vitamins.
Homocysteine is a highly reactive sulphur-containing amino acid and it is thought to
cause endothelial injury, endothelial dysfunction and thrombin formation.12 Epidemiologic
studies have revealed that elevated homocysteine levels is associated with increased risk
of cardiovascular disease (atherosclerosis, coronary artery disease and ischaemic stroke).14
Homocysteine has also been proposed as a haemolytic toxin.15 Ventura et al demonstrated
that homocysteine accumulation due to vitamin B12 and folate deficiency increased
haemolysis in- vitro.15 Although the exact mechanism of homocysteine's haemolytic effect is
not clear, its pro- oxidant attributes have been suggested as a possible explanation.15 This
phenomenon has however not been well documented as a possible cause of haemolysis in
the clinical setting.
In view of these, there is a need to determine serum homocysteine levels in adults with
sickle cell anaemia and establish its association if any with hyperhaemolytic and vaso-
occlusive crises.

5
JUSTIFICATION FOR THE STUDY
Sickle cell anaemic (SCA) patients suffer from a relative deficiency of folate due to
increased demand from erythropoiesis. This limits the conversion of homocysteine to
methionine with subsequent possibility of homocysteine accumulation.5 It is believed that
approximately two– thirds of all cases of hyperhomocysteinaemia is related to deficiency of
folic acid and vitamin B12.6 Hyperhomocysteinaemia is a risk factor for cardiovascular
events and has been found in vaso-occlusive diseases such as atherosclerosis, coronary artery
disease and ischaemic stroke.14 Homocysteine has also been proposed to be a haemolytic
toxin.15 Hence, it may contribute to the haemolytic and vaso-occlusive phenomena seen in
SCA patients. However, the relationship to folate and vitamin B12 levels in SCA patients is
generally not well documented and data on homocysteine levels in adult SCA patients in
Nigeria is scarce despite the country’s high burden of the disease.
Since folate and vitamin B12 deficiency supplementation can normalize homocysteine
levels,16 there is a need to assess serum homocysteine levels, evaluate its relationship with
folate and vitamin B12 levels and determine effects of homocysteine levels if any, on the
frequency and severity of sickle cell vaso-occlusive crises as well as effects on haemolysis in
adult Nigerians with SCA, especially since most SCA patients in Nigeria receive routine
folic acid supplementation.

6
CHAPTER TWO
OVERVIEW OF SICKLE ANAEMIA HISTORY OF SICKLE CELL
ANAEMIA
The clinical findings of sickle cell anaemia (SCA) was first described in Africa in 1670 in
a Ghanian family.17 This unknown clinical condition was also locally known as
“ogbanje” among the Igbo tribe and “abiku” among the Yoruba tribe in Nigeria ('children
who die and come back'). It is also known as ‘aromolegun’ i.e disease that causes
bone pains because of its episodes of sudden onset of bone pains and very high infant
mortality. However, the scientific discovery of SCA occurred ironically, in the United
States (not in Africa) in 1910 by the Chicago cardiologist and Professor of medicine
James B. Herrick. Herrick later published a paper describing an anemia with sickle shaped
red cells.18
EPIDERMIOLOGY OF SCA
Sickle cell anaemia is a genetic disease that originates from Africa, a malaria endemic
region. This origin is due to the protection from malaria which gives a survival advantage to
the sickle cell carrier, thereby maintaining the high prevalence of SCA in Africa. Due to
migration from Africa and racial admixture, SCA can be found less frequently in
Mediterranean countries such as Greece, Turkey, and Italy; the Arabian Peninsula; India;
and Spanish-speaking regions in South America, Central America, and parts of the
Caribbean. In Africa, the highest prevalence of sickle-cell trait occurs between latitudes
150 North and 200 South, ranging between 10% and 40% of the population. In countries
such as Cameroon, Republic of Congo, Gabon, Ghana and Nigeria, the prevalence is
between 15% and 30%.3 In Nigeria, the prevalence of SCA is 2% (20 per 1,000 births).3
Furthermore, due to the populous nature of Nigeria, she has the largest burden of SCA
in the world.3 About 150, 000 children are born annually with SCA in Nigeria.3
7
Sickle cell anaemia has significant public health implications as it causes 5% of under-five
deaths in Africa and up to 16% of under-five deaths in individual West African countries.3
PATHOPHYSIOLOGY OF SCA
The mutation responsible for sickle cell disease is a single nucleotide change in which there
is substitution of adenine for thymine (GTG→GAG) in the sixth codon of the β-globin gene.
This mutation results in replacement of hydrophilic glutamic acid with the hydrophobic
amino acid valine at the sixth position of the β-globin chain (β⁶ ) of haemoglobin (Hb).1
This mutant β-globin chain results in haemoglobin S (Hb S). Sickle cell anaemia, the
prototype of sickle cell disease is characterized by homozygousity for the gene for Hb S.
MOLECULAR BASIS OF SICKLING
When Hb S is in the deoxygenated state, the substituted hydrophobic valine of one Hb S
molecule interacts with an hydrophobic pocket formed by alanine, phenylalanine and
leucine on the β subunit of an adjacent Hb S tetramer19,20 triggering an aggregation of
haemoglobin tetramers into large polymers/fibers. This aggregation turns the deoxygenated
Hb S solution into an insoluble firm gel. This is the primary event in the molecular
pathogenesis of sickle cell disease21 and it results in a distortion of the shape of the red cell
into a sickle-like shape with a marked decrease in its deformability, thereby making it
unable to transverse capillary beds. Marked decrease in deformability with consequent
sludging and diminished life span of sickled red blood cells leads to vaso-occlusion and
haemolysis respectively. Repeated or prolonged sickling progressively damages the red
cell membrane, forming an irreversibly sickled cell (ISC).

8
PATHOGENESIS OF VASO-OCCLUSION IN SCA
Several processes contribute to development of vaso-occlusion in SCA. They include
endothelial dysfunction, sickle cell deformability, sickle blood viscosity, the fraction of
irreversible sickle cells, sickle cell–endothelial cell adherence, haemostatic activation,
vascular tone and contributions from white blood cells and platelets.22-24
The abnormal interaction between young deformable sickle cells and vascular endothelium
in the post-capillary venules (Figure 1B) initiates the events in vaso-occlusion and this
interaction is promoted by leucocytosis, platelet activation, plasma fibrinogen, plasma
fibronectin, histamine, hypoxia and inflammatory cytokines such as tumour necrosis factor
(TNF). Endothelial adherence has been shown to correlate significantly with the
severity of pain crisis.25 A study on the circulating levels of endothelial cells in sickle cell
anaemic patients with painful crisis revealed that they had higher levels of circulating
endothelial cells than patients with no recent events; who, in turn, had higher levels than
controls.26 In addition, in clinically less severe sickling disorders, such as Hb SC disease,
the red cells tend to be less adherent.27 In normal red blood cells (Hb A), there is no
restriction to blood flow (Figure 1A). Leucocytes may interfere with microvascular flow
by lodging in the capillary entrance or adhering to venous or capillary endothelium.
Increased white blood cell counts in patients with sickle cell disease have been associated
with increased mortality.28 Furthermore, acute infection, possibly because of the attendant
leucocytosis, is thought to be a triggering mechanism for vaso-occlusive pain events in
many SCA patients. Alterations in chemotaxis and adhesion of neutrophils have also
been observed in painful crisis states.29 Following endothelial adherence by reversible
sickle cells and leucocytes, the rigid irreversible sickle cells create a logjam (Figure 1B);
with subsequent increase in blood viscosity and reduced blood flow. This ultimately
results in obstruction of blood flow, tissue hypoxia, necrosis and often organ damage which
9
is worsened by abnormal regulation of vascular tone. A high steady- state leucocyte count
with high haemoglobin levels have been associated with a clinical phenotype involving
some disease complications such as vaso-occlusive pain crisis, acute chest syndrome,
avascular necrosis of bones and retinal vasculopathy.28,30 During crisis states, there is a
decrease in the levels of vasodilator substances like the prostacyclins and nitric oxide (NO)
and an increase in vasoconstrictor substances including endothelin and prostaglandins
(PGs). Nitric oxide plays a central role in vascular homeostasis by maintaining
vasomotor tone, limiting ischemia-reperfusion injury and modulating endothelial
proliferation. The intense pain observed in the chest, abdomen and skeleton during vaso-
occlusion is caused by the inflammatory response to muscle and bowel ischaemia as well as
bone or marrow necrosis. Two phases of painful crisis have been described31,32 - an
initial phase associated with increasing pain, decreased red blood cell deformity, increase
in the number of dense cells, red cell distribution width, haemoglobin distribution width,
reticulocyte count, leukocytosis and decrease in the number of platelets. The second phase
is characterized by established pain of maximum severity and gradual reversal of
abnormalities seen in the initial phase. These two phases of painful crisis have been
revised33 to involve four phases which include the prodromal, initial, established and
resolving phase.

10
Figure 1: Sickle cell endothelial adhesion and obstruction to blood flow in SCA, adapted
from NHLI http://www.nhlbi.nih.gov/health/health-topics/topics/sca/.34
N- Neutrophils RBC- Red blood cell
Neutrophils and

11
PATHOGENESIS OF HAEMOLYSIS IN SCA
The red cell survival in SCA is reduced from the normal 120 days to 4–25 days.
This haemolysis can be intravascular or extravascular producing anaemia, jaundice
(elevated indirect bilirubin), high serum lactate dehydrogenase (released from haemolyzed
red cell), high reticulocyte count and bone marrow erythroid hyperplasia to compensate for
the haemolysis. Two-thirds of haemolysis is extravascular in SCA, while one-third is
intravascular. Monocyte macrophage phagocytosis is the major mechanism of
extravascular haemolysis35 while physical entrapment of poorly deformable cells is the
less common pathway.36 Auto- oxidation of membrane components, acquisition of
immunoglobulins on red cell surface37 and loss of membrane symmetry on sickle cells all
enhance extravascular haemolysis.38 Intravascular haemolysis results from complement-
mediated lysis39 and sickling or shear induced membrane fragmentation,40 potentially
releasing as much as 10 g haemoglobin per day into blood plasma during hyperhaemolytic
crisis.41 This liberated plasma haemoglobin binds and consumes nitric oxide (NO),
forming methaemoglobin and nitrate (NO3-). This reaction causes a reduction in NO
levels (Figure 2[A]). Nitric oxide is synthesized in the endothelium and relaxes vascular
smooth muscle thereby causing vasodilation.42 L-arginine is the precursor for both NO and
L-ornithine. The synthesis of NO is catalyzed by NO synthases (NOS) and that of L-
ornithine by arginase. During intravascular haemolysis, arginase is released from the sickle
cells which redirects the metabolism of L-arginine to L-ornithine, contributing to low
NO levels (Figure 2[B]). L-ornithine may be converted to polyamines and L-proline which
are essential for smooth muscle cell growth and collagen synthesis; thus,
promoting vasoconstriction (Figure 1).43 In addition, NO depletion enhances the production
of endothelial adhesion molecules such as vascular cell adhesion molecule -1 (VCAM-
1), E-selectin and vasoconstrictors such as endothelin-1; all culminating in haemolysis

12
induced endothelial dysfunction. Sickle cell disease is associated with increased xanthine
oxidase44 and overproduction of reactive oxygen species, such as superoxide that can disrupt
NO homeostasis and produce the highly oxidative peroxynitrite (ONOO-) (Figure 2[C]).45
Cumulative effects of nitric oxide depletion favors vasospasm and hence precipitates vaso-
occlusive crisis.
It is hypothesized that low steady state haemoglobin, increased rate of intravascular
haemolysis and thus decreased NO bioavailability and endothelial dysfunction are
associated with some clinical phenotypes of sickle cell disease. These include cutaneous
leg ulceration, priapism, pulmonary hypertension, cholelithiasis, sudden death and stroke.4
Polyamines
L - proline
Figure 2: A summary of the pathophysiology of haemolysis in sickle cell anaemia,
adapted from Galdwin and Kato.48

13
LDH- Lactate dehydrogenase, NO- nitric oxide, NO3- - nitrate,
ONOO- - peroxynitrite, O- - - superoxide, MetHb- methaemoglobin
CLINICAL FEATURES OF SCA
The clinical features of SCA are highly variable and symptoms usually do not develop until
the age of six to twelve months of life when the level of the protective haemoglobin F has
sufficiently declined. Sickle cell patients can present in an asymptomatic steady state or an
acute crisis state. The steady state is the period free of crises extending from at least three weeks
since the last clinical event and three months or more since the last blood transfusion, to at least
one week before the start of a new clinical event.49
The hallmark of clinical presentation of SCA is the sickle cell crises, which refers to
episodes of acute illness due to the sickling phenomenon and associated with exacerbation of
the clinical signs and symptom of SCA (such as pain, anaemia and jaundice) in a patient
who had been in a stable condition.50 Sickle cell anaemic crises can be anaemic and/ or
vaso-occlusive crisis. Factors that could precipitate crisis are extremes of temperature,
infection, dehydration, stress (physical and emotional) and acidosis.51
VASO-OCCLUSIVE CRISIS (VOC)- This crisis is characterized by recurrent
attacks of sudden onset and self-limiting pain involving the skeleton, chest and
abdomen.52 Painful crisis is the most frequent cause of hospitalization in sickle cell
patients and most times, no precipitating factor is found.53 It is often associated with
modest exacerbation of anaemia, increased leucocytosis and fever. Fever maybe present
even in the absence of demonstrable infection.51,54
The frequency of acute pain crises in SCA varies within and between individuals from
rare occurences during a lifetime to many times a month.54 The frequency of pain episodes
increases late in the second decade of life and decreases in frequency after the fourth

14
decade for reasons that are not understood.53,54 Recurrent crises in an individual patient
may have the same pain distribution pattern. The frequency of painful crisis is increased
with high baseline haemoglobin (Hb) levels, low Hb F levels, leucocytosis and presence of
infection.53 The Arab- India and Senegalese β haplotypes are associated with less vaso-
occlusive crisis than the Benin and Bantu haplotypes. SCA patients with high rates of pain
episodes of more than 3 times a year tend to die earlier than those with lower rates of pain
episodes.53 Bone pain tends to be bilateral and symmetric, commonly involving the back,
legs, knees, arms, chest and abdomen in decreasing order of frequency.55,56 The severity of
pain ranges from mild transient attacks of five minutes to excruciating pain lasting up to
five to ten days which may require hospitalization. When a vaso-occlusive crisis lasts
longer than seven days, it may suggest other causes of bone pain, such as
osteomyelitis, avascular necrosis, right upper quadrant syndrome and compression
deformities. Pain in vaso-occlusive crisis can be assessed as to quantity, quality, location,
time course and aggravating and relieving factors. The goals of pain assessment are to
characterize patients' pain status and related experiences over time, to provide a basis on
which treatment decisions can be made and to document the effectiveness of pain
management strategies.55 Pain assessment relies heavily on self-reports of patients and
physicians' use of valid and reliable clinical measurement instruments. The
psychological, behavioural and cultural profile of individual patients also influence their
perception of pain and their ability to cope with the pain.57 Patients may describe the
quality of pain in vaso- occlusive crisis as throbbing, sharp, dull or stabbing in nature.55,56
Several pain scales have been used to quantify the intensity of pain in SCA. An objective
pain scale is the visual analog scale (VAS), which consists of a horizontal line labeled
from 0 (absence of pain) to 10 (worst possible pain ever experienced).55,56 The patient
circles the number that indicates the overall intensity of the pain. A peadiatric version of
15
this scale is the Wong-Baker faces pain rating scale which uses cartoon faces displaying
emotions ranging from “happiness/no pain” to “neutrality” to “distress/sadness”
corresponding to a scale of 0-10.58 Children are asked to point to the face that illustrates
how they feel. The visual analog scale may contain a scaled body drawing where patients
can mark on it the location of their pain.56,59 This technique is useful for determining
the extent of pain involvement and for distinguishing the pain of vaso-occlusive crisis
from pain caused by other complications, such as joint infection.60 The visual analog scale
can be used as an objective parameter for titrating the dosage of narcotic analgesics and
planning hospital discharge.60
The numeric rating scale (NRS),61 a verbal pain scale may be used if the patient is unable to
provide a written response to the visual analog scale. Pain intensity is reported verbally on
a scale of zero to 10. The NRS rates pain as 0= no pain, 1-3= mild pain, 4-6=moderate pain
and 7-10 =severe pain. This 11 point scale also corresponds to pain impact on activities of
daily living. Grading it as: no interference on activities of daily living; to interefence
of little activities (mild); to significant interference of daily activites (moderate); to being
unable to carry out activities of daily living (severe) respectively. Thus, patients can
compare their level of pain during vaso-occlusive crisis with their pain rating for an
average day to determine severity.
The verbal rating pain scale (VRS)62 is an additional tool used to assess the intensity of pain
in vaso-occlusive crisis and response to analgesia. This scale numerically rates the words -
none, slight, mild, moderate, severe and very severe as 0-5 respectively. The number
corresponding to the word chosen by the patient in crises is used to determine the intensity
of pain. There are different forms of the verbal rating scale. A modified verbal rating scale
has been found to be a reliable tool in pain assessment in Nigerian patients.63

16
The pain relief scale, is also an assessment tool that assists in analgesic dose titration
during vaso-occlusive crisis and planning of patient discharge. It compares the degree of
pain relief that has been achieved with the degree of pain that the patient had on the
previous day and/or the first day of hospitalization. The degree of pain relief is based on a
scale of 0 to 100 percent.56
A more comprehensive multidimensional pain assessment in patients with chronic pain
geared toward treatment planning include: treatment history (e.g. frequency of VOC the
previous year and pain medications), physical factors (e.g. blood pressure, pulse rate and
respiratory rate), demographic and psychosocial factors (e.g. age, gender, moods and coping
styles), dimension of pain (e.g. location of pain and precipitating factors) and impact of
pain on self-functioning (e.g. self-care and social interaction). The impact of vaso-
occlusive crisis on a patient's life depends on the frequency and duration of each episode
and the intensity of the pain.64
ANAEMIC CRISIS- This is characterized by sudden exaggeration of anemia. It may be
from hyperhaemolytic crisis, sequestration crisis, aplastic crisis or acute megaloblastic
anaemia. Despite the presence of anaemia, tissue oxygenation may be relatively preserved as
the affinity of HbS for oxygen is decreased in comparison with Hb A (in absence of vaso-
occlusion), hence explaining the rather good tolerance of anaemia.
Hyperhaemolytic crisis- is defined as a marked drop in haemoglobin from steady state
with evidence of increased red blood cell destruction [with or without reticulocytosis >
25% from baseline and/or presence of nucleated red blood cells in peripheral blood] in the
absence of other identifiable causes of red cell destruction [splenic or hepatic
sequestration].65 Several subphenotypes of hyperhaemolysis have been described including
hyperhaemolysis during an episode of acute vaso-occlusive painful crisis,66 or
hyperhaemolysis occurring as an acute or delayed haemolytic transfusion reaction,67 or
17
during infection such as malaria or drug exposure.68 However, isolated episodes of
hyperhemolysis in the absence of painful crises are often referred to as haemolytic crises.66
Acute splenic sequestration- This results from trapping of red cells in the splenic
sinuses leading to a sudden rapid enlargement of the spleen and a precipitous fall in
haemoglobin level with the potential for hypovolemic shock and cardiovascular failure. The
cooperative study of sickle cell disease (CSSCD) defined acute splenic sequestration as
decrease of haemoglobin or packed cell volume of at least 20% from the baseline along
with increase in palpable spleen size of at least 2 centimetres from baseline.69 It may follow
a viral or bacterial infection and there is usually evidence of reticulocytosis (an increase
of 25% from baseline) and often moderate to severe thrombocytopenia (<150,000 /µL).65
It usually occurs in children 3 months to 5 years of age,68 before auto-infarction and
fibrosis has taken place. Furthermore, SCA patients with high HbF levels retain splenic
function longer than those with lower HbF levels and remain susceptible to splenic
sequestration. Trapping of blood in the liver (hepatic sequestration crisis) characterized
by tender hepatomegaly, acute exacerbation of anemia, reticulocytosis and
hyperbilirubinaemia, occurs less frequently in SCA.70
Aplastic crisis- In SCA, the life span of red blood cells is greatly shortened. Hence,
a temporary cessation of erythropoiesis can result in acute exacerbation of anemia
producing pallor, tachycardia, and fatigue. Infection with parvovirus B19 is the most
important cause of aplastic crises and may be accompanied by extensive bone marrow
necrosis. Parvovirus B19, preferentially attacks erythroid precursors via its receptor, P-
antigen on the erythrocyte surface. Destruction of erythroid precursors leads to severe
anemia and reticulocytopaenia (usually < 50,000 /µL).65 Parvovirus B19 infection is self-
limiting and after 1–2 weeks the bone marrow begins to function normally.

18
Megaloblastic crisis - Chronic erythroid hyperplasia depletes folate reserves. Folate
depletion results in sudden ineffective erythropoiesis, causing a megaloblastic crisis. Folate
deficiency has been demonstrated in sickle cell disease patients5 and there is an inverse
relationship between plasma homocysteine concentration and folate status.12,15
COMPLICATIONS AFFECTING MAJOR ORGANS IN SCA
Complications of SCA refers to the chronic disability associated this disease.
Neurological Complications -Cerebrovascular accidents (CVA) are one of the most
devastating complications of sickle cell disease. It is due to lesions of major vessels,
particularly the internal carotid and anterior and middle cerebral arteries.71,72 The prevalence
of CVA in SCA has been found to be 4.01% and the incidence is 0.61 per 100 patient-
years.73-75 CVA includes transient ischemic attack (TIA), completed infarctive stroke and
haemorrhagic stroke. SCA patients with no history of stroke may have detectable
cerebral infarcts on magnetic resonance imaging (MRI), called silent infarcts. Impaired
neurocognitive function can also occur in SCA patients. This neurological complication is
not detected by imaging and other routine diagnostic methods but by abnormal
neuropsychiatric and neurobehavioral tests.68,76 The incidence of infarctive stroke is lowest in
SCA patients 20 to 29 years of age and higher in children and older patients. Conversely,
the incidence of hemorrhagic stroke is highest among SCA patients aged 20 to 29 years
and it is associated with a higher mortality rate.73
In children, measurement of cerebral blood flow velocities of 200 cm/sec or more by
transcranial doppler ultrasound (TCD) is associated with an increased risk of ischemic
stroke.77 Thus, TCD can identify high-risk SCA patients and chronic blood transfusions
may decrease the risk of a first stroke.78 Other risk factors for stroke in SCA include:
low steady state haemoglobin (Hb), low Hb F, high leucocyte count, high systemic blood

19
pressure, occurrence of painful crisis or priapism73,75,79 or aplastic crisis,80 previous TIA,81
previous stroke74 and increased homocysteine levels.82
Pulmonary Complications- Acute chest syndrome and pulmonary hypertension are the
most common causes of death in patients with sickle cell disease.28,47,83 Acute chest
syndrome (ACS) is usually accompanied by chest pain, fever, wheezing, cough, tachypnea
and hypoxaemia.83 It is associated with the radiographic abnormality of a new
pulmonary infiltrate that is consistent with alveolar consolidation but not atelectasis,
involving at least one complete lung segment.84 Risk factors for ACS in SCA are high
(Hb) concentrations, low Hb F concentrations and leucocytosis.85 ACS can be self-limiting
or can rapidly progress and may be fatal. In children, it is milder and more likely due to
infection, whereas in adults it is more likely to be severe and to be associated with pain
and a higher mortality rate. Typical causes include pulmonary infection, embolization of
bone marrow fat and intravascular pulmonary sequestration of sickled erythrocytes, resulting
in lung injury and infarction.84 Pulmonary infection by community acquired pathogen is
the most common cause of ACS. Studies in transgenic mice shows that HbS is
susceptible to inflammatory triggers such as lipopolysaccharide and episodic exposure to
environmental hypoxia, with the development of lung injury at doses of endotoxin or
degrees of hypoxia that do not adversely affect wild-type mice.86,87 Severe vaso-occlusion
may result in bone marrow necrosis and subsequent embolization of bone marrow fat to
the lungs. Bone marrow free fatty acids in the lungs initiates a severe inflammatory
response, hypoxaemia, acute pulmonary hypertension and lung injury.88 Pulmonary
infarctions or vaso-occlusion may be complicated by increased pulmonary pressure and
eventually cor pulmonale.89 Pulmonary hypertension is defined as mean pulmonary artery
pressure of 25 mmHg, determined by right heart catheterization. It is one of the leading
causes of mortality and morbidity in adults with sickle cell disease.68 The development of

20
pulmonary hypertension in sickle cell disease has been associated with the intensity of
haemolytic anaemia.47,90,91 Other mechanisms which contribute to pulmonary hypertension
in SCA include liver disease complicated by porto-pulmonary hypertension47 and in situ
pulmonary thromboembolism.92
Hepatobiliary Complications- About one-third of patients with sickle cell disease
present with liver dysfunction.93 Haemoglobin S affects the hepatobiliary system in different
ways.93,94 The liver may transiently increase in size during a painful crisis93 or an intrinsic
disease may result from intra-hepatic sequestration of sickle cells. Hepatic sequestration is
characterized by tender, progressive hepatomegaly, accentuated anaemia, reticulocytosis
and hyperbilirubinaemia. It may be complicated by intrahepatic cholestasis, a rare
catastrophic event, characterized by sudden onset of right upper quadrant pain, progressive
hepatomegaly and a serum bilirubin level that may rise to well over 100 mg/dl. The
gallbladder can also be affected by haemoglobin (pigmented) stones, cholecystitis and
biliary sludge. Viral hepatitis (independent of or secondary to red cell transfusions)
and transfusion associated- hepatic siderosis are other hepatic complications.
Renal Complications- SCA patients develop sickle cell nephropathy in several ways.
The renal medulla is particularly susceptible to damage in SCA.95 Polymerization of Hb S
in its unique hyperosmolar, acidic and anoxic environment results in sludging of blood flow
and loss of medullary osmolar gradient with eventual destruction of the vasa recta in the
distal tubule from vaso-occlusion.96 This distal tubule destruction results in hyposthenuria
/loss of urine concentrating ability. Infants and children with hyposthenuria present with
enuresis and nocturia with increased tendency to dehydration and red cell sickling.96 Apart
from loss of urine concentrating ability, distal tubule dysfunction also impairs the ability
to excrete acid and potassium.97,98 In contrast to distal tubular subnormal functions,

21
supranormal proximal tubular function is present in SCA, as evident by increased
reabsorption of sodium, phosphorus, and increased excretion of creatinine and uric acid in
the urine.99 This supranormal function of the proximal tubule is due to increased renal
plasma flow and increased GFR, possibly from the compensatory hypersecretion of
vasodilator prostaglandins in response to hypoxia-induced sickling.100
Children and infants with SCA have supranormal glomerular filtration rate (GFR), this
decreases during adolescence to normal levels, and in older adults, it is subnormal.
Sickling induced medullary congestion, vasa recta haemorrhage and papillary necrosis
results in microscopic to gross painless haematuria. Hematuria is often from the left kidney
and occurs at any age. Older SCA patients have been found to have glomerulopathy,
involving the juxtamedullary glomeruli that manifests as microalbuminuria,
macroalbuminuria or end-stage renal disease (ESRD).99,101,102 The pathogenesis of
glomerulopathy is unknown but presumed to occur from mesangial phagocytosis of
erythrocytes and apoptotic cells. Studies show that gross proteinuria and ESRD are
observed in 15 to 30 percent of patients with SCD.103 Kidney biopsies reveal enlarged
glomeruli, and the most common glomerular lesion in sickle cell nephropathy is focal
and segmental glomerulosclerosis (FSGS), while membranous glomerulopathy has also
been observed in some cases. Macroalbuminuria, especially over 1.5 gm per day, strongly
correlates with progression to renal failure, ESRD and acute chest syndrome.104-106
Priapism - Priapism is a prolonged, persistent, purposeless or unwanted and recurrent
painful erectile erection that may last from hours to days. Priapism affects 35% of boys
and men.107 Priapism in adult males with SCA is a marker of severe disease and identifies
patients who are at risk for other sickle cell-related organ failures syndrome.46,108
Thrombocytosis, low level of Hb F, and severity of hemolysis are reported risk factors of
priapism.46,108
22
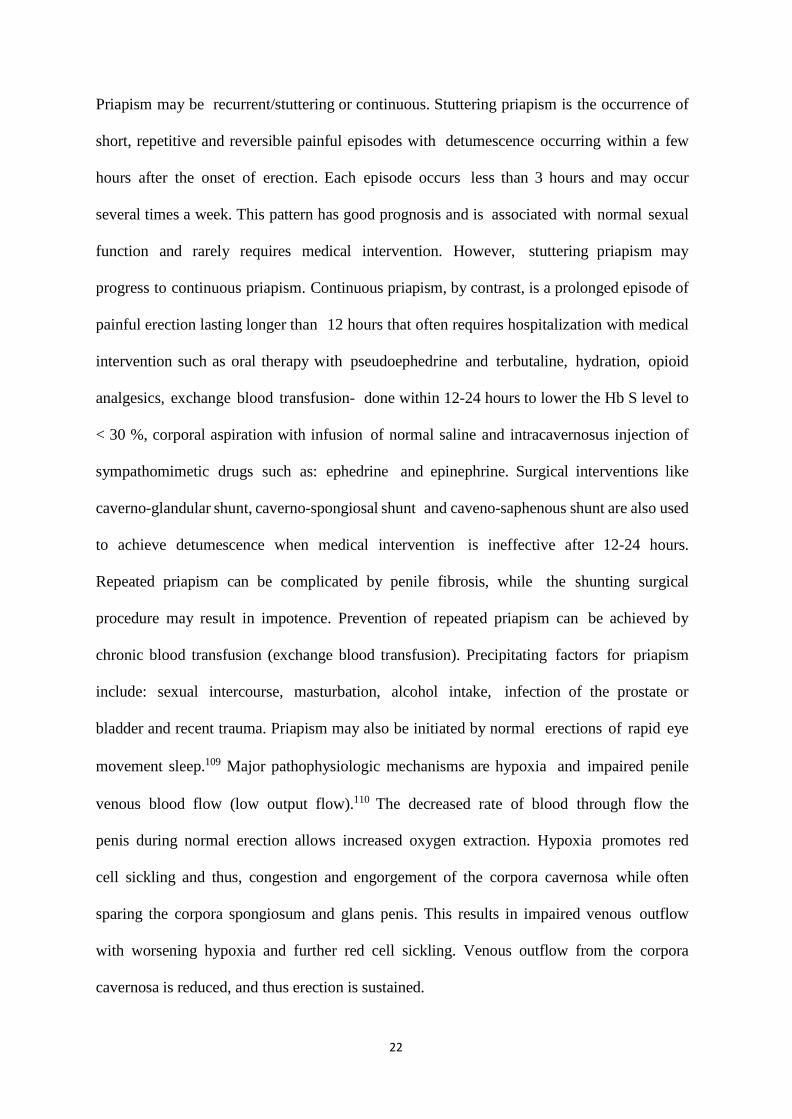
Priapism may be recurrent/stuttering or continuous. Stuttering priapism is the occurrence of
short, repetitive and reversible painful episodes with detumescence occurring within a few
hours after the onset of erection. Each episode occurs less than 3 hours and may occur
several times a week. This pattern has good prognosis and is associated with normal sexual
function and rarely requires medical intervention. However, stuttering priapism may
progress to continuous priapism. Continuous priapism, by contrast, is a prolonged episode of
painful erection lasting longer than 12 hours that often requires hospitalization with medical
intervention such as oral therapy with pseudoephedrine and terbutaline, hydration, opioid
analgesics, exchange blood transfusion- done within 12-24 hours to lower the Hb S level to
< 30 %, corporal aspiration with infusion of normal saline and intracavernosus injection of
sympathomimetic drugs such as: ephedrine and epinephrine. Surgical interventions like
caverno-glandular shunt, caverno-spongiosal shunt and caveno-saphenous shunt are also used
to achieve detumescence when medical intervention is ineffective after 12-24 hours.
Repeated priapism can be complicated by penile fibrosis, while the shunting surgical
procedure may result in impotence. Prevention of repeated priapism can be achieved by
chronic blood transfusion (exchange blood transfusion). Precipitating factors for priapism
include: sexual intercourse, masturbation, alcohol intake, infection of the prostate or
bladder and recent trauma. Priapism may also be initiated by normal erections of rapid eye
movement sleep.109 Major pathophysiologic mechanisms are hypoxia and impaired penile
venous blood flow (low output flow).110 The decreased rate of blood through flow the
penis during normal erection allows increased oxygen extraction. Hypoxia promotes red
cell sickling and thus, congestion and engorgement of the corpora cavernosa while often
sparing the corpora spongiosum and glans penis. This results in impaired venous outflow
with worsening hypoxia and further red cell sickling. Venous outflow from the corpora
cavernosa is reduced, and thus erection is sustained.

23
Leg ulcers- Ulcerations of the skin and underlying tissues commonly involves the medial
and lateral aspects of the ankle. Risk factors associated with the development of leg ulcers
in SCA include trauma, infection, severe anaemia, high haemolytic rate, low steady state
haemoglobin (Hb), low Hb F, geographic location, socioeconomic status and venous
incompetence.111,112
Possible complications include superimposed infection, ankle stiffness and oedema,
osteomyelitis, pathological fractures, severe pain, mood disorders and poor-health-related
quality of life.111 Factors that predispose to chronic ulceration in SCA include poor skin
perfusion (due to mechanical obstruction to flow from vaso-occlusion), increased local oedema
from venous incompetence, abnormal autonomic vascular control (inadequate veno-arterial
response to leg lowering and secondary venous hypertension),113 microvascular thrombosis,
decreased oxygenation, reduced nitric oxide bioavailability (impaired endothelial function) and
minor trauma.114
Bony complications- Dactylitis is a complication that usually manifests in infants and
children under 4 years of age with a peak at 6-12 months of life115. It is due to limited
avascular necrosis of the bone marrow involving the hands and feet presenting as bilateral
painful, red and swollen hands or feet. Prolonged ischaemia may lead to bony destruction of
the terminal phalanges and metacarpals. Dactylitis occurring in infants less than 6months has
been associated with a severe disease outcome.116 It is precipitated by cold, low Hb F and
high reticulocyte count.117 Necrosis of the bone marrow maybe complicated by marrow
fat embolization to the lungs resulting in an acute chest syndrome or sudden death.118
In adults, avascular necrosis of epiphyseal bones of the hip is common.119 Other frequently
involved joints are the shoulder and spine. Avascular necrosis results from complete
disruption of vascular supply to the articular surfaces and ends of long bones. The
24
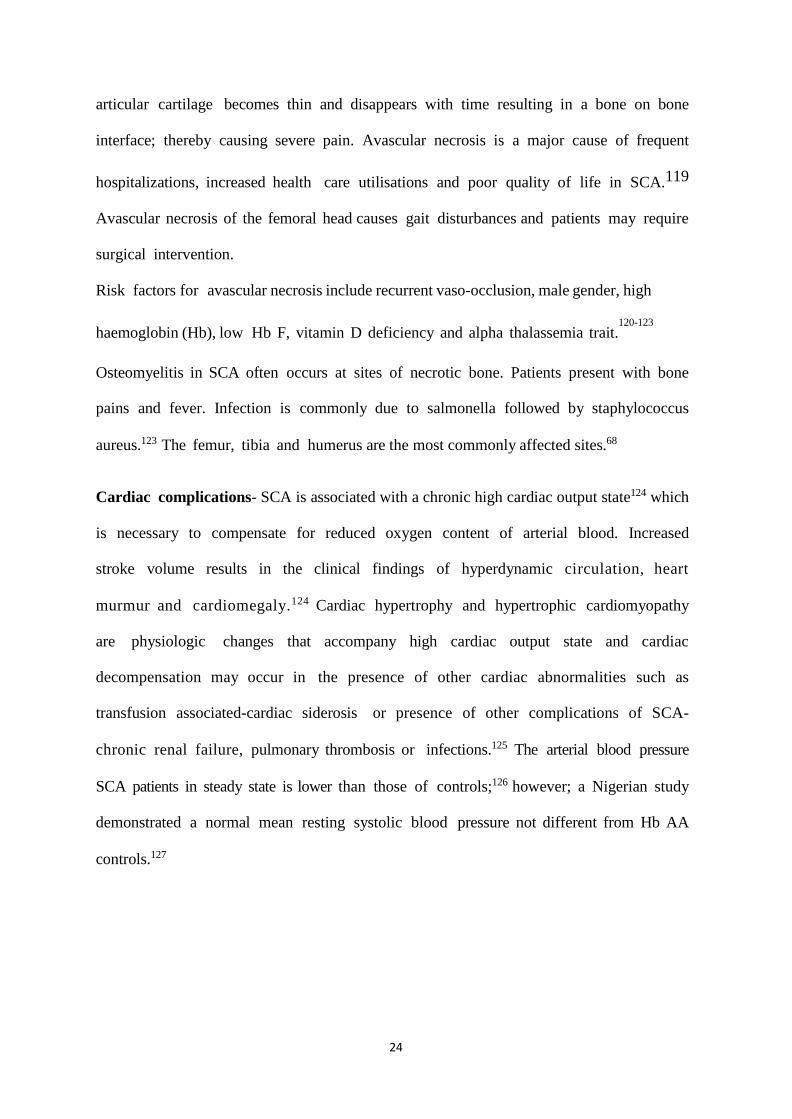
articular cartilage becomes thin and disappears with time resulting in a bone on bone
interface; thereby causing severe pain. Avascular necrosis is a major cause of frequent
hospitalizations, increased health care utilisations and poor quality of life in SCA.119
Avascular necrosis of the femoral head causes gait disturbances and patients may require
surgical intervention.
Risk factors for avascular necrosis include recurrent vaso-occlusion, male gender, high
haemoglobin (Hb), low Hb F, vitamin D deficiency and alpha thalassemia trait.120-123
Osteomyelitis in SCA often occurs at sites of necrotic bone. Patients present with bone
pains and fever. Infection is commonly due to salmonella followed by staphylococcus
aureus.123 The femur, tibia and humerus are the most commonly affected sites.68
Cardiac complications- SCA is associated with a chronic high cardiac output state124 which
is necessary to compensate for reduced oxygen content of arterial blood. Increased
stroke volume results in the clinical findings of hyperdynamic circulation, heart
murmur and cardiomegaly.124 Cardiac hypertrophy and hypertrophic cardiomyopathy
are physiologic changes that accompany high cardiac output state and cardiac
decompensation may occur in the presence of other cardiac abnormalities such as
transfusion associated-cardiac siderosis or presence of other complications of SCA-
chronic renal failure, pulmonary thrombosis or infections.125 The arterial blood pressure
SCA patients in steady state is lower than those of controls;126 however; a Nigerian study
demonstrated a normal mean resting systolic blood pressure not different from Hb AA
controls.127

25
ASSESSING THE DISEASE SEVERITY OF SICKLE CELL ANAEMIA
Some risk factors for individual disease complications of SCA are known but are
insufficiently precise to use for prognostic purposes and predicting the global disease
severity of SCA is not yet possible.128 The severity of the clinical and haematological
manifestations in SCA is extremely variable. Some SCA patients have frequent vaso-
occlusive crisis and die young while others have less crisis and have a normal lifespan. The
expression of variable phenotypes maybe due to co-inherited modifying genes with the
sickle cell (βs) mutation as well as environmental influences. A study conducted on twins
with sickle cell disease129 showed that despite identical β- and α-globin genotypes a nd
similarities in growth, haematological and biochemical parameters; the identical twins
had quite different prevalence and severity of painful crises and some of the sickle
complications. Thus, phenotypic variance is subjected to genetic and non-genetic
influences. Identification of genetic polymorphisms linked to haemolytic and vaso-
occlusive complications in SCA will eventually be a useful method for accurately
predicting disease severity as well as reveal new therapeutic targets.
Two major established predictors of sickle cell disease complications that influence the
primary event of HbS polymerization are haemoglobin F (Hb F) and the co-inheritance of
α- thalassaemia. Foetal haemoglobin (Hb F) inhibits Hb S polymerization and higher levels
are associated with a reduction of most vaso-occlusive complications of SCA.81 Hb F
concentrations vary in SCA patients; ranging from 0.1% to30% and there is considerable
variability in severity of complications among patients with similar concentration levels.
Typical levels of Hb F vary across the four major β-globin haplotypes. The highest Hb F
level and mildest clinical course is found in carriers of the Hb S gene on the Arab-India or
Senegal halotype, intermediate levels and moderate severity on the Benin haplotype, and
the lowest levels and most severe on the Bantu (Central African Republic) haplotype.81
26
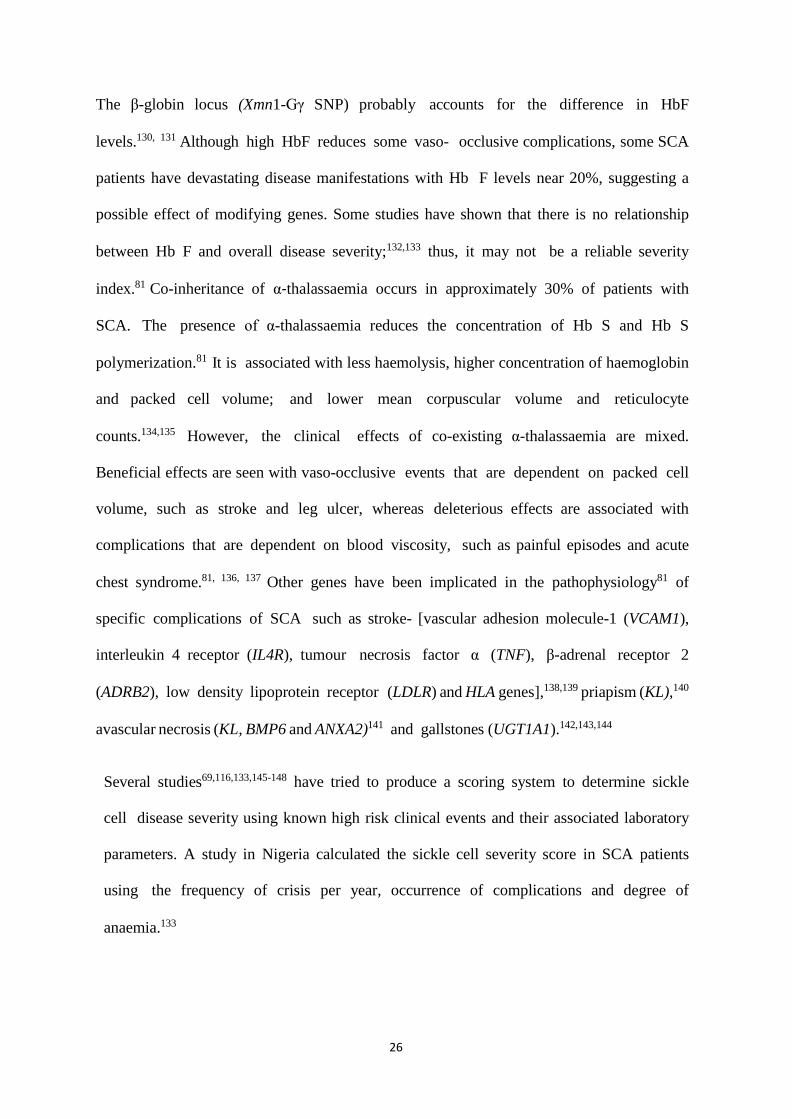
The β-globin locus (Xmn1-Gγ SNP) probably accounts for the difference in HbF
levels.130, 131 Although high HbF reduces some vaso- occlusive complications, some SCA
patients have devastating disease manifestations with Hb F levels near 20%, suggesting a
possible effect of modifying genes. Some studies have shown that there is no relationship
between Hb F and overall disease severity;132,133 thus, it may not be a reliable severity
index.81 Co-inheritance of αthalassaemia occurs in approximately 30% of patients with
SCA. The presence of α-thalassaemia reduces the concentration of Hb S and Hb S
polymerization.81 It is associated with less haemolysis, higher concentration of haemoglobin
and packed cell volume; and lower mean corpuscular volume and reticulocyte
counts.134,135 However, the clinical effects of co-existing α-thalassaemia are mixed.
Beneficial effects are seen with vaso-occlusive events that are dependent on packed cell
volume, such as stroke and leg ulcer, whereas deleterious effects are associated with
complications that are dependent on blood viscosity, such as painful episodes and acute
chest syndrome.81, 136, 137 Other genes have been implicated in the pathophysiology81 of
specific complications of SCA such as stroke- [vascular adhesion molecule-1 (VCAM1),
interleukin 4 receptor (IL4R), tumour necrosis factor α (TNF), β-adrenal receptor 2
(ADRB2), low density lipoprotein receptor (LDLR) and HLA genes],138,139 priapism (KL),140
avascular necrosis (KL, BMP6 and ANXA2)141 and gallstones (UGT1A1).142,143,144
Several studies69,116,133,145-148 have tried to produce a scoring system to determine sickle
cell disease severity using known high risk clinical events and their associated laboratory
parameters. A study in Nigeria calculated the sickle cell severity score in SCA patients
using the frequency of crisis per year, occurrence of complications and degree of
anaemia.133

27
Table 1: Calculation of disease severity score133
CLINICAL AND LABORATORY FEATURES SCORE
Crisis number(s) per year? 2- 3 [1] ≥4 [2]
Lobar pneumonia Yes [1] No [0]
Osteomyelitis Yes [1] No [0]
Anaemic heart failure Yes [1] No [0]
Acute chest syndrome Yes [1] No [0]
Dehydrated Yes [1] No [0]
Avascular necrosis of
femoral head
Yes [1] No [0]
Liver disease Yes [1] No [0]
Recurrent seizures Yes [1] No [0]
Renal Failure Yes [1] No [0]
Pigment gallstone and
Jaundice
Yes [1] No [0]
Growth retardation Yes [1] No [0]
Anaemia Hb ≥10g/dl [0] Hb≥8<10g/dl [1]
Hb≥6<8g/dl [2] Hb≥4<6g/dl [3] Hb<4g/dl [4]
TOTAL SEVERITY SCORE
This severity score was correlated with Hb F levels. The researchers divided the subjects
into three groups: Group I: Hb F levels < 10 %; Group II: Hb F levels > or = 10 % but <
15 %; Group III: Hb F levels > or = 15 %. The severity score was classified as mild,
moderate and severe (mild SCA (≤3), moderate SCA (>3 but ≤7) and Severe SCA (>7)).
The study did not find a significant correlation between Hb F and total severity
scores.133 They postulated that in subjects whose Hb F concentrations were < 20 %, other
variables apart from Hb F may have influenced the severity of their disease.
A 9 year cooperative study of sickle cell disease (CSSCD),116 analysed clinical and
laboratory data from 392 infants with sickle cell anaemia and defined adverse outcomes as

28
haemoglobin < 8 g/dL, leucocyte count > 20,000/cm3, an episode of dactylitis in patients
<1 year and an increase in percentage pocked red blood cells by 1 year. However, these
results could not be replicated in another study of children.116
A network model- the Bayesian network model148 has also been used to predict the risk of
death in sickle cell disease. This model studied 3380 sickle cell disease patients and used 25
variables (laboratory and clinical) to estimate disease severity represented as a predictive
score of death within 5 years. This model identified previously known risk factors for
mortality like renal insufficiency and leucocytosis along with laboratory markers severe
haemolytic anaemia, its associated clinical events and HbSS phenotype as contributing
risk factors for death in sickle cell disease. The Bayesian network is has been validated
by 2 independent studies and it is more specific than expert clinician assessment alone
and has the virtue of integrating many clinical and laboratory findings and providing a
quantifiable estimate of disease severity. However, this model does not integrate the
genetic polymorphisms that are likely to modulate the laboratory and clinical variables.148
Determining disease severity in SCD patients will improve treatment outcomes.
However, none captures satisfactorily the all-embracing severity of disease; probably
reflecting the omission of the genotypic changes that underlie the different disease
phenotypes.

29
OVERVIEW OF HOMOCYSTEINE
Homocysteine is sulfur containing amino acid derived from methionine; an essential amino
acid and also the only source of homocysteine in man. The metabolism of homocysteine
is at the intersection of two metabolic pathways: remethylation and transsulphuration
(Figure 3).
Remethylation Pathway (Figure 3): In the remethylation pathway, homocysteine is
converted to methionine by acquiring a methyl group from either the conversion of 5-
methyltetrahydrofolate to tetrahydrofolate or from the conversion of betaine to N, N-
dimethylglycine. The former reaction occurs in all tissues and it requires the enzyme
N5,N10 methyltetrahydrofolate homocysteine methyltransferase and vitamin B12 as a co-
factor. The latter reaction; which in general is relatively minor, is vitamin B12-independent,
occurs mainly in the liver and requires the enzyme –betaine homocysteine
methyltransferase. A considerable proportion of methionine generated in the remethylation
reaction is converted back to homocysteine in reactions that involve activation of
methionine by adenosine triphosphate (ATP) to form S-adenosylmethionine (SAM).
SAM serves primarily as a universal methyl donor in a wide variety of biological reactions
including purine and pyrimidine synthesis giving rise to a by-product S-
adenosylhomocysteine (SAH). SAH undergoes a hydrolysis reaction; thus, regenerating
homocysteine, which then becomes available to start a new cycle of remethylation
reaction. Homocysteine which is not remethylated, is catabolised in a second pathway
known as transsulphuration.
Transsulphuration Pathway (Figure 3): In the transsulphuration pathway,
homocysteine condenses with serine to form cystathionine in an irreversible reaction that is
catalysed by the enzyme cystathionine-β-synthase (CβS) and it requires pyridoxal-5'-
phosphate (vitamin B6) as a co-factor. Cystathionine in turn is catabolized to cysteine and
α-ketobutyrate, in a reaction that is catalysed by γ-cystathionase. Excess cysteine is

30
N5, N10
(B6)
oxidized to taurine or inorganic sulfates or is excreted in the urine. The transsulfuration
pathway effectively catabolizes excess homocysteine, which is not required for methyl
transfer and down regulates remethylation while up regulating the enzyme cystathionine-
β-synthase (CβS). The remethylation and transsulphuration pathways are coordinated by S
adenosylmethionine (SAM), which acts as an allosteric inhibitor of the
methylenetetrahydrofolate reductase (MTHFR) reaction and as an activator of
cystathionine β-synthase (CβS) reaction.
Figure 3: The metabolic pathways of homocysteine, adapted from Yap, Boers and
Remethylation pathway
Transsulphuration
Pathway
(B6)
N5, N10 methyl THF Homocystine methyl transferase
Betaine Homocystine methyl transferase
Cystathione �-synthase
y-cystathionine
31
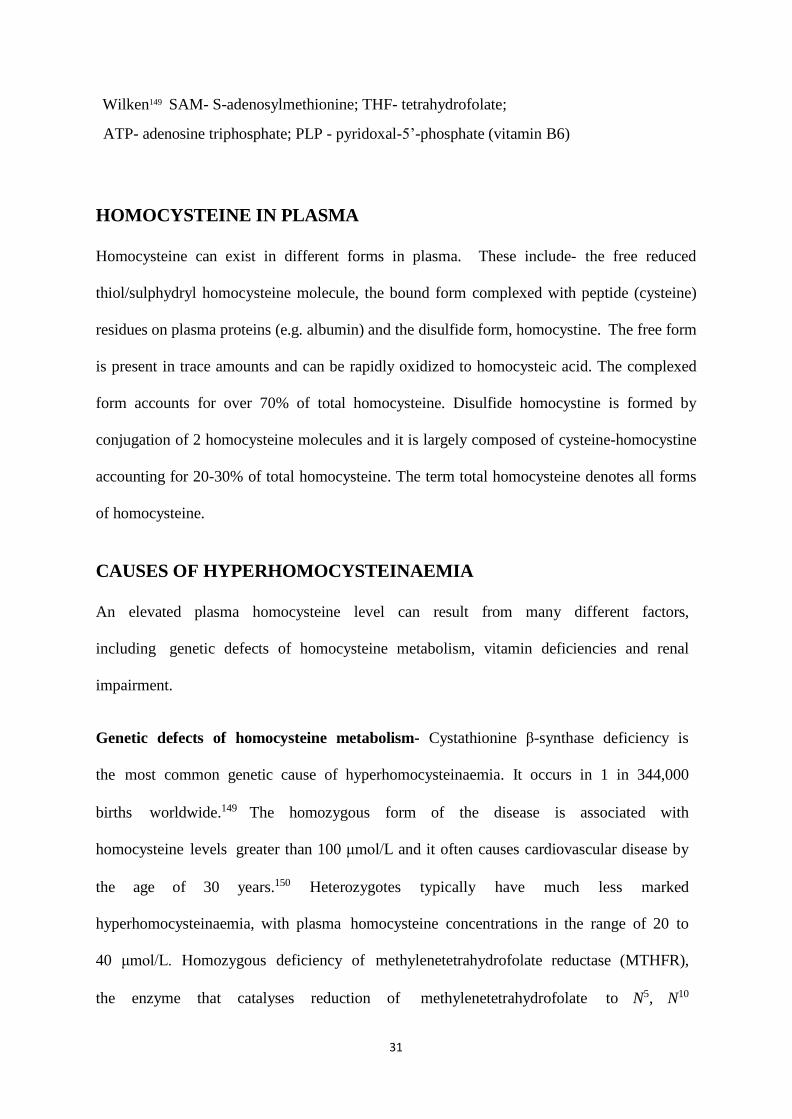
Wilken149 SAM- S-adenosylmethionine; THF- tetrahydrofolate;
ATP- adenosine triphosphate; PLP - pyridoxal-5’-phosphate (vitamin B6)
HOMOCYSTEINE IN PLASMA
Homocysteine can exist in different forms in plasma. These include- the free reduced
thiol/sulphydryl homocysteine molecule, the bound form complexed with peptide (cysteine)
residues on plasma proteins (e.g. albumin) and the disulfide form, homocystine. The free form
is present in trace amounts and can be rapidly oxidized to homocysteic acid. The complexed
form accounts for over 70% of total homocysteine. Disulfide homocystine is formed by
conjugation of 2 homocysteine molecules and it is largely composed of cysteine-homocystine
accounting for 20-30% of total homocysteine. The term total homocysteine denotes all forms
of homocysteine.
CAUSES OF HYPERHOMOCYSTEINAEMIA
An elevated plasma homocysteine level can result from many different factors,
including genetic defects of homocysteine metabolism, vitamin deficiencies and renal
impairment.
Genetic defects of homocysteine metabolism- Cystathionine β-synthase deficiency is
the most common genetic cause of hyperhomocysteinaemia. It occurs in 1 in 344,000
births worldwide.149 The homozygous form of the disease is associated with
homocysteine levels greater than 100 μmol/L and it often causes cardiovascular disease by
the age of 30 years.150 Heterozygotes typically have much less marked
hyperhomocysteinaemia, with plasma homocysteine concentrations in the range of 20 to
40 μmol/L. Homozygous deficiency of methylenetetrahydrofolate reductase (MTHFR),
the enzyme that catalyses reduction of methylenetetrahydrofolate to N5, N10

32
methyltetrahydrofolate may lead to moderate hyperhomocysteinaemia.150 Heterozygotes
have slightly higher homocysteine levels than unaffected people, while the homozygous
genotype have approximately 20% higher homocysteine levels.151 The MTHFR enzyme
deficiency involves a thermolabile variant in the MTHFR gene in which cytosine is
replaced by thymidine at position 677 (C677T or 677C→T), leading to the substitution
of valine for alanine.151 Homozygosity for C677T mutation is associated with an
exaggerated hyperhomocysteinaemic response to the depletion of folic acid and with folic
acid depletion may be at increased risk for vascular disease.152
Other abnormalities of the remethylation cycle that are associated with
hyperhomocysteinaemia include deficiency of N5, N10 methyltetrahydrofolate
homocysteine methyltransferase enzyme and disorders of vitamin B12 metabolism that
impair N5,N10 methyltetrahydrofolate homocysteine methyltransferase enzyme activity.
Vitamin deficiencies- Vitamin cofactors (folate, vitamin B12 and vitamin B6) are required
for homocysteine metabolism and their deficiencies may promote
hyperhomocysteinaemia. Deficiency of one or more B vitamins contributes to
approximately two-thirds of all cases of hyperhomocysteinemia.6 Vitamin supplementation
can normalize high homocysteine concentrations; however, it is uncertain if normalizing
homocysteine concentrations improves cardiovascular morbidity and mortality. Although
hyperhomocysteinaemia has been observed in patients with sickle cell disease,7-12 studies
from different parts of the world on folate and vitamin B12 levels in SCD have shown
inconsistent findings, reporting low, normal or elevated levels of these vitamins in the
presence of hyperhomocysteinaemia.7-13
Other causes of hyperhomocysteinaemia- Elevated creatinine levels, typically seen in
chronic renal failure correlates with an elevated plasma homocysteine concentration and
33
may partly explain the acceleration of atherosclerosis in these patients. However, it is
unclear whether the elevation in homocysteine is due to impaired metabolism or to reduced
excretion. A number of reports have linked hyperhomocysteinaemia to hypothyroidism,153
suggesting a potential mechanism for the higher incidence of vascular disease observed in
patients with hypothyroidism.
PATHOLOGICAL CONSEQUENCES OF HYPERHOMOCYSTEINAEMIA
An elevated homocysteine level is associated with an increased risk for developing
atherosclerosis, which can in turn lead to coronary artery disease,154 myocardial
infarction155 and stroke156. Other pathological consequences include peripheral vascular
diseases (deep vein thrombosis, pulmonary embolism and intermittent claudication),156,157
dementia,158 Alzheimer’s disease (AD)159 and obstetric complications (preeclampsia,
placental abruption and pregnancy loss).160
HOMOCYSTEINE AND SICKLE CELL ANAEMIA
It is known that patients with sickle cell anaemia (SCA) suffer from vaso-occlusion and
chronic haemolysis that result from red blood cell sickling and loss of elasticity. Chronic
haemolysis in SCA patients increases the erythropoietic demand for folate, predisposing
them to higher risk of folate deficiency.5 Hyperhomocysteinaemia has been observed in
patients with SCA.7-13 Folate and vitamin B12 (cyanocobalamin) are required for
remethylation of homocysteine to methionine. Deficiency of folate, vitamin B12 and
vitamin B6 inhibits the breakdown of homocysteine, thus giving rise to higher blood
levels of homocysteine. Approximately two- thirds of all cases of hyperhomocysteinaemia6
is due to one or more B vitamin deficiencies.
In a recent publication in Nigeria,13 a higher serum homocysteine and lower methylmalonic
acid and folate levels were observed in SCA patients with vaso-occlusive crisis when
34
compared with those SCA patients in steady state. However, serum homocysteine,
methylmalonic acid and vitamin B12 levels were lower when compared to those of age and
sex matched haemoglobin AA controls.13 A study in India,12 shows that children with sickle
cell anaemia and sickle cell- thalassemia had elevated serum homocysteine with
associated low folic acid and pyridoxine levels when compared to those of age and sex
matched healthy controls.
In addition, there was positive correlation between hyperhomocysteinaemia and the
frequency of vaso-occlusive crisis and a significant inverse correlation with pyridoxine
deficiency.12
Homocysteine has the potential to be a haemolytic toxin. A possible effect of
hyperhomocysteinemia in erythrocyte toxicity is that apart from neuronal cells, red blood
cell membrane has N-methyl-D-aspartic acid (NMDA) receptors.161 Homocysteine
hyperactivates the NMDA receptors on red blood cell membrane. This induces calcium
entry into the red cell with release of reactive oxygen species, thereby activating apoptosis
and causing haemolysis. Preincubation of red blood cells with homocysteine increased the
rate of acidic haemolysis and decreased the lag-period.161 Furthermore, homocysteine,
which is a very reactive thiol, has a preferential interaction with sulphydryl (-SH) groups of
proteins. It is also able to displace other thiols from protein binding sites to form
homocysteine-protein disulfides.162 Hence, it has been proposed that homocysteine may
exert its erythrocyte toxic effects via interaction with sulfhydryl residues of structural
protein (membrane and cytoskeleton) and enzymatic proteins on red blood cells, resulting
in premature red cell destruction.162 In vitro studies on red cells demonstrates that high
concentrations of sulfhydryl-active agents (including molecules able to form mixed disulfide
linkages) interfere with the transport and metabolism of glucose and the membrane
permeability to cations, thus leading to osmotic swelling and haemolysis.163

35
Homocysteine is readily auto-oxidized in plasma to homocysteine thiolactone (thiol/
sulphydryl group), homocystine and homocysteine-mixed disulfides. During auto-oxidation
of homocysteine, oxygen free radicals [superoxide (O⁻₂), hydroxyl ion (OH⁻) and
hydrogen peroxide (H₂O₂)] are generated.164 It has been proposed that this pro-oxidant
property of homocysteine is another mechanism of erythrocyte toxicity (Figure 4).
Membrane lipids, membrane proteins and cytoskeletal proteins are thought to be important
targets of oxidative damage in red blood cells. The protein thiol groups (cysteine residues)
on red cell membrane and cytoskeleton represent the most likely sites to be affected by
oxidant stress. These oxidative effects can result in premature red blood cell destruction
invivo. Furthermore, hyperhomocysteinaemia is associated with a reduced availability of
glutathione, an important factor in antioxidant defense of red blood cell.165 An invitro study
on red blood cells166 show induction of lipid peroxidation in the presence of decreased
cellular anti-oxidant capacity (Figure 4).
In addition, vitamin B12 and folate deficiency can induce megaloblastic anaemia in
SCA patients with resulting intramedullary destruction of fragile and abnormal
megaloblastic erythroid precursors. This can worsen the haemolytic crisis. It is possible
therefore that raised homocysteine levels in SCA patients predispose to the development of
further haemolysis.
The mechanism of vaso-occlusion in sickle cell disease is multifactorial and plasma
homocysteine may contribute to endothelial activation seen in sickle cell vaso-occlusive
crisis. The endothelial dysfunction in hyperhomocysteinaemia has been reported to be a
cause of vascular injury. Homocysteine induced endothelial injury has multiple aetiologies
(Figure 4). It can result from generation of reactive oxygen species which initiates lipid
peroxidation at the endothelial cell surface.164 This oxidant stress may induce cytokine

36
production and stimulate an inflammatory state. Apart from free radical derived endothelial
injury, exposure to homocysteine causes further endothelial injury by converting the
antithrombotic endothelium to a prothrombotic endothelium through tissue factor
expression and increased factor XII activity.167 Homocysteine also decreases protein C
activation and inhibits thrombomodulin expression thereby increasing factor V and factor
VIII activity.167 In addition, homocysteine suppresses heparin sulfate expression, a natural
inhibitor of thrombin.167 Homocysteine can also limit fibrinolysis by inhibiting the binding
of tissue-type plasminogen activator to its endothelial cell receptor- annexin II (Figure 4).
All of these changes have as their final common action facilitation of a thrombotic
process167 which can contribute to the hyperviscosity seen in vaso-occlusive crisis.
With respect to the vasodilator properties of the endothelium, homocysteine compromises
the production of endothelial nitric oxide (NO) (Figure 4). Normally, endothelial cells
prevent generation of the sulfhydryl group induced oxygen free radicals (O⁻₂, H₂O₂, OH⁻)
by increasing the production and release of nitric oxide and increasing NOS (nitric
oxide synthase) mRNA levels. Binding of NO and homocysteine leads to the formation of S-
nitroso- homocysteine.168 S-nitroso-homocysteine has vasodilatory and platelet anti-
aggregation properties and does not support H₂O₂ generation. This protective action of
nitric oxide, however, is eventually overcome by chronic exposure of the endothelial cell
to hyperhomocysteinaemia resulting in homocysteine-mediated oxidative injury to the
endothelium. Furthermore, O⁻₂ generated from auto-oxidation of the sulfhydryl group
combines with NO resulting in the formation of peroxynitrite (OONO⁻), a powerful
oxidant.168 Thus, further reducing nitric oxide levels. In addition, the antioxidant enzyme
glutathione peroxidase is reduced in hyperhomocysteinaemia through reduction of
glutathione peroxidase mRNA levels.165 Glutathione peroxidase catalyses the reduction of
both hydrogen and lipid peroxides to their corresponding alcohols. Inhibition of
37
glutathione peroxidase is in conjunction with oxidation of its co-substrate, reduced
glutathione (GSH) causing a relative deficiency of GSH.169 This impaired endothelial
oxidative defence mechanisms potentiates H₂O₂ mediated nitric oxide inactivation with
resulting endothelial dysfunction. Another mechanism that limits NO bioavailability is
the decrease in NO synthesis through homocysteine-dependent asymmetrical
dimethylarginine (ADMA) generation. ADMA acts as a potent endogenous inhibitor of
nitric oxide synthase (NOS) enzyme.170 Intravascular haemolysis in sickle cell anaemia
results in reduction of NO (Figure 1). In the presence of hyperhomocystienaemia, NO
levels may be further reduced which can worsen endothelial damage and increase the
tendency for vaso-occlusion.
With regards to homocysteine’s relationship to white cells, invivo studies in rats show that
hyperhomocysteinaemia enhances the interaction between leucocytes and endothelial cells via
leucocyte integrins CD11 b/CD18.171 This may worsen the obstruction to blood flow created
by sickle cells.

38
Figure 4: The relationship between homocysteine and vascular endothelium, nitric oxide
and red blood cell, adapted from Cristiana, Zamosteanu and Abu.172
Hcy- homocysteine, NOS-nitric oxide synthase, NO-nitric
oxide, Hcy-NO- S-nitroso-homocysteine, HcyS-SHcy-
homocystine, GPx- glutathione peroxidase, SOD- superoxide
dismutase, ADMA- asymmetrical dimethylarginine,
Prot-SHcy–homocysteine complexed with plasma proteins
+/- represents activation/inhibition
Endothelium cell
-
39
CHAPTER THREE
AIM AND OBJECTIVES
AIM
• To establish a relationship between serum homocysteine levels and the severity
of haemolysis and vaso-occlusion in patients with sickle cell anaemia (SCA) with
a view to further classify the clinical phenotypes of SCA, if possible.
OBJECTIVES
The specific objectives of this study are to
1. Determine serum homocysteine, folate and vitamin B12 levels in adult SCA
patients in steady state, hyperhaemolytic crises and vaso-occlusive crises and
compare with those of Hb AA controls;
2. Assess the relationship between serum homocysteine and frequency and severity
of vaso-occlusive crises of SCA;
3. Determine disease severity scores of SCA patients in the steady state;
4. Assess the relationship between serum homocysteine, folate and vitamin B12
levels and disease severity scores in the steady state of SCA;
5. Determine the markers of haemolysis (lactate dehydrogenase, indirect bilirubin,
reticulocyte count) in steady state and crises of SCA;
6. Assess the relationship between serum homocysteine levels and markers of
haemolysis in the steady state of SCA; and
7. Determine the level of compliance of SCA patients to routine medications (folic
acid).

40
CHAPTER FOUR
MATERIALS AND METHODS
STUDY SUBJECTS AND LOCATION
Participants in the study were recruited between December 2014 and April 2015. Subjects
with SCA who participated in the study were recruited from among patients with
SCA receiving care at the adult out-patient sickle cell clinic and the adult accident and
emergency unit of the Lagos University Teaching Hospital, (LUTH) Lagos, Nigeria; while
apparently healthy subjects with no known medical conditions served as controls and were
recruited from among members of staff of the hospital and volunteer blood donors. LUTH
is a major tertiary healthcare facility, located in the south-western part of Nigeria, within
Lagos metropolis. It is one of the largest teaching hospitals in the country with a bed-space
of 800 and 70-80% bed occupancy. It is a government- funded hospital providing
multidisciplinary tertiary healthcare service for the over nine million inhabitants of Lagos
state and its environs.
STUDY DESIGN AND ETHICAL CONSIDERATIONS
This was a cross-sectional, comparative study comprising of four arms. The first arm
consisted of subjects with SCA who were in steady state (Group A); the second arm
consisted of subjects with SCA who were admitted on account of a vaso-occlusive crisis,
primarily painful crisis (Group B); the third arm consisted of subjects with SCA who
had hyperhaemolytic crisis (Group C) and the fourth arm consisted of apparently healthy
individuals with haemoglobin AA (Hb AA) phenotype.
The study protocol was approved by the Health Research and Ethics Committee of LUTH
and all participants gave a written informed consent before being recruited into the study.
41
INCLUSION CRITERIA
Subjects with SCA:
Subjects were recruited into the SCA arm of the study if they:
1. Were at least 18 years old.
2. Had a confirmed diagnosis of SCA (screened by sickling test and diagnosed
by cellulose acetate electrophoresis at pH 8.4).
3. Were in steady state, painful vaso-occlusive crisis or hyperhaemolytic crisis.
Individuals with HbAA:
Apparently healthy volunteers were recruited into the control arm of the study if they:
1. Were at least 18 years old.
2. Had haemoglobin AA phenotype (confirmed by cellulose acetate electrophoresis
at pH 8.4).
EXCLUSION CRITERIA
For both subject and control arms, participants were excluded from the study if any of
the following conditions were present:
1. Evidence of kidney disease.
2. A history of thyroid dysfunction.
3. Use of medications known to influence plasma homocysteine levels such as
phenytoin and methotrexate.

42
SAMPLE SIZE DETERMINATION
The major thrust of this study was to determine homocysteine levels in sickle cell anaemia-
a condition noted for its increased demand for folic acid. It is assumed that in this
state of increased folate demand, mean serum homocysteine levels will be at least in
excess of 2SD plus the mean value of homocysteine of subjects with haemoglobin
AA (i.e the control population).
In a previous study of plasma homocysteine level in patients with cardiovascular
diseases,173 the mean homocysteine level in the control arm of that study was reported to
be 8.92 µmol/L with a SD of 2.4 µmol/L.173 Therefore, it was assumed that in the
population of patients with sickle cell anaemia, mean plasma homocysteine level
maybe as high as: 8.9 + 2 x 2.4 =13.7 µmol/L. Mean homocysteine levels in Hb AA
control population with that of patients with sickle cell anaemia was calculated as thus;174
Sample size (n) = (u + v) 2 (∂12 +∂0
2)
(µ1 - µ0) 2
u = one sided percentage point of the normal distribution corresponding to 100% less the
power of study. Using 90 %;
u = 10 % = 1.28.
v = percentage point of the normal distribution corresponding to the two sided
significant level. Significance set at 5 %.
v = 1.96.
µ1 - µ0 = difference between the general population mean and study mean population.173
µ`1 = 13.7 µmol/L , µ0 = 8.9 µmol/L
∂1, ∂0 = standard deviation for the study population and general population respectively.173
∂1 = 2.4 µmol/L, ∂0 = 2.4 µmol/L
Thus, the desired sample size of the study was calculated as follows:

43
n = (u + v)2 (∂12 + ∂0
2) = (1.28 + 1.96)2 (2.42 +2.42) =25.2
(µ1 - µ0) (13.7 - 8.9)
The 10% attrition rate was calculated as; 25.2 X 10
100
= 2.52
25 + 2.52 = 27.52
The sample size calculated for each arm of the study population was 28; therefore, total
sample size is 28 X 4 = 112. A total of 110 subjects were recruited into the study; 25 SCA
patients in steady state (Group A), 30 SCA patients in vaso-occlusive crisis (Group B),
29 in hyperhaemolytic crisis (Group C) and 26 individuals with Hb AA.
Information on the patients’ medications and medical history (disease complications) were
obtained from the case notes.
DEFINITION OF TERMS
Steady state –The period free of crisis extending from at least three weeks since the last
clinical event and three months or more since the last blood transfusion, to at least one week
before the start of a new clinical event.49
Vaso-occlusive crisis- Onset of pain (bone and joint pains or multiple sites of pain) that
lasts for at least four hours for which there is no other explanation other than vaso-
occlusion and which requires therapy with parenteral opioids in a medical setting.65
Hyperhaemolytic crisis – A significant decrease in haemoglobin concentration from
steady state value with evidence of increased red blood cell destruction [with or
without reticulocytosis > 25 % from baseline and/or presence of nucleated red blood cells in
peripheral blood] in the absence of other identifiable causes of red cell destruction
[splenic or hepatic sequestration].65

44
ASSESSMENT OF DISEASE SEVERITY
The disease severity was assessed using the modified scoring system by Hedo et al175
(Appendix II). The severity of painful crisis was assessed (within 24 hours of admission)
using the numeric rating pain scale61 (Appendix II).
ASSESSMENT OF FOLIC ACID COMPLIANCE
The degree of compliance with routine medication was assessed via patient recall using a
drug compliance assessment tool by Unni E.J176 (Appendix II).
LIST OF EQUIPMENT
1. BS – 3000T SINNOWA micro plate Elisa reader, Nianjin, China
2. Roche –Hitachi 902 chemical autoanalyzer, Roche Diagnostics, Switzerland
3. Sysmex KX21 haematology autoanalyzer, USA
4. Model 802 Gallenkomp centrifuge, England
5. Olympus CX23 microscope, China
6. Model SM-8B waterbath, surgifield medical, England
7. Haemoglobin electrophoresis tank, Helena biosciences, Europe
LIST OF KITS
1. Axis Shield Diagnostics homocysteine ELISA kit (Axis-Shield Diagnostics, United
Kingdom) - Lot number: 802901412; Manufacture date: 18/12/2014; Expiry date:
02/10/2015
2. Axis Shield Diagnostics holocobalamin ELISA kit (Axis-Shield Diagnostics, United
Kingdom) - Lot number: 802901977; Manufacture date: 20/12/2014; Expiry date:
12/10/2015
3. Uscn Life Science Inc folate ELISA kit (USCN Life Science Incorporation, USA) -
Lot number: L150430307; Manufacture date: 28/04/2015; Expiry date: 30/10/2015
45
SPECIMEN COLLECTION AND PREPARATION
The world health organization (WHO) hand hygiene technique177 was observed for
every clinical and laboratory procedure.
Ten milliliters of venous blood was obtained from each study participant. For patients in
crises state, samples were collected within 24 hrs of presentation. Five milliliters of this
was dispensed into a potassium ethylene diamine tetra-acetate (K3EDTA) specimen
bottle. This sample was used for a complete blood count including a peripheral blood film
and reticulocyte count. In the case of individuals in the Hb AA arm of the study, part of the
blood collected in the K3EDTA specimen bottle was used for cellulose acetate
electrophoresis test. Two milliliters of blood was transferred into a plain tube and put on
ice for homocysteine estimation. The sample was centrifuged and the serum supernatant
was transferred to new cryovials and stored at -80oC at the Central Research Laboratory
(CRL) of the College of Medicine University of Lagos (CMUL), Lagos, Nigeria; until it
was analysed. Three milliliters of blood was dispensed into plain plastic tubes. The sample
was centrifuged and the serum supernatant was aliquoted into cryovials and stored at -
800C at the Central Research Laboratory (CRL), CMUL until it was analyzed. This
sample was used for serum folate, vitamin B12, LDH and bilirubin assays. All samples
collected were labeled with a serial number allocated to each study participant.

46
METHODS
Serum homocysteine, folate and vitamin B12 were determined by the enzyme linked
immunosorbent assay method (ELISA).
ASSAY OF SERUM HOMOCYSTEINE
A commercial ELISA kit manufactured by Axis-Shield Diagnostics, United Kingdom was
used for the quantitative determination of homocysteine in serum.178 Low, normal and
high level controls as well as calibrators of known homocysteine concentration were assayed
in duplicate during each run.
Principle of assay for serum homocysteine178
In this assay, protein-bound homocysteine in the samples will be reduced to free
homocysteine by dithiothreitol (DTT) and enzymatically converted to S-adenosyl-L-
homocysteine (SAH) by SAH hydrolase and excess adenosine (in a separate procedure
prior to the immunoassay).179 The solid-phase ELISA that follows these pretreatment
reactions is based on competition for binding sites on a monoclonal mouse anti-SAH
antibody between SAH in the sample (as well as controls and calibrators) and the
immobilized SAH bound to the walls of the microtitre plate. After a wash stage to remove
unbound antibody, a secondary rabbit anti-mouse antibody labelled with horse raddish
peroxidase (HRP) is added. The peroxidase activity is measured spectrophotometrically at
a wavelength of 450 nm; after the addition of a substrate and the absorbance is inversely
related to the concentration of total homocysteine.
Reagent preparation
• All reagents and microtitre strips were equilibrated to room temperature before use.
• All reagents were mixed by gentle inversion.
47
• The sample preparation solution (SPS) was freshly prepared before the assay.
• The wash buffer solution was diluted 1:10 with distilled water before use.
Sample pre-treatment procedure
• Sample Preparation Solution (SPS) was made by mixing 54 mL Reagent A (assay
buffer), 3 mL Reagent B (adenosine /DDT) and 3 mL Reagent C (SAH hydroxylase).
• Samples were diluted in plastic tubes by adding 500 μL of SPS into 25 μL of sample
and mixed properly.
• All sample tubes were capped and incubated at 37 °C for 30 minutes.
• 500 μL of reagent D (enzyme inhibitor) was added and properly mixed.
• This mixture was incubated at 25 °C for15 minutes.
• 500 μL of reagent E (adenosine deaminase) was added and mixed properly.
• And incubated at 25 °C for 5 minutes.
This pretreatment procedure was followed by the microplate procedure
Microtitre plate procedure:
• 25 μL of diluted pre-treated samples, 25 μL of calibrator sample and 25 μL
control samples were pipetted into their respective wells of the SAH-coated microtitre
plate.
• 200 μL of reagent F (Monoclonal mouse-anti-S-adenosyl-Lhomocysteine-antibody)
was added to each well.
• This was incubated at 25 °C for 30 minutes. The microtitre plate was covered
with parafilm during incubation.
• After incubation, the wells were washed with 400 μL of diluted wash buffer three
times.
48
• Thereafter, 100 μL of reagent G /enzyme conjugate (Anti-mouse-antibody enzyme
conjugate, BSA, horse radish peroxidase) was added to each well.
• This was incubated at 25 °C for 20 minutes.
• The wells were was washed again with 400 μL of diluted wash buffer three times.
• 100 μL reagent H /substrate solution (Tetramethylbenzidine) was then added to each
well and incubated at 25 °C for 10 minutes.
• 100 μL reagent S /stop solution (0.8 M Sulphuric acid) was added to each well
and thereafter shaken gently.
• The absorbance of each well was read within 15 minutes using a spectrophotometer
(BS– 3000T SINNOWA micro plate Elisa reader) set at 450 nm.
Interpretation of results
A calibration curve was plotted with the calibrator concentration on the x-axis and
the corresponding mean absorbance on the y-axis. The calibrator range was from 2.0
to 50.0 μmol/L. (2 μmol/L - 4 μmol/L - 8 μmol/L - 15 μmol/L - 30 μmol/L - 50 μmol/L).
The homocysteine concentration in the samples and controls were determined by
interpolation from the calibration curve. The concentration of homocysteine in the low,
medium and high controls fell within the range specified on the vial labels.
Quality control
A set of low, medium and high level human sera controls ranging from 6 to 25 μmol/L
(6.4 μmol/L - 10.3 μmol/L – 21.4 μmol/L) of homocysteine was provided by Axis-
Shield Diagnostics, United Kingdom.

49
Reference range
Reference range of total homocysteine is 5-15 µmol/L.180 Hyperhomocysteinaemia occurs
with levels above 15µmol/L and it has been classified as mild- 15-30 µmol/L, moderate-
>30-100µmol/L, and severe >100 µmol/L.180
ASSAY OF SERUM FOLATE
A commercial ELISA kit manufactured by USCN Life Science Incorporation, USA was
used for the quantitative determination of folate in serum.
Calibrators/standards of known folate concentration from assay kit as well as low, normal
and high level controls from RANDOX Laboratories, United Kingdom were assayed in
duplicate during each run.
Principle of assay for serum folate181
This assay employs the competitive inhibition enzyme immunoassay technique. An
antibody specific for folate (vitamin B9/VB9) was pre-coated onto the microtitre plate by
manufacturer. A competitive inhibition reaction is launched between biotin labeled
vitamin B9 (VB9) and unlabeled VB9 (samples, controls and calibrators/standards) with
the pre-coated antibody specific for VB9. After incubation the unbound conjugate is
washed off. Next, avidin conjugated to Horseradish Peroxidase (HRP) is added to each
microtitre plate well and incubated. The amount of bound HRP conjugate is inversely
proportional to the concentration of VB9 in the sample. The reaction is terminated by the
stop solution and the microtitre plate is read at 450 nm wavelength using BS – 3000T
SINNOWA micro plate Elisa reader. The concentration of VB9 is inversely proportional to
the intensity of colour developed.

50
Reagent preparation
• All reagents and microtitre strips were equilibrated to room temperature before use.
STANDARD/ CALIBRATOR
• The standards were reconstituted with 0.5 ml of standard diluent. This
reconstitution produced a 20,000 pg/mL stock solution.
• This was left at room temperature for 10 minutes.
• It was thereafter shaken gently (not to foam) to begin serial dilutions.
• 5 tubes were prepared containing 0.6 mL standard diluent and labelled 2-6.
• A triple dilution series was produced by- removing 300 µL from the 20,000 pg/mL
stock solution (tube 1) and transferring into tube 2, this was mixed; then 300 µL
of diluted standard from tube 2 was transferred into tube 3, mixing was done; 300
µL of diluted standard from tube 3 was transferred into tube 4, it was mixed; and
finally, 300 µL of diluted standard was transferred from tube 4 into tube 5 and then
mixed.
• Tubes 1-5 were diluted standard of 20,000 pg/mL, 6,666.7 pg/mL, 2,222.2 pg/mL,
740.7 pg/mL, 246.9 pg/mL respectively. Tube 6 which contained the standard diluent
was the blank-0 pg/mL.
DETECTION REAGENT A AND DETECTION REAGENT B
• The stock detection A and detection B were briefly centrifuged before use and
thereafter 120 μL each of detection A and detection B was diluted with 12 mL each of
assay diluent A and B, respectively.
WASH SOLUTION
• Wash solution was prepared by diluting 20 mL of wash solution concentrate with
580mL of distilled water (600 mL of wash solution).
51
Assay procedure
• 50 μL of diluted standards, samples and controls were put into their respective wells.
• 50 μL of detection reagent A was added to each well immediately.
• The plate was gently shaken and covered with a plate sealer.
• This was incubated for 1 hour at 37 oC.
• After incubation, it was washed with 350 μL of wash solution three times and
decanted completely.
• 100 μL of detection reagent B working solution was thereafter added to each well,
gently mixed and incubated for 30 minutes at 37oC. The microtitre plate was covered
with a plate sealer during incubation.
• After incubation, the microtitre plate was washed with 350 μL of wash solution five times.
• 90μL of substrate solution was then added to each well, gently mixed and incubated for
25 minutes at 37oC.
• 50μL of stop solution was added to each well and mixed gently.
• The microtitre plate was read immediately at 450 nm with a microplate reader (BS –
3000T SINNOWA micro plate Elisa reader).
Interpretation of results
A calibration curve was plotted with the calibrator/standard concentration on the x-axis and
the corresponding mean absorbance on the y-axis. The calibrator/standard concentration
ranges from 246.91-20000 pg/mL (20000 pg/mL, 6666.67 pg/mL, 2222.22 pg/mL,
740.74 pg/mL, 246.91 pg/mL).
The VB9 concentration in the samples and controls were determined by interpolation from
the calibration curve. The concentration of BV9 in the low, normal and high level
controls fell within the range specified on the vial labels.
52
Quality control
• A set of low, normal and high level human sera controls of VB9 by RANDOX
Laboratories, UK were used (2,400 pg/mL - 4,800 pg/mL - 18,000 pg/mL).
Reference range182
Reference range of VB9 in adults is 2,000 - 20,000 pg/mL or 2 – 20ng/ml. VB9
deficiency occurs with concentrations < 2,000pg/mL. These values in pg/mL have been
converted to the S.I unit nmol/L by the conversion factor 0.002266. The reference range
in nmol/L is 4.5- 45.3nmol/L.
ASSAY OF SERUM VITAMIN B12
A commercial ELISA kit manufactured by Axis-Shield Diagnostics, United Kingdom was
used for the quantitative determination of holotranscobalamin (HoloTC)/active-B12 in
serum.183,184 Low and high level controls as well as calibrators of known
holotranscobalamin concentration were assayed in duplicate during each run.
Principle of assay for serum vitamin B12183
The microtitre wells are coated with a highly specific monoclonal antibody for active
vitamin B12 (holotranscobalamin). During the first incubation holotranscobalamin in
serum, controls and calibrators specifically binds to the antibody-coated surface. In the
second incubation, the conjugate (alkaline phosphatase-labelled murine monoclonal
antibody to human transcobalamin) binds to any captured holotranscobalamin. The
wells are then washed to remove unbound components. Bound holotranscobalamin is
detected by incubation with the substrate. Addition of stop solution terminates the reaction,
resulting in a coloured end-product. The microtitre plate is then read at 405 nm
wavelength. The concentration of holotranscobalamin in pmol/L is directly related to the
colour generated.

53
Reagent preparation
• All reagents and microtitre strips were equilibrated to room temperature before use and
all reagents were mixed by gentle inversion.
• A vial of the wash buffer solution was diluted with 175 mls of distilled water before use.
Sample preparation
• Prior to assay, 150 μL of pre-treatment buffer was added to 150 μL of patient sample
Assay protocol
• 100 μL of pre-treated patient samples, calibrators and kit controls were put into
appropriate wells and incubated at 25 °C for 70 minutes.
• The microtitre strip contents were thereafter decanted by quick inversion over a
sink and blotted with paper towels.
• 100 μL conjugate was then added to each microtitre well and incubated at 25 °C for
40 minutes.
• The microtitre strip contents were again decanted by quick inversion over a sink and
blotted with paper towels.
• The microtitre wells were washed five times with 250 μL of diluted wash buffer.
The microtitre plate was decanted and blotted after each wash addition.
• 100 μL substrate was added to each well and incubated at 25 °C for 40 minutes.
• 100 μL stop solution was added to each well, in the same order and rate as the
substrate and gently mixed.
• Within 120 minutes of addition of stop solution, the microtitre plate was read using
a microwell reader (Acurex plate read ELISA plate analyser) at 405 nm.
54
Interpretation of results
A calibration curve was plotted with the calibrator concentration on the x-axis and
the corresponding mean absorbance on the y-axis. The calibrator concentrations were:
0 pmol/L - 10 pmol/L - 25 pmol/L - 40 pmol/L - 92 pmol/L - 160 pmol/L.
The holotranscobalamin concentration in the samples and controls were determined by
interpolation from the calibration curve. The concentration of holotranscobalamin in the
low and high controls fell within the range specified on the vial labels.
Quality control
• A set of low and high level human sera controls of holotranscobalamin was provided
by Axis-Shield Diagnostics, United Kingdom (low 15 to 35 pmol/L; high 36 to 84
pmol/L).
Reference range
• Reference range of holotranscobalamin is 21 – 123 pmol/L.182 Vitamin B12
deficiency occurs with concentrations < 25 pmol/L.185
FULL BLOOD COUNT ANALYSIS
Full blood count analysis was performed by a laboratory scientist on the K3EDTA
anticoagulated blood samples using the Sysmex KX21 haematology autoanalyzer, USA.
Assay principle of complete blood count analysis186
The KX-21 performs analysis of 18 parameters in blood and detects the abnormal samples.
The KX-21 employs three detector blocks (WBC detector block; RBC detector block and
haemoglobin detector block). The WBC count is measured by the WBC detector block
using the DC (direct current) detection method. The RBC count and platelet count are
taken by the RBC detector block, also using the DC detection method.
55
In the direct current (DC) detection method, as direct current resistance changes, the blood
cell size is detected as electric pulses. Blood cell count is calculated by counting the
pulses and a histogram of blood cell sizes is plotted by determining the pulse sizes.
The haemoglobin detector block measures the haemoglobin concentration using the
non- cyanide haemoglobin method.
Non-cyanide hemoglobin analysis method rapidly converts blood haemoglobin to
oxyhaemoglobin and methaemoglobin into oxyhaemoglobin. When irradiated beam from
the light emitting diode (LED) is applied to the sample in the haemoglobin flow cell,
haemoglobin is measured by deducting absorbance of the diluent from samples'
absorbance.
Procedure
• All samples and controls were properly mixed before each procedure.
• The machine was turned on after which a self and background check was run (the
machines were calibrated at installation).
• Analysis mode was selected to analyse control blood sample which was aspirated via
the sample probe when the start button was pressed.
• The control results were within the acceptable control levels.
• Whole blood mode was then selected and sample number was set.
• The sample was set to the sample probe and the start button was pressed to aspirate.
• Results of analysis was then displayed on machine screen.
Analysis parameters:
WBC (white blood cell count), RBC (red blood cell count), HGB (haemoglobin),
HCT(haematocrit), MCV (mean corpuscular volume), MCH (mean corpuscular
haemoglobin), MCHC (mean corpuscular haemoglobin concentration), PLT (platelet),
RDW-SD (RBC distribution width-standard deviation), RDW-CV (RBC distribution

56
width-coefficient of variation), PDW (platelet distribution width), MPV (mean platelet
volume), P-LCR (platelet large cell ratio), lymphocyte percentage ratio and absolute count
(LYM% /LYM#), neutrophil percentage ratio and absolute count (NEUT% /NEUT#),
percentage ratio and absolute count of the basophils, eosinophils and monocytes (MXD%/
MXD#).
Quality control
Two levels of control –low and high were run in duplicate with each run.
Interpretation of results187, 188
Reference values for complete blood count in adults with African ancestry:
Hb - 11.3-11.4 g/dL (male); 10.5-11.4 g/dL (female)
RBC- 3.6- 5.7 x 10¹²/L
MCV- 77.4-100.9 fl
PLT-115-342 x 109/L
WBC- 2.8-7.8 x 10⁹/L
N- 1.3-4.2 x 10⁹/L
L- 1.1-3.6 x 10⁹/L
PERIPHERAL BLOOD FILM EXAMINATION189, 90
Examination of peripheral blood films to check for sickle cells and nucleated red blood cells
in SCA subjects was done using K3EDTA anticoagulated blood sample.
Principle of peripheral blood film exmination
Microscopic examination of a well-prepared and well-stained blood smear is an important
diagnostic screening tests used in the evaluation and detection of abnormal blood cells. It also
evaluates the morphology and maturation of red blood cell, white blood cell and platelet.

57
Leishman stain is a Romanowsky stain that contains acidic (eosin Y) and basic dyes (azure B).
Eosin has affinity for basic components and stains the basic components of blood cells such as
haemoglobin which stains pink and eosinophil grannules which stains orange-red. Conversely,
azure B has affinity for acidic components and stains the acidic components of blood cells such
as nucleic acids and nucleoprotein which stains mauve-purple and violet, grannules of
basophils which stain dark blue-violet and the cytoplasm of monocytes and lymphocytes which
stains blue or blue grey.
Reagent and sample preparation
A well-mixed whole blood sample in K3EDTA bottle, Leishman staining solution and pH
6.8 buffered water and immersion oil.
Procedure for making and staining of blood films
• A drop of well-mixed K3EDTA blood sample was placed at about 1 cm from the
frosted end of a clean slide.
• A clean smooth edge spreader slide was then paced in front of the drop of blood at
an angle of 30 degrees.
• The spreader was drawn back to touch the drop of blood and fill the angle between
the 2 slides. The drop of blood was spread along the slide and a film of about two-
thirds of the slide was made (in severely anaemic subjects, the angle of the slide
was increased to 70 degrees and spread quickly).
• The slide(s) was labelled and air dried immediately.
• After drying, the slide(s) was stained by covering the blood film with Leishman
stain for 2 minutes, thereafter, double the volume of buffered water was added
which was properly mixed and allowed to stain for 10 minutes.
• The stain was washed off in tap water, the back of the slide was wiped clean and
set upright to dry.

58
Identification of sickle cells: presence of elongated sickle shaped red blood cells on
the peripheral blood film
Counting the number of nucleated red blood cell189 Using oil/100x power on an
Olympus microscope, the nucleated red blood cells were counted in the area of the smear
where red cells were just touching each other. Ten high power fields were observed
and the number of nucleated red cells (NRBCs) seen were counted. The total NRBC
counted was expressed as the number of NRBC / 100 WBC.
Calculation of corrected WBC count189
When 10 or more nucleated red cells (NRBCs) were seen, the white blood cell count
was corrected using a corrected white blood cell (WBC) count formula;
WBC count x 100
Total number of NRBC per 100 WBC +100
Quality control
= Corrected WBC Count
1) The quality of properly made blood films were assessed by physical appearance –
a) Thick at one end with a gradual transition to thin portion.
b) Thinning out to a smooth rounded feather edge.
c) Occupied 2/3 of the total slide area.
d) Did not touch any edge of the slide.
e) Was free from lines and holes
2) Consistency in the staining procedure was maintained by following the
standard operating procedure.

59
3) Newly stained slides were compared with control stained blood films. Well-
stained smear had pink-colored red cells and the nuclei of the leukocytes was purple,
with well- differentiated chromatin and parachromatin.
Interpretation of results189
Nucleated red cells (NRBC) are not normally seen in peripheral blood film of an adult.
The presence of NRBC is an indicator of pathology due to an increase in erythroid
activity, disruption of bone marrow barrier / damage to the marrow micro-architecture or
activation of erythropoiesis.
RETICULOCYTE COUNT ESTIMATION
Reticulocyte count was estimated by the manual technique using new methylene blue
staining method on the K3EDTA anticoagulated blood samples.
Principle of reticulocyte count estimation191
The reticulocyte is a non-nucleated immature red cell containing residual RNA. A
supravital stain; new methylene blue, is used to precipitate the RNA into dark-blue filaments
or granules to identify reticulocytes.191 The number of reticulocytes in the circulating blood
provides an index of bone marrow activity. A high reticulocyte in anaemic patients indicates
appropriate bone marrow response while a low reticulocyte count indicates low bone
marrow response.
Reagent and sample preparation
A well-mixed K3EDTA whole blood sample; new methylene blue staining solution.

60
Test procedure
• 2 drops of new methylene blue was put into a plastic tube.
• Thereafter, 2 drops of well-mixed EDTA blood sample was added to the dye solution.
• This blood sample/dye solution mixture was properly mixed. For anaemic samples,
more blood was added to the mixture.
• The mixture was incubated at 37 °C for 20 minutes.
• The red cells were re-suspended by gentle mixing and 3 good smears were made,
labelled and dried.
Counting: Using oil/100x power, 500 red cells were counted each on two slides. The
mature red cells and reticulocytes were counted from the feather edge to body of smear.
A total of 1000 red cells were counted. Reticulocytes appeared greenish with blue
precipitates of ribonucleic acid. Two “dots” or more was counted a reticulocyte. Control
smears were also counted.
Quality control: The 500 red blood cells (RBC) on each of the two slides agreed within ±
15% of each other. Control smears also read within the assayed range.
Calculation191
Total red cells counted = 1000
1) Expressed as a percentage
=
number of reticulocytes counted
1000 X 100%
2) Expressed as an absolute number = reticulocyte % X RBC count/cmm
3) Corrected reticulocyte count; correction for the degree of anaemia =
reticulocyte % x patient’s PCV
normal PCV
4) Reticulocyte production index; correction for reticulocyte maturation time in circulation
corrected reticulocyte count =
maturation time in days

61
Maturation time--------------haematocrit%
1day---------------------------<45
1.5day---------------------------<35
2days---------------------------<25
2.5days---------------------------<15
Interpretation of results191
The range of absolute reticulocyte count / reticulocyte percentage in adults is:
50 - 100 × 109/L / 0.5 % – 2.5 %
Reticulocyte Index <1 %, Reticulocyte Count <0.5 % = low reticulocyte count
Reticulocyte Index >3 %, Reticulocyte Count >2.5 % = high reticulocyte count
Absolute reticulocyte count < 50 × 109/L = low reticulocyte count
Absolute reticulocyte count >100× 109/L = high reticulocyte count
HAEMOGLOBIN ELECTROPHORESIS
Control subjects were tested for Hb AA phenotype using the cellulose acetate
electrophoresis test on the K3EDTA anticoagulated blood samples.
Principle of haemoglobin electrophoresis192
When haemoglobin, a negatively charged protein is subjected to electrophoresis at alkaline
pH, it migrates toward the anode (+).
Very small samples of haemolysates prepared from whole blood are applied to cellulose
acetate paper. The haemoglobins (Hb) in the sample are separated by electrophoresis using
an alkaline buffer (pH 8.4). Structural Hb variants that have a change in the charge on
its surface will separate from Hb A.

62
Preparation of cellulose acetate paper and electrophoretic tank
• 3 sheets of cellulose acetate paper were soaked in alkaline buffer for 5 minutes.
• The electrophoresis tank was then prepared by placing equal amounts of alkaline buffer
in each of the outer buffer compartments of the electrophoretic tank.
• Two filter papers were put in the buffer and placed along each divider/bridge support,
while ensuring that they make good contact with the buffer.
• The chamber was then covered to prevent buffer evaporation.
Procedure
• One ml whole blood sample to three millilitres of haemolysate reagent, this was well
mixed and allowed to stand for 5 minutes.
• 5 μL of the sample hemolysates as well as known Hb phenotype controls were placed
into the wells of the sample well plates using a micro dispenser.
• The applicator was then primed by depressing the tips into the sample wells 3 times.
This loading was applied to a piece of blotter paper.
• The already wet cellulose acetate paper was removed from the buffer and blotted
firmly between two blotters.
• The applicator was again loaded by depressing the tips into the sample wells twice
(samples and controls) which was applied promptly to the cellulose acetate paper and
pressed down and held for 5 seconds.
• The cellulose acetate paper was quickly placed across the bridges in the
electrophoretic chamber with the blotted side facing down and sample end towards the
cathodic side of the chamber (-).
• The chamber was covered and the electrophoretic tank was set at 350 V for 25 minutes.
63
• Thereafter, the cellulose acetate paper was removed, blotted once, using clean
blotting paper and left to dry.
Interpretation of results
The cellulose acetate paper was inspected visually for the presence of abnormal
haemoglobin (Hb) bands. The controls from known haemoglobin phenotypes provided a
marker for Hb C, S, F and A migration and band identification.
The normal haemoglobin phenotype is AA. Common Hb abnormalities include:
1) Sickle cell trait- AS, showing Hb A, Hb S.
2) Sickle cell anemia – SS, showing almost exclusively Hb S, ± small amount of HbF.
3) Sickle-C disease – SC, demonstrating Hb S and Hb C.
Quality Control:
Controls made from a combination of Hb S and Hb C trait samples (AS, AC) and normal
cord blood (Hb A, Hb F) were used with each run of haemoglobin electrophoresis.
Reference values
The major hemoglobin present in adults is Hb A with up to 3.5% Hb A2 and less than 2%
Hb F . 192
ASSAY OF SERUM BILIRUBIN AND SERUM LACTATE DEHYDROGENASE
Serum bilirubin and lactate dehydrogenase (LDH) were performed by a laboratory scientist
on serum samples using the Roche/Hitachi 902 chemical autoanalyzer according to the
manufacturer’s protocol.

64
Principle of serum lactate dehydrogenase assay193, 194
Lactate Dehydrogenase (LDH), is an enzyme that converts lactate and NAD
(nicotinamide adenine dinucleotide) to pyruvate and NADH respectively. The rate at which
NADH is formed is determined by the rate of absorbance and is directly proportional to
enzyme activity.
Principle of serum bilirubin assay193, 194
Total bilirubin is coupled with diazonium salt DPD (2,5-dichlorophenyldiazonium
tetrafluoroborate) in a strongly acidic medium (pH 1.5). The intensity of the colour of
the azobilirubin produced is proportional to the total bilirubin concentration and can be
measured photometrically.
Assay procedure
• The Roche/Hitachi 902 chemical autoanalyzer was turned on.
• All vials of control serum, calibrators and diluent were brought to room
temperature before reconstitution.
• The calibration for specific assay (lactate dehydrogenase/ bilirubin) was selected.
• The calibrators were put in the machine analyzer tube according to
manufacturer’s specifications.
• The control for specific assay (lactate dehydrogenase/ bilirubin) was selected.
• Three levels of controls 1, 2, 3 (low, normal and high) were provided by
Roche Diagnostics.
• Calibrators and standard were run in duplicate.
• A calibration report was drawn up by the machine which was printed to and
verified, the quality control samples were within the manufacturer’s specifications.

65
• Thereafter, each test specimen and sample reagent were dispensed into an
appropriately barcoded analyzer tube and the monitor was requested to run the
samples.
• The analyte activity were automatically calculated and collated by the
Roche/Hitachi 902 chemical autoanalyzer computer system.
Interpretation of results182
Reference interval for lactate dehydrogenase in adults is 120-300 U/L.
Reference interval for direct bilirubin: 0 - 0.2 mg/dL; indirect bilirubin: 0.1-1.0 mg/dL;
total bilirubin- 0.1 - 1.2 mg/dL.
STATISTICAL ANALYSIS
Data obtained was entered into a Microsoft Excel spread sheet and analysed using the
statistical package for social science software (SPSS Inc, Chicago, IL) 2012, version 21
and presented using tables and figures. Continuous variables are presented as means and
standard deviation (SD), while categorical variables are presented as percentages.
Comparison of means was carried out using the student’s t-test and analysis of
variance where appropriate while chi-square test was used to compare data from
categories- discontinuous variables. Pearson’s correlation coefficient was used to
determine the relationship between variables, within and between groups. The level of
statistical significance was defined as p <0.05.
66
CHAPTER FIVE
RESULTS
Age and sex distribution of subjects and controls
A total of 84 subjects and 26 controls were studied. The subjects consisted of 25 in Group
A, 30 subjects in Group B and 29 in Group C. The mean age of controls (27.5 ± 6.6 years)
were not significantly different from the mean age of Hb SS subjects in Group A (24.9 ±
5.2 years, p = 0.116), in Group B (24.9 ± 5.9 years, p = 0.142) and those in Group C (24.9
± 5.3 years; p = 0.110; Table 2).
There was no significant difference in the proportion of males to females between the
different groups of the study (p > 0.05).

67
Table 2: Age and sex distribution of subjects and controls
p-
valu
es
Mea
n ±
SD
TO
TA
L
40-4
9
30-3
9
20-2
9
<20
AG
E
(YR
S)
27.6
± 6
.6
14
(53.8
%)
0
(0%
)
8
(30.8
%)
5
(19.2
%)
1
(3.8
%)
M
Hb
AA
con
trols
(n=
26)
12
(46.2
%)
2
(7.7
%)
4
(15.4
%)
5
(19.2
%)
1
(3.8
%)
F
26
(100%
)
2
(7.7
%)
12
(46.2
%)
10
(38.5
%)
2
(7.7
%)
TO
TA
L 0
.116 (N
S)
24.9
± 5
.2
10
(40.0
%)
0
(0%
)
1
(4.0
%)
7
(28.0
%)
2
(8.0
%)
M
Stea
dy sta
te
(Gro
up
A)
(n=
25)
15
(60.0
%)
1
(4.0
%)
2
(8.0
%)
10
(40.0
%)
2
(8.0
%)
F
25
(100
%)
1
(4.0
%)
3
(12.0
%)
17
(68.0
%)
4
(16.0
%)
TO
TA
L 0
.142 (N
S)
24. 8
± 5
.9
17
(56.7
%)
0
(0%
)
2
(6.7
%)
13
(43.3
%)
2
(6.7
%)
M
Vaso
occlu
sive crisis
(Gro
up
B)
(n=
30)
13
(43.3
%)
2
(6.7
%)
1
(3.3
%)
7
(23.3
%)
3
(10.0
%)
F
30
(100%
)
2
(6.7
%)
3
(10.0
%)
20
(66.7
%)
5
(16.6
%)
TO
TA
L 0
.110 (N
S)
24.9
± 5
.3
16
(55.2
%)
0
(0%
)
4
(13.8
%)
10
(34.5
%)
2
(6.7
%)
M
Hyp
erhaem
oly
tic
Crisis (G
rou
p C
)
(n=
29)
13
(44.6
%)
1
(34.4
%)
0
(0%
)
9
(31.0
%)
3
(10.3
%)
F
29
(100%
)
1
(3.4
%)
4
(14.0
%)
19
(65.5
%)
5
(17.2
%)
TO
TA
L
NB: p – values are the comparison of group means with controls
KEY: NS –Not statistically significant.

68
The mean haematological parameters of subjects and controls
The mean value of haemoglobin (Hb), haematocrit (Hct), white blood cell (wbc) and
platelet (plt) count were determined for subjects and controls as shown in Table 3.
The mean Hb and Hct were significantly lower in each of the groups of SCA subjects
when compared with controls (p < 0.001). Group C subjects showed significantly lower
mean Hb (6.4 ± 0.9 g/dl) and Hct (18.7 ± 2.4 %) when compared with both Group A (8.3 ±
2.1 g/dl and 23.8 ± 3.8 %) and Group B subjects (8.1 ± 1.2 g/dl and 24.6 ± 3.5 %); p <
0.001. While the mean Hb and Hct levels did not differ significantly between Groups A and
B subjects (p > 0.05).
The mean WBC count was significantly higher in each of the Hb SS groups when
compared with controls. Similarly, a significant increase in the WBC count occurred in
both Groups B and C when compared with Group A (p < 0.01). The WBC count of
subjects in Group C (15.0 ± 5.0 x 10⁹/L) was significantly higher than that of subjects in
Group B (12.7 ± 6.1 x 10⁹/L; p = 0.047).
There was also a significantly higher mean platelet count in each of the Hb SS study
groups when compared with controls (p = 0.001, 0.031 and 0.001 for Groups A, B and C
respectively). There was no significant difference in mean platelet count between subjects
in Group C and both Groups A and B subjects (p > 0.05). Whereas, there was a
significantly higher platelet count in Group B subjects when compared with Group A
subjects (p = 0.028).

69
Table 3: Comparison of mean haematological parameters of subjects and controls
Haematological
Parameters
Steady state
(Group A)
(n=25)
Mean ± (SD)
Vasoocclusive
crisis
(Group B)
(n=30)
Mean ± (SD)
Hyperhaemolytic
crisis (Group C)
(n= 29)
Mean ± (SD)
Hb AA
controls
(n=26)
Mean ± (SD)
p - values
Hb (g/dl) 8.3 ± 2.1 8.0 ± 1.1 6.4 ± 0.9 11.7 ± 1.2 < 0.001* <0.001**
<0.001 ***
0.467****(NS)
<0.001*****
<0.001******
Hct (%) 23.8 ± 3.8 24.6 ± 3.5 18.7 ± 2.4 35.6 ± 3.7 <0.001* <0.001 **
<0.001***
0.467**** (NS)
<0.001*****
<0.001******
WBC(x 109/L) 8.7 ± 3.4 12.7 ± 6.1 15.0 ± 5.0 4.9 ± 0.9 <0.001* <0.001**
<0.001***
0.003****
<0.001*****
0.047******
PLT (x109/L) 333.4±114.3 267.6 ± 118.0 293.4 ± 103.5 211.2 ± 62.0 0.031*
0.001**
0.001***
0.028****
0.193*****(NS)
0.341******
(NS)
KEY: NS – Not statistically significant
* p value for VOC vs Hb AA (comparing VOC and Hb AA controls).
** p value for hyperhaemolytic crisis vs Hb AA (comparing hyperhaemolytic
crisis and Hb AA controls).
*** p value for steady state vs Hb AA control (comparing steady state and Hb AA
controls).
**** p value for VOC vs steady state (comparing VOC and steady state).
***** p value for hyperhaemolytic crisis vs steady state (comparing
hyperhaemolytic crisis and steady state).
****** p value for hyperhaemolytic crisis vs VOC (comparing
hyperhaemolytic crisis and VOC).

70
Comparison of mean values of red cell indices in subjects and controls
The red cell indices: MCV (mean cell volume), MCH (mean cell haemoglobin) and RDW
(red cell distribution width) of subjects and controls were determined and presented in
Table 4.
In Group C subjects, the mean MCV (92.2 ± 6.9 fl) and MCH (31.1 ± 3.7pg) were
significantly higher than those of Group A subjects (MCV- 85.5 ± 8.8 fl, MCH- 28.2 ±2.9
pg) and control groups (MCV- 86.4 ± 4.9 fl, MCH- 28.0 ± 1.6 pg; p < 0.01). While in
Group B subjects, the mean MCV and MCH were not significantly different from those of
Groups A, C and control subjects (p > 0.05). Similarly, there was no difference in mean
MCV and MCH between Group A subjects and controls (p > 0.05).
As shown in Table 4, the mean MCHC was significantly higher in Group C subjects (33.8
±2.1 g/dl) compared with both controls (32.7 ± 1.1 g/dl) and Group B subjects (32.69 ±
1.86 g/dl; p = 0.027 and 0.020 respectively). It was however not significantly different from
Group A subjects (33.1 ± 2.0 g/dl). No significant difference was demonstrable when the
mean MCHC in Group B subjects were compared with the mean MCHC of both Group
A subjects and controls (p > 0.05). Similarly, no significant difference was seen in the mean
MCHC between Group A subjects and controls (p > 0.05).
The mean RDW was significantly higher in each of the Hb SS study groups when
compared with controls (p < 0.001). Also, there was a significant difference in the mean
RDW when Group C was compared with the Group B ( p = 0.032). No significant
difference was observed in the mean RDW of Group A subjects and the other Hb SS groups
– (B and C; p >0.05).

71
Table 4: Comparison of mean values of red cell indices in subjects and controls
Haematological
Parameters
Steady state
(Group A)
(n=25)
Mean ± (SD)
Vasoocclusive
crisis
(Group B)
(n=30)
Mean ± (SD)
Hyperhaemolytic
crisis (Group C)
(n= 29)
Mean ± (SD)
Hb AA
controls
(n=26)
Mean ± (SD)
p - values
MCV (fl) 85.5 ± 8.8 88.3 ± 9.2 92.2 ± 6.9 86.4 ± 4.9 0.370* (NS) <0.01 ** 0.663 *** (NS) 0.182**** (NS) <0.01***** 0.050****** (NS)
MCH (pg) 28.2 ± 2.9 30.8 ± 11.0 31.1 ± 3.7 28.0 ± 1.6 0.102* (NS) <0.01 ** 0.905***(NS) 0.134****(NS) <0.01***** 0.851****** (NS)
MCHC (g/dl) 33.1 ± 2.0 32.69 ± 1.86 33.8 ± 2.1 32.7 ± 1.1 0.978*(NS) 0.027** 0.376***(NS) 0.346**** (NS) 0.194*****(NS) 0.020******
RDW (%) 21.0 ± 2.5 20.6 ± 2.6 21.9 ± 2.5 12.9 ± 1.1 <0.001* <0.001 ** <0.001*** 0.691**** (NS) 0.096*****(NS) 0.032******
KEY: NS – Not statistically significant
* p value for VOC vs Hb AA (comparing VOC and Hb AA controls).
** p value for hyperhaemolytic crisis vs Hb AA (comparing hyperhaemolytic
crisis and Hb AA controls).
*** p value for steady state vs Hb AA control (comparing steady state and Hb
AA controls).
**** p value for VOC vs steady state (comparing VOC and steady state).
***** p value for hyperhaemolytic crisis vs steady state (comparing
hyperhaemolytic crisis and steady state).
****** p value for hyperhaemolytic crisis vs VOC (comparing
hyperhaemolytic crisis and VOC).
72
Serum homocysteine (hcy), folate and vitamin B12 levels of subjects and Hb controls
The serum homocysteine, folate and vitamn B12 levels of Hb SS subjects and controls
were determined and presented in Table 5.
The mean serum homocysteine level in each of the Hb SS groups was higher than the
control group. However, the difference reached statistical significance only in Group C
(13.1 ± 5.5 µmol/L vs 9.9 ± 2.5 µmol/L; p < 0.01). The mean serum homocysteine level
among Group C subjects was significantly higher than values found in Group A (10.3 ± 2.3
µmol/L; p < 0.01). The mean serum homocysteine level was not significantly different
between subjects in Group B vs Group C and between Groups B vs Group A (p > 0.05).
As shown in Table 6, the percentage of Group C subjects with
hyperhomocysteinaemia (homocystine >15 µmol/L) was 31.03%, while in Group B,
23.33% had hyperhomocysteinaemia. There was no significant difference in the
proportion of hyperhomocysteinaemic subjects in Group B and the
hyperhomocysteinaemic subjects in Group C (p > 0.05). Furthermore, when the serum
folate levels of hyperhomocysteinaemic Group B and C subjects was compared, no
significant difference was observed (p > 0.05). Similarly, no significant difference was seen
when serum folate levels of Group B and C normo-homocysteinaemic subjects were
compared (p > 0.05). There was no observed difference in the markers of haemolysis (RPI,
absolute reticulocyte count, LDH and indirect bilirubin) between the
hyperhomocysteinaemic subjects in Group B and the hyperhomocysteinaemic subjects
in Group C (p > 0.05).
In this study, the mean serum folate level in each of the Hb SS study groups was lower than
those of controls (12.9 ± 6.8 nmol/L). However, the difference reached statistical
significance only in the hyperhaemolytic crisis group (12.9 ± 6.8 nmol/L vs 9.9 ± 5.5
73
nmol/L; p = 0.042). No significant difference was observed in the mean serum folate level
between the Hb SS crises subjects (Groups B and C) and Group A subjects (p > 0.05).
However, when Group B subjects were compared with Group C subjects, the mean serum
folate was significantly higher in the Group B (12.7 ± 2.1 nmol/L vs 9.9 ± 5.5 nmol/L; p =
0.036). There was no significant difference in the mean serum vitamin B12 level between
each of the Hb SS study groups and controls. Similarly, no significant difference was
observed between both Groups B and C and Group A subjects. Also, no statistical
significant difference was observed between Group C and the control group (p > 0.05).
When the relationship between serum homocysteine levels and folate and vitamin B12
levels among Group A subjects was assessed, there was no significant correlation
between serum homocysteine and folate levels (r = 0.266; p > 0.05). There was a
negative correlation between serum homocysteine levels and vitamin B12 levels in Group A
subjects, however; this failed to reach statistical significance (r = - 0.346; p > 0.05).

74
Table 5: Comparison of mean homocysteine (hcy), folate and B12 levels of subjects
and controls
Haematological
Parameters
Steady state
(Group A)
(n=25)
Mean ±(SD)
Vasoocclusive
crisis
(Group B)
(n=30)
Mean ± (SD)
Hyperhaemolytic
crisis (Group C)
(n= 29)
Mean ± (SD)
Hb AA
controls
(n=26)
Mean±(SD)
p - values
Homocysteine
(hcy)
(µmol/L)
10.3 ± 2.3 11.9 ± 4.5 13.1 ± 5.5 9.9 ± 2.5 0.073*(NS)
<0.01**
0.754***(NS)
0.145****(NS)
<0.01*****
0.288******(NS)
folate
(nmol/L)
11.8 ± 4.1 12.7 ± 2.1 9.9 ± 5.5 12.9 ± 6.8 0.992*(NS)
0.042 **
0.528***(NS)
0.507****(NS)
0.168*****(NS)
0.036******
VitaminB12
(pmol/L)
99.1 ± 30.3 104.9 ± 51.2 91.2 ± 38.5 97.8 ± 28.8 0.496*(NS)
0.534**(NS)
0.904***(NS)
0.583****(NS)
0.460*****(NS)
0.177******(NS)
KEY: NS – Not statistically significant
* p value for VOC vs Hb AA (comparing VOC and Hb AA controls).
** p value for hyperhaemolytic crisis vs Hb AA (comparing hyperhaemolytic
crisis and Hb AA controls).
*** p value for steady state vs Hb AA control (comparing steady state and Hb AA
controls).
**** p value for VOC vs steady state (comparing VOC and steady state).
***** p value for hyperhaemolytic crisis vs steady state (comparing hyperhaemolytic
crisis and steady state).
****** p value for hyperhaemolytic crisis vs VOC (comparing
hyperhaemolytic crisis and VOC).

75
Table 6: Comparison of proportion of subjects with hyperhomocysteinaemia and
normal homocysteine levels in Groups B and C subjects
Subjects
Elevated
homocysteine
values
(> 15 µmol/L)
Normal
homocysteine
values
(5 -15 µmol/L)
No. % No. % Total
VOC
(Group B)
7 23.33 23 76.67 30 (100%)
Hyperhaemolytic
crisis (Group C)
9 31.03 20 68.97 29 (100%)
p values 0.990 (NS) 0.514 (NS)
KEY: NS – Not statistically significant

76
Effect of serum homocysteine, folate and vitamin B12 levels among subjects in
Group B
The mean serum folate and vitamin B12 levels in Group B subjects with elevated
homocysteine levels and normal homocysteine levels were compared as shown in Table 7.
The mean serum folate and vitamin B12 levels were significantly lower in subjects
with hyperhomocysteinaemia compared with those with normal homocysteine levels;
3.7 ± 0.6 nmol/L vs 15.4 ± 5.1nmol/L (p < 0.01) and 73.8 ± 33.6 pmol/L vs 114.4 ± 52.3
pmol/L (p = 0.028) respectively.
There was a demonstrable significant negative correlation between serum homocysteine
and folate levels (r = - 0.705; p < 0.001) -Figure 5. Similarly, a negative correlation existed
between homocysteine and vitamin B12 levels in this population (r = -0.214); however,
this did not reach statistical significance (p > 0.05).

77
Table 7: Comparing mean folate and vitamin B12 levels in hyperhomocysteinaemic
and normohomocysteinaemic subjects in Group B
Parameters Elevated homocysteine
levels (> 15 µmol/L)
(n = 7)
Mean ± (SD)
Normal Homocysteine
levels (5-15 µmol/L)
(n = 23)
Mean ± (SD)
p - values
Serum Folate
(nmol/L)
3.7 ± 0.6 15.4 ± 5.1 <0.01
Serum Vitamin
B12 (pmol/L)
73.8 ± 33.6 114.4 ± 52.3 0.028

78
Figure 5: Correlation between serum homcysteine and folate in subjects in Group B
r = -0.705; p < 0.001 (n = 30)

79
Effect of serum homocysteine, folate and vitamin B12 levels among subjects in
Group C
The mean serum folate and vitamin B12 levels were compared in Group C subjects who
had elevated serum homocysteine and normal serum homocysteine levels (Table 8).
The mean serum folate level was significantly lower in subjects with elevated
homocysteine levels than those with normal homocysteine levels (p < 0.01). However,
while serum vitamin B12 level was lower (81.3 ± 32.8 pmol/L) in subjects with
hyperhomocysteinaemia as compared with vitamin B12 levels in normo-homocysteinaemic
subjects (95.7 ± 40.9pmol/L), this did not reach statistical significance (p > 0.05).
As shown in Figure 6, there was a significant negative correlation between serum
homocysteine and serum folate in Group C (p < 0.001). However, there was no
correlation between serum homocysteine and serum vitamin B12 levels (r = - 0.081; p >
0.05).

80
Table 8: Comparing mean folate levels in hyperhomocysteinaemic and
normohomocysteinaemic subjects in Group C
Parameters Elevated homocysteine
levels (> 15 µmol/L)
(n = 9)
Mean ± (SD)
Normal homocysteine
levels (5-15 µmol/L)
(n = 20)
Mean ± (SD)
p - value
Serum Folate
(nmol/L)
4.1 ± 1.5 12.5 ± 4.6 <0.01
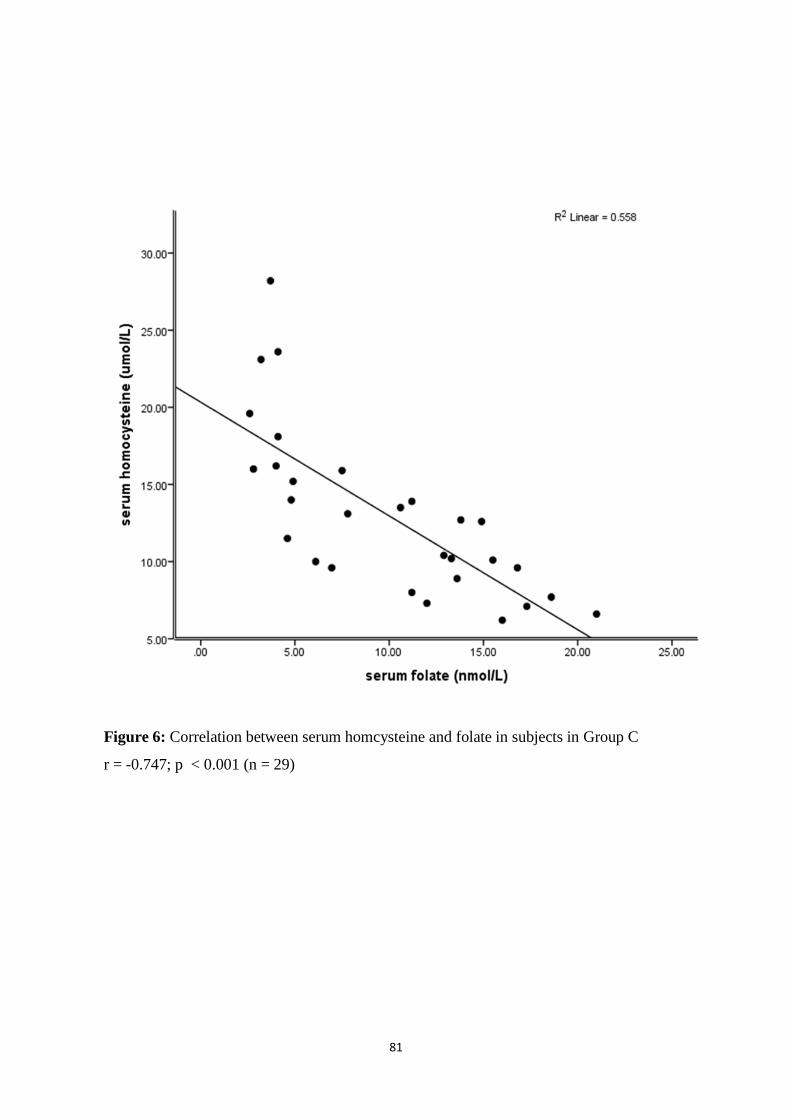
81
Figure 6: Correlation between serum homcysteine and folate in subjects in Group C
r = -0.747; p < 0.001 (n = 29)
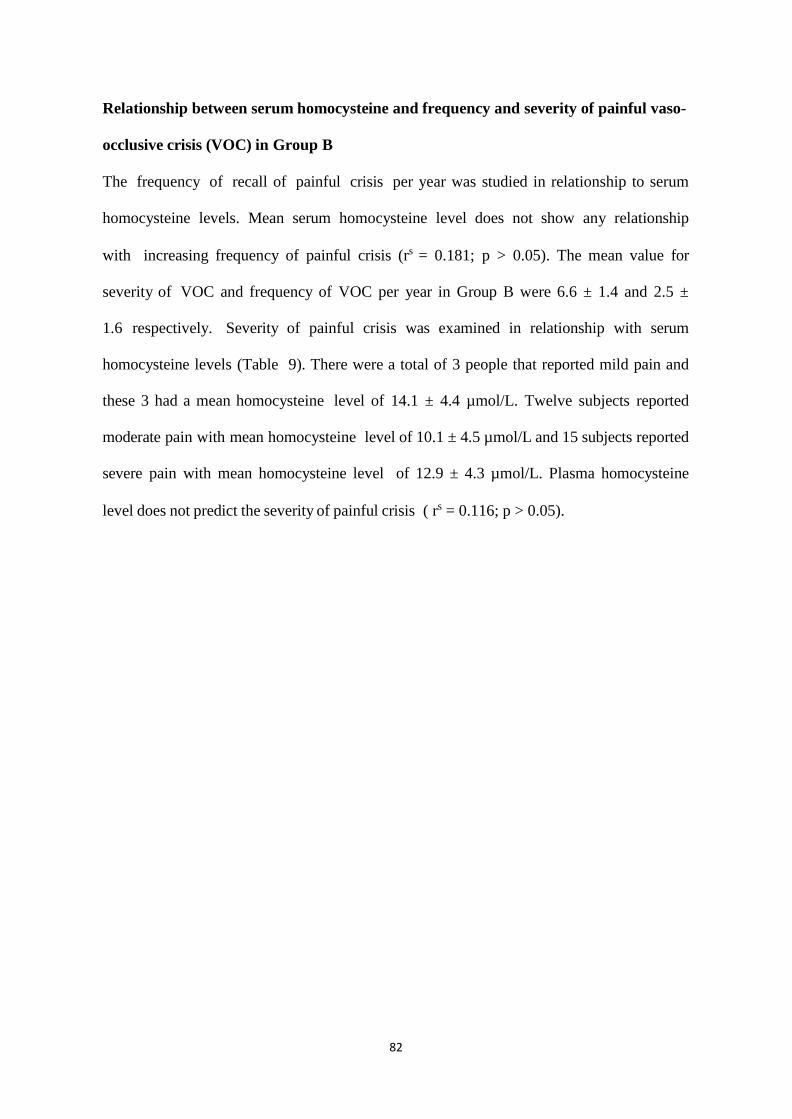
82
Relationship between serum homocysteine and frequency and severity of painful vaso-
occlusive crisis (VOC) in Group B
The frequency of recall of painful crisis per year was studied in relationship to serum
homocysteine levels. Mean serum homocysteine level does not show any relationship
with increasing frequency of painful crisis (rs = 0.181; p > 0.05). The mean value for
severity of VOC and frequency of VOC per year in Group B were 6.6 ± 1.4 and 2.5 ±
1.6 respectively. Severity of painful crisis was examined in relationship with serum
homocysteine levels (Table 9). There were a total of 3 people that reported mild pain and
these 3 had a mean homocysteine level of 14.1 ± 4.4 µmol/L. Twelve subjects reported
moderate pain with mean homocysteine level of 10.1 ± 4.5 µmol/L and 15 subjects reported
severe pain with mean homocysteine level of 12.9 ± 4.3 µmol/L. Plasma homocysteine
level does not predict the severity of painful crisis ( rs = 0.116; p > 0.05).
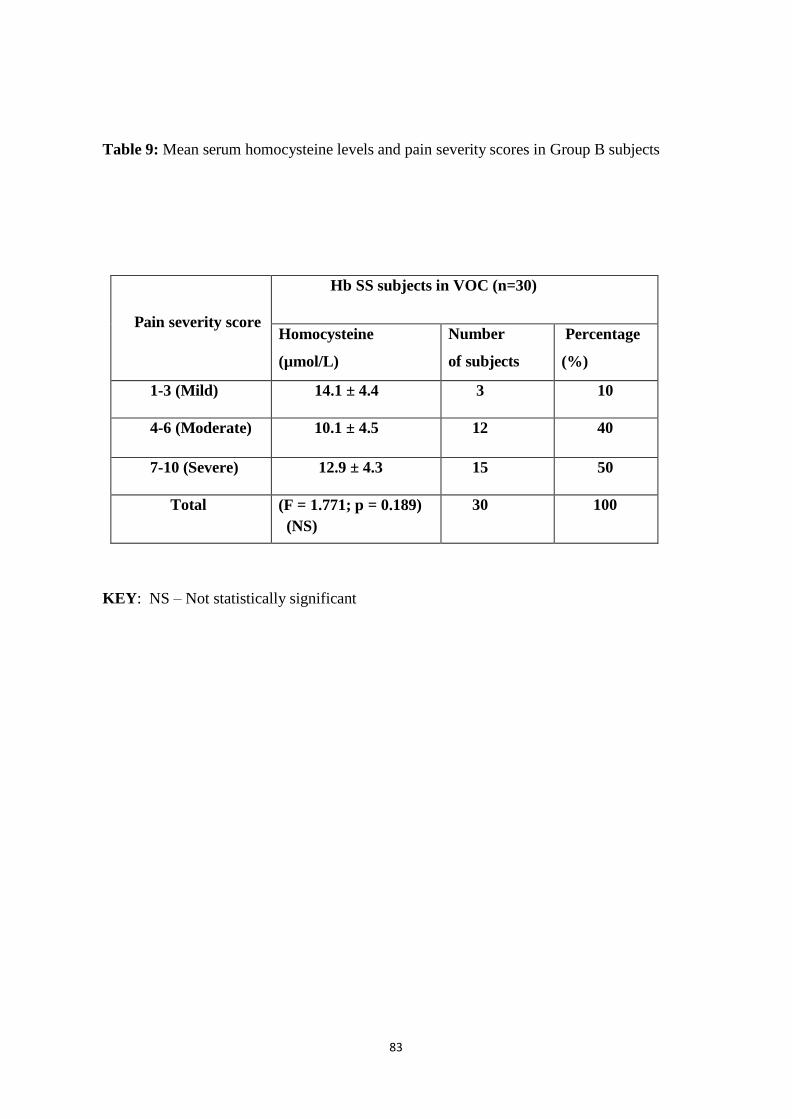
83
Table 9: Mean serum homocysteine levels and pain severity scores in Group B subjects
Pain severity score
Hb SS subjects in VOC (n=30)
Homocysteine
(µmol/L)
Number
of subjects
Percentage
(%)
1-3 (Mild) 14.1 ± 4.4 3 10
4-6 (Moderate) 10.1 ± 4.5 12 40
7-10 (Severe) 12.9 ± 4.3 15 50
Total (F = 1.771; p = 0.189)
(NS)
30 100
KEY: NS – Not statistically significant

84
Relationship between serum homocysteine and disease severity scores in Group A
subjects
Table 10 shows the grading of the disease severity scores of Group A subjects; 10
(40.0%) subjects had mild disease, while 15 (60.0%) subjects had moderate disease
severity scores. There was no subject with a severe disease score (> 7). The mean disease
severity score for subjects in Group A was 3.0 ± 1.4.
The mean homocysteine level of subjects with mild disease (9.8 ± 2.3 µmol/L) was
not significantly different from the mean homocysteine level of subjects with moderate
disease (10.8 ± 2.3 µmol/L; p > 0.05). There was no significant correlation between
serum homocysteine levels and disease severity scores in Group A subjects (rs = 0.102; p >
0.05).

85
Table 10: comparison of disease severity scores and mean homocysteine level in Group A
subjects
Disease severity score
Steady state Hb SS subjects (n=25)
Homocysteine
(µmol/L)
Number
of subjects
Percentage
(%)
≤ 3 (Mild) 9.9 ± 2.3 10 40.0
4-7 (Moderate) 10.8 ± 2.3 15 60.0
Total ( p = 0.465) (NS) 25 100
KEY: NS – Not statistically significant
86
Markers of haemolysis of subjects and controls
The markers of haemolysis evaluated in this study were reticulocyte production index
(RPI), absolute reticulocyte count, lactate dehydrogenase (LDH) and indirect bilirubin.
As shown in table 11, the mean RPI, absolute reticulocyte count and LDH levels of each of
the Hb SS groups were significantly higher than those of Hb AA controls (p < 0.01).
Likewise, in Group C subjects, the mean RPI (4.6 ± 1.0), absolute reticulocyte count (471
± 103.5 x 10⁹/L) and LDH (863.3 ± 98.0 U/L) were significantly higher when compared
with both Group A (RPI- 2.2 ± 1.1, absolute reticulocyte count- 198.3 ± 93.2 x 10⁹/L
and LDH-688.8 ± 238.5 U/L) and Group B subjects (RPI- 2.2 ± 1.2, absolute reticulocyte
count- 197.4 ± 83.9 x 10⁹/L and LDH- 569.7 ± 325.1 U/L; p < 0.01). However, there was
no significant difference in mean RPI, absolute reticulocyte count and LDH level of
Group B subjects when compared with Group A subjects ( p > 0.05). The mean
indirect bilirubin level of the controls (8.7 ± 6.4 mg/dl) was significantly lower than the
mean indirect bilirubin level of Group A subjects (21.9 ± 23.1 mg/dl), Group B (31.1 ± 12.6
mg/dl) and Group C subjects (47.9 ± 23.6 mg/dl; p < 0.01). Group A subjects had
significantly lower mean indirect bilirubin level when compared with both Group B and
C subjects (p < 0.01). Group B subjects had significantly lower mean indirect bilirubin
levels when compared with Group C subjects (p < 0.01).
In this study, there was no correlation between serum homocysteine levels and markers
of haemolysis in Group A subjects (RPI- r = - 0.240; p > 0.05, absolute reticulocyte count-
r = - 0.241; p > 0.05, LDH- r = 0.016; p > 0.05, indirect bilirubin- r = 0.145; p > 0.05).

87
Table 11: Comparison of mean values of markers of haemolysis in subjects and Hb AA
controls
Haematological
Parameters
Steady state
(Group A)
(n=25)
Mean ±(SD)
Vasoocclusive
crisis
(Group B)
(n=30)
Mean ± (SD)
Hyperhaemolytic
crisis (Group C)
(n= 29)
Mean ± (SD)
Hb AA
controls
(n=26)
Mean±(SD)
p - values
Reticulocyte
production
index
(RPI)
2.2 ± 1.1 2.2 ± 1.2 4.6 ± 1.0 0.6 ± 0.3 <0.01* <0.01 **
<0.01***
0.90****(NS)
<0.01*****
<0.01******
Absolute 198.3± 197.4 ± 83.9 471.1 ± 103.5 38.8 ±14.9 < 0.01* Reticulocyte 95.2 <0.01 **
count <0.01***
(x109/L) 0.97****(NS)
<0.01*****
<0.01******
LDH (U/L) 688.8 ± 569.7± 863.3 ± 98.0 234.1 ± <0.01* 238.5 325.1 140.4 <0.01**
<0.01***
0.57****(NS)
<0.01*****
<0.01******
Indirect 21.9 ± 31.1 ± 12.6 47.9 ± 23.6 8.7 ± 6.4 <0.01* bilirubin 23.1 <0.01**
(mg/dl) <0.01***
<0.01****
<0.01*****
<0.01******
KEY: NS – Not statistically significant
* p value for VOC vs Hb AA (comparing VOC and Hb AA controls).
** p value for hyperhaemolytic crisis vs Hb AA (comparing hyperhaemolytic crisis
and Hb AA controls).
*** p value for steady state vs Hb AA control (comparing steady state and Hb AA
controls).
**** p value for VOC vs steady state (comparing VOC and steady state).
***** p value for hyperhaemolytic crisis vs steady state (comparing hyperhaemolytic
crisis and steady state).
****** p value for hyperhaemolytic crisis vs VOC (comparing hyperhaemolytic
crisis and VOC).
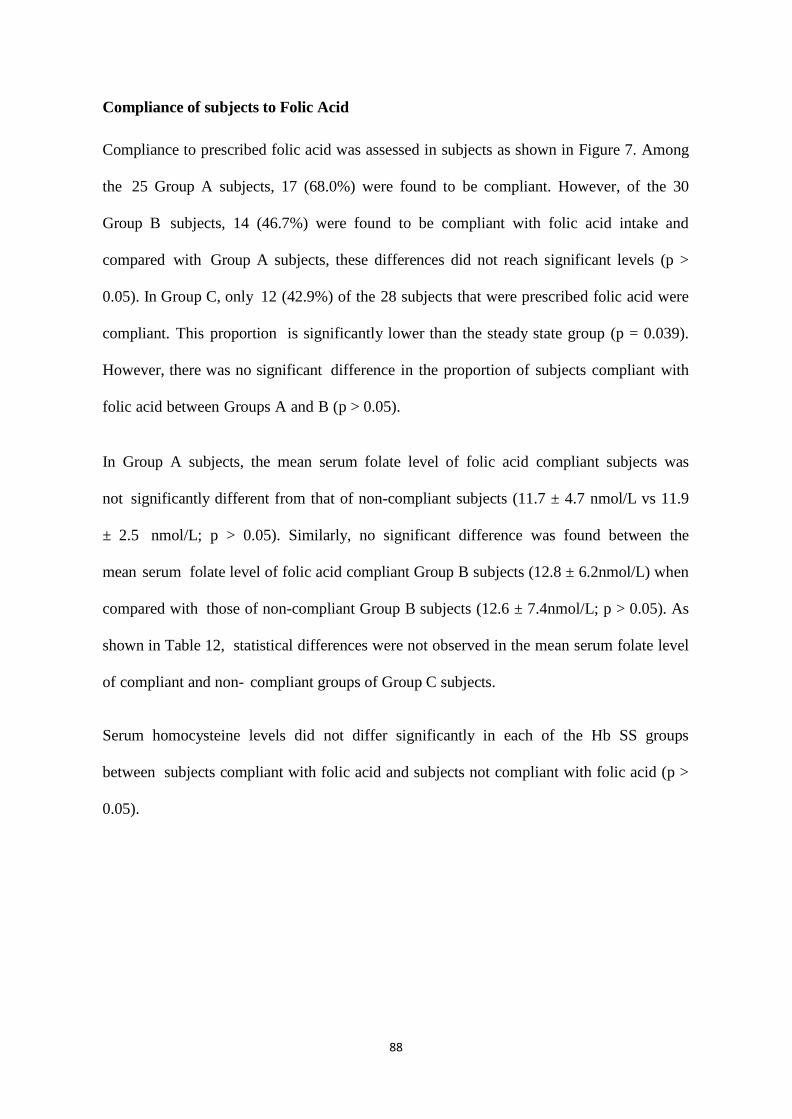
88
Compliance of subjects to Folic Acid
Compliance to prescribed folic acid was assessed in subjects as shown in Figure 7. Among
the 25 Group A subjects, 17 (68.0%) were found to be compliant. However, of the 30
Group B subjects, 14 (46.7%) were found to be compliant with folic acid intake and
compared with Group A subjects, these differences did not reach significant levels (p >
0.05). In Group C, only 12 (42.9%) of the 28 subjects that were prescribed folic acid were
compliant. This proportion is significantly lower than the steady state group (p = 0.039).
However, there was no significant difference in the proportion of subjects compliant with
folic acid between Groups A and B (p > 0.05).
In Group A subjects, the mean serum folate level of folic acid compliant subjects was
not significantly different from that of non-compliant subjects (11.7 ± 4.7 nmol/L vs 11.9
± 2.5 nmol/L; p > 0.05). Similarly, no significant difference was found between the
mean serum folate level of folic acid compliant Group B subjects (12.8 ± 6.2nmol/L) when
compared with those of non-compliant Group B subjects (12.6 ± 7.4nmol/L; p > 0.05). As
shown in Table 12, statistical differences were not observed in the mean serum folate level
of compliant and non- compliant groups of Group C subjects.
Serum homocysteine levels did not differ significantly in each of the Hb SS groups
between subjects compliant with folic acid and subjects not compliant with folic acid (p >
0.05).
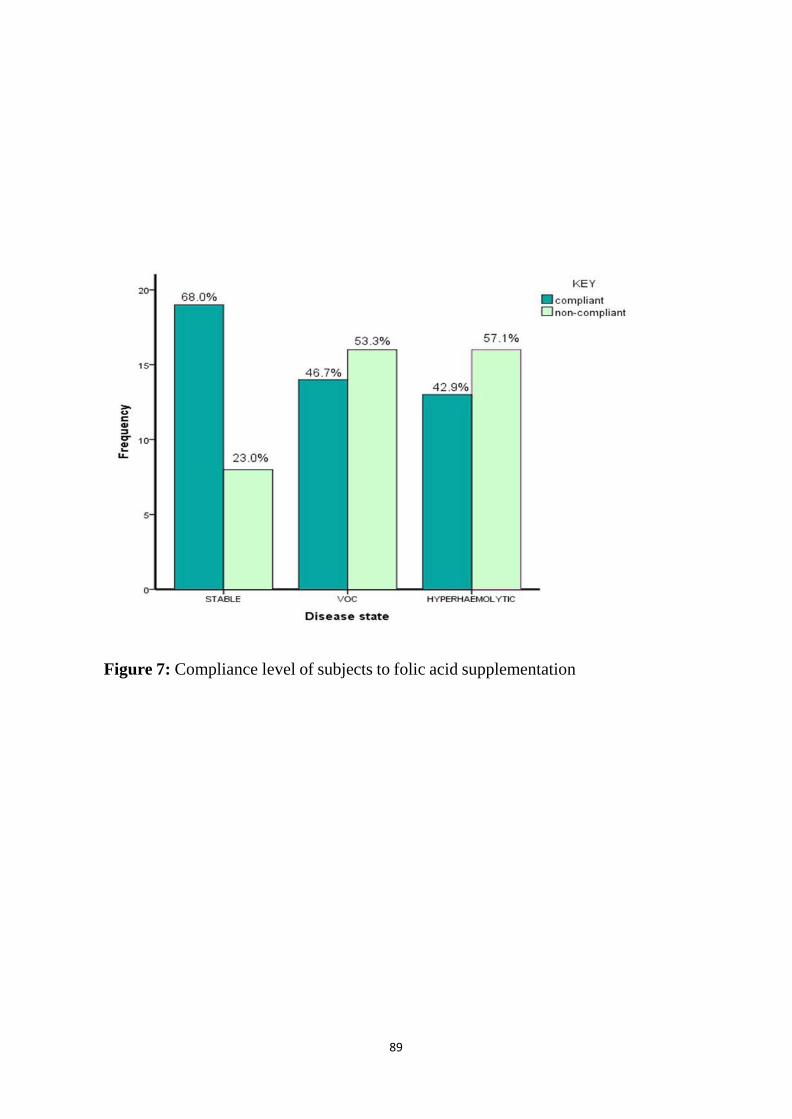
89
Figure 7: Compliance level of subjects to folic acid supplementation

90
Table 12: Relationship between folic acid compliance and mean serum folate
and homocysteine levels in subjects
Parameter
Steady state (Group A)
(n = 25)
Mean ± SD
VOC (Group B)
(n = 30)
Mean ± SD
Hyperhaemolytic (Group C)
(n = 28)
Mean ± SD
Compliant
with folic
acid
Non-
compliant
with folic
acid
Compliant
with folic
acid
Non-
compliant
with folic
acid
Compliant
with folic
acid
Non-compliant
with folic acid
Folate
(nmol/L)
11.4 ± 4.7
11.9 ± 2.5
12.8 ± 6.2
12.6 ± 7.4
10.3 ± 5.6
9.5 ± 5.7
Hcy
(µmol/L)
10.5 ± 2.5
9.8 ± 1.7
13.4 ± 5.3
12.8 ± 5.7
11.0 ± 4.2
12.7 ± 4.8
NB: All were not statistically significant

91
CHAPTER SIX
DISCUSSION
Mean homocysteine level in subjects and controls
Abnormal homocysteine, vitamin B12 and folate levels in SCD have been described in
several studies.7-13 This study showed that the mean serum homocysteine level in each of
the SCA subject groups was higher than those of control subjects. However, only Group C
subjects (13.1
± 5.5 µmol/L vs 9.9 ± 2.5 µmol/L; p < 0.01) demonstrated a significant increase in mean
serum homocysteine level. A study conducted in India, by Sati' Abbas et al,12 also
demonstrated a higher mean homcysteine level when the patient group (6 cases with SCA
and 20 cases with sickle – thalassemia in VOC); was compared with Hb AA controls,
although this was not significant (p > 0.05). These two studies however, contrast with the
study in Ibadan by Olaniyi et al13 in which 60 Hb SS subjects were studied (30 VOC and 30
steady state); the mean plasma homocysteine level was significantly reduced in Hb SS
subjects when compared with the Hb AA control group (p < 0.001). Olaniyi et al
suggested that this finding is a reflection of regular folic acid supplementation in SCA
subjects. Oral supplementation of folate has been shown to lower homocysteine levels
even in the absence of folate deficiency. In the present study, compliance of subjects
to prescribed folic acid was 70.4%, 46.7% and 42.9% in Groups A, B and C respectively.
Group C subjects had significantly lower folic acid compliance rates compared with
Group A subjects (p = 0.039).
The mechanism that may bring about hyperhomocysteinaemia in SCA can be
explained. Increased haemolysis as occurs in SCA is known to be a state of increased
folate demand. Insufficient folate intake particularly when there is hyperhaemolytic crisis

92
results in a fall in plasma folate, red blood cell folate and erythroid blast folate levels.
Folate lack or relative lack results in impairment of cells to convert homocysteine to
methionine, since the methyl group of the N5,N10 MTHF is the source of a unit of
carbon atom that is required to convert homocysteine that is usually generated from
the trans-sulphuration pathway back to methionine.
Mean folate level in subjects and controls
In this study, serum folate level in each of the Hb SS groups was lower than the control
group. However, this was only significant in Group C (12.8 ± 2.2 nmol/L vs 9.9 ± 5.5
nmol/L; p = 0.042). A significantly lower mean folate was also observed when Group
C subjects were compared with the Group B subjects; 12.9 ± 6.8 nmol/L vs 9.9 ± 5.5
nmol/L; p = 0.034). Studies by Olaniyi et al and Sati' Abbas et al, showed lower mean
serum folate in SCA subjects compared with controls respectively, although this was not
significant. The finding of significantly lower mean serum folate in hyperhaemolytic
crisis subjects compared with controls and VOC subjects in this study is not surprising as
hyperhaemolysis is a state of more folate demand compared to the steady state or VOC
state. Furthermore, folate has low body storage levels.
Mean vitamin B12 level in subjects and controls
In this study, the mean serum vitamin B12 level of Group A and B subjects, although
higher than that of controls was not significant. This is similar to the study by Sati'
Abbas et al,12 which also showed higher mean vitamin B12 level in SCD subjects in
VOC when compared with controls, although not significant (p > 0.05). The slightly
higher mean serum vitamin B12 levels seen in the VOC and steady state groups may
not be unrelated to the neutrophilia that is commonly found in SCA as compared with the
Hb AA population. In this study, there was a significantly higher white blood cell count in
93
Hb SS subjects (Groups A, B and C) as compared with Hb AA controls. However, this
finding contrast with that of Olaniyi et al13 which demonstrated significantly lower serum
vitamin B12 levels in Hb SS VOC and steady state groups when compared with controls.
This finding maybe due to decreased intake of dietary vitamin B12 and vitamin B12
supplements as well as transient transcobalamin I deficiency. The present study
demonstrated lower mean serum vitamin B12 level in hyperhaemolytic crisis subjects
compared with the control group. However, this was not statistically significant.
Relationship between serum homocysteine, serum folate and serum
vitamin B12 in subjects
It is known that folate and vitamin B12 are essential vitamins for erythropoiesis, they also
serve as co-enzymes involved in homocysteine metabolism. There was a significantly
lower mean serum folate level in Groups A and B subjects with elevated serum
homocysteine levels (homocysteine > 15 µmol/L) when compared with subjects with
normal serum homocysteine levels (homocysteine 5-15 µmol/L). Thus, the assumption
that folate deficiency may lead to elevated serum homocysteine levels. In the present
study, a negative correlation was observed between serum homocysteine and serum
folate in all subjects, but this was statistically significant only in Hb SS crises subjects
(Groups B and C; p < 0.001). Consistent with this result is the study by Rugani M.A195
conducted in Brazil (who recruited 53 VOC and 105 steady state SCD subjects), that
reported a significant negative correlation between serum homocysteine and serum folate
in study subjects. This correlation further supports the theory that low folate levels will
impair conversion of homocysteine to methionine. On the contrary however, the study by
the Sati' Abbas et al,12 reported no correlation between homocysteine and folate in the
VOC subjects. They inferred that serum pyridoxine (vitamin B6) deficiency was related

94
to hyperhomocysteinaemia in study subjects. The researchers demonstrated a significant
negative correlation between serum homocysteine and serum pyridoxine levels.
Pyridoxine is needed as a co-factor in the transsulphuration pathway to convert
homocysteine to cystathionine, a reaction that is catalysed by the enzyme
cystathionine-β-synthase (CβS).
The present study shows a negative correlation between serum homocysteine levels and
vitamin B12 in all subjects, but this did not reach significant levels. This finding is similar
to the study by the Sati' Abbas et al;12 however, it contrast with that of Rugani M.A195 who
demonstrated a significant negative correlation between mean homocysteine and vitamin
B12 in study subjects.
Markers of haemolysis of subjects and controls
The results obtained in this study show a significant increase in the mean RPI, absolute
reticulocyte count, LDH and indirect bilirubin levels of subjects when compared with
those of controls. This is in agreement with Moreira J.A et al196 and Mikobi T.M. et al197
who studied 50 and 211 SCA subjects in steady state respectively. Moreira J. A et al196
and Mikobi T. M et al197 both demonstrated a significant increase in the mean reticulocyte
count and LDH in SCA subjects when compared to the Hb AA control group.
Reticulocytosis and increased LDH observed in SCA is in response to the chronic
haemolytic state (bone marrow expansion and red cell lysis), which is further increased
during crises.
The results from this study show that in Group A subjects, there was no significant
correlation between serum homocysteine and markers of haemolysis (RPI, absolute
reticulocyte count, LDH and indirect bilirubin). The lack of significant correlation
maybe due to the fact that pathology ( e.g. red cell lysis) due to raised homocysteine

95
levels occurs more commonly when serum homocysteine level exceeds the upper limit
of normal (serum homocysteine >15µmol/L)198. As observed in this study, the mean
serum homocysteine level in steady state SCA group was 10.3 ± 2.3 µmol/L.
Relationship between homocysteine and disease severity
This study showed that there was no significant correlation between serum homocysteine
and disease severity in Group A subjects. Furthermore, Group A subjects were classified
as mild and moderate disease severity with mean serum homocysteine level of 9.9 ± 2.3
µmol/L and 10.8 ± 2.3 µmol/L respectively. There was no statistical difference in serum
homocysteine levels between subjects with mild and moderate disease severity (p >
0.05). Normal mean serum homocysteine level in this group can also explain why there
was no steady state subject who fit into the severe disease score.
The present study did not demonstrate a significant correlation between serum
homocysteine and frequency of recall of painful crisis per year in Group B subjects.
Likewise, there was no significant correlation between serum homocysteine and severity of
painful crisis in Group B subjects. This finding is similar to the study by Rugani M.A195
who did not demonstrate a significant correlation between serum homocysteine and
severity of VOC in SCD. These two studies reported the mean homocysteine level to be
within reference interval (11.89 ± 4.51 and 7.2 ± 2.9 µmol/L respectively). This is however,
in contrast to the study by Sati' Abbas et al,12 that recorded a mean homocysteine level
above the reference interval (44.52 ± 23.008 µmol/L) and demonstrated a significant
positive correlation between serum homocysteine and the frequency of VOC in the study
subjects. They inferred that hyperhomocysteinaemia contributes to initiation of vaso-
occlusive crisis through occlusion of small blood vessels. The difference between the mean
serum homocysteine level in the present study and that of Sati’ Abbas et al can be

96
attributable to difference in geographical location as well as differences in study subjects
(SCA and Sβ thalassemia), more studies will be needed to clarify these differences.
Compliance of subjects to folic acid
With regards to the level of compliance o f su b j ec t s to folic acid supplementation,
this study showed that there was no difference in the mean serum folate level of subjects
compliant with folic acid supplementation when compared with those subjects not
compliant with folic acid supplementation (p > 0.05). Similarly, there was no difference
in mean serum homocysteine level of subjects compliant with folic acid supplementation
and those not compliant with folic acid supplementation (p > 0.05). This is an unexpected
finding which suggests that other factors may be responsible for folate deficiency and
hyperhomocysteinaemia such as polymorphism of MTHFR gene and pyridoxine
deficiency respectively. More studies will be needed to establish this. Non-compliance
to folic acid may suggest inability to get a drug refill, forgetfulness, high pill burden and
drug apathy.
97
CHAPTER SEVEN
CONCLUSION
Evidence from these data show that the mean concentration of serum homocysteine,
folate and vitamin B12 in sickle cell anaemic subjects in steady state and vaso-
occlusive crisis are not significantly different from those of controls.
Subjects in hyperhaemolytic crisis had significantly higher mean serum homocysteine
and significantly lower mean serum folate when compared with controls.
Furthermore, there was a significant difference in mean serum folate level when vaso-
occlusive crisis and hyperhaemolytic crisis subjects with elevated serum
homocysteine levels (serum homocysteine >15 µmol/L) were compared with vaso-
occlusive crisis and hyperhaemolytic crisis subjects with normal serum homocysteine
levels (serum homocysteine 5-15 µmol/L). However, no significant difference was
observed in vitamin B12 levels.
A significant negative correlation was observed between serum homocysteine and
serum folate in both vaso-occlusive and hyperhaemolytic crises subjects. There was
no association between serum homocysteine and serum vitamin B12 level in all
subjects.
There was no difference in both the mean serum homocysteine and mean serum folate
level between SCA subjects compliant on folic acid supplementation and those non-
compliant on folic acid supplementation.
98
CHAPTER EIGHT
LIMITATIONS OF THE STUDY
Cost: Due to the high cost of the Elisa kits and the numbers of parameters measured, the
number of subjects studied could not be increased for a better of representation of the study
outcome.
Power Outage: Due to incessant power failure, samples had to be moved frequently from
one fridge to another. This was responsible for the loss of some samples during storage.

99
CHAPTER NINE
RECOMMENDATIONS
This study demonstrated that the use of higher doses of folate supplement will be beneficial
in Hb SS subjects in crises state to prevent hyperhomocysteinaemia. Hence, a larger study
should be carried out to confirm this preliminary finding.

100
REFERENCES
1. Ashutosh L, Elliott PV. Sickle cell disease. In: Hoffbrand AV, Catosky D, Tuddenham
GD. (eds.) Postgraduate hematology. 5th ed. Malden Massachusette: Blackwell
Publishing Inc; 2005. p. 104-118.
2. Provan D, Singer C.R.J, Baglin T, Lilleyman J. Sickling syndromes. In: Provan D,
Singer C.R.J, Baglin T, Lilleyman J. (eds) Oxford handbook of clinical
haematology. 2nd ed. New York; Oxford University Press Inc; 2004. p. 72-75.
3. World Health Organization. Sickle cell anaemia: a report by the secretariat. World
Health Organization, fifty-ninth World Health Assembly A59/9, provisional
agenda item 11.4; 2006.
4. Akinyanju O. The national burden of sickle cell disorder and the way forward. Sickle
Cell Foundation Nigeria; 2010. p. 1-18. Available from:
www.sicklecellfoundation.com (Assessed March, 2015).
5. Hoffbrand AV, Green R. Megaloblastic Anaemia. In: Hoffbrand AV, Catosky D,
Tuddenham GD. (eds.) Postgraduate hematology. 5th ed. Malden
Massachusette: Blackwell Publishing Inc; 2005. p. 60-84.
6. Selhub J, Jacques PF, Wilson PW, Rush D, Rosenberg IH. Vitamin status and intake
as primary determinants of homocysteinemia in an elderly population. JAMA.
1993; 270: 2693-2698.
7. Dhar M, Bellevue R, Brar S, Carmel R. Mild hyperhomocysteinemia in adult patients
with sickle cell disease: a common finding unrelated to folate and cobalamin
status. Am J Hematol. 2004; 76: 114-120.
8. Kennedy TS, Fung EB, Kawchak DA, Zemel BS, Ohene-Frempong K, Stallings VA.
Red blood cell folate and serum vitamin B12 status in children with sickle cell
disease. J Pediatr Hematol Oncol. 2001; 23: 165-169.

101
9. Lowenthal EA, Mayo MS, Cornwell PE, Thornley-Brown D. Homocysteine elevation
in sickle cell disease. J Am Coll Nutr. 2000; 19: 608-612.
10. Segal JB, Miller ER, 3rd, Brereton NH, Resar LM. Concentrations of B vitamins and
homocysteine in children with sickle cell anemia. South Med J. 2004; 97: 149-155.
11. Pilar M, Accioly E, Padilla P. Micronutrient deficiency in children and adolescents
with sickle cell anemia: A systematic review. Braz J Hematol. 2010; 32: 247-256.
12. Sati'Abbas S, Abul–Razak N, Mustafa N, Abd Ali R. Homocysteine, folic acid,
vitamin B12 and pyridoxine : Effects on vaso-occlusive crisis in sickle cell
anemia and sickle –thalassemia. IPMJ. 2011; 10: 473-479.
13. Olaniyi J, Akinlade K, Atere A, Arinola O. Plasma homocysteine, methyl-malonic
acid, vitamin B12 and folate levels in adult Nigerian sickle cell anaemia patients.
Br J Med Med Res. 2014; 4: 1327-1334.
14. Toole JF, Malinow MR, Chambless LE, Spence JD, Pettigrew LC, Howard VJ, et al.
Lowering homocysteine in patients with ischemic stroke to prevent recurrent
stroke, myocardial infarction and death: The Vitamin Intervention for Stroke
Prevention (VISP) randomized controlled trial. JAMA. 2004; 291: 565-575.
15. Ventura P, Panini R, Tremosini S, Salvioli G. A role for homocysteine increase in
haemolysis of megaloblastic anaemias due to vitamin B(12) and folate
deficiency: results from an in vitro experience. Biochim Biophys Acta. 2004; 1739:
33-42.
16. Papandreou D, Malindretos P, Arvanitidou M, Makedou A, Rousso I. Oral
supplementation of folic acid for two months reduces total serum homocysteine
levels in hyperhomocysteinemic Greek children. PMC. 2010; 14: 105-108.
102
17. Konotey-Ahulu FID. Effect of environment on sickle cell disease in West Africa:
Epidemiologic and clinical considerations. In: Abramson H, Bertles FF and
Wethers DL. (eds.) Sickle dell disease, diagnosis, management, education and
research. St. Louis: CV Mosby Co; 1973. p. 20-38.
18. Herrick JB. Peculiar elongated and sickle shaped red blood corpuscles in a case of
severe anemia. Arch Int Med. 1910; 6: 517-520.
19. Wishner B, Ward K, Lattman E, Love W. Crystal structure of sickle-cell
deoxyhemoglobin at 5 A resolution. J Mol Biol. 1975; 98: 179-194.
20. Fronticelli C, Gold R. Conformational relevance of the beta6Glu replaced by Val
mutation in the beta subunits and in the beta (1–55) and beta (1–30) peptides
of hemoglobin S. J. Biol. Chem. 1976; 251: 4968-4972.
21. Ferrone F, Nagel RL. Polymer structure and polymerization of deoxyhemoglobin S.
In: Steinberg MH, Forget BG, Higgs DR. (eds.) Disorders of hemoglobin:
Genetics, pathophysiology and clinical management. Cambridge: Cambridge
University Press; 2001. p. 577-610.
22. Embury SH, Hebbel RP, Mohandas N, Steinberg MH. Pathogenesis of vasoocclusion.
In: Embury SH, Hebbel RP, Mohandas N, Steinberg MH. (eds.) Sickle cell
disease: Basic principles and clinical practice. New York: Raven Press; 1994. p.
311-326.
23. Conran N, Franco-Penteado CF, Costa FF. Newer aspects of the pathophysiology of
sickle cell disease vaso-occlusion. Hemoglobin. 2009; 33: 1-16.
24. Manwani D, Frenette PS. Vaso-occlusion in sickle cell disease: pathophysiology and
novel targeted therapies. Blood. 2013; 122: 3892-2898.

103
25. Hebbel RP, Boogaerts MA, Eaton JW, Steinberg MH. Erythrocyte adherence to
endothelium in sickle-cell anemia. A possible determinant of disease severity. N
Engl J Med. 1980; 302: 992–995.
26. Solovey A, Lin Y, Browne P. Circulating activated endothelial cells in sickle cell
anemia. N Engl J Med. 1997; 337: 1584-1590.
27. Hebbel RP, Moldow CF, Steinberg MH. Modulation of erythrocyte-endothelial
interactions and the vasoocclusive severity of sickling disorders. Blood. 1981;
58: 947-952.
28. Platt OS, Brambilla DJ, Rosse WF. Mortality in sickle cell disease: life expectancy
and risk factors for early death. N Engl J Med. 1994; 330: 1639-1644.
29. Akenzua GI, Amiengheme OR. Inhibitor of in vitro neutrophil migration in sera of
children with homozygous sickle cell gene during pain crisis. Br J Haematol.
1981; 47: 345-352.
30. Platt OS. The acute chest syndrome of sickle cell disease. N Engl J Med. 2000; 342:
1904-1907.
31. Akinola NO, Stevens SME, Franklin IM, et al. Rheological changes in the prodromal
and established phases of sickle cell vasoocclusive crisis. Br J Haematol. 1992;
81: 598602.
32. Ballas SK, Smith ED. Red blood cell changes during the evolution of the sickle cell
painful crisis. Blood. 1992; 79: 21542163.
33. Ballas SK. The sickle cell painful crisis in adults: phases and objective signs.
Hemoglobin. 1995; 19: 32333.
34. National Heart, Lung, and Blood Institute. Sickle cell anaemia. Bethesda (US):
National Institutes of Health; 2012. Available from: http://www.nhlbi.nih.gov/
health/health-topics/topics/sca/ (Accessed 3rd September 2014).
104
35. Green GA, Kalra VK. Sickling-induced binding of immunoglobulin to sickle
erythrocytes. Blood. 1988; 71: 636-639.
36. Kaul DK, Fabry ME, Windisch P. Erythrocytes in sickle cell anemia are
heterogeneous in their rheological and hemodynamic characteristics. J Clin
Invest. 1983; 72: 22-31.
37. Hebbel RP, Miller WJ. Phagocytosis of sickle erythrocytes: immunologic and
oxidative determinants of hemolytic anemia. Blood. 1984; 64: 733-741.
38. Kuypers FA, Lewis RA, Hua M. Detection of altered membrane phospholipid
asymmetry in subpopulations of human red blood cells using fluorescently
labeled annexin V. Blood. 1996; 87: 1179-1187.
39. Test ST, Kleman K, Lubin B. Characterization of the complement sensitivity of
density-fractionated sickle cells. Blood. 1991; 78(suppl): 202a.
40. Harris JW, Brewster HH, Ham TH, Castle WB. Studies on the destruction of red blood
cells. X. The biophysics and biology of sickle cell disease. AMA Arch Intern
Med. 1956; 97: 145–168.
41. Bensinger TA, Gillette PN. Hemolysis in sickle cell disease. Arch Intern Med. 1974;
133: 624-631.
42. Reiter CD, Wang X, Tanus-Santos JE. Cell free hemoglobin limits nitric oxide
bioavailability in sickle-cell disease. Nat Med. 2002; 8: 1383-1389.
43. Durante W, Johnson FK, Johnson RAl. Arginase: a critical regulator of nitric oxide
synthesis and vascular function. Clin Exp Pharmacol Physiol. 2007; 34: 906-911.
44. Pritchard KA Jr, Ou J, Ou Z, Shi Y, Franciosi JP, Signorino P, et al. Hypoxia-induced
acute lung injury in murine models of sickle cell disease. Am J Physiol Lung Cell
Mol Physio. 2004; 286: 705-714.
45. Wood KC, Hsu LL, Gladwin MT. Sickle cell disease vasculopathy: a state of nitric

105
oxide resistance. Free Radic Biol Med. 2008; 44: 1506-1528.
46. Kato GJ, Gladwin MT, Steinberg MH. Deconstructing sickle cell disease: reappraisal
of the role of hemolysis in the development of clinical subphenotypes. Blood
Rev. 2007; 21: 37-47.
47. Gladwin MT, Sachdev V, Jison ML, Shizukuda Y, Plehn JF, Minter K, et al.
Pulmonary hypertension as a risk factor for death in patients with sickle cell
disease. N Engl J Med. 2004; 350: 886-895.
48. Gladwin MT, Kato GJ. Hemolysis-associated hypercoagulability in sickle cell
disease: the plot (and blood) thickens. Haematologica. 2008; 93: 1-3.
49. Akinola NO, Stevens SM, Franklin IM, Nash GB, Stuart J. Subclinical ischaemic
episodes during the steady state of sickle cell anaemia. J Clin Pathol. 1992; 45:
902- 906.
50. Gustave KK, Dunis S, Mori M. Reduced levels of T-cell subsets CD4+ and CD8+ in
homozygous sickle cell anaemia patients with splenic defects. Heamatol J. 2003;
4: 363-365.
51. Beutler E. Disorders of hemoglobin structure: sickle cell anemiand related
abnormalities. In: Lichtman MA, Beutler E, Kaushansky K. (eds.) Williams
hematology. 7th ed. New York: McGraw-Hill; 2006. p. 667-700.
52. Diggs LW. Sickle cell crises. Am J Clin Pathol. 1965; 44: 1-19.
53. Platt OS, Thorington BD, Brambilla DJ. Pain in sickle cell disease. Rates and risk
factors. N Engl J Med. 1991; 325: 11-16.
54. Serjeant GR, Ceulaer CD, Lethbridge R, Morris J, Singhal A, Thomas PW. The
painful crisis of homozygous sickle cell disease: clinical features. Br J
Haematol. 1994; 87: 586-591.
55. Ballas SK, Delengowski A. Pain measurement in hospitalized adults with sickle cell
106
painful episodes. Ann Clin Lab Sci. 1993; 23: 358-361.
56. Ballas SK, Carlos TM, Dampier C and Guidelines Committee. Guidelines for
standard of care of acute painful episodes in patients with sickle cell
disease. Harrisburg: Pennsylvania department of health; 2000.
57. Gil KM, Abrams MR, Phillips G, Keefe FJ. Sickle cell disease pain: relation of coping
strategies to adjustment. J Consult Clin Psychol. 1989; 57: 725-731.
58. Wong DL, Hockenberry-Eaton M, Wilson D, Winkelstein ML, Schwartz P. Wong's
essentials of pediatric nursing. 6 ed. St. Louis: Mobsy Inc; 2001. p. 1301.
59. Beyer J, Platt A, Kinney T, Treadwell M. Practice guidelines for the assessment of
children with sickle cell pain. J Soc Pediatr Nurses. 1999; 4: 61-73.
60. Marlowe KF, Chicella MF. Treatment of sickle cell pain. Pharmacotherapy. 2002;
22: 484-491.
61. National Institutes of Health. Pain intensity instruments. Warren Grant Magnuson
Clinical Center; 2003. Available from http://www.mvlta.net/ presentations/
mvltcapdf (Accessed 22nd April 2015).
62. Keele KD. The pain chart. Lancet. 1948; 2: 6-8.
63. Soyannwo OA, Amanor-Boadu SD, Sanya AO, Gureje O. Pain assessment in
Nigerians-visual analogue scale and verbal rating scale compared. West Afr J
Med. 2000; 19: 242-245.
64. Shapiro BS. The management of pain in sickle cell disease. Pediatr Clin North Am.
1989; 36: 1029-1045.
65. Ballas SK, Lieff S, Benjamin LJ, Dampier CD, Heeney MM, Hoppe C, et al.
Definitions of the phenotypic manifestations of sickle cell disease. Am J
Hematol. 2010; 85: 6-13.
66. Ballas SK, Marcolina MJ. Hyperhemolysis during the evolution of uncomplicated

107
acute painful episodes in patients with sickle cell anemia. Transfusion. 2006; 46:
105-110.
67. Petz LD, Calhoun L, Shulman IA, Johnson C, Herron RM. The sickle cell hemolytic
transfusion reaction syndrome. Transfusion. 1997; 37: 382-392.
68. Ballas SK, Kesen MR, Goldberg MF, Lutty GA, Dampier C, Osunkwo I, et al. Beyond
the definitions of the phenotypic complications of sickle cell disease: An update
on management. Sci World J. 2012; 2012: 1-55.
69. Bray GL, Muenz L, Makris N, Lessin LS. Assessing clinical severity in children with
sickle cell disease. Preliminary results from a cooperative study. Am J Pediatr
Hematol Oncol. 1994; 16: 50-54.
70. Hatton CS, Bunch C, Weatherall DJ. Hepatic sequestration in sickle cell anaemia. Br
Med J (Clin Res Ed). 1985; 290: 744-745.
71. Stockman JA, Nigro MA, Mishkin MM, Oski FA. Occlusion of large cerebral vessels
in sickle-cell anemia. N Engl J Med. 1972; 287: 846-849.
72. Russell MO, Goldberg HI, Hodson A, Kim HC, Halus J, Reivich M, et al. Effect of
transfusion therapy on arteriographic abnormalities and on recurrence of stroke
in sickle cell disease. Blood. 1984; 63: 162-169.
73. Ohene-Frempong K, Weiner SJ, Sleeper LA, Miller ST, Embury S, Moohr JW, et al.
Cerebrovascular accidents in sickle cell disease: rates and risk factors. Blood.
1998; 91: 288-294.
74. Powars D, Wilson B, Imbus C, Pegelow C, Allen J. The natural history of stroke in
sickle cell disease. Am J Med. 1978; 65: 461-471.
75. Ohene-Frempong K. Stroke in sickle cell disease: demographic, clinical, and
therapeutic considerations. Semin Hematol. 1991; 28: 213-219.
76. Vichinsky EP, Neumayr LD, Gold JI, Weiner MW, Rule RR, Truran D, et al.
108
Neuropsychological dysfunction and neuroimaging abnormalities in
neurologically intact adults with sickle cell anemia. JAMA. 2010; 303: 1823-1831.
77. Adams RJ, McKie VC, Carl EM, Nichols FT, Perry R, Brock K, et al. Long-term
stroke risk in children with sickle cell disease screened with transcranial Doppler.
Ann Neurol. 1997; 42: 699-704.
78. Adams RJ, McKie VC, Brambilla D, Carl E, Gallagher D, Nichols FT, et al. Stroke
prevention trial in sickle cell anemia. Control Clin Trials. 1998; 19: 110-129.
79. Siegel JF, Rich MA, Brock WA. Association of sickle cell disease, priapism,
exchange transfusion and neurological events: ASPEN syndrome. J Urol. 1993;
150: 1480-1482.
80. Balkaran B, Char G, Morris JS, Thomas PW, Serjeant BE, Serjeant GR. Stroke in a
cohort of patients with homozygous sickle cell disease. J Pediatr. 1992; 120:
360- 366.
81. Steinberg MH. Predicting clinical severity in sickle cell anaemia. Br J Haematol.
2005; 129: 465-481.
82. Houston PE, Rana S, Sekhsaria S, Perlin E, Kim KS, Castro OL. Homocysteine in
sickle cell disease: relationship to stroke. Am J Med. 1997; 103: 192-196.
83. Vichinsky EP, Neumayr LD, Earles AN, Williams R, Lennette ET, Dean D, et al.
Causes and outcomes of the acute chest syndrome in sickle cell disease. N Engl J
Med. 2000; 342: 1855-1865.
84. Gladwin MT, Vichinsky E. Pulmonary complications of sickle cell disease. N Engl J
Med. 2008; 359: 2254-2265.
85. Stuart MJ, Nagel RL. Sickle-cell disease. Lancet. 2004; 364: 1343-1360.
86. Sabaa N, De Franceschi L, Bonnin P, Castier Y, Malpeli G, Debbabi H, et al.
Endothelin receptor antagonism prevents hypoxia-induced mortality and morbidity

109
in a mouse model of sickle-cell disease. J Clin Invest. 2008; 118: 1924-1933.
87. Holtzclaw JD, Jack D, Aguayo SM, Eckman JR, Roman J, Hsu LL. Enhanced
pulmonary and systemic response to endotoxin in transgenic sickle mice. Am J
Respir Crit Care Med. 2004; 169: 687-695.
88. Castro O. Systemic fat embolism and pulmonary hypertension in sickle cell disease.
Hematol Oncol Clin North Am. 1996; 10: 1289-1303.
89. Powars D, Weidman JA, Odom-Maryon T, Niland JC, Johnson C. Sickle cell chronic
lung disease: prior morbidity and the risk of pulmonary failure. Medicine
(Baltimore). 1988; 67: 66-76.
90. Kato GJ, McGcwan V, Machado RF, Little JA, Taylor J, Morris CR, et al. Lactate
dehydrogenase as a biomarker of hemolysis-associated nitric oxide resistance,
priapism, leg ulceration, pulmonary hypertension, and death in patients with
sickle cell disease. Blood. 2006; 107: 2279-2285.
91. Kato GJ, Onyekwere OC, Gladwin MT. Pulmonary hypertension in sickle cell
disease: relevance to children. Pediatr Hematol Oncol. 2007; 24: 159-170.
92. Haque AK, Gokhale S, Rampy BA, Adegboyega P, Duarte A, Saldana MJ. Pulmonary
hypertension in sickle cell hemoglobinopathy: A clinicopathologic study of 20
cases. Human Pathology. 2002; 33: 1037-1043.
93. Johnson CS, Omata M, Tong MJ, Simmons JF Jr., Weiner J, Tatter D. Liver
involvement in sickle cell disease. Medicine (Baltimore). 1985; 64: 349-356.
94. Omata M, Johnson CS, Tong M, Tatter D. Pathological spectrum of liver diseases in
sickle cell disease. Dig Dis Sci. 1986; 31: 247-256.
95. Saborio P, Scheinman JI. Sickle cell nephropathy. J Am Soc Nephrol. 1999; 10: 187-
192.

110
96. Scheinman JI. Sickle cell disease and the kidney. Nat Clin Pract Nephr. 2008; 5: 78-
88.
97. DeFronzo RA, Taufield PA, Black H, McPhedran P, Cooke CR. Impaired renal
tubular potassium secretion in sickle cell disease. Ann Intern Med. 1979; 90: 310-
316.
98. Goossens J, Van Eps L, Schouten H, Giterson A. Incomplete renal tubular acidosis in
sickle cell disease. Clinica Chimica Acta. 1972; 41: 149-156.
99. Pham P-TT, Pham P-CT, Wilkinson AH, Lew SQ. Renal abnormalities in sickle cell
disease. Kidney Int. 2000; 57: 1-8.
100. De Jong PE, Saleh AW, de Zeeuw D, Donker AJ, van der Hem GK, Pratt JJ, et al.
Urinary prostaglandins in sickle cell nephropathy: a defect in 9-ketoreductase
activity. Clin Nephrol. 1984; 22: 212-213.
101. Bakir AA, Hathiwala SC, Ainis H, Hryhorczuk DO, Rhee HL, Levy PS, et al.
Prognosis of the nephrotic syndrome in sickle glomerulopathy. A retrospective
study. Am J Nephrol. 1987; 7: 110-115.
102. Wesson DE. The initiation and progression of sickle cell nephropathy. Kidney Int.
2002; 61: 2277-2286.
103. Ataga KI, Orringer EP. Renal abnormalities in sickle cell disease. Am J Hematol.
2000; 63: 205-211.
104. Alvarez O, Montane B, Lopez G, Wilkinson J, Miller T. Early blood transfusions
protect against microalbuminuria in children with sickle cell disease. Pediatr
Blood Cancer. 2006; 47: 71-76.
105. Guasch A, Cua M, Mitch WE. Early detection and the course of glomerular injury in
patients with sickle cell anemia. Kidney Int. 1996; 49: 786-791.

111
106. Powars DR, Elliott-Mills DD, Chan L, Niland J, Hiti AL, Opas LM, et al. Chronic
renal failure in sickle cell disease: risk factors, clinical course, and mortality.
Ann Intern Med. 1991; 115: 614-620.
107. Olujohungbe AB, Adeyoju A, Yardumian A, Akinyanju O, Morris J, Westerdale N,
et al. A prospective diary study of stuttering priapism in adolescents and young
men with sickle cell anemia: report of an international randomized control
trial—The priapism in sickle cell study. J Androl. 2011; 32: 375-382.
108. Kato GJ. Priapism in Sickle-Cell Disease: A Hematologist's Perspective. J Sex Med.
2012; 9: 70-78.
109. Winfred C, Wang S. Wintrobe's clinical hematology. 2003. In: Greer J.P et.al. (eds.)
Sickle cell anemia and other sickling syndromes. 11th ed. Philadelphia: Lippincott
Williams & Wilkins; 2003. p. 10171057.
110. Gradisek RE. Priapism in sickle cell disease. Ann Emerg Med. 1983; 12: 510-512.
111. HalabiTawil M, Lionnet F, Girot R, Bachmeyer C, Lévy P, Aractingi S. Sickle cell
leg ulcers: a frequently disabling complication and a marker of severity. Br J
Dermatol. 2008; 158: 339-44.
112. Cumming V, King L, Fraser R, Serjeant G, Reid M. Venous incompetence, poverty
and lactate dehydrogenase in Jamaica are important predictors of leg ulceration
in sickle cell anaemia. Br J haematol. 2008; 142: 119-125.
113. Mohan JS, Vigilance JE, Marshall JM, Hambleton IR, Reid HL, Serjeant GR.
Abnormal venous function in patients with homozygous sickle cell (SS) disease
and chronic leg ulcers. Clin Sci (Lond). 2000; 98: 667-672.
114. Minniti CP, Eckman J, Sebastiani P, Steinberg MH, Ballas SK. Leg ulcers in sickle
cell disease. Am J hematol. 2010; 85: 831-833.

112
115. Gill FM, Sleeper LA, Weiner S J. Clinical events in the first decade in a cohort of
infants with sickle cell disease. Blood. 1995; 86: 776-783.
116. Miller ST, Sleeper LA, Pegelow CH, Enos LE, Wang WC, Weiner SJ, et al. Prediction
of Adverse Outcomes in Children with Sickle Cell Disease. N Engl J Med. 2000;
342: 83-89.
117. Stevens MCG, Padwick M, Serjeant GR. Observations on the natural history of
dactylitis in homozygous sickle cell disease. Clin pediatr. 1981; 20: 311-317.
118. Shelley WM, Curtis EM. Bone marrow and fat embolism in sickle cell anemia and
sickle cell-hemoglobin C disease. Bull Johns Hopkins Hosp. 1958; 103: 8-25.
119. Almeida A, Roberts I. Bone involvement in sickle cell disease. Br J Haematol. 2005;
129: 482-490.
120. Hawker H, Neilson H, Hayes RJ, Serjeant GR. Haematological factors associated with
avascular necrosis of the femoral head in homozygous sickle cell disease. Br
J Haematol. 1982; 50: 29-34.
121. Milner PF, Kraus AP, Sebes JI, Sleeper LA, Dukes KA, Embury SH, et al. Sickle cell
disease as a cause of osteonecrosis of the femoral head. N Engl J Med. 1991;
325: 1476-1481.
122. Osunkwo I, Hodgman EI, Cherry K, Dampier C, Eckman J, Ziegler TR, et al. Vitamin
D deficiency and chronic pain in sickle cell disease. Br J Haematol. 2011; 153:
538- 540.
123. Burnett MW, Bass JW, Cook BA. Etiology of osteomyelitis complicating sickle cell
disease. Pediatrics. 1998; 101: 296-267.
124. Reid CD, Charache S, Lubin B. Heart. In: Reid CD, Charache S, Lubin B.
(eds.) Management and therapy of sickle cell disease. 3rd ed. Bethesda: NIH
Publication; 1995. p. 105-108.

113
125. Gerry JL, Bulkley BH, Hutchins GM. Clinicopathologic analysis of cardiac
dysfunction in 52 patients with sickle cell anemia. Am J Cardiol. 1978; 42: 211-
216.
126. Johnson CS, Giorgio AJ. Arterial blood pressure in adults with sickle cell anaemia.
Arch Intern Med. 1981; 141: 891-893.
127. Akinola NO, Balogun MO. Some observations of the cardiovascular status of
Nigerians with sickle cell anaemia at rest and in response to exercise. 24th
Annual scientific conference of the Nigerian Cardiac Society, llelfe.
1995; Abs.14: 23.
128. Quinn CT, Shull EP, Ahmad N, Lee NJ, Rogers ZR, Buchanan GR. Prognostic
significance of early vaso-occlusive complications in children with sickle cell
anemia. Blood. 2007; 109: 40-45.
129. Weatherall MW, Higgs DR, Weiss H, Weatherall DJ, Serjeant GR.
Phenotype/genotype relationships in sickle cell disease: a pilot twin study. Clin
Lab Haematol. 2005; 27: 384-390.
130. Labie D, Pagnier J, Lapoumeroulie C, Rouabhi F, Dunda-Belkhodja O, Chardin P, et
al. Common haplotype dependency of high gamma-globin gene expression and
high Hb F levels in beta-thalassemia and sickle cell anemia patients. Proc Natl
Acad Sci U S A. 1985; 82: 2111-2114.
131. Nagel RL, Fabry ME, Pagnier J, Zohoun I, Wajcman H, Baudin V, et al.
Hematologically and genetically distinct forms of sickle cell anemia in Africa.
The Senegal type and the Benin type. N Engl J Med. 1985; 312: 880-884.
132. Powars DR, Schroeder WA, Weiss JN, Chan LS, Azen SP. Lack of influence of fetal
hemoglobin levels or erythrocyte indices on the severity of sickle cell anemia. J
Clin Invest. 1980; 65: 732-740.
114
133. Hedo CC, Okpala IE, Aken'ova YA. Foetal haemoglobin levels in Nigerians with
sickle cell anaemia. A revisitation. Trop Geogr Med. 1993; 45: 162-164.
134. Steinberg M, Rosenstock W, Coleman M, Adams J, Platica O, Cedeno M, et al.
Effects of thalassemia and microcytosis on the hematologic and vasoocclusive
severity of sickle cell anemia. Blood. 1984; 63: 1353-1360.
135. Embury SH, Dozy AM, Miller J, Davis Jr J, Kleman KM, Preisler H, et al. Concurrent
sickle-cell anemia and α-thalassemia: effect on severity of anemia. N Engl J
Med. 1982; 306: 270-274.
136. Serjeant GR. National history and determinants of clinical severity of sickle cell
disease. Curr Opin Heamatol. 1995; 2: 103-108.
137. Steinberg MH. Review: sickle cell disease: present and future treatment. Am J Med
Sci. 1996; 312: 166-174.
138. Taylor JG, Tang DC, Savage SA, Leitman SF, Heller SI, Serjeant GR, et al. Variants
in the VCAM1 gene and risk for symptomatic stroke in sickle cell disease.
Blood. 2002; 100: 4303-4309.
139. Hoppe C, Klitz W, Cheng S, Apple R, Steiner L, Robles L, et al. Gene interactions
and stroke risk in children with sickle cell anemia. Blood. 2004; 103: 2391-2396.
140. Nolan VG, Baldwin C, Ma Q, Wyszynski DF, Amirault Y, Farrell JJ, et al.
Association of single nucleotide polymorphisms in klotho with priapism in sickle
cell anaemia. Br J Haematol. 2005; 128: 266-272.
141. Baldwin C, Nolan VG, Wyszynski DF, Ma QL, Sebastiani P, Embury SH, et al.
Association of klotho, bone morphogenic protein 6, and annexin A2
polymorphisms with sickle cell osteonecrosis. Blood. 2005; 106: 372-375.
142. Vasavda N, Menzel S, Kondaveeti S, Maytham E, Awogbade M, Bannister S, et al.
The linear effects of α-thalassaemia, the UGT1A1 and HMOX1 polymorphisms

115
on cholelithiasis in sickle cell disease. Br J Haematol. 2007; 138: 263-270.
143. Chaar V, Keclard L, Diara JP, Leturdu C, Elion J, Krishnamoorthy R, et al.
Association of UGT1A1 polymorphism with prevalence and age at onset of
cholelithiasis in sickle cell anemia. Haematologica. 2005; 90: 188-199.
144. Haverfield EV, McKenzie CA, Forrester T, Bouzekri N, Harding R, Serjeant G, et al.
UGT1A1 variation and gallstone formation in sickle cell disease. Blood. 2005;
105: 968-972.
145. Steinberg MH, Dreiling BJ, Morrison FS, Necheles TF. Mild sickle cell disease.
Clinical and laboratory studies. JAMA. 1973; 224: 317-321.
146. Odenheimer DJ, Sarnaik SA, Whitten CF, Rucknagel DL, Sing CF. The relationship
between fetal hemoglobin and disease severity in children with sickle cell anemia.
Am J Med Genet. 1987; 27: 525-535.
147. Sebastiani P, Ramoni MF, Nolan V, Baldwin CT, Steinberg MH. Genetic dissection
and prognostic modeling of overt stroke in sickle cell anemia. Nat Genet. 2005;
37: 435-440.
148. Sebastiani P, Nolan VG, Baldwin CT, Abad-Grau MM, Wang L, Adewoye AH, et al.
A network model to predict the risk of death in sickle cell disease. Blood. 2007;
110: 2727-2735.
149. Yap. S, Boers. G H, Wilcken. B. Vascular outcome in patients with homocystinuria
due to cystathionine beta-synthase deficiency treated chronically: a multicenter
observational study. Arterioscler Thromb Vasc Biol. 2001: 2080–2085.
150. McKusick V. Homocystinuria. In: McKusick V. (ed.) Mendelian inheritance in man.
10th ed. Baltimore, MD: The Johns Hopkins University Press; 1992. p. 1444-1446.
151. Wald DS, Law M, Morris JK. Homocysteine and cardiovascular disease: evidence on
causality from a meta-analysis. BMJ. 2002; 325: 1202-1209.

116
152. Deloughery TG, Evans A, Sadeghi A. Common mutation in methylene
tetrahydrofolate reductase: Correlation with homocysteine metabolism and late-
onset vascular disease. Circulation. 1996; 94: 3074-3078.
153. McCully KS. Homocysteine and vascular disease. Nat Med. 1996; 2: 386-389.
154. Robinson K, Mayer E, Miller D. Hyperhomocysteinemia and low pyridoxal
phosphate. Common and independent reversible risk factors for coronary artery
disease. Circulation. 1995; 92: 2825-2830.
155. Chasan-Taber L, Selhub J, Rosenberg I. A Prospective study of folate and vitamin B6
and risk of myocardial infarction in U.S. physicians. J Am Coll Nutr. 1996; 15:
136- 143.
156. Franken D, Boers G, Blom H. Treatment of mild hyperhomocysteinaemia in vascular
disease patients. Arterioscler Thromb Vasc Biol. 1994; 14: 465-470.
157. Den Heijer M, Kostor T, Blom HJ. Hyperhomocysteinemia as a risk factor for deep-
vein thrombosis. N Engl J Med. 1996; 334: 759-762.
158. Watkins D, Rosenblatt DS. Functional methionine synthase deficiency (cblE and
cblG): clinical and biochemical heterogeneity. Am J Med Genet. 1989; 34: 427-
434.
159. Levitt AJ, Karlinsky H. Folate, vitamin B12 and cognitive impairment in patients with
Alzheimer’s disease. Acta Psychiatr Scand. 1992; 86: 301-305.
160. Ray JG, Laskin CA. Folic acid and homocyst(e)ine metabolic defects and the risk of
placental abruption, pre-eclampsia and spontaneous pregnancy loss: a
systematic review. Placenta. 1999; 20: 519-529.
161. Arzumanyan ES, Makhro AV, Tyulina OV, Boldyrev AA. Carosine protects
erythrocytes from oxidative stress caused by homocysteic acid. Dok Biochem
Biophys. 2008; 418: 44-46.

117
162. Mansoor MA, Guttormsen AB, Fiskerstrand T, Refsum H, Ueland PM, Svardal AM.
Redox status and protein binding of plasma aminothiols during the transient
hyperhomocysteinemia that follows homocysteine administration. Clin Chem.
1993; 39: 980-985.
163. Baumann E, Stoya G, Volkner A, Richter W, Lemke C, Linss W. Hemolysis of human
erythrocytes with saponin affects the membrane structure. Acta Histochem. 2000;
102: 21-35.
164. Heinecke JS. Superoxide mediated oxidation of low-density lipoproteins by thiols. In:
Cerutti PA, Cerutti JM, McCord I, Fridovich I. (eds.) Oxy-radicals in
molecular biology and pathology. New York: Alan R, Liss; 1998. p. 433-457.
165. Upchurch GR, Welch GN, Freedman JE, Loscalzo J. Homocyst(e)ine attenuates
endothelial glutathione peroxidase and thereby potentiates peroxide-mediated
cell injury. Circulation. 1995; 92: 1-228.
166. Goth L, Vitai M. The effects of hydrogen peroxide promoted by homocysteine and
inherited catalase deficiency on human hypocatalasemic patients. Free Radic
Biol Med. 2003; 35: 882-888.
167. Hajjar KA. Homocysteine in health and disease. In: Carmel R, Jacobsen DW. (eds.)
Homocysteine and haemostasis. Cambridge, United Kingdom: Cambridge
University Press; 2001. p. 415-424.
168. Jia L, Furchgott RL. Inhibition by sulphydryl compounds of vascular relaxation
induced by nitric oxide and endothelium-derived relaxing factor. J Pharmacol
Exp Ther. 1993; 267: 371-378.
169. Welch GN, Upchurch Jr GR, Keaney Jr JF, Loscalzo L. Homocyst(e)ine decreases
cell redox potential in vascular smooth muscle cells. J Am Coll Cardiol. 1996;
27:1- 164.

118
170. Sydowa K, Schwedhelmb E, Arakawac N, Bode-Bögerd SM, Tsikasd D, Hornigc B,
et al. ADMA and oxidative stress are responsible for endothelial dysfunction
in hyperhomocyst(e)inemia: effects of L-arginine and B vitamins. Circ Res.
2003; 57: 244-252.
171. Dudman PB, Temple ST, Guo XW. Homocysteine enhances nutrophil-endothelial
interactions in both cultured human cells and rats in vivo. Circ Res. 1999; 84:
409- 441.
172. Cristiana F, Zamosteanu N, Albu E. An overview of studies in hematology. In:
Moschandreou T. (ed.) Homocysteine in red blood cells metabolism –
Pharmacological approaches. Croatia: In Tech; 2012. p. 31-68.
173. Ajuluchukwu J, Oluwatowoju I, Adebayo K, Onakoya A. Plasma Total Homocysteine
in Diverse Cardiovascular Diseases in Urban Africans. World J Life Sci Med
Res. 2011; 1: 126-132.
174. Kirkwood BR, Sterne AC. Calculation of required sample size. In: Kirkwood BR,
Sterne AC. (eds). Essential Medical Statistics. Malden Massachusetts:
Blackwell Science; 2003. p. 413-428.
175. Akinlade KS, Atere AD, Rahamon SK, Olaniyi JA. Serum levels of copeptin, C-
reactive protein and cortisol in different severity groups of sickle cell anaemia.
Niger J Physiol Sci. 2013; 28: 159-164.
176. Unni EJ. Development of models to predict medication non-adherence based on a new
typology. Iowa: University of Iowa; 2008. p. 44-90.
177. World Health Organization. WHO guidelines on hand hygiene in health care
(Advanced draft). Geneva: World Health Organization; 2008. Available from:
http://www.who.int/gpsc/5may/Hand_Hygiene_Why_How_and_When_Brochure.p
df (Accessed 3rd September 2014).
119
178. Frantzen F, Faaren AL, Alfheim I, Nordhei AK. Enzyme conversion immunoassay
for determining total homocysteine in plasma or serum. Clin Chem. 1998; 44:
311- 316.
179. Sundrehagen E. Homocysteine assay. Google Patents; 1998. Available from:
http://www.google.com/patents/US5827645 (Accessed 3rd September 2014).
180. Welch GN, Loscalzo J. Homocysteine and atherothrombosis. N Engl J Med. 1998;
338: 1042-1049.
181. Cloud -Clone Corporation. Vitamin B9 ELISA kit instruction manual. Available
from: http://www.uscnk.de/en/products/detail/nr/uscn-life-science--elisa--ge--
cea610ge (Accessed 5th September 2014).
182. Fischbach F, Dunning M .B. Diagnostic testing. In: Surrena H, Kogut H, Gibbons T.
(eds.) Manual of laboratory and diagnostic tests. 8 ed. Philadelphia:
Lippincott Williams & Wilkins; 2008. p. 1-55.
183. Axis-shield plc. Axis-shield active-B12 (holotranscobalamin) ELISA kit instruction
manual. Available from: http://www.active-b12.com/Assays-Active-B12
(Accessed 5th September 2014).
184. Greibe E, Nexo, E. Vitamin B12 absorption judged by measurement of
holotranscobalamin, active vitamin B12: evaluation of a commercially available
EIA kit. Clin Chem Lab Med. 2011; 49: 1883-1885.
185. Lloyd-Wright Z, Hvas A-M, Møller J, Sanders TAB, Nexø E. Holotranscobalamin as
an indicator of dietary Vitamin B12 deficiency. Clin Chem. 2003; 49: 2076-2078.
186. Sysmex Corporation. Sysmex KX-21 haematology analyzer instruction manual.
Available from:
http://www.frankshospitalworkshop.com/equipment/documents/automated_analyz
er/user_manuals/Sysmex%20KX-21%20Hematology%20Analyzer%20-

120
%20Instruction%20manual.pdf (Accessed 5th September 2014).
187. Hematological and nutritional biochemistry reference data for persons 6months-
74 years of age: United States,1976-80. Vital Health Stat 11. 1982; 232: 1-173.
188. Bain BJ. Ethnic and sex differences in the total and differential white cell count and
platelet count. J Clin Pathol. 1996; 49: 664-666.
189. Cheesbrough M. Haematological tests. In: Cheesbrough M. (ed.) District laboratory
practise in tropical countries. Cambridge: Cambridge university press; 2000. p.
267- 347.
190. Lewis SM, Bain BJ. Preparation and staining methods for blood and bone marrow
films. In: Lewis SM, Bain BJ, Bates I, Dacie JV. (eds.) Dacie and Lewis
practical haematology. 10 ed. Philadelphia: Churchill Livingstone Elsevier; 2006.
p. 60-76.
191. Lewis SM, Bain BJ, Bates I. Basic haematology techniques. In: Lewis SM, Bain BJ,
Bates I. Dacie, J.V. (eds.) Dacie and Lewis: practical haematology. 10 ed.
Philadelphia: Churchill Livingstone Elsevier; 2006. p. 26-54.
192. Wild B, Bain B. Investigation of abnormal haemoglobin and thalassaemias. In: Lewis
SM, Bain BJ, Bates I, Dacie, J.V. (eds.) Dacie and Lewis: practical
haematology. 10th ed. Philadelphia: Churchill Livingstone Elsevier; 2006. p. 272-
307.
193. Hitachi Limited. Service manual for hitachi model 902 automatic analyzer. Available
from:http://www.frankshospitalworkshop.com/equipment/documents/automated_an
alyzer/service_manuals/Hitachi (Accesssed 5th September 2014).
194. Chema Diagnostica. Hitachi 902 instruction manual. Available from:
http://www.chema.com/chema/automation_en_files/Hitachi%20902.pdf (Accessed
5th September 2014).

121
195. Rugani MA. Association of homocysteine with vaso-occlusive crisis in sickle cell
disease. Brazil: Fluminense Federal unversity; 2008. Available from:
http://www.bdtd.ndc.uff.br/tde_arquivos/33/TDE-2009-06-17T090656Z-
2093/Publico/TEDE-Dissert-Marilia%20Rugani.pdf (Assessed 1st June 2015).
196. Moreira JA, Laurentino MA, Machado RPG, Barbosa MC, Gonçalves RP, Mota A,
et al. Pattern of hemolysis parameters and association with fetal hemoglobin in
sickle cell anemia patients in steady state. Rev Bras Hematol Hemoter. 2015; 37:
167-171.
197. Mikobi TM, Lukusa Tshilobo P, Aloni MN, Mvumbi Lelo G, Akilimali PZ,
Muyembe-Tamfum JJ. Correlation between the lactate dehydrogenase levels
with laboratory variables in the clinical severity of sickle cell anemia in congolese
patients. PLoS ONE. 2015; 10: e0123568. doi:10.1371/journal.pone.
198. Olinescua R, Kummerow FA, Handlerc B, Fleischerc L. The hemolytic activity of
homocysteine is increased by the activated polymorphonuclear leukocytes.
Biochemical and Biophysical Research Communications. 1996; 226: 912-916.

122
APPENDIX I
INFORMED CONSENT FORM
Title of the research: ESTABLISHING A RELATIONSHIP BETWEEN SERUM
HOMOCYSTEINE LEVELS AND DISEASE SEVERITY IN ADULTS WITH
SICKLE CELL ANAEMIA IN LAGOS UNIVERSITY TEACHING HOSPITAL (LUTH),
LAGOS, NIGERIA.
Name and affiliation of researcher: This study is being conducted by Dr Ali,
Adebukola Khairat in the department of haematology and blood transfusion, Lagos
university teaching hospital (LUTH).
Sponsor of research: This is a self-sponsored research, it is part of the requirement for
the award of fellowship of the National Postgraduate Medical College of Nigeria.
Purpose of research: The purpose of this research is to know the level of serum
homocysteine in adults with sickle cell anaemia and observe how it affects the severity
of haemolysis and vaso-occlusion. Also to determine the level of folic acid and vitamin
B12 in blood.
Procedure of the research: An interviewer administered questionnaire will be
administered by the study staff during a single routine clinic visit or while on hospital
admission for sickle cell crises. About 10 mls of blood will be collected from participants
for blood tests after an informed consent has been obtained. These blood tests will be free
of charge and includes full blood count, reticulocyte count, lactate dehydrogenase,
bilirubin, homocysteine, folate and vitamin B12 blood levels. Results of the test shall be
made available to study participants if desired.
Expected duration of research and of participant(s)’ involvement: This research
requires only about 30 minutes, during a one time encounter.
Possible Risks, Discomforts and Inconveniences: This research poses a minimal risk to

123
the participant; as there may be slight discomfort during the collection of blood due to the
needle prick. About 20-30mins of participant’s time will be used for administration of
questionnaire and physical examination.
Potential Benefits: The direct benefit of this research is to know the folate, vitamin B12
and homocysteine levels in the blood as well as some markers of sickle cell disease severity
(lactate dehydrogenase, reticulocyte count, serum bilirubin and full blood count
including red cell indices). The results of these tests will be available for participant’s
management. Furthermore, this may throw more light on how homocysteine affects sickle
cell anaemia.
Confidentiality: All information collected in this study will be given the utmost
confidentiality. Data generated from this research will be restricted to the researchers,
data analyzers and managing physicians. The results of this research may be presented at
scientific or medical meetings or published in scientific journals.
Voluntariness: Your participation in this study is entirely voluntary. You will not be
denied any form of treatment or intervention because of your decision not to participate in
this study. However, if you are willing to participate in this study, kindly indicate by
signing below.
STUDY PARTICIPANT’S RESPONSIBILITIES As a study participant, your
responsibilities include:
• Give an informed consent by signing in the space provided for you
• Follow the instructions of the study staff
• Answer the questions from the interviewer-administered questionnaire
• Ask questions as you think of them
• Tell the study staff if you change your mind about participating in the study

124
Statement of person obtaining informed consent:
I have fully explained this research to -------------- and I have given sufficient information,
including research risks and benefits in order to make an informed decision.
DATE: _____________________________
SIGNATURE: _________________________
NAME: _____________________________
Statement of person giving consent:
I have read the description of the research or have had it translated into the language
I understand. I understand it and I believe that my participation is voluntary. I know
enough about the purpose, methods, risks and benefits of the research to decide that I
would like to take part in it. I understand that I may willingly withdraw from this study at
any time. I have received a copy of this consent form to keep for myself.
DATE: _____________________________
SIGNATURE: _________________________
NAME: _____________________________
WITNESS/ TRANSLATOR’S SIGNATURE: __________________________
WITNESS’ NAME ________________________
Researcher’s Contact: Dr Ali Adebukola Khairat
Department of Haematology and Blood Transfusion, LUTH
08033924747
Email Address: [email protected]
LUTH Health Research Ethics Committee Contact
Room 107, Administration Building,
LUTH, Idi-Araba, Lagos.

125
APPENDIX II
QUESTIONNAIRE
LUTH HREC NOS: ADM/DCST/HREC/APP/1740 (15-04-14 to 15-04-15)
Subject serial No:………………………
Title of Research: Establishing a relationship between serum homocysteine levels and
disease severity in adults with sickle cell anaemia in Lagos university teaching hospital
(LUTH), Lagos, Nigeria.
Instruction: Tick or write where appropriate.
BIODATA
Hospital number ………………………………………………
Age (as at last birthday)…………………… Sex………………..
Occupation………………………………………………………..
Educational Status: Primary ( ), Secondary ( ), Tertiary ( )
MEDICAL HISTORY
1) How often in the last one year did you have pain crisis or deepening yellow from your
usual yellowish discoloration of the eyes?
a) Once in a month ( )
b) Once in 3 months ( )
c) Once in 6 months ( )
d) Once in 9 months ( )
e) Once in a year ( )
f) Others ………………….
2) Have you had painful crisis in the last 3 weeks?
a) Yes ( )
b) No ( )
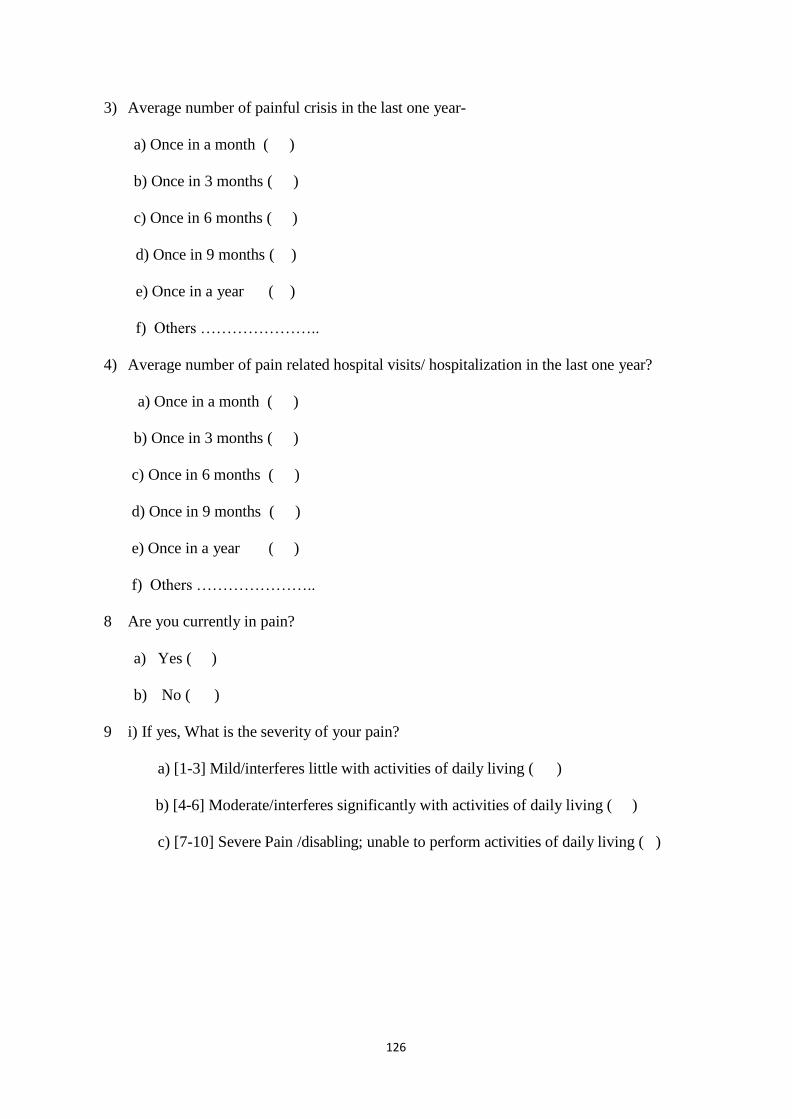
126
3) Average number of painful crisis in the last one year-
a) Once in a month ( )
b) Once in 3 months ( )
c) Once in 6 months ( )
d) Once in 9 months ( )
e) Once in a year ( )
f) Others …………………..
4) Average number of pain related hospital visits/ hospitalization in the last one year?
a) Once in a month ( )
b) Once in 3 months ( )
c) Once in 6 months ( )
d) Once in 9 months ( )
e) Once in a year ( )
f) Others …………………..
8 Are you currently in pain?
a) Yes ( )
b) No ( )
9 i) If yes, What is the severity of your pain?
a) [1-3] Mild/interferes little with activities of daily living ( )
b) [4-6] Moderate/interferes significantly with activities of daily living ( )
c) [7-10] Severe Pain /disabling; unable to perform activities of daily living ( )

127
10 How often do you have deepening yellow from your usual yellowish discoloration of
the eyes, in the last one year?
a) Once in a month ( )
b) Once in 3 months ( )
c) Once in 6 months ( )
d) Once in 9 months ( )
e) Once in a year ( )
f) Others …………………..
11 How often do you have coca-cola coloured urine in the last one year?
a) Once in a month ( )
b) Once in 3 months ( )
c) Once in 6 months ( )
d) Once in 9 months ( )
e) Once in a year ( )
f) Others …………………..
12 In the past one week, how many days did you forget to take folic acid?
a) 0 day ( )
b) 1 day ( )
c) 2 days or more ( )
13 In the past one week, how many days did you not take folic acid on purpose?
a) 0 day ( )
b) 1 day ( )
c) 2 days or more ( )
128
14 How often did you have blood transfusion in the last one year?
a) Once in a month ( )
b) Once in 3 months ( )
c) Once in 6 months ( )
d) Once in 9 months ( )
e) Once in a year ( )
f) Others …………………..
15 When was the last time you had a blood transfusion?...................................................
16 What is your steady state PCV?………………………………………

129
CALCULATION OF DISEASE SEVERITY SCORE
CLINICAL AND LABORATORY FEATURES SCORE
Crisis number(s) per year? 0-1 [0] 2- 3 [1] ≥4 [2]
Previous blood transfusion: Yes/No
If yes, how many times per year?
1-2 [1]
≥3 [2]
Pneumonia Yes [1] No [0]
Osteomyelitis Yes [1] No [0]
Acute chest syndrome Yes [1] No [0]
Dehydrated Yes [1] No [0]
Avascular necrosis of femoral head Yes [1] No [0]
Renal Failure Yes [1] No [0]
Pigment gallstone & Jaundice Yes [1] No [0]
Vaso-occlusive crisis (VOC)/Pain? No [0] Localized [1] Generalized [2]
Anaemia Hb ≥10g/dl [0] Hb≥8<10g/dl [1] Hb≥6<8g/dl [2]
Hb≥4<6g/dl [3] Hb<4g/dl [4]
TOTAL SEVERITY SCORE
Total disease severity score was calculated as mild SCA (≤3), moderate SCA (>3 but
≤7) and Severe SCA (>7)175.

130
ASSESSMENT TOOL FOR COMPLIANCE OF ROUTINE MEDICATIONS
Assessment
Days Folic acid
In the past one week how many days
did you forget to take folic acid?
0
1
≥2
In the past one week how many days
did you not take folic acid on purpose?
0
1
≥2
Non- compliant patients were those who answered 2 days or more due to forgetfulness and
1 day or more due to purposeful missing176.
LABORATORY FINDINGS
PCV (%)…………………… Hb (g/dl)……………. MCV (fl)…………………
MCHC (g/dl)……………… MCH (pg)…………… RDW (%)………………..
WBC ( x 109/L)………………
PLT ( x 109/L)………………..
Absolute reticulocyte count(x109/L)…………..........
Reticulocyte production
index……………………… Indirect bilirubin
(mg/dL)…………………………… Serum lactate
dehydrogenase (U/L)………………… Serum
homocysteine (µmol/L)………………………
Serum folate
(nmol/L)………………………………. Serum
vitamin B12 (pmol/L)…………………………