1 relationship between serum cholesterol and indices of
TRANSCRIPT

1
Relationship between Serum Cholesterol and Indices of Erythrocytes and Platelets in the U.S.
Population
Michael B. Fessler, MD1; Kathryn Rose, PhD2; Yanmei Zhang2; Renee Jaramillo, MStat2; Darryl C.
Zeldin, MD1
1Laboratory of Respiratory Biology, National Institute of Environmental Health Sciences, National
Institutes of Health, Department of Health and Human Services, Research Triangle Park, NC 27709
2SRA International, Durham, NC 27713
Running title: Relation of Cholesterol to Red Cells and Platelets
Abbreviations: BMI, body mass index; C-RP, C-reactive protein; MCV, mean corpuscular volume;
MPV, mean platelet volume; NHANES, National Health and Nutrition Examination Survey; TC, total
cholesterol.
Correspondence to:
Michael B. Fessler, MD
National Institute of Environmental Health Sciences
111 T.W. Alexander Drive
P.O. Box 12233, Maildrop D2-01
Research Triangle Park, NC 27709
Ph: (919) 541-3701
Fax: (919) 541-4133
Email: [email protected]
by guest, on March 28, 2019
ww
w.jlr.org
Dow
nloaded from

2
Abstract
Whereas dyslipidemia has been associated with leukocytosis, the relationship between serum cholesterol
and other hematopoietic lineages is poorly defined. Erythrocytes and platelets, anucleate cells relegated
to nonspecific, diffusional exchange of cholesterol with serum, have been proposed to have a distinct
relationship to cholesterol from leukocytes. We examined the relationship between serum cholesterol and
circulating erythrocyte/platelet indices in 4,469 adult participants of the National Health and Nutrition
Examination Survey (NHANES) 2005-2006. In linear regression analyses, serum non-high density
lipoprotein-cholesterol (non-HDL-C) was positively associated with mean erythrocyte number,
hematocrit, hemoglobin concentration, platelet count, and platelet crit independently of age, gender,
race/ethnicity, smoking, body mass index, serum folate, and C-reactive protein. The magnitude of the
relationship was most marked for platelets, with lowest vs. highest non-HDL-C quartile subjects
having geometric mean platelet counts of 258,000/µL vs. 281,000/µL, respectively (adjusted
model, P<0.001 for trend). These associations persisted in a sensitivity analysis excluding
several conditions that affect erythrocyte/platelet and/or serum cholesterol levels, and were also
noted in an independent analysis of 5,318 participants from NHANES 2007-2008. As non-HDL-C,
erythrocytes, and platelets all impact cardiovascular disease risk, there is a need for advancing
understanding of the underlying interactions that govern levels of these three blood components.
Supplementary Key Words: High Density Lipoprotein-Cholesterol; Non-High Density Lipoprotein-
Cholesterol; Hematocrit; National Health and Nutrition Examination Survey
by guest, on March 28, 2019
ww
w.jlr.org
Dow
nloaded from

3
Introduction
Several cross-sectional analyses have indicated that metabolic syndrome and dyslipidemia associate with
leukocytosis in humans (1-3), however the relationship between serum cholesterol and other
hematopoietic lineages is poorly defined. Erythrocytes and platelets are linked in their life cycle, deriving
from a common progenitor in the bone marrow and ultimately undergoing clearance by the
reticuloendothelial system (4-6). Unlike macrophages, they have minimal capacity for storage of
cholesteryl ester, and, as anucleate cells, lack the means for cholesterol synthesis (7, 8). As erythrocytes
have no intracellular membranes and undergo nonspecific diffusional exchange of cholesterol with their
milieu (7, 8), the cholesterol content of the erythrocyte plasma membrane is particularly susceptible to
serum cholesterol (7, 9). Platelets undergo similar diffusional exchange of cholesterol with plasma (7).
Given this, erythrocytes and platelets have been proposed to have a relationship to extracellular (serum)
cholesterol distinct from that of leukocytes (7).
Reports using animal models have identified erythrocyte and platelet abnormalities associated with
dyslipidemia (4, 6, 10-15). Loading of the plasma membrane with cholesterol, such as by elevated non-
high density lipoprotein-cholesterol (non-HDL-C) in the setting of a high-fat diet, promotes erythrocyte
hemolysis (10, 12) and reduces platelet survival (14). Elevated high density lipoprotein cholesterol
(HDL-C), such as seen in scavenger receptor class B type I (SR-BI)-deficient mice, has also been linked
to impaired lifespan and number of erythrocytes and platelets, as well as to macrocytosis of both cell
types (4, 6, 13). In vitro studies indicate that erythrocyte membrane fluidity is reduced and stability
increased in parallel with exogenously induced increases in membrane cholesterol/phospholipid ratio
(16), but that membrane stability may be maximal within a critical window of cholesterol content, above
which it, along with erythrocyte and platelet lifespan, are compromised (4, 6, 17).
In humans, multiple small clinical case series have identified reduced serum cholesterol as a common
finding in a variety of hemolytic anemias, and it has been proposed that this may occur through
by guest, on March 28, 2019
ww
w.jlr.org
Dow
nloaded from

4
cholesterol consumption by avid erythropoiesis (11). Reports such as these suggest that, in addition to
serum cholesterol impacting the population kinetics of erythrocytes and platelets, erythrocytes may
reciprocally impact serum cholesterol levels. In support of this postulate, in vitro studies indicate that
human erythrocytes act as a reservoir of cholesterol for serum lipoproteins, presumably because of their
high, nonspecific cholesterol loading capacity (18, 19).
There have been very few studies of the relationship between serum cholesterol and indices of either
erythrocytes or platelets in large human populations. While a few studies have shown positive
correlations between serum cholesterol and either hematocrit or hemoglobin (20, 21), others have found
no such relationship (22). Findings for serum cholesterol and platelets have similarly been disparate (23,
24). Given this, the nature of the relationships in humans between serum cholesterol and both
erythrocytes and platelets remain undefined outside of disease extremes, as do the broader relevance of
these relationships to public health. Given that hypercholesterolemia, erythrocytosis, and
thrombocytosis, as well as the membrane cholesterol content of both erythrocytes and platelets are all risk
factors for cardiovascular disease (25-28), there is a need for advancing our understanding of the
underlying relationships between serum cholesterol and erythrocyte and platelet lineages in humans.
The National Health and Nutrition Examination Survey (NHANES) is a biennial, cross-sectional
population-based survey of the U.S. population that includes measurements of erythrocyte and platelet
indices, and serum cholesterol. We hypothesized that, in humans, as observed in rodent models, HDL-C
would have an inverse association with abundance indices of erythrocytes (erythrocyte number,
hematocrit, hemoglobin concentration) and platelets (platelet crit, platelet count). Given that non-HDL-C
may possibly promote both production and destruction of both cell types, we had no clear a priori
hypothesis regarding the relationship between non-HDL-C and erythrocyte/platelet indices.
by guest, on March 28, 2019
ww
w.jlr.org
Dow
nloaded from
5
Methods
Study Population
Data were obtained from the NHANES 2005-2006 and NHANES 2007-2008, which used a complex
multistage design to assess the health and nutritional status of the civilian, non-institutionalized U.S.
population. NHANES uses a randomization scheme to select U.S. counties, and, within them, households
for survey each year, and thus by design minimizes the likelihood of resampling individuals across 2-year
survey installments. To ensure adequate sample sizes of certain subgroups of the population, NHANES
oversampled persons of low income, elderly subjects (≥60 years), African Americans, and Mexican
Americans, among others. All study participants who completed the household interview were also
invited to participate in the Health Examination Component that was conducted in the mobile
examination center. Detailed description of the survey design and implementation may be found online
at: http://www.cdc.gov/nchs/nhanes.htm. NHANES 2005-2006 was treated as the primary study
population for our analyses, and NHANES 2007-2008 as a replication study population. All participants
aged ≥20 years who visited the NHANES mobile examination center, and for which data were available
for total cholesterol (TC), HDL-C, erythrocyte count, hemoglobin concentration, hematocrit, and platelet
count were included in our analyses.
Serum cholesterol and blood cell measurements
Serum TC and HDL-C were measured using a Roche Hitachi 717 or 912 (NHANES 2005-2006) or a
Roche Modular P chemistry analyzer (NHANES 2007-2008). For TC, coupled enzymatic reactions were
used involving cholesteryl ester hydrolase, cholesterol oxidase, and peroxidase, followed by phenazone
absorbance detection. HDL-C measurement was by the Roche/Boehringer-Mannheim Diagnostics direct
HDL method. For blood cell analysis, a Beckman Coulter MAXM (NHANES 2005-2006) or Beckman
Coulter HMX (NHANES 2007-2008) were used. Erythrocyte count (RBCC) was measured directly.
Hemoglobin concentration was determined by absorbance found through photocurrent transmittance.
Mean corpuscular volume (MCV) was derived from the erythrocyte histogram, and used in NHANES to
by guest, on March 28, 2019
ww
w.jlr.org
Dow
nloaded from
6
compute hematocrit as: RBCC x MCV/10. Platelet count and mean platelet volume (MPV) were both
derived from the platelet histogram. Platelet crit (%) was calculated as follows: [Platelet count x
MPV]/10,000.
Covariates and other laboratory measurements
Covariates were obtained from questionnaire (age, race/ethnicity, gender, smoking), lab analyses (serum
C-reactive protein [CRP], erythrocyte and serum folate), and physical examination (height, weight). CRP
was measured by latex-enhanced nephelometry. Serum and erythrocyte folate were measured by
microbiologic assay of L. rhamnosus by turbidometry at 590 nm. Body mass index (BMI) was calculated
as weight in kilograms divided by height in meters squared (kg/m2). Glycohemoglobin (hemoglobin
A1C) was measured on either a Tosoh A1c 2.2 Plus or Tosoh G7 Automated HPLC System (commenced
in 2007) Glycohemoglobin Analyzer.
Statistical Analysis
To account for the complex sampling design used in NHANES and to assure unbiased variance estimates,
all analyses were conducted using SAS Survey statistical software (Version 9.3, SAS, Cary, North
Carolina, USA). Descriptive statistics were generated (means or percentages and associated standard
errors). All blood parameters were assessed for normality. Hemoglobin and platelets were not normally
distributed; thus, geometric means are presented. Linear regression analyses were run, assessing the
association of the blood parameters with quartile of HDL-C and non-HDL-C; least squares means of the
blood parameters, by quartile of cholesterol, and associated 95% confidence intervals were generated
from the regression coefficients and variance estimates. Cholesterol quartiles derived from NHANES
2005-2006 were used to analyze both surveys: 1) HDL-C (low [≤41.83 mg/dL]; medium [>41.83–51.38
mg/dL]; high [>51.38–62.93 mg/dL]; very high [>62.93 mg/dL]); and 2) non-HDL-C (low [≤114.42
mg/dL]; medium [>114.42–140.1 mg/dL]; high [>140.1–168.28 mg/dL]; very high [>168.28 mg/dL]).
Cholesterol quartiles for NHANES 2007-2008 were similar, as follows: 1) HDL-C (low [≤40.04 mg/dL];
by guest, on March 28, 2019
ww
w.jlr.org
Dow
nloaded from

7
medium [>40.04–49.14 mg/dL]; high [>49.14–60.61 mg/dL]; very high [>60.61 mg/dL]); and 2) non-
HDL-C (low [≤115.06 mg/dL]; medium [>115.06–140.67 mg/dL]; high [>140.67–170.08 mg/dL]; very
high [>170.08 mg/dL]). Five sets of models were run: 1) unadjusted; 2) adjusted for age, race/ethnicity,
gender, smoking, and BMI; 3) adjusted for age race/ethnicity, gender, smoking BMI, and fasting time; 4)
adjusted for age race/ethnicity, gender, smoking BMI, and C-reactive protein; and 5) adjusted for age
race/ethnicity, gender, smoking BMI, C-reactive protein and fasting time. Because adjustment for fasting
time and CRP did not affect the observed associations, only the crude models (Model 1) and the models
adjusting for age, race/ethnicity, gender, smoking, and BMI (Model 2) are presented in the results section.
A test for trend was used to statistically evaluate variations in the blood parameters across quartile of
cholesterol. A p-value of ≤0.001 was set as a cutoff for statistical significance. This value was chosen
given the large NHANES sample sizes and to account for the multiple blood parameters examined.
by guest, on March 28, 2019
ww
w.jlr.org
Dow
nloaded from

8
Results
The characteristics of the NHANES 2005-2006 and 2007-2008 study populations are shown in Table 1.
The NHANES 2005-2006 study population was approximately equally divided between genders, with a
mean ± SE age of 46.8 ± 0.7 years, and was predominantly (72.4%) non-Hispanic White, with the
remainder represented by non-Hispanic Black, Mexican American, and Other categories. A little under
half of the subjects had fasted (i.e., ≥9 hours) at the time of laboratory analysis, and 13.3 ± 0.8% reported
using a statin drug within the past 30 days. TC and HDL-C were measured in both fasting and non-
fasting NHANES participants, whereas LDL-C was only measured in subjects who had been instructed to
fast. Non-HDL-C (i.e., TC minus HDL-C), a composite measure of atherogenic low density lipoprotein-
cholesterol (LDL-C) and very low density lipoprotein-cholesterol (VLDL-C), has comparable or better
predictive value than LDL-C for cardiovascular disease (29, 30), and both fasting and non-fasting non-
HDL-C are predictive of cardiovascular disease (31). Thus, all primary analyses were based upon non-
HDL-C (derived as TC minus HDL-C) and HDL-C measured in a combined fasting and non-fasting study
population, as previously reported (32). The mean ± SE serum non-HDL-C in the 2005-2006 study
population was 144.4 ± 0.9 mg/dL, and the mean serum HDL-C was 54.6 ± 0.3 mg/dL. Mean ± SE
values for hematocrit, hemoglobin, platelet count, and platelet crit were 42.7 ± 0.2%, 14.4 ± 0.1 g/dL,
272.1 ± 2.0 x 10³/µL, and 0.225 ± 0.002%, respectively. For the 2007-2008 study population, the mean
± SE serum non-HDL-C was 145.3 ± 0.6 mg/dL, and the mean serum HDL-C was 52.0 ± 0.5 mg/dL.
Mean ± SE values for hematocrit, hemoglobin, platelet count, and platelet crit were 41.6 ± 0.2%, 14.3 ±
0.1 g/dL, 258.2 ± 1.3 x 10³/µL, and 0.204 ± 0.002%, respectively.
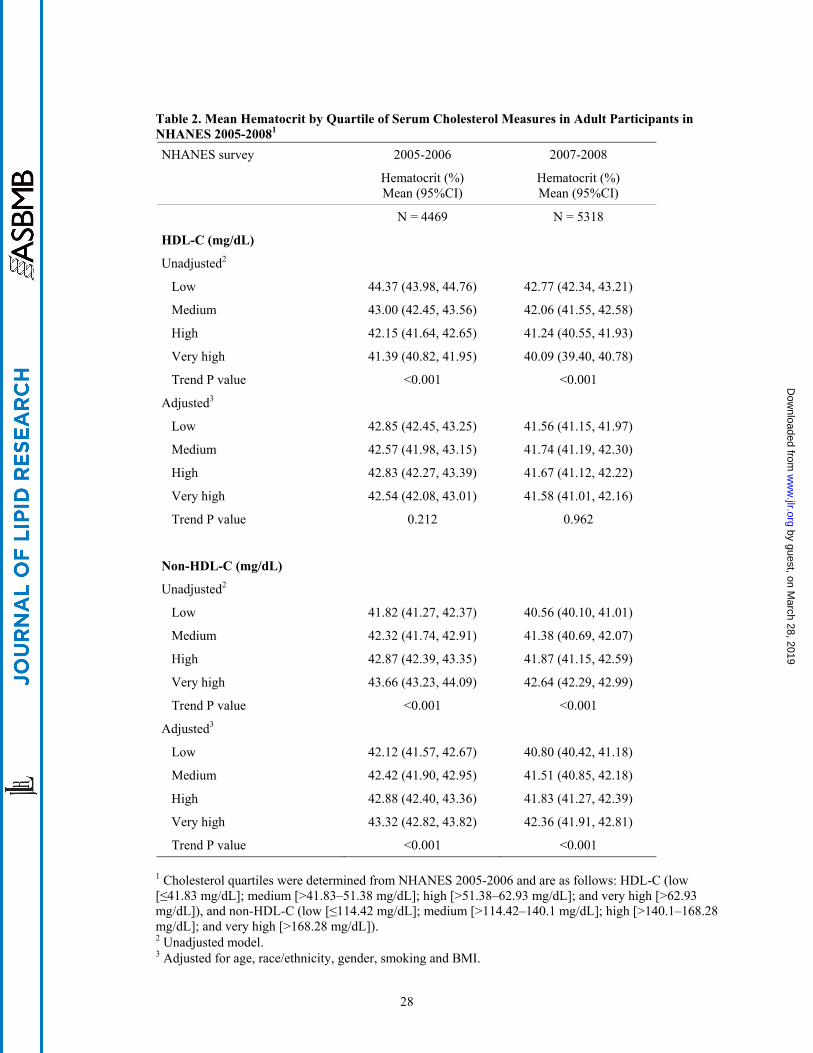
Table 2 presents mean hematocrit by quartile of HDL-C and non-HDL-C. In the unadjusted model,
mean hematocrit decreased as HDL-C increased. However, upon adjustment for age, race/ethnicity,
gender, smoking status, and BMI, this inverse association did not persist. By contrast, mean hematocrit
increased across ascending quartiles of non-HDL-C, and this association persisted after controlling for
age, race/ethnicity, gender, smoking status, and BMI. Additional adjustment for fasting time, erythrocyte
by guest, on March 28, 2019
ww
w.jlr.org
Dow
nloaded from

9
folate, and CRP did not appreciably impact results (data not shown). No relationship was found between
ascending categories of non-HDL-C and transferrin saturation or serum folate (data not shown). As
shown in Table 2, we repeated these analyses using data from NHANES 2007-2008, and while absolute
mean values varied, the associations were replicated.
As shown in Table 3, patterns of association of cholesterol with mean hemoglobin concentration, an
alternate clinically used metric of erythrocyte mass, were similar to those observed for hematocrit. In
adjusted analyses, there was no significant association between HDL-C and hemoglobin, while there was
a significant increase in hemoglobin across increasing quartiles of non-HDL-C. As for hematocrit, the
associations of hemoglobin to HDL-C and non-HDL-C observed in NHANES 2005-2006 were replicated
in NHANES 2007-2008.
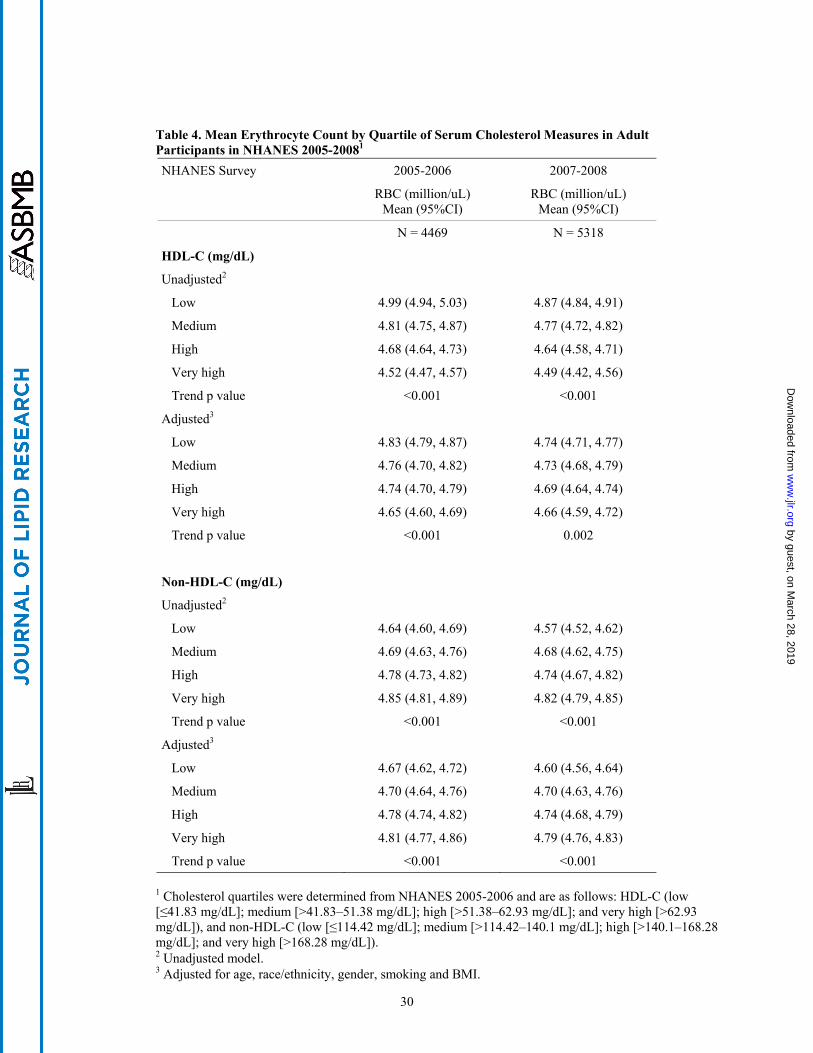
Consistent with the findings for hematocrit and hemoglobin, a significant increase was also observed in
unadjusted and adjusted erythrocyte number across ascending categories of non-HDL-C in both surveys
(Table 4). By contrast, while the inverse relationships of HDL-C to hematocrit and hemoglobin did not
persist after adjustment for covariates, an inverse relationship of HDL-C to erythrocyte number was
observed in both unadjusted and adjusted analyses of NHANES 2005-2006. This relationship was
attenuated after adjustment in NHANES 2007-2008, marginally missing the significance threshold.
Increasing MCV was observed across ascending quartiles of HDL-C in both adjusted and unadjusted
models; this was observed in both NHANES surveys (Table 5). This relationship persisted after
controlling for transferrin saturation and erythrocyte folate (data not shown). No relationship was
observed between non-HDL-C and MCV.
Serum cholesterol-platelet relationships were next examined. As for hematocrit, a significant increase in
platelet crit was observed across ascending categories of non-HDL-C in unadjusted and adjusted models
by guest, on March 28, 2019
ww
w.jlr.org
Dow
nloaded from
10
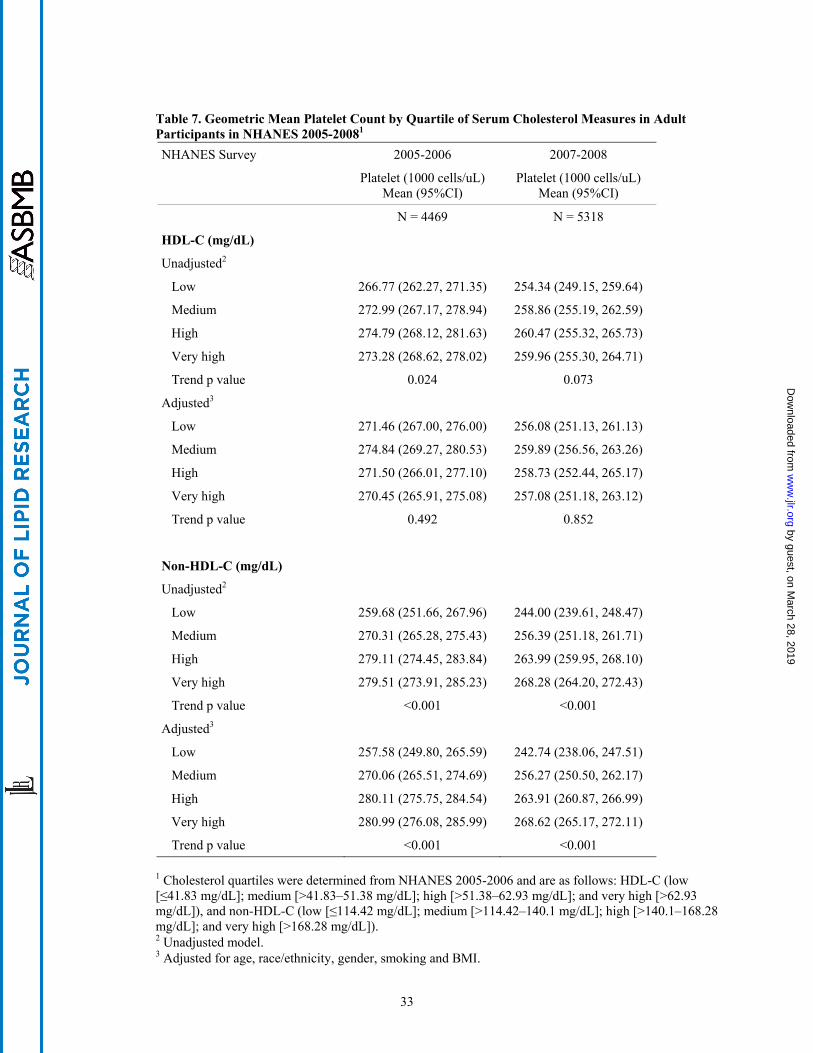
(Table 6). Similar to the findings for erythrocyte number, a significant increase in mean platelet count
was also observed across ascending categories of non-HDL-C in unadjusted and adjusted models (Table
7). This relationship was seen in both NHANES surveys, and also persisted after adjustment for fasting
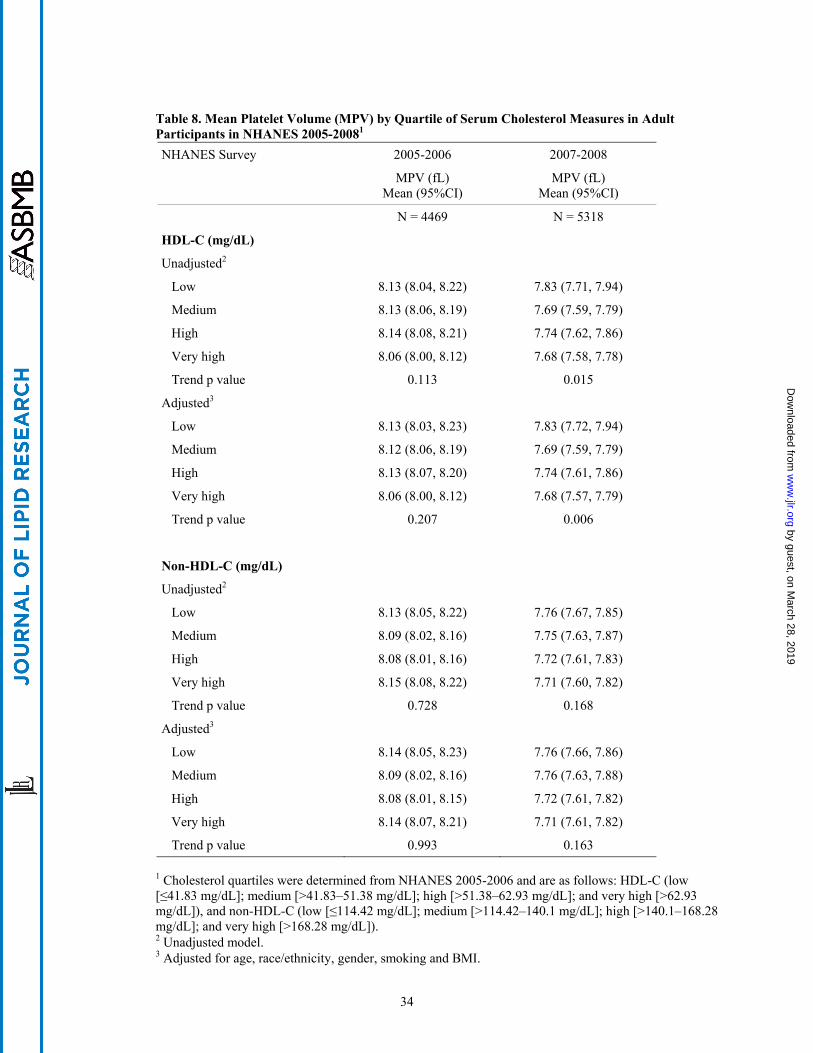
time, CRP, and erythrocyte folate (data not shown). However, no consistent relationship was seen
between either HDL-C or non-HDL-C and MPV (Table 8).
In order to evaluate the robustness of these associations, we performed a sensitivity analysis of the
NHANES 2005-2006 study population in which we excluded subjects (N=1,375) with one or more of the
following conditions known to impact serum cholesterol levels and/or blood cell counts: 1) history of
liver disease; 2) history of cancer; 3) statin use within past 30 days; 4) current pregnancy; and 5)
treatment for anemia within the past 3 months. Neither the magnitude nor the statistical significance of
any of the relationships of HDL-C and non-HDL-C to hematocrit, hemoglobin, erythrocyte count, MCV,
platelet crit, and platelet count was changed after these exclusions (Supplementary Tables 1-6).
Analysis of the lipoprotein strata in both surveys revealed a significant decline in males across ascending
HDL-C quartiles. Conversely, an increase in males across ascending non-HDL-C quartiles was observed
in NHANES 2005-2006 (Supplementary Table 7). Given this, in order to address possible persisting
effects of gender upon our analysis, we also repeated the analyses within gender strata. The significant
increases in hematocrit, hemoglobin, erythrocyte count, and platelet count seen in both surveys across
increasing quartiles of non-HDL-C were also observed in gender-stratified analyses (i.e., within both
males and females separately)(Supplementary Tables 8-15). The significant increase in MCV across
increasing quartiles of HDL-C was seen within both genders in NHANES 2005-2006 and within males in
NHANES 2007-2008, but fell just short of significance (p=0.004) within females in the adjusted model in
NHANES 2007-2008 (Supplementary Tables 16-17).
by guest, on March 28, 2019
ww
w.jlr.org
Dow
nloaded from
11
Differences in the percentage of fasting subjects were also noted across HDL-C and non-HDL-C
quartiles, although most differences fell short of statistical significance (Supplementary Table 18). In
order to more confidently exclude confounding by fasting, we evaluated the relationship of HDL-C and
non-HDL-C to blood cell parameters among the subset of the study population that had fasted (i.e., ≥9
hours). As shown in Supplementary Tables 19-24, we obtained very similar results to those obtained in
the mixed fasting-nonfasting study population.
by guest, on March 28, 2019
ww
w.jlr.org
Dow
nloaded from
12
Discussion
Examining U.S. national data from NHANES 2005-2006, we report that serum non-HDL-C is positively
related to abundance measures of both erythrocytes (erythrocyte number, hematocrit, hemoglobin
concentration) and platelets (platelet crit, platelet count). This is independent of age, race/ethnicity,
gender, smoking status, and BMI. Conversely, an inverse relationship was found between HDL-C and
erythrocyte number. We also report that HDL-C is directly related to erythrocyte MCV, whereas no
relationships were found between either HDL-C or non-HDL-C and MPV. Consistent findings were
observed in an independent study population from NHANES 2007-2008.
Erythrocytes and platelets, anucleate blood cells with no significant capacity for cholesterol storage but
with high capacity for diffusional exchange of cholesterol with plasma, have long been proposed to have
a relationship to extracellular cholesterol that differs substantially from that of leukocytes (7). Coordinate
abnormalities of erythrocytes and platelets have been observed in gene-targeted rodent models of
dyslipidemia (4, 6, 13). Conversely, low serum cholesterol has been reported in several types of anemia
and found to reverse upon treatment of anemia (11). However, the broader relevance of these
relationships to human health has remained undefined.
Studies extending back over 30 years have elegantly shown that in vitro incubation of erythrocytes and
platelets with cholesterol-enriched lipid dispersions or LDL leads to cholesterol incorporation into the cell
membrane, and that cholesterol incorporation may regulate cell populations through impacting membrane
stability (16, 33). Membrane fluidity is reduced and order increased in parallel with increases in
membrane cholesterol/phospholipid ratio (16). This may explain clinical reports, generally consistent
with the present one, that LDL-C, erythrocyte membrane stability, and hematocrit are all positively
correlated (34). It has also been proposed that the stability of erythrocytes may be maximal within an
optimal range of membrane fluidity (and thus membrane cholesterol)(17). Thus, under cholesterol-
loading conditions that exceed the critical range, erythrocyte membrane stability is impaired, likely
by guest, on March 28, 2019
ww
w.jlr.org
Dow
nloaded from

13
accounting for the increased erythrocyte osmotic fragility and spur cell and hemolytic anemias seen in
experimental animals fed a high-cholesterol diet (10, 12), and the erythrocyte membrane damage
observed in hypercholesterolemic humans (9). Conversely, LDL-C reduction in hypercholesterolemic
multiple sclerosis patients with statin therapy has been shown to increase erythrocyte stability (17).
As has been proposed for erythrocytes, it is possible that non-HDL-C may impact platelet number in part
through effects on membrane stability. Interestingly, however, recent studies have suggested the potential
for additional mechanisms. Thus, it has been reported that high LDL-C induces thrombocytosis in mice
in part through delocalization of megakaryocytes in the bone marrow due to an altered gradient of stromal
cell-derived factor-1 (35). It is also reported that cholesterol loading of megakaryocyte progenitors
induces thrombocytosis through enhancing cell surface expression and activation of the thrombopoietin
receptor, c-MPL (36).
Several case series have documented hypocholesterolemia as a common finding in a wide variety of
anemias, including megaloblastic anemia, hereditary spherocytosis, sickle cell disease, aplastic anemia,
glucose-6-phosphate deficiency, and anemia associated with liver disease (11). These studies suggest
that, in addition to effects of serum cholesterol on erythrocyte populations, erythrocyte kinetics may
reciprocally affect cholesterol status. Remarkably, following treatment of several disparate anemias,
ranging from B12/folate repletion for megaloblastic anemia, to splenectomy for hereditary spherocytosis,
to red blood cell transfusion for sickle cell disease or aplastic anemia, an increase in serum cholesterol has
been noted that parallels the correction in hematocrit (11, 37). While this has led some investigators to
hypothesize that serum cholesterol may be reduced during anemia by hemodilution, low serum
cholesterol during hemolytic anemias has been attributed by others to consumption by avid erythropoiesis
in the bone marrow (38, 39). Additional hypotheses for anemia-associated hypocholesterolemia have
included reduced cholesterol biosynthesis by the liver and increased cholesterol clearance by the
by guest, on March 28, 2019
ww
w.jlr.org
Dow
nloaded from
14
reticuloendothelial system. There have been no studies, to our knowledge, that have investigated serum
cholesterol levels during primary platelet disorders.
While it is plausible that disease extremes such as hemolytic anemia may serve to reveal some of the
mechanisms that govern blood cell-cholesterol relationships during health, it is likely that additional
mechanisms may be at work in large human populations. For example, malnutrition has the potential to
reduce both serum cholesterol and circulating numbers of erythrocytes (e.g., through iron deficiency) and
platelets (e.g., through folate or vitamin B12 deficiency) (40). Similarly, inflammation has complex
effects, as it can be associated with anemia (41), altered serum cholesterol transport (42), and
thrombocytosis (43). Arguing against an important role for nutritional factors in our findings, the
relationships persisted after adjustment for red blood cell folate and BMI, and no relationship was
detected between non-HDL-C and either transferrin saturation (a marker of iron status) or serum folate.
In addition, our finding that the relationships persisted after adjustment for CRP argues against
confounding by inflammation.
To date, there have been very few systematic evaluations of red cell abundance across varying levels of
serum cholesterol in large human populations. In 1972, Böttiger and Carlson reported a positive
correlation between serum cholesterol and hemoglobin in 2,458 non-anemic subjects (20); a similar
correlation between serum cholesterol and hematocrit was noted by another group 20 years later (21).
More recently, no relationship was found between serum cholesterol and erythrocyte number, hematocrit,
hemoglobin concentration, or MCV (22). However, this study involved just 463 subjects, all of whom
were elderly and from South Korea. Another small study documented increased erythrocyte membrane
cholesterol in patients with primary hypercholesterolemia, but did not report on erythrocyte abundance
indices (44). The few studies of platelet number during cholesterol disorders have yielded disparate
findings. Pathansali and colleagues reported no alteration in platelet count in 8 patients with primary
hypercholesterolemia (24). By contrast, in a Japanese study of 387 men and 550 women, platelet counts
by guest, on March 28, 2019
ww
w.jlr.org
Dow
nloaded from

15
in women correlated negatively with HDL-C but were unrelated to non-HDL-C, whereas in men they
were unrelated to HDL-C but were positively correlated to non-HDL-C (23). The latter result is
consistent with our finding in NHANES. Last, of interest but of uncertain significance, thrombocytopenia
has been described in Tangier disease, a condition of low HDL-C due to mutation of the ATP Binding
Cassette Transporter A1 (45).
Interestingly, we found that HDL-C was positively related to MCV, although apparently unrelated to
MPV, suggesting important differences in the relationship of HDL to erythrocytes and platelets. HDL-C
was also inversely related to erythrocyte count. These findings are somewhat reminiscent of the SR-BI-
null mouse, which, along with marked increases in HDL-C, is reported to have macrocytic anemia (6, 13).
In that setting, it is thought that increased erythrocyte membrane cholesterol deriving from HDL may both
impair erythrocyte maturation (13), and promote hemolysis through effects on osmotic fragility and
deformability (6). The analogy to our study may be imperfect, however, given that SR-BI-null mice have
abnormally large HDL particles as well as increased free cholesterol, and their elevated MCV may in part
derive from reticulocytosis (6, 13).
Our study has limitations. Importantly, the cross-sectional design of the NHANES precludes inferences
of causality between blood cell abundance and serum cholesterol. It is possible that serum cholesterol
and erythrocyte/platelet levels, rather than causally impacting each other, may track together as
biomarkers of a separate, underlying condition. Our sensitivity analysis, nonetheless, indicates that the
relationships do persist after several common conditions affecting blood cell levels and cholesterol are
excluded. Although the ratio of free:total cholesterol has been linked to platelet abnormalities in mouse
and man (4, 46), we were unable to analyze free cholesterol as it was not measured in the NHANES.
Also, ABO blood group type, recently shown in a genome-wide association study to be associated with
LDL-C (47), was not determined in NHANES. Two additional variables that we did not analyze, but that
have important effects upon erythrocyte membrane stability, are albumin concentration (48) and glucose
by guest, on March 28, 2019
ww
w.jlr.org
Dow
nloaded from

16
concentration (49). Strengths of our analysis include the large size of our study population and our
replication of results in a separate cohort. In addition, we analyzed HDL-C and non-HDL-C, and not just
TC (the sum of HDL-C and non-HDL-C), allowing us to identify distinct relationships for these different
lipoprotein categories.
The effect size of the adjusted relationships of non-HDL-C to erythrocyte parameters are modest when
considered in isolation. A somewhat more impressive relationship was found for platelets, where a nearly
10% difference in mean platelet count was observed between the lowest and highest non-HDL-C quartiles
in the adjusted model. While these relationships are of uncertain clinical significance, erythrocytosis,
thrombocytosis, and hypercholesterolemia are all risk factors for thrombosis (50, 51). If, as our data
suggest, these variables track together in human subjects, it is possible that they may synergize in
promoting cardiovascular disease. Indeed, emerging data suggest that erythrocytes, and erythrocyte
membrane cholesterol, in particular, are independently associated with clinical instability in coronary
artery disease patients (26, 52). Interestingly, red blood cell distribution width, a strong prognostic
marker in cardiovascular disease, is positively associated with erythrocyte membrane cholesterol (53).
Similarly, platelet cholesterol overload correlates with platelet activation and coronary artery disease (28).
Atorvastatin is reported to decrease erythrocyte membrane cholesterol in human subjects (54). The lack
of a change in our results after excluding statin-treated subjects may suggest that pharmacologic reduction
of cholesterol is associated with similar effects on blood cell indices as other environmental or genetic
influences on cholesterol present in the general population. Nonetheless, whether interventions upon
serum cholesterol such as statins impact population kinetics of erythrocytes and/or platelets is an
important question that may require investigation using a prospective study design. Finally, our findings
at least raise the possibility that non-HDL-C may act as a disease modifier of primary disorders of
erythrocytes and platelets. For example, elevated non-HDL-C could conceivably attenuate anemia from
iron-deficiency and/or aggravate erythrocytosis in polycythemia vera. Conversely, our findings raise the
by guest, on March 28, 2019
ww
w.jlr.org
Dow
nloaded from
17
possibility that circulating erythrocyte and/or platelet counts could modify the expression of primary
hypercholesterolemia.
In closing, we report for the first time that non-HDL-C is directly related to abundance measures of
circulating erythrocytes and platelets in the U.S. population, whereas HDL-C is directly related to MCV.
Given that elevated erythrocytes, elevated platelets, and hypercholesterolemia are all established risk
factors for coronary disease and that hypercholesterolemia impairs erythrocyte deformability (55), and
activates platelets (56, 57), our findings suggest an important need for characterizing possible
mechanisms by which serum cholesterol and the population kinetics of erythrocytes and platelets may
impact one another.
by guest, on March 28, 2019
ww
w.jlr.org
Dow
nloaded from

18
Acknowledgments
This work was supported in part by the Intramural Research Program of the National Institute of
Environmental Health Sciences, National Institutes of Health (Z01 ES102005 and Z01 ES025041).
by guest, on March 28, 2019
ww
w.jlr.org
Dow
nloaded from
19
References
1. Ford, E. S. 2003. The metabolic syndrome and C-reactive protein, fibrinogen, and leukocyte
count: findings from the Third National Health and Nutrition Examination Survey. Atherosclerosis 168:
351-358.
2. Tsai, J. C., S. H. Sheu, H. C. Chiu, F. M. Chung, D. M. Chang, M. P. Chen, S. J. Shin, and Y. J.
Lee. 2007. Association of peripheral total and differential leukocyte counts with metabolic syndrome and
risk of ischemic cardiovascular diseases in patients with type 2 diabetes mellitus. Diabetes Metab Res Rev
23: 111-118.
3. Desai, M. Y., D. Dalal, R. D. Santos, J. A. Carvalho, K. Nasir, and R. S. Blumenthal. 2006.
Association of body mass index, metabolic syndrome, and leukocyte count. Am J Cardiol 97: 835-838.
4. Dole, V. S., J. Matuskova, E. Vasile, A. Yesilaltay, W. Bergmeier, M. Bernimoulin, D. D.
Wagner, and M. Krieger. 2008. Thrombocytopenia and platelet abnormalities in high-density lipoprotein
receptor-deficient mice. Arterioscler Thromb Vasc Biol 28: 1111-1116.
5. Guo, Y., C. Niu, P. Breslin, M. Tang, S. Zhang, W. Wei, A. R. Kini, G. P. Paner, S. Alkan, S. W.
Morris, M. Diaz, P. J. Stiff, and J. Zhang. 2009. c-Myc-mediated control of cell fate in megakaryocyte-
erythrocyte progenitors. Blood 114: 2097-2106.
6. Meurs, I., M. Hoekstra, E. J. van Wanrooij, R. B. Hildebrand, J. Kuiper, F. Kuipers, M. R.
Hardeman, T. J. Van Berkel, and M. Van Eck. 2005. HDL cholesterol levels are an important factor for
determining the lifespan of erythrocytes. Exp Hematol 33: 1309-1319.
7. Schick, B. P., and P. K. Schick. 1985. Cholesterol exchange in platelets, erythrocytes and
megakaryocytes. Biochim Biophys Acta 833: 281-290.
8. Gottlieb, M. H. 1980. Rates of cholesterol exchange between human erythrocytes and plasma
lipoproteins. Biochim Biophys Acta 600: 530-541.
9. Koter, M., I. Franiak, K. Strychalska, M. Broncel, and J. Chojnowska-Jezierska. 2004. Damage to
the structure of erythrocyte plasma membranes in patients with type-2 hypercholesterolemia. Int J
Biochem Cell Biol 36: 205-215.
by guest, on March 28, 2019
ww
w.jlr.org
Dow
nloaded from
20
10. Akahane, K., K. Furuhama, and T. Onodera. 1986. Simultaneous occurrence of
hypercholesterolemia and hemolytic anemia in rats fed cholesterol diet. Life Sci 39: 499-505.
11. Atac, B., D. Brahaj, W. H. Frishman, and R. Lerner. 2003. Anemia and hypocholesterolemia.
Heart Dis 5: 65-71.
12. Cooper, R. A., M. H. Leslie, D. Knight, and D. K. Detweiler. 1980. Red cell cholesterol
enrichment and spur cell anemia in dogs fed a cholesterol-enriched atherogenic diet. J Lipid Res 21:
1082-1089.
13. Holm, T. M., A. Braun, B. L. Trigatti, C. Brugnara, M. Sakamoto, M. Krieger, and N. C.
Andrews. 2002. Failure of red blood cell maturation in mice with defects in the high-density lipoprotein
receptor SR-BI. Blood 99: 1817-1824.
14. Wanless, I. R. 1984. The effect of dietary cholesterol on platelet survival in the rabbit--a study
using 14C-serotonin and 51chromium double-labelled platelets. Thromb Haemost 52: 85-89.
15. Korporaal, S. J., I. Meurs, A. D. Hauer, R. B. Hildebrand, M. Hoekstra, H. T. Cate, D. Pratico, J.
W. Akkerman, T. J. Van Berkel, J. Kuiper, and M. Van Eck. 2011. Deletion of the high-density
lipoprotein receptor scavenger receptor BI in mice modulates thrombosis susceptibility and indirectly
affects platelet function by elevation of plasma free cholesterol. Arterioscler Thromb Vasc Biol 31: 34-42.
16. Cooper, R. A., M. H. Leslie, S. Fischkoff, M. Shinitzky, and S. J. Shattil. 1978. Factors
influencing the lipid composition and fluidity of red cell membranes in vitro: production of red cells
possessing more than two cholesterols per phospholipid. Biochemistry 17: 327-331.
17. de Freitas, M. V., M. R. de Oliveira, D. F. dos Santos, R. de Cassia Mascarenhas Netto, S. B.
Fenelon, and N. Penha-Silva. 2010. Influence of the use of statin on the stability of erythrocyte
membranes in multiple sclerosis. The Journal of membrane biology 233: 127-134.
18. Nikolic, M., D. Stanic, I. Baricevic, D. R. Jones, O. Nedic, and V. Niketic. 2007. Efflux of
cholesterol and phospholipids derived from the haemoglobin-lipid adduct in human red blood cells into
plasma. Clin Biochem 40: 305-309.
by guest, on March 28, 2019
ww
w.jlr.org
Dow
nloaded from

21
19. Chung, B. H., F. Franklin, B. H. Cho, J. P. Segrest, K. Hart, and B. E. Darnell. 1998. Potencies of
lipoproteins in fasting and postprandial plasma to accept additional cholesterol molecules released from
cell membranes. Arterioscler Thromb Vasc Biol 18: 1217-1230.
20. Bottiger, L. E., and L. A. Carlson. 1972. Relation between serum cholesterol and triglyceride
concentration and haemoglobin values in non-anaemic healthy persons. British medical journal 3: 731-
733.
21. Kochar, M. S., S. Paka, and M. J. Kim. 1992. Relation between serum cholesterol and hematocrit.
JAMA : the journal of the American Medical Association 267: 1071.
22. Choi, J. W., and S. H. Pai. 2004. Influences of hypercholesterolemia on red cell indices and
erythrocyte sedimentation rate in elderly persons. Clin Chim Acta 341: 117-121.
23. Kameda, S., T. Sakata, Y. Kokubo, M. Mitsuguro, A. Okamoto, M. Sano, and T. Miyata. 2011.
Association of platelet aggregation with lipid levels in the Japanese population: the Suita study. J
Atheroscler Thromb 18: 560-567.
24. Pathansali, R., N. Smith, and P. Bath. 2001. Altered megakaryocyte-platelet haemostatic axis in
hypercholesterolaemia. Platelets 12: 292-297.
25. Zhang, J., L. Pan, Y. Xu, C. Wu, C. Wang, Z. Cheng, and R. Zhao. 2011. Total cholesterol
content of erythrocyte membranes in acute coronary syndrome: correlation with apolipoprotein A-I and
lipoprotein (a). Coron Artery Dis 22: 145-152.
26. Tziakas, D. N., J. C. Kaski, G. K. Chalikias, C. Romero, S. Fredericks, I. K. Tentes, A. X.
Kortsaris, D. I. Hatseras, and D. W. Holt. 2007. Total cholesterol content of erythrocyte membranes is
increased in patients with acute coronary syndrome: a new marker of clinical instability? J Am Coll
Cardiol 49: 2081-2089.
27. Danesh, J., R. Collins, R. Peto, and G. D. Lowe. 2000. Haematocrit, viscosity, erythrocyte
sedimentation rate: meta-analyses of prospective studies of coronary heart disease. Eur Heart J 21: 515-
520.
by guest, on March 28, 2019
ww
w.jlr.org
Dow
nloaded from
22
28. Ravindran, R., and L. K. Krishnan. 2007. Increased platelet cholesterol and decreased percentage
volume of platelets as a secondary risk factor for coronary artery disease. Pathophysiol Haemost Thromb
36: 45-51.
29. Davidson, M. H. 2008. Is LDL-C passed its prime? The emerging role of non-HDL, LDL-P, and
ApoB in CHD risk assessment. Arterioscler Thromb Vasc Biol 28: 1582-1583.
30. Liu, J., C. T. Sempos, R. P. Donahue, J. Dorn, M. Trevisan, and S. M. Grundy. 2006. Non-high-
density lipoprotein and very-low-density lipoprotein cholesterol and their risk predictive values in
coronary heart disease. Am J Cardiol 98: 1363-1368.
31. Mora, S., N. Rifai, J. E. Buring, and P. M. Ridker. 2008. Fasting compared with nonfasting lipids
and apolipoproteins for predicting incident cardiovascular events. Circulation 118: 993-1001.
32. Fessler, M. B., M. W. Massing, B. Spruell, R. Jaramillo, D. W. Draper, J. H. Madenspacher, S. J.
Arbes, A. Calatroni, and D. C. Zeldin. 2009. Novel relationship of serum cholesterol with asthma and
wheeze in the United States. J Allergy Clin Immunol 124: 967-974 e961-915.
33. Cooper, R. A. 1977. Abnormalities of cell-membrane fluidity in the pathogenesis of disease. The
New England journal of medicine 297: 371-377.
34. de Arvelos, L. R., V. C. Rocha, G. P. Felix, C. C. da Cunha, M. Bernardino Neto, M. da Silva
Garrote Filho, C. de Fatima Pinheiro, E. S. Resende, and N. Penha-Silva. 2013. Bivariate and multivariate
analyses of the influence of blood variables of patients submitted to Roux-en-Y gastric bypass on the
stability of erythrocyte membrane against the chaotropic action of ethanol. The Journal of membrane
biology 246: 231-242.
35. Gomes, A. L., T. Carvalho, J. Serpa, C. Torre, and S. Dias. 2010. Hypercholesterolemia promotes
bone marrow cell mobilization by perturbing the SDF-1:CXCR4 axis. Blood 115: 3886-3894.
36. Murphy, A. J., N. Bijl, L. Yvan-Charvet, C. B. Welch, N. Bhagwat, A. Reheman, Y. Wang, J. A.
Shaw, R. L. Levine, H. Ni, A. R. Tall, and N. Wang. 2013. Cholesterol efflux in megakaryocyte
progenitors suppresses platelet production and thrombocytosis. Nature medicine 19: 586-594.
37. Westerman, M. P. 1975. Hypocholesterolaemia and anaemia. Br J Haematol 31: 87-94.
by guest, on March 28, 2019
ww
w.jlr.org
Dow
nloaded from

23
38. Dessi, S., B. Batetta, O. Spano, D. Pulisci, M. F. Mulas, S. Muntoni, M. Armeni, C. Sanna, R.
Antonucci, and P. Pani. 1992. Serum lipoprotein pattern as modified in G6PD-deficient children during
haemolytic anaemia induced by fava bean ingestion. Int J Exp Pathol 73: 157-160.
39. el-Hazmi, M. A., A. S. Warsy, A. al-Swailem, and H. Bahakim. 1995. Red cell genetic disorders
and plasma lipids. J Trop Pediatr 41: 202-205.
40. Mitrache, C., J. R. Passweg, J. Libura, L. Petrikkos, W. O. Seiler, A. Gratwohl, H. B. Stahelin,
and A. Tichelli. 2001. Anemia: an indicator for malnutrition in the elderly. Ann Hematol 80: 295-298.
41. Raj, D. S. 2009. Role of interleukin-6 in the anemia of chronic disease. Semin Arthritis Rheum
38: 382-388.
42. van der Westhuyzen, D. R., F. C. de Beer, and N. R. Webb. 2007. HDL cholesterol transport
during inflammation. Curr Opin Lipidol 18: 147-151.
43. Ceresa, I. F., P. Noris, C. Ambaglio, A. Pecci, and C. L. Balduini. 2007. Thrombopoietin is not
uniquely responsible for thrombocytosis in inflammatory disorders. Platelets 18: 579-582.
44. Vaya, A., M. Martinez Triguero, E. Reganon, V. Vila, V. Martinez Sales, E. Sola, A. Hernandez
Mijares, and A. Ricart. 2008. Erythrocyte membrane composition in patients with primary
hypercholesterolemia. Clin Hemorheol Microcirc 40: 289-294.
45. Fasano, T., P. Zanoni, C. Rabacchi, L. Pisciotta, E. Favari, M. P. Adorni, P. B. Deegan, A. Park,
T. Hlaing, M. D. Feher, B. Jones, A. S. Uzak, F. Kardas, A. Dardis, A. Sechi, B. Bembi, P. Minuz, S.
Bertolini, F. Bernini, and S. Calandra. 2012. Novel mutations of ABCA1 transporter in patients with
Tangier disease and familial HDL deficiency. Molecular genetics and metabolism 107: 534-541.
46. Vergeer, M., S. J. Korporaal, R. Franssen, I. Meurs, R. Out, G. K. Hovingh, M. Hoekstra, J. A.
Sierts, G. M. Dallinga-Thie, M. M. Motazacker, A. G. Holleboom, T. J. Van Berkel, J. J. Kastelein, M.
Van Eck, and J. A. Kuivenhoven. 2011. Genetic variant of the scavenger receptor BI in humans. The New
England journal of medicine 364: 136-145.
47. Teslovich, T. M., K. Musunuru, A. V. Smith, A. C. Edmondson, I. M. Stylianou, M. Koseki, J. P.
Pirruccello, S. Ripatti, D. I. Chasman, C. J. Willer, C. T. Johansen, S. W. Fouchier, A. Isaacs, G. M.
Peloso, M. Barbalic, S. L. Ricketts, J. C. Bis, Y. S. Aulchenko, G. Thorleifsson, M. F. Feitosa, J.
by guest, on March 28, 2019
ww
w.jlr.org
Dow
nloaded from
24
Chambers, M. Orho-Melander, O. Melander, T. Johnson, X. Li, X. Guo, M. Li, Y. Shin Cho, M. Jin Go,
Y. Jin Kim, J. Y. Lee, T. Park, K. Kim, X. Sim, R. Twee-Hee Ong, D. C. Croteau-Chonka, L. A. Lange,
J. D. Smith, K. Song, J. Hua Zhao, X. Yuan, J. Luan, C. Lamina, A. Ziegler, W. Zhang, R. Y. Zee, A. F.
Wright, J. C. Witteman, J. F. Wilson, G. Willemsen, H. E. Wichmann, J. B. Whitfield, D. M. Waterworth,
N. J. Wareham, G. Waeber, P. Vollenweider, B. F. Voight, V. Vitart, A. G. Uitterlinden, M. Uda, J.
Tuomilehto, J. R. Thompson, T. Tanaka, I. Surakka, H. M. Stringham, T. D. Spector, N. Soranzo, J. H.
Smit, J. Sinisalo, K. Silander, E. J. Sijbrands, A. Scuteri, J. Scott, D. Schlessinger, S. Sanna, V. Salomaa,
J. Saharinen, C. Sabatti, A. Ruokonen, I. Rudan, L. M. Rose, R. Roberts, M. Rieder, B. M. Psaty, P. P.
Pramstaller, I. Pichler, M. Perola, B. W. Penninx, N. L. Pedersen, C. Pattaro, A. N. Parker, G. Pare, B. A.
Oostra, C. J. O'Donnell, M. S. Nieminen, D. A. Nickerson, G. W. Montgomery, T. Meitinger, R.
McPherson, M. I. McCarthy, W. McArdle, D. Masson, N. G. Martin, F. Marroni, M. Mangino, P. K.
Magnusson, G. Lucas, R. Luben, R. J. Loos, M. L. Lokki, G. Lettre, C. Langenberg, L. J. Launer, E. G.
Lakatta, R. Laaksonen, K. O. Kyvik, F. Kronenberg, I. R. Konig, K. T. Khaw, J. Kaprio, L. M. Kaplan, A.
Johansson, M. R. Jarvelin, A. C. Janssens, E. Ingelsson, W. Igl, G. Kees Hovingh, J. J. Hottenga, A.
Hofman, A. A. Hicks, C. Hengstenberg, I. M. Heid, C. Hayward, A. S. Havulinna, N. D. Hastie, T. B.
Harris, T. Haritunians, A. S. Hall, U. Gyllensten, C. Guiducci, L. C. Groop, E. Gonzalez, C. Gieger, N. B.
Freimer, L. Ferrucci, J. Erdmann, P. Elliott, K. G. Ejebe, A. Doring, A. F. Dominiczak, S. Demissie, P.
Deloukas, E. J. de Geus, U. de Faire, G. Crawford, F. S. Collins, Y. D. Chen, M. J. Caulfield, H.
Campbell, N. P. Burtt, L. L. Bonnycastle, D. I. Boomsma, S. M. Boekholdt, R. N. Bergman, I. Barroso, S.
Bandinelli, C. M. Ballantyne, T. L. Assimes, T. Quertermous, D. Altshuler, M. Seielstad, T. Y. Wong, E.
S. Tai, A. B. Feranil, C. W. Kuzawa, L. S. Adair, H. A. Taylor, Jr., I. B. Borecki, S. B. Gabriel, J. G.
Wilson, H. Holm, U. Thorsteinsdottir, V. Gudnason, R. M. Krauss, K. L. Mohlke, J. M. Ordovas, P. B.
Munroe, J. S. Kooner, A. R. Tall, R. A. Hegele, J. J. Kastelein, E. E. Schadt, J. I. Rotter, E. Boerwinkle,
D. P. Strachan, V. Mooser, K. Stefansson, M. P. Reilly, N. J. Samani, H. Schunkert, L. A. Cupples, M. S.
Sandhu, P. M. Ridker, D. J. Rader, C. M. van Duijn, L. Peltonen, G. R. Abecasis, M. Boehnke, and S.
Kathiresan. 2010. Biological, clinical and population relevance of 95 loci for blood lipids. Nature 466:
707-713.
by guest, on March 28, 2019
ww
w.jlr.org
Dow
nloaded from

25
48. Fonseca, L. C., L. R. Arvelos, R. C. Netto, A. B. Lins, M. S. Garrote-Filho, and N. Penha-Silva.
2010. Influence of the albumin concentration and temperature on the lysis of human erythrocytes by
sodium dodecyl sulfate. Journal of bioenergetics and biomembranes 42: 413-418.
49. Lemos, G. S., L. F. Marquez-Bernardes, L. R. Arvelos, L. F. Paraiso, and N. Penha-Silva. 2011.
Influence of glucose concentration on the membrane stability of human erythrocytes. Cell biochemistry
and biophysics 61: 531-537.
50. Pearson, T. C. 2002. The risk of thrombosis in essential thrombocythemia and polycythemia vera.
Semin Oncol 29: 16-21.
51. Vaya, A., Y. Mira, M. Martinez, P. Villa, F. Ferrando, A. Estelles, D. Corella, and J. Aznar. 2002.
Biological risk factors for deep vein trombosis. Clin Hemorheol Microcirc 26: 41-53.
52. Tziakas, D. N., G. K. Chalikias, D. Stakos, I. K. Tentes, D. Papazoglou, A. Thomaidi, A. Grapsa,
G. Gioka, J. C. Kaski, and H. Boudoulas. 2011. Independent and additive predictive value of total
cholesterol content of erythrocyte membranes with regard to coronary artery disease clinical presentation.
International journal of cardiology 150: 22-27.
53. Tziakas, D., G. Chalikias, A. Grapsa, T. Gioka, I. Tentes, and S. Konstantinides. 2012. Red blood
cell distribution width: a strong prognostic marker in cardiovascular disease: is associated with
cholesterol content of erythrocyte membrane. Clin Hemorheol Microcirc 51: 243-254.
54. Koter, M., M. Broncel, J. Chojnowska-Jezierska, K. Klikczynska, and I. Franiak. 2002. The effect
of atorvastatin on erythrocyte membranes and serum lipids in patients with type-2 hypercholesterolemia.
Eur J Clin Pharmacol 58: 501-506.
55. Kohno, M., K. Murakawa, K. Yasunari, K. Yokokawa, T. Horio, H. Kano, M. Minami, and J.
Yoshikawa. 1997. Improvement of erythrocyte deformability by cholesterol-lowering therapy with
pravastatin in hypercholesterolemic patients. Metabolism 46: 287-291.
56. Opper, C., C. Clement, H. Schwarz, J. Krappe, A. Steinmetz, J. Schneider, and W. Wesemann.
1995. Increased number of high sensitive platelets in hypercholesterolemia, cardiovascular diseases, and
after incubation with cholesterol. Atherosclerosis 113: 211-217.
by guest, on March 28, 2019
ww
w.jlr.org
Dow
nloaded from

26
57. Korporaal, S. J., and J. W. Akkerman. 2006. Platelet activation by low density lipoprotein and
high density lipoprotein. Pathophysiol Haemost Thromb 35: 270-280.
by guest, on March 28, 2019
ww
w.jlr.org
Dow
nloaded from

26
Table 1. Characteristics of the NHANES 2005-2006 and 2007-2008 study populations, aged ≥20 years
NHANES 2005-2006 NHANES 2007-2008
N3 Mean/% SE N3 Mean/% SE
Total 4469 100.0 5318 100.0
Gender
Male 2148 48.1 0.6 2608 48.2 0.6
Female 2321 51.9 0.6 2710 51.8 0.6
Race/Ethnicity
White Non-Hispanic 2254 72.4 2.7 2537 70.0 3.6
Black Non-Hispanic 996 11.1 1.9 1018 10.3 1.8
Mexican American 910 8.0 1.0 941 8.5 1.5
Other1 309 8.5 1.1 822 11.2 1.8
Mean age (years) 4469 46.8 0.7 5318 47.0 0.4
BMI (kg/m2)
Underweight (<18.5) 142 2.9 0.3 155 2.6 0.3
Healthy (≥18.5 to 25) 1261 30.7 1.3 1432 30.0 0.9
Overweight (≥25 to 30) 1507 32.3 0.8 1826 34.3 0.8
Obese (≥30) 1559 34.0 1.4 1905 33.0 1.1
Education Attainment2
Less than 9th grade 523 6.4 0.7 681 7.0 0.7
9-11th grade 648 11.6 1.3 876 12.9 1.4
High school grade or GED 1052 24.9 1.0 1317 25.6 1.3
Some College 1248 30.9 1.1 1299 27.9 1.0
College Graduate and above 879 26.3 2.1 1034 26.6 2.1
Mean CRP (mg/L) 4468 4.3 0.2 5315 4.0 0.1
Smoking Status
Never 2348 51.1 1.3 2788 52.9 1.7
Past 1135 24.9 1.0 1344 24.6 0.7
Current 983 24.0 1.2 1180 22.5 1.3
Fasting (≥9 hrs) 2065 46.2 0.7 2475 46.1 1.2
HDL-C (mg/dL) 4469 54.6 0.3 5318 52.0 0.5
Non-HDL-C (mg/dL) 4469 144.4 0.9 5318 145.3 0.6
Hematocrit (%) 4469 42.7 0.2 5318 41.6 0.2
Hemoglobin (g/dL)4 4469 14.4 0.1 5318 14.3 0.1
Erythrocyte Count (million/uL) 4469 4.7 0.02 5318 4.7 0.02
Erythrocyte MCV (fL)5 4469 90.2 0.2 5318 88.6 0.3
Platelets (1000 cells/uL)4 4469 272.1 2.0 5318 258.2 1.3
Mean platelet volume (fL) 4469 8.1 0.03 5318 7.7 0.05
by guest, on March 28, 2019
ww
w.jlr.org
Dow
nloaded from

27
Platelet crit (%) 4469 0.225 0.002 5318 0.204 0.002
Statin use, past 30 days 645 13.3 0.8 972 15.1 0.6
Hemoglobin A1C ≥6.5% 6 385 6.2 0.5 611 7.8 0.7
1 Includes Hispanics other than Mexican Americans, other race/ethnic groups, and persons reporting a race/ethnicity in more than one category. 2 Based on education of the referent household member. 3 The sum of the Ns for levels of individual characteristics may be slightly lower than the total N due to a small percentage of missing values. 4 Geometric mean 5 MCV = mean corpuscular volume. 6 Hemoglobin A1C ≥6.5% was proposed as diagnostic of diabetes by 2011 Executive Summary Guidelines (Sacks DB et al., Clin Chem 2011; 57:793-8). There were changes in the equipment used to measure hemoglobin A1C from NHANES 2005-2006 to NHANES 2007-2008 (see Methods).
by guest, on March 28, 2019
ww
w.jlr.org
Dow
nloaded from
28
Table 2. Mean Hematocrit by Quartile of Serum Cholesterol Measures in Adult Participants in NHANES 2005-20081
NHANES survey 2005-2006 2007-2008
Hematocrit (%) Mean (95%CI)
Hematocrit (%) Mean (95%CI)
N = 4469 N = 5318
HDL-C (mg/dL)
Unadjusted2
Low 44.37 (43.98, 44.76) 42.77 (42.34, 43.21)
Medium 43.00 (42.45, 43.56) 42.06 (41.55, 42.58)
High 42.15 (41.64, 42.65) 41.24 (40.55, 41.93)
Very high 41.39 (40.82, 41.95) 40.09 (39.40, 40.78)
Trend P value <0.001 <0.001
Adjusted3
Low 42.85 (42.45, 43.25) 41.56 (41.15, 41.97)
Medium 42.57 (41.98, 43.15) 41.74 (41.19, 42.30)
High 42.83 (42.27, 43.39) 41.67 (41.12, 42.22)
Very high 42.54 (42.08, 43.01) 41.58 (41.01, 42.16)
Trend P value 0.212 0.962
Non-HDL-C (mg/dL)
Unadjusted2
Low 41.82 (41.27, 42.37) 40.56 (40.10, 41.01)
Medium 42.32 (41.74, 42.91) 41.38 (40.69, 42.07)
High 42.87 (42.39, 43.35) 41.87 (41.15, 42.59)
Very high 43.66 (43.23, 44.09) 42.64 (42.29, 42.99)
Trend P value <0.001 <0.001
Adjusted3
Low 42.12 (41.57, 42.67) 40.80 (40.42, 41.18)
Medium 42.42 (41.90, 42.95) 41.51 (40.85, 42.18)
High 42.88 (42.40, 43.36) 41.83 (41.27, 42.39)
Very high 43.32 (42.82, 43.82) 42.36 (41.91, 42.81)
Trend P value <0.001 <0.001
1 Cholesterol quartiles were determined from NHANES 2005-2006 and are as follows: HDL-C (low [≤41.83 mg/dL]; medium [>41.83–51.38 mg/dL]; high [>51.38–62.93 mg/dL]; and very high [>62.93 mg/dL]), and non-HDL-C (low [≤114.42 mg/dL]; medium [>114.42–140.1 mg/dL]; high [>140.1–168.28 mg/dL]; and very high [>168.28 mg/dL]). 2 Unadjusted model. 3 Adjusted for age, race/ethnicity, gender, smoking and BMI.
by guest, on March 28, 2019
ww
w.jlr.org
Dow
nloaded from

29
Table 3. Geometric Mean of Hemoglobin by Quartile of Serum Cholesterol Measures in Adult Participants in NHANES 2005-20081
NHANES Survey 2005-2006 2007-2008
Hemoglobin (g/dL)
Mean (95%CI) Hemoglobin (g/dL)
Mean (95%CI)
N = 4469 N = 5318
HDL-C (mg/dL)
Unadjusted2
Low 15.00 (14.88, 15.11) 14.78 (14.57, 14.98)
Medium 14.48 (14.32, 14.65) 14.43 (14.21, 14.64)
High 14.17 (14.01, 14.32) 14.11 (13.85, 14.38)
Very high 13.94 (13.76, 14.11) 13.70 (13.44, 13.95)
Trend p value <0.001 <0.001
Adjusted3
Low 14.45 (14.34, 14.56) 14.31 (14.12, 14.50)
Medium 14.33 (14.16, 14.51) 14.31 (14.09, 14.55)
High 14.41 (14.24, 14.58) 14.27 (14.06, 14.48)
Very high 14.33 (14.21, 14.45) 14.24 (14.03, 14.45)
Trend p value 0.196 0.183
Non-HDL-C (mg/dL)
Unadjusted2
Low 14.03 (13.84, 14.22) 13.87 (13.68, 14.06)
Medium 14.26 (14.10, 14.42) 14.16 (13.89, 14.44)
High 14.46 (14.33, 14.59) 14.36 (14.07, 14.65)
Very high 14.74 (14.60, 14.88) 14.72 (14.55, 14.90)
Trend p value <0.001 <0.001
Adjusted3
Low 14.14 (13.98, 14.30) 13.96 (13.81, 14.12)
Medium 14.29 (14.16, 14.43) 14.21 (13.95, 14.48)
High 14.46 (14.34, 14.58) 14.34 (14.12, 14.57)
Very high 14.61 (14.46, 14.77) 14.61 (14.43, 14.80)
Trend p value <0.001 <0.001
1 Cholesterol quartiles were determined from NHANES 2005-2006 and are as follows: HDL-C (low [≤41.83 mg/dL]; medium [>41.83–51.38 mg/dL]; high [>51.38–62.93 mg/dL]; and very high [>62.93 mg/dL]), and non-HDL-C (low [≤114.42 mg/dL]; medium [>114.42–140.1 mg/dL]; high [>140.1–168.28 mg/dL]; and very high [>168.28 mg/dL]). 2 Unadjusted model. 3 Adjusted for age, race/ethnicity, gender, smoking and BMI.
by guest, on March 28, 2019
ww
w.jlr.org
Dow
nloaded from
30
Table 4. Mean Erythrocyte Count by Quartile of Serum Cholesterol Measures in Adult Participants in NHANES 2005-20081
NHANES Survey 2005-2006 2007-2008
RBC (million/uL)
Mean (95%CI) RBC (million/uL)
Mean (95%CI)
N = 4469 N = 5318
HDL-C (mg/dL)
Unadjusted2
Low 4.99 (4.94, 5.03) 4.87 (4.84, 4.91)
Medium 4.81 (4.75, 4.87) 4.77 (4.72, 4.82)
High 4.68 (4.64, 4.73) 4.64 (4.58, 4.71)
Very high 4.52 (4.47, 4.57) 4.49 (4.42, 4.56)
Trend p value <0.001 <0.001
Adjusted3
Low 4.83 (4.79, 4.87) 4.74 (4.71, 4.77)
Medium 4.76 (4.70, 4.82) 4.73 (4.68, 4.79)
High 4.74 (4.70, 4.79) 4.69 (4.64, 4.74)
Very high 4.65 (4.60, 4.69) 4.66 (4.59, 4.72)
Trend p value <0.001 0.002
Non-HDL-C (mg/dL)
Unadjusted2
Low 4.64 (4.60, 4.69) 4.57 (4.52, 4.62)
Medium 4.69 (4.63, 4.76) 4.68 (4.62, 4.75)
High 4.78 (4.73, 4.82) 4.74 (4.67, 4.82)
Very high 4.85 (4.81, 4.89) 4.82 (4.79, 4.85)
Trend p value <0.001 <0.001
Adjusted3
Low 4.67 (4.62, 4.72) 4.60 (4.56, 4.64)
Medium 4.70 (4.64, 4.76) 4.70 (4.63, 4.76)
High 4.78 (4.74, 4.82) 4.74 (4.68, 4.79)
Very high 4.81 (4.77, 4.86) 4.79 (4.76, 4.83)
Trend p value <0.001 <0.001
1 Cholesterol quartiles were determined from NHANES 2005-2006 and are as follows: HDL-C (low [≤41.83 mg/dL]; medium [>41.83–51.38 mg/dL]; high [>51.38–62.93 mg/dL]; and very high [>62.93 mg/dL]), and non-HDL-C (low [≤114.42 mg/dL]; medium [>114.42–140.1 mg/dL]; high [>140.1–168.28 mg/dL]; and very high [>168.28 mg/dL]). 2 Unadjusted model. 3 Adjusted for age, race/ethnicity, gender, smoking and BMI.
by guest, on March 28, 2019
ww
w.jlr.org
Dow
nloaded from

31
Table 5. Erythrocyte Mean Corpuscular Volume by Quartile of Serum Cholesterol Measures in Adult Participants in NHANES 2005-20081
NHANES Survey 2005-2006 2007-2008
Mean cell volume (fL)
Mean (95%CI) Mean cell volume (fL)
Mean (95%CI)
N = 4469 N = 5318
HDL-C (mg/dL)
Unadjusted2
Low 89.14 (88.72, 89.56) 87.97 (87.33, 88.61)
Medium 89.55 (88.96, 90.14) 88.33 (87.73, 88.93)
High 90.15 (89.61, 90.68) 88.95 (88.18, 89.71)
Very high 91.74 (91.27, 92.20) 89.47 (88.56, 90.39)
Trend p value <0.001 <0.001
Adjusted3
Low 88.96 (88.50, 89.41) 87.90 (87.30, 88.50)
Medium 89.58 (89.03, 90.13) 88.34 (87.75, 88.93)
High 90.41 (89.88, 90.94) 89.01 (88.23, 89.78)
Very high 91.69 (91.29, 92.09) 89.49 (88.65, 90.34)
Trend p value <0.001 <0.001
Non-HDL-C (mg/dL)
Unadjusted2
Low 90.32 (89.60, 91.04) 88.91 (88.02, 89.81)
Medium 90.32 (89.72, 90.93) 88.49 (87.60, 89.37)
High 89.91 (89.41, 90.40) 88.45 (87.89, 89.02)
Very high 90.19 (89.66, 90.73) 88.65 (88.03, 89.28)
Trend p value 0.526 0.376
Adjusted3
Low 90.36 (89.75, 90.97) 88.95 (88.11, 89.79)
Medium 90.37 (89.85, 90.89) 88.54 (87.73, 89.36)
High 89.92 (89.33, 90.51) 88.51 (87.91, 89.11)
Very high 90.17 (89.62, 90.72) 88.54 (87.96, 89.11)
Trend p value 0.360 0.101
1 Cholesterol quartiles were determined from NHANES 2005-2006 and are as follows: HDL-C (low [≤41.83 mg/dL]; medium [>41.83–51.38 mg/dL]; high [>51.38–62.93 mg/dL]; and very high [>62.93 mg/dL]), and non-HDL-C (low [≤114.42 mg/dL]; medium [>114.42–140.1 mg/dL]; high [>140.1–168.28 mg/dL]; and very high [>168.28 mg/dL]). 2 Unadjusted model. 3 Adjusted for age, race/ethnicity, gender, smoking and BMI.
by guest, on March 28, 2019
ww
w.jlr.org
Dow
nloaded from

32
Table 6. Mean Platelet Crit by Quartile of Serum Cholesterol Measures in Adult Participants in NHANES 2005-20081
NHANES Survey 2005-2006 2007-2008
Platelet crit (%) Mean (95%CI)
Platelet crit (%) Mean (95%CI)
N = 4469 N = 5318
HDL-C (mg/dL)
Unadjusted2
Low 0.222 (0.219, 0.225) 0.204 (0.198, 0.210)
Medium 0.227 (0.222, 0.232) 0.203 (0.199, 0.206)
High 0.229 (0.224, 0.233) 0.206 (0.202, 0.210)
Very high 0.224 (0.220, 0.228) 0.204 (0.200, 0.208)
Trend p value 0.186 0.747
Adjusted3
Low 0.226 (0.223, 0.229) 0.205 (0.200, 0.211)
Medium 0.228 (0.224, 0.233) 0.203 (0.200, 0.207)
High 0.226 (0.222, 0.230) 0.205 (0.200, 0.209)
Very high 0.222 (0.218, 0.226) 0.201 (0.197, 0.206)
Trend p value 0.083 0.362
Non-HDL-C (mg/dL)
Unadjusted2
Low 0.216 (0.210, 0.222) 0.195 (0.191, 0.199)
Medium 0.224 (0.220, 0.227) 0.203 (0.199, 0.206)
High 0.230 (0.225, 0.235) 0.208 (0.203, 0.212)
Very high 0.232 (0.228, 0.236) 0.210 (0.206, 0.215)
Trend p value <0.001 <0.001
Adjusted3
Low 0.215 (0.209, 0.221) 0.194 (0.190, 0.198)
Medium 0.223 (0.221, 0.226) 0.202 (0.199, 0.206)
High 0.230 (0.226, 0.235) 0.207 (0.203, 0.211)
Very high 0.233 (0.230, 0.236) 0.210 (0.207, 0.214)
Trend p value <0.001 <0.001
1 Cholesterol quartiles were determined from NHANES 2005-2006 and are as follows: HDL-C (low [≤41.83 mg/dL]; medium [>41.83–51.38 mg/dL]; high [>51.38–62.93 mg/dL]; and very high [>62.93 mg/dL]), and non-HDL-C (low [≤114.42 mg/dL]; medium [>114.42–140.1 mg/dL]; high [>140.1–168.28 mg/dL]; and very high [>168.28 mg/dL]). 2 Unadjusted model. 3 Adjusted for age, race/ethnicity, gender, smoking and BMI.
by guest, on March 28, 2019
ww
w.jlr.org
Dow
nloaded from
33
Table 7. Geometric Mean Platelet Count by Quartile of Serum Cholesterol Measures in Adult Participants in NHANES 2005-20081
NHANES Survey 2005-2006 2007-2008
Platelet (1000 cells/uL)
Mean (95%CI) Platelet (1000 cells/uL)
Mean (95%CI)
N = 4469 N = 5318
HDL-C (mg/dL)
Unadjusted2
Low 266.77 (262.27, 271.35) 254.34 (249.15, 259.64)
Medium 272.99 (267.17, 278.94) 258.86 (255.19, 262.59)
High 274.79 (268.12, 281.63) 260.47 (255.32, 265.73)
Very high 273.28 (268.62, 278.02) 259.96 (255.30, 264.71)
Trend p value 0.024 0.073
Adjusted3
Low 271.46 (267.00, 276.00) 256.08 (251.13, 261.13)
Medium 274.84 (269.27, 280.53) 259.89 (256.56, 263.26)
High 271.50 (266.01, 277.10) 258.73 (252.44, 265.17)
Very high 270.45 (265.91, 275.08) 257.08 (251.18, 263.12)
Trend p value 0.492 0.852
Non-HDL-C (mg/dL)
Unadjusted2
Low 259.68 (251.66, 267.96) 244.00 (239.61, 248.47)
Medium 270.31 (265.28, 275.43) 256.39 (251.18, 261.71)
High 279.11 (274.45, 283.84) 263.99 (259.95, 268.10)
Very high 279.51 (273.91, 285.23) 268.28 (264.20, 272.43)
Trend p value <0.001 <0.001
Adjusted3
Low 257.58 (249.80, 265.59) 242.74 (238.06, 247.51)
Medium 270.06 (265.51, 274.69) 256.27 (250.50, 262.17)
High 280.11 (275.75, 284.54) 263.91 (260.87, 266.99)
Very high 280.99 (276.08, 285.99) 268.62 (265.17, 272.11)
Trend p value <0.001 <0.001
1 Cholesterol quartiles were determined from NHANES 2005-2006 and are as follows: HDL-C (low [≤41.83 mg/dL]; medium [>41.83–51.38 mg/dL]; high [>51.38–62.93 mg/dL]; and very high [>62.93 mg/dL]), and non-HDL-C (low [≤114.42 mg/dL]; medium [>114.42–140.1 mg/dL]; high [>140.1–168.28 mg/dL]; and very high [>168.28 mg/dL]). 2 Unadjusted model. 3 Adjusted for age, race/ethnicity, gender, smoking and BMI.
by guest, on March 28, 2019
ww
w.jlr.org
Dow
nloaded from
34
Table 8. Mean Platelet Volume (MPV) by Quartile of Serum Cholesterol Measures in Adult Participants in NHANES 2005-20081
NHANES Survey 2005-2006 2007-2008
MPV (fL)
Mean (95%CI) MPV (fL)
Mean (95%CI)
N = 4469 N = 5318
HDL-C (mg/dL)
Unadjusted2
Low 8.13 (8.04, 8.22) 7.83 (7.71, 7.94)
Medium 8.13 (8.06, 8.19) 7.69 (7.59, 7.79)
High 8.14 (8.08, 8.21) 7.74 (7.62, 7.86)
Very high 8.06 (8.00, 8.12) 7.68 (7.58, 7.78)
Trend p value 0.113 0.015
Adjusted3
Low 8.13 (8.03, 8.23) 7.83 (7.72, 7.94)
Medium 8.12 (8.06, 8.19) 7.69 (7.59, 7.79)
High 8.13 (8.07, 8.20) 7.74 (7.61, 7.86)
Very high 8.06 (8.00, 8.12) 7.68 (7.57, 7.79)
Trend p value 0.207 0.006
Non-HDL-C (mg/dL)
Unadjusted2
Low 8.13 (8.05, 8.22) 7.76 (7.67, 7.85)
Medium 8.09 (8.02, 8.16) 7.75 (7.63, 7.87)
High 8.08 (8.01, 8.16) 7.72 (7.61, 7.83)
Very high 8.15 (8.08, 8.22) 7.71 (7.60, 7.82)
Trend p value 0.728 0.168
Adjusted3
Low 8.14 (8.05, 8.23) 7.76 (7.66, 7.86)
Medium 8.09 (8.02, 8.16) 7.76 (7.63, 7.88)
High 8.08 (8.01, 8.15) 7.72 (7.61, 7.82)
Very high 8.14 (8.07, 8.21) 7.71 (7.61, 7.82)
Trend p value 0.993 0.163
1 Cholesterol quartiles were determined from NHANES 2005-2006 and are as follows: HDL-C (low [≤41.83 mg/dL]; medium [>41.83–51.38 mg/dL]; high [>51.38–62.93 mg/dL]; and very high [>62.93 mg/dL]), and non-HDL-C (low [≤114.42 mg/dL]; medium [>114.42–140.1 mg/dL]; high [>140.1–168.28 mg/dL]; and very high [>168.28 mg/dL]). 2 Unadjusted model. 3 Adjusted for age, race/ethnicity, gender, smoking and BMI.
by guest, on March 28, 2019
ww
w.jlr.org
Dow
nloaded from