establishing a novel diagnostic method to localize the
TRANSCRIPT

Establishing a novel diagnostic method to localize the
epileptogenic zone in cryptogenic focal epilepsy
Joanna Goc
Munich, 4th November 2016
Dissertation der Graduate School of Systemic Neurosciences der
Ludwig-Maximilians-Universität München

ii

iii
Date of Oral Defense:
Munich, 4th April 2017
Supervisor:
Dr. med. Dr. phil. Christian Vollmar
Examination Committee:
1st reviewer: Dr. med. Dr. phil. Christian Vollmar
2nd reviewer Dr. Afra Wohlschläger
External reviewer: Dr. Philipp Sämann
Dr. Thomas Stephan

iv

v
To my fiancé and family.

vi
ABSTRACT
Epilepsy is one of the most common neurological disorder worldwide and about 30% of
diagnosed patients are pharmacoresistant. For some of these, the most efficient treatment
is resective surgery, which surgically removes the epileptogenic zone (EZ). However, this
surgery is challenging in patients with cryptogenic focal epilepsy (cFE), when conventional
MRI fails to localize the EZ.
The purpose of this project was to establish a novel diagnostic method to localize the EZ in
patients with pharmacoresistant cFE using diffusion tensor imaging (DTI). The main
hypothesis was that the short association fibers, called U-fibers, located directly at the grey
and white matter junction are affected in epilepsy by a common pathology called focal
cortical dysplasia, which is often not seen in conventional MRI.
This thesis entailed different steps in the development of the method, starting with a pilot
version of the method where U-fiber track density images (ufTDI) were quantified for
patients with cFE using a small number of healthy controls and default settings of the used
software. The remaining part of the thesis involved optimizing and improving the method
to increase the sensitivity and specificity.
This novel diagnostic method is now a valuable tool in patients considered for resective
epilepsy surgery. It is already routinely used at the Epilepsy Centre at the University of
Munich Hospital, as a guidance tool for implantation of the electrodes for invasive EEG
recordings.

vii
TABLE OF CONTENTS
Abstract ..................................................................................................................................................... vi
Abbreviations ....................................................................................................................................... viii
Chapter 1. Introduction .........................................................................................................................1
1.1. Epilepsy ..................................................................................................................................................... 1 1.1.1. Six Cortical Zones in Focal Epilepsy....................................................................................................... 2 1.1.2. Pathology ........................................................................................................................................................... 5 1.1.3. Pre-surgical Evaluation ............................................................................................................................... 7 1.1.4. Cryptogenic Focal Epilepsy .................................................................................................................... 10
1.2. Diffusion MRI .........................................................................................................................................11 1.2.1. Diffusion Tensor Imaging ........................................................................................................................ 11 1.2.2. Tractography ................................................................................................................................................ 12 1.2.3. DTI in Epilepsy ............................................................................................................................................. 13
1.3. Aims of the Thesis ................................................................................................................................15
Chapter 2. From FA to U-Fibers ....................................................................................................... 16
2.1. Contributions.........................................................................................................................................16
Chapter 3. On The Clinical Side........................................................................................................ 39
3.1. Contributions.........................................................................................................................................39
Chapter 4. Effects of Pre-processing .............................................................................................. 70
4.1. Contributions.........................................................................................................................................70
Chapter 5. Gender and Controls ...................................................................................................... 91
5.1. Contributions.........................................................................................................................................91
Chapter 6. General Discussion ...................................................................................................... 110
6.1. Overview .............................................................................................................................................. 110 6.2. Clinical Application .......................................................................................................................... 115
Summary Points ................................................................................................................................. 116
References............................................................................................................................................ 117
Acknowledgments ............................................................................................................................. 123
Curriculum Vitae ............................................................................................................................... 124
List of Publications............................................................................................................................ 126
Affidavit................................................................................................................................................. 127
Declaration of Author Contributions ......................................................................................... 128

viii
ABBREVIATIONS
ADC: Apparent Diffusion Coefficient
AEDs: Antiepileptic Drugs
ANTs: Advanced Normalization Tools
cFE: cryptogenic Focal Epilepsy
DTI: Diffusion Tensor Imaging
DWI: Diffusion Weighted Images
EZ: Epileptogenic Zone
FA: Fractional Anisotropy
FCD: Focal Cortical Dysplasia
FLAIR: Fluid-Attenuated Inversion Recovery
fMRI: functional MRI
MCD: Malformatations of Cortical Development
MD: Mean Diffusivity
mMCD: mild Malformation of Cortical Development
MRI: Magnetic Resonance Imaging
PET: Positron Emission Tomography
SPECT: Single-Photon Emission Computed Tomography
SPM: Statistical Parametric Mapping
SPMd: SPM default
SPMo: SPM optimised
TDI: Track Density Images

Chapter 1. Introduction 1
CHAPTER 1. INTRODUCTION
1.1. EPILEPSY
Epilepsy, characterized by recurrent seizures, is one of the most common
neurological disorder affecting ~1% of population worldwide. It can be treated with
antiepileptic drugs (AEDs), but ~30% of patients have pharmacoresistant epilepsy, which is
diagnosed after a failure of at least two AEDs treatments. In many of these cases, resective
surgery is an alternative treatment, where the source of the focal epilepsy is removed.
The success of resective surgery, measured by seizure freedom, depends on different
prognostic factors e.g. presence of detectable lesions, scope of the resection, underlying
pathology, the localization of the epileptogenic zone (EZ) and the surrounding brain
structures (McIntosh et al., 2012; Ramey et al., 2013). However, seizure freedom is achieved
in only 49.8% of extratemporal lobe epilepsy (Ramey et al., 2013), possibly due to partial
resection or incorrect estimation of the extent of the EZ.
Epilepsy can be secondary to various detectable lesions, such as tumors, vascular
malformation, ischemic changes or cortical dysplasia. Therefore, pre-surgical evaluation
and planning of the resection is greatly dependent on neuroimaging techniques (McIntosh
et al., 2012). However, up to 50% of patients with focal epilepsy do not have a visible lesion
in a conventional MRI and therefore are diagnosed with cryptogenic focal epilepsy (cFE).
This makes the surgical outcome harder to predict due to limited pre-surgical outlining of
the region that needs to be resected (Ramey et al., 2013).
Chapter 1. Introduction 2
1.1.1. SIX CORTICAL ZONES IN FOCAL EPILEPSY
Apart from the epileptogenic lesion, six cortical zones are defined to aid in the pre-
surgical evaluation (Lüders, 2008): seizure onset zone, irritative zone, symptomatogenic
zone, epileptogenic zone, functional deficit zone and eloquent cortex. The spatial extent of
the zones varies. They can be regional, lateralized, non-lateralized, bilateral or bilateral with
asymmetrical seizure evolution. This can have a great impact on the surgery planning and
its outcome.
The epileptogenic lesion is a radiographic lesion that can be seen in magnetic
resonance imaging (MRI) or computed tomography (CT) and causes epileptic seizures. In
cryptogenic epilepsy, the epileptogenic lesion is not visible. Naturally, not all radiographic
lesions are epileptogenic, therefore they have to be cautiously verified using different
diagnostic tools. The relation to EZ is similar to the seizure onset zone, where a complete
resection of the lesion does not necessarily result in seizure freedom. This could be the case
if the lesion is not intrinsically epileptogenic, but can induce seizures by causing reactions
in the surrounding tissue. Another explanation could be an incomplete detection of the
extent of the lesion, e.g. the tissue surrounding the lesion have a more subtle or diffuse
pathology and thus not be detected by MRI. This is frequently the case with focal cortical
dysplasia.
The seizure onset zone is an area of the cortex that generates clinical seizures and is
typically localized using scalp or invasive electroencephalogram (EEG) methods, like depth
or subdural electrodes to detect the electrical activity representing an epileptic seizure, as
well as ictal single-photon emission computed tomography (SPECT), which can identify a
regional increase in blood flow in response to the high metabolic demand of an epileptic

Chapter 1. Introduction 3
seizure. Unlike the irritative zone, the seizure onset zone generates repetitive discharges
that are strong enough to generate clinical ictal symptoms. However, this cannot be
confused with the EZ. Often the EZ is more extensive than the seizure onset zone indicating
that a complete resection of the seizure onset zone alone will not result in seizure freedom,
if some of the EZ remains unresected. This happens when the seizure onset zone has
multiple thresholds within a single EZ. Only the seizure zone of the lowest threshold is
detected prior to surgery, therefore another seizure onset zone with a higher threshold may
become clinically visible after the resection of the previous zone. Occasionally, the seizure
onset zone is larger than EZ and partial resection of the seizure onset zone can still lead to
seizure freedom if the entire EZ was resected.
The irritative zone is an area of the cortex that produces interictal spikes (also called
interictal epileptiform discharge), measured by scalp EEG. Interictal spikes are short
(<250ms) events observed in EEG that occur between seizures and usually isolated and
independent spikes will not produce any clinical symptoms. The presence of interictal
spikes strongly supports the diagnosis of epilepsy.
The symptomatogenic zone is an area of the cortex, which produces ictal symptoms
during a seizure. It is common for this zone to reach beyond the EZ, because seizures are
dynamic events, propagating through the brain over time. Some parts of the brain, when
electrically stimulated are silent, i.e. a focal seizure in this area would not cause visible
clinical symptoms. During a seizure, occasionally symptoms are generated only when the
electrical activity spreads to adjacent eloquent cortex.
The epileptogenic zone (EZ) is defined as the area of the cortex that is indispensable
for the generation of epileptic seizures and whose resection is necessary and sufficient for
seizure control in pharmacoresistant focal epilepsy. Unfortunately, there is currently no

Chapter 1. Introduction 4
diagnostic modality that can measure the EZ directly. Therefore, the location of the zone
must be measured indirectly, by defining the above-mentioned zones.
It has been suggested, that in some cases, the EZ is not bound to only one region, but
is interconnected to other regions (Buser and Bancausd, 1983). One example is the
corticocortical facilitatory connections, which describe fronto-temporal epilepsy (Bancaud
and Talairach, 1992).
The functional deficit zone is defined as regions of the cortex, which are functionally
abnormal during the interictal period. The spatial extent of the functional deficit zone
usually reaches beyond the EZ and can be investigated directly with neurological
examination, neuropsychological assessment and indirectly with EEG, SPECT and PET.
Generally, the functional deficit zone can only lateralize and estimate the localization of the
EZ to the lobe affected in focal epilepsy, but is not specific. However, it does provide
complementary information to the other five zones during the pre-surgical evaluation.
The eloquent cortex is cortex that carries a specific, relevant function and must be
spared during surgery. The aim of the surgery is to resect the complete EZ with good
boundaries, but at the same time sparing the eloquent cortex in order to avoid additional
deficit for the patient. To identify eloquent areas, the cortex can be electrically stimulated to
test whether this results in a functional impairment or not. However, in situations where
the eloquent cortex overlaps with the EZ, sparing of the eloquent cortex has the priority and
would only allow partial resection of the EZ with lower chances for post-surgical seizure
freedom. If a patient is a candidate for surgery, then the individual risk factors have to be
discussed with the patient prior to the resection.

Chapter 1. Introduction 5
1.1.2. PATHOLOGY
Focal epilepsy can be caused by different underlying pathologies and the
consequences of seizures on the brain are complex affecting both brain function and
structure. The structural alterations are present at different levels, such as cellular, synaptic
and molecular, some of which may be permanent (Thom, 2011). To achieve seizure
freedom in pharmacoresistant focal epilepsy, the EZ must be resected using a number of
diagnostic tools to outline the borders of the EZ (see Section 1.1.3).
The histopathology of resected tissue in cFE often shows malformations of cortical
development (MCD), which is an outcome of abnormal prenatal development of the brain.
The pathology involves neuronal proliferation, migration and organization of the cerebral
cortex. MCD occurs in cFE, however, focal cortical dysplasia (FCD) is a more frequent
pathology, especially in pharmacoresistant focal epilepsy (Blümcke et al., 2011).
FCD includes a wide spectrum of abnormalities in the grey and white matter and is
characterized by the occurrence of histological abnormalities of the organization of the
cortex, blurring of the grey and white matter border, dysmorphic neurons, balloon cells and
ectopic neurons in the subcortical white matter (Besson et al., 2008; Blümcke et al., 2011).
FCD can be diffuse or focal and can vary in severity. More severe forms of FCD can typically
be detectable in MRI scans (Figure 1).
FCD has a wide spectrum of characteristics and often it is difficult to reach a
consensus for the classification of the histopathological specimen amongst
neuropathologists (Chamberlain et al., 2009). Currently FCD can be classified into Type I
and Type II, and recently Type III has been proposed (Blümcke et al., 2011).

Chapter 1. Introduction 6
Type I subdivides into Type IA and IB. Type IA shows architectural alterations of the
cortical lamination, whereas Type IB additionally includes hypertrophic pyramidal neurons.
Type II FCD can also be subdivided into IIA and IIB types of pathology. The hallmark of FCD
Type IIA are dysmorphic neurons and Type IIB also includes balloon cells.
The pathology can be located anywhere in the cortex and the extent of the pathology
varies. Some types of FCD are more frequent in certain regions of the brain than others, e.g.
FCD Type II is more commonly occurring in extratemporal areas, particularly in the frontal
lobe (Blümcke et al., 2011).
Neuroimaging techniques have been used extensively for diagnosing FCD. However,
it has been proven to be limited. Neuroimaging is not able to reliably identify the FCD
subtypes and often cannot detect subtle forms of FCD or the total extent of the pathology,
making the delineation more difficult. Additionally, often patients diagnosed with the same
FCD subtype according to Palmini’s classification system show different imaging
characteristics (Lerner et al., 2009).
The histopathology of the resective tissue in cryptogenic focal epilepsy often shows
mild MCD (mMCD), which entails subtler end of the spectrum of cortical abnormalities than
MCD or FCD and are often referred to as mild architectural changes (Lüders, 2008; Thom,
2011), such as blurring of the grey and white matter border and excess of cortical neuronal
clusters. The diagnosis of mMCD is a challenging one, as there is no established
immunohistochemical method that labels the ‘ectopic’ neurons from the normal neuronal
population. This of course leads to less consensus on the diagnosis of mMCD compared to
other, more severe forms of FCD (Thom, 2011).
Chapter 1. Introduction 7
1.1.3. PRE-SURGICAL EVALUATION
An extensive diagnostic investigation is needed to determine whether a patient with
pharmacoresistant focal epilepsy is a candidate to undergo resective surgery. The aim of
such a surgery is to remove the EZ, while sparing the eloquent cortex. To achieve this,
several diagnostic tools are used, like scalp EEG with video monitoring, MRI, Positron
Emission Tomography (PET) and SPECT (Rosenow and Lüders, 2001).
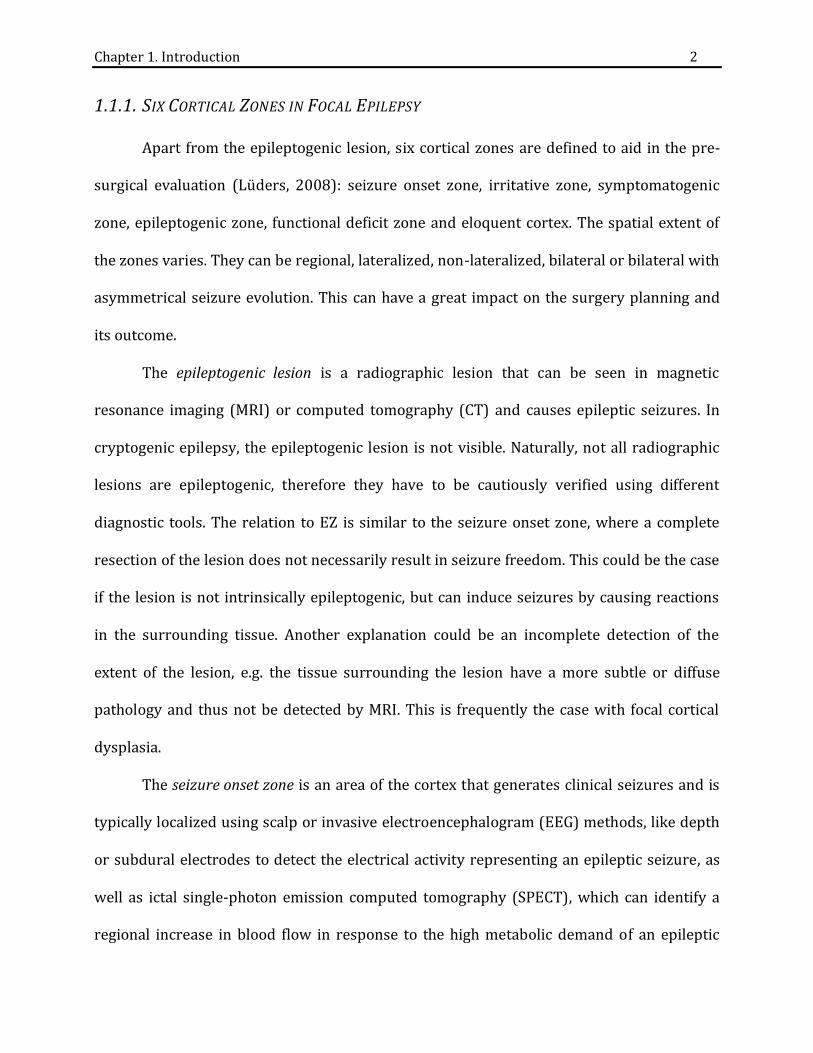
Typically, T1-, T2-weighted and FLAIR sequences are used for basic MRI evaluation.
FLAIR sequences are particularly successful for localizing the epileptogenic lesions (Figure
1). On the other hand, T1 and T2-weighted sequences can show the blurring of the grey and
white matter border, which is characteristic of FCD.
Figure 1 Epileptogenic lesion seen in T2 and T2-FLAIR. At the Epilepsy Centre, patients routinely obtain neuroimages including A) T1 showing blurred grey and white matter junction B) T2 showing cortical thickening and C) T2-FLAIR, where the signal is enhanced around the epileptogenic lesion. Curtesy of Dr. Christian Vollmar.
Scalp EEG is another important diagnostic tool, essential in the pre-surgical
evaluation of epilepsy. It measures the electrical activity of the brain and is able to lateralize
and localize the seizure onset zone in majority of cases. Currently, video-EEG monitoring is
the gold standard for defining the irritative and seizure onset zones (see Section 1.1.1)
Chapter 1. Introduction 8
when recording a sufficient amount of ictal and interictal EEG (Lüders, 2008; Rosenow and
Lüders, 2001).
One limitation of scalp EEG is low sensitivity to deep cortical areas, such as mesial
frontal or fronto-orbital regions, due to the large distances between the scalp electrodes
and those cortical areas. Usually, scalp electrodes are only able to detect the discharges
after they have spread considerably. Scalp EEG is typically combined with video monitoring
to assess the seizure semiology.
Seizure semiology allows for the localization of the symptomatogenic zone, which is
usually in close proximity to the epileptogenic zone. Thereby seizure semiology contributes
localizing information to the pre-surgical evaluation and can be particularly helpful in cFE.
There are several established lateralizing and localizing signs of auras and seizures
(described in detail in Lüders et al., 1999; Tufenkjian and Lüders, 2012) and some of these
signs have a correct lateralization rate of > 95%. For example, clonic movement of the left
hand indicates an epileptic activation of the right precentral cortex. If this occurs early in
the seizure, chances are high that the epileptogenic zone is in close proximity to the right
motor cortex.
If scalp EEG and seizure semiology do not allow for the exact localization or
lateralization of the seizure onset zone, then additional methods are needed, including
intracranial EEG recording, such as depth or subdural electrodes. Information obtained
from scalp EEG and MRI guides the implantation of intracranial EEG recording. Even though
the pre-surgical evaluation for the resection relies mainly on intracranial EEG for
delineating the EZ (Rosenow and Lüders, 2001; Zhang et al., 2014), it is crucial to have a
strong clinical hypothesis for the location of the EZ, when planning the implantation of the
depth electrodes. This is because depth electrodes record activity from a very localized and

Chapter 1. Introduction 9
limited region and the total number of electrodes that can be implanted is limited. However,
they are highly sensitive due to the direct contact with the brain matter and accurately
record the epileptic activity. On the other hand, the subdural grid is more invasive than
depth electrodes and has higher risk of complications, but it covers a larger area of the
cortex, which can be beneficial when the location of the EZ is not clear (Zhang et al., 2014).
Another important diagnostic test is the ictal SPECT, which is based on cerebral
metabolic and perfusion coupling. During a seizure, neurons are hyperactive resulting in an
increased metabolic demand and a regional increase in blood flow. This ictal
hyperperfusion can be depicted with a SPECT scan, if the tracer is injected early during the
seizure, preferably within 20 seconds after the seizure onset (Van Paesschen, 2004). The
evaluation of ictal and interictal SPECT can be challenging. The sensitivity of SPECT in
localizing the EZ increases when computer-aided subtraction ictal SPECT co-registered to
MRI (SISCOM) is applied (O’Brien et al., 1998).
Another nuclear medicine technique, called positron emission tomography (PET),
often can reliably identify dysfunctional cortex with hypometabolism. It is often acquired in
cFE and in some cases the EZ can be visible because of a change in glucose metabolism in
the affected region of the brain reflecting the regions of functional deficit (Lüders, 2008).
All of the above mentioned methods reflect different aspects of the epileptogenic
network and provide complementary information when combined, thus increasing the
sensitivity and specificity of the diagnosis. The need to use all of the methods show how
complex the pre-surgical evaluation of focal epilepsy is. This process becomes even more
challenging in cFE.

Chapter 1. Introduction 10
1.1.4. CRYPTOGENIC FOCAL EPILEPSY
Cryptogenic, or MRI-negative, focal epilepsy is a classification of epilepsy where the
lesion is not visible in conventional MRI. The diagnostic protocol remains the same as for
lesional focal epilepsy. The only difference is that there is no visible lesion in MRI, which
would be a valuable clue, where to look first. In cFE, the diagnosis relies almost exclusively
on EEG, semiology and nuclear medicine like SPECT and PET.

Chapter 1. Introduction 11
1.2. DIFFUSION MRI
Diffusion weighted MRI is a specific MRI acquisition that allows for the
quantification of water diffusion in tissue. The process of diffusion is influenced by the
structure of the tissue, like cell membranes, cytoskeleton and macromolecules (Le Bihan,
2014). This enables indirect inferences on the cellular integrity and pathology of the tissue.
The diffusivity depends on the angle between the fiber track and the applied magnetic field
gradient. The diffusivity is largest when the magnetic field gradient is parallel to the fiber
direction and smallest when it is perpendicular (Basser et al., 1994). Application of
gradients to enhance the diffusion attenuation introduces a contrast mechanism creating
diffusion-weighted images (DWI).
In grey matter, the measured diffusivity is mainly isotropic, i.e. uniform in all
directions. Therefore, the diffusion characteristics can be measured using a single apparent
diffusion coefficient (ADC). However, white matter tissue is anisotropic, where the
diffusivity is dependent upon the orientation of the axonal bundles and a single ADC is not
sufficient (Basser et al., 1994). A more complex model has to be applied in order to account
for the anisotropic properties of the axonal bundles by implementing a diffusion tensor of
water.
1.2.1. DIFFUSION TENSOR IMAGING
A tensor is a 33 matrix representing the orientation of the anisotropic diffusion
with respect to the three orthogonal axes of the reference frame (Stejskal and Tanner,
1965). Diffusion tensor imaging (DTI) is a technique measuring the diffusion tensor from
each voxel in the brain (Basser et al., 1994). This allows for the calculation of diffusivity

Chapter 1. Introduction 12
(degree of diffusion), anisotropy (directionality of the diffusion) and principal direction,
therefore providing information on the microstructure of the tissue and white matter tracts
that cannot be obtained in standard MRI.
There are two main DTI-based scalars: fractional anisotropy (FA) and mean
diffusivity (MD). FA shows the degree of directionality of water diffusion, where a high FA
indicates a diffusion restriction along one direction, and low FA indicates unconstrained
diffusion equally in different directions. MD on the other hand shows the total degree of
diffusivity, regardless of the directionality. In the vicinity of a lesion, FA is often decreased
and MD increased (Dumas de la Roque et al., 2005). Even though both of these measures, FA
and MD, have shown alterations in many neurological diseases, in focal epilepsy these
changes often remain non-specific (Winston, 2015).
1.2.2. TRACTOGRAPHY
Tractography is currently the only available tool for identifying white matter
pathways non-invasively and in vivo in humans. It is based on the fundamental assumption
that when axons align along a common axis, the diffusion of water is greater along than
across the axis (Behrens et al., 2003). Tractography is a process of integrating voxel-wise
fiber orientations into a pathway (Behrens et al., 2009) by streamlining through a vector
field. The streamlines can be reconstructed at any starting seed by following the main
direction of water diffusion (Figure 2), it moves on to the next vector and so on until it
reaches the stopping vector. Streamline tractography has many advantages, including fast
reconstruction of fibers, does not require special computational equipment or training and
is able to reconstruct many major white matter tracts.

Chapter 1. Introduction 13
Figure 2 Streamline tractography. The blue line represents the streamline that follows the orientation of the diffusion. Image was created by the author of this thesis.
Although streamline tractography allows for non-invasive research, it can be prone
to errors. One key limitation of diffusion tensor model is that it can only recognize a single
fiber orientation in each voxel. Therefore, the model might fail at locations with crossing or
kissing fibers. There are multiple alternative models and algorithms that recover more
information about the fiber orientation from a single voxel, such as high angular resolution
diffusion imaging (HARDI) (Tuch et al., 2002), QBall imaging (Tuch, 2004) or constrained
spherical deconvolution (CSD) (Anderson and Ding, 2002), which can be helpful to
delineate a more complex topography in regions with crossing fibers.
1.2.3. DTI IN EPILEPSY
Alterations related to pathology like FCD and MCD (see Section 1.1.2) have been
described in DTI, mainly by reduced anisotropy and increased diffusivity within the
proximity of the EZ in patients with MRI-visible FCD (Dumas de la Roque et al., 2005;
Chapter 1. Introduction 14
Eriksson et al., 2001). In some patients, the extent of the alterations exceeded beyond the
borders of MCD visible on conventional T1- and T2-weighted images (Eriksson et al., 2001).
Diffusion Tensor Tractography (DTT) has been shown to detect structural changes in
cFE (Vollmar and Diehl, 2011), where the number of tracts was reduced in the
epileptogenic zone compared to the healthy contralateral side.
The specificity of DTI in localizing the EZ is higher for extratemporal than temporal
lobe epilepsy (Thivard et al., 2006), possibly due to the higher prevalence of dysplastic
lesions in extratemporal epilepsy, as opposed to hippocampal sclerosis in temporal
epilepsy. Thivard et al (2006) also suggested that the epileptic networks associated with
extratemporal and temporal epilepsy differ in structural connections and cytoarchitecture.

Chapter 1. Introduction 15
1.3. AIMS OF THE THESIS
The aim of this PhD thesis is to establish a new diagnostic method that localizes the
epileptogenic zone in patients with pharmacoresistant cryptogenic focal epilepsy (cFE) by
quantifying the density of short association fibers, called U-fibers, obtained through DTI.
The main objectives are:
1. To compare the sensitivity and specificity of the conventional DTI-based measures FA
and MD with track density images (TDI), including whole brain TDI and U-fiber TDI, for
the detection of the epileptogenic zone in individual patients with cFE.
2. To compare the results of the method to the electroclinical data obtained from the
hospital.
3. To compare different options throughout the pre-processing pipeline, to optimize the
pre-processing steps of the method.
4. To investigate the effects of the control population on the results of the quantification.

Chapter 2. From FA to U-Fibers 16
CHAPTER 2. FROM FA TO U-FIBERS
2.1. CONTRIBUTIONS
The work was done under the supervision of Dr. Christian Vollmar (CV). Joanna Goc (JG)
and CV designed the research. JG, CV and Dr. Elisabeth Hartl (EH) recruited and scanned
participants. JG designed the method and carried out the research and analysis and together
with CV discussed the results. JG wrote the article.

Chapter 2. From FA to U-Fibers 17
Performance of different DTI-based measures to localize the
epileptogenic zone in cryptogenic focal epilepsy
J. Goc1,2, E. Hartl1, K. Ernst1, S. Noachtar1, C. Vollmar1,3 *
1Dept. of Neurology, Epilepsy Centre, University of Munich Hospital, Munich, Germany 2Graduate School of Systemic Neurosciences, Ludwig Maximilians University, Munich,
Germany 3Dept. of Neuroradiology, University of Munich Hospital, Munich, Germany
*Correspondence to:
Dr. Christian Vollmar
Marchioninistr. 15
81377 Munich
Germany
+4989440072682
Keywords:
cryptogenic epilepsy, focal epilepsy, fractional anisotropy, diffusion tensor imaging, U-fibers, mean
diffusivity

Chapter 2. From FA to U-Fibers 18
Abstract
Pharmacoresistant focal epilepsy may be treated surgically by removing the
epileptogenic zone (EZ). However, in patients with cryptogenic epilepsy no structural lesion
is visible in clinical MRI, challenging the localization of the EZ and planning of the resective
surgery. Here, we show a DTI analysis approach based on a quantification of regional track
density images (TDI) and compare that to conventional FA and MD maps to localize
previously undetected structural abnormalities in the EZ.
Ten patients with MRI-negative focal epilepsy with clear clinical localization of the
EZ were compared against 42 controls. DTI data was acquired on a 3T GE Signa HDx
Scanner with 64 diffusion-weighted directions and b-value of 1000 s/mm². DTI data was
processed and FA and MD maps were created. Whole brain streamline tracking was
performed and three TDI were created. These track density images were spatially
normalized together with FA and MD to a common template space. Statistical comparison to
the healthy control population was carried out to identify alterations in individual patients.
The resulting significant alterations were compared to clinical data.
All DTI-based measures showed alterations in patients with epilepsy, beyond the
range seen in healthy controls. However, the extent and specificity of these alterations
varied. The quantification of U-fiber track density images correctly identified the EZ in 80%
of the patients, compared to only 20% and 10% for FA and MD, respectively, showing that
these frequently used DTI measures are not ideal to localize specific alterations in the EZ.

Chapter 2. From FA to U-Fibers 19
Abbreviations: DTI = diffusion tensor imaging; MRI = magnetic resonance imaging; PET =
positron emission tomography; SPECT = single-photon emission computed tomography;
SPM = statistical parametric mapping; CVA = conventional visual analysis; cFE =
cryptogenic focal epilepsy; HP = healthy population; CTR = control; FA = fractional
anisotropy; MD = mean diffusivity; TDI = fiber density image; EZ = epileptogenic zone
Chapter 2. From FA to U-Fibers 20
1. Introduction
Epilepsy is one of the most commonly occurring neurological diseases affecting up to
1% of the population and is typically treated with medication. However, according to World
Health Organization (WHO, 2016), 30% of patients do not respond sufficiently to
medication (pharmacoresistant epilepsy) and for some of these patients resective epilepsy
surgery might be an effective treatment option (Rosenow and Lüders, 2001). Up to half of
the candidates for epilepsy surgery have non-lesional, “cryptogenic” focal epilepsy (cFE),
where conventional MRI does not show underlying structural lesions and the localization of
the epileptogenic zone (EZ) depends on complementary diagnostic methods. The success
rate of resective surgery in cryptogenic epilepsy (measured by the absence of seizures) is
often lower than in lesional epilepsy (Martin et al., 2015). The outcome of surgery depends
on multiple factors, starting from the type of underlying histopathology (Yao et al., 2014) to
correct localization and complete resection of the EZ, which is not straight forward in MRI-
negative patients.
One of the most frequent causes of focal drug-resistant epilepsy is focal cortical
dysplasia (FCD), a structural pathology characterized by histological abnormalities of the
laminar layers of the cortex, blurring of the white and grey matter border, dysmorphic
neurons, balloon cells and ectopic neurons in the subcortical white matter (Besson et al.,
2008; Blümcke et al., 2011). More severe forms of FCD are detectable with conventional
MRI and occasionally with diffusion tensor imaging (DTI) (Dumas de la Roque et al., 2005;
Eriksson et al., 2001; Rugg-Gunn et al., 2001; Widjaja et al., 2011). However, mild
malformations of the cortical development (MCD) are often missed even with an optimized
epilepsy MRI protocol.

Chapter 2. From FA to U-Fibers 21
In recent years, DTI has become more popular in clinical diagnostics. Most
commonly used DTI-derived scalars include: fractional anisotropy (FA) and mean
diffusivity (MD). FA shows the degree of directionality of water diffusion, where a high FA
indicates a diffusion restriction along one direction, and low FA indicates unconstrained
diffusion in different directions. MD on the other hand shows the total degree of diffusivity,
regardless of the directionality. In the vicinity of a lesion, FA is often decreased and MD
increased (Dumas de la Roque et al., 2005; Eriksson et al., 2001; Rugg-Gunn et al., 2001).
Even though both of these measures, FA and MD, have shown alterations in many
neurological diseases, in focal epilepsy, these changes often remain non-specific (Winston,
2015).
An alternative DTI-based measure to FA or MD is track density imaging (TDI)
(Calamante et al., 2015, 2010), a tractography mapping technique that has already been
applied in various neurological disorders. The TDI maps are typically based on whole brain
streamline tracking and represent the number of streamlines passing through any voxel.
The possible microstructural alterations in cFE, like the blurring of the white and
grey matter border could have an effect on fibers that are located in the proximity of the
white-grey matter border, like on local short association fibers, called the U-fibers
(Colombo et al., 2003). These microstructural changes might affect the tracking enough to
yield a more specific effect than FA or MD. Thus, using alternative DTI-based measures
based on fiber-tracking, like TDI, could improve the identification of subtle structural
alterations in cFE.
In this study we compared sensitivity and specificity of the conventional DTI
measures FA and MD with different types of track density images (TDI) including a specific
TDI for U-fibers only, for mapping the EZ in individual patients with cFE.

Chapter 2. From FA to U-Fibers 22
2. Methods and Participants
2.1. Participants
A group of 10 patients diagnosed with drug-resistant, cryptogenic focal epilepsy
(cFE) [mean age of 30 years (SD: 9.9), 8 males] was investigated. All patients had
conventional structural MRI at 3T using a specific epilepsy protocol, including high
resolution 3D T1 and 3D FLAIR images, coronal FLAIR T2 and inversion recovery T1
images, not showing any structural epileptogenic lesions. All patients underwent a series of
neurological examinations including routine EEG and non-invasive EEG-video-monitoring,
FDG-PET, SPECT and in most cases invasive intracranial EEG (n=8). All patients had a clear
clinical hypothesis as for the localization of the EZ based on the conclusive interpretation of
the aforementioned tests: bilateral frontal (n=1), right frontal (n=1), left frontal (n=4), right
temporal (n=2), left temporal (n=1) and right parietal (n=1).
A healthy population (HP) of 42 participants with no history of neurological or
psychiatric disease [mean age of 29.4 years (SD: 6.1), 27 males] was scanned for
comparison.
Additionally, 10 controls (CTR) were individually compared to the HP group using
identical procedures as for the cFE patients.
The University of Munich Ethics Committee approved the study and all participants
gave written and informed consent.
2.2. DTI acquisition
All participants had additional DTI data acquisition on a 3T GE Signa HDx Scanner
using a DTI-acquisition scheme with 64 diffusion-weighted directions, a b-value of 1000
s/mm², 60 axial slices with 2.4 mm slice thickness, a 96x96 in-plane matrix with a 220mm

Chapter 2. From FA to U-Fibers 23
field of view, TR 16000 ms, TE 90.2 ms, flip angle 90° and parallel imaging with a SENSE
factor 2.
2.3. DTI Processing
The processing of DTI data involved several steps. Firstly, the images were
resampled to isotropic 1mm voxel size and corrected for movement and distortions
artefacts caused by eddy currents using FMRIB Software Library Version 4.1.6 (FSL;
http://fsl.fmrib.ox.ac.uk). The diffusion weighted images were skull-stripped using the
Brain Extraction Tool implemented in FSL. Next, using FSL dtifit, we created the two most
commonly used DTI-based scalars: fractional anisotropy (FA) and mean diffusivity (MD).
2.4. Streamline Tractography
Deterministic streamline tracking was performed using the Diffusion Toolkit
(http://trackvis.org/blog/tag/diffusion-toolkit/) seeding from every voxel within the brain.
Tracking used a 2nd-order Runge Kutta propagation algorithm with an angular threshold of
<35° between neighboring voxels. The termination criteria of the tracking were either
exiting the brain or reaching a voxel with an FA value <0.1. The average whole brain track
counts for cFE and HP were 979461 and 1034048, respectively. Visual quality check of the
streamlines was performed using TrackVis (http://trackvis.org/).

Chapter 2. From FA to U-Fibers 24
2.5. Track-density imaging (TDI)
The population of U-fibers was selected from the whole brain streamline data using
the following selection parameters: length 20-60mm, curvature 2-10 and a U-factor,
describing the shape of a fiber between 0.6-1.
Using TrackVis, three types of track density images (TDI) were created: 1) whole
brain TDI (wbTDI), 2) enhanced whole brain TDI (ewbTDI) and U-fiber TDI (ufTDI). To
account for the underrepresentation of peripheral curved U-fibers in comparison to major
deep white matter tracts (Girard et al., 2014) we created the ewbTDI map. It combines the
wbTDI and the ufTDI multiplied by a factor of 5 to enhance the fiber density at the
periphery of the dataset. In each density map, every voxel represents the number of fibers
passing through it.
2.6. Spatial Normalization
The FA map was spatially normalized to the FMRIB58_FA template in MNI space
using SPM5 software (http://www.fil.ion.ucl.ac.uk/) with the following settings: Source
Image Smoothing 5mm FWHM, Non-linear Frequency cut-off 12mm, non-linear
Regularization 0.1, non-linear iterations 128. The determined transformation from
individual DTI space to MNI template space was then applied to all five DTI-based images:
FA, MD, wbTDI, ewbTDI and ufTDI.
2.7. Voxel-wise Statistical Analysis
Spatially normalized FA, MD, wbTDI, ewbTDI and ufTDI of an individual brain were
used for further voxel-wise statistical analysis. Every patient with MRI-negative focal
epilepsy is different and therefore each patient has to be analyzed individually using an

Chapter 2. From FA to U-Fibers 25
approach suggested by Henson (Henson., 2006). First, the differences between one
individual patient and each of the 42 healthy participants were calculated for each DTI-
based measure. The resulting 42 difference images were analyzed with one-sample T-test
using SPM5 software for each patient, identifying voxels with significant deviations from
the healthy population. We specifically tested for reduced FA, increased MD and reduced
track density, correcting for multiple comparisons with the family-wise error method and
thresholding at p<0.001.
2.8. Regional Quantification
To compare the sensitivity and specificity of the five different DTI-based measures,
we divided each brain into 8 regions (left and right: frontal, parietal, temporal and occipital
lobes) in MNI-space using MNI structural Atlas obtained from FSL software. Using fslstats,
implemented in FSL, two parameters were determined from the statistical analysis of each
DTI-based measure for each region: the highest T-score per region and the number of
voxels in each region with a T-score larger than 8.
To further evaluate the specificity of the DTI-based measures we assessed, for each
cFE patient, how many lobes showed alterations larger than 20cm3 (Table I).
Differences between cFE and CTR were assessed with two-sample t-test.
3. Results
3.1. Visualization of voxel-wise statistical analysis
In cFE, the visual inspection showed more widespread, bilateral and non-specific
alterations in FA, MD and wbTDI. The alterations in ewbTDI were less extensive than in FA
or MD, but still were more widespread than in ufTDI, where alterations were most

Chapter 2. From FA to U-Fibers 26
circumscribed and localized to one region (Fig. 1). In comparison to cFE, the alterations
seen in 10 CTR were significantly smaller for all five DTI-based measures (Fig. 1).
Chapter 2. From FA to U-Fibers 27

Chapter 2. From FA to U-Fibers 28
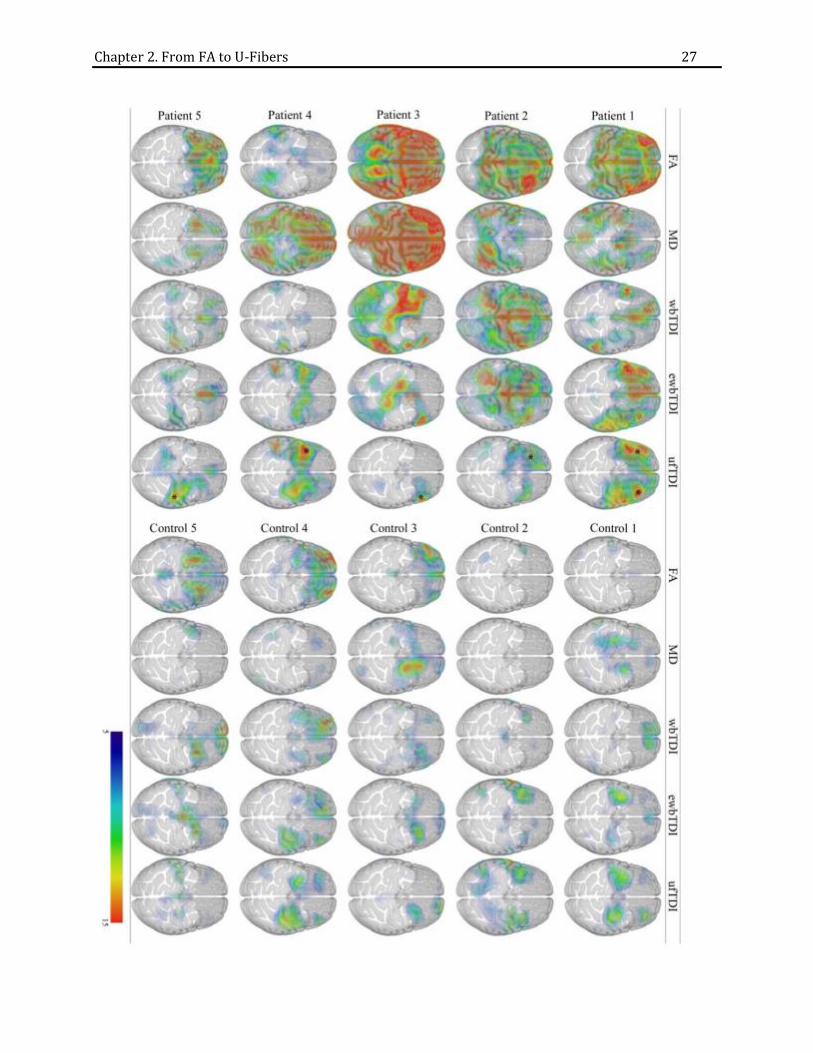
Figure 1. Visualization of voxel-wise statistical analysis.
Examples of five cFE patients and five CTR participants are used to show the differences in distribution of T-
scores and volume alterations in five DTI-based measures: FA, MD, wbTDI, ewbTDI and ufTDI, with low (blue)
to high T-score (red). The results of SPM quantification were rendered together with a MNI template at a
threshold T-score>5. The transparency of the template was increased to allow for the appreciation of the
extent of alterations. For cFE patients, the clinical localization of the EZ is marked with an asterisk.
3.2. Number of lobes with alterations
Using a threshold of 20cm³ per lobe, FA quantification showed the most unspecific
alterations. Only 10% of the patients had reductions in intensity in only one lobe of the
brain, 20% of patients showed alterations in up to three lobes and 60% showed alteration
in more than three lobes including 40% with FA reductions in all eight lobes (Table I). MD
alterations were restricted to one lobe in only 10% of patients and 80% of patients showed
alterations spreading to more than three lobes. The extent of the alterations was more
restricted with TDI-based quantifications. A restriction of alterations to only one lobe was
seen in 20% and 30% for wbTDI and ewbTDI, respectively. ufTDI alterations were most
localized, in 60% of patients the alterations were restricted to only one lobe and the
remaining 40% of the patients showed changes in up to three lobes (Table I).
No. of lobes FA MD wbTDI ewbTDI ufTDI
8 4 3 2 0 0 7 0 2 0 0 0 6 0 1 0 1 0 5 2 2 1 2 0
4 0 0 2 1 0
3 1 0 0 2 2 2 1 0 1 0 2 1 1 1 2 3 6
Table I. Number of lobes showing alterations in different DTI-based measures for all cFE patients. At a threshold of alteration volume of 20cm3, the frequency of alterations in eight lobes was counted for all DTI-based measures in 10 patients. The number of patients is color-coded with a gradient, where red represents the highest number of patients. Only in a few patients the alteration volume did not reach 20cm3 in any lobes for FA (n=1), MD (n=1), wbTDI (n=2) and ewbTDI (n=1).

Chapter 2. From FA to U-Fibers 29
3.3. Correlation with clinical data
Statistical analysis of FA, MD, wbTDI, ewbTDI and ufTDI for 10 individual cFE
patients and its regional quantification was compared to the clinical location of the EZ. The
quantification of FA, wbTDI and ewbTDI showed the peak T-score of alterations in the lobe
of the EZ in 20% of patients and MD identified the correct region in only 10%. In ufTDI
quantification, 80% of patients showed the peak T-score in the correct region.
Assessing the number of voxels above the threshold of T-score of 8 led to similar
results as the peak T-score. Only 20% of FA, MD and ewbTDI and only 10% in wbTDI
showed the correct lobe. ufTDI performed better than any other measure, with the highest
number of voxels in the correct lobe in 60%.
3.4. Differences between cFE and CTR quantification
To determine the range of alterations in our DTI-based measures in healthy controls,
the data of 10 CTR participants were analyzed, using the same quantitative procedure as for
the 10 cFE patients.
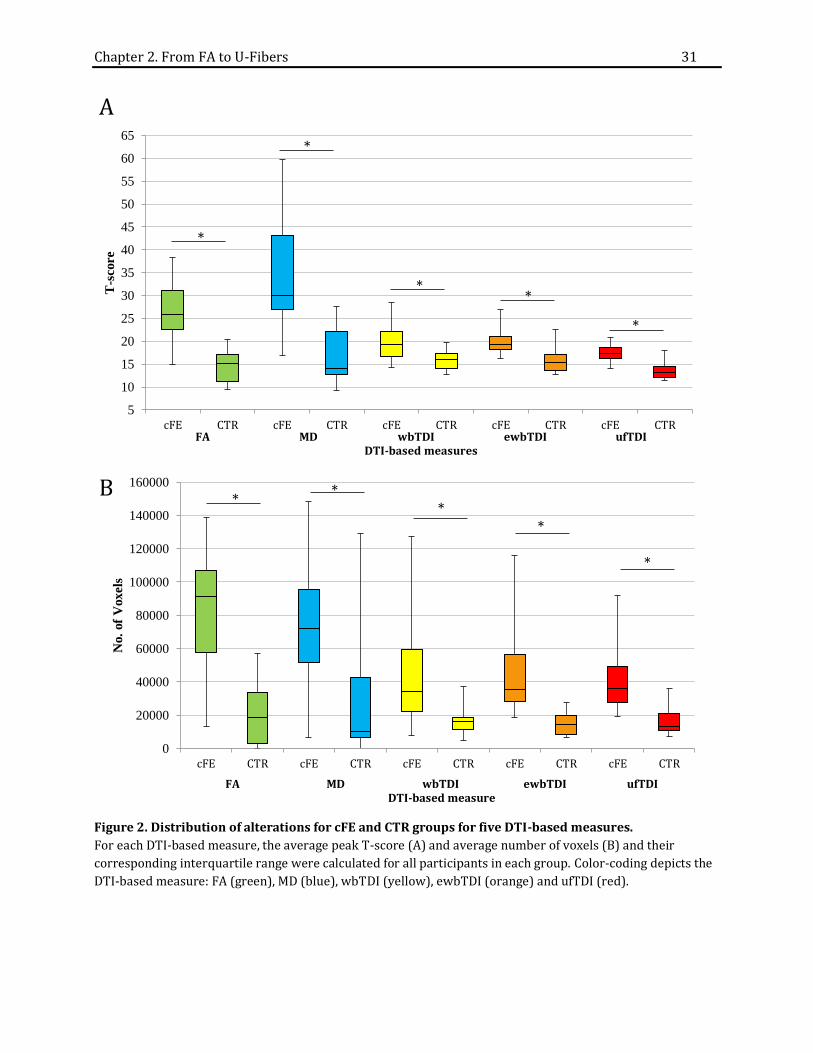
For all DTI-based measures, the peak T-scores of observed alterations were
significantly higher in cFE than in CTR (FA p0.0001, MD p0.0015, wbTDI p0.007,
ewbTDI p0.002, ufTDI p0.001; Fig. 2A).
The volumes of alterations with a T-score >8 of all measures in cFE were also
significantly larger in cFE than in CTR (Fig. 2B), which can also be appreciated visually (Fig.
1). Within the CTR group, the median volume of significant alterations falls below 20cm³ for
all five measures, whereas for cFE the median is above 30cm³. In the cFE group, FA
quantification showed a wide distribution (Fig. 2B) with a median alteration volume of

Chapter 2. From FA to U-Fibers 30
91cm³. On the other hand, the volume of FA decrease for CTR was significantly lower with a
median volume of 18cm³ (p6.6×10-5).
The quantification of MD showed an increase in intensity. In the cFE group, the
volume of this alteration had a median of 72cm³ compared to 10cm³ in the CTR group
(p0.01). MD alterations showed a larger variability in CTR than FA accounting for the
relatively high differences in p value 0.01.
The quantification of track density images showed much smaller alteration volumes.
For wbTDI the median volume of significant reductions is 34cm³ for cFE and 16cm³ in CTR
(p0.006), similar to that of ewbTDI with a median of 35cm³ in cFE and 14cm³ in CTR
(p0.0008) and ufTDI with a median of 36cm³ and 13cm³ for cFE and CTR (p0.0008),
respectively.
Chapter 2. From FA to U-Fibers 31
Figure 2. Distribution of alterations for cFE and CTR groups for five DTI-based measures.
For each DTI-based measure, the average peak T-score (A) and average number of voxels (B) and their
corresponding interquartile range were calculated for all participants in each group. Color-coding depicts the
DTI-based measure: FA (green), MD (blue), wbTDI (yellow), ewbTDI (orange) and ufTDI (red).
5
10
15
20
25
30
35
40
45
50
55
60
65
cFE CTR cFE CTR cFE CTR cFE CTR cFE CTR
T-s
core
FA MD wbTDI ewbTDI ufTDIDTI-based measures
A
*
*
**
*
0
20000
40000
60000
80000
100000
120000
140000
160000
cFE CTR cFE CTR cFE CTR cFE CTR cFE CTR
No.
of
Voxels
FA MD wbTDI ewbTDI ufTDIDTI-based measure
B*
**
*
*

Chapter 2. From FA to U-Fibers 32
4. Discussion
The localization of the epileptogenic zone (EZ) in patients with pharmacoresistant
cryptogenic focal epilepsy considered for resective epilepsy surgery is challenging with
current diagnostic methods.
To increase the yield of MRI, different processing strategies have been proposed
(other methods discussed in a review by (Kini et al., 2016)). Voxel-based morphometry
(VBM) (Ashburner and Friston, 2000) using either T1 or T2 FLAIR has also been applied in
MRI-negative epilepsy. However, similarly to FA and MD quantification, the yield was low.
One study using VBM of FLAIR-images identified focal changes in 14.3% of 70 patients of
which only half correlated with clinical data (Focke et al., 2009). Another study using
morphometric analysis programme detected 1% more histologically proven FCD Type IIb
than in conventional visual analysis (CVA), where CVA detected FCD in 91% of 74 cases
(Wagner et al., 2011). This method was more successful at detecting FCD Type IIa
pathology, where morphometric analysis detected 82% of histologically proven lesions
compared to 65% using CVA (n=17).
Recently, DTI has also been used as an additional diagnostic tool in a variety of
diseases. Here we compared the diagnostic accuracy of different DTI-based measures to
identify cryptogenic lesions in patients with focal epilepsy and showed that conventionally
used DTI measures, like FA and MD, are not optimal in localizing the EZ.
This is consistent with the few studies that used DTI for localization in MRI-negative
patients, where the analyses of FA and MD maps have been disappointing. A study using
voxel-wise statistical quantification identified an increase in MD in 8 of 30 MRI-negative
patients of which only half corresponded to the ictal EEG recordings and two patients that
showed alterations in FA, but only one was confirmed with ictal EEG (Rugg-Gunn et al.,

Chapter 2. From FA to U-Fibers 33
2001). Another study, showed that increased MD identified the EZ, determined by the
intracranial EEG, in 8 out of 20 patients (40%) (Thivard et al., 2011). Similarly to these
studies, our quantification of FA and MD maps showed widespread alterations throughout
the brain in most patients, insufficient to specifically identify the EZ. Specific changes
restricted to the EZ were seen in only 20% of the patients. Our analysis with one sample t-
test of difference images increases sensitivity for single subject studies, which could explain
the higher detection rate than what was reported in the aforementioned study (Rugg-Gunn
et al., 2001), but this procedure does not improve specificity. The high specificity of our
ufTDI quantification shows that ufTDI reflects different tissue properties than FA and MD,
selectively detecting changes in the EZ of focal epilepsy. Perhaps FA and MD are more
sensitive to secondary effects of epilepsy, seizures or medication, which cannot be
distinguished from the primary alterations in the EZ.
There is evidence of cytoarchitectural alterations at the grey-white matter border in
the resected epileptogenic tissue from cFE patients (Blümcke et al., 2011), which might
influence the tractography, by tracking fewer fibers in the vicinity of these epileptogenic
changes. From our 5 DTI-based measures, ufTDI is most specific for the grey-white matter
border and this could explain why ufTDI correlated best with clinical data, in 80% of our
patients, which to our knowledge has not been achieved before in MRI-negative epilepsy.
It is a common conception that every healthy brain is different. Therefore, it comes
to no surprise that regional alterations of all DTI-based measures were also observed in the
10 CTR participants we investigated, reflecting individual anatomic variability. However,
these alterations had a much lower T-score and smaller volume than the alterations we saw
in epilepsy patients for all five DTI-based measures. So in spite of their poor localizing
value, even FA and MD could still separate healthy subjects from patients.

Chapter 2. From FA to U-Fibers 34
4.1. Limitations
In this study, a rather small sample of 10 cFE patients were analyzed and
confirmation of our results in a larger cohort is warranted. Another potential limitation is
that the locations of DTI alterations are compared to the available clinical data. So far, only
two patients underwent resective surgery, definitely confirming the EZ. However, for all
patients there was conclusive clinical evidence for the location of the EZ, with no
contradictory information from any diagnostic modality. Also, we have used a standard
streamline tracking algorithm and perhaps more sophisticated algorithms, like HARDI
(Tuch et al., 2002) or Q-Ball (Berman et al., 2008), would lead to different results. We are
also aware of another DTI-based measure, called Neurite Orientation Dispersion and
Density Imaging (NODDI) (Zhang et al., 2012). However, this requires a two shell DTI
acquisition scheme, not readily available in a clinical setting and has not been applied to
cryptogenic epilepsy.
4.2. Conclusion
Quantification of U-fiber track density images provides a novel diagnostic method of
mapping the EZ in MRI-negative focal epilepsy, with much higher sensitivity and specificity
than the currently used DTI measures FA and MD. We assume this reflects specific
microstructural alterations at the grey-white matter border, where U-fibers are located.
Acknowledgement
This study was supported by the Friedrich-Baur-Stiftung and the Herta-Riehr Stiftung.
Chapter 2. From FA to U-Fibers 35
5. References
Ashburner, J., Friston, K.J., 2000. Voxel-Based Morphometry—The Methods. Neuroimage 11,
805–821. doi:10.1006/nimg.2000.0582
Berman, J.I., Chung, S., Mukherjee, P., Hess, C.P., Han, E.T., Henry, R.G., 2008. Probabilistic
streamline q-ball tractography using the residual bootstrap. Neuroimage 39, 215–22.
doi:10.1016/j.neuroimage.2007.08.021
Besson, P., Andermann, F., Dubeau, F., Bernasconi, A., 2008. Small focal cortical dysplasia
lesions are located at the bottom of a deep sulcus. Brain 131, 3246–3255.
doi:10.1093/brain/awn224
Blümcke, I., Thom, M., Aronica, E., Armstrong, D.D., Vinters, H. V, Palmini, A., Jacques, T.S.,
Avanzini, G., Barkovich, a J., Battaglia, G., Becker, A., Cepeda, C., Cendes, F., Colombo, N.,
Crino, P., Cross, J.H., Delalande, O., Dubeau, F., Duncan, J., Guerrini, R., Kahane, P.,
Mathern, G., Najm, I., Ozkara, C., Raybaud, C., Represa, A., Roper, S.N., Salamon, N.,
Schulze-Bonhage, A., Tassi, L., Vezzani, A., Spreafico, R., 2011. The clinico-pathologic
spectrum of focal cortical dysplasias: a consensus classification proposed by an ad hoc
Task Force of the ILAE Diagnostic Methods Commission. Epilepsia 52, 158–74.
doi:10.1111/j.1528-1167.2010.02777.x
Calamante, F., Smith, R.E., Tournier, J., Raffelt, D., Connelly, A., 2015. Quantification of voxel-
wise total fiber density: Investigating the problems associated with track-count
mapping. Neuroimage 117, 284–293. doi:10.1016/j.neuroimage.2015.05.070
Calamante, F., Tournier, J.-D., Jackson, G.D., Connelly, A., 2010. Track-density imaging (TDI):
super-resolution white matter imaging using whole-brain track-density mapping.
Neuroimage 53, 1233–43. doi:10.1016/j.neuroimage.2010.07.024

Chapter 2. From FA to U-Fibers 36
Colombo, N., Tassi, L., Galli, C., Citterio, A., Lo Russo, G., Scialfa, G., Spreafico, R., 2003. Focal
cortical dysplasias: MR imaging, histopathologic, and clinical correlations in surgically
treated patients with epilepsy. Am. J. Neuroradiol. 24, 724–733.
Dumas de la Roque, A., Oppenheim, C., Chassoux, F., Rodrigo, S., Beuvon, F., Daumas-Duport,
C., Devaux, B., Meder, J.-F., 2005. Diffusion tensor imaging of partial intractable
epilepsy. Eur. Radiol. 15, 279–85. doi:10.1007/s00330-004-2578-8
Eriksson, S.H., Rugg-Gunn, F.J., Symms, M.R., Barker, G.J., Duncan, J.S., 2001. Diffusion tensor
imaging in patients with epilepsy and malformations of cortical development. Brain
124, 617–626. doi:10.1093/brain/124.3.617
Focke, N.K., Bonelli, S.B., Yogarajah, M., Scott, C., Symms, M.R., Duncan, J.S., 2009. Automated
normalized FLAIR imaging in MRI-negative patients with refractory focal epilepsy.
Epilepsia 50, 1484–1490. doi:10.1111/j.1528-1167.2009.02022.x
Girard, G., Whittingstall, K., Deriche, R., Descoteaux, M., 2014. Towards quantitative
connectivity analysis: reducing tractography biases. Neuroimage 98, 266–278.
doi:10.1016/j.neuroimage.2014.04.074
Henson, R., 2006. Comparing a single patient versus a group of controls (and SPM) 1–5.
Kini, L.G., Gee, J.C., Litt, B., 2016. Computational analysis in epilepsy neuroimaging: A survey
of features and methods. NeuroImage Clin. 11, 515–529.
doi:10.1016/j.nicl.2016.02.013
Martin, P., Bender, B., Focke, N.K., 2015. Post-processing of structural MRI for individualized
diagnostics. Quant. Imaging Med. Surg. 5, 188–203. doi:10.3978/j.issn.2223-
4292.2015.01.10
Chapter 2. From FA to U-Fibers 37
Rosenow, F., Lüders, H., 2001. Presurgical evaluation of epilepsy. Brain 124, 1683–700.
doi:10.4103/1817-1745.40593
Rugg-Gunn, F.J., Eriksson, S.H., Symms, M.R., Barker, G.J., Duncan, J.S., 2001. Diffusion tensor
imaging of cryptogenic and acquired partial epilepsies. Brain 124, 627–636.
doi:10.1093/brain/124.3.627
Thivard, L., Bouilleret, V., Chassoux, F., Adam, C., Dormont, D., Baulac, M., Semah, F., Dupont,
S., 2011. Diffusion tensor imaging can localize the epileptogenic zone in nonlesional
extra-temporal refractory epilepsies when [(18)F]FDG-PET is not contributive.
Epilepsy Res. 97, 170–82. doi:10.1016/j.eplepsyres.2011.08.005
Tuch, D.S., Reese, T.G., Wiegell, M.R., Makris, N., Belliveau, J.W., Van Wedeen, J., 2002. High
angular resolution diffusion imaging reveals intravoxel white matter fiber
heterogeneity. Magn. Reson. Med. 48, 577–582. doi:10.1002/mrm.10268
Wagner, J., Weber, B., Urbach, H., Elger, C.E., Huppertz, H.J., 2011. Morphometric MRI
analysis improves detection of focal cortical dysplasia type II. Brain 134, 2844–2854.
doi:10.1093/brain/awr204
WHO, 2016. Epilepsy. World Heal. Organ. URL
http://www.who.int/mediacentre/factsheets/fs999/en/
Widjaja, E., Geibprasert, S., Otsubo, H., Snead III, O.C., Mahmoodabadi, S.Z., 2011. Diffusion
Tensor Imaging Assessment of the Epileptogenic Zone in Children with Localization-
Related Epilepsy. Am. J. Neuroradiol. 32, 1789–1794.
Winston, G.P., 2015. The potential role of novel diffusion imaging techniques in the
understanding and treatment of epilepsy. Quant. Imaging Med. Surg. 5, 279–287.

Chapter 2. From FA to U-Fibers 38
doi:10.3978/j.issn.2223-4292.2015.02.03
Yao, K., Mei, X., Liu, X., Duan, Z., Liu, C., Bian, Y., Ma, Z., Qi, X., 2014. Clinical characteristics,
pathological features and surgical outcomes of focal cortical dysplasia (FCD) type II:
correlation with pathological subtypes. Neurol. Sci. 35, 1519–26. doi:10.1007/s10072-
014-1782-9
Zhang, H., Schneider, T., Wheeler-Kingshott, C.A., Alexander, D.C., 2012. NODDI: practical in
vivo neurite orientation dispersion and density imaging of the human brain.
Neuroimage 61, 1000–16. doi:10.1016/j.neuroimage.2012.03.072

Chapter 3. On The Clinical Side 39
CHAPTER 3. ON THE CLINICAL SIDE
3.1. CONTRIBUTIONS
The author of this doctoral thesis, Joanna Goc (JG), contributed to the study by recruiting
and scanning the patients and controls with Dr. Christian Vollmar (CV). JG also contributed
by carrying out the research and analysis and together with CV discussed the results. CV
wrote the article.

Chapter 3. On The Clinical Side 40
Looking at the Dark Side of Diffusion Tensor Imaging Data –
U-Fiber Track Density Imaging Identifies Specific Structural Changes in
Non-lesional Focal Epilepsy
C. Vollmar1,2, J. Goc1,3, E. Hartl1, S. Noachtar1
1Dept. of Neurology, Epilepsy Centre, University of Munich Hospital, Germany
2Dept. of Neuroradiology, University of Munich Hospital, Munich, Germany
3Graduate School of Systemic Neurosciences, Ludwig Maximilian University, Munich,
Germany
Chapter 3. On The Clinical Side 41
Abstract
Epilepsy surgery is the most efficient treatment for selected patients with medically
refractory focal epilepsy. However, epilepsy surgery is challenging in non-lesional patients
when conventional magnetic resonance imaging (MRI) fails to identify the underlying
epileptogenic lesion. Here, we present a novel analysis method for single-subject Diffusion
Tensor Imaging (DTI), based on reconstruction, quantification and statistical analysis of
regional U-fibers, the most peripheral, short association fibers of the brain, located at the
grey-white-matter junction. This new approach identifies previously undetected structural
changes in 95% of 22 epilepsy patients with normal conventional MRI compared to normal
controls. Seventy-five percent of these changes are localized in brain regions consistent
with the epileptogenic zone. This novel diagnostic approach is a valuable tool in patients
considered for resective epilepsy surgery, when conventional MRI fails to identify a surgical
target.

Chapter 3. On The Clinical Side 42
Introduction
Diffusion tensor imaging (DTI) is a recent MRI method, which allows in vivo studies
of brain white matter and significantly contributed to important advances in clinical and
theoretical neuroscience in the past years (Craddock et al. 2013). Traditionally, analyses of
DTI data focused on fractional anisotropy (FA) images, which indicate the degree of
directional bundling of white matter fibers. Anatomically, analyses have focused on the
major white matter tracts which appear bright in FA images and which can be assessed
reliably, even with low- or medium-quality DTI acquisitions. More recently, high-quality
DTI acquisitions and processing methods provide rich datasets, with more detailed
information on structural brain anatomy, from core white matter tracts to the most
peripheral U-fibers of the brain. These peripheral regions appear dark in FA images (“dark
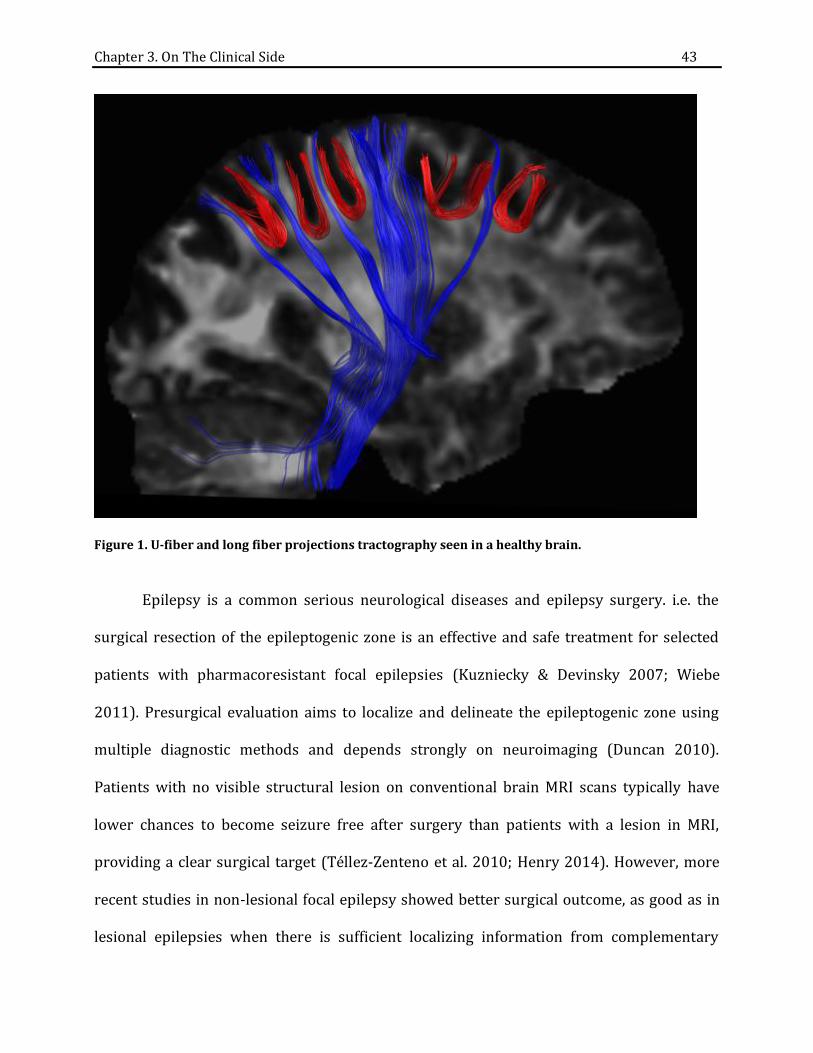
side”) and deserve more attention and further investigation (Fig. 1).
Chapter 3. On The Clinical Side 43
Figure 1. U-fiber and long fiber projections tractography seen in a healthy brain.
Epilepsy is a common serious neurological diseases and epilepsy surgery. i.e. the
surgical resection of the epileptogenic zone is an effective and safe treatment for selected
patients with pharmacoresistant focal epilepsies (Kuzniecky & Devinsky 2007; Wiebe
2011). Presurgical evaluation aims to localize and delineate the epileptogenic zone using
multiple diagnostic methods and depends strongly on neuroimaging (Duncan 2010).
Patients with no visible structural lesion on conventional brain MRI scans typically have
lower chances to become seizure free after surgery than patients with a lesion in MRI,
providing a clear surgical target (Téllez-Zenteno et al. 2010; Henry 2014). However, more
recent studies in non-lesional focal epilepsy showed better surgical outcome, as good as in
lesional epilepsies when there is sufficient localizing information from complementary

Chapter 3. On The Clinical Side 44
functional imaging data, consistent with the clinical and electrophysiological data (Lazow et
al. 2012).
Improvement of imaging methods has led to higher detection rates of epileptogenic
abnormalities, especially focal cortical dysplasia (FCD) (Mellerio et al. 2013). Despite these
advances in neuroimaging, still up to 50% of referrals for epilepsy surgery in tertiary
referral centers are patients with non-lesional or cryptogenic focal epilepsies (Nguyen et al.
2013) which require more extensive pre-surgical evaluation, including invasive EEG studies
with intracranial electrodes (Wiebe & Jette 2012; So & Lee 2014).
Several neuroimaging approaches have been developed to improve localization of
the epileptogenic zone in patients with non-lesional focal epilepsies (Madan & Grant 2009).
These include analysis of conventional T1-weighted MRI data using morphometry, which
has helped to identify hidden structural changes in some patients (Bernasconi et al. 2011;
Huppertz et al. 2005). Advanced MRI acquisition schemes are also being developed (Feindel
2013) and high field strength MRI at 7 Tesla is evaluated (De Ciantis et al. 2016). Functional
imaging, such as single photon emission tomography (SPECT) (Sulc et al. 2014) and
glucose-metabolism-based positron emission tomography (FDG-PET) (Rheims et al. 2013)
can also provide complementary information to localize functional abnormalities.
Magnetencephalography (MEG) has contributed additional localizing information in a few
selected patients (Jung et al. 2013). All of these methods have some limitations. T1-based
morphometry has low yield, providing additional information in only 10-30% of patients
(Wagner et al. 2011; Srivastava et al. 2005). MEG, FDG-PET and ictal SPECT which should be
performed during continuous EEG-video-monitoring are not readily available outside
tertiary referral centers. Both SPECT and FDG-PET are expensive and involve significant
radiation exposure.

Chapter 3. On The Clinical Side 45
Focal epilepsy is mainly a grey matter disease, caused by cortical neuronal
hyperexcitability, while DTI is usually used to analyze brain white matter. FCD is one of the
most frequent etiologies in focal epilepsy in patients with normal conventional MRI, often
diagnosed histopathologically in specimens from resective surgery (Wang et al. 2013). FCD
is a malformation of cortical development associated with impaired neuronal migration and
altered architecture of the cortex and underlying white matter (Blümcke et al. 2011).
Hallmarks of FCD are cortical thickening, blurring of the grey-white-matter border and
ectopic neurons in the subcortical white matter. Contemporary, high-quality DTI data
acquisition and processing allow to reliably reconstruct a comprehensive network of white
matter connections, including small peripheral U-fibers, spanning from one gyrus to the
neighboring gyri (Fig. 2), directly underneath the cortex, where FCD causes architectural
alterations. Quantification of regional U-fiber density is therefore a specific approach to
assess the brains microstructural properties in the proximity of the grey-white-matter-
border.

Chapter 3. On The Clinical Side 46
Figure 2. Schematic diagram showing the affected U-fibers in focal cortical dysplasia. Asterisk represents area affected by the pathology, which includes the blurring of the grey and white matter junction and the regional U-fibers.
Additionally, U-fibers are important for regional feedback mechanisms, controlling
activity levels within a brain area. Cortical inhibition, facilitated by interneurons, has been
shown to be impaired in focal epilepsy (Badawy et al. 2009; Werhahn et al 2000.). Axons of
inhibitory interneurons contribute a large proportion of connections in regional U-Fibers,
but this has not been studied systematically. In a patient with focal epilepsy following
hypoxic brain damage and normal conventional MRI, we could show regional U-fiber
reduction in the epileptogenic zone, leading to impaired cortical inhibition and
epileptogenicity (Feddersen, 2015).
Here, we propose a novel analysis approach to DTI data, which can be easily
acquired on a clinical routine MRI scanner. We show that reconstruction and statistical
quantification of regional U-fiber density from DTI data can serve as a novel neuroimaging

Chapter 3. On The Clinical Side 47
biomarker, identifying regional structural changes at the grey-white-matter-border, which
could not be detected by conventional MRI techniques in patients with focal epilepsy.
Results
Thirty consecutive patients with refractory focal epilepsy referred for pre-surgical
evaluation were investigated. In all of them epilepsy oriented (conventional) state of the art
3-Tesla MRI of the brain failed to reveal any structural lesion. Additional DTI images were
acquired for all patients. All patients had prolonged Video-EEG monitoring and we included
only those 22 with consistent clinical evidence for the localization of the epileptogenic zone.
Eleven of the 22 included patients had electroclinical evidence of a single localized
epileptogenic zone (frontal, n=6; temporal, n=3; central, n=2). Six patients had evidence for
two epileptogenic zones in one hemisphere and five patients had clinical evidence for
bilateral seizure onset.
Fourteen patients were re-examined with invasive EEG after implantation of
subdural electrodes (n=2) or stereotactic depth electrodes (n=12). Seven patients went on
to have epilepsy surgery, and six are since seizure free (follow-up 6-18 months). In three
patients, intracranial EEG showed bilateral epileptogenic zones, prohibiting resective
epilepsy surgery. Four patients are currently awaiting surgery.
In total, 48 clusters of voxels with significant reductions in U-fiber track density
images (ufTDI) were found in 21 of 22 patients (95%): One single cluster was identified in
three patients (14%), two clusters in ten (45%), three clusters in seven (32%) and four
clusters in two patients (9%) (Fig. 3). Of these 48 clusters, 36 (75%) were consistent with
clinically suspected epileptogenic regions, twelve (25%) did not match the clinical data.
Three additional regions were clinically suspected in two patients but did not show

Chapter 3. On The Clinical Side 48
significant ufTDI reductions (6%). Of the twelve clusters not matching the clinical data,
eight were ipsilateral to the epileptogenic zone and four were in the contralateral
hemisphere.
In the 14 patients with invasive EEG, 26 clusters were detected, 22 of which were
covered by the intracranial electrodes. Intracranial EEG recording showed seizure onset in
17 of these 22 clusters (77%).
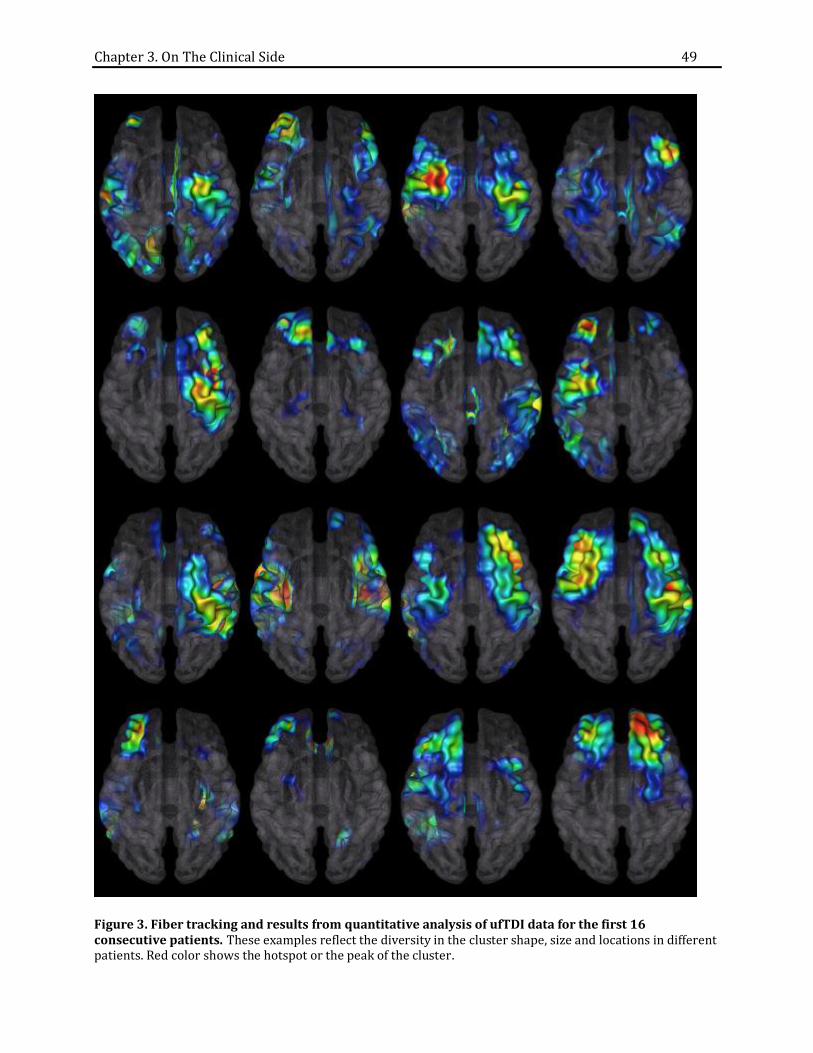
Chapter 3. On The Clinical Side 49
Figure 3. Fiber tracking and results from quantitative analysis of ufTDI data for the first 16 consecutive patients. These examples reflect the diversity in the cluster shape, size and locations in different patients. Red color shows the hotspot or the peak of the cluster.

Chapter 3. On The Clinical Side 50
Of the five patients with clinical evidence for bilateral epileptogenic zones, 4 showed
extensive, bilateral changes in the quantitative ufTDI analysis. Bilateral seizure onset was
confirmed by intracranial EEG recordings in three of them, precluding these patients from
resective epilepsy surgery. One of these patients has subsequently undergone implantation
of deep brain stimulation electrodes in the anterior thalamus, improving seizure control,
and one had a vagal nerve stimulator implanted.
Histopathological analysis of resected surgical specimen was performed in the seven
operated patients, and showed mild architectural disturbances with blurred grey-white-
matter border and ectopic neurons (n=5), ganglioglioma (n=1) and normal brain tissue
(n=1).
We also investigated one additional patient with severe hypoxic brain damage, a
pathology known to predominantly affect U-fibers. This patient had normal conventional
MRI but ufTDI quantification showed extensive bilateral reductions of U-fiber density, to a
degree and extent not seen in our epilepsy patients (Fig. 4). This serves as proof of concept
and demonstrates the sensitivity of our method to detect damage to U-fibers.

Chapter 3. On The Clinical Side 51
Figure 4. ufTDI quantification in a patient with hypoxic brain damage. Images from the left to right: T2, conventional diffusion weighted images (DWI) and ufTDI quantification results. ufTDI showed extensive bilateral reductions, whereas neither T2 nor DWI showed any abnormalities.
Discussion
We present a novel analysis method for DTI data, based on tracking and
quantification of regional U-fibers. U-Fiber track density images (ufTDI) were statistically
compared with a sample of healthy controls. This novel approach identifies focal structural
changes in patients with so-called cryptogenic focal epilepsy, where state-of-the-art 3 Tesla
conventional MRI had failed to show the epileptogenic lesions. This method provides a new
neuroimaging biomarker for microstructural alterations at the grey-white-matter-border,
not visible in conventional epilepsy oriented MRI. DTI data was acquired on a 9-year-old
clinical routine 3T Scanner, not requiring any specific hardware or software. Similar data
can be acquired on almost all currently available MRI scanners.
Almost all previous studies using DTI in epilepsy have been performed in patients
with visible brain lesions, such as hippocampal sclerosis, and investigated DTI alterations
beyond and remote from the lesion (Ahmadi et al. 2009) or their correlation with cognitive
parameters (McDonald et al. 2014).

Chapter 3. On The Clinical Side 52
DTI has rarely been used as additional localizing method in non-lesional focal
epilepsy. One of the few studies with a larger cohort used statistical analysis of mean
diffusivity (MD) images in 20 epilepsy patients and reported regional MD increases with a
sensitivity of 40% and specificity of 60% (Thivard et al. 2011). One recent DTI study also
included patients with non-lesional temporal lobe epilepsy and failed to identify
abnormalities in the major white matter tracts (Campos et al. 2015). However, this study
only evaluated major, “bright” white matter tracts, which are less affected by focal cortical
dysplasias. In contrast, our current study addressed U-fibers, in the “dark” and so far
unexplored periphery of DTI images, specifically investigating the grey-white matter
border, affected by FCD. Previous voxel based morphometry studies in epilepsy have
repeatedly shown focal alterations of the grey-white matter border (Wagner et al. 2011),
but with a much lower yield than with our approach. We recently compared ufTDI
quantification against the conventional DTI measures FA and MD showed a much higher
sensitivity and specificity of ufTDI for the detection of the epileptogenic zone in non-
lesional focal epilepsy (Goc, 2016, submitted).
True positive findings
With our approach, we were able to show clusters of reduced U-fiber track density,
representing focal microstructural brain changes in 95% of the patients, and 75% of these
clusters were consistent with clinical evidence on the epileptogenic zone. This sensitivity
and specificity is higher than for other complementary neuroimaging methods in non-
lesional focal epilepsy (Thivard et al. 2011). The correct identification of the epileptogenic
zone in previously non-lesional patients has several clinical consequences:

Chapter 3. On The Clinical Side 53
1) Some patients, where complementary functional investigations also remained
inconclusive, would have been excluded from epilepsy surgery. Here, ufTDI facilitates that
these patients benefit from surgery, by providing a target region for further investigation.
2) If patients are candidates for epilepsy surgery but require intracranial EEG recordings,
ufTDI can help in guiding the implantation of invasive electrodes, increasing the yield of the
procedure and reducing the number of required electrodes, and thereby minimizing the
risk of complications.
3) Further, ufTDI showed extensive bilateral U-fiber reductions in all patients, where
invasive recordings confirmed bilateral epileptogenic zones (Fig. 5). In these patients, not
suitable for resective surgery, our new approach may help in the future to identify these
patients earlier and to avoid the risks of invasive EEG recordings.
Figure 5. Co-registration of intracranial EEG electrodes and clusters of significant ufTDI reductions. These images show co-localization of seizure onset (red electrodes) with ufTDI alterations.
Chapter 3. On The Clinical Side 54
False positive findings
In about half of our patients, ufTDI showed more widespread changes, including
additional clusters of ufTDI reductions outside the clinically determined epileptogenic zone.
These additional areas were located ipsilateral to the epileptogenic zone in eight patients,
but also included clusters in the contralateral hemisphere in four patients. Only one of those
four contralateral clusters was the main (primary) cluster, the other three were smaller
(secondary or tertiary clusters) in addition to the primary, correctly localizing cluster.
There are different possible explanations for these additional clusters:
1) False positive clusters may reflect secondary effects of chronic focal epilepsy, where
areas remote from, but well connected to the epileptogenic onset zone, can show secondary
changes. This would be typical for homologue areas in the contralateral hemisphere where
lacking physiological input from the diseased side leads to inactivity or even regional
atrophy on the contralateral side. Such remote effect may also be seen in areas belonging to
the same functional system, similar to ipsilateral frontal hypometabolism observed in
patients with mesial temporal epilepsy (Arnold et al. 1995; Wong et al. 2010). Follow-up
scans of patients rendered seizure-free by surgery, may allow us to determine if some of
these remote effects are reversible after seizure cessation.
2) These false positive clusters may not be false positive after all. Not all patients who
undergo resective epilepsy surgery become seizure free, and some develop recurrent
seizures after a variable time of seizure freedom following surgery (Rosenow & Lüders
2001). There are several reasons for this, such as incomplete resection, but also including
dual pathology, where a second epileptogenic zone exists, but had not been detected at the
time of the pre-surgical evaluation, probably because it was not yet epileptically active at
that time. The fact that patients with non-lesional focal epilepsy tend to have a less

Chapter 3. On The Clinical Side 55
favorable outcome may indicate a higher proportion of such remote pathologies, extending
beyond the assumed epileptogenic zone (Bernhardt et al. 2013). Clinically uncorrelated
clusters of ufTDI reductions may represent such brain areas with structural alterations,
currently not epileptogenic, but with the potential to become secondary seizure generators
later on (Rosenow & Lüders 2001).
3) Finally, these additional clusters could be unrelated to epilepsy and simply reflect more
pronounced individual anatomical variations. In our current control population, we have
not observed clusters larger than 5 cm³ at the threshold we use for analyses in epilepsy
patients, but this does not preclude larger anatomical variations without pathological value.
False negative findings
No corresponding changes were seen in ufTDI for three brain regions with strong
clinical evidence of the epileptogenic zone. This may be due to different reasons, which
ultimately result in a reduced number of reconstructed U-fibers and hence may reduce the
sensitivity or statistical power of our method. 1) Some brain areas have a lower amount of
regional U-fibers than others, or a higher inter-individual variability reducing the statistical
power. 2) Our selection criteria to identify U-fibers may not be ideal for all brain areas, for
example, our length constrain of 20 - 60 mm may be too short to include longer U-fibers
around a deeper sulcus, artificially reducing fiber density. 3) Technical artifacts, specific to
some brain areas, may interfere with DTI data quality, such as susceptibility artifacts from
the skull base, which interfere with the reconstruction of basal temporal fiber tracts.

Chapter 3. On The Clinical Side 56
Patient population, gold standard and confirmation
All patients in our study underwent pre-surgical video-EEG monitoring, more than
half of them with intracranial EEG recordings, the gold standard for identification and
delineation of the epileptogenic zone in non-lesional focal epilepsy. Our ufTDI
quantification could identify clusters of focal reductions in all of these patients, and
intracranial EEG confirmed seizure onset in 77% of the identified clusters.
In those without intracranial EEG, the epileptogenic zone was defined by conclusive
interpretation of all available diagnostic information, including non-invasive video-EEG
monitoring, ictal SPECT, PET and clinical data. The percentage of correlation was not
significantly different in these patients, with 73% of ufTDI clusters correlating with the
clinical data. This indicates, that our observed correlations do not depend on the way, the
epileptogenic zone was identified.
Histopathology
The most frequent histopathological finding in resected surgical specimen from our
patients is a mild architectural disturbance with blurred grey-white-matter border and
ectopic neurons in the subcortical white matter, not enough to fulfil the current
histopathological criteria for FCD (Blümcke et al. 2014). We assume, that these subtle
histological changes disrupt the DTI tracking algorithm through a less consistent fiber
alignment, disturbed by ectopic neurons in the white matter. It is important to clarify that,
rather than showing white matter fibers directly, DTI and tractography actually show
reconstructed pathways of water diffusion, resembling the white matter fibers described in
anatomical studies. Hence, the reduction of U-fiber density we observe in our patients may

Chapter 3. On The Clinical Side 57
reflect an actual reduction of the number of anatomical U-fibers but could also reflect focal
changes interfering with the tracking algorithm.
Further correlation with histopathology results from more patients, the comparison
of different fiber types and different tracking algorithms, and the inclusion of additional
parametric DTI and other MR images will allow us to look into the biological nature of the
underlying alterations in more detail. Should different alteration patterns emerge, this may
allow us to predict histological changes from specific profiles of alterations in DTI data. That
we currently do not know the exact mechanism underlying our observed reductions in
ufTDI does not decrease its important clinical value for patients with medically refractory
non-lesional focal epilepsy.
Conclusion
Our novel user-independent DTI analysis method is able to identify subtle focal
structural changes at the grey-white-matter border not seen in conventional MRI. This
approach should be considered in patients with “non-lesional” focal epilepsy to localize the
epileptogenic zone. This additional localizing information has an impact on the
management of these patients, by helping to identify candidates for intracranial evaluation
and guidance of the electrode implantation. This same method may also be suitable to
identify patients with extensive bilateral alterations, who are not candidates for resective
surgery, sparing them unnecessary invasive investigations.
Outlook
Further analyses of different fiber populations and long-term follow-up of patients
will further our understanding of the mechanisms of epileptogenesis, seizure propagation

Chapter 3. On The Clinical Side 58
and secondary epileptogenesis, as well as compensation mechanisms and long-term effects
of chronic focal epilepsy.
Similar changes, with subtle alteration of peripheral fibers may also be found to
underlie other neurological disorders, such as neurodegenerative disease, where state-of-
the-art structural MRI fails to show specific pathological changes in early stages of the
disease and where the dark side of DTI data also has not been explored so far.

Chapter 3. On The Clinical Side 59
(Online) Methods
Study population
We investigated 30 patients with refractory focal epilepsy referred for pre-surgical
evaluation at the University of Munich Hospital between 2013 and 2015. All patients had
more than one conventional MRI, including a dedicated epilepsy protocol on a 3T scanner
evaluated by at least 2 experienced neuroradiologists and epileptologists, all MRI scans
were reported normal. Comprehensive pre-surgical evaluation allowed hypothesizing a
single seizure onset zone in 22 of the 30 patients, based on the conclusive interpretation of
scalp EEG, seizure semiology, ictal SPECT imaging (n=11) and FDG-PET (n=13). In the
remaining 6 patients, the pre-surgical evaluation was inconclusive, i.e. the epileptogenic
zone could not be lateralized or was only lateralized to one hemisphere but with no further
lobar localization. All patients are candidates for further invasive evaluation, using
intracranial depth or subdural electrodes.
For comparison we have scanned 31 age- and gender matched healthy controls with no
prior history of neurological disease and normal structural MRI scan.
Figure 6 shows the workflow of the method starting with the pre-processing of the diffusion
weighted images to ufTDI quantification in SPM.

Chapter 3. On The Clinical Side 60
Figure 6. Workflow of DTI data processing and analysis.
MRI
Clinical MRI was performed on a GE Signa HDx 3T scanner, using a dedicated epilepsy
protocol, including 3D T1, coronal T1 inversion recovery, coronal T2, coronal and axial 2D
FLAIR and a 3D sagittal FLAIR sequence.
DTI imaging
DTI data was acquired on the same scanner in a different session, using an acquisition
scheme with 64 diffusion-weighted directions, a b-value of 1000m/s², 2.4 mm slice

Chapter 3. On The Clinical Side 61
thickness and a 96x96 matrix within a 220mm field of view, resulting in a 2.3 mm in-plane
resolution. Using one excitation per volume, the acquisition time was 17:36 minutes.
DTI processing
Image volumes were resampled to isotropic 1mm voxel size and realigned to correct for
movement and eddy current induced distortions with FSL software
(http://fsl.fmrib.ox.ac.uk). Diffusion tensors were fitted and fractional anisotropy (FA) and
mean diffusivity (MD) maps were created. The resulting FA maps were spatially normalized
to a FA template in MNI (Montreal Neurological Institute) space using SPM5 software
(http://www.fil.ion.ucl.ac.uk/spm) to determine a nonlinear transformation with a 12mm
frequency cutoff, a regularization of 0.1 and 128 nonlinear iterations. Whole-brain
deterministic streamline tractography was performed in native individual subject space
with diffusion toolkit (http://trackvis.org), using an FA threshold of 0.1 and an angular
threshold of 35° between voxels, resulting in an average of 1.04 million fiber tracts per
subject (range 0.87 - 1.22million). From these fiber tracts, we selected U-fibers with the
command-line tool track_vis, using a length constraint of 20 - 60 mm, curvature of 5 - 10
and a U-factor, which estimates the shape of a fiber, of 0.6 – 1 (range -1 to 1). This resulted
in an average of 84 thousand U-fibers per subject (range 65 – 107), which were used for
subsequent analyses.
Statistical analysis and quantification of DTI data
For user-independent, automatic analysis of U-fibers, we subsequently created U-Fiber
track density images (ufTDI), where each voxel is assigned the number of U-fibers passing
through it. The ufTDI were then spatially normalized to MNI space, applying the

Chapter 3. On The Clinical Side 62
transformation previously determined from the FA normalization. Spatially normalized
ufTDI were smoothed with an 8mm FHWM kernel.
For the clinical purpose of localizing the previously undetermined epileptogenic area of a
patient, each patient needs to be analyzed as a single individual. We have, therefore, chosen
the approach suggested by Henson (R. Henson 2006) for single subject analysis, where
difference images are created for every patient, subtracting the ufTDI of every single
control from the ufTDI of the patient.
The resulting 31 difference images were then analyzed using a one sample t-test in SPM,
identifying areas of consistent decrease of U-fiber density.
We chose the threshold of p<0.001, with family-wise error correction for multiple
comparisons and a spatial extend threshold of at least 5000 contiguous voxels (equivalent
to 5 cm³ volume) to eliminate small volume noise.
Clusters of decreased U-fiber density were visualized in SPM glass brain view, sectional
images overlay and 3D surface rendering. Clusters were also back-normalized from MNI-
space into the patient’s individual DTI data and superimposed with the U-fiber rendering to
allow visual inspection of fiber tracts in the regions detected as statistically significant.
For the purpose of this study, regional increases in ufTDI were not analyzed. However,
future studies should address this in view of potential compensatory changes outside the
epileptogenic zone.
Chapter 3. On The Clinical Side 63
References
Ahmadi, M.E. et al., 2009. Side matters: diffusion tensor imaging tractography in left and
right temporal lobe epilepsy. AJNR, 30(9), pp.1740–7. Available at:
http://www.pubmedcentral.nih.gov/articlerender.fcgi?artid=2759860&tool=pmcentr
ez&rendertype=abstract [Accessed August 2, 2014].
Badawy, R. a B., Harvey, A.S. & Macdonell, R. a L., 2009. Cortical hyperexcitability and
epileptogenesis: Understanding the mechanisms of epilepsy - part 2. Journal of clinical
neuroscience, 16(4), pp.485–500. Available at:
http://www.ncbi.nlm.nih.gov/pubmed/19230676 [Accessed August 13, 2013].
Bernasconi, A. et al., 2011. Advances in MRI for “cryptogenic” epilepsies. Nature reviews.
Neurology, 7(2), pp.99–108. Available at:
http://www.ncbi.nlm.nih.gov/pubmed/21243016 [Accessed August 15, 2014].
Bernhardt, B.C. et al., 2013. Imaging structural and functional brain networks in temporal
lobe epilepsy. Frontiers in human neuroscience, 7(October), p.624. Available at:
http://www.pubmedcentral.nih.gov/articlerender.fcgi?artid=3787804&tool=pmcentr
ez&rendertype=abstract [Accessed December 22, 2013].
Besson, P. et al., 2008. Small focal cortical dysplasia lesions are located at the bottom of a
deep sulcus. Brain, 131(Pt 12), pp.3246–55. Available at:
http://www.ncbi.nlm.nih.gov/pubmed/18812443 [Accessed August 13, 2013].
Blümcke, I. et al., 2011. The clinico-pathologic spectrum of focal cortical dysplasias: a
consensus classification proposed by an ad hoc Task Force of the ILAE Diagnostic
Methods Commission. Epilepsia, 52(1), pp.158–74. Available at:

Chapter 3. On The Clinical Side 64
http://www.pubmedcentral.nih.gov/articlerender.fcgi?artid=3058866&tool=pmcentr
ez&rendertype=abstract [Accessed April 2, 2014].
Burzynska, A.Z. et al., 2013. A scaffold for efficiency in the human brain. The Journal of
neuroscience, 33(43), pp.17150–9. Available at:
http://www.ncbi.nlm.nih.gov/pubmed/24155318 [Accessed March 19, 2014].
Campos, B.M. et al., 2015. White matter abnormalities associate with type and localization
of focal epileptogenic lesions. Epilepsia, 56(1), pp.125–132. Available at:
http://doi.wiley.com/10.1111/epi.12871.
De Ciantis, A. et al., 2016. 7T MRI in focal epilepsy with unrevealing conventional field
strength imaging. Epilepsia, p.n/a–n/a. Available at:
http://doi.wiley.com/10.1111/epi.13313.
Colombo, N. et al., 2012. Focal cortical dysplasia type IIa and IIb: MRI aspects in 118 cases
proven by histopathology. Neuroradiology, 54(10), pp.1065–77. Available at:
http://www.ncbi.nlm.nih.gov/pubmed/22695739 [Accessed April 13, 2014].
Craddock, R.C. et al., 2013. Imaging human connectomes at the macroscale. Nature methods,
10(6), pp.524–39. Available at: http://www.ncbi.nlm.nih.gov/pubmed/23722212
[Accessed December 12, 2013].
Duncan, J.S., 2010. Imaging in the surgical treatment of epilepsy. Nature reviews. Neurology,
6(10), pp.537–50. Available at: http://www.ncbi.nlm.nih.gov/pubmed/20842185
[Accessed August 13, 2013].
Chapter 3. On The Clinical Side 65
Feindel, K.W., 2013. Can we develop pathology-specific MRI contrast for “MR-negative”
epilepsy? Epilepsia, 54 Suppl 2(2009), pp.71–4. Available at:
http://www.ncbi.nlm.nih.gov/pubmed/23646976 [Accessed January 3, 2014].
Hader, W.J. et al., 2013. Complications of epilepsy surgery: a systematic review of focal
surgical resections and invasive EEG monitoring. Epilepsia, 54(5), pp.840–7. Available
at: http://www.ncbi.nlm.nih.gov/pubmed/23551133 [Accessed November 17, 2013].
Henry, T.R., 2014. Resecting without detecting the lesion in extratemporal lobe epilepsy?
Neurology. Available at: http://www.ncbi.nlm.nih.gov/pubmed/24532278 [Accessed
March 2, 2014].
Huppertz, H.-J. et al., 2005. Enhanced visualization of blurred grey-white matter junctions in
focal cortical dysplasia by voxel-based 3D MRI analysis. Epilepsy research, 67(1-2),
pp.35–50. Available at: http://www.ncbi.nlm.nih.gov/pubmed/16171974 [Accessed
August 4, 2010].
Jung, J. et al., 2013. The value of magnetoencephalography for seizure-onset zone
localization in magnetic resonance imaging-negative partial epilepsy. Brain, 136(Pt
10), pp.3176–86. Available at:
http://www.pubmedcentral.nih.gov/articlerender.fcgi?artid=3784280&tool=pmcentr
ez&rendertype=abstract [Accessed December 16, 2013].
Kuzniecky, R. & Devinsky, O., 2007. Surgery Insight: surgical management of epilepsy.
Nature clinical practice. Neurology, 3(12), pp.673–81. Available at:
http://www.ncbi.nlm.nih.gov/pubmed/18046440 [Accessed August 5, 2014].
Chapter 3. On The Clinical Side 66
Lazow, S.P. et al., 2012. Outcome of frontal lobe epilepsy surgery. Epilepsia, 53(10),
pp.1746–55. Available at: http://www.ncbi.nlm.nih.gov/pubmed/22780836 [Accessed
January 19, 2015].
Madan, N. & Grant, P.E., 2009. New directions in clinical imaging of cortical dysplasias.
Epilepsia, 50 Suppl 9, pp.9–18. Available at:
http://www.ncbi.nlm.nih.gov/pubmed/19761449 [Accessed January 21, 2015].
McDonald, C.R. et al., 2014. White matter microstructure complements morphometry for
predicting verbal memory in epilepsy. Cortex, 58, pp.139–150. Available at:
http://dx.doi.org/10.1016/j.cortex.2014.05.014.
Mellerio, C. et al., 2013. 3T MRI improves the detection of transmantle sign in type 2 focal
cortical dysplasia. Epilepsia, 55(1), p.n/a–n/a. Available at:
http://doi.wiley.com/10.1111/epi.12464 [Accessed November 17, 2013].
Nguyen, D.K. et al., 2013. Prevalence of non-lesional focal epilepsy in an adult epilepsy
clinic. The Canadian journal of neurological sciences, 40(2), pp.198–202. Available at:
http://www.ncbi.nlm.nih.gov/pubmed/23419568 [Accessed April 13, 2014].
Von Oertzen, J. et al., 2002. Standard magnetic resonance imaging is inadequate for patients
with refractory focal epilepsy. Journal of neurology, neurosurgery, and psychiatry, 73(6),
pp.643–7. Available at:
http://www.ncbi.nlm.nih.gov/entrez/query.fcgi?cmd=Retrieve&db=PubMed&dopt=Ci
tation&list_uids=12438463 [Accessed August 10, 2014].

Chapter 3. On The Clinical Side 67
Paus, T. et al., 1999. Structural maturation of neural pathways in children and adolescents:
in vivo study. Science, 283(5409), pp.1908–11. Available at:
http://www.ncbi.nlm.nih.gov/pubmed/10082463 [Accessed January 19, 2015].
Rheims, S., Jung, J. & Ryvlin, P., 2013. Combination of PET and Magnetoencephalography in
the Presurgical Assessment of MRI-Negative Epilepsy. Frontiers in neurology,
4(November), p.188. Available at:
http://www.pubmedcentral.nih.gov/articlerender.fcgi?artid=3836027&tool=pmcentr
ez&rendertype=abstract [Accessed January 3, 2014].
Rosenow, F. & Lüders, H., 2001. Presurgical evaluation of epilepsy. Brain, 124(Pt 9),
pp.1683–700. Available at: http://www.ncbi.nlm.nih.gov/pubmed/11522572.
See, S.-J. et al., 2013. Surgical outcomes in patients with extratemporal epilepsy and subtle
or normal magnetic resonance imaging findings. Neurosurgery, 73(1), pp.68–76;
discussion 76–7. Available at: http://www.ncbi.nlm.nih.gov/pubmed/23615090
[Accessed December 12, 2013].
Seo, J.H. et al., 2011. Multimodality imaging in the surgical treatment of children with
nonlesional epilepsy. Neurology, 76(1), pp.41–8. Available at:
http://www.pubmedcentral.nih.gov/articlerender.fcgi?artid=3030221&tool=pmcentr
ez&rendertype=abstract.
So, E.L. & Lee, R.W., 2014. Epilepsy surgery in MRI-negative epilepsies. Current opinion in
neurology, 27(2), pp.206–12. Available at:
http://www.ncbi.nlm.nih.gov/pubmed/24553461 [Accessed September 14, 2014].

Chapter 3. On The Clinical Side 68
Srivastava, S. et al., 2005. Feature-based statistical analysis of structural MR data for
automatic detection of focal cortical dysplastic lesions. NeuroImage, 27(2), pp.253–66.
Available at: http://www.ncbi.nlm.nih.gov/pubmed/15993628 [Accessed April 13,
2014].
Sulc, V. et al., 2014. Statistical SPECT processing in MRI-negative epilepsy surgery.
Neurology, 82(11), pp.932–9. Available at:
http://www.ncbi.nlm.nih.gov/pubmed/24532274 [Accessed March 2, 2014].
Téllez-Zenteno, J.F. et al., 2010. Surgical outcomes in lesional and non-lesional epilepsy: a
systematic review and meta-analysis. Epilepsy research, 89(2-3), pp.310–8. Available
at: http://www.ncbi.nlm.nih.gov/pubmed/20227852 [Accessed April 6, 2014].
Thivard, L. et al., 2011. Diffusion tensor imaging can localize the epileptogenic zone in
nonlesional extra-temporal refractory epilepsies when [(18)F]FDG-PET is not
contributive. Epilepsy research, 97(1-2), pp.170–82. Available at:
http://www.ncbi.nlm.nih.gov/pubmed/21885254 [Accessed August 13, 2013].
Wagner, J. et al., 2011. Morphometric MRI analysis improves detection of focal cortical
dysplasia type II. Brain, 134(Pt 10), pp.2844–54. Available at:
http://www.ncbi.nlm.nih.gov/pubmed/21893591 [Accessed August 13, 2013].
Wang, Z.I. et al., 2013. The pathology of magnetic-resonance-imaging-negative epilepsy.
Modern pathology, 26(8), pp.1051–8. Available at:
http://www.ncbi.nlm.nih.gov/pubmed/23558575 [Accessed August 5, 2014].
Chapter 3. On The Clinical Side 69
Wiebe, S., 2011. Epilepsy. Outcome patterns in epilepsy surgery--the long-term view. Nature
reviews. Neurology, 8(3), pp.123–4. Available at:
http://www.ncbi.nlm.nih.gov/pubmed/22290572 [Accessed January 4, 2014].
Wiebe, S. & Jette, N., 2012. Pharmacoresistance and the role of surgery in difficult to treat
epilepsy. Nature reviews. Neurology, 8(12), pp.669–77. Available at:
http://www.ncbi.nlm.nih.gov/pubmed/22964510 [Accessed January 27, 2014].
Wong, C.H. et al., 2010. The topography and significance of extratemporal hypometabolism
in refractory mesial temporal lobe epilepsy examined by FDG-PET. Epilepsia, 51(8),
pp.1365–73. Available at: http://www.ncbi.nlm.nih.gov/pubmed/20384730.

Chapter 4. Effects of Pre-processing 70
CHAPTER 4. EFFECTS OF PRE-PROCESSING
4.1. CONTRIBUTIONS
The work was done under the supervision of Dr. Christian Vollmar (CV). CV developed the
initial hypothesis and together with Joanna Goc (JG) designed the research. JG, CV and Dr.
Elisabeth Hartl (EH) recruited and scanned participants. JG developed the method and
Nadia Khalilieh (NK) optimized spatial normalization procedures that JG later used in the
study. JG carried out the research and analysis and together with CV discussed the results.
JG wrote the article.
Chapter 4. Effects of Pre-processing 71
The effects of pre-processing pipeline steps on statistical DTI tract
quantification in cryptogenic focal epilepsy
J. Goc1,2, E. Hartl1, N. Khalilieh1, S. Noachtar1, C. Vollmar1,3 *
1Dept. of Neurology, Epilepsy Centre, University of Munich Hospital, Germany 2Graduate School of Systemic Neurosciences, Ludwig Maximilian University, Munich,
Germany 3Dept. of Neuroradiology, University of Munich Hospital, Munich, Germany
*Correspondence to:
Dr. Dr. Christian Vollmar
Marchioninistr. 15
81377 Munich
Germany
+49 89440072682
Keywords:
cryptogenic epilepsy, epileptogenic zone, ufTDI, localization, spatial normalization, DTI

Chapter 4. Effects of Pre-processing 72
Abstract
A recent approach to localize the epileptogenic zone (EZ) in patients with
cryptogenic focal epilepsy (cFE) based on the quantification of U-fiber track density images
(ufTDI) showed better results than the quantification of FA or MD. However, the analysis
involves a complex processing pipeline, where every processing step should be evaluated
and optimized. Here, we looked at the effects of three different spatial normalization
procedures, a U-fiber-specific masking and two different tracking algorithms on the final
ufTDI results.
22 patients with MRI-negative focal epilepsy were compared against 31 healthy
controls. DTI data was acquired on a 3T GE Signa HDx Scanner with 64 diffusion-weighted
directions and b-value of 1000 s/mm². DTI data was pre-processed, whole brain
deterministic streamline tracking and HARDI tracking were performed and ufTDI were
created, counting the number of U-fibers passing through any voxel. The ufTDI of each
participant was spatially normalized to a template in MNI-space using three different
approaches: SPM with default settings (SPMd) and optimized parameters (SPMo) and
Advanced Normalization Tools (ANTs). A statistical comparison to the healthy control
population was carried out, using a whole brain mask or the U-fiber-specific mask. The
resulting clusters of significant ufTDI reductions, in every individual patient, were
compared to the clinical localization of the EZ.
All three spatial normalization procedures showed comparable results, identifying
primary clusters of reductions at similar locations with an average overlap of 71.5%.
Results based on the SPMo spatial normalization showed the highest correlation with the
clinical data and strongest statistical significance. Using a U-fiber-specific mask, instead of
the MNI152_T1 whole brain mask reduced the volume of false-positive clusters by 31.6%.

Chapter 4. Effects of Pre-processing 73
Deterministic streamline tracking showed fewer tertiary clusters than when using HARDI
tracking.
Quantification of ufTDI is a robust method to localize the EZ in cFE. However,
optimization of several processing steps along the analysis pipeline can help to increase
sensitivity and specificity of the results, mostly by reducing the number of false positive
findings.

Chapter 4. Effects of Pre-processing 74
Abbreviations: DTI = diffusion tensor imaging; MRI = magnetic resonance imaging; SPM =
statistical parametric mapping; ANTs = advanced normalization tool; cFE = cryptogenic
focal epilepsy; CTR = control; EZ = epileptogenic zone; ufTDI = U-fiber track density image

Chapter 4. Effects of Pre-processing 75
1. Introduction
Epilepsy is one of the most common neurological disorders affecting up to 1% of the
population, where 30% of patients have pharmacoresistant epilepsy. In some of these
patients, resective epilepsy surgery can be an effective treatment option (Rosenow and
Lüders, 2001). Up to 50% of the candidates for surgery have “non-lesional”, cryptogenic
focal epilepsy (cFE), where conventional MRI does not show the underlying structural
lesion. No single diagnostic method alone is available for the localization of the
epileptogenic zone (EZ) (Kudr et al., 2013). The correct localization of the EZ and its
complete resection are crucial for postoperative seizure freedom. The most frequent
structural pathology in focal epilepsy is focal cortical dysplasia (FCD) characterized by
histological abnormalities of the laminar layer of the cortex, blurring of the white and grey
matter border, dysmorphic neurons and balloon cells (Besson et al., 2008; Blümcke et al.,
2011). More severe forms of FCD can be detected by conventional MRI, but the changes can
also be subtle and then may be easily overlooked on visual inspection of MRI or may not be
visible in conventional MRI at all (Besson et al., 2008).
The use of diffusion tensor imaging (DTI) for identifying hidden lesions in cFE
patients is less common. Quantification of the track density images (TDI) of short
association fibers, called U-fibers, obtained from DTI has been shown to localize the EZ
more effectively than quantitative analysis of fractional anisotropy (FA), mean diffusivity
(MD) or whole brain track density images (Goc et al., submitted). This approach provides a
novel and efficient diagnostic tool in cFE, offering additional valuable information for the
localization of the EZ (Vollmar et al., in prep).
The ability to accurately compare DTI data across brains of many individuals relies
on spatial normalization to transform individual brain scans onto a common template thus

Chapter 4. Effects of Pre-processing 76
allowing further comparison and voxel wise analyses. There are two types of approaches:
volume-based and surface-based. The former, more common type, uses voxel intensities to
steer the spatial normalization and uses full brain volume (Ghosh et al., 2010; Klein et al.,
2009), whereas the latter takes into account the cortical surface alone, i.e. the shape of sulci
and gyri (Fischl et al., 1999). The choice of the type of spatial normalization is likely to affect
the results of cross subject analyses. Here we are interested in the reductions in fiber
density and therefore volume-based spatial normalization is more applicable for this
purpose.
Here we report the effects of the software and parameters for volume-based spatial
normalization, a U-fiber-specific masking and different tracking algorithms on the
quantification of U-fiber track density images (ufTDI).
2. Methods and Participants
2.1. Participants
A group of 22 patients [mean age of 31 (SD: 12.4), 11 males] diagnosed with drug-
resistant cryptogenic focal epilepsy (cFE) was investigated. All patients had conventional
structural MRI at 3T, not showing any structural epileptogenic lesions and underwent a
series of neurological examinations including scalp EEG and video monitoring, FDG-PET,
SPECT and in some cases invasive intracranial EEG.
31 healthy participants with no previous neurological or psychiatric history were
included in the control (CTR) group [mean age of 28 years (SD: 6.4), 24 males].
The University of Munich Ethics Committee approved the study and all participants
have given a written and informed consent.

Chapter 4. Effects of Pre-processing 77
2.2. DTI acquisition and pre-processing
All participants had additional DTI data acquisition on a 3T GE Signa HDx Scanner
with an 8-channel head coil using 64 diffusion-weighted directions, a b-value of 1000
s/mm², 60 axial slices with 2.4 mm slice thickness, a 96x96 in-plane matrix with a 220mm
field of view, TR 16000 ms, TE 90.2 ms, flip angle 90° and parallel imaging with a SENSE
factor of 2.
DTI-images were resampled to isotropic 1mm voxel size and corrected for
movement and distortions caused by eddy currents using FSL software
(http://fsl.fmrib.ox.ac.uk). Skull-stripped, realigned images were processed with FSL dtifit
to create fractional anisotropy (FA) maps.
2.3. Tracking and U-fiber selection
Deterministic streamline tracking (DST) seeding from every voxel within the brain
was performed with the Diffusion Toolkit (http://trackvis.org/) using a 2nd-order Runge
Kutta propagation algorithm with an angular threshold of 35°. The termination criteria of
the tracking were either exiting the brain or when the FA value in a voxel was <0.1. The
streamlines were then visually analyzed in TrackVis (http://trackvis.org/) to check for
erroneous tracking. The average whole brain track counts for cFE and CTR were 951699
and 1025380, respectively.
Additionally, in the first 10 cFE patients, the same DTI data was used for a high
angular resolution diffusion imaging (HARDI) tracking performed with Diffusion Toolkit.
The termination criteria, visual verification and U-fiber selection were the same as for DST
tractography, except for an angular threshold of 45°. The average whole brain track counts
for cFE and CTR using HARDI tracking were 1136809 and 1240378, respectively.

Chapter 4. Effects of Pre-processing 78
The population of U-fibers was selected from the whole brain tracking data using the
following selection parameters: length 20-60mm, curvature 2-10 and U-factor, describing
the shape of a fiber, between 0.6-1. These were then used to create U-fiber track density
images (ufTDI) (Goc et al., submitted).
2.4. Spatial Normalization
We compared two commonly used volume-based programs for affine and nonlinear
spatial normalizations: SPM (Ashburner et al., 1999) and Advanced Normalization Tools
(ANTs) (Avants et al., 2011). The FA maps were spatially normalized to the FMRIB58_FA
template in MNI space provided by FSL. The following three different spatial normalization
procedures were compared:
SPM default (SPMd) – using default parameters provided by SPM5.
SPM optimized (SPMo) – with the following adjustments: source image smoothing
(from 8 to 5mm), non-linear frequency cut-off (from 25 to 12mm), non-linear
regularization (from 1 to 0.1) and non-linear iterations (from 16 to 128).
ANTs optimized (ANTs) – using the SyN algorithm with a regularization of SyN 0.5,
smoothing 5mm and a 4x2x1 subsampling scheme with 30x90x150 nonlinear
iterations.
The determined transformation from individual FA maps to the FA template was then
applied to ufTDI before further statistical analyses.
2.5. Voxel-wise Statistical Analysis
Spatially normalized ufTDI of an individual brain was used for the voxel-wise
statistical analysis based on the method described elsewhere (Goc et al., submitted). First,

Chapter 4. Effects of Pre-processing 79
the differences in ufTDI maps between each individual patient and the group of 31 controls
were calculated (Henson, 2006). The resulting 31 difference images were analyzed with
one-sample t-test using SPM to identify clusters of voxels with decreased track density
compared to the CTR group. After family wise error (FWE) correction for multiple
comparisons, the results were analyzed at the threshold of p<0.001 and a spatial extent
threshold of >5000 voxels (5cm3).
2.6. U-fiber-specific explicit mask
Additionally, a U-fiber-specific mask was created to constrain statistical analysis to
regions with a sufficient U-fiber density by averaging the spatially normalized ufTDIs of all
participants. This average was then smoothed with 8mm FWHM, thresholded at 3 and
binarised. Using FSL atlas tool, subcortical structures (brainstem, caudate, putamen,
pallidum, thalamus and lateral ventricles) and cerebellum were subtracted from the mask.
This U-fiber-specific mask was compared to the conventionally used MNI152_T1 whole
brain mask before statistical analysis in a sample of 10 cFE patients using the SPMo
normalization.
2.7. Classification of clusters
In most of the patients, the quantification of ufTDI showed multiple clusters of
voxels with ufTDI reductions varying in spatial extent and degree of significance.
Occasionally, there are clusters with a high T-score that are unlikely to be true findings,
usually located in regions where no U-fibers are present, presumably due to e.g. DTI
acquisition or spatial normalization artefacts. Therefore, to overcome these issues, we have
ranked clusters based on their weight defined by:

Chapter 4. Effects of Pre-processing 80
Equation 1. Calculating the cluster weight. Cluster volume is based on the number of voxels thresholded at p <0.001 and cluster T-score is the maximum T-score of any voxel within this cluster.
cluster weight = (cluster volume) × (cluster peak T-score)
The primary cluster is the one with the highest cluster weight per participant.
Tertiary clusters have a cluster weight smaller than 10% of the primary cluster. Secondary
clusters are all clusters in between.
3. Results
3.1. Spatial normalization procedures
The quantification of ufTDI showed clusters of statistically significant decrease in
track density in all patients for all three spatial normalization procedures. Overall ufTDI
quantification identified 45, 49 and 51 clusters for SPMd, SPMo and ANTs, respectively. We
restricted further analyses to the primary cluster of every patient. Compared to the clinical
information about the localization of the EZ, the ufTDI quantification correctly identified the
EZ in 79%, 85% and 74% of primary clusters using SPMd, SPMo and ANTs normalization,
respectively.
In general, the three spatial normalization procedures lead to very similar statistical
results. However, there are differences, which can be appreciated visually and
quantitatively. On average, the volume of primary clusters was bigger in SPMd by 3%
compared to SPMo. The volume of the clusters was bigger in ANTs than SPMo by 6.5% and
SPMd by 3.9%.
The peak T-score obtained by the quantification of ufTDI was significantly higher in
cFE than in CTR for all three spatial normalization procedures (Fig.1). The average peak T-

Chapter 4. Effects of Pre-processing 81
scores for primary clusters in CTR and cFE groups were 12.0 and 15.1 for SPMd (p=4x10⁻³),
12.2 and 16.3 for SPMo (p=8.66x10⁻⁷) and 12.2 and 16.0 for ANTs (p=1.46x10⁻⁵),
respectively, showing that the difference between cFE and CTR was most significant using
the SPMo spatial normalization procedure.
The quantification based on all three spatial normalization procedures showed the clusters
in similar regions (Fig. 2) with 71.5% average overlap of the three clusters in each patient
(Table 1).
5
10
15
20
25
CTR cFE CTR cFE CTR cFE
Pea
k T-
sco
re
SPMd SPMo ANTsSpatial Normalization procedure
* **
Figure 1. Significance of ufTDI reductions in CTR and cFE patients based on three different spatial normalization procedures. For each spatial normalization procedure, the average peak T-score of ufTDI quantification and its corresponding interquartile range was calculated for each group.

Chapter 4. Effects of Pre-processing 82
3.2. U-fiber specific mask
The effects of a U-fiber-specific mask on the cluster volume obtained in
quantification and visual impression were evaluated in 10 cFE patients. Quantification of
ufTDI using a U-fiber-specific explicit mask, resulted on average in 31.6% smaller volume of
and SPMd SPMo ANTs
Ove
rlap
bet
wee
n
clu
ster
s
SPMd - 69% 67%
SPMo 73% - 70%
ANTs 75% 75% -
Figure 2. Visualisation of the ufTDI quantification based on three different spatial normalization procedures in the same patient. ufTDI quantification showing a single cluster extending from the right postcentral gyrus in the parietal lobe to the temporal lobe. Clinically, the patient had somatosensory auras with tingling of the left hand consistent with the postcentral location of the cluster. SPMo shows the most significant reduction in the postcentral gyrus comparing to SPMd and ANTs. The 3D mesh is rendered at the smoothed grey-white-matter border of the MNI152T1 template. The color-coded overlay shows one patient’s statistically significant reductions of the ufTDI compared to controls.
Table 1. Average degree of overlap between quantifications based on different spatial normalization procedures. The percentage of the overlap of clusters from two different quantifications was calculated. The top row indicates what the overlap was for a particular quantification, e.g. the overlap between SPMd and SPMo was 69% of SPMo-based cluster and 73% of SPMd-based cluster.

Chapter 4. Effects of Pre-processing 83
clusters compared to using the MNI152_T1 whole brain mask. With the U-fiber-specific
mask, several of the false-positive clusters were removed from anatomical regions where U-
fibers are not typically present (Fig. 3). For this reason, the remaining analyses were based
on the quantification using the U-fiber-specific explicit mask.
3.3. DST versus HARDI tracking
The comparison of the effects of DST and HARDI tracking algorithms on the
quantification of ufTDI was performed for 10 cFE patients using SPMo spatial normalization
and the U-fiber-specific mask. On average, HARDI tracking resulted in 16% more whole-
brain fibers and 36% more U-fibers than DST.
The ufTDI quantification based on HARDI tracking showed a slightly lower average
T-score for primary clusters (16.26) than DST (16.98). The total number of clusters
detected in these 10 patients was higher in HARDI (n=34) than in DST (n=23). Typically, the
additional clusters were tertiary clusters or noise (Fig. 4).
Figure 3. Effects of masking on ufTDI quantification. (A) SPMo-based quantification using MNI152_T1 whole brain mask showed clusters in regions were U-
fibers are not typically found, e.g. cerebellum. Those clusters are masked out using (B) U-fiber-specific mask.

Chapter 4. Effects of Pre-processing 84
Generally, the primary clusters were detected at similar locations and had a
comparable shape for all patients. In terms of correlation with the electroclinical data, the
same primary clusters were correctly identified in all 10 cFE patients with both DST and
HARDI tracking. However, of all known clusters, including secondary clusters, 76%
matched the clinical localization of the EZ when using DST and 65% in HARDI.
Figure 4. Visualisation of the ufTDI quantification based on different tracking algorithms in the same patient.
ufTDI quantification results based on (A) DST and (B) HARDI tracking.

Chapter 4. Effects of Pre-processing 85
4. Discussion
In cryptogenic focal epilepsy (cFE), localization of the epileptogenic zone (EZ) is
challenged by the absence of a visible lesion in conventional MRI and relies on
complementary diagnostic methods. DTI might be able to detect microscopic changes due
to disruptions of the cortical laminations (Rugg-Gunn et al., 2001; Martin et al., 2015; Goc et
al., submitted; Vollmar et al., in prep) in the area causing epilepsy. The use of DTI data
allows for the analysis of structural differences in regions of the hypothesized EZ by
quantifying U-fiber track density images (ufTDI). However, the processing pipeline of such
analyses is complex, involving pre-processing, tracking, spatial normalization, masking, etc.
and each step may affect the final results. Here, we focused on evaluating the effects of the
spatial normalization and masking. We chose two commonly used volume-based software
packages for this purpose: SPM and ANTs.
We expected for this step to be important, as it might directly relate to the accuracy
and reliability of the results later on (Ghosh et al., 2010). However, we showed that the type
of normalization and the optimization of parameters do not fundamentally influence the
results of the quantification, i.e. the majority of primary clusters remain at the same
location in all three spatial normalization procedures. The type of spatial normalization has
an impact on the amount of secondary and tertiary clusters and the amount of general
noise. It has been reported that ANTs performs better at registering the native brain to a
reference image than SPM does (Ghosh et al., 2010). In our data, the apparent changes in
ufTDI are robust enough that the different spatial normalization procedures do not
significantly change the results of statistical quantification.
It is difficult to assess which spatial normalization procedure is best to improve the
quantification. We still do not know whether presence of more or fewer clusters is better or

Chapter 4. Effects of Pre-processing 86
worse. We do know that altogether, SPMd normalization lead to the lowest number of
clusters, however, cluster location based on SPMo correlated best with the clinical data.
Here, we only evaluated the primary clusters, but we do know that in some patients, the EZ
might extend to more than just one region. SPMd showed higher correlation of the primary
clusters with the clinical data than ANTs did by 5%, whereas SPMo identified 6% more
clusters than SPMd did. All three are within a close range and the clusters largely
overlapped. It is important to take into account the computation time and ANTs has shown
to be more demanding and time-consuming than SPMo (Ghosh et al., 2010), while the
results were similar.
On the other hand, the U-fiber-specific explicit mask used in the quantification had a
major effect on the results. All primary clusters remained at the same location, but the total
size of all clusters significantly decreased by 31.6%, mostly by eliminating artefactual
secondary and tertiary clusters.
Every brain has its own individual characteristics, meaning that there will be
clusters of reduced ufTDI present in every brain including healthy controls (Goc et al.,
submitted). To determine the threshold, separating CTR from cFE, we have also performed
statistical ufTDI quantification in the CTR group and compared the results to those from
cFE patients. The distribution of T-scores clearly separates CTR and cFE groups (see Fig. 1).
Together with other indications (e.g. cluster weight, cluster shape, etc.), this separation
might be used as a threshold to determine the validity of the cluster.
We have compared ufTDI quantifications based on both DST and HARDI tracking
algorithms, which have both correctly identified the same primary clusters. But –similarly
to the spatial normalization procedures – changes in the tracking algorithms affected the
amount of noise and false-positive clusters. In our series, HARDI-based quantification

Chapter 4. Effects of Pre-processing 87
showed more clusters that were not correlated with the electroclinical data. Compared to a
simple DST tracking algorithm, HARDI is optimized to decipher multiple fiber orientations
within a single voxel (Tuch et al., 2002) and is more capable to overcome crossings. This
could account for a different distribution of reconstructed tracts and the additional clusters
seen in HARDI-based quantification. However, the effects of different tracking algorithms
on ufTDI quantification to localize the EZ should be investigated in more detail.
4.1. Conclusion
For a complex analysis pipeline, such as statistical quantification of ufTDI, every
step, from the data acquisition to the statistical analysis, matters and every step should be
optimized to obtain the best results possible for a given question. None of the differences
we investigated have resulted in a failure to correctly identify the primary cluster of ufTDI
reductions, also illustrating the robustness of this approach. However, the choice of the
most appropriate alternative for every step throughout the processing pipeline has reduced
the number of false-positive findings, reduced the amount of noise, strengthened the
separation of patients from controls and improved the specificity of findings.
5. Acknowledgements
This study was supported by the Friedrich-Baur-Stiftung and the Herta-Riehr Stiftung.
Chapter 4. Effects of Pre-processing 88
6. References
Ashburner, J., Andersson, J.L., Friston, K.J., 1999. High-dimensional image registration using
symmetric priors. Neuroimage 9, 619–28. doi:10.1006/nimg.1999.0437
Avants, B.B., Tustison, N.J., Song, G., Cook, P. a., Klein, A., Gee, J.C., 2011. A reproducible
evaluation of ANTs similarity metric performance in brain image registration.
Neuroimage 54, 2033–2044. doi:10.1016/j.neuroimage.2010.09.025
Besson, P., Andermann, F., Dubeau, F., Bernasconi, A., 2008. Small focal cortical dysplasia
lesions are located at the bottom of a deep sulcus. Brain 131, 3246–3255.
doi:10.1093/brain/awn224
Blümcke, I., Thom, M., Aronica, E., Armstrong, D.D., Vinters, H. V, Palmini, A., Jacques, T.S.,
Avanzini, G., Barkovich, a J., Battaglia, G., Becker, A., Cepeda, C., Cendes, F., Colombo, N.,
Crino, P., Cross, J.H., Delalande, O., Dubeau, F., Duncan, J., Guerrini, R., Kahane, P.,
Mathern, G., Najm, I., Ozkara, C., Raybaud, C., Represa, A., Roper, S.N., Salamon, N.,
Schulze-Bonhage, A., Tassi, L., Vezzani, A., Spreafico, R., 2011. The clinicopathologic
spectrum of focal cortical dysplasias: a consensus classification proposed by an ad hoc
Task Force of the ILAE Diagnostic Methods Commission. Epilepsia 52, 158–74.
doi:10.1111/j.1528-1167.2010.02777.x
Fischl, B., Sereno, M.I., Dale, a M., 1999. Cortical Surface-Based Analysis II: Inflation,
Flattening, and a Surface-Based Coordinate System. Neuroimage 9, 195–207.
doi:10.1006/nimg.1998.0396
Ghosh, S.S., Kakunoori, S., Augustinack, J., Nieto-Castanon, A., Kovelman, I., Gaab, N.,
Christodoulou, J.A., Triantafyllou, C., Gabrieli, J.D.E., Fischl, B., 2010. Evaluating the
validity of volume-based and surface-based brain image registration for developmental

Chapter 4. Effects of Pre-processing 89
cognitive neuroscience studies in children 4 to 11 years of age. Neuroimage 53, 85–93.
doi:10.1016/j.neuroimage.2010.05.075
Henson, R., 2006. Comparing a single patient versus a group of controls (and SPM) 1–5.
Klein, A., Andersson, J., Ardekani, B.A., Ashburner, J., Avants, B., Chiang, M.C., Christensen,
G.E., Collins, D.L., Gee, J., Hellier, P., Song, J.H., Jenkinson, M., Lepage, C., Rueckert, D.,
Thompson, P., Vercauteren, T., Woods, R.P., Mann, J.J., Parsey, R. V., 2009. Evaluation of
14 nonlinear deformation algorithms applied to human brain MRI registration.
Neuroimage 46, 786–802. doi:10.1016/j.neuroimage.2008.12.037
Kudr, M., Krsek, P., Marusic, P., Tomasek, M., Trnka, J., Michalova, K., Jaruskova, M., Sanda, J.,
Kyncl, M., Zamecnik, J., Rybar, J., Jahodova, A., Mohapl, M., Komarek, V., Tichy, M., 2013.
SISCOM and FDG-PET in patients with non-lesional extratemporal epilepsy:
Correlation with intracranial EEG, histology, and seizure outcome. Epileptic Disord. 15,
3–13. doi:10.1684/epd.2013.0560
Martin, P., Bender, B., Focke, N.K., 2015. Post-processing of structural MRI for individualized
diagnostics. Quant. Imaging Med. Surg. 5, 188–203. doi:10.3978/j.issn.2223-
4292.2015.01.10
Rosenow, F., Lüders, H., 2001. Presurgical evaluation of epilepsy. Brain 124, 1683–700.
doi:10.4103/1817-1745.40593
Rugg-Gunn, F.J., Eriksson, S.H., Symms, M.R., Barker, G.J., Duncan, J.S., 2001. Diffusion tensor
imaging of cryptogenic and acquired partial epilepsies. Brain 124, 627–636.
doi:10.1093/brain/124.3.627
Tuch, D.S., Reese, T.G., Wiegell, M.R., Makris, N., Belliveau, J.W., Van Wedeen, J., 2002. High

Chapter 4. Effects of Pre-processing 90
angular resolution diffusion imaging reveals intravoxel white matter fiber
heterogeneity. Magn. Reson. Med. 48, 577–582. doi:10.1002/mrm.10268

Chapter 5. Gender and Controls 91
CHAPTER 5. GENDER AND CONTROLS
5.1. CONTRIBUTIONS
The work was done under the supervision of Dr. Christian Vollmar (CV). Joanna Goc (JG)
developed the initial hypothesis and designed the research. JG and Dr. Elisabeth Hartl (EH)
recruited and scanned additional healthy controls. JG adjusted the previously mentioned
method in Chapters 3 and 4. JG carried out the research and analysis and together with CV
discussed the results. JG wrote the article.

Chapter 5. Gender and Controls 92
Careful control selection improves the quantification of fiber density
images in cryptogenic focal epilepsy
J. Goc1,2, E. Hartl1, S. Noachtar1, C. Vollmar1,3 *
1Dept. of Neurology, Epilepsy Centre, University of Munich Hospital, Germany 2Graduate School of Systemic Neurosciences, Ludwig Maximilian University, Munich,
Germany 3Dept. of Neuroradiology, University of Munich Hospital, Munich, Germany
*Correspondence to:
Dr. med. Dr. phil. Christian Vollmar
Klinikum Großhadern
Marchioninistr. 15
81377 Munich
Germany
+49 89440072682
Keywords:
control population, gender, sex dimorphism, DTI, cryptogenic epilepsy, focal epilepsy, U-
fibers, ufTDI
Chapter 5. Gender and Controls 93
Abstract
DTI is becoming increasingly used as a diagnostic tool in neurology. Recently, we proposed
a new DTI-based diagnostic method that localized the epileptogenic zone in patients with
cryptogenic focal epilepsy (cFE) by quantifying U-fiber track density images (ufTDI) in
comparison to a healthy control population. We also showed that optimizing the steps in
the complex pre-processing pipeline improves the specificity of the ufTDI quantification.
Another unexplored aspect of this approach is the effect of the control population on the
quantification. In neuroimaging studies, there are still open questions regarding the
composition of the correct control group and it may be selected inadequately. The effects of
gender-matched control groups are rarely investigated and to our knowledge, no single-
subject study has evaluated them.
Here, we investigated different effects of the composition of the group of healthy
controls (n=60) on ufTDI quantification in cFE patients (n=48). DTI data was acquired for
all participants on a 3T GE Signa HDx Scanner with 64 diffusion-weighted directions and b-
value of 1000 s/mm². DTI data was pre-processed and whole brain streamline tracking was
performed and U-fibres were selected to create ufTDI. Statistical comparisons of single
individual patients to the varying healthy population (HP) groups were carried out to
identify changes in the final results of the ufTDI quantification.
The results showed that increasing size of the HP group increases the statistical
significance of the ufTDI quantification and improves the separation of healthy controls
from cFE patients. The separation was further strengthened by removing outliers from the
biggest HP group. When using a gender-matched HP group, the overall volume of ufTDI
reductions decreased by 17% for male and 21.5% for female patients. At the same time, the

Chapter 5. Gender and Controls 94
primary clusters amongst all groups and patients remained at the same location and only
the additional clusters, e.g. noise clusters, are affected.
In summary, we showed that careful selection of controls affects the amount of noise
and additional clusters without fundamentally changing the primary cluster.
Abbreviations: DTI = diffusion tensor imaging; MRI = magnetic resonance imaging; ufTDI =
U-fiber track density image; cFE = cryptogenic focal epilepsy; CTR = control; HP = healthy
participants
Chapter 5. Gender and Controls 95
1. Introduction
Identifying micro-structural lesions using diffusion tensor imaging in patients with
‘non-lesional’ cryptogenic focal epilepsy (cFE) is new. In drug-resistant patients, the correct
localization of the epileptogenic zone (EZ) and its complete surgical resection are crucial to
achieve seizure freedom (Rosenow and Lüders, 2001). Recently, a new approach of
quantifying track density images (TDI) of short association fibers, called U-fibers, obtained
from DTI has been introduced (Goc et al., submitted). It has shown to localize the EZ more
effectively than a quantitative analysis of commonly-used fractional anisotropy (FA), mean
diffusivity (MD) or whole brain track density images. A following study showed that
optimizing steps of the pre-processing pipeline, like spatial normalization or the use of a U-
fiber-specific mask, improved the sensitivity and specificity of the method (Goc et al., in
prep). These studies did not yet evaluate the role of the control group for statistical
comparison and its effects on the final statistical results.
The quantification of U-fiber track density images (ufTDI) is based on statistical
comparison of one individual cFE patient against a group of healthy controls, which is able
to identify clusters with significantly decreased track density in individual cFE patients. The
primary cluster has been shown to correlate well with the clinically-determined EZ (Goc et
al., in prep). Often there are additional, smaller clusters of reduced track density that are
thought to represent false-positive findings. These could be due to a number of factors, e.g.
individual anatomical variability, the sample size and composition of the control group.
In neuroimaging studies, there are still open questions regarding the composition of
the correct control group and it is occasionally poorly selected (Greene et al., 2016). This is
particularly true for new methodological approaches, such as the ufTDI quantification,
where the sample size necessary for statistical analyses or comparisons is unknown.

Chapter 5. Gender and Controls 96
Underpowered studies are prone to low chance of discovering a true effect and even if that
effect is found, most likely the relative magnitude of that effect would be exaggerated (the
so-called “Winner’s curse”, Button et al., 2013). Too small size of a control group could
prevent the discovery of the true effect and increasing the number of controls might
improve the power of a study. However, this association is not linear and beyond a certain
number of controls, there is little improvement in the power of the study (Grimes and
Schulz, 2005). Finding the optimal number of controls for neuroimaging studies remains a
challenging task, especially for a single-subject study against group comparison that we
perform here.
It has been shown that gender-specific differences are present in the human brain. A
number of studies over the last decade studied sex dimorphism using neuroimaging
methods, such as fMRI, voxel-based morphometry (VBM) and DTI (Sacher et al., 2013).
Sexual dimorphism was investigated at great length, primarily looking into the overall brain
size, where male brain volume is larger than female’s brain, or investigating the proportion
of white to grey matter, where women showed to have a higher proportion of grey matter
(Sacher et al., 2013). These differences can influence statistical analyses such as our ufTDI
quantification and could result in both reduced sensitivity and false-positive findings and
increased noise in case of gender mismatch. Additionally, recent structural studies have
shown regional differences in brain volume, where men showed an increased volume of
midbrain, left inferior temporal gyrus, right middle temporal gyrus and cerebellum (Chen et
al., 2007). Women showed greater volume in cingulate cortices (Chen et al., 2007) and
auditory and language-related areas (Brun et al., 2009).
In most neuroimaging studies, mixed control groups are used and the gender of the
controls is not necessarily considered, e.g. for mixed patient group, a mixed control group is

Chapter 5. Gender and Controls 97
assembled. Occasionally, when a gender-related disease is investigated, e.g. prostate cancer,
then naturally it would involve a male control group. However, the effects of using a gender-
specific control group are rarely investigated and to our knowledge, no single-subject study
has evaluated the effects of single-patients against mixed control group compared to a
gender-specific control group.
Basically, the control population should be similar to the patients in all regards,
except for the disorder in question (Grimes and Schulz, 2005; Schulz and Grimes, 2002).
Therefore, here we evaluated the effects of the size and gender of the control group on the
ufTDI quantification of individual patients with cFE.
2. Methods and Participants
2.1. Participants
A group of 48 patients [26 males with mean age 31.4 (SD: 11.5), 22 females with
mean age 29.1 (SD: 9.2)] diagnosed with MRI-negative cryptogenic focal epilepsy (cFE) was
investigated. 20 of those patients had a clinically clearly defined epileptogenic zone and
were used for further analyses. All patients had conventional structural MRI at 3T using a
specific epilepsy protocol, including high resolution 3D T1 and 3D FLAIR images, coronal
FLAIR T2 and inversion recovery T1 images, not showing any structural epileptogenic
lesions. All patients underwent a series of neurological examinations including scalp EEG
and Video Monitoring, FDG-PET, ictal SPECT and in some cases invasive intracranial EEG.
60 healthy controls (CTR) with no previous history of neurological or psychiatric
disease were included in the healthy population (HP) group [mean age of 28.7 years (SD:
7.1), 30 males and 30 females].

Chapter 5. Gender and Controls 98
The University of Munich Ethics Committee approved the study and all participants
gave written and informed consent.
2.2. DTI acquisition and pre-processing
All participants had additional DTI data acquisition on a 3T GE Signa HDx Scanner
with an 8-channel head coil using 64 diffusion-weighted directions, a b-value of 1000
s/mm², 60 axial slices with 2.4 mm slice thickness, a 96x96 in-plane matrix with a 220mm
field of view, TR 16000 ms, TE 90.2 ms, flip angle 90° and parallel imaging with a SENSE
factor of 2.
DTI-images were resampled to isotropic 1mm voxel size and corrected for
movement and distortions caused by eddy currents using eddy-correct function in FSL 4.1.9
software (http://fsl.fmrib.ox.ac.uk). Skull-stripped, realigned images were processed with
FSL dtifit to create fractional anisotropy (FA) maps.
2.4. Streamline Tractography and U-fiber selection
Deterministic streamline tracking seeding from every voxel within the brain was
performed using the Diffusion Toolkit 0.6.2.1 (http://trackvis.org/). This was based on 2nd-
order Runge Kutta propagation algorithm with an angular threshold of 35°. The termination
criteria of the tracking were either exiting the brain or when the FA value in a voxel was
<0.1. The streamlines were then visually analyzed in TrackVis 0.5.2.1 (http://trackvis.org/)
to check for erroneous tracking.
The population of U-fibers was selected from the whole brain tracking data using the
command line tool track_vis with the following selection parameters: length 20-60mm,
curvature 2-10 and U-factor 0.6-1 (more information available in the help command in

Chapter 5. Gender and Controls 99
track_vis, as part of TrackVis). These were then used to create U-fiber track density images
(ufTDI) (Goc et al., submitted), where the value at each pixel represents the number of U-
fibers passing through it.
2.5. Spatial Normalization
The FA maps were spatially normalized to the FMRIB58_FA template in MNI space
using SPM5 software (http://www.fil.ion.ucl.ac.uk/) with the following settings: Source
Image Smoothing 5mm, Non-linear Frequency cut-off 12mm, non-linear Regularization 0.1,
non-linear iterations 128. The determined transformation from individual DTI space to MNI
template space was then applied to ufTDI.
2.6. Voxel-wise Statistical Analysis
Spatially normalized ufTDI of an individual brain was used for the voxel-wise
statistical analysis based on the method described elsewhere (Vollmar et al., in prep; Goc et
al., submitted; Henson, 2006). In short, for each patient ufTDI difference images are
calculated by subtracting each CTR ufTDI from a patient’s ufTDI. These difference images
are then analyzed using a one-sample t-test for each individual cFE patient. This was also
repeated for each individual CTR in the same way.
Additionally, to limit the false-positive results, a U-fiber-specific mask was created
by averaging the spatially normalized ufTDIs of all participants. This was then smoothed by
FWHM 8, thresholded at 3. and binarised. Using the FSL Atlas tool, subcortical structures
(brainstem, caudate, putamen, pallidum, thalamus and lateral ventricles) and cerebellum
were subtracted from the mask.

Chapter 5. Gender and Controls 100
Four analyses were performed. 1) We investigated the effects of the size of the HP
group on the quantification results on ufTDI in 20 individual cFE patients, in which case the
number included in the HP group varied: 20, 30, 40, 50 and 60 HP. Each individual CTR was
also analyzed against the whole group of HP in the same way as the 20 cFE patients. 2) In
the second part of the study, we investigated the importance of “cleaned” up HP group,
where outliers were removed, in comparison to the 60HP group. The average and standard
deviation (SD) of t-scores of individual CTR from the 60HP-quantification were calculated
and CTR participants that had t-score higher than the average plus one standard deviation
were excluded with the aim of selecting CTR with a normal distribution and no outliers. The
re-selected “cleaned-up” HP group consisted of 49 healthy controls. 3) Additionally, a two
sample t-test was performed comparing the male and female G-HP groups. 4) The last part
of the study evaluated the effects of using a gender-specific healthy population (G-HP) on
the quantification including 30 HP each for a male and female G-HP.
The resulting clusters of decreased ufTDI were analyzed at the threshold of p<0.001
after family wise error (FWE) correction for multiple comparisons of and with a spatial
extent threshold of >5000 voxels.
3. Results
3.1. Size of the Control Group
The analysis was performed based on a comparison of 20 cFE patients against
groups of controls of: 20, 30, 40, 50 and 60 HP.
The average t-score of the primary clusters gradually increased with the increase in
the size of the control group showing a high R2 value for a non-linear regression model
(R2=0.993; Fig. 1). With the increasing HP group, the distinction between CTR and cFE
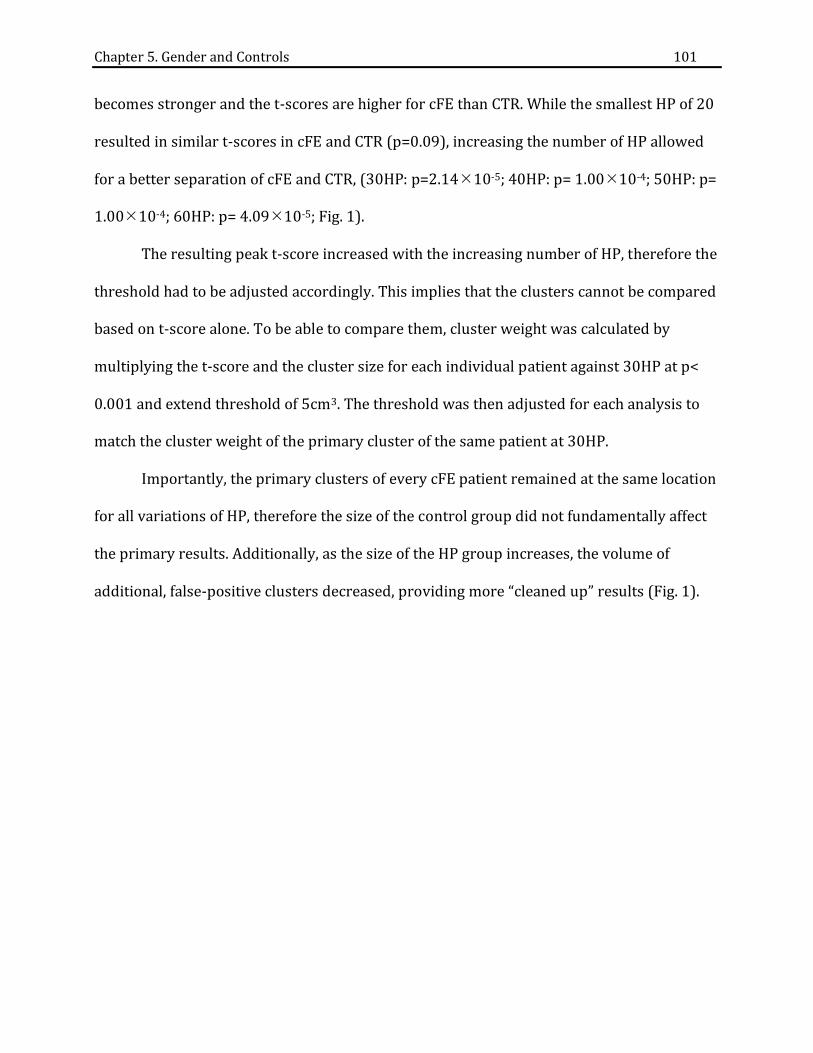
Chapter 5. Gender and Controls 101
becomes stronger and the t-scores are higher for cFE than CTR. While the smallest HP of 20
resulted in similar t-scores in cFE and CTR (p=0.09), increasing the number of HP allowed
for a better separation of cFE and CTR, (30HP: p=2.1410-5; 40HP: p= 1.0010-4; 50HP: p=
1.0010-4; 60HP: p= 4.0910-5; Fig. 1).
The resulting peak t-score increased with the increasing number of HP, therefore the
threshold had to be adjusted accordingly. This implies that the clusters cannot be compared
based on t-score alone. To be able to compare them, cluster weight was calculated by
multiplying the t-score and the cluster size for each individual patient against 30HP at p<
0.001 and extend threshold of 5cm3. The threshold was then adjusted for each analysis to
match the cluster weight of the primary cluster of the same patient at 30HP.
Importantly, the primary clusters of every cFE patient remained at the same location
for all variations of HP, therefore the size of the control group did not fundamentally affect
the primary results. Additionally, as the size of the HP group increases, the volume of
additional, false-positive clusters decreased, providing more “cleaned up” results (Fig. 1).

Chapter 5. Gender and Controls 102
Figure 1 Graphical representation of peak t-scores in cFE group against HP groups of different sizes. The ufTDI were quantified for 20 cFE patients. Each box and whisker plot represents the peak t-score of the primary cluster in patients for a given HP group. The thick black line represents polynomial regression of the average t-score per each HP group (R2= 0.993). Underneath the graph are two examples showing the changes in cluster volume in glass brain, as the number of controls increases in the HP group.
3.2. Re-selected HP Group
The peak t-scores of ufTDI reductions seen in individual CTR differed significantly
between 60HP and 49HP groups (p=0.0047) with the average t-score of 17.18 and 15.84,
respectively (Fig. 2). On the other hand, the peak t-scores for cFE were similar in both 60HP
and 49HP groups (p=0.44) with average t-score of 20.26 and 19.66, respectively.

Chapter 5. Gender and Controls 103
Consequently, the re-selected 49 HP group did further strengthen the separation between
CTR and cFE (p=5.2510-6) and decreased the cluster volume of secondary and tertiary
clusters by 8%. In some patients, the quantification using 49 HP group resulted in new
additional clusters (Fig. 2, Patient 1), which could indicate regions implicated in epilepsy
that were previously “hidden” in quantification based on a larger, but less homogenous HP
group.
Figure 2 ufTDI quantification of CTR and cFE against re-selected HP group. Box and whisker plot showing t-scores of primary clusters for CTR and cFE against two HP groups: 60HP and 49HP. The latter HP group is a re-selected group based on the ufTDI quantification of CTR against 60HP where mild outliers were excluded. A two-tailed two-sampled student’s t-test was performed showing a significant difference between CTR and cFE in 60HP (p=1.37x10⁻⁵) and 49hp (p=5.25x10⁻⁶). On the right are two examples of cFE patients using re-selected group quantification showing redistribution of t-scores within the clusters are reduced cluster volume.
3.3. Structural differences between male and female brains
A two sample t-test was performed comparing male and female G-HP groups. The
differences were minor (at p<0.05 uncorrected). Females showed higher U-fiber track
density in the superior frontal gyrus, posterior temporal neocortex and left occipital lobe.
Males showed increased ufTDI in inferior central region above the Sylvian fissure (Fig. 3).

Chapter 5. Gender and Controls 104
Figure 3. Differences in ufTDI between female and male control population. Results of two sample t-test where female and male healthy brains were compared. Increased ufTDI seen in A) female brains compared to male, B) male brains compared to female at p<0.05, uncorrected.
3.4. Gender-specific quantification
The ufTDI of all 48 cFE patients were individually quantified using mixed HP group
of 30 healthy controls and compared to quantification using 30 gender-matched controls.
The primary clusters in all cFE patients were located in the same region (Fig. 4), but the
peak t-scores were lower when using the G-HP group. The overall volume of all the clusters
in both male and female groups for cFE and CTR groups decreased with a higher reduction
in cFE compared to CTR (Table 1.)

Chapter 5. Gender and Controls 105
Figure 4 Glass-brains of patients comparing mixed HP to G-HP quantification. Shows 3 male and 3 female cFE patients at FWE p<0.001 and extent threshold of 5cm3. The primary clusters remain in the same location when using G-HP group, whereas the additional clusters either disappear or become smaller. In G-HP-based quantification, the t-scores within the primary cluster are redistributed giving a higher contrast within the cluster and increased specificity.
Average no. of clusters Average volume of all
clusters (cm3) average difference in volume of all clusters (± SD) Mixed HP
Gender-matched HP
Mixed HP Gender-
matched HP
Pat
ien
ts
Male 2.8 2.7 137.0 120.0 -17.0% (±15.0%)
Female 3.1 2.8 123.8 101.2 -21.5% (± 25.3%)
Co
ntr
ols
Male 2.9 2.8 69.6 65.4 -1.3% (±25.0%)
Female 2.3 2.1 68.6 55.3 -24.8% (±30.6%)
Table 1 Cluster volume differences between mixed HP group and G-HP group.
4. Discussion
It is common understanding that the control population for statistical analysis in
neuroimaging should resemble the tested population in all aspects, except for what is being
tested, in this case the diagnosis of cryptogenic focal epilepsy (cFE). Here, we showed that
careful selection of the control population might not fundamentally change the results, but
it might reduce the amount of noise and additional clusters.

Chapter 5. Gender and Controls 106
How many healthy participants are needed for such a statistical analysis? We
evaluated the effects of increasing number of HP and there were two main effects. First, the
number of additional and false-positive clusters has decreased. Second, with an increase in
control population statistical significance in the form of t-score also increases. In a single-
subject study, increasing the number of controls increases the statistical significance of the
method. The highest number of HP used in this study was 60 and the plateau of the peak t-
score of the primary cluster was not yet reached, which could indicate that an even larger
HP group would still result in higher t-scores.
Healthy participants in the HP groups were randomized. By chance the distribution
of the t-scores of CTR in 30HP was close to normal, but other groups showed much higher
variability (Fig. 1). Obviously by introducing additional CTR with an unusual distribution of
Fibers. For this reason, we decided to investigate a “cleaner” HP group, where we excluded
11 healthy participants from the 60HP group with the highest individual variability of their
U-fiber density. The results showed a stronger separation between CTR and cFE groups,
which is clinically more relevant. This shows that the t-score alone is not the determining
factor of what an effective method is. The reselected HP group of 49 participants had a
more homogenous distribution and a better separation between CTR and cFE, thus showing
that the size of the group alone is not enough and does not outweigh the importance of
homogenous control population.
Similarly, using gender-matched HP group also resulted in decreased average t-score
for both CTR and cFE and it also improved the separation of CTR from cFE patients and
reduced the total cluster volume in the form of additional clusters. We have shown that
absolute t-scores are not comparable and other factors are equally, if not more, important,

Chapter 5. Gender and Controls 107
such as cluster size, cluster weight, distribution of the t-scores within a cluster, number of
clusters per subject, etc.
While visually inspecting the results of the quantification for each subject, we
noticed certain clusters of minor significance that appeared in the same region in patients
of the same gender, e.g. a cluster in right posterior temporal lobe was often seen in male
patients, when compared to the mixed HP and often this was no longer present when using
the gender-matched control population. To counteract the possibly-artefactual and
potentially-confusing clusters, we decided to investigate the effects of gender-matched HP
group. We performed a two sample t-test comparing healthy male and female brains and
found increases in ufTDI in regions previously reported, e.g. females showed increased
volume in the cingulate cortex (Chen et al., 2007).
We found that in gender-matched ufTDI quantification, there is an overall decrease
in cluster volume, primarily of the additional clusters, in patients by 17-21.5%. Introducing
gender-matched HP groups “cleaned” up the results, making it easier for clinicians to
interpret results, even though this did not fundamentally alter the results or did not
increase the statistical value. Additionally, the distribution of the t-scores, as seen in the
glass brain, shows a greater contrast, thus making it clearer to determine where the peak
isolated within a large primary cluster.
An optimal composition of the control population is particularly important for
single-subject studies like this. Careful selection of control population allows for improved
results, while the fundamental, primary cluster remains at the same location. In patients, it
can reduce the volume of additional or false-positive clusters in the range of 17-21.5% and
improve the specificity of the method.

Chapter 5. Gender and Controls 108
5. Acknowledgements
This study was supported by the Friedrich-Baur-Stiftung and the Herta-Riehr Stiftung.

Chapter 5. Gender and Controls 109
6. References
Brun, C.C., Leporé, N., Luders, E., Chou, Y.-Y., Madsen, S.K., Toga, A.W., Thompson, P.M., 2009.
Sex differences in brain structure in auditory and cingulate regions. Neuroreport 20,
930–5. doi:10.1097/WNR.0b013e32832c5e65
Button, K.S., Ioannidis, J.P.A., Mokrysz, C., Nosek, B.A., Flint, J., Robinson, E.S.J., Munafò, M.R.,
2013. Power failure: why small sample size undermines the reliability of neuroscience.
Nat. Rev. Neurosci. 14, 365–76.
Chen, X., Sachdev, P.S., Wen, W., Anstey, K.J., 2007. Sex differences in regional gray matter in
healthy individuals aged 44-48 years: a voxel-based morphometric study. Neuroimage
36, 691–9. doi:10.1016/j.neuroimage.2007.03.063
Greene, D.J., Black, K.J., Schlaggar, B.L., 2016. Considerations for MRI study design and
implementation in pediatric and clinical populations. Dev. Cogn. Neurosci. 18, 101–
112. doi:10.1016/j.dcn.2015.12.005.CONSIDERATIONS
Grimes, D. a., Schulz, K.F., 2005. Compared to what? Finding controls for case-control
studies. Lancet 365, 1429–1433. doi:10.1016/S0140-6736(05)66379-9
Henson, R., 2006. Comparing a single patient versus a group of controls (and SPM) 1–5.
Rosenow, F., Lüders, H., 2001. Presurgical evaluation of epilepsy. Brain 124, 1683–700.
doi:10.4103/1817-1745.40593
Sacher, J., Neumann, J., Okon-Singer, H., Gotowiec, S., Villringer, A., 2013. Sexual dimorphism
in the human brain: Evidence from neuroimaging. Magn. Reson. Imaging 31, 366–375.
doi:10.1016/j.mri.2012.06.007
Schulz, K.F., Grimes, D. a., 2002. Case-control studies: research in reverse. Lancet 359, 431–
434. doi:10.1016/S0140-6736(02)07605-5

Chapter 6. General Discussion 110
CHAPTER 6. GENERAL DISCUSSION
6.1. OVERVIEW
Patients with pharmacoresistant focal epilepsy may benefit from resective surgery,
in which the epileptogenic zone (EZ) is removed. Typically, patients undergo a series of
neurological tests, including scalp EEG, MRI and in some cases ictal SPECT or PET studies
and invasive EEG recordings. In cryptogenic focal epilepsy (cFE) conventional MRI does not
show any structural lesion and the localization of the EZ is often more challenging.
Imprecise localization of the EZ in these patients can result in poorer surgical outcome. For
this reason, there have been a number of studies investigating alternative MRI approaches
that would improve the localization of the EZ, starting with voxel based morphometry using
T1 (Huppertz et al., 2005) or T2 FLAIR images (Focke et al., 2009) to FA and MD quantitative
analyses (Eriksson et al., 2001; Rugg-Gunn et al., 2001; Thivard et al., 2011).
In focal epilepsy, one of the most commonly occurring pathologies is focal cortical
dysplasia (FCD), whose histopathological characteristics include blurring of the grey and
white matter border and cytoarchitectural alterations (Blümcke et al., 2011). For that
reason, I focused on the role of short association fibers, called U-fibers. They are located
directly at the border between grey and white matter and might be affected by FCD.
The clinical features of cFE are hugely variable between different patients, thus
preventing conventional group comparisons. Instead, each patient needs to be analyzed
individually. The new diagnostic method for cryptogenic focal epilepsy introduced and
discussed throughout this thesis, uses a tractography mapping approach of track density
images (TDI) (Calamante et al., 2010). A density image of U-fibers can be calculated by
selecting U-fibers from whole brain streamline tracking data of an individual, thus creating

Chapter 6. General Discussion 111
a U-fiber track density image (ufTDI), for every participant. The ufTDI were used to
calculate difference images between individual patients with cFE and a group of healthy
participants. These difference images were then used in one-sample t-test. This statistical
analysis approach, proposed by Henson increases the sensitivity and allows a single-subject
statistical tests (Henson, 2006).
DTI-based research commonly uses either FA or MD maps, therefore the first step
was to compare the effectiveness of ufTDI quantification against the conventionally used
DTI-based measures FA and MD in a sample of cFE patients (n=10) with a clear clinical
localization of the EZ (see Chapter 2. From FA to U-). The ufTDI quantification successfully
localized the EZ in 8 out of 10 patients, whereas the FA quantification correctly localized EZ
in only 2 out of 10 patients and MD in only one patient, which is similar to the low yield in
previously reported studies for both FA and MD (Rugg-Gunn et al., 2001; Thivard et al.,
2011). The alterations in ufTDI showed circumscribed and confined changes, whereas FA
and MD maps were often unspecific and widespread. This indicated that our ufTDI
approach is more sensitive and specific than the conventional DTI measures. The additional
step of performing streamline tracking and selecting U-fibers suggests that there might be
specific microstructural alterations at the grey-white matter border, which interfere with
the simple tracking algorithm.
Quantifying ufTDI proved to perform better than FA or MD and in a more extensive
analysis, which included 22 patients, the reductions in ufTDI were more closely analyzed
and compared to the clinical data (see Chapter 3. On The Clinical Side). Each patient with
cFE showed different extent, severity and pathology of the disorder and this diversity is
reflected in the observed clusters of reduced U-fiber track density. Results showed a wide
range of clusters ranging from a single, small and circumscribed cluster to multiple or

Chapter 6. General Discussion 112
larger clusters extending to both hemispheres. One or more cluster was detected in 95% of
all patients and 75% of all clusters correlated with the clinical data, such as EEG recording,
PET and/or ictal SPECT. This sensitivity and specificity is higher than any other reported
neuroimaging method in cryptogenic focal epilepsy (Thivard et al., 2011). The remaining
clusters could mean a number of things as mentioned in Chapter 3. However, most likely
some of the false-positive clusters are unrelated to epilepsy and reflect individual
anatomical variations.
The false-positive clusters could be due to e.g. individual subject variability or
inadequately selected parameters in the pre-processing pipeline. Therefore, the next step
involved the optimization of the ufTDI quantification pipeline to further enhance the
specificity of the method and to reduce the amount epilepsy-unrelated clusters (see Chapter
4. Effects of Pre-processing). I evaluated different steps within the pipeline starting with the
parameters for spatial normalization to tracking algorithms and using a U-fiber-specific
mask. Here, the clusters were described in more detail, i.e. number of clusters per patient,
the t-score of each cluster and the cluster weight. Based on the additional information, I was
able to suggest a ranking of clusters: primary, secondary and tertiary to reflect the
significance of the cluster in relation to the clinical data. The primary cluster represents the
highest cluster weight and was further verified by correlation to the clinical data.
In neuroimaging, one of the most important pre-processing step is spatial
normalization. It allows for the comparison between subjects by aligning each brain to a
common space, e.g. MNI-space. There is a variety of software options and algorithms that
are able to perform this spatial normalization. We have compared two commonly used
software packages: SPM and ANTs, where I analyzed the default (SPMd) and optimized
(SPMo) parameter settings in SPM and optimized settings in ANTs. The results showed that

Chapter 6. General Discussion 113
both SPMo and ANTs performed better than SPMd with a higher specificity and fewer false-
positive findings. However, the type of normalization did not fundamentally influence the
outcome of the quantification, i.e. the primary cluster remained present and at the same
location in all three spatial normalization procedures further supporting the initial
hypothesis that regional U-fibers are affected in cFE patients.
A U-fiber-specific mask was created, where an averaged and binarised density map
of U-fibers was generated. Conventionally, a whole brain mask in MNI space is used for
analyses in SPM. However, when using the whole brain mask, clusters of reduced “U-fibers”
were observed in areas where U-fibers are not expected to be present. Therefore, a U-fiber-
specific mask allows for a focused analysis restricted to the regions of the brain that we are
interested in. Using this mask resulted in fewer secondary and tertiary false-positive
clusters by 31.6%, whilst leaving the primary cluster at the same location with the same
statistical significance in all patients.
During a pilot study, the number of healthy participants was only 18, but even then
the ufTDI quantification already showed promising results. The next study included 30
healthy participants, which resulted in fewer additional clusters. This confirmed that the
role of the control group has a greater impact on the statistical analysis. Therefore, Chapter
5 explores the effects of control population on the results of the ufTDI quantification. In that
study, I investigated two main aspects: 1) the effects of the size of the healthy population
and 2) gender-matching of the population (see Chapter 5. Gender and Controls).
Increasing the size of the healthy population strengthens the statistics, improves the
sensitivity of the method and reduces the number of false-positive clusters. The biggest
healthy population group that was analyzed in Chapter 5 included 60 healthy participants
and the average t-score of the primary clusters among cFE patients was the highest.

Chapter 6. General Discussion 114
However, a remaining question was, which is more important: quantity or quality of the
healthy population? To answer that question, I re-selected healthy participants from the
pool of all controls available (n=60) based on the variability within group, thus excluding 11
participants as mild outliers. The comparison of the ufTDI quantification of the cFE patients
based on “cleaner” group and “larger” group revealed fewer false-positive clusters and
more focused redistribution of the t-scores within the primary cluster in cFE patients when
using “cleaner” healthy population. More importantly, the “cleaner” group showed
strengthened separation between healthy controls and cFE patients, which is clinically
more meaningful. Thus, in this case “quality” seems to be more effective than “quantity”.
As mentioned earlier, some of the false-positive clusters are possibly caused by
individual variability and this might include gender differences as well. Gender differences
have been extensively investigated over the last decade (Sacher et al., 2013) and studies
have found many functional and structural dissimilarities. Chapter 5 explains in more detail
that using a gender-matched healthy population further reduces the number of false-
positive clusters by 17-21.5% without changing the location of the primary cluster, thus
improving the specificity of the method.
In summary, quantifying ufTDI in cFE patients proves to be a sensitive, specific and
robust method that localizes the EZ reliably in the majority of cases. Improving and
optimizing individual steps within the pre-processing and processing pipeline shows to
have small effects, but when combined they have considerably reduced false-positive
clusters, increased the t-score of the primary cluster and strengthened the separation
between healthy population and cFE patients. Thus, improving sensitivity and specificity to
a level not achieved by any other diagnostic method to localize the EZ.

Chapter 6. General Discussion 115
6.2. CLINICAL APPLICATION
The ufTDI quantification for localization of the epileptogenic zone in cFE is still an
experimental method, nonetheless we are already implementing it routinely in the Epilepsy
Centre at the University of Munich Hospital. Currently, we quantify ufTDI in all incoming
patients with cryptogenic focal epilepsy before the implantation of the intracranial
electrodes. This allows the neurologists to include this information in the planning of the
electrode placement. In some cases, the ufTDI quantification showed reductions in regions
that were not clinically suspected prior to invasive EEG recordings and often the
intracranial electrodes later confirmed that these regions were also involved in seizure
generation.
So far I performed the quantification using optimized spatial normalization, U-fiber
specific mask and gender-matched control group on 67 patients of which 18 had
implantation of electrodes and 10 had resective surgery. Many other patients are currently
awaiting implantation of electrodes or resections.
Few patients showed widespread bilateral reductions of U-fiber density (see Fig. 5,
Chapter 3) and bilateral seizure onset was then confirmed using intracranial electrodes.
These patients are not candidates for resective surgery and ufTDI quantification could
potentially be used as an exclusion test in the future. This may prevent unnecessary risks of
surgery and invasive EEG recordings.

Summary Points 116
SUMMARY POINTS
• U-fiber Track Density Images (ufTDI) reflect the number of U-fibers per voxel in an
individual brain
• ufTDI reflect different microstructural tissue properties than conventional FA or MD
maps
• ufTDI quantification can localize mild architectural changes in cryptogenic epilepsy
with higher specificity and sensitivity than FA or MD
• FA and MD quantification shows widespread and unspecific alterations
• 95% of the patients with no structural lesion in conventional 3T MRI showed
reductions in ufTDI
• 75% of all clusters observed in cFE patients correlated with clinical data
• Optimized settings of spatial normalization improve the statistical significance of the
ufTDI quantification
• A U-fiber-specific mask reduces the volume of false-positive clusters by 31.6%.
• Both, increasing the size and removing outliers from the healthy population
improves the statistical significance of the ufTDI quantification and strengthens the
separation of healthy controls and cFE patients
• Using a gender-specific control population reduces the volume of false-positive
clusters by 17-21.5%
• Quantification of ufTDI is already routinely used for guidance of electrode
implantation in the Epilepsy Centre at the University of Munich Hospital

References 117
REFERENCES
Anderson, A.W., Ding, Z., 2002. Sub-voxel measurement of fiber orientation using high
angular resolution diffusion tensor imaging. Tenth Annu. Meet. Int. Soc. Magn. Reson.
Med. Berkeley, CA ISMRM 10, 440.
Basser, P.J., Mattiello, J., LeBihan, D., 1994. MR diffusion tensor spectroscopy and imaging.
Biophys. J. 66, 259–67. doi:10.1016/S0006-3495(94)80775-1
Basser, P.J., Mattiello, J., LeBihan, D., 1994. Estimation of the effective self-diffusion tensor
from the NMR spin echo. J. Magn. Reson. B 103, 247–254. doi:10.1006/jmrb.1994.1037
Behrens, T.E.J., Sotiropoulos, S.N., Jbabdi, S., 2009. MR Diffusion Tractography, in: Diffusion
MRI: From Quantitative Measurement to In Vivo Neuroanatomy: First Edition. Elsevier
Inc., pp. 333–351. doi:10.1016/B978-0-12-396460-1.00019-6
Behrens, T.E.J., Woolrich, M.W., Jenkinson, M., Johansen-Berg, H., Nunes, R.G., Clare, S.,
Matthews, P.M., Brady, J.M., Smith, S.M., 2003. Characterization and Propagation of
Uncertainty in Diffusion-Weighted MR Imaging. Magn. Reson. Med. 50, 1077–1088.
doi:10.1002/mrm.10609
Besson, P., Andermann, F., Dubeau, F., Bernasconi, A., 2008. Small focal cortical dysplasia
lesions are located at the bottom of a deep sulcus. Brain 131, 3246–3255.
doi:10.1093/brain/awn224
Blümcke, I., Thom, M., Aronica, E., Armstrong, D.D., Vinters, H. V, Palmini, A., Jacques, T.S.,
Avanzini, G., Barkovich, a J., Battaglia, G., Becker, A., Cepeda, C., Cendes, F., Colombo, N.,
Crino, P., Cross, J.H., Delalande, O., Dubeau, F., Duncan, J., Guerrini, R., Kahane, P.,
References 118
Mathern, G., Najm, I., Ozkara, C., Raybaud, C., Represa, A., Roper, S.N., Salamon, N.,
Schulze-Bonhage, A., Tassi, L., Vezzani, A., Spreafico, R., 2011. The clinicopathologic
spectrum of focal cortical dysplasias: a consensus classification proposed by an ad hoc
Task Force of the ILAE Diagnostic Methods Commission. Epilepsia 52, 158–74.
doi:10.1111/j.1528-1167.2010.02777.x
Calamante, F., Tournier, J.-D., Jackson, G.D., Connelly, A., 2010. Track-density imaging (TDI):
super-resolution white matter imaging using whole-brain track-density mapping.
Neuroimage 53, 1233–43. doi:10.1016/j.neuroimage.2010.07.024
Chamberlain, W.A., Cohen, M.L., Gyure, K.A., Kleinschmidt-DeMasters, B.K., Perry, A., Powell,
S.Z., Qian, J., Staugaitis, S.M., Prayson, R.A., 2009. Interobserver and intraobserver
reproducibility in focal cortical dysplasia (malformations of cortical development).
Epilepsia 50, 2593–2598. doi:10.1111/j.1528-1167.2009.02344.x
Dumas de la Roque, A., Oppenheim, C., Chassoux, F., Rodrigo, S., Beuvon, F., Daumas-Duport,
C., Devaux, B., Meder, J.-F., 2005. Diffusion tensor imaging of partial intractable
epilepsy. Eur. Radiol. 15, 279–85. doi:10.1007/s00330-004-2578-8
Eriksson, S.H., Rugg-Gunn, F.J., Symms, M.R., Barker, G.J., Duncan, J.S., 2001. Diffusion tensor
imaging in patients with epilepsy and malformations of cortical development. Brain
124, 617–626. doi:10.1093/brain/124.3.617
Focke, N.K., Bonelli, S.B., Yogarajah, M., Scott, C., Symms, M.R., Duncan, J.S., 2009. Automated
normalized FLAIR imaging in MRI-negative patients with refractory focal epilepsy.
Epilepsia 50, 1484–1490. doi:10.1111/j.1528-1167.2009.02022.x

References 119
Henson, R., 2006. Comparing a single patient versus a group of controls (and SPM) 1–5.
Huppertz, H.-J., Grimm, C., Fauser, S., Kassubek, J., Mader, I., Hochmuth, A., Spreer, J.,
Schulze-Bonhage, A., 2005. Enhanced visualization of blurred grey–white matter
junctions in focal cortical dysplasia by voxel-based 3D MRI analysis. Epilepsy Res. 67,
35–50. doi:10.1016/j.eplepsyres.2005.07.009
Le Bihan, D., 2014. Diffusion MRI: What water tells us about the brain. EMBO Mol. Med. 6,
569–573. doi:10.1002/emmm.201404055
Lerner, J.T., Salamon, N., Hauptman, J.S., Velasco, T.R., Hemb, M., Wu, J.Y., Sankar, R., Donald
Shields, W., Engel, J., Fried, I., Cepeda, C., Andre, V.M., Levine, M.S., Miyata, H., Yong,
W.H., Vinters, H. V., Mathern, G.W., 2009. Assessment and surgical outcomes for mild
type i and severe type II cortical dysplasia: A critical review and the UCLA experience.
Epilepsia 50, 1310–1335. doi:10.1111/j.1528-1167.2008.01998.x
Lüders, H., 2008. Textbook of Epilepsy Surgery. Informa Healthcare.
doi:10.1017/CBO9781107415324.004
Lüders, H.O., Acharya, J., Baumgartner, C., Benbadis, S.R., Bleasel, A., Burgess, R., Dinner, D.S.,
Ebner, A., Foldvary, N., Geller, E.B., Hamer, H., Holthausen, H., Kotagal, P., Morris, H.,
Meencke, H.J., Noachtar, S., Rosenow, F., Sakamoto, A., Steinhoff, B.J., Tuxhorn, I., Wyllie,
E., 1999. A new epileptic seizure classification based exclusively on ictal semiology.
Acta Neurol. Scand. 99, 137–141.
McIntosh, A.M., Averill, C.A., Kalnins, R.M., Mitchell, L.A., Fabinyi, G.C.A., Jackson, G.D.,
Berkovic, S.F., 2012. Long-term seizure outcome and risk factors for recurrence after

References 120
extratemporal epilepsy surgery. Epilepsia 53, 970–978. doi:10.1111/j.1528-
1167.2012.03430.x
O’Brien, T.J., So, E.L., Mullan, B.P., Hauser, M.F., Brinkmann, B.H., Bohnen, N.I., Hanson, D.,
Cascino, G.D., Jack, C.R., Sharbrough, F.W., 1998. Subtraction ictal SPECT co-registered
to MRI improves clinical usefulness of SPECT in localizing the surgical seizure focus.
Neurology 50, 445–54.
Ramey, W.L., Martirosyan, N.L., Lieu, C.M., Hasham, H.A., Lemole, G.M., Weinand, M.E., 2013.
Current management and surgical outcomes of medically intractable epilepsy. Clin.
Neurol. Neurosurg. 115, 2411–2418. doi:10.1016/j.clineuro.2013.09.035
Rosenow, F., Lüders, H., 2001. Presurgical evaluation of epilepsy. Brain 124, 1683–700.
doi:10.4103/1817-1745.40593
Rugg-Gunn, F.J., Eriksson, S.H., Symms, M.R., Barker, G.J., Duncan, J.S., 2001. Diffusion tensor
imaging of cryptogenic and acquired partial epilepsies. Brain 124, 627–636.
doi:10.1093/brain/124.3.627
Sacher, J., Neumann, J., Okon-Singer, H., Gotowiec, S., Villringer, A., 2013. Sexual dimorphism
in the human brain: Evidence from neuroimaging. Magn. Reson. Imaging 31, 366–375.
doi:10.1016/j.mri.2012.06.007
Stejskal, E.O., Tanner, J.E., 1965. Spin diffusion measurements: spin echoes in the presence
of a time-dependant field gradient. J. Chem. Phys. 42, 288–292. doi:10.1063/1.1695690
Thivard, L., Adam, C., Hasboun, D., Clemenceau, S., Dezamis, E., Lehericy, S., Dormont, D.,
Chiras, J., Baulac, M., Dupont, S., 2006. Interictal diffusion MRI in partial epilepsies
References 121
explored with intracerebral electrodes. Brain 129, 375–385.
doi:10.1093/brain/awh709
Thivard, L., Bouilleret, V., Chassoux, F., Adam, C., Dormont, D., Baulac, M., Semah, F., Dupont,
S., 2011. Diffusion tensor imaging can localize the epileptogenic zone in nonlesional
extra-temporal refractory epilepsies when [(18)F]FDG-PET is not contributive.
Epilepsy Res. 97, 170–82. doi:10.1016/j.eplepsyres.2011.08.005
Thom, M., 2011. Neuropathology of epilepsy., in: Epilepsy 2011 From Science to Society, A
Practical Guide to Epilepsy. International League Against Epilepsy (UK Chapter) and
Epilepsy Society, pp. 39–67. doi:10.1097/00005072-199903000-00015
Tuch, D.S., 2004. Q-ball imaging. Magn. Reson. Med. 52, 1358–1372.
doi:10.1002/mrm.20279
Tuch, D.S., Reese, T.G., Wiegell, M.R., Makris, N., Belliveau, J.W., Van Wedeen, J., 2002. High
angular resolution diffusion imaging reveals intravoxel white matter fiber
heterogeneity. Magn. Reson. Med. 48, 577–582. doi:10.1002/mrm.10268
Tufenkjian, K., Lüders, H.O., 2012. Seizure semiology: Its value and limitations in localizing
the epileptogenic zone. J. Clin. Neurol. 8, 243–250. doi:10.3988/jcn.2012.8.4.243
Van Paesschen, W., 2004. Ictal SPECT. Epilepsia 45 Suppl 4, 35–40. doi:10.1111/j.0013-
9580.2004.04008.x
Vollmar, C., Diehl, B., 2011. Diffusion tensor tractography in extratemporal lobe epilepsy, in:
Extratemporal Lobe Epilepsy Surgery. pp. 197–205.
Winston, G.P., 2015. The potential role of novel diffusion imaging techniques in the

References 122
understanding and treatment of epilepsy. Quant. Imaging Med. Surg. 5, 279–287.
doi:10.3978/j.issn.2223-4292.2015.02.03
Zhang, J., Liu, W., Chen, H., Xia, H., Zhou, Z., Mei, S., Liu, Q., Li, Y., 2014. Multimodal
neuroimaging in presurgical evaluation of drug-resistant epilepsy. NeuroImage Clin. 4,
35–44. doi:10.1016/j.nicl.2013.10.017

Acknowledgments 123
ACKNOWLEDGMENTS
First and foremost, I would like to thank my supervisor Dr. Christian Vollmar for his never-
ending support, patience and guidance throughout my PhD. Thank you for our many
scientific (and not only) discussions, your help and for all that you have taught me and most
of all for inspiring and motivating me during this process.
Furthermore, I am grateful to Prof Soheyl Noachtar who encouraged and supported me
every step of the way. I am very grateful to be part of the Epilepsy Group who are
wonderful. I have been very lucky to have met some of my closest friends there. I am very
thankful to Dr. Elisabeth Hartl and Katharina Ernst for being there for me.
I would also like to thank Prof Stefan Glasauer and Dr. Afra Wohlschläger for their helpful
discussions and guidance during TAC meetings. I was most fortunate to have such a great
committee! I would not be able to find this great project if it wasn’t for Graduate School of Systemic
Neurosciences (GSN) and for this I will be forever grateful. GSN has been incredibly
supportive, especially during the difficult moments.
I would like to express my sincere gratitude to my family who have been so incredibly
encouraging and always showed interest in my project.
Last but definitely not least, my special thanks go to my fiancé Jan Bartkiewicz for
everything that he has done to show his support, understanding and love. He consoled me
and listened to me every time I needed him. So thank you!
Thank you all that have been involved in this wonderful process. I honestly cannot imagine
a more enjoyable and exciting PhD project!

Curriculum Vitae 124
CURRICULUM VITAE
Education
Research Experience
Oct. 2013 – Current Researcher for doctoral degree (PhD)
Epilepsy Centre at University Hospital Munich
LMU Munich, Germany
Supervisor: Dr. Christian Vollmar
Dissertation title: “Establishing a novel diagnostic method to
localize the epileptogenic zone in cryptogenic focal epilepsy”
Oct. 2012 – Oct. 2013 Researcher
Institute of Pharmacology, Toxicology and Pharmacy
LMU Munich, Germany
Supervisor: Prof. Heidrun Potschka
Dec. 2011 – June 2012 Researcher for MSc degree
Dept. of Neuropathology, UCL Institute of Neurology
Supervisor: Prof. Sanjay Sisodiya and Prof. Maria Thom
Dissertation title: “Study of cellular reactions around electrode
tracks in patients with drug-resistant focal epilepsy”
Summer 2010 Research Intern
Dept. of Craniofacial Development and Stem Cell Biology
King’s College London, UK
Supervisor: Dr. Albert Basson
Oct. 2012 – Current PhD candidate in Clinical Neuroscience at Graduate School
of Systemic Neurosciences Ludwig-Maximillians-University
Munich, Germany
Sept. 2011 – Jul. 2012 MSc in Clinical Neuroscience at University College London,
UK
Sept. 2008 – Jul. 2011 BSc in Biomedical Science at King’s College London, UK

Curriculum Vitae 125
Honors
GSN Scholarship Allowance (Sept. 2013 – Feb. 2014)
1st Place Poster Award at 114th Meeting of the British Neuropathology
Society, London, UK (March 2013)
Poster Presentations
• Goc, J., Hartl, E., Noachtar, S., Vollmar, C. (2016). DTI Analysis of U-fiber density
images localizes the epileptogenic zone better than FA or MD. 22nd Annual Meeting of
the Organization for Human Brain Mapping, Genève, Switzerland
• Goc, J., Hartl, E., Noachtar, S., Vollmar, C. (2016). U-fiber density imaging identifies
specific microstructural alteration in the epileptogenic zone in individual patients
with cryptogenic focal epilepsy. 60th Scientific Annual Meeting of the German Society
for Clinical Neurophysiology and Functional Imaging, Düsseldorf, Germany
• Ernst, K., Hartl, E., Goc, J., Noachtar, S., Vollmar, C. (2016). Increased coherence to the
midline in interictal EEG predicts generalized seizures in focal epilepsy. 60th
Scientific Annual Meeting of the German Society for Clinical Neurophysiology and
Functional Imaging, Düsseldorf, Germany
• Goc, J., Khalilieh, N., Hartl, E., Noachtar, S., Vollmar, C. (2015). The effects of
preprocessing on statistical DTI fiber quantification in cryptogenic focal epilepsy.
21st Annual Meeting of the Organization for Human Brain Mapping, Honolulu, Hawaii
• Goc, J., Noachtar, S., Vollmar, C. (2014). Case Report: Diffusion Tensor Imaging and
Tractography identify structural changes in 14 year old male with cryptogenic focal
epilepsy (2014). 88 Kongress der Deutschen Gesellschaft für Neurologie: Neurowoche,
Munich, Germany
• Goc, J., Liu, J., Sisodiya, S., Thom, M. (2013). A study of gliogenesis in the vicinity of
depth electrode tracts. 114th Meeting of the British Neuropathology Society, London,
UK

List of Publications 126
LIST OF PUBLICATIONS
Hartl, E., Rémi, J., Vollmar, C., Goc, J., Loesch, A.M., Rominger, A., Noachtar, S., 2016. PET
imaging in extratemporal epilepsy requires consideration of electroclinical findings.
Epilepsy Res. 125, 72–76.
Russmann, V., Goc, J., Boes, K., Ongerth, T., Salvamoser, J.D., Siegl, C., Potschka, H., 2016.
Minocycline fails to exert antiepileptogenic effects in a rat status epilepticus model.
Eur. J. Pharmacol. 771, 29–39. doi:10.1016/j.ejphar.2015.12.002
Walker, A., Russmann, V., Deeg, C.A., von Toerne, C., Kleinwort, K.J.H., Szober, C., Rettenbeck,
M.L., von Rüden, E.-L., Goc, J., Ongerth, T., Boes, K., Salvamoser, J.D., Vezzani, A., Hauck,
S.M., Potschka, H., 2016. Proteomic profiling of epileptogenesis in a rat model: Focus on
inflammation. Brain. Behav. Immun. 53, 138–158. doi:10.1016/j.bbi.2015.12.007
Goc, J., Liu, J.Y.W., Sisodiya, S.M., Thom, M., 2014. A spatiotemporal study of gliosis in
relation to depth electrode tracks in drug-resistant epilepsy. Eur. J. Neurosci. 39,
2151–2162. doi:10.1111/ejn.12548
Thom, M., Kensche, M., Maynard, J., Liu, J., Reeves, C., Goc, J., Marsdon, D., Fluegel, D., Foong,
J., 2014. Interictal psychosis following temporal lobe surgery: dentate gyrus pathology.
Psychol. Med. 44, 3037–3049. doi:10.1017/S0033291714000452
Shepherd, C., Liu, J., Goc, J., Martinian, L., Jacques, T.S., Sisodiya, S.M., Thom, M., 2013. A
quantitative study of white matter hypomyelination and oligodendroglial maturation
in focal cortical dysplasia type II. Epilepsia 1–11. doi:10.1111/epi.12143

Affidavit 127
AFFIDAVIT
Hiermit versichere ich an Eides statt, dass ich die vorliegende Dissertation “Establishing a
novel diagnostic method to localize the epileptogenic zone in cryptogenic focal
epilepsy” selbstständig angefertigt habe, mich außer der angegebenen keiner weiteren
Hilfsmittel bedient und alle Erkenntnisse, die aus dem Schrifttum ganz oder annähernd
übernommen sind, als solche kenntlich gemacht und nach ihrer Herkunft unter
Bezeichnung der Fundstelle einzeln nachgewiesen habe.
I hereby confirm that the dissertation “Establishing a novel diagnostic method to
localize the epileptogenic zone in cryptogenic focal epilepsy” is the result of my own
work and that I have only used sources or materials listed and specified in the dissertation.
Datum/Date: Unterschrift/signature
München, 4th November 2016 Joanna Irena Goc
Declaration of Author Contributions 128
DECLARATION OF AUTHOR CONTRIBUTIONS
Chapter 2. Performance of different DTI-based measures to localize the epileptogenic zone in
cryptogenic focal epilepsy was done under the supervision of Dr. Christian Vollmar (CV).
Joanna Goc (JG) and CV designed the research. JG, CV and Dr. Elisabeth Hartl (EH) recruited
and scanned participants. JG designed the method and carried out the research and analysis
and together with CV discussed the results. JG wrote the article.
Chapter 3. Looking at the Dark Side of Diffusion Tensor Imaging Data – U-Fiber Track Density
Imaging Identifies Specific Structural Changes in Non-lesional Focal Epilepsy, where the
author of this doctoral thesis, Joanna Goc (JG), contributed to the study by scanning the
patients and controls with Dr. Christian Vollmar (CV). JG also contributed by carrying out
the research and analysis and together with CV discussed the results. CV wrote the article.
Chapter 4. The effects of pre-processing pipeline steps on statistical DTI tract quantification in
cryptogenic focal epilepsy was done under the supervision of Dr. Christian Vollmar (CV). CV
developed the initial hypothesis and together with Joanna Goc (JG) designed the research.
JG, CV and Dr. Elisabeth Hartl (EH) recruited and scanned participants. JG developed the
method and Nadia Khalilieh (NK) optimized spatial normalization procedures that JG later
used in the study. JG carried out the research and analysis and together with CV discussed
the results. JG wrote the article.
Chapter 5. Careful control selection improves the quantification of fiber density images in
cryptogenic focal epilepsy was done under the supervision of Dr. Christian Vollmar (CV).
Joanna Goc (JG) developed the initial hypothesis and designed the research. JG and Dr.

Declaration of Author Contributions 129
Elisabeth Hartl (EH) recruited and scanned additional healthy controls. JG adjusted the
previously mentioned method in Chapters 3 and 4. JG carried out the research and analysis
and together with CV discussed the results. JG wrote the article.
Munich, 4th November 2016
Joanna Goc Dr. Christian Vollmar