essentials for professional use - roadroid.com user guide - essentials.pdf · essential guide for...
TRANSCRIPT

Essential guide for road professionals – June 2015
~ 1 ~
Road roughness/IRI surveys using smart phones
Essentials for professional use
June 2015 - App version 1.7-1.8
This guide gives a short introduction and briefly describes how to:
1. collect data and photos
2. upload data and photos
3. view data on internet maps
4. download aggregated files in 100 meter segments
5. make charts from segments in Excel
Please advise the full user guide for detailed descriptions!
The user guide assumes basic knowledge of Android phones, internet and MS Excel.
Roadroid is a globally awarded innovation from Sweden!
Essential guide for road professionals – June 2015
~ 2 ~
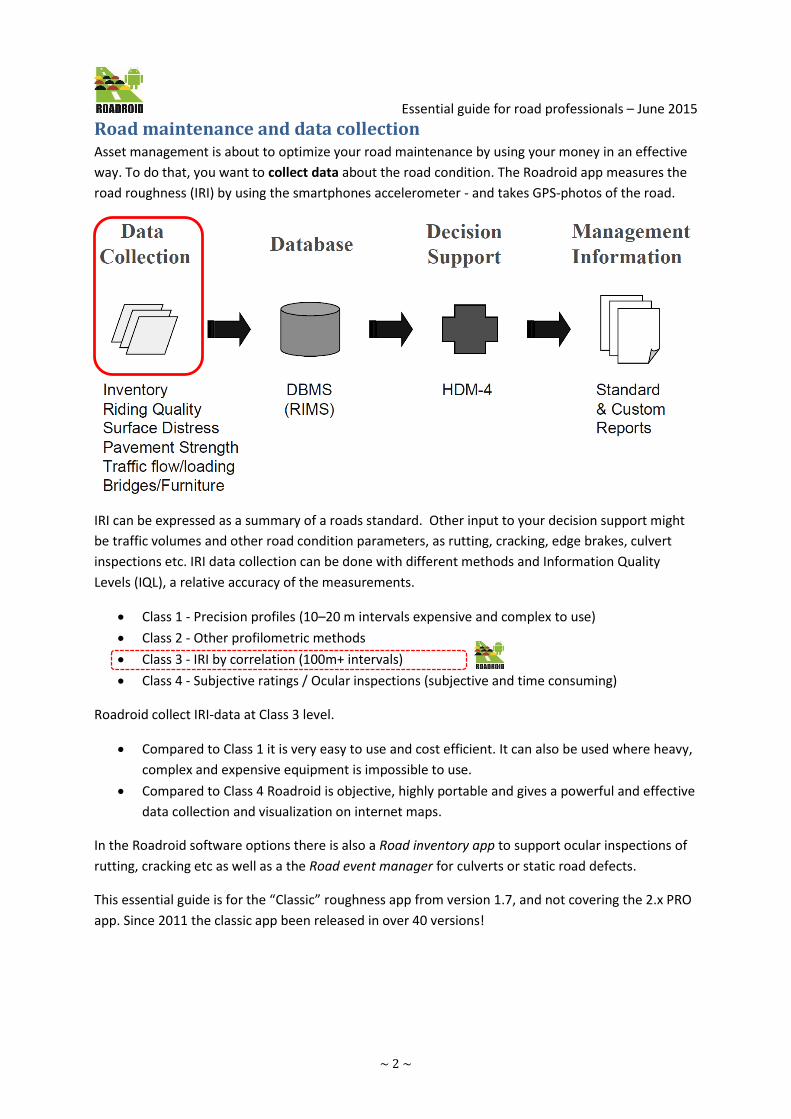
Road maintenance and data collection Asset management is about to optimize your road maintenance by using your money in an effective
way. To do that, you want to collect data about the road condition. The Roadroid app measures the
road roughness (IRI) by using the smartphones accelerometer - and takes GPS-photos of the road.
IRI can be expressed as a summary of a roads standard. Other input to your decision support might
be traffic volumes and other road condition parameters, as rutting, cracking, edge brakes, culvert
inspections etc. IRI data collection can be done with different methods and Information Quality
Levels (IQL), a relative accuracy of the measurements.
Class 1 - Precision profiles (10–20 m intervals expensive and complex to use)
Class 2 - Other profilometric methods
Class 3 - IRI by correlation (100m+ intervals)
Class 4 - Subjective ratings / Ocular inspections (subjective and time consuming)
Roadroid collect IRI-data at Class 3 level.
Compared to Class 1 it is very easy to use and cost efficient. It can also be used where heavy,
complex and expensive equipment is impossible to use.
Compared to Class 4 Roadroid is objective, highly portable and gives a powerful and effective
data collection and visualization on internet maps.
In the Roadroid software options there is also a Road inventory app to support ocular inspections of
rutting, cracking etc as well as a the Road event manager for culverts or static road defects.
This essential guide is for the “Classic” roughness app from version 1.7, and not covering the 2.x PRO
app. Since 2011 the classic app been released in over 40 versions!

Essential guide for road professionals – June 2015
~ 3 ~
1 Collect data Start with installing the app on your Android smartphone (With Android OS later than 4.4).
Make sure Roadroid have registered your units IMEI number, and that your email is filled in Settings-
>User Equipment ID, and that the unit is set on the correct phone model under “Android device” and
correct car type under vehicle type.
Mount the phone car rack in the front windshield.
Make sure the rack is stable
Fit it so it is easy to reach and tap on the display.
Mount the phone as straight as possible, horizontally is often most suitable to use the GPS-photo function.
Fit the rack so that the camera display the road Start the cam while fitting to find a good position!
Start the Roadroid application by tapping the icon (1), press "Ok" to accept settings (2). Press the
yellow “fitting” button (3).
While fitting – adjust the phone to X, Y and Z as close to = 0 as possible. The OK button will turn green when you are within the tolerances. Press the green OK-button.
Tip you can always “go back” with the back-button, often in the bottom right corner of the phone. Press “Start/stop sampling” to start collect data (button changes from grey to red). Measurement starts only if a GPS signal is available. Stand still to receive a GPS-signal (may take a minute).

Essential guide for road professionals – June 2015
~ 4 ~
Estimated IRI values are collected in speeds between 20-100 km/h.
Calculated IRI can be adjusted in settings and should be collected in a stable speed of 60-90 km/h.
Press “Start/stop sampling” to stop measurement, make a note as road section ID/name to keep
track of your files.
Make a good plan of how to collect data, press start/stop in logical intersections of the road.
Under settings you can also choose a preferred auto photo capture length/distance.
Auto photos can also be share to www.mapillary.com, by checking that box under settings. Ensure
you got a good view of the road with the camera lens!
Exit the app with menu button (up right corner) - or by “back button” (down right) twice.
2- Upload data To upload data you need to be connected to a have a stable internet connection. Always use a WiFi
to upload photos. Connect to WiFi through normal Android procedure.
If you can surf on internet with the phones internet browser – your phone is connected. If not – you
don’t have an internet connection, and will not be able to upload your data.
When you are connected: 1) Tap the Upload button (up right), 2) Choose “Upload” and then 3)
Choose Data to upload your collected roughness data and Media to upload eventual photos.
A new roughness survey file is saved each time you press Start/stop. Roughness data is saved in
maximally 300 kB files (often smaller). Media (photos) can be up to 2 MB!
When the file transfer has started it will continue until finished, stay still during this process. See the
notification in the upper left corner of the display. Click-drag the notification to view the file transfer
progress. Small files uploads in seconds. Larger files and with poor connection can take hours.
Sometimes you need to restart the upload process.
When the upload is finished a success message should occur. If there is a problem, an error message
will be seen instead. Advise the user guide to find out more about possible problems.
When the Data button is pressed:
1. files in /roadroid/classic/data folder are compressed and moved to /roadroid/classic folder.
2. the Roadroid app transfer function starts, and lastly
3. if the file transfer is successful the zipped files is moved to /roadroid/classic/backup folder.

Essential guide for road professionals – June 2015
~ 5 ~
This repeats for every file. If the transfer is incomplete the function will try again next time an upload
is started. The files will stay in the /roadoid/classic folder until they are successfully transferred. If no
transfer attempt is done: uncompressed files are located in the "Roadroid/classic/data” directory.
The files on the phone are encrypted, and will be decrypted in the web import. Make sure you have
enough space on the phone, especially using auto photos. Use a cable to the phone to eventually
make your own backup of photos etc
3 – View data by the Roadroid web service When data is successfully uploaded, it will be imported to the web service within an hour. Surf in to
www.roadroid.com and you need a user log-in and password to view details of your data. Depending
on if there is a road network layer available – colored road links will appear on the map. If there are
no colored links, you need to check the “GPS-Points” (5).
The time filter (3) is used to display and measure point data only within the set time interval. It can
be used to look at changes over time and obtaining statistics with the report functions.
Navigate (4) allow you to drag the map with the mouse. With draw polygon active, you click on the
map to draw a polygon for an area to calculate. Close polygon by double click (turns orange). Click
"Calc" to calculate and you should get the percentage of each 4 road classes Good – Poor and an
average estimated IRI.
Map Background: Google Streets is default, but it is changeable to Google Satellite.
The amount of points shown at the same time is limited (for server performance reasons).
When you zoom in to the map, eIRI – labels will occur at each dot a certain zoom level.
If photos are uploaded to the Roadroid web they will appear as clickable black camera icons.

Essential guide for road professionals – June 2015
~ 6 ~
4 – Download aggregated files Data is saved in the phone every second between 20-100 km/h - the distance between the “dots” will
vary depending on the speed. To make tables and charts for studies on a road, or to import data to
HDM-4, you need average data in fixed sections lengths. Through the “import history” you can
download the data aggregated in 100 meter sections as text files.
Left: Raw decrypted data in one row per second. Right: Aggregated data in 100 meter sections.
Essential guide for road professionals – June 2015
~ 7 ~
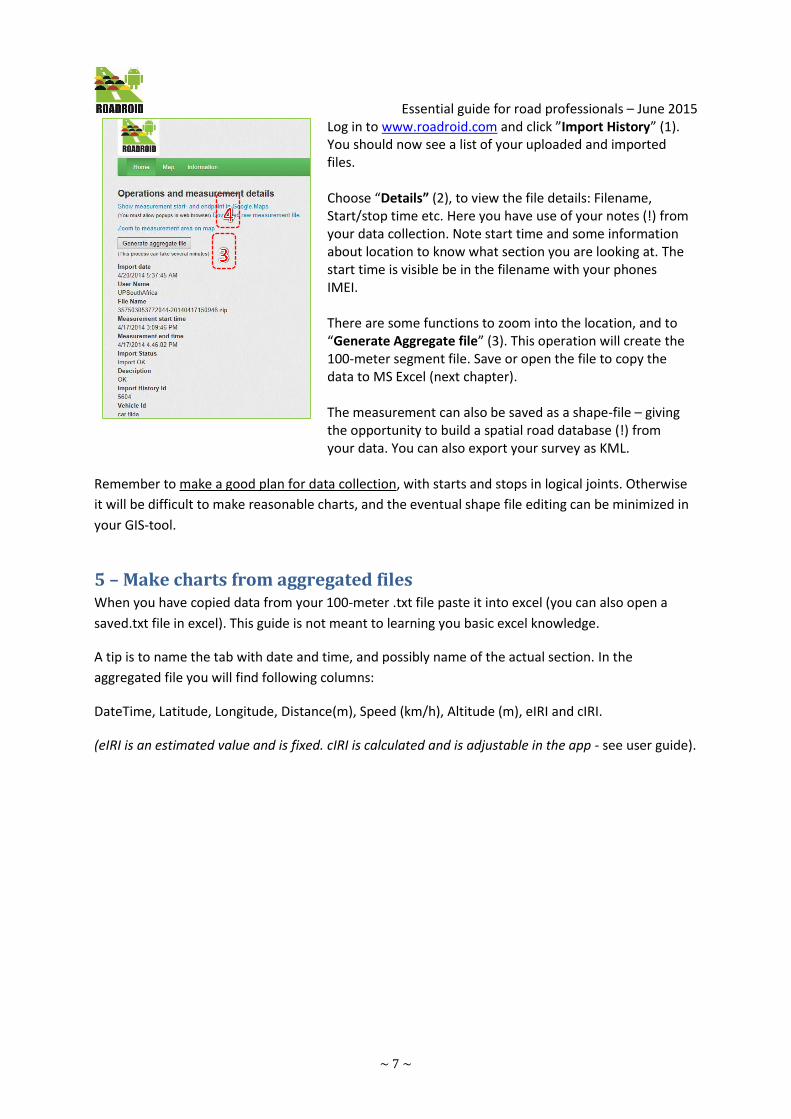
Log in to www.roadroid.com and click ”Import History” (1). You should now see a list of your uploaded and imported files. Choose “Details” (2), to view the file details: Filename, Start/stop time etc. Here you have use of your notes (!) from your data collection. Note start time and some information about location to know what section you are looking at. The start time is visible be in the filename with your phones IMEI. There are some functions to zoom into the location, and to “Generate Aggregate file” (3). This operation will create the 100-meter segment file. Save or open the file to copy the data to MS Excel (next chapter). The measurement can also be saved as a shape-file – giving the opportunity to build a spatial road database (!) from your data. You can also export your survey as KML.
Remember to make a good plan for data collection, with starts and stops in logical joints. Otherwise
it will be difficult to make reasonable charts, and the eventual shape file editing can be minimized in
your GIS-tool.
5 – Make charts from aggregated files When you have copied data from your 100-meter .txt file paste it into excel (you can also open a
saved.txt file in excel). This guide is not meant to learning you basic excel knowledge.
A tip is to name the tab with date and time, and possibly name of the actual section. In the
aggregated file you will find following columns:
DateTime, Latitude, Longitude, Distance(m), Speed (km/h), Altitude (m), eIRI and cIRI.
(eIRI is an estimated value and is fixed. cIRI is calculated and is adjustable in the app - see user guide).

Essential guide for road professionals – June 2015
~ 8 ~
When you have pasted/imported your data in excel, you can start making charts.
The data aggregation length in the web download is 100 meter, a usual import length in HDM. Speed
and vertical profile is interesting for a road engineer to get an overall view. And the data can
preferably be used with images form a GPS-video capture:

Essential guide for road professionals – June 2015
~ 9 ~
6 – Spatial data exports
Under file details you have an option to export data in spatial formats as:
- Shape files (https://en.wikipedia.org/wiki/Shapefile) or
- KML (https://en.wikipedia.org/wiki/Keyhole_Markup_Language)
The shape file is only containing the geometrical data (the .shp file of the four files in the zipped
shape directory). The KML is also containing roughness, speed and other attributes.
Please refer to your GIS-resources for working with these files and formats.
Roadroid can also offer custom exports from a whole survey period and preferred survey units.