es - energize connecticut | empowering connecticut to ... · web viewthe data show the following:...
TRANSCRIPT

DOCUMENT TITLE
Connecticut LED Lighting Study Report (R154)DRAFT
November 16, 2015
SUBMITTED TO:Connecticut EEB
SUBMITTED BY:NMR Group, Inc.
1

CONNECTICUT LED LIGHTING STUDY REPORT (R154)
Table of ContentsEXECUTIVE SUMMARY.......................................................................................................................I
SOCKET SATURATION TRENDS.......................................................................................................I
PENETRATION, FAMILIARITY, AND SATISFACTION...........................................................................III
RECENT PURCHASES..................................................................................................................IV
STORAGE BEHAVIOR....................................................................................................................V
EISA COVERAGE, EXEMPTIONS, AND EXCLUSIONS.......................................................................V
REMAINING POTENTIAL ENERGY SAVINGS....................................................................................VI
RECOMMENDATIONS AND CONSIDERATIONS................................................................................VII
SECTION 1: INTRODUCTION.......................................................................................................1
1.1 BACKGROUND...................................................................................................................1
1.2 STUDY OBJECTIVES...........................................................................................................1
1.3 METHODOLOGY.................................................................................................................2
SECTION 2: CHANGES IN SOCKET SATURATION OVER TIME.......................................................3
2.1 SATURATION BY HOUSEHOLD.............................................................................................3
2.2 COMPARISON AREAS.........................................................................................................6
2.3 ROOM-BY-ROOM ANALYSIS................................................................................................8
SECTION 3: PENETRATION, FAMILIARITY, AND SATISFACTION...................................................12
3.1 BULB PENETRATION........................................................................................................12
3.2 FAMILIARITY AND SATISFACTION WITH BULB TYPES..........................................................16
SECTION 4: RECENT PURCHASES............................................................................................18
4.1 SOURCES OF NEWLY ACQUIRED BULBS...........................................................................18
4.1.1 Influence of Direct-Install Program Activity...............................................................20
4.1.2 Purchases by Manufacturer......................................................................................21
4.2 BULB REPLACEMENTS.....................................................................................................21
4.3 CONSUMER SURVEY SELF-REPORTED PURCHASE BEHAVIOR...........................................24
4.4 CONSUMER UNDERSTANDING OF LIGHTING INFORMATION.................................................25
SECTION 5: STORAGE BEHAVIOR............................................................................................27
5.1 IN-SERVICE RATES..........................................................................................................28
SECTION 6: EISA COVERAGE, EXEMPTIONS, AND EXCLUSIONS...............................................29
SECTION 7: REMAINING POTENTIAL ENERGY SAVINGS.............................................................32
7.1 ENERGY SAVINGS POTENTIAL..........................................................................................32
7.2 CALCULATING POTENTIAL SAVINGS..................................................................................33
Connecticut LED Lighting Study Report (R154)DRAFT
November 16, 2015
SUBMITTED TO:Connecticut EEB
SUBMITTED BY:NMR Group, Inc.

CONNECTICUT LED LIGHTING STUDY REPORT (R154)
SECTION 8: DEMOGRAPHICS...................................................................................................35
APPENDIX A METHODOLOGY......................................................................................................1
A.1 CONSUMER SURVEY..........................................................................................................1
A.2 ON-SITE SATURATION SURVEY...........................................................................................1
A.2.1 Comparison Area Data Collection..............................................................................2
A.3 WEIGHTING SCHEME.........................................................................................................2
A.4 INTERPOLATION OF 2010, 2011, AND 2014........................................................................4
FiguresFIGURE 1: CONNECTICUT SATURATION TRENDS, 2009-2015.............................................................IFIGURE 2: CFL AND LED SATURATION IN CT, MA, AND UPSTATE NY, 2009-2015..........................IIFIGURE 3: CONNECTICUT PENETRATION TRENDS, 2009-2015.........................................................IIIFIGURE 4: RECENT PURCHASES.....................................................................................................IVFIGURE 5: FIRST YEAR, IN-SERVICE RATE FOR NEWLY PURCHASED CFLS AND LEDS.....................VFIGURE 6: BULBS BY EISA CATEGORY..........................................................................................VIFIGURE 7: POTENTIAL ENERGY USE...............................................................................................VIFIGURE 8: EFFICIENT BULB SATURATION, 2009-2015......................................................................4FIGURE 9: LED SATURATION, 2009-2015.......................................................................................7FIGURE 10: CFL SATURATION, 2009-2015......................................................................................8FIGURE 11: ENERGY-EFFICIENT BULB SATURATION BY ROOM TYPE, 2009-2015.............................9FIGURE 12: SPECIALTY BULB SATURATION BY ROOM TYPE, 2015*................................................11FIGURE 13: LED PENETRATION BY ROOM TYPE, 2009-2015.........................................................13FIGURE 14: CFL PENETRATION BY ROOM TYPE, 2009-2015.........................................................14FIGURE 15: INCANDESCENT PENETRATION BY ROOM TYPE, 2009-2015.........................................15FIGURE 16: WHERE BULBS OBTAINED...........................................................................................19FIGURE 17: WHERE BULBS PURCHASED........................................................................................19FIGURE 18: REPLACED BULBS 2015, CT AND MA.........................................................................22FIGURE 19: INFORMATION LOOKED FOR ON BULB PACKAGING.......................................................25FIGURE 20: FIRST YEAR IN-SERVICE RATE FOR NEWLY PURCHASED CFLS AND LEDS..................28FIGURE 21: EISA CATEGORIES.....................................................................................................30FIGURE 22: CONNECTICUT (R154) INSTALLED BULBS BY EISA CATEGORY....................................31FIGURE 23: NEEP RESIDENTIAL LIGHTING PRODUCT BREAKDOWN................................................31
TablesTABLE 1: COMPARISON OF SATURATION RATES, 2009-2015...........................................................5TABLE 2: CFL AND LED PENETRATION, 2009-2015......................................................................14TABLE 3: FAMILIARITY WITH CFLS, LEDS, AND HALOGENS...........................................................17TABLE 4: SATISFACTION WITH CFLS AND LEDS............................................................................18TABLE 5: PREFER CFLS OR LEDS................................................................................................18TABLE 6: REASON PREFER CFLS OR LEDS..................................................................................19TABLE 7: DIRECT-INSTALL PROGRAM PARTICIPATION....................................................................23TABLE 8: TOTAL PURCHASES BY MANUFACTURER.........................................................................23

CONNECTICUT LED LIGHTING STUDY REPORT (R154)
TABLE 9: DELTA WATTS BY BULB TYPE FOR PAST YEAR..............................................................25TABLE 10: BULBS PURCHASED IN THE PAST SIX MONTHS.............................................................26TABLE 11: USE OF LIGHTING/ENERGY FACTS LABEL.....................................................................27TABLE 12: LUMENS.......................................................................................................................28TABLE 13: UNDERSTANDING OF WARM WHITE/COOL WHITE..........................................................28TABLE 14: STORED BULBS BY BULB TYPE OVER TIME..................................................................30TABLE 15: HOU VALUES FOR EFFICIENT AND INEFFICIENT BULB TYPES BY ROOM TYPE................35TABLE 16: HOU BY BULB TYPE AND ROOM TYPE – CURRENT MARKET.........................................36TABLE 17: 2015 CONNECTICUT ON-SITE VISITS WEIGHTING SCHEME............................................42TABLE 18: CONNECTICUT WEIGHTING SCHEMES 2009-2013..........................................................42

CONNECTICUT LED LIGHTING STUDY REPORT (R154)
Executive Summary This report presents the results of the Connecticut LED Lighting Study (R154) conducted by NMR Group, Inc., which was designed to assess the current residential market for light-emitting diodes (LEDs) in Connecticut. For the R154 study, NMR collected data through 151 telephone surveys of a random sample of homes throughout
Connecticut and 81 on-site lighting inventories conducted with the subset of those telephone survey respondents who agreed to the visit. This executive summary focuses on the highlights from sections of the report, including saturation, penetration, storage, purchases, and energy use. Methodological details can be found in Appendix A.
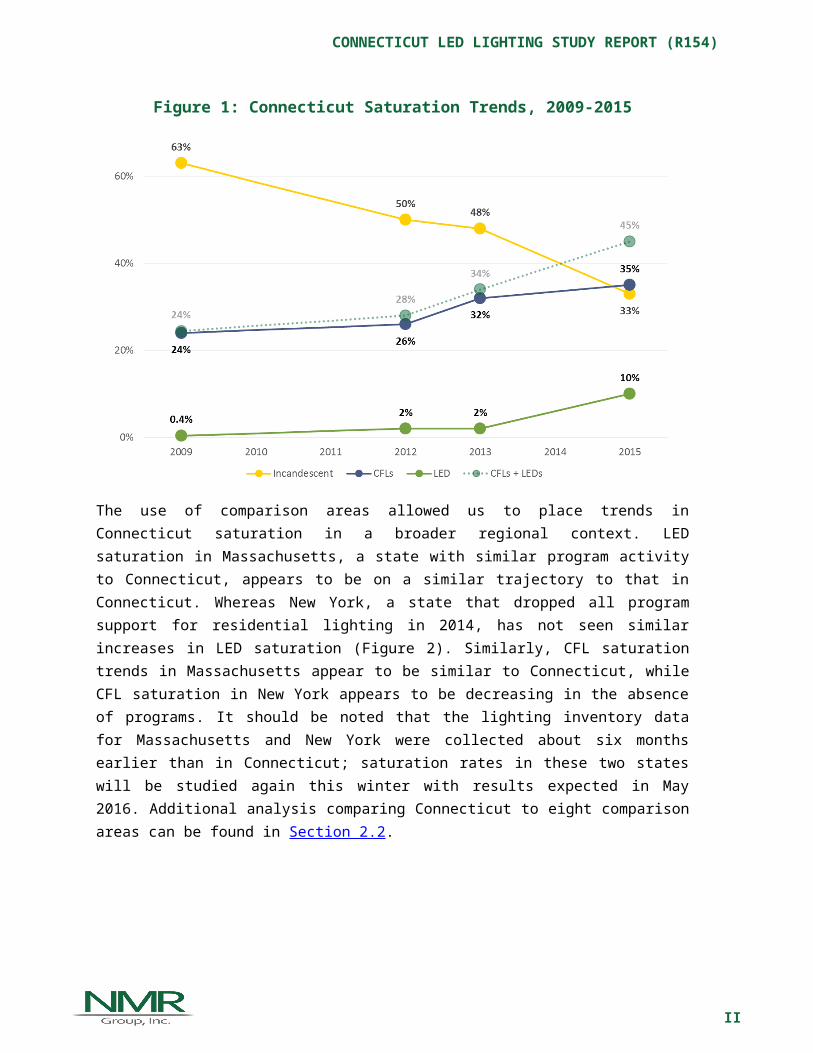
SOCKET SATURATION TRENDSBetween 2009 and 2015, Connecticut experienced a steady increase in efficient bulb saturation (the percentage of sockets filled with a specific bulb type) and a corresponding decrease in incandescent bulb saturation. Importantly, LED saturation in Connecticut, which had been rising slowly between 2009 and 2013, increased significantly between 2013 and 2015; LED bulbs now occupy one out of ten sockets in Connecticut (10%), up from just 2% in 2013. CFL saturation growth appears to have slowed, with only relatively small gains in saturation between 2013 and 2015—an increase of only three percentage points (32% to 35%). Combined, LED and CFL saturation has increased an average of six percentage points per year since 2012 (Figure 1). Additional analysis related to saturation trends over time in Connecticut can be found in Section 2.1.
Figure 1: Connecticut Saturation Trends, 2009-2015
ES
I
CONNECTICUT LED LIGHTING STUDY REPORT (R154)
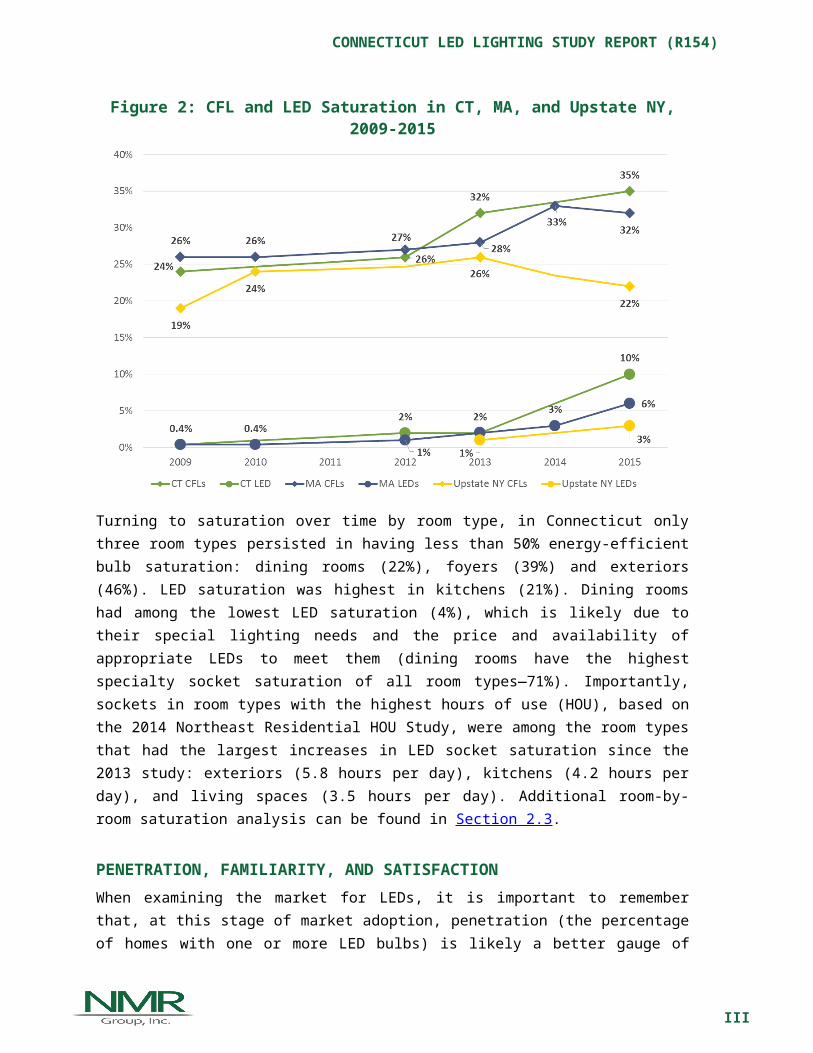
The use of comparison areas allowed us to place trends in Connecticut saturation in a broader regional context. LED saturation in Massachusetts, a state with similar program activity to Connecticut, appears to be on a similar trajectory to that in Connecticut. Whereas New York, a state that dropped all program support for residential lighting in 2014, has not seen similar increases in LED saturation (Figure 2). Similarly, CFL saturation trends in Massachusetts appear to be similar to Connecticut, while CFL saturation in New York appears to be decreasing in the absence of programs. It should be noted that the lighting inventory data for Massachusetts and New York were collected about six months earlier than in Connecticut; saturation rates in these two states will be studied again this winter with results expected in May 2016. Additional analysis comparing Connecticut to eight comparison areas can be found in Section 2.2.
Figure 2: CFL and LED Saturation in CT, MA, and Upstate NY, 2009-2015
Turning to saturation over time by room type, in Connecticut only three room types persisted in having less than 50% energy-efficient bulb saturation: dining rooms (22%), foyers (39%) and exteriors (46%). LED saturation was highest in kitchens (21%). Dining rooms had among the lowest LED saturation (4%), which is likely due to their special lighting needs and the price and availability of appropriate LEDs to meet them (dining rooms have the highest specialty socket saturation of all room types—71%). Importantly, sockets in room types with the highest hours of use (HOU), based on the 2014 Northeast Residential HOU Study, were among the room types that had the largest increases in LED socket saturation since the 2013 study: exteriors (5.8 hours per day), kitchens (4.2 hours per day), and living spaces (3.5 hours per day). Additional room-by-room saturation analysis can be found in Section 2.3.
II
CONNECTICUT LED LIGHTING STUDY REPORT (R154)
PENETRATION, FAMILIARITY, AND SATISFACTIONWhen examining the market for LEDs, it is important to remember that, at this stage of market adoption, penetration (the percentage of homes with one or more LED bulbs) is likely a better gauge of LED program success than is total saturation. As more households purchase LEDs and penetration rates rise, saturation rates will follow suit. Over the last five years, LED penetration has skyrocketed. In the 2009 study, screw-base general service LED bulbs were present in only one home, while in the 2015 study they were present in 34 of 81 homes (42%). Additionally, LED penetration jumped for all room types from 2013 to 2015; many room types had no LEDs installed as recently as 2013, while LEDs were present in all room types by 2015. Concurrently, incandescent penetration has shown a decrease in all room types over the past few years, which is in line with the decrease in incandescent socket saturation. Additional analysis on penetration by household and room type can be found in Section 3.1.
Similarly, awareness and satisfaction with LEDs are important market indicators for LED programs. The majority (66%) of consumer survey participants were either very or somewhat familiar with LEDs. Those who reported having CFLs or LEDs installed were largely very satisfied or somewhat satisfied with both bulb types; however, when asked, most participants preferred LEDs over CFLs. Additional details on familiarity and satisfaction can be found in Section 3.2.
Figure 3: Connecticut Penetration Trends, 2009-2015
III

CONNECTICUT LED LIGHTING STUDY REPORT (R154)
RECENT PURCHASESMore than one-half (55%) of telephone survey respondents reported purchasing screw-base CFLs and nearly two-fifths (37%) reported purchasing screw-base LEDs within the past six months. Approximately one-half (48%) reported purchasing incandescent bulbs, adding to the growing body of evidence suggesting that the implementation of EISA has not completely eroded the market for incandescent bulbs. These percentages however, rely solely on self-reported data and should be treated with some caution.
On-site participants reported that most LEDs and CFLs obtained in the year prior to the study came from home improvements stores. The second most common source from which participants obtained bulbs was through direct-install programs. Study participants who were confirmed as having taken part in a direct-install program (6%) were in line with the proportion of program participants in the state (12%) in 2014. Additional information on sources of new bulbs can be found in Section 4.1.
The following is an examination of the types of bulbs that newly purchased (i.e., excluding self-reported direct-install bulbs) CFLs and LEDs replaced, according to self-reported data provided on-site. The majority (81%) of CFLs replaced incandescents; similarly, a large proportion of LED bulbs also replaced incandescents (45%), though this was followed closely by LEDs replacing CFLs (38%). These newly installed bulbs led to a large drop in the observed wattage of the replaced sockets. Overall, newly installed CFLs reduced the average wattage used in those replaced sockets by 40.6 watts, and the average energy use in the sockets replaced with LEDs declined by 26.9 watts. The smaller decrease in delta watts from LEDs reflects the fact that many of these bulbs (two out of five) are replacing CFLs rather than incandescents (Figure 4). When compared to the Massachusetts panel study, where actual observed bulb changes were recorded, the average changes in wattages were very different: for CFLs, 41 delta watts in Connecticut vs. 28 delta watts in Massachusetts; for LEDs, 27 delta watts in Connecticut vs. 38 delta watts in Massachusetts. Given the nature of self-reported data, we place greater faith in the Massachusetts findings. Additional details on bulb replacements, including comparisons to findings from a Massachusetts panel study, can be found in Section 4.2.
Figure 4: Recent Purchases
IV

CONNECTICUT LED LIGHTING STUDY REPORT (R154)
STORAGE BEHAVIOREight out of ten homes in the on-site study had at least one bulb in storage. While incandescent bulbs were still the most commonly stored bulb type, they have begun to show signs of losing ground to CFLs, which have increased in number. Most bulbs are being stored for future use, though 15% of incandescent bulbs are reportedly earmarked for disposal.
Slightly more than four out of five (84%) newly purchased CFLs and LEDs were installed within a year of purchase. Notably, newly purchased LEDs were installed at a much quicker rate than newly purchased CFLs (Figure 5), likely due to a mixture of consumer satisfaction, high bulb prices, and fewer bulbs per pack. Section 5 contains additional details on storage behavior, including in-service rates.
Figure 5: First Year, In-Service Rate for Newly Purchased CFLs and LEDs
(Base: All bulbs purchased within the past year; excludes self-reported direct-install bulbs)
EISA COVERAGE, EXEMPTIONS, AND EXCLUSIONSIn order to help understand the residential lighting market in the post-EISA period, we grouped installed bulbs into three categories: covered by EISA, exempt from EISA, and non-general service bulbs (outside the realm of EISA). Just over one-half (56%) of installed bubs in Connecticut were covered by EISA; the remaining 44% were either non-general service bulbs or exempt from EISA. However, a recent NEEP paper based on secondary research, including shelf stocking studies, showed that just over one-third (36%) of bulbs currently being sold are covered by EISA, leading NEEP to conclude that great opportunities remain for efficiency programs to remain engaged with the residential lighting market. The differences in findings between the two studies can be explained by differences in methodology. The analysis for this study (R154) covers currently installed bulbs, whereas the NEEP estimates cover bulbs available for purchase (and not sales-
V

CONNECTICUT LED LIGHTING STUDY REPORT (R154)
weighted). Additional details on this analysis, including additional discussion of methodological differences, can be found in Section 6.
Figure 6: Bulbs by EISA Category
REMAINING POTENTIAL ENERGY SAVINGSOne of the main goals of this study was to update the residential energy potential for energy-efficient lighting in Connecticut. Using saturation figures from this study and hours of use (HOU) values from a study completed in 2014, we found that, while inefficient bulb types fill fewer than one-half of the sockets in Connecticut homes (44%), they are responsible for two-thirds (67%) of the energy used for lighting in these homes. To help illustrate remaining potential energy savings in the residential lighting market, we calculated potential savings for three hypothetical scenarios, including if all sockets currently filled with inefficient bulb types were replaced with CFLs (CFL-land) or LEDs (LED-land), the energy savings potential is nearly equal to the savings that have already been achieved (Figure 7). Details for this analysis and additional findings can be found in Section 7.
Figure 7: Potential Energy Use
VI

CONNECTICUT LED LIGHTING STUDY REPORT (R154)
RECOMMENDATIONS AND CONSIDERATIONSRecommendation 1: The PAs should continue to educate consumers about and provide incentives for LED bulbs in future program cycles.
Rationale: While consumers are adopting LEDs in non-program states, they appear to be adopting them at a greater pace in program states. Evidence from Connecticut and the comparison areas of Massachusetts and New York indicates that programs appear to have a strong impact on saturation levels, increasing energy-efficient bulb saturation in program states (CT and MA) and decreasing energy-efficient bulb saturation where programs no longer exist (NY). Further, as the potential energy savings analysis in this report demonstrates, there are substantial savings yet to be realized in the residential lighting market, and EISA at most only applies to just over one-half of all bulbs currently installed in Connecticut.
Recommendation 2: The PAs should carefully observe and assimilate information coming from ongoing and planned saturation studies in the Northeast. In particular, Massachusetts is once again studying residential lighting markets in Massachusetts and New York. This study will offer further insight into the results of exiting the residential lighting market.
Rationale: The residential lighting market is in a period of rapid change, which creates opportunities to see significant changes in saturation across even partial years. This could lead to different outcomes or conclusions from upcoming evaluations outside of Connecticut.
Recommendation 3: When updating the program savings document, the PAs should consider findings from this study regarding first-year in-service rates. Based on bulbs found in storage and installed, we calculate a first-year in-service rate of 95% for LEDs and 76% for CFLs.
Rationale: While the in-service rate figures are based on self-reported purchases, any bias in the responses are likely to apply equally to both installed and stored bulbs.
Consideration 1: The PAs should consider plans for future primary residential lighting research in Connecticut to supplement and supplant information gathered in other areas in the Northeast.
Rationale: Given the rapid state of change in the market, it is likely that the market will change enough over the next 12 months to merit further study. While secondary research relying on other states may benefit Connecticut, firsthand research in Connecticut may offer greater insight. In addition, it may be possible to coordinate future research efforts with the efforts of others in the region to expand the scope of studies or leverage allocated resources.
Consideration 2: The PAs should carefully consider future support for CFLs. While CFL saturation growth appears to have slowed or plateaued, avoiding backsliding is an important consideration. Any changes in program support for CFLs should be well coordinated with changes or adjustments to program support for LEDs.
VII

CONNECTICUT LED LIGHTING STUDY REPORT (R154)
Rationale: Evidence from the New York comparison area suggests that CFL saturation has receded in the absence of programs, while halogen saturation has increased. This is an indication of potential backsliding in the absence of program support for CFLs and LEDs. Still, consumers in Connecticut appear ready to adopt LEDs as an alternative to CFLs—they self-reported that 38% of LEDs installed in the past year replaced a CFL. To avoid potential drops in delta watts, it is important that consumers understand that LEDs and CFLs are both more efficient than halogen and incandescent alternatives.
Consideration 3: The PAs should carefully consider whether or not they should use delta watt findings from this study when updating the program savings document or instead explore the possibility of updating delta watts through a market adoption model approach.
Rationale: While this study explored delta watts, findings are based on self-reported data. On-site participants were not only asked to recall whether a CFL or LED had been purchased within the past year, they were also asked to recall the bulb type and wattage it had replaced. Comparing findings from this study to actual observed findings in Massachusetts reveals significant differences and draws into question the self-reported findings from this study. In addition, even actual observed delta watts offer a snapshot of history and do not factor in changes in market conditions. If the PAs were to pursue a market adoption model, it would offer a forecast of delta watts.
VIII

CONNECTICUT LED LIGHTING STUDY REPORT (R154)
Section 1: IntroductionThis report presents the results of the Connecticut LED Lighting Study (R154), which was designed to assess the current residential market in Connecticut with a special emphasis on light-emitting diodes (LEDs). NMR Group, Inc. (NMR), conducted this study at the request of the Connecticut Energy Efficiency Board (EEB). The study results draw on
telephone surveys completed with random sample of households in Connecticut and on-site lighting inventory visits completed with a subset of survey participants.
1.1 BACKGROUNDEnergizeCT’s Retail Lighting Program is part of the Residential Retail Products Program, the objective of which is “to increase consumer awareness, acceptance and market share of ENERGY STAR® lighting, appliances and consumer electronics.”1 The Lighting Program specifically promotes the sale of ENERGY STAR® lighting products. The program continues to support both CFLs and LEDs, but has shifted focus increasingly toward LED bulbs. In 2015, the program discontinued incentives for specialty CFLs because, as stated in the 2015 annual update, “There are better performing LED alternatives on the market at good price points.” Incentives are applied at the wholesale level to manufacturers, allowing consumers to pay a discounted price at the point of purchase. Historically, the Retail Lighting Program has concentrated on home improvement and big-box stores, but it has made recent efforts to expand to hard-to-reach retail stores.
The EEB, Eversource, and the United Illuminating Company (UI) have been tracking numerous lighting market indicators through on-site lighting inventories since 2009. Over time, the purpose of lighting inventories has shifted focus from simply tracking CFL adoption to incorporating metrics for all types of bulbs—program-supported and non-program-supported, efficient and non-efficient. The current effort (R154) continues to track metrics for all bulb types but, in deference to the shift in program focus, this study had a special focus on the market for LEDs.
1.2 STUDY OBJECTIVESThe R154 study was developed for the EEB with the overall goal of assessing trends in the Connecticut lighting market, with special emphasis on LEDs, and providing information to inform updates to parameters used in the calculation of energy and demand savings for the 2016 to 2018 program cycle. These same estimates could also be incorporated into future program savings documents (PSDs) and could inform the EEB’s decisions regarding the future of residential lighting programs.
1 2015 Annual Update of the 2013-2015 Electric and Natural Gas Conservation and Load Management Plan – Public Act 11-80 Section 33. http://www.energizect.com/sites/default/files/2015%20C%26LM%20Plan%20Update%20FINAL%2012-22-14.pdf
1
1
CONNECTICUT LED LIGHTING STUDY REPORT (R154)
The R154 study had the following three main objectives:
To provide a basis for reliable estimates of the current use of various bulb types and updated calculations of Connecticut socket and savings lighting potential. These results will be used in combination with inputs from previously conducted Connecticut studies.
To provide data on baselines and delta watts suitable for the PSD, savings estimates, and program planning.
To provide data on first-year in-service rates suitable for the PSD, savings estimates, and program planning.
To provide the customer, equipment, and market data needed to support program targeting and planning needs.
1.3 METHODOLOGYFor the R154 study, NMR collected data through 151 telephone surveys of a random sample of homes throughout Connecticut and 81 on-site lighting inventories conducted with the subset of those telephone survey respondents who agreed to the visit. The phone survey was fielded between July and August of 2015, and the on-site visits took place between July and September of 2015.
In addition to data from the 2015 R154 study, in order to better understand the market in the state and examine trends, this report also includes information from previously completed on-site lighting studies in Connecticut from 2009, 2011, and 2013.2 The methods for the 2015 study differed slightly from previous efforts; we have outlined the major differences in Appendix A. This report also explores the saturation of energy-efficient residential lighting products in Connecticut over time in reference to eight comparison areas: California, Georgia, Kansas, Maine, Massachusetts, Rhode Island, and New York (Upstate and Downstate). While the timing of visits in these comparison areas does not directly align with those conducted in Connecticut, the trends observed provide useful context.
Additional methodological details related the consumer survey and the on-site saturation survey—including sampling error and weighting schemes—can be found in Appendix A.
2 NMR, R86: Connecticut Residential LED Market Assessment and Lighting Net-to-Gross Overall Report, 2015. http://tinyurl.com/R86-Study
2

CONNECTICUT LED LIGHTING STUDY REPORT (R154)
Section 2: Changes in Socket Saturation over Time
The Connecticut EEB has been tracking socket saturation (the percentage of sockets filled with a specific bulb type) since 2009. In this section, we explore trends in socket saturation in both Connecticut and comparison areas, the percent of installed bulbs covered by EISA, and
room-by-room saturation trends over time in Connecticut. Some of the highlights include the following:
Examining data over time and between comparison areas, we see that efficient bulb saturation is on the rise, with corresponding decreases in incandescent bulb saturation.
Efficient bulb saturation increases are being driven primarily by large increases in LED saturation.
Halogen, linear fluorescent, and CFL saturation have held steady since 2013.
Massachusetts, a state with similar residential lighting programs, shows similar trends to Connecticut.
New York, a state that dropped all program support for residential lighting in 2014, has not seen similar increases in LED saturation and shows some signs of backsliding with increases in inefficient bulb saturation.
In Connecticut, only three room types had less than 50% energy-efficient bulb saturation in 2015: dining rooms (22%), foyers (39%), and exteriors (46%).
LED saturation was highest in kitchens (21%), and among the lowest was dining rooms (4%), which is likely due to their special lighting needs.
2.1 SATURATION BY HOUSEHOLDSaturation for all bulb types in Connecticut between 2009 and 2015 is displayed in Figure 8 below. To aid in understanding trends, we have interpolated data to represent years in which saturation studies are not available (2010, 2011, and 2014). The figure clearly shows a downward trend in incandescent bulb saturation (yellow) from filling nearly two-thirds of all sockets in 2009 (63%) to filling only one-third of all sockets in 2015 (33%).
Not surprisingly, there is a corresponding increase in both CFL and LED saturation during the same timeframe. Notably, LED saturation has quintupled from 2% in 2013 to 10% in 2015. In contrast, the feared spike in halogen saturation following the full implementation of EISA in 2014—especially the phase-out of the 60-watt incandescent—has not materialized in Connecticut. Fluorescent bulb saturation has remained steady at 11% since 2012, though this may change in the near future with the introduction to the market of linear LED conversion kits and replacement bulbs.3
3 Note, however, that linear LED conversion kits and replacement bulbs are generally not compatible with older magnetic ballasts often associated with T12 fluorescent lighting. Replacing older linear fluorescents with LEDs
2
3
CONNECTICUT LED LIGHTING STUDY REPORT (R154)
Figure 8: Efficient Bulb Saturation, 2009-2015
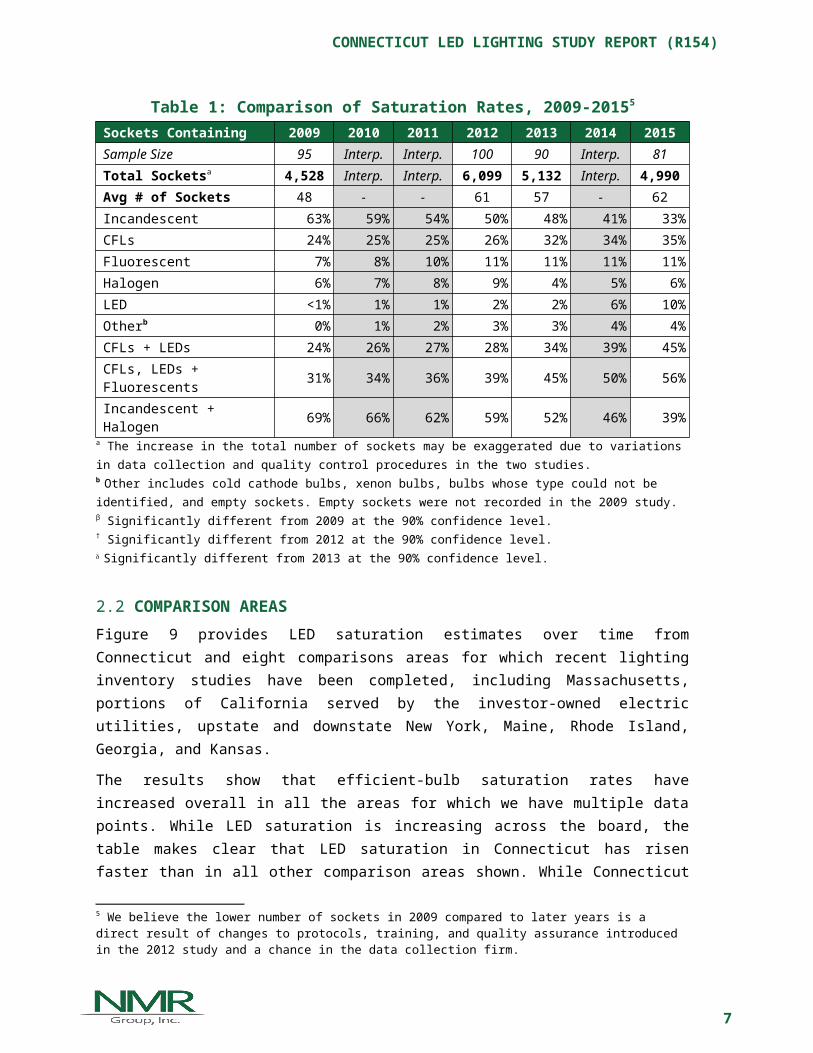
Table 1 provides the same data shown in Figure 8 as well as combined saturation figures for efficient and inefficient bulb types and notations for significant differences between 2015 and previous years.
The data show the following:
LEDs occupied less than 1% of all sockets in Connecticut in 2009. Saturation slowly increased between 2009 and 2013 to 2% of all sockets and has since increased to 10% of all sockets, a statistically significant increase compared to 2009, 2012, and 2013.
CFL saturation has increased steadily since 2009, and in 2015 CFLs accounted for about one out of every three sockets in Connecticut (35%), a statistically significant increase compared to 2009.
Incandescent saturation has decreased dramatically since 2009. Between 2009 and 2015, incandescent saturation decreased thirty percentage points (63% to 33%). The percentage of sockets filled with incandescent bulbs is significantly lower in 2015 than it was in all three prior studies (2009, 2012, and 2013).
Linear fluorescent saturation has remained at 11% since 2012.
Halogen saturation has hovered around 6% since 2009.4
represents a higher level of effort, requiring fixture or ballast replacements. 4 Note that halogen bulbs are very similar in appearance and are in actuality a subtype of incandescent bulbs. Technicians are thoroughly trained to distinguish halogen bulbs but it is still likely that some halogen bulbs are misidentified as standard incandescent bulbs. For this reason, we also look at combined inefficient bulbs.
4

CONNECTICUT LED LIGHTING STUDY REPORT (R154)
Combined CFL and LED saturation in 2015 is significantly higher compared to 2009 and 2012. In 2009, combined CFL and LED saturation accounted for about one-quarter (24%) of all installed bulbs in Connecticut, and in 2015 accounted for just over two-fifths (45%) of all installed bulbs.
Combined efficient (CFL, LED, and fluorescent) bulb saturation in 2015 is significantly higher compared to 2009 and 2012. In 2009, combined efficient bulb saturation accounted for just under one-third (31%) of all sockets in Connecticut, while in 2015 it accounted for more than one-half (56%) of all sockets.
Combined inefficient (incandescent and halogen) bulb saturation in 2015 is significantly different from all three prior studies, dropping 13 percentage points since the 2013 study alone.
Table 1: Comparison of Saturation Rates, 2009-20155
Sockets Containing 2009 2010 2011 2012 2013 2014 2015Sample Size 95 Interp. Interp. 100 90 Interp. 81Total Socketsa 4,528 Interp. Interp. 6,099 5,132 Interp. 4,990Avg # of Sockets 48 - - 61 57 - 62Incandescent 63% 59% 54% 50% 48% 41% 33%CFLs 24% 25% 25% 26% 32% 34% 35%Fluorescent 7% 8% 10% 11% 11% 11% 11%Halogen 6% 7% 8% 9% 4% 5% 6%LED <1% 1% 1% 2% 2% 6% 10%Otherb 0% 1% 2% 3% 3% 4% 4%CFLs + LEDs 24% 26% 27% 28% 34% 39% 45%CFLs, LEDs + Fluorescents 31% 34% 36% 39% 45% 50% 56%Incandescent + Halogen 69% 66% 62% 59% 52% 46% 39%
a The increase in the total number of sockets may be exaggerated due to variations in data collection and quality control procedures in the two studies.b Other includes cold cathode bulbs, xenon bulbs, bulbs whose type could not be identified, and empty sockets. Empty sockets were not recorded in the 2009 study.β Significantly different from 2009 at the 90% confidence level.† Significantly different from 2012 at the 90% confidence level. Significantly different from 2013 at the 90% confidence level.
2.2 COMPARISON AREASFigure 9 provides LED saturation estimates over time from Connecticut and eight comparisons areas for which recent lighting inventory studies have been completed, including Massachusetts, portions of California served by the investor-owned electric utilities, upstate and downstate New York, Maine, Rhode Island, Georgia, and Kansas.
The results show that efficient-bulb saturation rates have increased overall in all the areas for which we have multiple data points. While LED saturation is increasing across the board, the table makes clear that LED saturation in Connecticut has risen faster than in all
5 We believe the lower number of sockets in 2009 compared to later years is a direct result of changes to protocols, training, and quality assurance introduced in the 2012 study and a chance in the data collection firm.
5

CONNECTICUT LED LIGHTING STUDY REPORT (R154)
other comparison areas shown. While Connecticut LED saturation figures are the highest, they are also the most recent—the 2015 lighting inventory data for Massachusetts and Upstate New York were collected about six months prior to the 2015 Connecticut data. The data from Massachusetts and New York in particular offer insights due to a unique natural experiment. Massachusetts offers similar lighting programs as Connecticut, although Connecticut more aggressively shifted resources from CFLs to LEDs earlier than Massachusetts; moreover, New York ceased supporting LEDs (and specialty CFLs) in 2014 (and standard CFLs in 2012). Note that the Massachusetts and New York data will be updated in early 2016, after the finalization of this report. Some of the highlights of this comparison include the following:
Connecticut LED saturation quintupled from 2% to 10% between 2013 and 2015. Massachusetts exhibited the next largest percentage point increase, tripling from
2% to 6% over a time period that was six months shorter. New York also saw its rate triple, but the increase was 1% to 3%. Maine’s LED saturation rate went from virtually zero in 2014 to 3% in 2014. Kansas’s 4% rate in 2014 is also notable given that it has never had a lighting
program.
Figure 9: LED Saturation, 2009-20156
(Base: All sockets in each state and year [some exclude empty sockets])
6 Figure 9 and Figure 10 assume consistent, linear changes between estimates, which may not be accurate. For example, Georgia had a saturation rate of 16% in 2009 and 19% in 2014, and the graph shows this change as linear when, in reality, the increase in saturation may have occurred only between 2013 and 2014.
6

CONNECTICUT LED LIGHTING STUDY REPORT (R154)
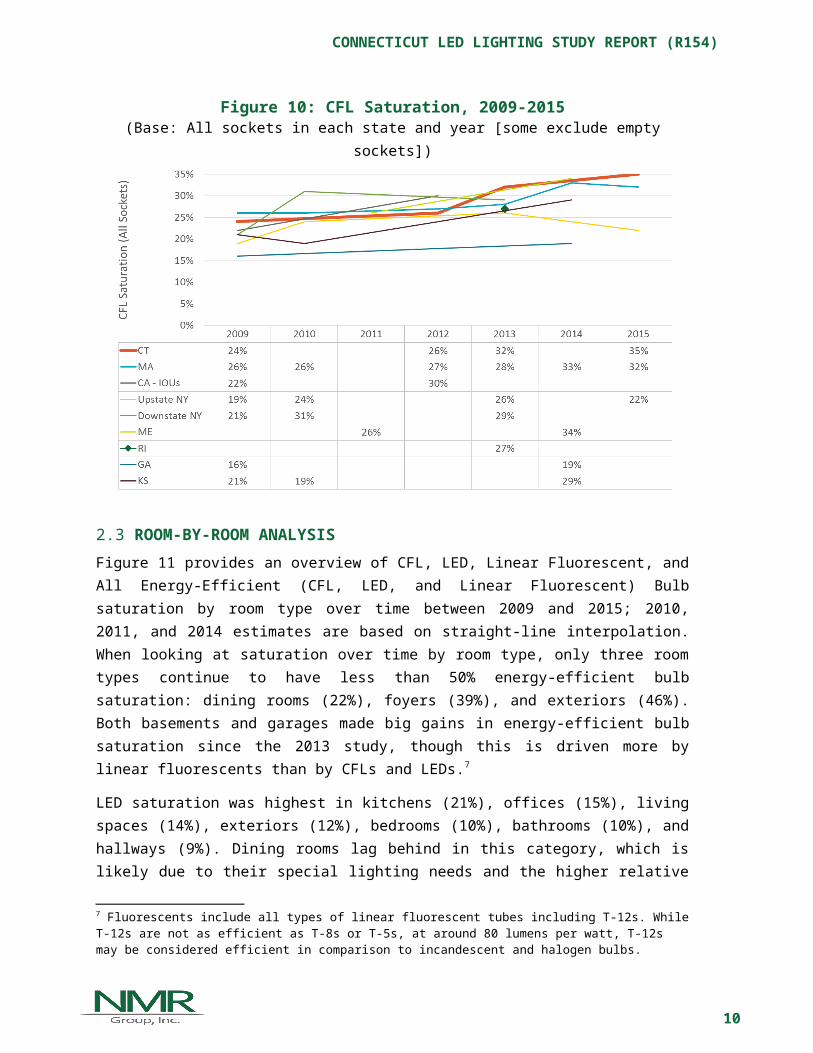
Figure 10 shows the same information as the previous table, but for CFLs.
CFL saturation in Massachusetts, a very active program state, shows a very similar pattern to Connecticut.
CFL saturation in New York shows signs of backsliding, with a decrease between 2013 and 2015. The timing of this decrease coincides with the state abandoning all residential lighting activity by mid-2014.
Figure 10: CFL Saturation, 2009-2015(Base: All sockets in each state and year [some exclude empty sockets])
2.3 ROOM-BY-ROOM ANALYSISFigure 11 provides an overview of CFL, LED, Linear Fluorescent, and All Energy-Efficient (CFL, LED, and Linear Fluorescent) Bulb saturation by room type over time between 2009 and 2015; 2010, 2011, and 2014 estimates are based on straight-line interpolation. When looking at saturation over time by room type, only three room types continue to have less than 50% energy-efficient bulb saturation: dining rooms (22%), foyers (39%), and exteriors (46%). Both basements and garages made big gains in energy-efficient bulb saturation since the 2013 study, though this is driven more by linear fluorescents than by CFLs and LEDs.7
LED saturation was highest in kitchens (21%), offices (15%), living spaces (14%), exteriors (12%), bedrooms (10%), bathrooms (10%), and hallways (9%). Dining rooms lag behind in this category, which is likely due to their special lighting needs and the higher relative price of specialty shaped LEDs. As Figure 12 shows, specialty sockets comprise nearly three-
7 Fluorescents include all types of linear fluorescent tubes including T-12s. While T-12s are not as efficient as T-8s or T-5s, at around 80 lumens per watt, T-12s may be considered efficient in comparison to incandescent and halogen bulbs.
7

CONNECTICUT LED LIGHTING STUDY REPORT (R154)
quarters of all sockets in dining rooms (71%), the highest of any room type. Exteriors (57%), kitchens (53%), and foyers (53%) are the only other room types with greater than 50% specialty bulb saturation. Importantly, sockets in exteriors (5.8 hours/day), kitchens (4.2 hours/day), and living spaces (3.5 hours/day) have the average highest hours of use (HOU) of all room types and were among the rooms that had the biggest increase in LED socket saturation since the 2013 study.8
8 NMR, Northeast Residential Lighting Hours-of-Use Study, 2014. http://tinyurl.com/TimelessHOU
8

CONNECTICUT LED LIGHTING STUDY REPORT (R154)
Figure 11: Energy-Efficient Bulb Saturation by Room Type, 2009-2015
9
CONNECTICUT LED LIGHTING STUDY REPORT (R154)
10

CONNECTICUT LED LIGHTING STUDY REPORT (R154)
Figure 12: Specialty Bulb Saturation by Room Type, 2015*
*Specialty bulbs include dimmable and three-way bulbs of any kind; circline fluorescents; flood/spot and tube halogens; all non-spiral CFLs; and bug, candelabra, flood/spot, globe, and bullet/torpedo incandescent bulbs.
11

CONNECTICUT LED LIGHTING STUDY REPORT (R154)
Section 3: Penetration, Familiarity, and Satisfaction
In this section, we explore trends in penetration (i.e., the percentage of homes using at least one of a particular bulb type) for various bulb types, including a room-by-room penetration analysis over time, as well as
familiarity and satisfaction with LEDs and CFLs. When examining the market for LEDs, it is important to remember that at this stage of market adoption, penetration is likely a better gauge of LED program success than is total saturation. Penetration shows that the program is getting people to try LEDs, but as more households purchase LEDs and expand the number and diversity of sockets in which LEDs are installed, higher saturation rates will follow suit. Similarly, awareness of and satisfaction with LEDs are important market indicators for LED programs. In 2015, all signs point to strong growth in LED penetration and awareness and
continued high levels of satisfaction with LED bulbs. Almost all Connecticut households use at least one CFL, suggesting full market
penetration. Any additional gains in the CFL market will come through expanded socket saturation—if the market expands at all, given the rapid adoption of LEDs and competition from lower-priced halogens.
Incandescent penetration continues a decline first observed in 2013. LED penetration jumped for all room types from 2013 to 2015; many room types
had no LEDs installed as recently as 2013, while LEDs were present in all room types by 2015.
CFL penetration has also increased steadily in most room types since 2009, while incandescent penetration has decreased across the board.
3.1 BULB PENETRATIONAs Table 2 shows, both CFL and LED penetration have increased since 2009. However, while CFLs were nearly ubiquitous in Connecticut homes in 2009 (88%), LEDs were just being introduced to the market. Over the last five years, LED penetration has skyrocketed. In the 2009 study, screw-base general service LED bulbs9 were present in only one home, while in the 2015 study they were present in 34 of 81 homes (42%). CFL penetration, which hovered around 90% to 95% between 2009 and 2013, increased to 99% in 2015, which is essentially full market penetration. In contrast, incandescent penetration dropped to 93%, down from 96% in 2013 and essentially 100% prior to then.
9 Specifically, the 2009 study included one home with three medium screw-base flood light LEDs.
3
12
CONNECTICUT LED LIGHTING STUDY REPORT (R154)
Table 2: CFL and LED Penetration, 2009-20152009 2010 2011 2012 2013 2014 2015
Sample Size 95 Interpolated Interpolated 100 90 Interpolated 81CFLs 88% 91% 94% 96% 91% 95% 99% β
LED 1% 7% 13% 19% 23% 33% 42% β†
Incandescent 98% 99% 99% 100% 96% 94% 93%†
β Significantly different from 2009 at the 90% confidence level.† Significantly different from 2012 at the 90% confidence level. Significantly different from 2013 at the 90% confidence level.
In addition to household-level penetration, we examined LED, CFL, and incandescent penetration by room type from 2009 to 2015. When calculating penetration by room type, we included only homes that had rooms of that type. For example, in 2015, 79 homes had living spaces and 22 of those homes had at least one LED installed in living spaces, which calculates to a 28% penetration rate. As Figure 13 shows, LED penetration has increased for all room types from 2013 to 2015. Living spaces served as the most common place to install at least one LED (28%), followed by kitchens (25%) and exterior spaces (24%). Many room types had no LEDs installed as recently as 2013, while LEDs were present in all room types by 2015.
Figure 13: LED Penetration by Room Type, 2009-2015
13

CONNECTICUT LED LIGHTING STUDY REPORT (R154)
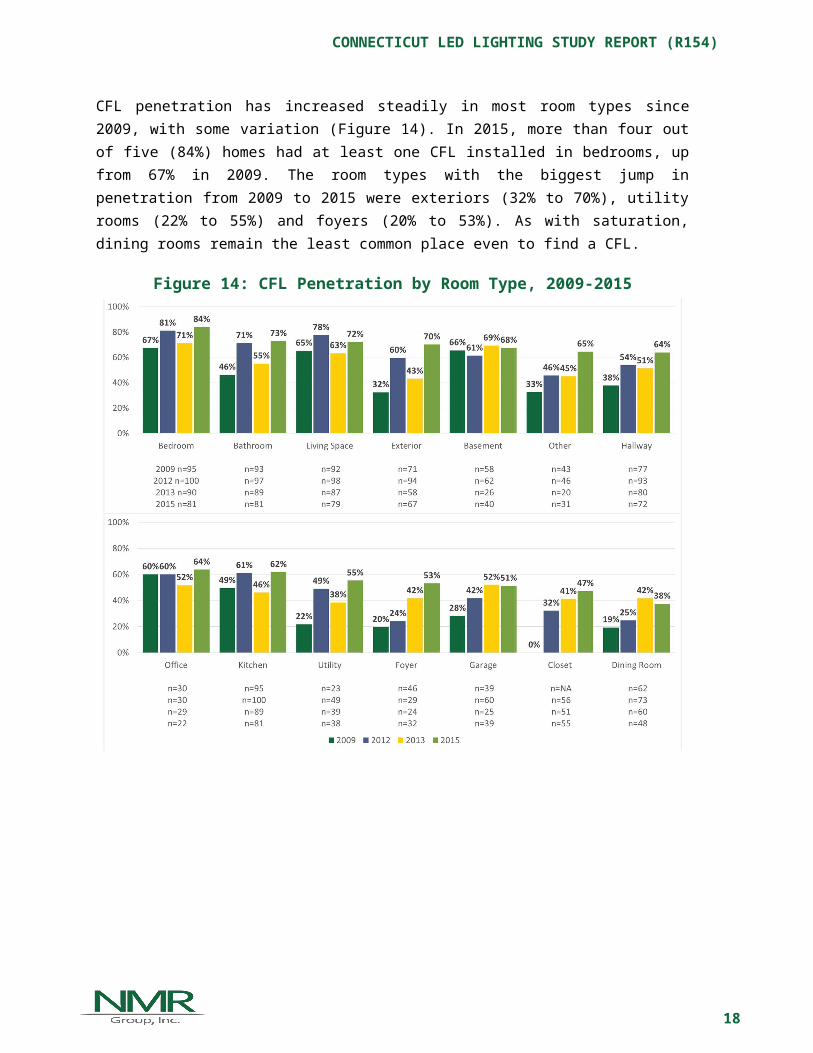
CFL penetration has increased steadily in most room types since 2009, with some variation (Figure 14). In 2015, more than four out of five (84%) homes had at least one CFL installed in bedrooms, up from 67% in 2009. The room types with the biggest jump in penetration from 2009 to 2015 were exteriors (32% to 70%), utility rooms (22% to 55%) and foyers (20% to 53%). As with saturation, dining rooms remain the least common place even to find a CFL.
Figure 14: CFL Penetration by Room Type, 2009-2015
14

CONNECTICUT LED LIGHTING STUDY REPORT (R154)
Incandescent penetration has shown a decrease in all room types over the past few years, which is in line with the decrease in incandescent socket saturation. The biggest drop in incandescent penetration since 2009 has been in hallways (65% to 32%) and utility rooms (73% to 39%). Exteriors saw the biggest drop in incandescent penetration between 2013 and 2015, with it reaching a high of 91% in 2013 and then dropping to 63% (29 percentage points) in 2015. Notably, only four out of ten homes (40%) had at least one incandescent bulb installed in kitchens in 2015.
Figure 15: Incandescent Penetration by Room Type, 2009-2015
15

CONNECTICUT LED LIGHTING STUDY REPORT (R154)
3.2 FAMILIARITY AND SATISFACTION WITH BULB TYPESTo provide a larger sample than just on-site alone, questions about familiarity and satisfaction with bulb types were asked during the consumer survey. Each respondent was asked about his or her level of familiarity with CFLs, LEDs, and halogen bulbs (Table 3).
LEDs: Two-thirds of 2015 respondents were either somewhat or very familiar with LEDs (66%), up from just 35% in 2012 when LEDs were the bulb type consumer survey respondents were least familiar with.
CFLs: Nine out of ten 2015 respondents were somewhat or very familiar with CFLs (89%), up from 75% in 2012.
Halogens: Respondents in 2015 were least familiar with halogen bulbs, with three out of five (57%) reporting that they were somewhat or very familiar with this type of bulb. This is similar to the 54% who said the same in 2012.
Table 3: Familiarity with CFLs, LEDs, and Halogens(Base: Telephone survey respondents)
Level of Familiarity*
CFLs LEDs Halogens2012 2015 2012 2015 2012 2015
Sample Size 551 151 551 151 551 151Very familiar 34% 67% 14% 42% 23% 35%Somewhat familiar 41% 22% 21% 24% 31% 22%Not too familiar 11% 6% 20% 12% 19% 18%Not at all familiar 14% 4% 44% 21% 27% 24%Don’t know 1% 0% <1% 0% <1% 1%*We also examined familiarity and satisfaction for the subset of on-site participants; their patterns mirrored those of all telephone respondents.
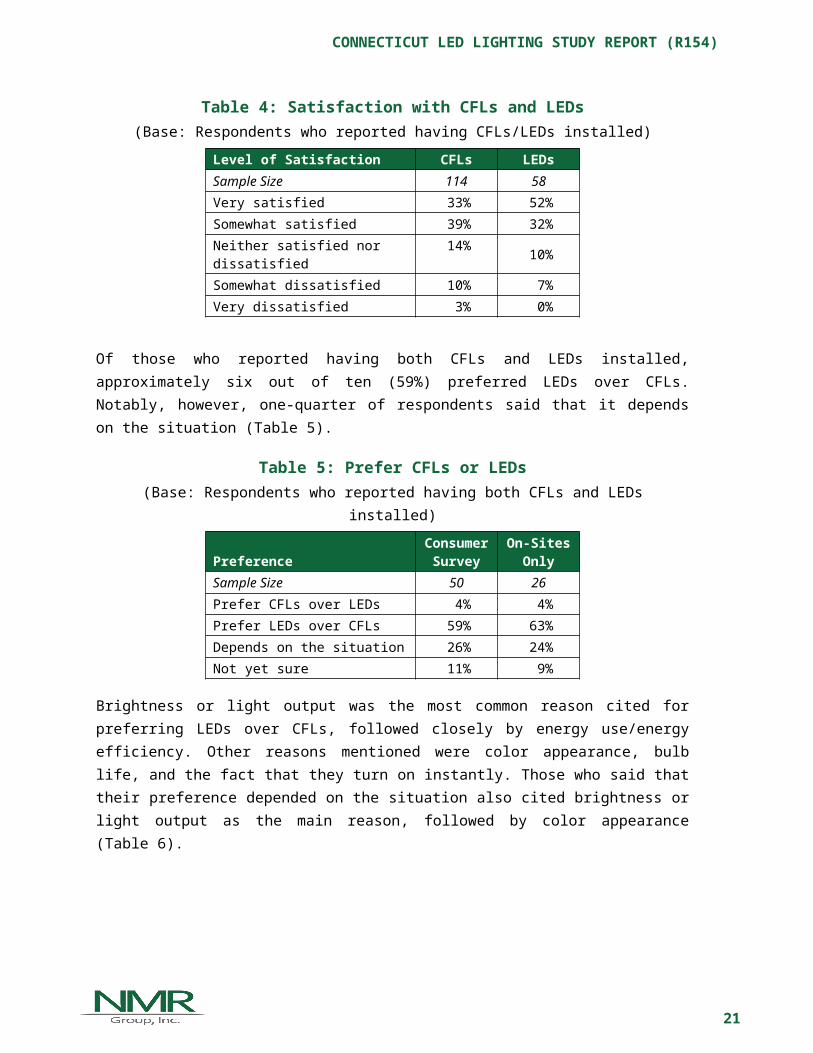
As Table 4 shows, those who self-reported having CFLs or LEDs installed were also asked to rate their level of satisfaction with each bulb type. While approximately three-quarters of respondents who had CFLs installed said they were very or somewhat satisfied with CFLs, 84% of respondents who had LEDs installed were very or somewhat satisfied with them, with more than one-half reporting they were very satisfied with LEDs.
Table 4: Satisfaction with CFLs and LEDs(Base: Respondents who reported having CFLs/LEDs installed)
Level of Satisfaction CFLs LEDsSample Size 114 58Very satisfied 33% 52%Somewhat satisfied 39% 32%Neither satisfied nor dissatisfied 14% 10%Somewhat dissatisfied 10% 7%Very dissatisfied 3% 0%
16

CONNECTICUT LED LIGHTING STUDY REPORT (R154)
Of those who reported having both CFLs and LEDs installed, approximately six out of ten (59%) preferred LEDs over CFLs. Notably, however, one-quarter of respondents said that it depends on the situation (Table 5).
Table 5: Prefer CFLs or LEDs(Base: Respondents who reported having both CFLs and LEDs installed)
PreferenceConsumer
SurveyOn-Sites
OnlySample Size 50 26Prefer CFLs over LEDs 4% 4%Prefer LEDs over CFLs 59% 63%Depends on the situation 26% 24%Not yet sure 11% 9%
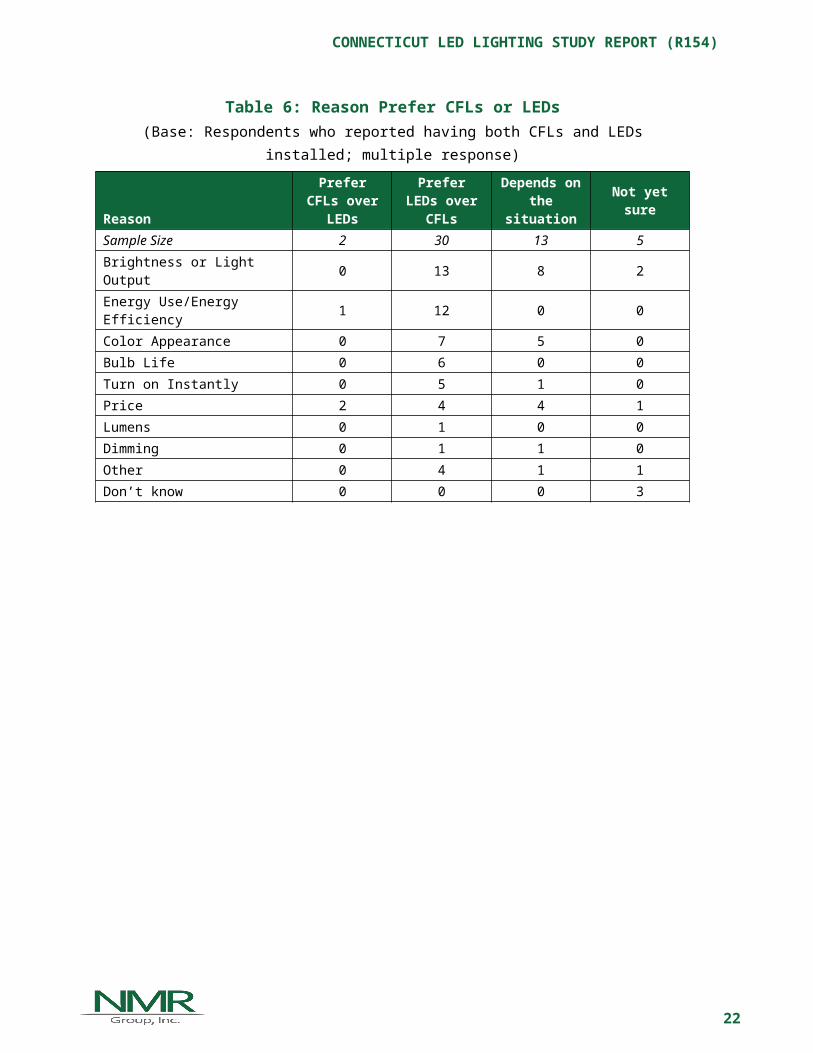
Brightness or light output was the most common reason cited for preferring LEDs over CFLs, followed closely by energy use/energy efficiency. Other reasons mentioned were color appearance, bulb life, and the fact that they turn on instantly. Those who said that their preference depended on the situation also cited brightness or light output as the main reason, followed by color appearance (Table 6).
Table 6: Reason Prefer CFLs or LEDs(Base: Respondents who reported having both CFLs and LEDs installed; multiple
response)
ReasonPrefer CFLs over LEDs
Prefer LEDs over CFLs
Depends on the situation Not yet sure
Sample Size 2 30 13 5Brightness or Light Output 0 13 8 2Energy Use/Energy Efficiency 1 12 0 0Color Appearance 0 7 5 0Bulb Life 0 6 0 0Turn on Instantly 0 5 1 0Price 2 4 4 1Lumens 0 1 0 0Dimming 0 1 1 0Other 0 4 1 1Don’t know 0 0 0 3
17
CONNECTICUT LED LIGHTING STUDY REPORT (R154)
Section 4: Recent PurchasesNot only did NMR technicians ask respondents when they had bought the LEDs and CFLs found in their homes, we also asked them to recall where they had obtained the bulbs they had acquired within the past year. This section looks at recent purchases by channel and also includes an assessment of bulbs obtained through direct-install
programs as well as an analysis of self-reported purchasing behavior.
A large number of bulbs (about one-quarter) were obtained through direct-install programs.
Among purchased bulbs, consumers bought about three-fifths of LEDs and CFLs from home improvement stores.
While consumers recalled buying CFLs at many other retail channels, the only other large source for LEDs was club stores. This is consistent with the program, which has historically focused on big box and home improvement stores.
The majority (81%) of newly installed CFLs replaced incandescents; the majority of newly installed LED bulbs also replaced incandescents (45%), though this was followed closely by CFLs (38%).
Approximately one-half of participants reported purchasing incandescent bulbs within the past six months, which indicates that EISA has not completely eroded the market for incandescent bulbs; purchasing CFLs and LEDs was also very common.
4.1 SOURCES OF NEWLY ACQUIRED BULBSFigure 16 looks at all bulbs obtained within the past year. The most common place homeowners went to get both LEDs and CFLs was home improvement stores (e.g., Home Depot or Lowe’s), which accounted for over two-fifths of the LEDs (45%) and CFLs (44%) on-site respondents had obtained in the past year. This is not surprising because, historically, the Connecticut program has relied heavily on home improvement stores as the main conduit to consumers. In a 2015 study, NMR found that about one-half (49%) of LED sales and 61% of standard CFL sales came through home improvement stores.10 Club stores were the second most common source of LEDs (23%) and the third most common source of CFLs (6%). Unfortunately, because the data were self-reported, homeowners were unable to recall where one-quarter (23%) of all newly installed CFLs and LEDs had been obtained. Of note, 11 homes self-reported that they had obtained LEDs or CFLs from a direct-install program within the past year. However, when we examined program records, only five of these homes appear to have participated in the Connecticut Home Energy Services (HES) program or HES Income Eligible (HES-IE) programs in 2014 or 2015. In Figure 16, we have coded the source of self-reported direct-install bulbs for the other six (unconfirmed) homes as Don’t know.11
10 NMR, R86: Connecticut Residential LED Market Assessment and Lighting Net-to-Gross Overall Report, 2015. http://tinyurl.com/R86-Study
4
18

CONNECTICUT LED LIGHTING STUDY REPORT (R154)
Figure 16: Where Bulbs Obtained(Base: All bulbs obtained within the past year)
Figure 17 looks solely at bulbs purchased from retail stores; for more details on bulbs obtained through direct-install programs, see Table 7. Home improvement stores (e.g., Home Depot or Lowe’s) accounted for about three out of every five LEDs (60%) and CFLs (56%) purchased within the past year. Nearly one-third (30%) of LED bulbs were purchased at club stores (e.g., Costco or Sam’s Club), while only 8% of CFLs were purchased in this type of store.
Figure 17: Where Bulbs Purchased(Base: All bulbs purchased within the past year; excludes self-reported direct-install bulbs)
4.1.1 Influence of Direct-Install Program ActivityIn order to understand the influence of direct-install program participants on the on-site sample, we compared key statistics from the on-site sample to the population of HES
11 If we include the bulbs identified as direct-install bulbs from the six unconfirmed participants, direct install bulbs account for 24% of all bulbs obtained in the past year—25% of LEDs and 22% of CFLs.
19

CONNECTICUT LED LIGHTING STUDY REPORT (R154)
program participants and the upstream lighting program (Table 7). Based on this analysis, we conclude that the proportion of on-site participants in our sample is lower than the population, but the percentage of bulbs obtained through direct-install programs by the on-site sample is higher than expected.
Proportion of Direct-Install Participants
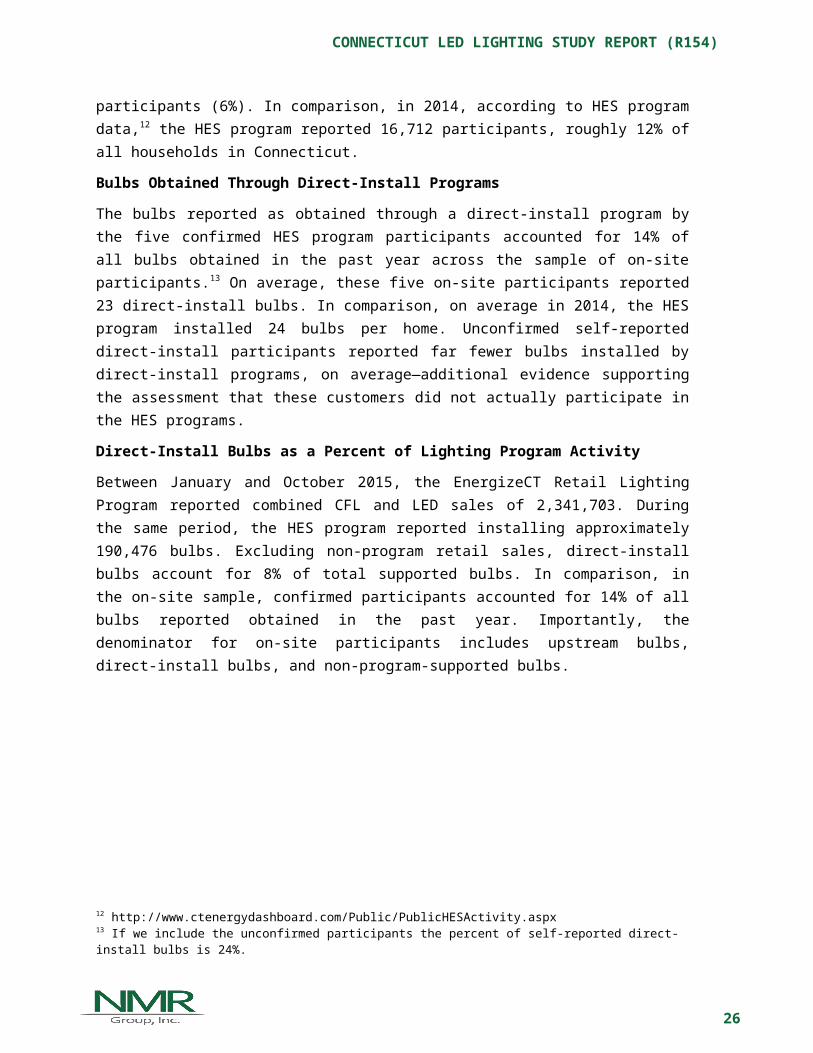
Among R154 on-site participants, 11 households (14%) self-reported participation in the PAs’ direct-install programs. However, when we tried to confirm program participation using program records, we were only able to confirm participation for five on-site participants (6%). In comparison, in 2014, according to HES program data,12 the HES program reported 16,712 participants, roughly 12% of all households in Connecticut.
Bulbs Obtained Through Direct-Install Programs
The bulbs reported as obtained through a direct-install program by the five confirmed HES program participants accounted for 14% of all bulbs obtained in the past year across the sample of on-site participants.13 On average, these five on-site participants reported 23 direct-install bulbs. In comparison, on average in 2014, the HES program installed 24 bulbs per home. Unconfirmed self-reported direct-install participants reported far fewer bulbs installed by direct-install programs, on average—additional evidence supporting the assessment that these customers did not actually participate in the HES programs.
Direct-Install Bulbs as a Percent of Lighting Program Activity
Between January and October 2015, the EnergizeCT Retail Lighting Program reported combined CFL and LED sales of 2,341,703. During the same period, the HES program reported installing approximately 190,476 bulbs. Excluding non-program retail sales, direct-install bulbs account for 8% of total supported bulbs. In comparison, in the on-site sample, confirmed participants accounted for 14% of all bulbs reported obtained in the past year. Importantly, the denominator for on-site participants includes upstream bulbs, direct-install bulbs, and non-program-supported bulbs.
12 http://www.ctenergydashboard.com/Public/PublicHESActivity.aspx13 If we include the unconfirmed participants the percent of self-reported direct-install bulbs is 24%.
20
CONNECTICUT LED LIGHTING STUDY REPORT (R154)
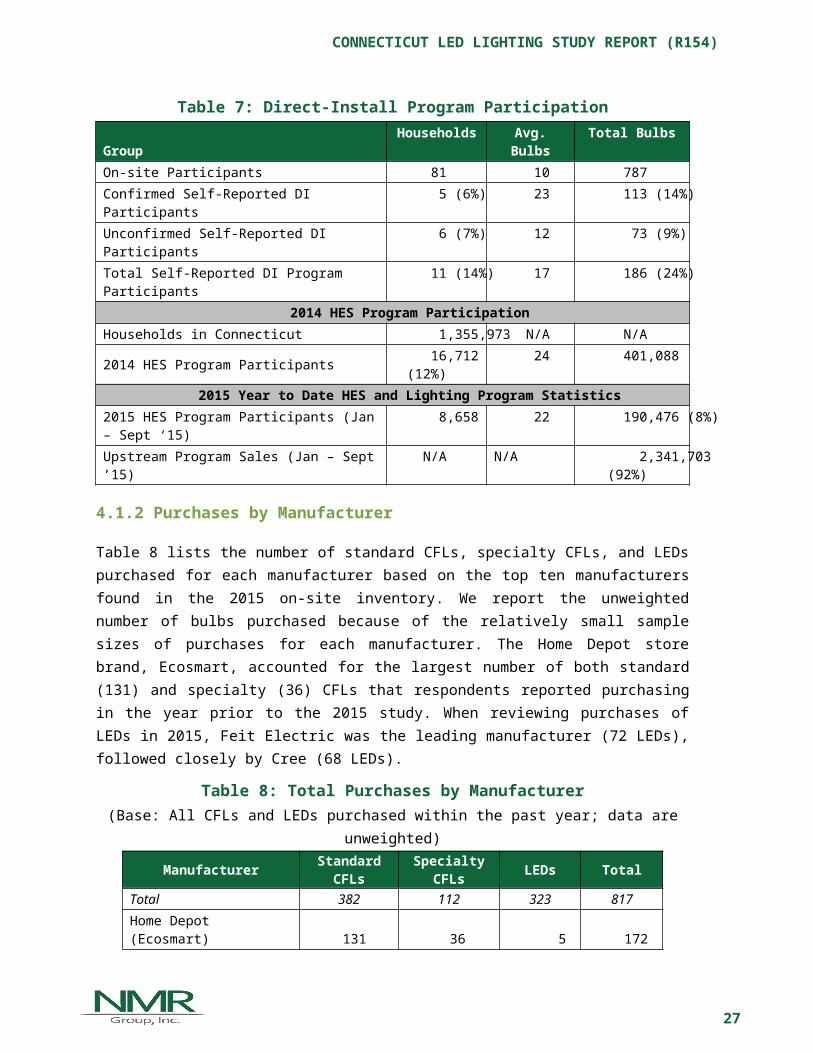
Table 7: Direct-Install Program ParticipationGroup Households Avg. Bulbs Total BulbsOn-site Participants 81 10 787Confirmed Self-Reported DI Participants 5 (6%) 23 113 (14%)Unconfirmed Self-Reported DI Participants 6 (7%) 12 73 (9%)Total Self-Reported DI Program Participants 11 (14%) 17 186 (24%)
2014 HES Program ParticipationHouseholds in Connecticut 1,355,973 N/A N/A2014 HES Program Participants 16,712 (12%) 24 401,088
2015 Year to Date HES and Lighting Program Statistics2015 HES Program Participants (Jan – Sept ‘15)
8,658 22 190,476 (8%)
Upstream Program Sales (Jan – Sept ’15) N/A N/A 2,341,703 (92%)
4.1.2Purchases by Manufacturer
Table 8 lists the number of standard CFLs, specialty CFLs, and LEDs purchased for each manufacturer based on the top ten manufacturers found in the 2015 on-site inventory. We report the unweighted number of bulbs purchased because of the relatively small sample sizes of purchases for each manufacturer. The Home Depot store brand, Ecosmart, accounted for the largest number of both standard (131) and specialty (36) CFLs that respondents reported purchasing in the year prior to the 2015 study. When reviewing purchases of LEDs in 2015, Feit Electric was the leading manufacturer (72 LEDs), followed closely by Cree (68 LEDs).
Table 8: Total Purchases by Manufacturer(Base: All CFLs and LEDs purchased within the past year; data are unweighted)
Manufacturer Standard CFLs
Specialty CFLs LEDs Total
Total 382 112 323 817Home Depot (Ecosmart) 131 36 5 172Feit Electric 31 4 72 107Lumacoil 27 3 0 30GE 23 2 1 26Utilitech 18 0 2 20Philips 11 9 50 70Cree 9 11 68 88Maxlite 9 22 0 31TCP 2 0 24 26Simply Conserve 85 22 63 170Don’t know 36 3 38 77
4.2 BULB REPLACEMENTSDuring the on-site visits, for installed CFLs or LEDs identified as having been purchased within the past year, homeowners were asked what bulb type the newly purchased bulb had
21

CONNECTICUT LED LIGHTING STUDY REPORT (R154)
replaced. As a point of comparison, we provide data from a panel study conducted in Massachusetts in 2015; in Connecticut, the data are self-reported, whereas in the Massachusetts study, bulb changes were matched to the previous year’s data and are, therefore, more reliable.
In Connecticut, the majority (81%) of newly installed CFLs replaced incandescents, followed by 13% filling sockets in new fixtures, and 6% replacing other CFLs. In Massachusetts, the most common bulb type replaced was still incandescents, though at a significantly lower percentage than what was self-reported in Connecticut. Another significant difference is that one-third of newly installed CFLs in Massachusetts replaced other CFLs.
When looking at newly installed LEDs, the most common bulb type replaced was, again, incandescents (45%), though this was followed closely by CFLs (38%). The Massachusetts data showed similar results, with 54% of LEDs replacing incandescents and 22% replacing CFLs. This is not surprising considering the strong preference for LEDs over CFLs shown in Table 5.
Figure 18: Replaced Bulbs 2015, CT and MA(Base: CFLs and LEDs that replaced installed bulbs; excluding self-reported direct-install
bulbs, new fixtures, and empty sockets)
22

CONNECTICUT LED LIGHTING STUDY REPORT (R154)
New CFLs or LEDs were installed in a combined total of 596 sockets during the year prior to the study. Based on self-reported responses for what bulb type and wattage had been replaced by CFLs or LEDs purchased within the past year, we calculated the estimated delta watts for newly installed CFLs to be 40.6, and the average delta wattage of LEDs was 26.9.
Looking closely at the type of bulb the CFLs and LEDs replaced, it is clear that most of the drop in wattage came from replacing incandescent bulbs with CFLs or LEDs. The average delta wattage of newly installed LEDs is lower than that of newly installed CFLs due to the fact that two out of five (43%) new LEDs replaced CFLs.
These calculations, however, rely solely on self-reported data; participants were not only asked to recall whether a CFL or LED had been purchased within the past year, they were also asked to recall the bulb type and wattage it had replaced. When compared to the Massachusetts panel study, where actual observed bulb changes from 2014 to 2015 were recorded, these average changes in wattages were very different: for CFLs, 41 delta watts in Connecticut vs. 28 delta watts in Massachusetts; for LEDs, 27 delta watts in Connecticut vs. 38 delta watts in Massachusetts (Table 9). Given the nature of self-reported data, we place greater faith in the Massachusetts findings. In addition, we note that even actual observed delta watts offer only a snapshot of history and do not factor in changes in market conditions.
Table 9: Delta Watts by Bulb Type for Past Year(Base: CFLs and LEDs that replaced installed bulbs; excluding self-reported direct-install
bulbs, new fixtures, and empty sockets)
Bulb Type Replaced
Newly Installed BulbsCFLs LEDs
n New CFLsAvg Delta
Watts n New LEDsAvg Delta
WattsTotal Replaced Bulbs 332 41 264 27Incandescent 309 93% 44 135 51% 48Fluorescent 1 <1% 26 3 1% 3Halogen 0 - 0 11 4% 32CFLs 22 7% 0 114 43% 3LED Bulb 0 N/A N/A 1 <1% 0
23
CONNECTICUT LED LIGHTING STUDY REPORT (R154)
4.3 CONSUMER SURVEY SELF-REPORTED PURCHASE BEHAVIORWe also asked customers about general purchasing habits in the consumer survey. To aid with recall, we limited questions to the past six months.14 More than two-thirds (67%) of consumer survey respondents recalled purchasing bulbs within six months prior to the study. More than one-half (55%) had purchased screw-base CFLs, and nearly two-fifths (37%) had purchased screw-base LEDs. Approximately one-half (48%) reported purchasing incandescent bulbs, which further adds to the growing body of evidence suggesting that the implementation of EISA has not completely eroded the market for incandescent bulbs (Table 10).
Table 10: Bulbs Purchased in the Past Six Months15
(Base: Respondents who reported having purchased bulbs in the past six months; multiple response)
Bulb Type Consumer SurveySample Size 100CFLs (screw-base) 55%Incandescents 48%LEDs (screw-base) 37%Fluorescents 21%Halogens 19%CFLs (pin-base) 8%LEDs (pin-base) 8%Other 1%
4.4 CONSUMER UNDERSTANDING OF LIGHTING INFORMATIONWhen asked what information they looked for on bulb packaging to help them decide which bulb to purchase, only 5% of all respondents mentioned looking for the lighting facts/energy facts label without being prompted. However, when those who had not mentioned it were asked directly if they refer to the lighting facts/energy facts label when deciding which bulb to purchase, one-half reported that they did (Table 11).
Table 11: Use of Lighting/Energy Facts Label(Base: Respondents who did not self-report using the Energy Facts Label)
Consumer SurveySample Size 144Yes 49%No 51%Don’t know 1%
14 During the on-site visits, we asked customers about purchasing behavior during the past six months, the past year, and the period before the past year. 15 We have found over multiple studies across several states that self-reported responses are not accurate when compared to what is found installed in the home. For example, comparing Table 10 responses to responses from CFL and LED purchases reported during on-site visits, only 35% had purchased at least one screw-base CFL within the past six months, and only 26% had purchased at least one LED.
24
CONNECTICUT LED LIGHTING STUDY REPORT (R154)
All respondents were asked to list what information they look for on bulb packaging when making bulb purchasing decisions. Overall, consumers were still referring to wattage (63%) and price (37%) above all when considering which bulb to purchase. Markedly, one in four (25%) reported considering bulb energy use/energy efficiency (Figure 19).
Figure 19: Information Looked for on Bulb Packaging(Base: All Respondents; Multiple Response)
25

CONNECTICUT LED LIGHTING STUDY REPORT (R154)
In an effort to assess respondents’ knowledge of the market, all were asked to define both lumens and cool white and warm white. Just over one-half (54%) of all consumer survey respondents had heard the term lumens in relation to lighting. When asked what the term meant, four out of five (80%) said that lumens refers to light output or brightness. The second most common answer, “Don’t know,” was given by nearly one out of five (17%) respondents (Table 12).
Table 12: Lumens(Base: Respondents who had heard of lumens; multiple response)
Definition of lumensConsumer
SurveySample Size 82Light Output or Brightness 80%Same as Watts 6%Other 4%Light Color 2%Don’t know 17%
Seventy percent of respondents had heard the terms warm white and cool white in reference to lighting. As shown in Table 13, most respondents were able to assign meaning to each term, while some were more vague and general in their responses. The most common response was to associate each term with the color the bulb emits, with just under one-third (31%) assigning a white/blue color to cool white and a yellow/orange/red color to warm white. One-fifth thought that cool white was brighter, while warm white was more comfortable or “soft.”
Table 13: Understanding of Warm White/Cool White(Base: Respondents who had heard of warm white/cool white; multiple response)
Definition of cool white/warm whiteConsumer
SurveySample Size 98Cool white is white/blue color; warm with is yellow/red/orange color 31%Cool white is brighter; warm white is comfortable/soft 20%Related to bulb brightness/intensity 16%Related to bulb temperature/heat coming from bulb 10%Warm white is brighter and more natural 9%Cool white is a lighter white; warm white is a darker white 7%Related to color or mood 7%Other 5%Don’t know 3%
26

CONNECTICUT LED LIGHTING STUDY REPORT (R154)
Section 5: Storage BehaviorSixty-five of the 81 homes (80%) visited for the 2015 on-site study had bulbs in storage. In this section, we explore trends in storage behavior across time in Connecticut as well as in-service rates—i.e., the percentage of CFLs and LEDs bulbs that were newly purchased and installed within the past year.
While incandescent bulbs were still the most commonly stored bulb type, they have begun to show signs of losing ground to CFLs, which have increased.
Most bulbs were being stored for future use, though 15% of incandescent bulbs were reportedly earmarked for disposal.
Newly purchased LEDs were installed at a much quicker rate than newly purchased CFLs.
While more than one-half (52%) of visited homes had incandescent bulbs in storage, this percentage has decreased by eleven points since 2012. Conversely, the percentage of energy-efficient bulbs in storage has increased by nine points, from 34% in 2012 to 43% in 2015 (Table 14). When looking at the reason for storing bulbs, more than nine out of ten (92%) energy-efficient bulbs were in storage for future use, while just over eight out of ten (84%) inefficient bulbs were in storage for future use; homeowners planned to throw out or recycle, did not plan to use, or did not have plans for 15% of the inefficient bulbs.
For select incandescent bulbs in storage that are no longer being manufactured—60-, 75-, and 100-watt bulbs—homeowners were asked if they had purchased and stored these bulbs because they were no longer being manufactured. Somewhat alarmingly, 14 on-site participants (17%) said they were stockpiling incandescent bulbs because they are no longer being manufactured, accounting for 40% of stored 60-, 75-, and 100-watt incandescents. This is a high proportion of homes reporting stockpiling bulbs. In fact, over the past two years across four states, NMR has only identified a total of 13 self-identified stockpilers among hundreds of on-site visits.
In 2015 in Massachusetts and New York, none of the new on-site participants was identified as a stockpiler.
In 2014, o 4% of Massachusetts on-site participants (10 homes) were identified as stockpilers. o 3% of Georgia on-site participants (2 homes) were identified as stockpilers.o 2% of Kansas on-site participants (1 home) were identified as stockpilers.
Saturation among stockpilers in Connecticut in 2015 is slightly different from that of the overall sample, with 53% non-energy-efficient bulb saturation (vs. 44% overall), and 48% efficient bulb saturation (vs. 56% overall). One home was labeled as an outlier, accounting for more than one-half (54%) of stockpiled bulbs and 17% of all stored bulbs. This outlier was removed for the analysis in Table 14.
5
27

CONNECTICUT LED LIGHTING STUDY REPORT (R154)
Table 14: Stored Bulbs by Bulb Type over Time2012 2013 2015*
Sample Size 100 90 80Total Stored Bulbs 1,995 1,169 1,214Avg. # of Stored Bulbs 5 13 15Median 4 4 8Incandescent 63% 61% 52%CFLs 30% 27% 35%Fluorescent 4% 3% 4%Halogen 4% 9% 5%LED <1% 1% 4%Other 0% 0% <1%
*One outlier was removed for this analysis.
5.1 IN-SERVICE RATESNewly purchased CFLs and LEDs have a combined first-year in-service rate of 84%. When looking at the first-year in-service rate by bulb type, Figure 20 shows that newly purchased LEDs are being installed at a faster rate than CFLs. More than eight out of ten (76%) CFLs purchased within the past year were installed, while nearly all (95%) newly purchased LEDs were installed.
For reference, the average first-year in-service rate reported in the Unified Methods Project (UMP)16 is 79%; while the CFL installation rate is nearly identical to this (76%), the in-service rate for LEDs found in the Connecticut 2015 on-site study is significantly higher (95%). This offers evidence that consumers are more likely to install LEDs within the first year compared to CFLs, possibly due to higher levels of satisfaction with LEDs (Table 4), higher prices, and smaller pack sizes.
Figure 20: First Year In-Service Rate for Newly Purchased CFLs and LEDs
(Base: All bulbs purchased within the past year; excludes self-reported direct-install bulbs)
16 http://www.nrel.gov/extranet/ump/pdfs/20140514_ump_res_lighting_draft.pdf
28
CONNECTICUT LED LIGHTING STUDY REPORT (R154)
Section 6: EISA Coverage, Exemptions, and Exclusions
This section looks at installed bulbs in the context of EISA. By categorizing each bulb as covered by EISA, exempt from EISA, or excluded from the EISA scope, NMR was able to assess EISA’s impact on current bulb installation.
Just over one-half (56%) of installed Connecticut bubs were covered by EISA; the remaining 44% were either non-general service bulbs or exempt from EISA.
NEEP’s review of shelf stocking studies showed that just over one-third (36%) of bulbs currently being sold are covered by EISA.
The Northeast Energy Efficiency Partnerships (NEEP) recently issued a report looking at the residential lighting market in the Northeast in the context of EISA.17 The purpose of the report was to determine if the residential lighting market has been transformed, where the market is heading, and if there is a role for residential lighting programs in the future. As part of the NEEP assessment, residential lighting was grouped into the following categories in order to increase understanding of the proportion of bulbs covered by the EISA rulemaking:
General Service (covered by EISA) General Service (exempt from EISA) Non-General Service Lighting (excluded from EISA scope)18
NMR wanted to look at installed bulbs in Connecticut in this context as well in order to specifically assess the proportion of bulbs currently installed that are covered by EISA. In order to group the on-site data collected into categories, we used the flow chart in Figure 21 prepared by Apex Analytics. Any bulbs that were not covered in this flow chart were categorized as Non-General Service Bulbs.
17 NEEP, The State of Our Sockets: A Regional Analysis of the Residential Lighting Market, 2015. http://www.neep.org/sites/default/files/resources/StateOfOurSocketsFinal_0.pdf 18 The R154 study excluded appliance lights and non-permanent holiday lights.
6
29
CONNECTICUT LED LIGHTING STUDY REPORT (R154)
Figure 21: EISA Categories19
Figure 22 shows installed bulbs in Connecticut homes in 2015 grouped into three categories: covered by EISA, exempt from EISA, or excluded from EISA rulemaking. Over one-half (56%) of installed bulbs were general service (covered by EISA) bulbs.20 Figure 23 shows the results of the NEEP analysis as presented in its report. The NEEP analysis found that just over two-thirds (36%) of available bulbs were general service (covered by EISA).
The differences in findings between the two studies can be explained by differences in methodology. The analysis for this study (R154) covers currently installed bulbs based on lighting inventory data collected in the field, whereas the NEEP estimates cover bulbs available for purchase (and not sales weighted) based on secondary research from recently completed shelf-stocking surveys. Shelf-stocking surveys provide helpful insights in understanding what choices customers will face when purchasing bulbs in the near future, while lighting inventories provide a snapshot of currently installed bulbs. In addition, on-site lighting inventories are not able to fully capture the installation of exempt bulbs in sockets that are nearly indistinguishable from similar EISA covered bulbs, such as rough service lamps, shatter-resistant lamps, and vibration service lamps. Future studies may want to collect data on all recently purchased bulbs; this may offer better insight into whether or not households are purchasing EISA-exempt bulbs.
19 This flow chart was created by Apex Analytics.20 Examining the breakdown for currently installed inefficient bulbs alone reveals a similar breakdown: 54% covered by EISA, 21% exempt from EISA, and 26% non-general service bulbs.
30

CONNECTICUT LED LIGHTING STUDY REPORT (R154)
Figure 22: Connecticut (R154) Installed Bulbs by EISA Category
Figure 23: NEEP Residential Lighting Product Breakdown21
21 NEEP, The State of our Sockets: A Regional Analysis of the Residential Lighting Market, 2015. http://www.neep.org/sites/default/files/resources/StateOfOurSocketsFinal_0.pdf
31

CONNECTICUT LED LIGHTING STUDY REPORT (R154)
Section 7: Remaining Potential Energy Savings
One of the goals of this study was to update the residential energy potential for energy-efficient lighting in Connecticut. To do this, NMR combined findings from the recent Northeast Residential Lighting Hours of Use (HOU) study completed in 2014 with the Connecticut data
collected in 2015.22 This section looks at current energy usage in Connecticut homes by room type as well as the potential savings that remain available in residential lighting.
Overall, while inefficient bulb types fill less than one-half of the sockets in Connecticut homes (44%), they are responsible for two-thirds (67%) of the energy used by lighting in these homes.
If all inefficient sockets were changed to CFLs, Connecticut homes could potentially save 1,045 kWh per household.
If all inefficient sockets were changed to LEDs, Connecticut homes could potentially save 1,133 kWh per household.
The remaining potential savings that could be achieved by replacing inefficient sockets with CFLs or LEDs is nearly equal to that of already achieved savings.
7.1 ENERGY SAVINGS POTENTIALNMR calculated potential savings for four scenarios to help illustrate the remaining potential in the residential lighting market.
1. Incandescent-land – annual household energy usage if all screw-base bulbs were incandescent.
2. Current market – energy usage today based on actual current lighting inventories. 3. CFL-land – annual household energy usage if all currently installed inefficient bulbs
were replaced with CFLs. 4. LED-land – annual household energy usage if all currently installed inefficient bulbs
were replaced with LEDs.
The first scenario, Incandescent-land, was calculated by replacing all screw-base CFLs and LEDs with screw-base incandescents; linear fluorescents and non-screw-base bulbs were not changed. This scenario allowed us to imagine what residential lighting energy usage would be today if efficient bulbs had never been introduced to the market.
To create the third and fourth scenarios, each inefficient bulb’s wattage was replaced with the equivalent replacement wattage of a CFL or LED. This allowed us to imagine a situation where all bulbs installed in the home were efficient. Using the all-bulb HOU23 in Table 15, we could then look at what energy use would be if all bulbs were efficient and estimate the potential savings from reaching 100% efficient socket saturation. In these two scenarios,
22 NMR, Northeast Residential Lighting Hours-of-Use Study, 2014. http://tinyurl.com/TimelessHOU23 Based on the assumption that efficient HOU will approach the all bulb HOU estimate over time as saturation approaches 100%.
7
32

CONNECTICUT LED LIGHTING STUDY REPORT (R154)
there is still a large amount of potential savings per household. LED-land shows the largest amount of potential savings available, with a reduction of 1,133 kWh per household possible—an amount nearly equal to all savings realized to date in the current market.
Figure 20: HOU and Energy Savings Potential
7.2 CALCULATING POTENTIAL SAVINGSTable 15 shows the overall HOU estimates broken out by type of bulb (inefficient vs. efficient vs. all bulbs) and by room type. The 2014 study showed that the HOU vary by room type and type of bulb; therefore, NMR chose to use these values for a more accurate estimate.
Table 15: HOU Values for Efficient and Inefficient Bulb Types by Room Type
Room Type Inefficient Efficient All BulbBathroom 1.4 2.1 1.7Bedroom 1.8 2.4 2.1Dining Room 2.5 2.9 2.8Exterior 5.3 5.7 5.6Kitchen 3.7 4.3 4.1Living Space 3.0 3.3 3.3Other 1.4 2.0 1.7
33

CONNECTICUT LED LIGHTING STUDY REPORT (R154)
To determine potential energy savings, NMR categorized each installed bulb as efficient (CFL, LED, or Fluorescent) or inefficient. Using these categories, each bulb’s wattage was multiplied by the HOU values displayed in Table 15. These values were multiplied by 365 to get HOU per year for each bulb and divided by 1,000 to reach kWh per year by room type and bulb type (inefficient or efficient). These values were then averaged on the household level (divided by n=81).
Table 16 shows the current hours of use by room type in Connecticut. Overall, while inefficient bulb types fill the less than one-half (44%) of the sockets in Connecticut homes, they are responsible for two-thirds (67%) of the energy used by lighting in these homes. When looking at hours of use by room type, dining rooms have the highest rate of inefficient bulb saturation, which account for nearly all (91%) of the energy used in this room type. The only room type where efficient bulbs are responsible for more of the energy used than inefficient bulbs is Other.
Table 16: HOU by Bulb Type and Room Type – Current Market
Room TypeInefficient
Avg. KwHOU/ HH % HOU % Saturation Avg. SocketsHousehold 1,351 67% 44% 27Dining Room 112 91% 78% 3Exterior 473 84% 54% 3Living Space 192 69% 46% 3Bedroom 137 64% 44% 4Bathroom 84 62% 41% 3Kitchen 145 57% 36% 2Other* 208 47% 37% 8
Room TypeEfficient
Avg. KwHOU/ HH % HOU % Saturation Avg SocketsHousehold 655 33% 59% 35Dining Room 12 9% 46% 1Exterior 88 16% 64% 2Living Space 85 31% 63% 4Bedroom 78 36% 22% 5Bathroom 52 38% 56% 5Kitchen 109 43% 54% 4Other 231 53% 56% 13
* Other includes basements, closets, foyers, garages, hallways, offices, utility rooms, and other room types.
34

CONNECTICUT LED LIGHTING STUDY REPORT (R154)
Section 8: DemographicsThe demographic information was collected over the phone through the consumer survey. Connecticut census data comes from the 2014 American Community Survey (ACS) 1-year Estimates; we provided census data in comparison to the consumer survey and on-site participant sample when it was available.
Overall, the consumer survey and on-site visit participant samples were similar to the Connecticut population.
While some categories were significantly different (single-family homes, respondents in the 55-65 year age range, etc.), the majority were comparable.
The on-site participant sample was very similar to the consumer survey, indicating that there was not a lot of shift in demographics between the survey and the actual visits.
Home Type: More than seven out of ten (71%) on-site participants lived in single-family households, which are defined in this study as residential buildings with one to four units, including single-family detached and single-family attached homes. This is significantly different from the Connecticut 2014 ACS 1-year estimates, which show that more than eight out of ten (82%) of homes in the state are single-family.
Tenure: More than two-thirds (68%) of on-site participants owned their homes, while only one-third (32%) were renters.
Income: The majority (65%) of the on-site sample were not low-income households.
Home Size: Nearly six out of ten (59%) on-site participants reported that their homes were smaller than 2,000 square feet.
When Built: Almost one-quarter (23%) of the homes that participated in the 2015 on-site study were built in the 1960s, which is significantly different from the 14% statewide built during the same period.
Education: The most common level of education achieved among on-site participants was a bachelor’s degree or higher (49%), followed by high school graduate (includes GED; 25%).
Number of Rooms: Not including bathrooms, nearly one out of five homes (19%) in the on-site sample had four rooms.
Number of People: More than one-third (37%) of participants were two-person households.
Age: Nearly one out of three participants were between 55 and 64 years old, which is significantly more than the population found statewide in this age group.
8
35

CONNECTICUT LED LIGHTING STUDY REPORT (R154)
36

CONNECTICUT LED LIGHTING STUDY REPORT (R154)
37

CONNECTICUT LED LIGHTING STUDY REPORT (R154)
Appendix A MethodologyIn this appendix, we provide methodological details concerning the R154 study, including the consumer survey, the on-site saturation survey, comparison area data collection, weighting schemes, and interpolation of data for missing data points.
A.1 CONSUMER SURVEYFor the 2015 R154 study, the telephone survey screened respondents by asking them if they would participate in the on-site part of the study. If the respondent agreed, the interview would continue; if he or she did not agree, the call was terminated. This differed from previous evaluations in Connecticut conducted in 2009, 2012, and 2013. In the past, NMR relied on a study design approach in which we first called randomly selected customers of Eversource and UI to conduct a telephone survey that explored various lighting- and EISA-related issues. At the end of the telephone survey, the interviewer offered each respondent an incentive to participate in an on-site visit to his or her home that would be used to gather more information about that household’s lighting use. The change in methodology in 2015 was driven by budgetary needs.
In all years, NMR randomly selected households from among all respondents voicing interest in participating and called to set up on-site visits.
A.2 ON-SITE SATURATION SURVEYFor the 2015 R154 study, NMR completed 81 on-site lighting inventory visits. In addition, in this report we have incorporated the results of on-site visits completed in 2009 (95 visits), 2012 (100 visits), and 2013 (90 visits). Sampling methods varied slightly across the studies, with the 2013 sample designed to secure comparable numbers of single-family and multifamily homes.
In each wave of on-sites, NMR or its subcontractor employed and trained technicians to conduct the on-site data collection. A typical on-site visit proceeded as follows: A technician arrived at the home at a pre-scheduled time, introduced him- or herself, and asked for the contact person who had been identified when scheduling the visit. The technician then walked through each room of the home (including the home’s exterior and exterior structures), examining all lighting sockets and gathering data on fixture type, bulb type, bulb shape, socket type, wattage, and specialty characteristics for all installed lighting products. The technician also examined bulbs in storage, again noting similar detailed information on each type of bulb, and asked the householder specific questions regarding the house’s lighting. In the 2013 study, technicians also installed time-of-use light meters (loggers); additional detail on the loggers is included in the Northeast Residential Lighting Hours-of-Use Study.24
24 NMR, Northeast Residential Lighting Hours-of-Use Study, 2014. http://tinyurl.com/TimelessHOU
A
A1

CONNECTICUT LED LIGHTING STUDY REPORT (R154)
Starting in 2012, in addition to closely reviewing the on-site data submitted by the technicians, NMR began to collect data directly instead of through subcontractors. In addition, as an extra level of quality control, NMR began calling 20% of participants to ensure that their experiences with the field technician were satisfactory and revisited approximately 5% of the homes, repeating the data collection process to ensure that the highest quality data was collected.
A.2.1 Comparison Area Data CollectionIn addition to examining Connecticut-specific lighting inventory data, this report explores the saturation of energy-efficient residential lighting products in Connecticut over time in reference to six comparison areas: Massachusetts, New York, Maine, Rhode Island, Georgia and Kansas. NMR focused on these particular comparison areas for a number of reasons, including the availability of prior saturation estimates that allowed us to look at a time series of data, but also because they display varying levels of lighting program activity. Georgia recently began providing incentives for CFLs and LEDs (earlier it had focused on education and small promotions or bulb giveaways), whereas Kansas is a non-program-activity comparison area not currently or historically providing incentives for efficient lighting. Massachusetts continues to provide incentives for standard CFLs, specialty CFLs, and LEDs; New York, on the other hand, ceased standard spiral CFL incentives in 2012 and gradually removed any remaining specialty and LED incentives by the second half of 2014. In this way, NMR could consider the impact of differing levels of program support on changes in efficient bulb saturation. We compare the prior Connecticut data to those collected from these four states between 2009 and 2015.
While we present data from nine comparison areas, NMR believes that the data from Massachusetts and New York offer the most pertinent comparisons. Massachusetts has the longest uninterrupted time series of lighting data in the nation and continues to offer comparable programs to Connecticut; New York offers a unique natural experiment because of the recent withdraw of residential lighting programs in that state. California is another good source, but the data are sparse and the last available data are from 2012—which, given the rapid pace of change in the market, might not reflect the current status of lighting in California.
A.3 WEIGHTING SCHEMENMR weighted the 2015 on-site data to reflect the population proportions for tenure and home type in Connecticut based on the American Community Survey (ACS) 2014 1-year Estimates. The guiding principles behind the scheme are as follows:
To maintain comparability to previous schemes dating back to 2009 To reflect the 2015 population of Connecticut
Due to the limited number of multifamily owner-occupied housing units in the sample, the scheme combined owner-occupied housing units into one group, but split renter-occupied units into single-family and multifamily. The consumer survey was weighted in the same
A2

CONNECTICUT LED LIGHTING STUDY REPORT (R154)
manner in order to maintain consistency. The 2015 weights used are shown in Table 17. Weighting schemes from prior Connecticut studies are shown in Table 18 below.
Table 17: 2015 Connecticut On-Site Visits Weighting Scheme
Tenure and Home Type Households Sample SizeProportionate
WeightSample Error
On-Site Visits OnlyTotal 1,355,973 81 n/a 9.6%Owner-Occupied Housing Units 917,074 56 0.97 11.1%Renter-Occupied Housing Units Single Family 87,430 10 0.52 27.4% Multifamily 351,469 15 1.40 22.0%Consumer SurveyTotal 1,355,973 151 n/a 7.1%Owner-Occupied Housing Units 917,074 106 0.96 8.0%Renter-Occupied Housing Units Single Family 87,430 20 0.49 18.9% Multifamily 351,469 25 1.57 16.8%
Table 18: Connecticut Weighting Schemes 2009-2013Year Tenure and Home
TypeHousehold
sSample
SizeProportionate
Weight Sample Error
2009
Total 1,326,092 95 9.9%Owner-Occupied 917,097 76 0.86 9.5%Renter-Occupied***
Single Family** 76,331 10 0.55 27.4%Multifamily 332,664 9 2.65 29.1%
2012
Total 1,355,973 100 11.5%Owner-OccupiedSingle Family 821,275 81 0.75 9.2%Multifamily 95,799 6 1.18 36.8%Renter-OccupiedSingle Family 87,430 7 0.92 33.6%Multifamily 351,469 6 4.32 36.8%
2013
Total 1,355,973 90 9.8%Owner-OccupiedSingle Family 821,275 34 1.60 14.3%Multifamily 95,799 14 0.45 22.8%Renter-Occupied***
Single Family 87,430 11 0.53 26.0%Multifamily 351,469 31 0.75 15.0%
* Includes one “Occupied without payment or rent.”** Includes one “Don’t know.”
A3

CONNECTICUT LED LIGHTING STUDY REPORT (R154)
A.4 INTERPOLATION OF 2010, 2011, AND 2014 Because saturation studies were not conducted in Connecticut in 2010, 2011, or 2014, NMR interpolated saturation for these years based on the 2009, 2012, 2013, and 2015 on-site data. We used straight line interpolation to provide estimates for missing years. This interpolation is provided in order to aid tracking trends over time in Connecticut and across comparison areas for which data collection time periods do not align.
A4