connecticut cable transient and harmonic study for · pdf filenu phase 2 final report.doc...
TRANSCRIPT

GE Power Systems Energy Consulting i NU Phase 2 Final Report.doc
Connecticut Cable Transient and Harmonic Study for Phase 2
Final Report November 2003 Prepared for: Northeast Utilities
Dated: September 24, 1999
__________________________________________________________________________________________________________
GE Power Systems Energy Consulting NU Phase 2 Final Report.doc
Connecticut Cable Transient and Harmonic Study for Phase 2
Final Report November 2003
Principal Contributors: Goran Drobnjak
Murray A. Eitzmann Sang Y. Lee
Elizabeth R. Pratico Reigh A. Walling
Power Systems Energy Consulting General Electric International, Inc.
One River Road Schenectady, NY 12345 USA
___________________________________________________________________________________________________________
GE Power Systems Energy Consulting i NU Phase 2 Final Report.doc
Foreword
This document was prepared by General Electric International, Inc. (GEII) acting through its Power Systems Energy Consulting (PSEC) located in Schenectady, New York. It is submitted to Northeast Utilities (NU). Technical and commercial questions and any correspondence concerning this document should be referred to:
Elizabeth R. Pratico Power Systems Energy Consulting General Electric International, Inc.
1 River Road Building 5, Room 310
Schenectady, New York 12345 Phone: (518) 385-5624 Fax: (518) 385-2860
E-mail: [email protected]
GE Power Systems Energy Consulting ii NU Phase 2 Final Report.doc
Legal Notice
This report was prepared by General Electric International, Inc.’s Power Systems Energy Consulting as an account of work sponsored by Northeast Utilities (NU). Neither NU nor PSEC, nor any person acting on behalf of either:
1. Makes any warranty or representation, expressed or implied, with respect to the use of any information contained in this report, or that the use of any information, apparatus, method, or process disclosed in the report may not infringe privately owned rights.
2. Assumes any liabilities with respect to the use of or for damage resulting from the use of any information, apparatus, method, or process disclosed in this report.
GE Power Systems Energy Consulting iii NU Phase 2 Final Report.doc
Table of Contents
EXECUTIVE SUMMARY E-1 STUDY OBJECTIVES E-1 CONCLUSIONS AND RECOMMENDATIONS E-1
1. INTRODUCTION 1-1
2. STUDY APPROACH 2-1
3. SYSTEM MODEL 3-1
4. HARMONIC ANALYSIS 4-1 DRIVING-POINT IMPEDANCE 4-1 AMBIENT HARMONIC VOLTAGE DISTORTION 4-6
5. SWITCHING TRANSIENT ANALYSIS 5-1 SWITCHGEAR CONSIDERATIONS 5-1 SURGE ARRESTER CONSIDERATIONS 5-11 115 KV EQUIPMENT DUTY AND POWER QUALITY 5-15
6. CONCLUSIONS AND RECOMMENDATIONS 6-1
APPENDIX A – DRIVING-POINT IMPEDANCE PLOTS A-1
APPENDIX B – POWER QUALITY ANALYSIS PLOTS B-1
APPENDIX C – SWITCHING SIMULATION CASE PLOTS C-1

GE Power Systems Energy Consulting E-1 NU Phase 2 Final Report.doc
Executive Summary
Study Objectives
GE Power Systems Energy Consulting (PSEC) has performed several switching transient and harmonic studies of the Northeast Utilities (NU) Phase 1 and Phase 2 345 kV transmission cable project that is proposed in southwestern Connecticut. These included a feasibility study of Phase 1 and Phase 2 and a switching transient and harmonic design study for the Phase 1 cable project. Another study was performed to further analyze the Phase 1 Configuration X′, in particular the effect of pre-insertion resistor size (Part 1) and the impact of the Phase 2 additions on the Phase 1 switching transient and harmonic performance (Part 2).
The focus of this study was to further analyze switching transients and harmonic characteristics of the system with the Phase 2 cable addition (Part 3 of the additional workscope). The objective of the study was to investigate the harmonic impacts of the cable addition and evaluate switching transients with particular emphasis on equipment duty and power quality.
The study has been performed with the Electromagnetic Transients Program (ATP/EMTP), which is recognized as an industry standard for simulating the transient performance and frequency response of electric utility systems [www.emtp.org].
The following Northeast Utilities expectations were used as the fundamental principles guiding the performance of this study:
• Goal of Phase 2 project is to transfer power to southwestern Connecticut without
o presenting undue risk of equipment damage due to planned and reasonably foreseeable unplanned events and operation,
o resulting in unacceptable power quality, and
o generating harmonic voltage distortion beyond established guideline limits, or which have a detrimental effect on NU customer loads.
• Provide guidance for purchasing decisions
o Circuit breakers – uncontrolled, pre-insertion resistors, or synchronous closing
o Surge arrester ratings
• Utilize a clear methodology to produce defendable study results
Conclusions and Recommendations
With the appropriate selection of equipment and implementation of operating practices, Phase 2 can be operated consistent with Northeast Utilities’ expectations for transient and harmonic distortion impact.

GE Power Systems Energy Consulting NU Phase 2 Final Report.doc E-2
Controlled closing is necessary for all 345 kV circuit breakers in Phase 2 substations where 345 kV cables are terminated (Norwalk, Singer, and Devon). Use of uncontrolled closing in these breakers can result in significant degradation of power quality, and potential exposure of utility and customer system equipment to damaging overvoltages. Such consequences, as a result of routine cable and transformer switching, are unacceptable.
Implementation of controlled closing by applying circuit breakers with resistor preinsertion provides a universal and robust solution, useable at all Phase 1 and Phase 2 345 kV breaker positions. Synchronous closing is an alternative which can be applied at Singer, and at Devon with limitations. Synchronous breakers used to energize cables need to be programmed for voltage-zero switching, and those used to energize transformers must be programmed for voltage-peak switching to minimize magnetic inrush. The proposed substation configuration for Singer facilitates assigning different breakers these disparate functions. At Devon, similar assignment of functionality requires more complex solutions to accommodate single-breaker unavailability situations. These solutions include dynamic re-programming of the breaker closing logic, complex and limiting operating procedures, and complex interlocks. For Norwalk, acceptable cable and transformer energization performance is achieved only with resistor preinsertion.
The study has identified situations where Phase 2 operation can impose duties outside of the rated capabilities of 362 kV circuit breakers. Critical fault clearing cases, with sustained voltage across the breaker contacts near 750 kV, exceed test values defined in ANSI C37.06 and should be reviewed with the breaker manufacturer. These cases indicate the need for a higher TOV capability required for the breaker or could possibly be a driver for a higher circuit breaker voltage rating if the manufacturer cannot provide the capability with a 362 kV breaker.
A second situation exposing circuit breakers to exceptional duty is the potential for persistent direct current offset, without sufficient ac component to cause natural current zeros. This can occur when a highly compensated (near 100% compensation) cable is energized at voltage zero, without resistor preinsertion. Existing ac circuit breaker standards do not address the ability to interrupt direct current. Because voltage-zero energization is the objective of synchronous breakers used for cable switching, this can be a significant issue if synchronous closing technology is applied. Therefore, it is essential that, if synchronous closing breakers are to be used to switch Phase 2 cables, the ability of the breakers to interrupt several hundred Amperes of direct current must be confirmed with the breaker manufacturer.
While controlled closing nearly eliminates overvoltage and severe voltage distortion resulting from cable and transformer switching, it can not eliminate overvoltages and distortion resulting from faults and equipment failure, such as circuit breaker restrikes during interruption. For such events, the criterion is that consequential equipment damage or misoperation should not occur. Faults and restrikes cause both transient and temporary overvoltages which appear both locally and sometimes at remote locations in the system. Transient overvoltages on the 345 kV system are limited by 294 kV-rated surge arresters, without exposing these arresters to energy duty in excess of the typical capability of such an arrester. Temporary overvoltages appearing after fault clearing on the Phase 2 system are within the typical withstand capability of this arrester rating.

GE Power Systems Energy Consulting NU Phase 2 Final Report.doc E-3
Fault and restrike events also tend to create overvoltages at locations remote from the fault on the 115 kV system, particularly at capacitor bank locations. Some very high overvoltages were simulated in this study, resulting from the oscillatory transient introduced by application of a 345 kV system fault. The natural-frequency oscillations of the 345 kV cable system appear to interact with the resonance of the 115 kV capacitor banks, greatly amplifying the transient. In the actual system, surge arresters located on the 115 kV system will limit these overvoltages.1 Evaluation of the energy duty imposed on the 115 kV arresters was not within the scope of this study, but should be considered during system design to determine if arresters with greater energy rating should be applied. Phase 2 events, particularly fault clearing, also result in temporary overvoltages on the 115 kV system. The study results should be compared with the temporary overvoltage capability of existing surge arresters, to determine if arresters should be replaced with a higher voltage rating. The older silicon carbide arrester technology is ill-suited for application near large capacitances, and it is recommended that NU review the use of SiC arresters at 115 kV and 345 kV substations located near the Phase 2 system. NU should consider replacement of these arresters with metal-oxide surge arresters, especially at shunt capacitor bank locations.
Although harmonic distortion levels resulting from widely dispersed harmonic sources cannot be precisely predicted, results indicate a significant potential that the planned cable additions could result in voltage distortion levels at individual harmonic orders exceeding accepted limits. The potential problem tends to be concentrated near the 5th harmonic, and is most evident when a large number of 115 kV capacitor banks are in service. Since harmonic resonances and voltage distortion levels are highly dependent on local conditions of capacitor banks in service, and on the generally unknown characteristics of the harmonic current sources dispersed throughout the network, it is difficult to predict with any precision the voltage distortion levels that could exist in Phase 2. For this reason, no specific actions at this time are recommended to NU. If excess distortion does become an observed problem, NU’s options are to de-commission certain capacitor banks, avoid certain capacitor status configurations, or to convert some of the capacitor banks into harmonic filters.
1 Also, damping of the system at the relatively high frequency of this interaction (600 Hz – 1 kHz) may be greater than represented in the simulation model, due to skin effects in the transmission cables and overhead 1ines.

GE Power Systems Energy Consulting NU Phase 2 Final Report.doc 1-1
1. Introduction
GE Power Systems Energy Consulting (PSEC) has performed several switching transient and harmonic studies of the Northeast Utilities (NU) Phase 1 and Phase 2 345 kV transmission cable project that is proposed in southwestern Connecticut. Beginning with a feasibility study of Phase 1 and Phase 21, PSEC studied a configuration that included 89 miles of 345 kV cable between Plumtree, Norwalk, Bridgeport (Singer), Devon, and Beseck and 9 miles of 345 kV cable from Norwalk to Glenbrook. The study results indicated that the cable project has significant harmonic resonance issues, power quality concerns, and potential challenges for equipment duty.
PSEC performed a switching transient and harmonic design study for the Phase 1 cable project2. In this study, a more extensive model of the NU system in southwestern Connecticut was developed to enhance the fidelity of simulations. The Phase 1 project consists of 345 kV cables (about 11 miles) and overhead lines between the existing Plumtree 345 kV substation and a new Norwalk 345 kV substation (Configuration X). The study indicated favorable switching results using circuit breakers equipped with pre-insertion resistors and also showed harmonic resonances near 3rd and 5th harmonics. With moderate existing distortion, the Phase 1 cable addition may result in some individual voltage harmonics somewhat exceeding IEEE Std. 519 guidelines for utilities.
Another study was performed to further analyze the Phase 1 Configuration X′, in particular the effect of pre-insertion resistor size (Part 1) and the impact of the Phase 2 additions on the Phase 1 switching transient and harmonic performance (Part 2)3. In Configuration X′ the cable length increased to about 12 miles, and the shunt reactors were modeled as three variable reactors (75-150 MVAR), rather than five fixed reactors (90 MVAR). The Phase 2 additions consisted of 24 miles of 345 kV cable between Norwalk, Singer, and Devon and 33 miles of overhead line from Devon to Beseck. The study confirmed favorable switching results using circuit breakers with 350Ω pre-insertion resistors, and showed harmonic resonances below 3rd and near 5th and 11th harmonics with the Phase 2 addition. Due to the strengthening of the system at Plumtree and Norwalk with the 345 kV loop through Beseck, the magnitude of the impedance resonances are generally lower with Phase 2 than with Phase 1, however it appears that ambient distortion at 11th harmonic may be amplified in Phase 2. The Phase 2 addition did not have a significant impact on switching transients. Recommendations were made in regard to surge arresters and manufacturer review of fault clearing cases.
The focus of the study, documented in this report, is to further analyze switching transients and harmonic characteristics of the system with the Phase 2 cable addition (Part 3 of the additional workscope). Further details are provided requiring additional changes to the system model. The objective of the study is to investigate the harmonic impacts of the cable 1 Final Report dated March 2003
2 Final Report dated June 2003
3 Final Report dated October 2003
GE Power Systems Energy Consulting NU Phase 2 Final Report.doc 1-2
addition and evaluate switching transients with particular emphasis on equipment duty and power quality.
The study has been performed with the Electromagnetic Transients Program (ATP/EMTP), which is recognized as an industry standard for simulating the transient performance and frequency response of electric utility systems [www.emtp.org].
GE Power Systems Energy Consulting NU Phase 2 Final Report.doc 2-1
2. Study Approach
With an accelerated schedule required to deliver the study results to NU, extra measures were taken to ensure high quality results in this study. Thus, several GE “Six Sigma” quality tools have been utilized in the study methodology. These included Quality Function Deployment (QFD), Failure Modes and Effects Analysis (FMEA), and process mapping.
Study Methodology
The study methodology was centered around the Quality Function Deployment (QFD) model which utilizes a team approach to clearly define customer expectations and identify specific processes to meet those expectations. A team of highly qualified engineers was assembled to perform the study. The team met regularly to discuss the study methodology and analyze simulation results.
The following Northeast Utilities expectations were used as the fundamental principles guiding the performance of this study:
• Goal of Phase 2 project is to transfer power to southwestern Connecticut without
o presenting undue risk of equipment damage due to planned and reasonably foreseeable unplanned events and operation,
o resulting in unacceptable power quality, and
o generating harmonic voltage distortion beyond established guideline limits, or which have a detrimental effect on NU customer loads.
• Provide guidance for purchasing decisions
o Circuit breakers – uncontrolled, pre-insertion resistors, or synchronous closing
o Surge arrester ratings
• Utilize a clear methodology to produce defendable study results
The following processes were identified to meet those customer expectations:
• Harmonic analysis at 345 kV and 115 kV buses around loop
o Calculate driving-point impedance versus frequency including variation of capacitor banks at 115 kV buses
o Calculate voltage distortion at individual harmonics and total harmonic distortion
o Compare harmonic characteristics of Phase 2 with existing system and Phase 1 system
o Evaluate harmonic results using IEEE Std. 519-1992 guidelines for utilities
• Switching transient analysis

GE Power Systems Energy Consulting NU Phase 2 Final Report.doc 2-2
o Simulation cases focused on equipment duty and power quality
o Utilize Failure Modes and Effects Analysis (FMEA) to identify failure scenarios (e.g. faults, stuck breakers, restrike) with a reasonable level of contingencies
o Circuit breaker closing technology for cables and transformers
Various scenarios with uncontrolled closing
Select highest switching transient and TOV cases and repeat with pre-insertion resistors and synchronous closing
Evaluate power quality at 115 kV buses using volt-time curve guideline in IEEE Std. 1100-1999
o Circuit breaker recovery voltage (transient and sustained)
Various fault clearing scenarios
Evaluate using ANSI C37.06-1997
o Surge arrester energy duty
Simulate single-pole restrike for arrester energy evaluation
Address energy sharing by modeling arresters at cable ends having a high V-I curve and repeat critical cases with a low V-I curve at the arrester location with highest energy1
o Surge arrester temporary overvoltage (TOV) duty
Evaluate arrester capability to withstand TOV magnitude and duration for various fault clearing scenarios
o 115 kV equipment duty and power quality
Evaluate 115 kV transient voltages for various metal oxide (modern) arrester protective levels and silicon carbide (conventional) arrester sparkover levels
Consider 115 kV capacitor bank variation for case with high transient voltages
Provide guidance for arresters at 115 kV in regard to energy and TOV capability
Evaluate power quality at 115 kV buses using volt-time curve guideline in IEEE Std. 1100-1999
1 The voltage-current characteristics of MOV surge arresters, for a given manufacturer, model, and nominal voltage rating, tend to vary within a range of manufacturing tolerances. Because of the extreme nonlinearity of MOV arresters, these tolerances can create large variations in the degree of current sharing between arresters located near to each other and subjected to the same voltage surge. The methodology used here is intended to evaluate arrester duty based on a worst-case current division.

GE Power Systems Energy Consulting NU Phase 2 Final Report.doc 2-3
Operational and Failure Sequences
The switching transient case list included simulation of routine operational switching cases and fault events. Failure Modes and Effects Analysis (FMEA) was utilized to identify failure scenarios (e.g. faults, stuck breaker, restrike). Examination of the substation breaker layout revealed some critical switching cases with stuck breakers. Routine operational switching scenarios and failure scenarios included prior conditions representing a reasonable range of conditions and equipment status. The case list was dynamically adjusted depending on intermediate case results during the progression of the study.
The following conditions, equipment status, failure modes, and candidate solutions were included in the switching transient analysis:
• Cable energization
o Shunt reactive compensation
o 115 kV capacitor bank variation
o Outage of Devon-Beseck line
o Outage of Plumtree-Norwalk cable
o Outage of parallel and adjacent cables
o Transformer outage
o Insertion of 7% reactor on Devon-Beseck line
o Outage of Phase 2 cables (first cable in)
o Energize into fault
o Pre-insertion resistor
o Synchronous closing
o Staggered switching of cable and shunt reactors
• Transformer energization
o 115 kV capacitor bank variation
o Outage of Devon-Beseck line
o Outage of Plumtree-Norwalk cable
o Outage of adjacent cable
o Transformer outage
o Outages with minimal Phase 2 in service
o Pre-insertion resistor
o Synchronous closing
• Cable de-energization
o Shunt reactive compensation
GE Power Systems Energy Consulting NU Phase 2 Final Report.doc 2-4
o 115 kV capacitor bank variation
o Outage of Devon-Beseck line
o Stuck breaker
o Delayed breaker opening
o Restrike on one pole
• Fault clearing
o Shunt reactive compensation
o 115 kV capacitor bank variation
o Outage of Devon-Beseck line
o Stuck breaker
o Delayed breaker opening
o Cable faults and stub faults
Study Process
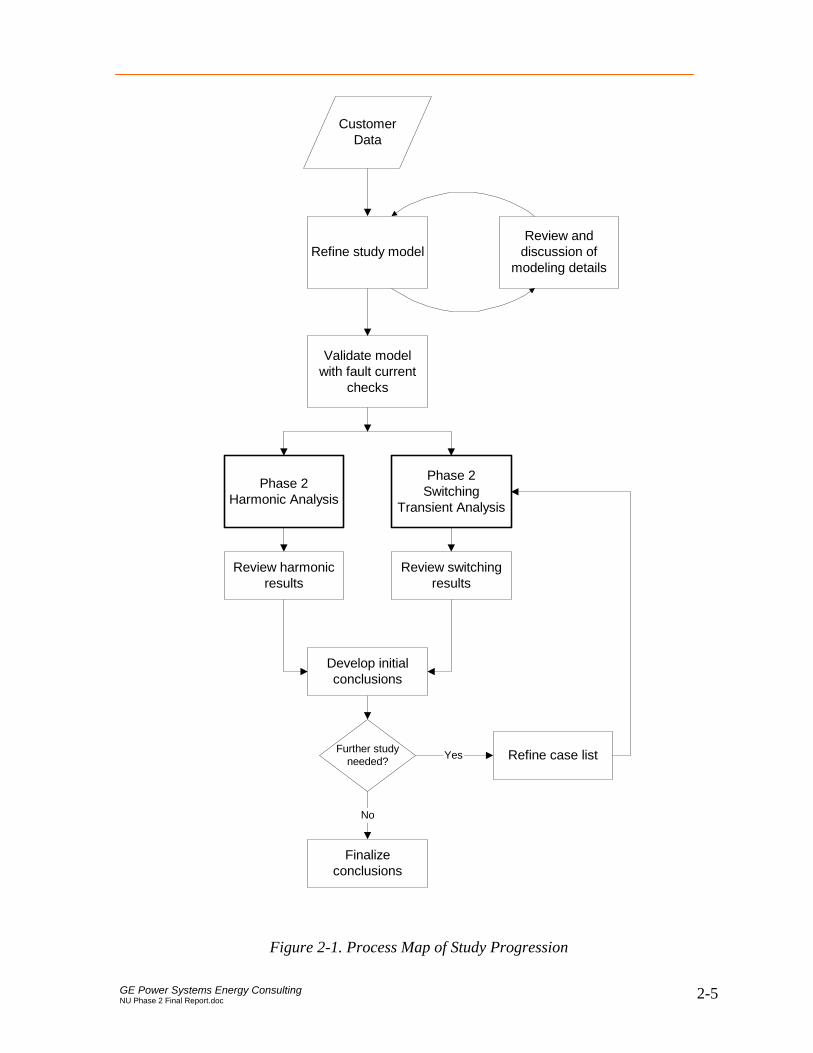
Figure 2-1 shows the process map illustrating the study progression. Following the study model refinement and validation (further discussed in Section 3), the harmonic analysis and switching transient analysis began. The switching transient case list was refined as the study progressed based on harmonic results and intermediate switching results.
GE Power Systems Energy Consulting NU Phase 2 Final Report.doc 2-5
Figure 2-1. Process Map of Study Progression
CustomerData
Refine study modelReview and
discussion ofmodeling details
Validate modelwith fault current
checks
Phase 2Switching
Transient Analysis
Phase 2Harmonic Analysis
Review harmonicresults
Review switchingresults
Refine case list
Develop initialconclusions
Finalizeconclusions
Further studyneeded? Yes
No
GE Power Systems Energy Consulting NU Phase 2 Final Report.doc 2-6
The study was organized into two tasks:
1. Harmonic Analysis
2. Switching Transient Analysis
Task 1. Harmonic Analysis
The large shunt charging capacitance of cables can significantly affect the harmonic frequency response of the system. Resonances in the low-order harmonic range can be expected. There is an ambient level of harmonic distortion in any power system, due to nonlinear loads and power electronic equipment distributed throughout the system. The resonances formed by the cable charging can potentially amplify the ambient distortion to unacceptable levels. Harmonic currents may also add to the heating of the cable, and potentially constrain cable loadability. Harmonic resonance concerns were addressed by performing harmonic screening simulations. Frequency-domain simulations were performed using the EMTP model2 to calculate the positive-sequence driving-point impedance versus frequency at Plumtree, Norwalk, Southington, East Shore, Devon, Frostbridge, Glenbrook, Singer, Devon, and Beseck. Comparison cases were performed with variation of the 115 kV capacitor banks in the system.
The impact of the cable system on ambient harmonic distortion levels was approximated by superimposing a voltage distortion component on the each of the equivalent sources in the model. The distortion spectrum was a typical combination of odd-order harmonics which were at the magnitude limits specified in IEEE 519. The distortion voltage sources represented the ambient distortion which may be present without the cable system. Using the system model, including the cable system, voltage distortion at 345 kV and 115 kV buses in the model was calculated to identify the potential impact of the system additions on ambient voltage distortion. Also, harmonic current flow on the cable circuits was measured to determine if there is any significant thermal impact on the cable system.
A total of 39 cases were performed to calculate the positive-sequence driving-point impedance, and 18 additional cases were performed to evaluate the impact of the cables on ambient harmonic distortion levels. The results of the harmonic analysis are provided in Section 4.
Task 2. Switching Transient Analysis
The switching transient analysis simulations included energization, de-energization, transformer switching, and fault and clear cases to determine switching transient overvoltages and temporary overvoltages for evaluation of equipment duty and power quality. Equipment recommendations are focused on surge arresters and switchgear.
2 The EMTP model is described in Section 3.
GE Power Systems Energy Consulting NU Phase 2 Final Report.doc 2-7
Except in the limited case of some recently introduced circuit breakers with synchronous switching, the timing of circuit breaker closing is essentially random with respect to the point on voltage wave. There is also typically a variation between the closing times of the individual breaker poles (phases). Some transient results are sensitive to the exact timing of switching. Because of the complexities involved, it is virtually impossible to precisely predict the breaker timing which produces the most severe transient results. For this reason, detailed design studies typically use extensive Monte Carlo analysis of randomly selected breaker timings. However, for the purpose of this study, breaker timing rules-of-thumb were utilized to produce results which roughly approach the worst-case results. Most energization cases were performed using fixed point-on-wave circuit breaker closing angles, e.g., closing at voltage peaks or zeroes for cable energization cases, and voltage zeroes for transformer energization (to maximize inrush harmonics). Using fixed point-on-wave closing angles was sufficient to determine the switching transient issues associated with the cables and transformers. Circuit breakers were modeled with uncontrolled closing, with synchronous closing, and with pre-insertion resistors. Once it was determined that uncontrolled closing was unacceptable for cable energization, it was not necessary to perform statistical analysis. However, it should be noted that actual transient overvoltages could be higher than those presented in this report. Temporary overvoltages were maximized using a uniform distribution of fault application and clearing times to vary the flux offset conditions in stub fault cases.
Cable switching and faults can create transient oscillations which can potentially be magnified at buses with capacitor banks in the lower voltage systems interconnected with the cable transmission project. Voltage magnification can occur when resonances form between the 345 kV cable capacitance, 345 kV driving-point impedance, the 115 kV bank capacitance, and the impedance between them. Voltages at nearby capacitor installations were monitored during cable switching and fault simulations to screen for such magnification. This issue may require extensive analysis in any future design study.
More than 200 simulation cases were performed to complete this part of the study. The results of the transient analysis are provided in Section 5.
GE Power Systems Energy Consulting NU Phase 2 Final Report.doc 3-1
3. System Model
An extensive model of the NU system in southwestern Connecticut was developed in the Phase 1 study, including explicit representation of the 345 kV transmission system as far as Pleasant Valley, Manchester, Card, and Montville and the 115 kV transmission system as far as Campville, Berlin, East Meriden, and Green Hill. The 138 kV undersea cables to Northport were also included in the model. The transmission system beyond the extent of the model was represented by equivalent sources at each point where the model interfaces with the external system. Capacitor banks and load transformers were modeled throughout the explicitly-represented 115 kV system.
In the additional studies performed on Phase 1 (Parts 1 and 2 of additional workscope), the Phase 1 model was modified from Configuration X to Configuration X′, and Phase 2 additions were modeled, including two parallel cables with shunt reactive compensation from Norwalk to Singer and from Singer to East Devon, totaling about 24 miles, and a 33-mile overhead line from East Devon to Beseck. Existing 345 kV overhead lines near Beseck were reconfigured, and 345/115 kV transformers were added at Norwalk, Singer, and East Devon, as well as a 115 kV cable from Norwalk to Glenbrook.
Figure 3-1 shows the one-line diagram of Phase 2 including the breaker arrangement, provided by NU. The circuit breakers at East Devon 345 kV have been numbered for the purpose of discussion in Section 5. Figure 3-2 shows the detail of the system model in the vicinity of the Phase 1 and Phase 2 cables. The configuration of Phase 1 and Phase 2 cables, overhead lines, and shunt reactors is indicated. The 345 kV loop is shown in simplified form. The system model extends beyond the loop as described above. Circuit breakers indicated by lettered and numbered squares are used to describe the case simulation conditions. The simulation model shown in Figure 3-2, while not identical in configuration to Figure 3-1, is functionally equivalent and fully adequate to model the switching operations of the Phase 2 system. For example, breaker V1 represents one of two breakers that could be used to energize a cable from Norwalk to Singer. Also, in stuck breaker cases, breakers V, W, and Y are operated to isolate a portion of the system from the remaining 345 kV substation.
For this study, there were additional changes required for Phase 2. Tap settings at 75, 100, 150 MVAR were modeled for the 75-150 MVAR variable shunt reactors (75, 100, 150 MVAR), and 294 kV surge arresters were modeled at the Phase 2 cable ends. A 7% (on 100 MVA base) series reactor was added at the Devon end of the Devon-Beseck 345 kV line, which was normally bypassed. Some reconfiguration was required at Devon 115 kV, according to information received from NU, including removing the bus tie reactor and adding two 1% reactors to the East Devon 115 kV bus, reconnecting the Milford generating plant to East Devon 115 kV, and removing a 115 kV line from Devon to Lucchini (past Cook Hill Junction). The 115 kV cable from Norwalk to Glenbrook was modified, and another was added from Norwalk Harbor to Glenbrook. The cable data is shown as modeled in Table 3-1.

GE Power Systems Energy Consulting NU Phase 2 Final Report.doc 3-2
Figure 3-1. Phase 2 One-Line Diagram with Breaker Arrangement

GE Power Systems Energy Consulting NU Phase 2 Final Report.doc 3-3
Figure 3-2. System Model One-Line Diagram for Phase 2
S D
E
to Weston, Hawthorne, Flax Hill, Rowayton Jct.
CM
L
H
I G
F
to Stony Hill
to New Town
Ridgefield115kV13.8kV 13.8kV
Norwalk S/S
Norwalk Jct.
0.2mi
5.6mi
0.6mi
Plumtree115kV
Whittlesey
Hoyts Hill Rd.
Archers Lane
Peaceable115kV
Norwalk115kV
27.6kV
(3) (3)
∆Υ
∆Υ
Υ Υ∆
∆ Υ
∆ Υ
Υ Υ
Υ Υ∆
Υ Υ∆
Υ∆
∆Υ
∆Υ
B R
KA
J
Norwalk Jct.
Norwalk S/S
9.7mi
500ft
Plumtree345kV
2.1mi
Archers Lane
Hoyts Hill Rd.
Norwalk345kV
PQ
toPleasant Valley
Long Mountain345 kV
0.6mi
0.8mi
1.3mi
2.4mi
6.8mi
3.7mi
4.9mi
3.7mi
Scovill Rock345kV
Devon345kV
Singer345kV
Beseck345kV
Frost Bridge345kV Southington
345kV
Haddam Neck345kV
Glenbrook115kV Norwalk
Harbor115kV
8.8mi7.9mi
O
Υ Υ
N
V V1
V2
W1
W2
W
2
Υ Υ
3 5
Υ Υ
4Pequonnock115kV
BridgeportEnergy115kV
X1
X2
YY1
Y2
6
Υ Υ
7Devon115kV
Z
1
BY
N2
N1
S2
S1
S4
S3
D2
D1
15.5mi
8.2mi
33.3mi
Meriden Pwr345kV
toMillstone
toMontville
to Manchester,Middletown,Cross Sound
GE Power Systems Energy Consulting NU Phase 2 Final Report.doc 3-4
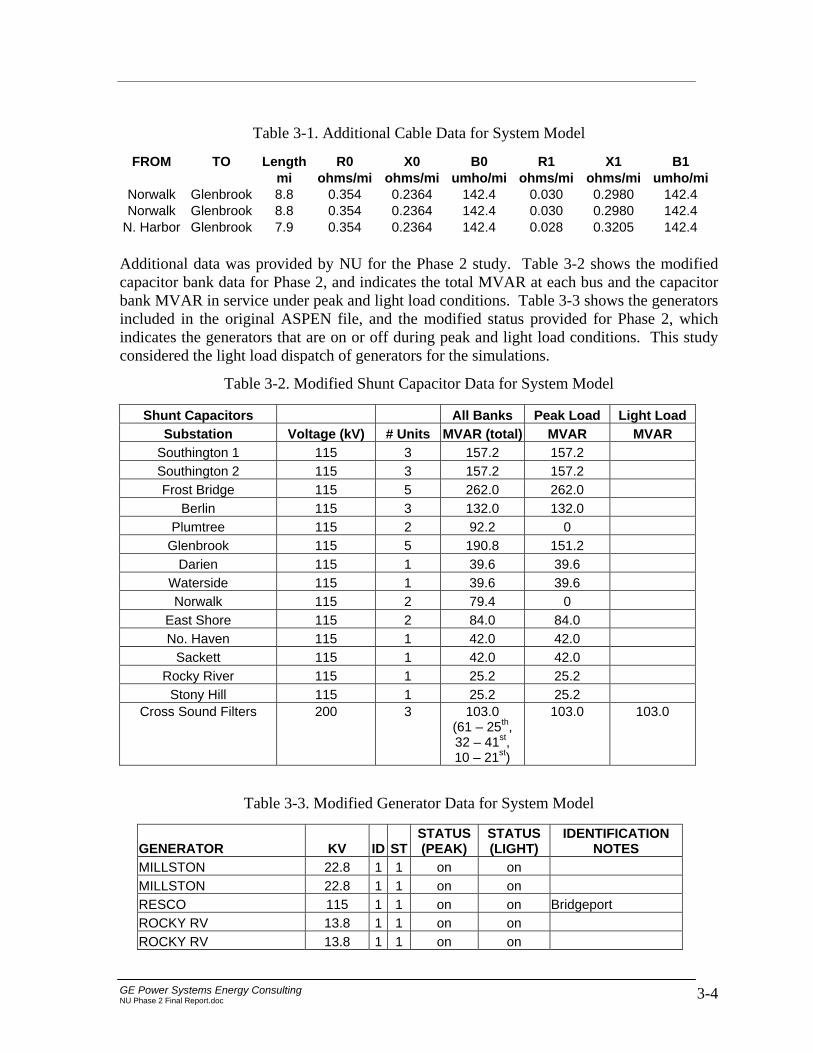
Table 3-1. Additional Cable Data for System Model
FROM TO Length R0 X0 B0 R1 X1 B1 mi ohms/mi ohms/mi umho/mi ohms/mi ohms/mi umho/mi
Norwalk Glenbrook 8.8 0.354 0.2364 142.4 0.030 0.2980 142.4 Norwalk Glenbrook 8.8 0.354 0.2364 142.4 0.030 0.2980 142.4
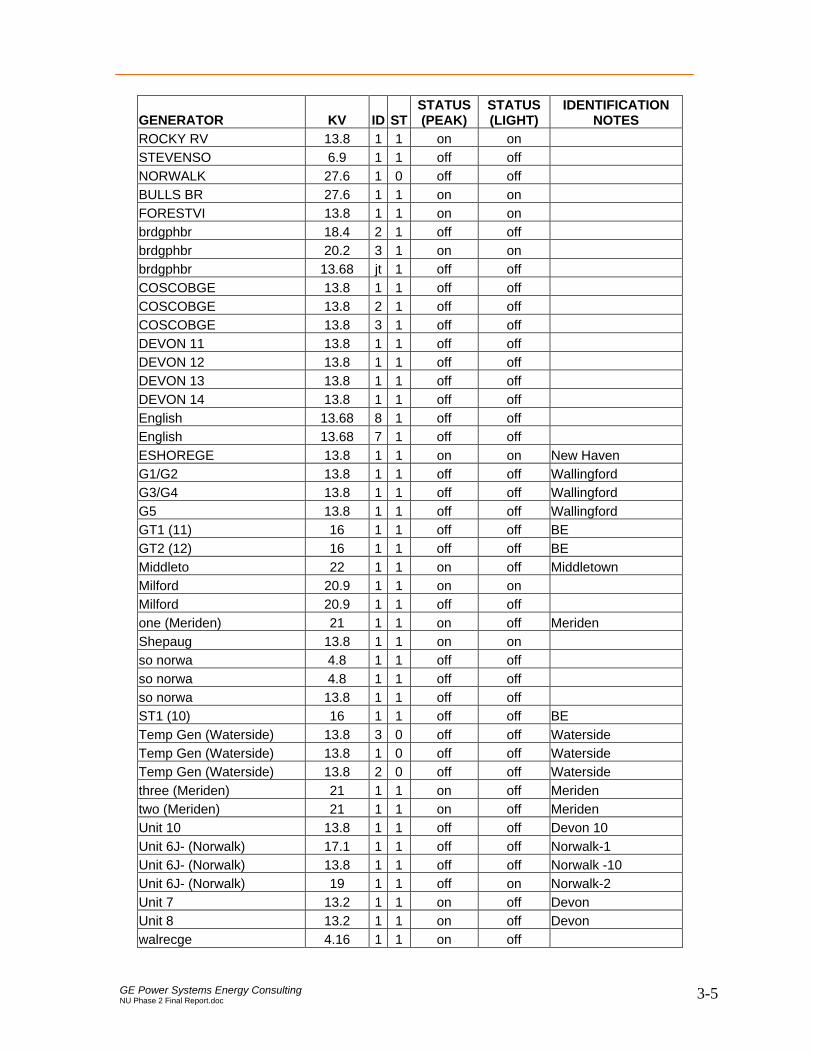
N. Harbor Glenbrook 7.9 0.354 0.2364 142.4 0.028 0.3205 142.4 Additional data was provided by NU for the Phase 2 study. Table 3-2 shows the modified capacitor bank data for Phase 2, and indicates the total MVAR at each bus and the capacitor bank MVAR in service under peak and light load conditions. Table 3-3 shows the generators included in the original ASPEN file, and the modified status provided for Phase 2, which indicates the generators that are on or off during peak and light load conditions. This study considered the light load dispatch of generators for the simulations.
Table 3-2. Modified Shunt Capacitor Data for System Model
Shunt Capacitors All Banks Peak Load Light Load Substation Voltage (kV) # Units MVAR (total) MVAR MVAR
Southington 1 115 3 157.2 157.2 Southington 2 115 3 157.2 157.2 Frost Bridge 115 5 262.0 262.0
Berlin 115 3 132.0 132.0 Plumtree 115 2 92.2 0
Glenbrook 115 5 190.8 151.2 Darien 115 1 39.6 39.6
Waterside 115 1 39.6 39.6 Norwalk 115 2 79.4 0
East Shore 115 2 84.0 84.0 No. Haven 115 1 42.0 42.0
Sackett 115 1 42.0 42.0 Rocky River 115 1 25.2 25.2
Stony Hill 115 1 25.2 25.2 Cross Sound Filters
200
3
103.0 (61 – 25th, 32 – 41st, 10 – 21st)
103.0
103.0
Table 3-3. Modified Generator Data for System Model
GENERATOR KV ID STSTATUS(PEAK)
STATUS (LIGHT)
IDENTIFICATION NOTES
MILLSTON 22.8 1 1 on on MILLSTON 22.8 1 1 on on RESCO 115 1 1 on on Bridgeport ROCKY RV 13.8 1 1 on on ROCKY RV 13.8 1 1 on on
GE Power Systems Energy Consulting NU Phase 2 Final Report.doc 3-5
GENERATOR KV ID STSTATUS(PEAK)
STATUS (LIGHT)
IDENTIFICATION NOTES
ROCKY RV 13.8 1 1 on on STEVENSO 6.9 1 1 off off NORWALK 27.6 1 0 off off BULLS BR 27.6 1 1 on on FORESTVI 13.8 1 1 on on brdgphbr 18.4 2 1 off off brdgphbr 20.2 3 1 on on brdgphbr 13.68 jt 1 off off COSCOBGE 13.8 1 1 off off COSCOBGE 13.8 2 1 off off COSCOBGE 13.8 3 1 off off DEVON 11 13.8 1 1 off off DEVON 12 13.8 1 1 off off DEVON 13 13.8 1 1 off off DEVON 14 13.8 1 1 off off English 13.68 8 1 off off English 13.68 7 1 off off ESHOREGE 13.8 1 1 on on New Haven G1/G2 13.8 1 1 off off Wallingford G3/G4 13.8 1 1 off off Wallingford G5 13.8 1 1 off off Wallingford GT1 (11) 16 1 1 off off BE GT2 (12) 16 1 1 off off BE Middleto 22 1 1 on off Middletown Milford 20.9 1 1 on on Milford 20.9 1 1 off off one (Meriden) 21 1 1 on off Meriden Shepaug 13.8 1 1 on on so norwa 4.8 1 1 off off so norwa 4.8 1 1 off off so norwa 13.8 1 1 off off ST1 (10) 16 1 1 off off BE Temp Gen (Waterside) 13.8 3 0 off off Waterside Temp Gen (Waterside) 13.8 1 0 off off Waterside Temp Gen (Waterside) 13.8 2 0 off off Waterside three (Meriden) 21 1 1 on off Meriden two (Meriden) 21 1 1 on off Meriden Unit 10 13.8 1 1 off off Devon 10 Unit 6J- (Norwalk) 17.1 1 1 off off Norwalk-1 Unit 6J- (Norwalk) 13.8 1 1 off off Norwalk -10 Unit 6J- (Norwalk) 19 1 1 off on Norwalk-2 Unit 7 13.2 1 1 on off Devon Unit 8 13.2 1 1 on off Devon walrecge 4.16 1 1 on off

GE Power Systems Energy Consulting NU Phase 2 Final Report.doc 3-6
After refinements were made to the system model, fault currents were checked to validate the model. NU provided fault currents from their Phase 2 model in ASPEN with all generators online. With the above generators all online, three-line-to-ground and single-line-to-ground faults were simulated at various buses in EMTP. The results are provided in Table 3-4, which shows the ASPEN and EMTP fault currents and the percent difference between them. The comparison indicates that the differences are less than 5%, which is an excellent result.
Table 3-4. Fault Current Comparison
ASPEN ASPEN EMTP EMTP 3LG 1LG NAME KV 3LG(A) 1LG(A) 3LG(A) 1LG(A) ∆ (%) ∆ (%) BESECK JCT 345 28421 23643 27415 23204 -3.5 -1.9 DEVON 345 21617 19207 21845 19517 1.1 1.6 LONG MTN 345 20807 14757 20497 14910 -1.5 1.0 MILLSTONE 345 30752 34435 30244 34359 -1.7 -0.2 NORWALK 345 21722 19584 21816 19656 0.4 0.4 PLUMTREE 345 19449 15597 19303 15210 -0.8 -2.5 SINGER 345 22077 20117 22288 20422 1.0 1.5 SOUTHINGTON 345 28388 25755 27277 26021 -3.9 1.0

GE Power Systems Energy Consulting C:\LizFiles\ERP\EMTP\NUphase2design\Phase 2 Final Report Docs\NU Phase 2 Final Report.doc, 11/17/03 4-1
4. Harmonic Analysis
The harmonic impact of the Phase 2 345 kV cables was analyzed by evaluating the driving-point impedance versus frequency and potential amplification of ambient harmonic voltage distortion.
Driving-Point Impedance
Harmonic screening simulations were performed to calculate the positive-sequence driving-point impedance versus frequency at the Plumtree, Norwalk, Singer, Devon, Beseck, Southington, and East Shore 345 kV buses and at the Plumtree, Norwalk, Southington, Devon, Frost Bridge and Glenbrook 115 kV buses. Cases were performed for the Phase 2 system with various capacitor bank allocations. Table 4-1 shows the cases that were performed for the Phase 2 system and the resonant frequencies that were observed along with the corresponding impedance value at those frequencies. The resonant frequency is indicated by its harmonic number (HN), in per unit of 60 Hz, and impedance magnitude is in ohms. For comparison purposes, the Phase 1 and existing system cases from the Phase 1 study are shown in Table 4-2. The driving-point impedance plots for Phase 2 are provided in Appendix B.
Table 4-1. Driving-Point Impedance Cases for Phase 2
Resonant Frequency & Impedance (pu of 60Hz, Ohm)
Low Middle High Case Location Capacitor Banks HN Z(Ω) HN Z(Ω) HN Z(Ω) PH2_1A Plumtree 345 kV Light Load 2.8 192 10.5 449 PH2_1B Plumtree 345 kV All in Service 2.4 128 11.3 620 PH2_1C Plumtree 345 kV All Out of Service 2.8 194 10.5 445 PH2_2A Plumtree 115 kV Light Load 2.8 19 10.5 93 13.9 109 PH2_2B Plumtree 115 kV All in Service 2.4 17 6.6 70 PH2_2C Plumtree 115 kV All Out of Service 2.8 19 10.5 93 13.9 109 PH2_3A Norwalk 345 kV Light Load 2.8 243 PH2_3B Norwalk 345 kV All in Service 2.4 149 5.0 70 PH2_3C Norwalk 345 kV All Out of Service 2.8 245 PH2_4A Norwalk 115 kV Light Load 2.8 16 7.9 24 PH2_4B Norwalk 115 kV All in Service 2.4 15 5.0 18 15.6 181 PH2_4C Norwalk 115 kV All Out of Service 2.8 16 7.9 24 PH2_5A Southington 345 kV Light Load 2.8 60 10.4 259 PH2_5B Southington 345 kV All in Service 2.4 61 4.3 81 8.2 88 PH2_5C Southington 345 kV All Out of Service 2.8 60 10.3 250 PH2_6A Southington 115 kV Light Load 10.2 29 PH2_6B Southington 115 kV All in Service 4.3 26 5.4 38 11.3 126 PH2_6C Southington 115 kV All Out of Service 10.1 28 PH2_7A East Shore 345 kV Light Load 4.7 167 10.2 212 PH2_7B East Shore 345 kV All in Service 4.3 111 7.2 188 12.5
14.6 261 519
PH2_7C East Shore 345 kV All Out of Service 10.1 239 PH2_8A Devon 115 kV Light Load 2.8 13

GE Power Systems Energy Consulting NU Phase 2 Final Report.doc 4-2
Resonant Frequency & Impedance (pu of 60Hz, Ohm)
Low Middle High Case Location Capacitor Banks HN Z(Ω) HN Z(Ω) HN Z(Ω) PH2_8B Devon 115 kV All in Service 2.4 11 PH2_8C Devon 115 kV All Out of Service 2.8 13 PH2_9A Frost Bridge 115 kV Light Load 2.8 11 10.4 30 PH2_9B Frost Bridge 115 kV All in Service 2.4 14 4.3
5.4 31 40
8.3 34
PH2_9C Frost Bridge 115 kV All Out of Service 2.8 11 10.4 29 PH2_10A Glenbrook 115 kV Light Load 2.8 14 8 42 16.0 56 PH2_10B Glenbrook 115 kV All in Service 2.4 15 5.0 45 PH2_10C Glenbrook 115 kV All Out of Service 2.8 14 8 42 16.0 56 PH2_11A Singer 345 kV Light Load 2.8 237 10.5 136 PH2_11B Singer 345 kV All in Service 2.4 144 5.0 74 11.3 231 PH2_11C Singer 345 kV All Out of Service 2.8 239 10.5 135 PH2_12A Devon 345 kV Light Load 2.8 228 10.5 173 PH2_12B Devon 345 kV All in Service 2.4 139 5.0 67 11.3 318 PH2_12C Devon 345 kV All Out of Service 2.8 230 10.5 171 PH2_13A Beseck 345 kV Light Load 2.8 67 10.4 280 PH2_13B Beseck 345 kV All in Service 2.4 57 12.5 277 PH2_13C Beseck 345 kV All Out of Service 2.8 67 10.4 270
Table 4-2. Driving-Point Impedance Cases for Phase 1 and Existing System
Resonant Frequency & Impedance (pu of 60Hz, Ohm)
Low Middle High Case Location System Capacitor Banks HN Z(Ω) HN Z(Ω) HN Z(Ω) 1A Plumtree 345 kV Phase 1 Light Load 3.4 354 1B Plumtree 345 kV Phase 1 All in Service 2.7 183 5.0 155 1C Plumtree 345 kV Phase 1 All Out of Service 3.7 531 1D Plumtree 345 kV Existing Light Load 6.4 238 8.6 269 1E Plumtree 345 kV Existing All in Service 2.9 110 9.1 229 11.3 314 1F Plumtree 345 kV Existing All Out of Service 8.8 267 12.0 463 1G Plumtree 345 kV Phase 1 Light Load. No loads. 3.4 363 1H Plumtree 345 kV Phase 1 Tuned. 3.0 229 5.3 108 2A Plumtree 115 kV Phase 1 Light Load 3.4 36 9.8 114 2B Plumtree 115 kV Phase 1 All in Service 2.7 28 9.5 47 11.7 97 2C Plumtree 115 kV Phase 1 All Out of Service 3.6 44 13.3 118 2D Plumtree 115 kV Existing Light Load 6.5 45 8.7 92 2E Plumtree 115 kV Existing All in Service 3.0 23 9.2 51 11.5 77 2F Plumtree 115 kV Existing All Out of Service 12.1 108 2G Plumtree 115 kV Phase 1 Tuned. 3.0 28 8.2 141 3A Norwalk 345 kV Phase 1 Light Load 3.4 451 3B Norwalk 345 kV Phase 1 All in Service 2.7 215 5.0 261 6.1 142 3C Norwalk 345 kV Phase 1 All Out of Service 3.7 689 3D Norwalk 345 kV Phase 1 Tuned 3.0 283 5.3 180 8.3 71 4A Norwalk 115 kV Phase 1 Light Load 16.3 290 4B Norwalk 115 kV Phase 1 All in Service 10.4 84 12.6 175 4C Norwalk 115 kV Phase 1 All Out of Service 3.6 22 7.7 19 4D Norwalk 115 kV Existing Light Load 14.9 265 4E Norwalk 115 kV Existing All in Service 9.8 133 12.1 92

GE Power Systems Energy Consulting NU Phase 2 Final Report.doc 4-3
Resonant Frequency & Impedance (pu of 60Hz, Ohm)
Low Middle High Case Location System Capacitor Banks HN Z(Ω) HN Z(Ω) HN Z(Ω) 4F Norwalk 115 kV Existing All Out of Service 6.8 28 4G Norwalk 115 kV Phase 1 Tuned 3.0 21 10.6 83 12.6 168 5A Southington 345 kV Phase 1 Light Load 7.3 223 15.7 131 5B Southington 345 kV Phase 1 All in Service 2.6 57 4.2 104 8.3 129 5C Southington 345 kV Phase 1 All Out of Service 3.6 58 9.6 266 5D Southington 345 kV Existing Light Load 6.5 174 15.7 132 5E Southington 345 kV Existing All in Service 2.9 66 8.3 129 12.2 103 5F Southington 345 kV Existing All Out of Service 9.0 223 5G Southington 345 kV Phase 1 Tuned 2.9 51 5.2 119 8.1 157 6A Southington 115 kV Phase 1 Light Load 7.3 53 15.8 166 6B Southington 115 kV Phase 1 All in Service 4.2 29 9.4 112 6C Southington 115 kV Phase 1 All Out of Service 9.3 27 6D Southington 115 kV Existing Light Load 15.8 165 6E Southington 115 kV Existing All in Service 9.4 114 6F Southington 115 kV Existing All Out of Service 8.7 23 6G Southington 115 kV Phase 1 Tuned 8.3 68 15.7 162 7A East Shore 345 kV Phase 1 Light Load 4.7 202 12.5 385 14.5 350 7B East Shore 345 kV Phase 1 All in Service 4.2 123 7.1 200 14.6 523 7C East Shore 345 kV Phase 1 All Out of Service 9.3 213 7D East Shore 345 kV Existing Light Load 4.7 160 12.5 372 7E East Shore 345 kV Existing All in Service 4.3 112 7.1 199 14.6 523 7F East Shore 345 kV Existing All Out of Service 8.7 170 7G East Shore 345 kV Phase 1 Tuned 4.7 198 11.8 366 14.5 389 8A Devon 115 kV Phase 1 Light Load 3.3 9 8B Devon 115 kV Phase 1 All in Service 2.6 8 8C Devon 115 kV Phase 1 All Out of Service 3.5 9 8D Devon 115 kV Existing Light Load 4.2 10 8E Devon 115 kV Existing All in Service 2.9 9 8F Devon 115 kV Existing All Out of Service 6.6 14 8G Devon 115 kV Phase 1 Tuned 2.9 9 5.2 10 9A Frost Bridge 115 kV Phase 1 Light Load 3.3 13 7.2 30 11.4 84 9B Frost Bridge 115 kV Phase 1 All in Service 2.6 16 5.6 53 8.4 26 9C Frost Bridge 115 kV Phase 1 All Out of Service 3.6 13 9.3 23 9D Frost Bridge 115 kV Existing Light Load 6.5 33 11.5 82 12.7 100 9E Frost Bridge 115 kV Existing All in Service 3.0 18 5.9 40 9F Frost Bridge 115 kV Existing All Out of Service 8.7 25 12.0 16 9G Frost Bridge 115 kV Phase 1 Tuned 2.9 16 5.3 95
10A Glenbrook 115 kV Phase 1 Light Load 3.3 21 5.5 60 10B Glenbrook 115 kV Phase 1 All in Service 2.6 19 4.0 51 10C Glenbrook 115 kV Phase 1 All Out of Service 3.6 16 7.9 44 10D Glenbrook 115 kV Existing Light Load 4.8 45 10E Glenbrook 115 kV Existing All in Service 3.0 27 3.8 43 10F Glenbrook 115 kV Existing All Out of Service 7.0 39 10G Glenbrook 115 kV Phase 1 Tuned 2.9 24 4.5 57
The driving-point impedance results indicate a general shift of impedance resonances down toward lower frequencies with the Phase 2 additions. However, the magnitude of the impedance resonances are generally lower with Phase 2 than with Phase 1, due to the strengthening of the system with the 345 kV loop through Beseck. Resonances are seen
GE Power Systems Energy Consulting NU Phase 2 Final Report.doc 4-4
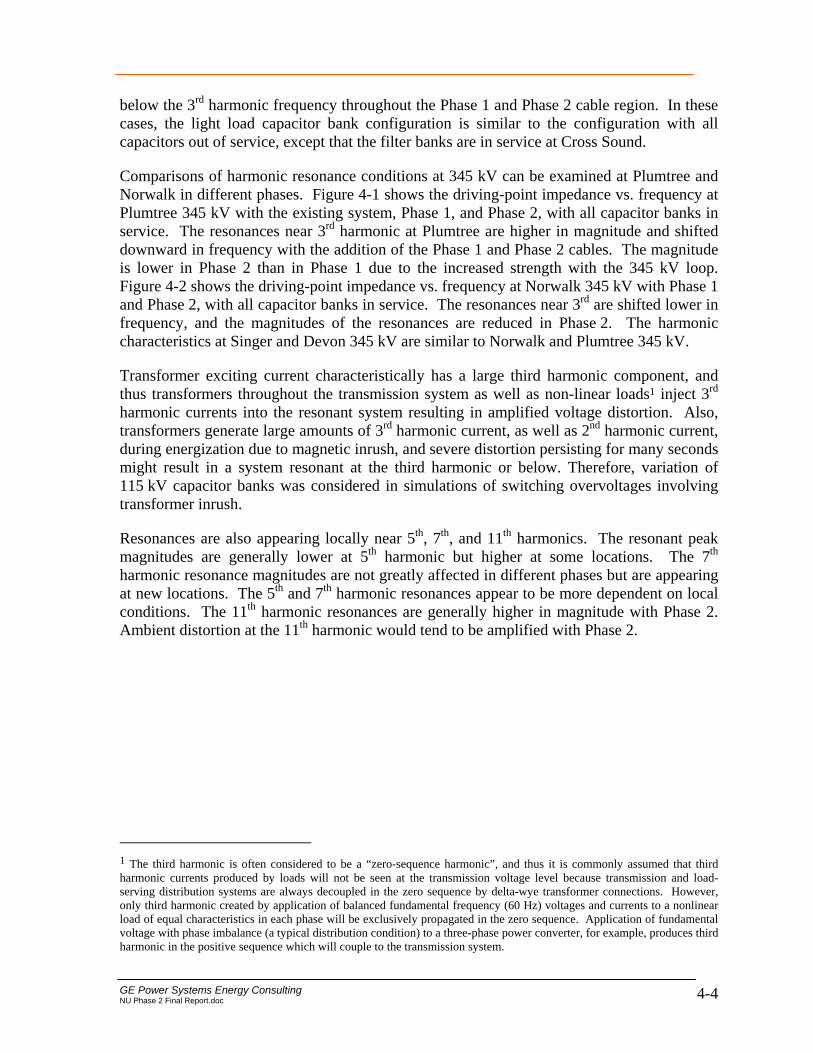
below the 3rd harmonic frequency throughout the Phase 1 and Phase 2 cable region. In these cases, the light load capacitor bank configuration is similar to the configuration with all capacitors out of service, except that the filter banks are in service at Cross Sound.
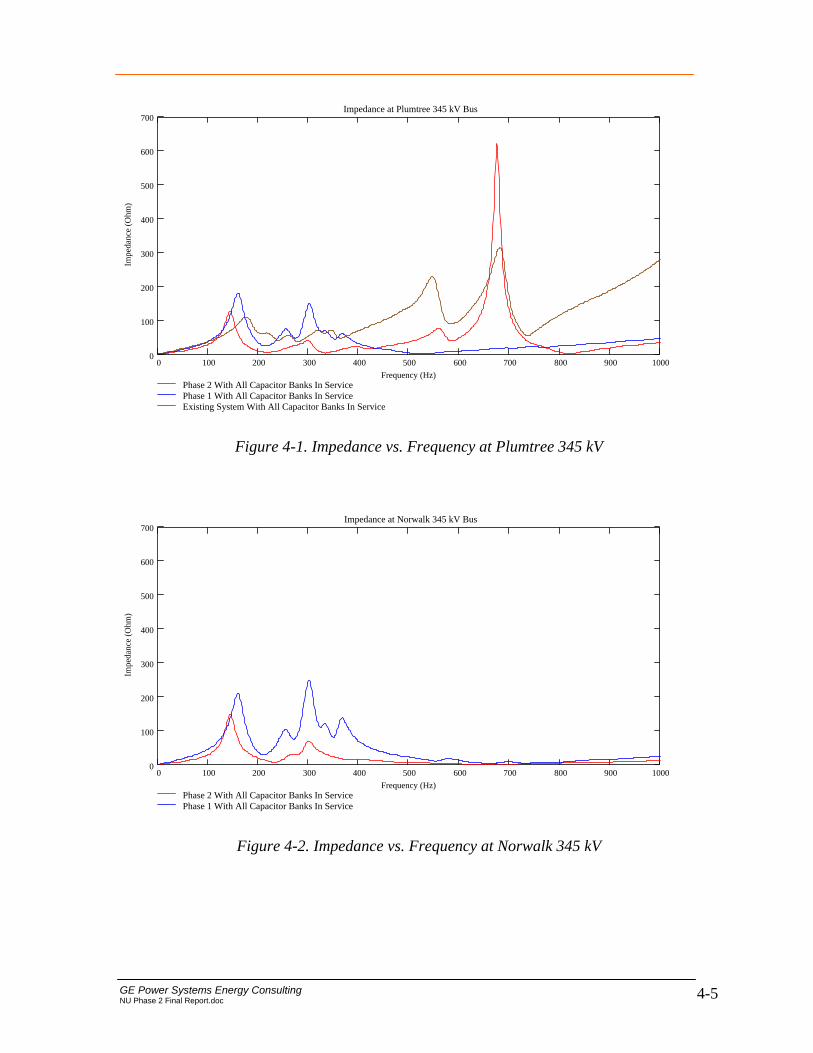
Comparisons of harmonic resonance conditions at 345 kV can be examined at Plumtree and Norwalk in different phases. Figure 4-1 shows the driving-point impedance vs. frequency at Plumtree 345 kV with the existing system, Phase 1, and Phase 2, with all capacitor banks in service. The resonances near 3rd harmonic at Plumtree are higher in magnitude and shifted downward in frequency with the addition of the Phase 1 and Phase 2 cables. The magnitude is lower in Phase 2 than in Phase 1 due to the increased strength with the 345 kV loop. Figure 4-2 shows the driving-point impedance vs. frequency at Norwalk 345 kV with Phase 1 and Phase 2, with all capacitor banks in service. The resonances near 3rd are shifted lower in frequency, and the magnitudes of the resonances are reduced in Phase 2. The harmonic characteristics at Singer and Devon 345 kV are similar to Norwalk and Plumtree 345 kV.
Transformer exciting current characteristically has a large third harmonic component, and thus transformers throughout the transmission system as well as non-linear loads1 inject 3rd harmonic currents into the resonant system resulting in amplified voltage distortion. Also, transformers generate large amounts of 3rd harmonic current, as well as 2nd harmonic current, during energization due to magnetic inrush, and severe distortion persisting for many seconds might result in a system resonant at the third harmonic or below. Therefore, variation of 115 kV capacitor banks was considered in simulations of switching overvoltages involving transformer inrush.
Resonances are also appearing locally near 5th, 7th, and 11th harmonics. The resonant peak magnitudes are generally lower at 5th harmonic but higher at some locations. The 7th harmonic resonance magnitudes are not greatly affected in different phases but are appearing at new locations. The 5th and 7th harmonic resonances appear to be more dependent on local conditions. The 11th harmonic resonances are generally higher in magnitude with Phase 2. Ambient distortion at the 11th harmonic would tend to be amplified with Phase 2.
1 The third harmonic is often considered to be a “zero-sequence harmonic”, and thus it is commonly assumed that third harmonic currents produced by loads will not be seen at the transmission voltage level because transmission and load-serving distribution systems are always decoupled in the zero sequence by delta-wye transformer connections. However, only third harmonic created by application of balanced fundamental frequency (60 Hz) voltages and currents to a nonlinear load of equal characteristics in each phase will be exclusively propagated in the zero sequence. Application of fundamental voltage with phase imbalance (a typical distribution condition) to a three-phase power converter, for example, produces third harmonic in the positive sequence which will couple to the transmission system.
GE Power Systems Energy Consulting NU Phase 2 Final Report.doc 4-5
0 100 200 300 400 500 600 700 800 900 10000
100
200
300
400
500
600
700
Phase 2 With All Capacitor Banks In ServicePhase 1 With All Capacitor Banks In ServiceExisting System With All Capacitor Banks In Service
Impedance at Plumtree 345 kV Bus
Frequency (Hz)
Impe
danc
e (O
hm)
Figure 4-1. Impedance vs. Frequency at Plumtree 345 kV
0 100 200 300 400 500 600 700 800 900 10000
100
200
300
400
500
600
700
Phase 2 With All Capacitor Banks In ServicePhase 1 With All Capacitor Banks In Service
Impedance at Norwalk 345 kV Bus
Frequency (Hz)
Impe
danc
e (O
hm)
Figure 4-2. Impedance vs. Frequency at Norwalk 345 kV
GE Power Systems Energy Consulting NU Phase 2 Final Report.doc 4-6
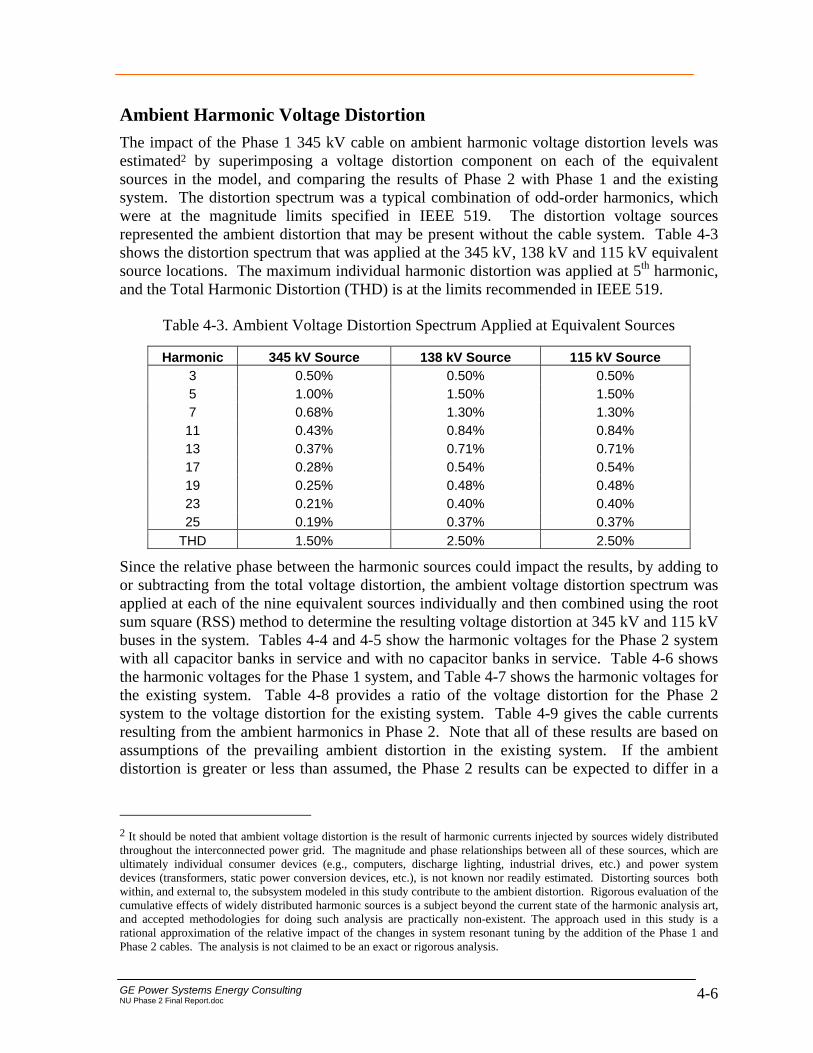
Ambient Harmonic Voltage Distortion The impact of the Phase 1 345 kV cable on ambient harmonic voltage distortion levels was estimated2 by superimposing a voltage distortion component on each of the equivalent sources in the model, and comparing the results of Phase 2 with Phase 1 and the existing system. The distortion spectrum was a typical combination of odd-order harmonics, which were at the magnitude limits specified in IEEE 519. The distortion voltage sources represented the ambient distortion that may be present without the cable system. Table 4-3 shows the distortion spectrum that was applied at the 345 kV, 138 kV and 115 kV equivalent source locations. The maximum individual harmonic distortion was applied at 5th harmonic, and the Total Harmonic Distortion (THD) is at the limits recommended in IEEE 519.
Table 4-3. Ambient Voltage Distortion Spectrum Applied at Equivalent Sources
Harmonic 345 kV Source 138 kV Source 115 kV Source 3 0.50% 0.50% 0.50% 5 1.00% 1.50% 1.50% 7 0.68% 1.30% 1.30% 11 0.43% 0.84% 0.84% 13 0.37% 0.71% 0.71% 17 0.28% 0.54% 0.54% 19 0.25% 0.48% 0.48% 23 0.21% 0.40% 0.40% 25 0.19% 0.37% 0.37%
THD 1.50% 2.50% 2.50%
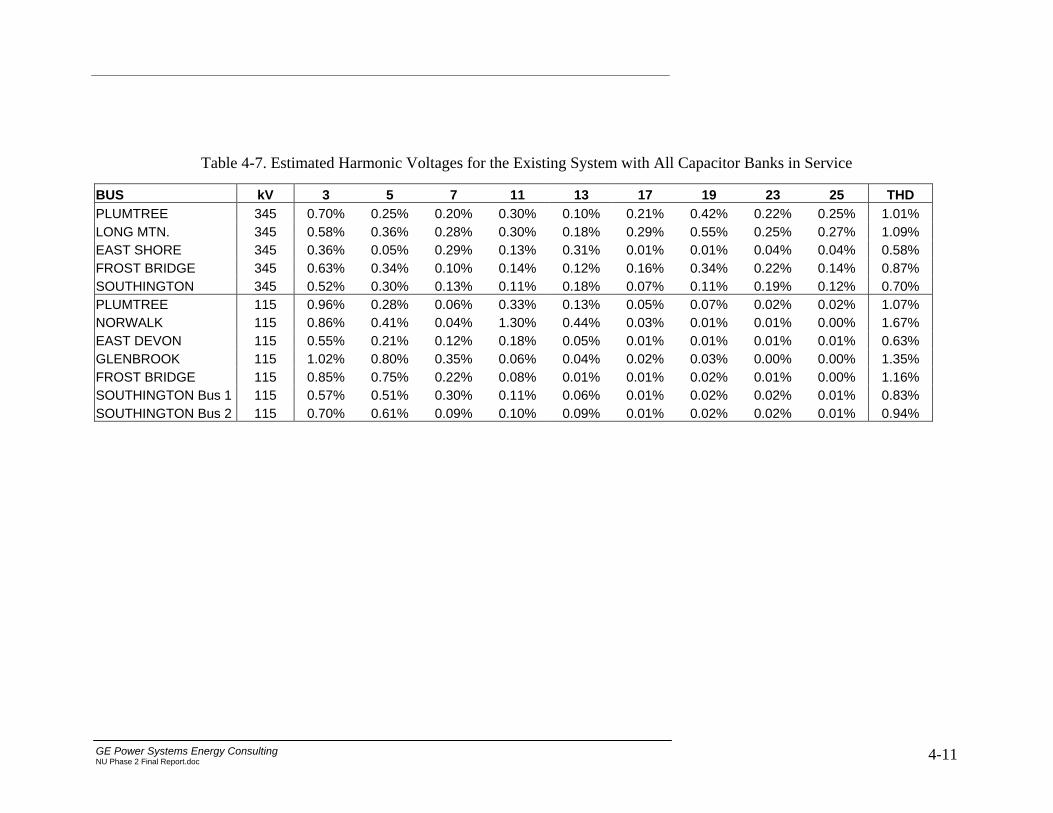
Since the relative phase between the harmonic sources could impact the results, by adding to or subtracting from the total voltage distortion, the ambient voltage distortion spectrum was applied at each of the nine equivalent sources individually and then combined using the root sum square (RSS) method to determine the resulting voltage distortion at 345 kV and 115 kV buses in the system. Tables 4-4 and 4-5 show the harmonic voltages for the Phase 2 system with all capacitor banks in service and with no capacitor banks in service. Table 4-6 shows the harmonic voltages for the Phase 1 system, and Table 4-7 shows the harmonic voltages for the existing system. Table 4-8 provides a ratio of the voltage distortion for the Phase 2 system to the voltage distortion for the existing system. Table 4-9 gives the cable currents resulting from the ambient harmonics in Phase 2. Note that all of these results are based on assumptions of the prevailing ambient distortion in the existing system. If the ambient distortion is greater or less than assumed, the Phase 2 results can be expected to differ in a
2 It should be noted that ambient voltage distortion is the result of harmonic currents injected by sources widely distributed throughout the interconnected power grid. The magnitude and phase relationships between all of these sources, which are ultimately individual consumer devices (e.g., computers, discharge lighting, industrial drives, etc.) and power system devices (transformers, static power conversion devices, etc.), is not known nor readily estimated. Distorting sources both within, and external to, the subsystem modeled in this study contribute to the ambient distortion. Rigorous evaluation of the cumulative effects of widely distributed harmonic sources is a subject beyond the current state of the harmonic analysis art, and accepted methodologies for doing such analysis are practically non-existent. The approach used in this study is a rational approximation of the relative impact of the changes in system resonant tuning by the addition of the Phase 1 and Phase 2 cables. The analysis is not claimed to be an exact or rigorous analysis.
GE Power Systems Energy Consulting NU Phase 2 Final Report.doc 4-7
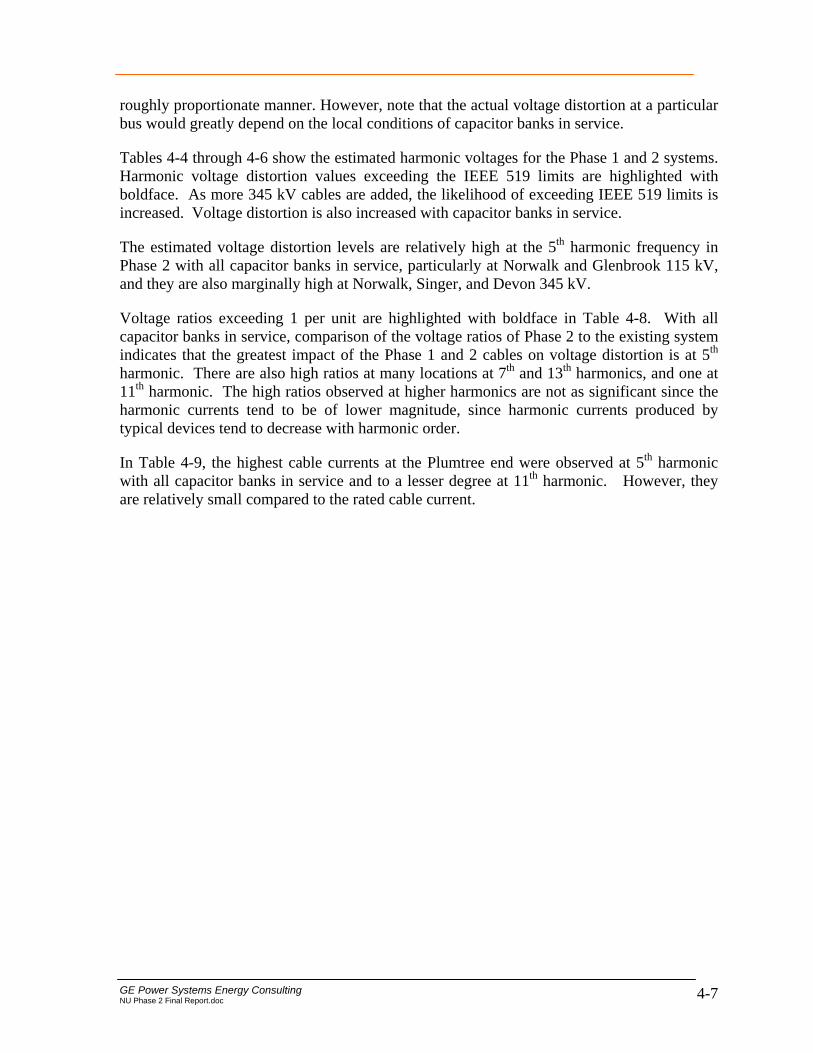
roughly proportionate manner. However, note that the actual voltage distortion at a particular bus would greatly depend on the local conditions of capacitor banks in service.
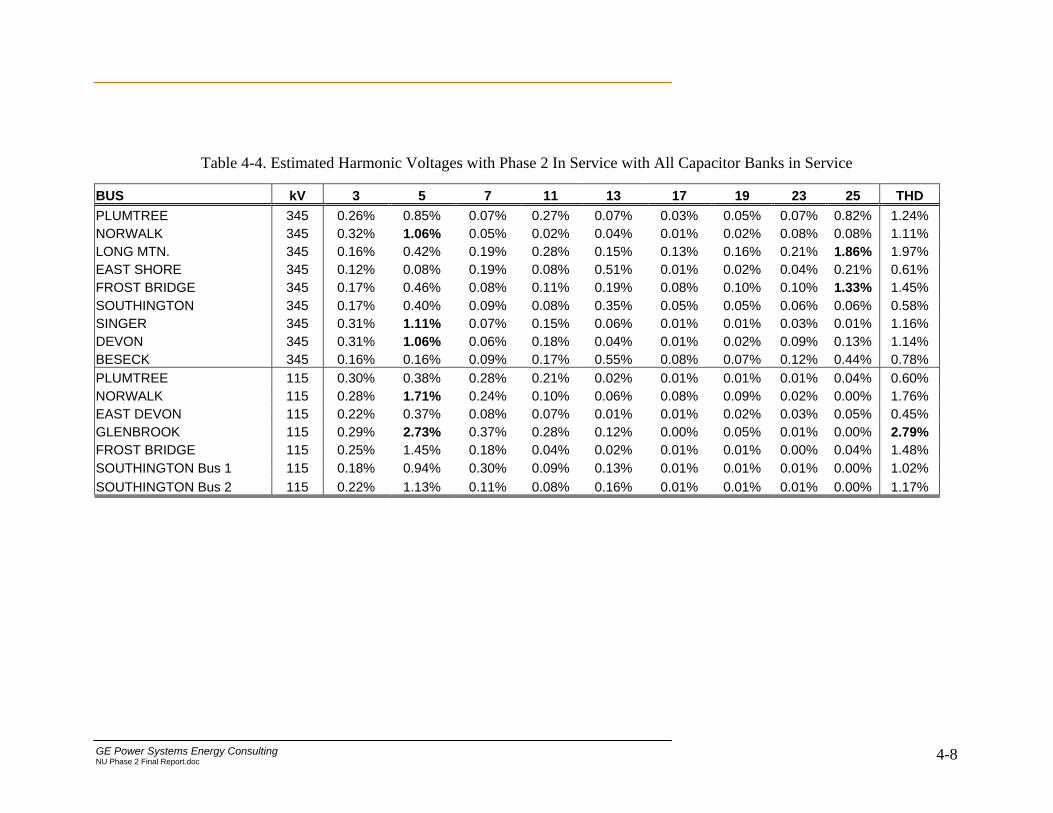
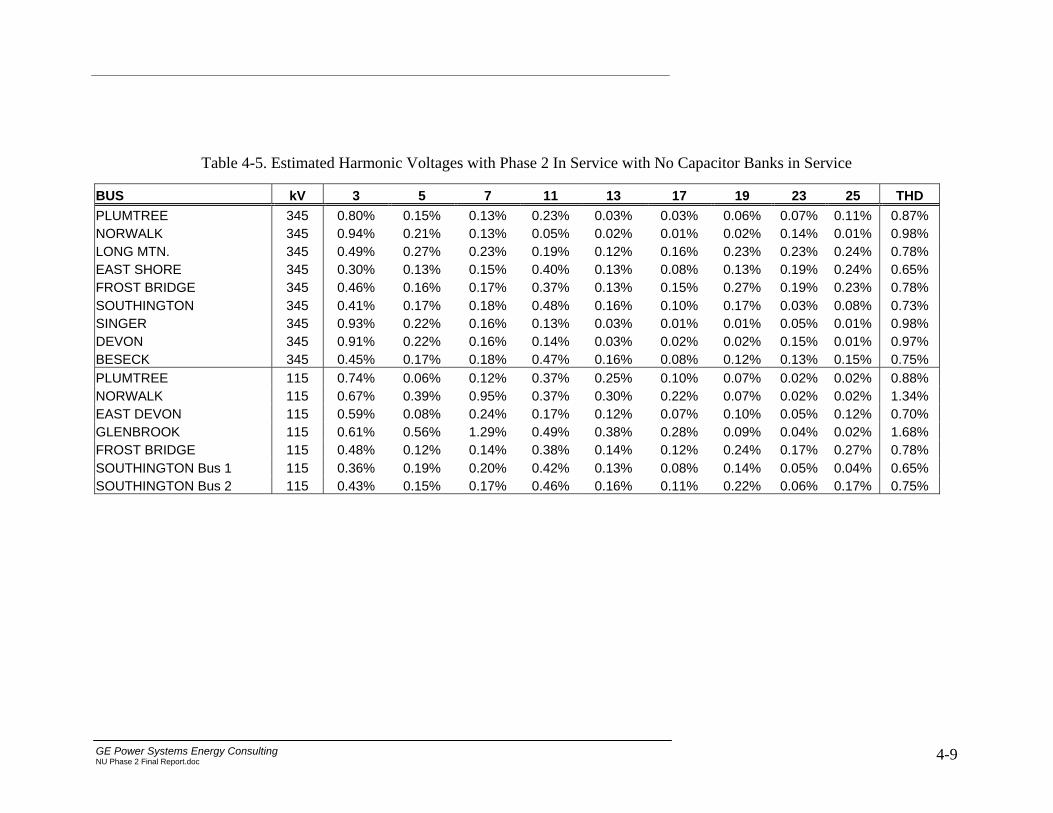
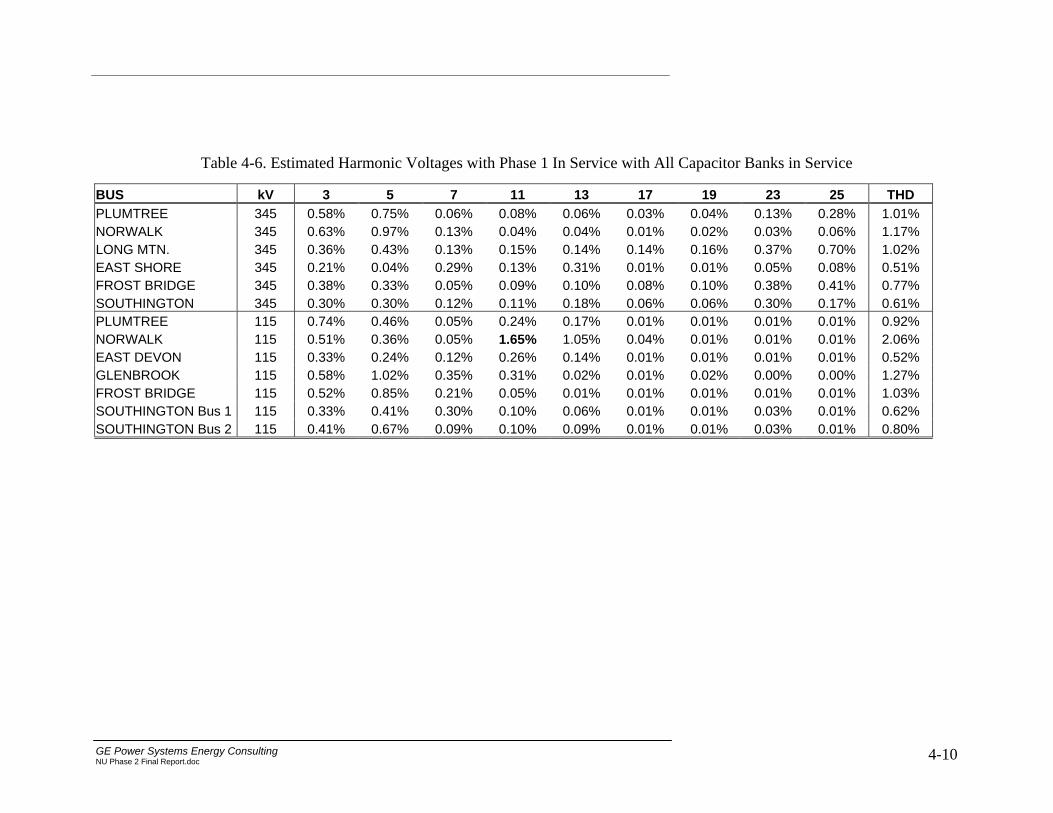
Tables 4-4 through 4-6 show the estimated harmonic voltages for the Phase 1 and 2 systems. Harmonic voltage distortion values exceeding the IEEE 519 limits are highlighted with boldface. As more 345 kV cables are added, the likelihood of exceeding IEEE 519 limits is increased. Voltage distortion is also increased with capacitor banks in service.
The estimated voltage distortion levels are relatively high at the 5th harmonic frequency in Phase 2 with all capacitor banks in service, particularly at Norwalk and Glenbrook 115 kV, and they are also marginally high at Norwalk, Singer, and Devon 345 kV.
Voltage ratios exceeding 1 per unit are highlighted with boldface in Table 4-8. With all capacitor banks in service, comparison of the voltage ratios of Phase 2 to the existing system indicates that the greatest impact of the Phase 1 and 2 cables on voltage distortion is at 5th harmonic. There are also high ratios at many locations at 7th and 13th harmonics, and one at 11th harmonic. The high ratios observed at higher harmonics are not as significant since the harmonic currents tend to be of lower magnitude, since harmonic currents produced by typical devices tend to decrease with harmonic order.
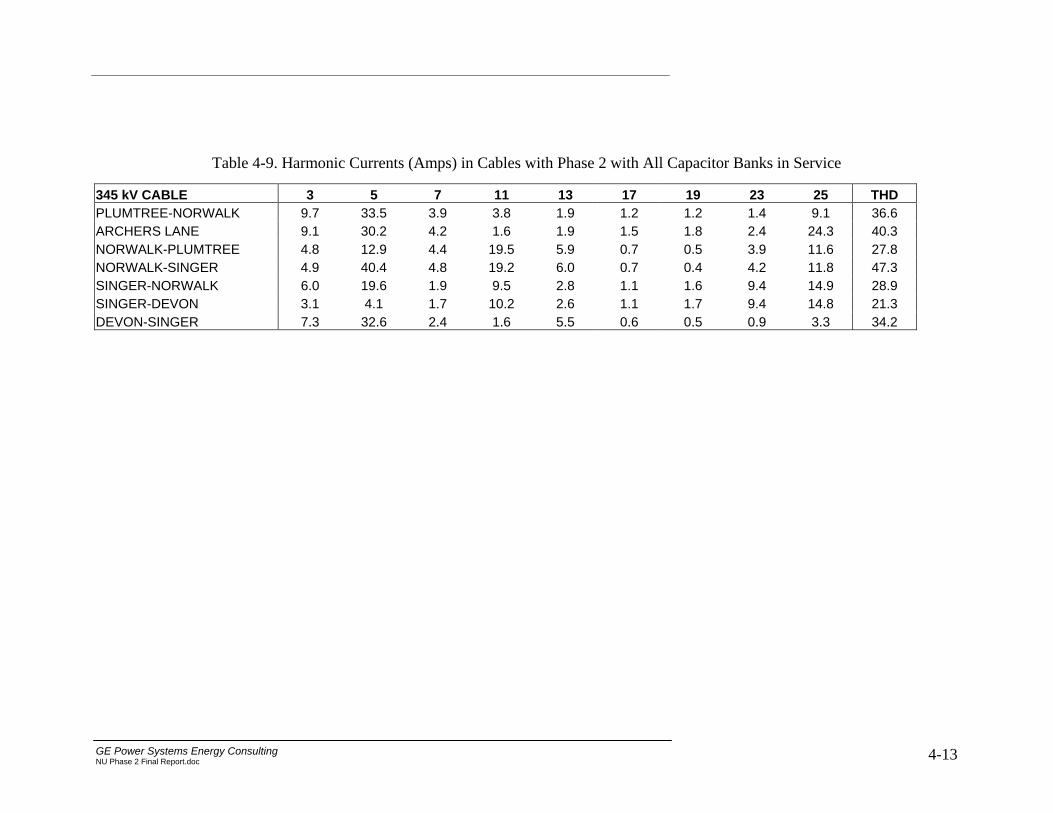
In Table 4-9, the highest cable currents at the Plumtree end were observed at 5th harmonic with all capacitor banks in service and to a lesser degree at 11th harmonic. However, they are relatively small compared to the rated cable current.
GE Power Systems Energy Consulting NU Phase 2 Final Report.doc 4-8
Table 4-4. Estimated Harmonic Voltages with Phase 2 In Service with All Capacitor Banks in Service
BUS kV 3 5 7 11 13 17 19 23 25 THD PLUMTREE 345 0.26% 0.85% 0.07% 0.27% 0.07% 0.03% 0.05% 0.07% 0.82% 1.24% NORWALK 345 0.32% 1.06% 0.05% 0.02% 0.04% 0.01% 0.02% 0.08% 0.08% 1.11% LONG MTN. 345 0.16% 0.42% 0.19% 0.28% 0.15% 0.13% 0.16% 0.21% 1.86% 1.97% EAST SHORE 345 0.12% 0.08% 0.19% 0.08% 0.51% 0.01% 0.02% 0.04% 0.21% 0.61% FROST BRIDGE 345 0.17% 0.46% 0.08% 0.11% 0.19% 0.08% 0.10% 0.10% 1.33% 1.45% SOUTHINGTON 345 0.17% 0.40% 0.09% 0.08% 0.35% 0.05% 0.05% 0.06% 0.06% 0.58% SINGER 345 0.31% 1.11% 0.07% 0.15% 0.06% 0.01% 0.01% 0.03% 0.01% 1.16% DEVON 345 0.31% 1.06% 0.06% 0.18% 0.04% 0.01% 0.02% 0.09% 0.13% 1.14% BESECK 345 0.16% 0.16% 0.09% 0.17% 0.55% 0.08% 0.07% 0.12% 0.44% 0.78% PLUMTREE 115 0.30% 0.38% 0.28% 0.21% 0.02% 0.01% 0.01% 0.01% 0.04% 0.60% NORWALK 115 0.28% 1.71% 0.24% 0.10% 0.06% 0.08% 0.09% 0.02% 0.00% 1.76% EAST DEVON 115 0.22% 0.37% 0.08% 0.07% 0.01% 0.01% 0.02% 0.03% 0.05% 0.45% GLENBROOK 115 0.29% 2.73% 0.37% 0.28% 0.12% 0.00% 0.05% 0.01% 0.00% 2.79% FROST BRIDGE 115 0.25% 1.45% 0.18% 0.04% 0.02% 0.01% 0.01% 0.00% 0.04% 1.48% SOUTHINGTON Bus 1 115 0.18% 0.94% 0.30% 0.09% 0.13% 0.01% 0.01% 0.01% 0.00% 1.02% SOUTHINGTON Bus 2 115 0.22% 1.13% 0.11% 0.08% 0.16% 0.01% 0.01% 0.01% 0.00% 1.17%
GE Power Systems Energy Consulting NU Phase 2 Final Report.doc 4-9
Table 4-5. Estimated Harmonic Voltages with Phase 2 In Service with No Capacitor Banks in Service
BUS kV 3 5 7 11 13 17 19 23 25 THD PLUMTREE 345 0.80% 0.15% 0.13% 0.23% 0.03% 0.03% 0.06% 0.07% 0.11% 0.87% NORWALK 345 0.94% 0.21% 0.13% 0.05% 0.02% 0.01% 0.02% 0.14% 0.01% 0.98% LONG MTN. 345 0.49% 0.27% 0.23% 0.19% 0.12% 0.16% 0.23% 0.23% 0.24% 0.78% EAST SHORE 345 0.30% 0.13% 0.15% 0.40% 0.13% 0.08% 0.13% 0.19% 0.24% 0.65% FROST BRIDGE 345 0.46% 0.16% 0.17% 0.37% 0.13% 0.15% 0.27% 0.19% 0.23% 0.78% SOUTHINGTON 345 0.41% 0.17% 0.18% 0.48% 0.16% 0.10% 0.17% 0.03% 0.08% 0.73% SINGER 345 0.93% 0.22% 0.16% 0.13% 0.03% 0.01% 0.01% 0.05% 0.01% 0.98% DEVON 345 0.91% 0.22% 0.16% 0.14% 0.03% 0.02% 0.02% 0.15% 0.01% 0.97% BESECK 345 0.45% 0.17% 0.18% 0.47% 0.16% 0.08% 0.12% 0.13% 0.15% 0.75% PLUMTREE 115 0.74% 0.06% 0.12% 0.37% 0.25% 0.10% 0.07% 0.02% 0.02% 0.88% NORWALK 115 0.67% 0.39% 0.95% 0.37% 0.30% 0.22% 0.07% 0.02% 0.02% 1.34% EAST DEVON 115 0.59% 0.08% 0.24% 0.17% 0.12% 0.07% 0.10% 0.05% 0.12% 0.70% GLENBROOK 115 0.61% 0.56% 1.29% 0.49% 0.38% 0.28% 0.09% 0.04% 0.02% 1.68% FROST BRIDGE 115 0.48% 0.12% 0.14% 0.38% 0.14% 0.12% 0.24% 0.17% 0.27% 0.78% SOUTHINGTON Bus 1 115 0.36% 0.19% 0.20% 0.42% 0.13% 0.08% 0.14% 0.05% 0.04% 0.65% SOUTHINGTON Bus 2 115 0.43% 0.15% 0.17% 0.46% 0.16% 0.11% 0.22% 0.06% 0.17% 0.75%
GE Power Systems Energy Consulting NU Phase 2 Final Report.doc 4-10
Table 4-6. Estimated Harmonic Voltages with Phase 1 In Service with All Capacitor Banks in Service
BUS kV 3 5 7 11 13 17 19 23 25 THD PLUMTREE 345 0.58% 0.75% 0.06% 0.08% 0.06% 0.03% 0.04% 0.13% 0.28% 1.01% NORWALK 345 0.63% 0.97% 0.13% 0.04% 0.04% 0.01% 0.02% 0.03% 0.06% 1.17% LONG MTN. 345 0.36% 0.43% 0.13% 0.15% 0.14% 0.14% 0.16% 0.37% 0.70% 1.02% EAST SHORE 345 0.21% 0.04% 0.29% 0.13% 0.31% 0.01% 0.01% 0.05% 0.08% 0.51% FROST BRIDGE 345 0.38% 0.33% 0.05% 0.09% 0.10% 0.08% 0.10% 0.38% 0.41% 0.77% SOUTHINGTON 345 0.30% 0.30% 0.12% 0.11% 0.18% 0.06% 0.06% 0.30% 0.17% 0.61% PLUMTREE 115 0.74% 0.46% 0.05% 0.24% 0.17% 0.01% 0.01% 0.01% 0.01% 0.92% NORWALK 115 0.51% 0.36% 0.05% 1.65% 1.05% 0.04% 0.01% 0.01% 0.01% 2.06% EAST DEVON 115 0.33% 0.24% 0.12% 0.26% 0.14% 0.01% 0.01% 0.01% 0.01% 0.52% GLENBROOK 115 0.58% 1.02% 0.35% 0.31% 0.02% 0.01% 0.02% 0.00% 0.00% 1.27% FROST BRIDGE 115 0.52% 0.85% 0.21% 0.05% 0.01% 0.01% 0.01% 0.01% 0.01% 1.03% SOUTHINGTON Bus 1 115 0.33% 0.41% 0.30% 0.10% 0.06% 0.01% 0.01% 0.03% 0.01% 0.62% SOUTHINGTON Bus 2 115 0.41% 0.67% 0.09% 0.10% 0.09% 0.01% 0.01% 0.03% 0.01% 0.80%
GE Power Systems Energy Consulting NU Phase 2 Final Report.doc 4-11
Table 4-7. Estimated Harmonic Voltages for the Existing System with All Capacitor Banks in Service
BUS kV 3 5 7 11 13 17 19 23 25 THD PLUMTREE 345 0.70% 0.25% 0.20% 0.30% 0.10% 0.21% 0.42% 0.22% 0.25% 1.01% LONG MTN. 345 0.58% 0.36% 0.28% 0.30% 0.18% 0.29% 0.55% 0.25% 0.27% 1.09% EAST SHORE 345 0.36% 0.05% 0.29% 0.13% 0.31% 0.01% 0.01% 0.04% 0.04% 0.58% FROST BRIDGE 345 0.63% 0.34% 0.10% 0.14% 0.12% 0.16% 0.34% 0.22% 0.14% 0.87% SOUTHINGTON 345 0.52% 0.30% 0.13% 0.11% 0.18% 0.07% 0.11% 0.19% 0.12% 0.70% PLUMTREE 115 0.96% 0.28% 0.06% 0.33% 0.13% 0.05% 0.07% 0.02% 0.02% 1.07% NORWALK 115 0.86% 0.41% 0.04% 1.30% 0.44% 0.03% 0.01% 0.01% 0.00% 1.67% EAST DEVON 115 0.55% 0.21% 0.12% 0.18% 0.05% 0.01% 0.01% 0.01% 0.01% 0.63% GLENBROOK 115 1.02% 0.80% 0.35% 0.06% 0.04% 0.02% 0.03% 0.00% 0.00% 1.35% FROST BRIDGE 115 0.85% 0.75% 0.22% 0.08% 0.01% 0.01% 0.02% 0.01% 0.00% 1.16% SOUTHINGTON Bus 1 115 0.57% 0.51% 0.30% 0.11% 0.06% 0.01% 0.02% 0.02% 0.01% 0.83% SOUTHINGTON Bus 2 115 0.70% 0.61% 0.09% 0.10% 0.09% 0.01% 0.02% 0.02% 0.01% 0.94%

GE Power Systems Energy Consulting NU Phase 2 Final Report.doc 4-12
Table 4-8. Ratio of Voltage for Phase 2 System to Voltage for Existing System with All Capacitor Banks in Service
BUS kV 3 5 7 11 13 17 19 23 25 THD PLUMTREE 345 0.38 3.40 0.33 0.88 0.75 0.13 0.11 0.33 3.22 1.23 LONG MTN. 345 0.27 1.16 0.69 0.93 0.82 0.46 0.30 0.84 6.93 1.81 EAST SHORE 345 0.34 1.68 0.64 0.62 1.64 0.98 1.16 1.02 5.40 1.05 FROST BRIDGE 345 0.27 1.37 0.75 0.81 1.58 0.47 0.31 0.46 9.44 1.66 SOUTHINGTON 345 0.32 1.33 0.70 0.74 1.92 0.77 0.46 0.29 0.50 0.82 PLUMTREE 115 0.31 1.33 4.91 0.62 0.18 0.16 0.15 0.31 2.51 0.56 NORWALK 115 0.33 4.17 5.56 0.08 0.14 2.36 6.67 2.62 0.76 1.06 EAST DEVON 115 0.40 1.78 0.61 0.38 0.26 0.91 1.20 3.20 8.27 0.71 GLENBROOK 115 0.29 3.39 1.06 4.39 3.30 0.21 2.15 1.83 1.58 2.06 FROST BRIDGE 115 0.30 1.93 0.81 0.42 1.52 0.53 0.32 0.51 8.84 1.28 SOUTHINGTON Bus 1 115 0.32 1.85 1.03 0.79 1.96 0.79 0.47 0.30 0.49 1.23 SOUTHINGTON Bus 2 115 0.31 1.86 1.27 0.79 1.81 0.81 0.49 0.31 0.53 1.25
GE Power Systems Energy Consulting NU Phase 2 Final Report.doc 4-13
Table 4-9. Harmonic Currents (Amps) in Cables with Phase 2 with All Capacitor Banks in Service
345 kV CABLE 3 5 7 11 13 17 19 23 25 THD PLUMTREE-NORWALK 9.7 33.5 3.9 3.8 1.9 1.2 1.2 1.4 9.1 36.6 ARCHERS LANE 9.1 30.2 4.2 1.6 1.9 1.5 1.8 2.4 24.3 40.3 NORWALK-PLUMTREE 4.8 12.9 4.4 19.5 5.9 0.7 0.5 3.9 11.6 27.8 NORWALK-SINGER 4.9 40.4 4.8 19.2 6.0 0.7 0.4 4.2 11.8 47.3 SINGER-NORWALK 6.0 19.6 1.9 9.5 2.8 1.1 1.6 9.4 14.9 28.9 SINGER-DEVON 3.1 4.1 1.7 10.2 2.6 1.1 1.7 9.4 14.8 21.3 DEVON-SINGER 7.3 32.6 2.4 1.6 5.5 0.6 0.5 0.9 3.3 34.2
GE Power Systems Energy Consulting NU Phase 2 Final Report.doc 4-14
Although the harmonic distortion levels which will occur with the addition of the Phase 2 system cannot be precisely predicted, the results show that there is an expectation that the planned cable additions will increase the risk of voltage distortion levels at individual harmonic orders exceeding accepted limits. The concern is that voltage distortion tends to propagate down to the consumer level, having a detrimental effect on power quality and utility equipment. Harmonic analysis results show impedance resonances near 3rd , 5th, 7th, and 11th harmonics and indicated the potential for voltage distortion gains at low-order harmonic frequencies with the Phase 2 addition. NU provided some harmonic measurements gathered over a one week period in early August. Average voltage distortion levels were exceeding 1% at Norwalk at 3rd and 5th harmonics. Since impedance resonances and voltage distortion levels are highly dependent on local conditions of capacitor banks in service, it is difficult to predict the voltage distortion levels that could exist in Phase 2.
GE Power Systems Energy Consulting C:\LizFiles\ERP\EMTP\NUphase2design\Phase 2 Final Report Docs\NU Phase 2 Final Report.doc, 11/17/03 5-1
5. Switching Transient Analysis
The critical issues that were examined in regard to switching cables and transformers, and clearing faults, in the Phase 2 system were power quality and equipment duty. Different criteria were applied for evaluation of transient and temporary overvoltages and distortion resulting from routine switching operations, and results from contingencies such as faults and equipment failures. Sustained and distorted overvoltages, resulting from routine cable and transformer switching, are not acceptable when considering power quality throughout the system. Various switchgear options were considered to minimize the switching transient when energizing the cables and adjacent transformers. For fault and equipment failure events, avoidance of consequential equipment damage was the driving criterion. Equipment must be able to withstand temporary overvoltages, and circuit breakers must be capable of successfully interrupting under these conditions. Surge arrester energy duties were evaluated. To perform a reasonably comprehensive evaluation of the transient performance issues in the Phase 2 system, more than 200 simulation cases were performed.
Table 5-1 provides a case list of the switching transient simulations that were performed and includes the operating breaker, open breakers, fault type and location, shunt reactor settings, surge arresters in service, pre-insertion resistor size, capacitor bank dispatch, switch timing, and other system conditions. The corresponding simulation case plots can be found in Appendix C. The first page of the plots for each case are included in the Appendix, and the complete set of plots is included separately on a CD. This summary page includes the cable end voltage, surge arrester energies, and circuit breaker voltage. Quantities at each cable end are superposed on each plot.
Switchgear Considerations
Switchgear considerations included the investigation of circuit breaker closing technology required for cable and transformer energization and evaluation of circuit breaker recovery voltage for cable fault clearing situations.
Circuit Breaker Closing Technology
Various cable and transformer energization scenarios were first simulated with uncontrolled closing. When considering sensitive electronic load equipment, IEEE Standard 1100-1999 provides a volt-time curve guideline (ITIC curve) where overvoltage should be within the limits of 2.0 pu for 1 ms, 1.4 pu for 3 ms, and 1.2 pu for 0.5 s. The overvoltages at selected 115 kV buses, including the capacitor bank locations, were compared to the ITIC curve to evaluate the power quality resulting from the energization case. The curve was exceeded in most of the cable energization cases with uncontrolled closing. Figure 5-1 shows a sample 115 kV voltage and comparison with the ITIC curve for energization of the cable from Norwalk to Singer. A complete set of ITIC curve comparisons is provided in Appendix B, indicating the 115 kV location with the worst power quality evaluation for each of the cable and transformer energization cases.
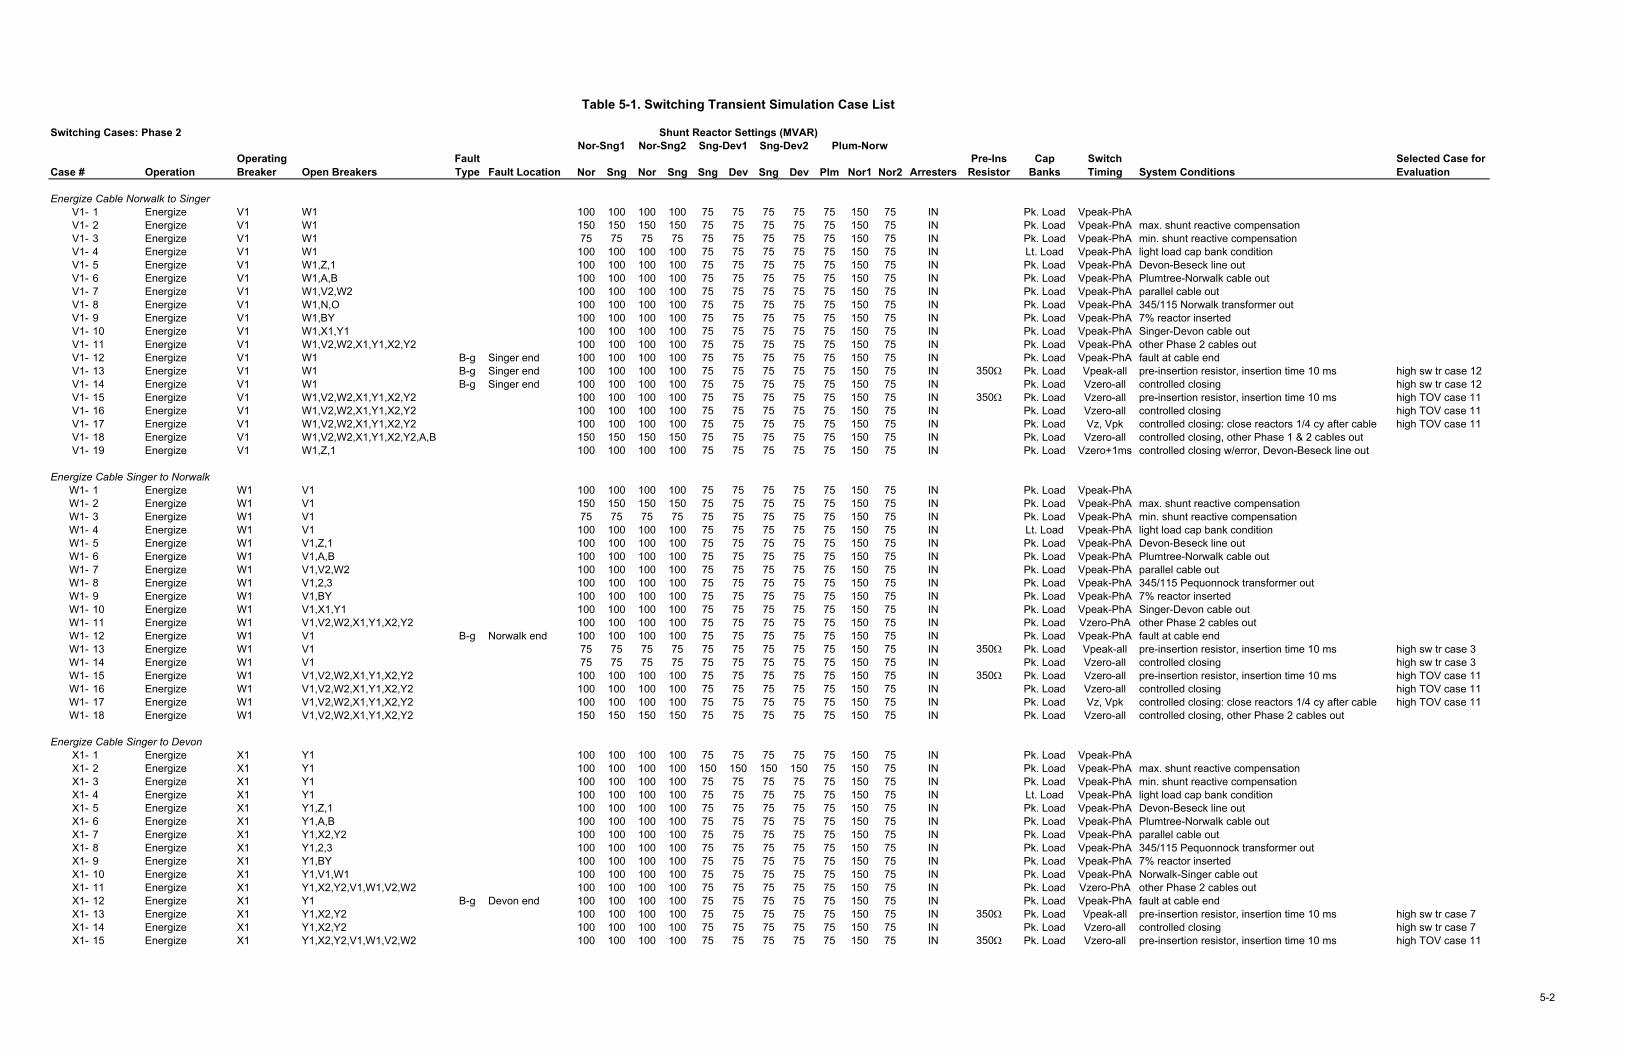
Table 5-1. Switching Transient Simulation Case List
Switching Cases: Phase 2
Case # OperationOperating Breaker Open Breakers
Fault Type Fault Location Nor Sng Nor Sng Sng Dev Sng Dev Plm Nor1 Nor2 Arresters
Pre-Ins Resistor
Cap Banks
Switch Timing System Conditions
Selected Case for Evaluation
Shunt Reactor Settings (MVAR)Nor-Sng1 Nor-Sng2 Sng-Dev1 Sng-Dev2 Plum-Norw
Energize Cable Norwalk to SingerV1- 1 Energize V1 W1 100 100 100 100 75 75 75 75 75 150 75 IN Pk. Load Vpeak-PhAV1- 2 Energize V1 W1 150 150 150 150 75 75 75 75 75 150 75 IN Pk. Load Vpeak-PhA max. shunt reactive compensationV1- 3 Energize V1 W1 75 75 75 75 75 75 75 75 75 150 75 IN Pk. Load Vpeak-PhA min. shunt reactive compensationV1- 4 Energize V1 W1 100 100 100 100 75 75 75 75 75 150 75 IN Lt. Load Vpeak-PhA light load cap bank conditionV1- 5 Energize V1 W1,Z,1 100 100 100 100 75 75 75 75 75 150 75 IN Pk. Load Vpeak-PhA Devon-Beseck line outV1- 6 Energize V1 W1,A,B 100 100 100 100 75 75 75 75 75 150 75 IN Pk. Load Vpeak-PhA Plumtree-Norwalk cable outV1- 7 Energize V1 W1,V2,W2 100 100 100 100 75 75 75 75 75 150 75 IN Pk. Load Vpeak-PhA parallel cable outV1- 8 Energize V1 W1,N,O 100 100 100 100 75 75 75 75 75 150 75 IN Pk. Load Vpeak-PhA 345/115 Norwalk transformer outV1- 9 Energize V1 W1,BY 100 100 100 100 75 75 75 75 75 150 75 IN Pk. Load Vpeak-PhA 7% reactor insertedV1- 10 Energize V1 W1,X1,Y1 100 100 100 100 75 75 75 75 75 150 75 IN Pk. Load Vpeak-PhA Singer-Devon cable outV1- 11 Energize V1 W1,V2,W2,X1,Y1,X2,Y2 100 100 100 100 75 75 75 75 75 150 75 IN Pk. Load Vpeak-PhA other Phase 2 cables outV1- 12 Energize V1 W1 B-g Singer end 100 100 100 100 75 75 75 75 75 150 75 IN Pk. Load Vpeak-PhA fault at cable endV1- 13 Energize V1 W1 B-g Singer end 100 100 100 100 75 75 75 75 75 150 75 IN 350Ω Pk. Load Vpeak-all pre-insertion resistor, insertion time 10 ms high sw tr case 12V1- 14 Energize V1 W1 B-g Singer end 100 100 100 100 75 75 75 75 75 150 75 IN Pk. Load Vzero-all controlled closing high sw tr case 12V1- 15 Energize V1 W1,V2,W2,X1,Y1,X2,Y2 100 100 100 100 75 75 75 75 75 150 75 IN 350Ω Pk. Load Vzero-all pre-insertion resistor, insertion time 10 ms high TOV case 11V1- 16 Energize V1 W1,V2,W2,X1,Y1,X2,Y2 100 100 100 100 75 75 75 75 75 150 75 IN Pk. Load Vzero-all controlled closing high TOV case 11V1- 17 Energize V1 W1,V2,W2,X1,Y1,X2,Y2 100 100 100 100 75 75 75 75 75 150 75 IN Pk. Load Vz, Vpk controlled closing: close reactors 1/4 cy after cable high TOV case 11V1- 18 Energize V1 W1,V2,W2,X1,Y1,X2,Y2,A,B 150 150 150 150 75 75 75 75 75 150 75 IN Pk. Load Vzero-all controlled closing, other Phase 1 & 2 cables outV1- 19 Energize V1 W1,Z,1 100 100 100 100 75 75 75 75 75 150 75 IN Pk. Load Vzero+1ms controlled closing w/error, Devon-Beseck line out
Energize Cable Singer to NorwalkW1- 1 Energize W1 V1 100 100 100 100 75 75 75 75 75 150 75 IN Pk. Load Vpeak-PhAW1- 2 Energize W1 V1 150 150 150 150 75 75 75 75 75 150 75 IN Pk. Load Vpeak-PhA max. shunt reactive compensationW1- 3 Energize W1 V1 75 75 75 75 75 75 75 75 75 150 75 IN Pk. Load Vpeak-PhA min. shunt reactive compensationW1- 4 Energize W1 V1 100 100 100 100 75 75 75 75 75 150 75 IN Lt. Load Vpeak-PhA light load cap bank conditionW1- 5 Energize W1 V1,Z,1 100 100 100 100 75 75 75 75 75 150 75 IN Pk. Load Vpeak-PhA Devon-Beseck line outW1- 6 Energize W1 V1,A,B 100 100 100 100 75 75 75 75 75 150 75 IN Pk. Load Vpeak-PhA Plumtree-Norwalk cable outW1- 7 Energize W1 V1,V2,W2 100 100 100 100 75 75 75 75 75 150 75 IN Pk. Load Vpeak-PhA parallel cable outW1- 8 Energize W1 V1,2,3 100 100 100 100 75 75 75 75 75 150 75 IN Pk. Load Vpeak-PhA 345/115 Pequonnock transformer outW1- 9 Energize W1 V1,BY 100 100 100 100 75 75 75 75 75 150 75 IN Pk. Load Vpeak-PhA 7% reactor insertedW1- 10 Energize W1 V1,X1,Y1 100 100 100 100 75 75 75 75 75 150 75 IN Pk. Load Vpeak-PhA Singer-Devon cable outW1- 11 Energize W1 V1,V2,W2,X1,Y1,X2,Y2 100 100 100 100 75 75 75 75 75 150 75 IN Pk. Load Vzero-PhA other Phase 2 cables outW1- 12 Energize W1 V1 B-g Norwalk end 100 100 100 100 75 75 75 75 75 150 75 IN Pk. Load Vpeak-PhA fault at cable endW1- 13 Energize W1 V1 75 75 75 75 75 75 75 75 75 150 75 IN 350Ω Pk. Load Vpeak-all pre-insertion resistor, insertion time 10 ms high sw tr case 3W1- 14 Energize W1 V1 75 75 75 75 75 75 75 75 75 150 75 IN Pk. Load Vzero-all controlled closing high sw tr case 3W1- 15 Energize W1 V1,V2,W2,X1,Y1,X2,Y2 100 100 100 100 75 75 75 75 75 150 75 IN 350Ω Pk. Load Vzero-all pre-insertion resistor, insertion time 10 ms high TOV case 11W1- 16 Energize W1 V1,V2,W2,X1,Y1,X2,Y2 100 100 100 100 75 75 75 75 75 150 75 IN Pk. Load Vzero-all controlled closing high TOV case 11W1- 17 Energize W1 V1,V2,W2,X1,Y1,X2,Y2 100 100 100 100 75 75 75 75 75 150 75 IN Pk. Load Vz, Vpk controlled closing: close reactors 1/4 cy after cable high TOV case 11W1- 18 Energize W1 V1,V2,W2,X1,Y1,X2,Y2 150 150 150 150 75 75 75 75 75 150 75 IN Pk. Load Vzero-all controlled closing, other Phase 2 cables out
Energize Cable Singer to DevonX1- 1 Energize X1 Y1 100 100 100 100 75 75 75 75 75 150 75 IN Pk. Load Vpeak-PhAX1- 2 Energize X1 Y1 100 100 100 100 150 150 150 150 75 150 75 IN Pk. Load Vpeak-PhA max. shunt reactive compensationX1- 3 Energize X1 Y1 100 100 100 100 75 75 75 75 75 150 75 IN Pk. Load Vpeak-PhA min. shunt reactive compensationX1- 4 Energize X1 Y1 100 100 100 100 75 75 75 75 75 150 75 IN Lt. Load Vpeak-PhA light load cap bank conditionX1- 5 Energize X1 Y1,Z,1 100 100 100 100 75 75 75 75 75 150 75 IN Pk. Load Vpeak-PhA Devon-Beseck line outX1- 6 Energize X1 Y1,A,B 100 100 100 100 75 75 75 75 75 150 75 IN Pk. Load Vpeak-PhA Plumtree-Norwalk cable outX1- 7 Energize X1 Y1,X2,Y2 100 100 100 100 75 75 75 75 75 150 75 IN Pk. Load Vpeak-PhA parallel cable outX1- 8 Energize X1 Y1,2,3 100 100 100 100 75 75 75 75 75 150 75 IN Pk. Load Vpeak-PhA 345/115 Pequonnock transformer outX1- 9 Energize X1 Y1,BY 100 100 100 100 75 75 75 75 75 150 75 IN Pk. Load Vpeak-PhA 7% reactor insertedX1- 10 Energize X1 Y1,V1,W1 100 100 100 100 75 75 75 75 75 150 75 IN Pk. Load Vpeak-PhA Norwalk-Singer cable outX1- 11 Energize X1 Y1,X2,Y2,V1,W1,V2,W2 100 100 100 100 75 75 75 75 75 150 75 IN Pk. Load Vzero-PhA other Phase 2 cables outX1- 12 Energize X1 Y1 B-g Devon end 100 100 100 100 75 75 75 75 75 150 75 IN Pk. Load Vpeak-PhA fault at cable endX1- 13 Energize X1 Y1,X2,Y2 100 100 100 100 75 75 75 75 75 150 75 IN 350Ω Pk. Load Vpeak-all pre-insertion resistor, insertion time 10 ms high sw tr case 7X1- 14 Energize X1 Y1,X2,Y2 100 100 100 100 75 75 75 75 75 150 75 IN Pk. Load Vzero-all controlled closing high sw tr case 7X1- 15 Energize X1 Y1,X2,Y2,V1,W1,V2,W2 100 100 100 100 75 75 75 75 75 150 75 IN 350Ω Pk. Load Vzero-all pre-insertion resistor, insertion time 10 ms high TOV case 11
5-2

Table 5-1. Switching Transient Simulation Case List
Switching Cases: Phase 2
Case # OperationOperating Breaker Open Breakers
Fault Type Fault Location Nor Sng Nor Sng Sng Dev Sng Dev Plm Nor1 Nor2 Arresters
Pre-Ins Resistor
Cap Banks
Switch Timing System Conditions
Selected Case for Evaluation
Shunt Reactor Settings (MVAR)Nor-Sng1 Nor-Sng2 Sng-Dev1 Sng-Dev2 Plum-Norw
X1- 16 Energize X1 Y1,X2,Y2,V1,W1,V2,W2 100 100 100 100 75 75 75 75 75 150 75 IN Pk. Load Vzero-all controlled closing high TOV case 11X1- 17 Energize X1 Y1,X2,Y2,V1,W1,V2,W2 100 100 100 100 75 75 75 75 75 150 75 IN Pk. Load Vz, Vpk controlled closing: close reactors 1/4 cy after cable high TOV case 11X1- 18 Energize X1 Y1,X2,Y2,V1,W1,V2,W2 100 100 100 100 150 150 150 150 75 150 75 IN Pk. Load Vzero-all controlled closing, other Phase 2 cables out
Energize Cable Devon to SingerY1- 1 Energize Y1 X1 100 100 100 100 75 75 75 75 75 150 75 IN Pk. Load Vpeak-PhAY1- 2 Energize Y1 X1 100 100 100 100 150 150 150 150 75 150 75 IN Pk. Load Vpeak-PhA max. shunt reactive compensationY1- 3 Energize Y1 X1 100 100 100 100 75 75 75 75 75 150 75 IN Pk. Load Vpeak-PhA min. shunt reactive compensationY1- 4 Energize Y1 X1 100 100 100 100 75 75 75 75 75 150 75 IN Lt. Load Vpeak-PhA light load cap bank conditionY1- 5 Energize Y1 X1,Z,1 100 100 100 100 75 75 75 75 75 150 75 IN Pk. Load Vpeak-PhA Devon-Beseck line outY1- 6 Energize Y1 X1,A,B 100 100 100 100 75 75 75 75 75 150 75 IN Pk. Load Vpeak-PhA Plumtree-Norwalk cable outY1- 7 Energize Y1 X1,X2,Y2 100 100 100 100 75 75 75 75 75 150 75 IN Pk. Load Vzero-PhA parallel cable outY1- 8 Energize Y1 X1,6,7 100 100 100 100 75 75 75 75 75 150 75 IN Pk. Load Vpeak-PhA 345/115 Devon transformer outY1- 9 Energize Y1 X1,BY 100 100 100 100 75 75 75 75 75 150 75 IN Pk. Load Vpeak-PhA 7% reactor insertedY1- 10 Energize Y1 X1,V1,W1 100 100 100 100 75 75 75 75 75 150 75 IN Pk. Load Vpeak-PhA Norwalk-Singer cable outY1- 11 Energize Y1 X1,X2,Y2,V1,W1,V2,W2 100 100 100 100 75 75 75 75 75 150 75 IN Pk. Load Vzero-PhA other Phase 2 cables outY1- 12 Energize Y1 X1 B-g Singer end 100 100 100 100 75 75 75 75 75 150 75 IN Pk. Load Vpeak-PhA fault at cable endY1- 13 Energize Y1 X1,V1,W1 100 100 100 100 75 75 75 75 75 150 75 IN 350Ω Pk. Load Vpeak-all pre-insertion resistor, insertion time 10 ms high sw tr case 10Y1- 14 Energize Y1 X1,V1,W1 100 100 100 100 75 75 75 75 75 150 75 IN Pk. Load Vzero-all controlled closing high sw tr case 10Y1- 15 Energize Y1 X1,X2,Y2,V1,W1,V2,W2 100 100 100 100 75 75 75 75 75 150 75 IN 350Ω Pk. Load Vzero-all pre-insertion resistor, insertion time 10 ms high TOV case 11Y1- 16 Energize Y1 X1,X2,Y2,V1,W1,V2,W2 100 100 100 100 75 75 75 75 75 150 75 IN Pk. Load Vzero-all controlled closing high TOV case 11Y1- 17 Energize Y1 X1,X2,Y2,V1,W1,V2,W2 100 100 100 100 75 75 75 75 75 150 75 IN Pk. Load Vz, Vpk controlled closing: close reactors 1/4 cy after cable high TOV case 11Y1- 18 Energize Y1 X1,X2,Y2,V1,W1,V2,W2 100 100 100 100 150 150 150 150 75 150 75 IN Pk. Load Vzero-all controlled closing, other Phase 2 cables outY1- 19 Energize Y1 X1 A-g Devon end 100 100 100 100 75 75 75 75 75 150 75 IN Pk. Load Vzero-all controlled closing, open Y1 to chop dc current
Energize Line Devon to BeseckZ- 1 Energize Z 1 100 100 100 100 75 75 75 75 75 150 75 IN Pk. Load Vpeak-PhA
Energize Norwalk TransformerN- 1 Energize N O 100 100 100 100 75 75 75 75 75 150 75 IN Pk. Load Vzero-allN- 2 Energize N O 100 100 100 100 75 75 75 75 75 150 75 IN Lt. Load Vzero-all light load cap bank conditionN- 3 Energize N O,Z,1 100 100 100 100 75 75 75 75 75 150 75 IN Pk. Load Vzero-all Devon-Beseck line outN- 4 Energize N O,A,B 100 100 100 100 75 75 75 75 75 150 75 IN Pk. Load Vzero-all Plumtree-Norwalk cable outN- 5 Energize N O,V1,W1 100 100 100 100 75 75 75 75 75 150 75 IN Pk. Load Vzero-all Norwalk-Singer cable outN- 6 Energize N O,R,S 100 100 100 100 75 75 75 75 75 150 75 IN Pk. Load Vzero-all 345/115 Norwalk transformer outN- 7 Energize N O,V1,W1,V2,W2,X1,Y1,X2,Y2,
Z,1,2,3,4,5,6,7100 100 100 100 75 75 75 75 75 150 75 IN Pk. Load Vzero-all energizing Phase 2
N- 8 Energize N O,X1,Y1,X2,Y2 100 100 100 100 75 75 75 75 75 150 75 IN Pk. Load Vzero-all Singer-Devon cables outN- 9 Energize N O,X1,Y1,X2,Y2 100 100 100 100 75 75 75 75 75 150 75 IN 350Ω Vzero-all pre-insertion resistor, insertion time 10 ms high TOV case 8N- 10 Energize N O,X1,Y1,X2,Y2 100 100 100 100 75 75 75 75 75 150 75 IN Vpeak-all controlled closing high TOV case 8
Energize Singer/Pequonnock Transformer2- 1 Energize 2 3 100 100 100 100 75 75 75 75 75 150 75 IN Pk. Load Vzero-all2- 2 Energize 2 3 100 100 100 100 75 75 75 75 75 150 75 IN Lt. Load Vzero-all light load cap bank condition2- 3 Energize 2 3,Z,1 100 100 100 100 75 75 75 75 75 150 75 IN Pk. Load Vzero-all Devon-Beseck line out2- 4 Energize 2 3,A,B 100 100 100 100 75 75 75 75 75 150 75 IN Pk. Load Vzero-all Plumtree-Norwalk cable out2- 5 Energize 2 3,V1,W1 100 100 100 100 75 75 75 75 75 150 75 IN Pk. Load Vzero-all Norwalk-Singer cable out2- 6 Energize 2 3,4,5 100 100 100 100 75 75 75 75 75 150 75 IN Pk. Load Vzero-all 345/115 Singer/BrgEnergy transformer out2- 7 Energize 2 3,X1,Y1,X2,Y2,Z,1,4,5,6,7 100 100 100 100 75 75 75 75 75 150 75 IN Pk. Load Vzero-all energizing Phase 2
2- 8 Energize 2 3,X1,Y1,X2,Y2 100 100 100 100 75 75 75 75 75 150 75 IN Pk. Load Vzero-all Singer-Devon cables out2- 9 Energize 2 3,X1,Y1,X2,Y2 100 100 100 100 75 75 75 75 75 150 75 IN 350Ω Vzero-all pre-insertion resistor, insertion time 10 ms high TOV case 82- 10 Energize 2 3,X1,Y1,X2,Y2 100 100 100 100 75 75 75 75 75 150 75 IN Vpeak-all controlled closing high TOV case 8
Energize Devon Transformer6- 1 Energize 6 7 100 100 100 100 75 75 75 75 75 150 75 IN Pk. Load Vzero-all6- 2 Energize 6 7 100 100 100 100 75 75 75 75 75 150 75 IN Lt. Load Vzero-all light load cap bank condition
5-3

Table 5-1. Switching Transient Simulation Case List
Switching Cases: Phase 2
Case # OperationOperating Breaker Open Breakers
Fault Type Fault Location Nor Sng Nor Sng Sng Dev Sng Dev Plm Nor1 Nor2 Arresters
Pre-Ins Resistor
Cap Banks
Switch Timing System Conditions
Selected Case for Evaluation
Shunt Reactor Settings (MVAR)Nor-Sng1 Nor-Sng2 Sng-Dev1 Sng-Dev2 Plum-Norw
6- 3 Energize 6 7,Z,1 100 100 100 100 75 75 75 75 75 150 75 IN Pk. Load Vzero-all Devon-Beseck line out6- 4 Energize 6 7,A,B 100 100 100 100 75 75 75 75 75 150 75 IN Pk. Load Vzero-all Plumtree-Norwalk cable out6- 5 Energize 6 7,X1,Y1 100 100 100 100 75 75 75 75 75 150 75 IN Pk. Load Vzero-all Singer-Devon cable out6- 6 Energize 6 7,2,3 100 100 100 100 75 75 75 75 75 150 75 IN Pk. Load Vzero-all 345/115 Pequonnock transformer out6- 7 Energize 6 7,V1,W1,V2,W2,X1,Y1,X2,Y2,
2,3,4,5100 100 100 100 75 75 75 75 75 150 75 IN Pk. Load Vzero-all energizing Phase 2
6- 8 Energize 6 7,V1,W1,V2,W2 100 100 100 100 75 75 75 75 75 150 75 IN Pk. Load Vzero-all Norwalk-Singer cables out6- 9 Energize 6 7,V1,W1,V2,W2 100 100 100 100 75 75 75 75 75 150 75 IN 350Ω Vzero-all pre-insertion resistor, insertion time 10 ms high TOV case 86- 10 Energize 6 7,V1,W1,V2,W2 100 100 100 100 75 75 75 75 75 150 75 IN Vpeak-all controlled closing high TOV case 8
De-energize Cable Norwalk to SingerNS- 1 De-energize V1,W1 S1 75 0 75 75 75 75 75 75 75 150 75 IN Pk. Load Bkr W1 last open t=5,11cyNS- 2 De-energize V1,W1 S1,Z,1 75 0 75 75 75 75 75 75 75 150 75 IN Pk. Load Bkr W1 last D-B line out, open t=5,11cyNS- 3 De-energize W1,V1 S1 75 0 75 75 75 75 75 75 75 150 75 IN Pk. Load Bkr V1 last open t=5,11cyNS- 4 De-energize W1,V,O S1 75 0 75 75 75 75 75 75 75 150 75 IN Pk. Load Bkr O last stuck breaker at Norwalk, open t=5,13,14cyNS- 5 De-energize W1,V,O S1,Z,1 75 0 75 75 75 75 75 75 75 150 75 IN Pk. Load Bkr O last stuck breaker at Norwalk, D-B line outNS- 6 De-energize W1,V,O S1,Z,1 75 0 75 75 75 75 75 75 75 150 75 IN Lt. Load Bkr O last stuck breaker at Norwalk, D-B line out, lt.capNS- 7 De-energize V1,W,Y1 S1 75 0 75 75 75 75 75 75 75 150 75 IN Pk. Load Bkr Y1 last stuck breaker at Singer, open t=5,13,14cyNS- 8 De-energize V1,W,Y1 S1,Z,1 75 0 75 75 75 75 75 75 75 150 75 IN Pk. Load Bkr Y1 last stuck breaker at Singer, D-B line outNS- 9 De-energize V1,W,Y1 S1,Z,1 75 0 75 75 75 75 75 75 75 150 75 IN Lt. Load Bkr Y1 last stuck breaker at Singer, D-B line out, lt. capNS- 10 De-eng, Restrike V1,W1 S1 75 0 75 75 75 75 75 75 75 150 75 IN Pk. Load Restrk PhANS- 11 De-eng, Restrike W1,V1 S1 75 0 75 75 75 75 75 75 75 150 75 IN Pk. Load Restrk PhANS- 11-AR De-eng, Restrike W1,V1 S1 75 0 75 75 75 75 75 75 75 150 75 low V-I Pk. Load Restrk PhANS- 12 De-eng, Restrike V1,W1 S1,N1 0 0 75 75 75 75 75 75 75 150 75 IN Pk. Load Restrk PhA no shunt reactorsNS- 13 De-eng, Restrike W1,V1 S1,N1 0 0 75 75 75 75 75 75 75 150 75 IN Pk. Load Restrk PhA no shunt reactorsNS- 13-AR De-eng, Restrike W1,V1 S1,N1 0 0 75 75 75 75 75 75 75 150 75 low V-I Pk. Load Restrk PhA no shunt reactorsNS- 14 De-eng, Restrike W1,V,O S1 75 0 75 75 75 75 75 75 75 150 75 IN Pk. Load Restrk PhA stuck breaker at Norwalk, open t=5,13,14cyNS- 14-AR De-eng, Restrike W1,V,O S1 75 0 75 75 75 75 75 75 75 150 75 low V-I Pk. Load Restrk PhA stuck breaker at Norwalk, open t=5,13,14cy
De-energize Cable Singer to DevonSD- 1 De-energize X1,Y1 D1 75 75 75 75 75 0 75 75 75 150 75 IN Pk. Load Bkr Y1 last open t=5,11cySD- 2 De-energize X1,Y1 D1,Z,1 75 75 75 75 75 0 75 75 75 150 75 IN Pk. Load Bkr Y1 last D-B line out, open t=5,11cySD- 3 De-energize Y1,X1 D1 75 75 75 75 75 0 75 75 75 150 75 IN Pk. Load Bkr X1 last open t=5,11cySD- 4 De-energize X1,Y,7 D1 75 75 75 75 75 0 75 75 75 150 75 IN Pk. Load Bkr 7 last stuck breaker at Devon, open t=5,13,14cySD- 5 De-energize X1,Y,7 D1,Z,1 75 75 75 75 75 0 75 75 75 150 75 IN Pk. Load Bkr 7 last stuck breaker at Devon, D-B line outSD- 6 De-energize X1,Y,7 D1,Z,1 75 75 75 75 75 0 75 75 75 150 75 IN Lt. Load Bkr 7 last stuck breaker at Devon, D-B line out, lt.capSD- 7 De-energize Y1,W,V1 D1 75 75 75 75 75 0 75 75 75 150 75 IN Pk. Load Bkr V1 last stuck breaker at Singer, open t=5,13,14cySD- 8 De-energize Y1,W,V1 D1,Z,1 75 75 75 75 75 0 75 75 75 150 75 IN Pk. Load Bkr V1 last stuck breaker at Singer, D-B line outSD- 9 De-energize Y1,W,V1 D1,Z,1 75 75 75 75 75 0 75 75 75 150 75 IN Lt. Load Bkr V1 last stuck breaker at Singer, D-B line out, lt. capSD- 10 De-eng, Restrike X1,Y1 D1 75 75 75 75 75 0 75 75 75 150 75 IN Pk. Load Restrk PhASD- 11 De-eng, Restrike Y1,X1 D1 75 75 75 75 75 0 75 75 75 150 75 IN Pk. Load Restrk PhASD- 12 De-eng, Restrike X1,Y1 D1,S3 75 75 75 75 0 0 75 75 75 150 75 IN Pk. Load Restrk PhA no shunt reactorsSD- 13 De-eng, Restrike Y1,X1 D1,S3 75 75 75 75 0 0 75 75 75 150 75 IN Pk. Load Restrk PhA no shunt reactorsSD- 14 De-eng, Restrike X1,Y,7 D1 75 75 75 75 75 0 75 75 75 150 75 IN Pk. Load Restrk PhA stuck breaker at Devon, open t=5,13,14cy
Fault and Clear Cable Norwalk to Singer (apply fault at 1 cy)NSF- 1 De-energize V1,W1 S1 A-g Singer end 75 0 75 75 75 75 75 75 75 150 75 IN Pk. Load Bkr W1 last open t=5,11cyNSF- 2 De-energize V1,W1 S1,Z,1 A-g Singer end 75 0 75 75 75 75 75 75 75 150 75 IN Pk. Load Bkr W1 last D-B line out, open t=5,11cyNSF- 3 De-energize W1,V1 S1 A-g Singer end 75 0 75 75 75 75 75 75 75 150 75 IN Pk. Load Bkr V1 last open t=5,11cyNSF- 4 De-energize W1,V,O S1 A-g Singer end 75 0 75 75 75 75 75 75 75 150 75 IN Pk. Load Bkr O last stuck breaker at Norwalk, open t=5,13,14cyNSF- 5 De-energize W1,V,O S1,Z,1 A-g Singer end 75 0 75 75 75 75 75 75 75 150 75 IN Pk. Load Bkr O last stuck breaker at Norwalk, D-B line outNSF- 6 De-energize W1,V,O S1,Z,1 A-g Singer end 75 0 75 75 75 75 75 75 75 150 75 IN Lt. Load Bkr O last stuck breaker at Norwalk, D-B line out, lt.capNSF- 7 De-energize V1,W,Y1 S1 A-g Singer end 75 0 75 75 75 75 75 75 75 150 75 IN Pk. Load Bkr Y1 last stuck breaker at Singer, open t=5,13,14cyNSF- 8 De-energize V1,W,Y1 S1,Z,1 A-g Singer end 75 0 75 75 75 75 75 75 75 150 75 IN Pk. Load Bkr Y1 last stuck breaker at Singer, D-B line outNSF- 9 De-energize V1,W,Y1 S1,Z,1 A-g Singer end 75 0 75 75 75 75 75 75 75 150 75 IN Lt. Load Bkr Y1 last stuck breaker at Singer, D-B line out, lt. capNSF- 10 De-energize V1,W1 S1 ABC-g Singer end 75 0 75 75 75 75 75 75 75 150 75 IN Pk. Load Bkr W1 last open t=5,11cyNSF- 11 Stub Fault & Clr Fault S1 ABC-g Norwalk 345 kV 75 0 75 75 75 75 75 75 75 150 75 IN Pk. Load open t=5cy
5-4
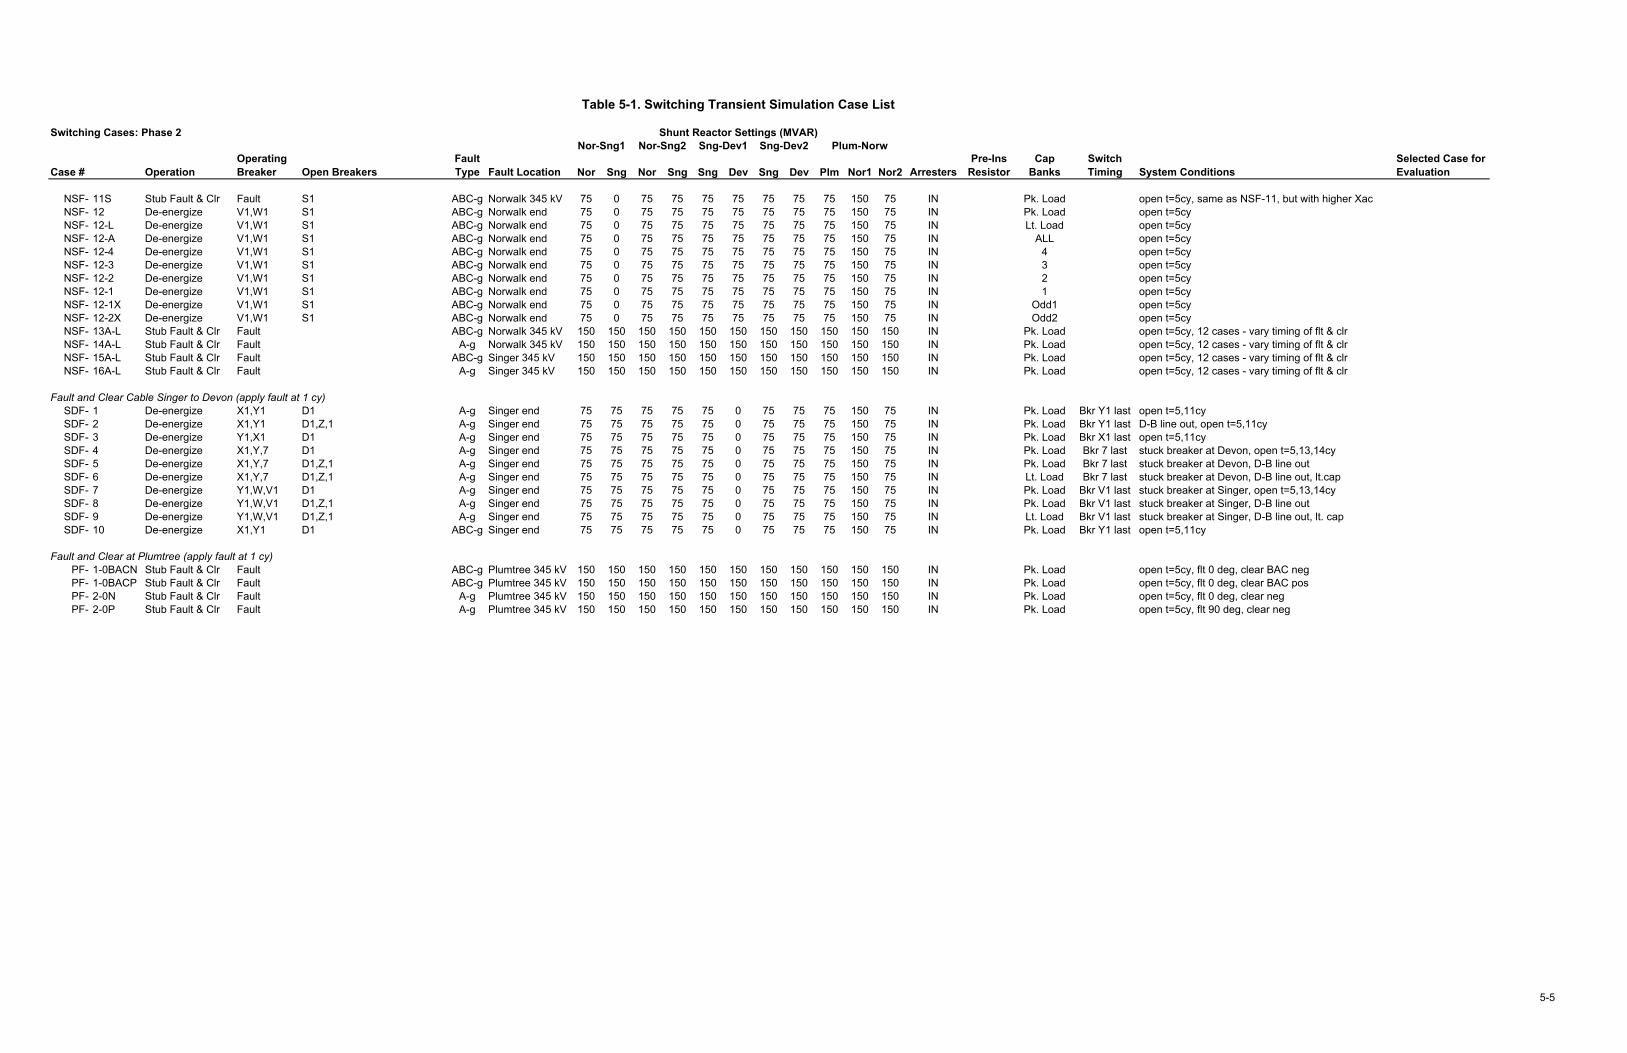
Table 5-1. Switching Transient Simulation Case List
Switching Cases: Phase 2
Case # OperationOperating Breaker Open Breakers
Fault Type Fault Location Nor Sng Nor Sng Sng Dev Sng Dev Plm Nor1 Nor2 Arresters
Pre-Ins Resistor
Cap Banks
Switch Timing System Conditions
Selected Case for Evaluation
Shunt Reactor Settings (MVAR)Nor-Sng1 Nor-Sng2 Sng-Dev1 Sng-Dev2 Plum-Norw
NSF- 11S Stub Fault & Clr Fault S1 ABC-g Norwalk 345 kV 75 0 75 75 75 75 75 75 75 150 75 IN Pk. Load open t=5cy, same as NSF-11, but with higher XacNSF- 12 De-energize V1,W1 S1 ABC-g Norwalk end 75 0 75 75 75 75 75 75 75 150 75 IN Pk. Load open t=5cyNSF- 12-L De-energize V1,W1 S1 ABC-g Norwalk end 75 0 75 75 75 75 75 75 75 150 75 IN Lt. Load open t=5cyNSF- 12-A De-energize V1,W1 S1 ABC-g Norwalk end 75 0 75 75 75 75 75 75 75 150 75 IN ALL open t=5cyNSF- 12-4 De-energize V1,W1 S1 ABC-g Norwalk end 75 0 75 75 75 75 75 75 75 150 75 IN 4 open t=5cyNSF- 12-3 De-energize V1,W1 S1 ABC-g Norwalk end 75 0 75 75 75 75 75 75 75 150 75 IN 3 open t=5cyNSF- 12-2 De-energize V1,W1 S1 ABC-g Norwalk end 75 0 75 75 75 75 75 75 75 150 75 IN 2 open t=5cyNSF- 12-1 De-energize V1,W1 S1 ABC-g Norwalk end 75 0 75 75 75 75 75 75 75 150 75 IN 1 open t=5cyNSF- 12-1X De-energize V1,W1 S1 ABC-g Norwalk end 75 0 75 75 75 75 75 75 75 150 75 IN Odd1 open t=5cyNSF- 12-2X De-energize V1,W1 S1 ABC-g Norwalk end 75 0 75 75 75 75 75 75 75 150 75 IN Odd2 open t=5cyNSF- 13A-L Stub Fault & Clr Fault ABC-g Norwalk 345 kV 150 150 150 150 150 150 150 150 150 150 150 IN Pk. Load open t=5cy, 12 cases - vary timing of flt & clrNSF- 14A-L Stub Fault & Clr Fault A-g Norwalk 345 kV 150 150 150 150 150 150 150 150 150 150 150 IN Pk. Load open t=5cy, 12 cases - vary timing of flt & clrNSF- 15A-L Stub Fault & Clr Fault ABC-g Singer 345 kV 150 150 150 150 150 150 150 150 150 150 150 IN Pk. Load open t=5cy, 12 cases - vary timing of flt & clrNSF- 16A-L Stub Fault & Clr Fault A-g Singer 345 kV 150 150 150 150 150 150 150 150 150 150 150 IN Pk. Load open t=5cy, 12 cases - vary timing of flt & clr
Fault and Clear Cable Singer to Devon (apply fault at 1 cy)SDF- 1 De-energize X1,Y1 D1 A-g Singer end 75 75 75 75 75 0 75 75 75 150 75 IN Pk. Load Bkr Y1 last open t=5,11cySDF- 2 De-energize X1,Y1 D1,Z,1 A-g Singer end 75 75 75 75 75 0 75 75 75 150 75 IN Pk. Load Bkr Y1 last D-B line out, open t=5,11cySDF- 3 De-energize Y1,X1 D1 A-g Singer end 75 75 75 75 75 0 75 75 75 150 75 IN Pk. Load Bkr X1 last open t=5,11cySDF- 4 De-energize X1,Y,7 D1 A-g Singer end 75 75 75 75 75 0 75 75 75 150 75 IN Pk. Load Bkr 7 last stuck breaker at Devon, open t=5,13,14cySDF- 5 De-energize X1,Y,7 D1,Z,1 A-g Singer end 75 75 75 75 75 0 75 75 75 150 75 IN Pk. Load Bkr 7 last stuck breaker at Devon, D-B line outSDF- 6 De-energize X1,Y,7 D1,Z,1 A-g Singer end 75 75 75 75 75 0 75 75 75 150 75 IN Lt. Load Bkr 7 last stuck breaker at Devon, D-B line out, lt.capSDF- 7 De-energize Y1,W,V1 D1 A-g Singer end 75 75 75 75 75 0 75 75 75 150 75 IN Pk. Load Bkr V1 last stuck breaker at Singer, open t=5,13,14cySDF- 8 De-energize Y1,W,V1 D1,Z,1 A-g Singer end 75 75 75 75 75 0 75 75 75 150 75 IN Pk. Load Bkr V1 last stuck breaker at Singer, D-B line outSDF- 9 De-energize Y1,W,V1 D1,Z,1 A-g Singer end 75 75 75 75 75 0 75 75 75 150 75 IN Lt. Load Bkr V1 last stuck breaker at Singer, D-B line out, lt. capSDF- 10 De-energize X1,Y1 D1 ABC-g Singer end 75 75 75 75 75 0 75 75 75 150 75 IN Pk. Load Bkr Y1 last open t=5,11cy
Fault and Clear at Plumtree (apply fault at 1 cy)PF- 1-0BACN Stub Fault & Clr Fault ABC-g Plumtree 345 kV 150 150 150 150 150 150 150 150 150 150 150 IN Pk. Load open t=5cy, flt 0 deg, clear BAC negPF- 1-0BACP Stub Fault & Clr Fault ABC-g Plumtree 345 kV 150 150 150 150 150 150 150 150 150 150 150 IN Pk. Load open t=5cy, flt 0 deg, clear BAC posPF- 2-0N Stub Fault & Clr Fault A-g Plumtree 345 kV 150 150 150 150 150 150 150 150 150 150 150 IN Pk. Load open t=5cy, flt 0 deg, clear negPF- 2-0P Stub Fault & Clr Fault A-g Plumtree 345 kV 150 150 150 150 150 150 150 150 150 150 150 IN Pk. Load open t=5cy, flt 90 deg, clear neg
5-5

GE Power Systems Energy Consulting NU Phase 2 Final Report.doc 5-6
The results indicate that uncontrolled closing of the Norwalk-Singer and Singer-Devon cables yields unacceptable power quality, and some form of controlled closing is required for the circuit breakers at each cable end. Cable energization was evaluated with pre-insertion resistor closing and with synchronous closing. It was found that with cables in service behind the switched breaker, the energization transient was predominately a capacitive switching transient, and with no cables in service behind the switched breaker (inductive source), the energization transient resulted in a sustained and distorted overvoltage due to shunt reactor inrush. Synchronous closing would nominally be set for closing each phase near a voltage zero to minimize the capacitive switching transient. The highest switching transient and temporary overvoltage (TOV) cases were repeated with pre-insertion resistors and synchronous closing, and the power quality was evaluated using the ITIC curve comparison.
The evaluation of cases with pre-insertion resistors and synchronous closing indicates that pre-insertion resistors provide acceptable cable switching performance at Norwalk, Singer, and Devon, and synchronous closing is an option worthy of further consideration at Singer and Devon. However, pre-insertion resistors for cable switching at Norwalk were determined to be necessary to ensure adequate system power quality.
Energization of a cable with synchronous closing at voltage zeros, when it is nearly 100% compensated, can result in only a direct current flowing in the circuit breaker. Energization of the cable capacitance results in a high-frequency ac component superimposed on the 60 Hz charging current. Energization of the shunt reactors results in its 60 Hz current component, plus a dc component that can be as great as the peak of the 60 Hz current. At 100% compensation, the cable charging and shunt reactor 60 Hz currents exactly cancel, leaving the dc component and the high-frequency capacitive switching current. The latter component quickly decays (in one or two 60 Hz cycles), but the direct current could persist a long time (seconds) because its decay time constant is established by the relatively large inductance and small resistance of the shunt reactors. If the breaker was commanded to open during this time, the breaker would draw an arc but may not immediately interrupt due to the absence of a natural current zero crossing. This exposes the breaker to duty outside of standard capabilities. If synchronous closing is desired, it is recommended that this phenomenon be thoroughly examined by the manufacturer providing the equipment.
The results of transformer switching simulations indicate that either resistor pre-insertion or synchronous closing is necessary to avoid temporary overvoltages and distortion when transformers are energized. Also, with uncontrolled closing, a high level of 2nd and 3rd harmonic currents are observed in the cables, which could potentially be an issue particularly for certain protection schemes. It is also possible that energizing other nearby transformers could cause harmonic currents in the cables1. Resistor pre-insertion, using the same resistor size and insertion time, has been determined to provide acceptable performance for both cable and transformer switching. The results also indicate that uncontrolled closing of the Norwalk, Singer, and Devon transformers yields marginal power quality in some cases.
1 The effect of energizing transformers throughout the NU system was outside the scope of this study.

GE Power Systems Energy Consulting NU Phase 2 Final Report.doc 5-7
Pre-insertion resistors are recommended for transformer energization at Norwalk, as designed for in Phase 1. The same breaker could be used to energize a cable or a transformer at Norwalk, and pre-insertion resistors are acceptable in this regard.
The preferred switching strategy for synchronous closing differs for cables and transformers, however. Synchronous closing for transformers would normally be at voltage peaks to minimize the inrush, in contrast to voltage zeros for cable energization. Most of the circuit breakers in the Phase 2 substation would normally switch either a cable, or a transformer, but the same breaker would not normally be required to do both types of energization operations. There are two breakers in the Phase 2 substations that could be used for either operation. One is at Norwalk and the other is at Devon. Since pre-insertion resistors are recommended at Norwalk, this is a non-issue for this location. However, the dual-mode requirement would be an issue for breakers 4 and 6 at Devon (Refer to Figure 3-1). If these breakers were programmed for cable switching (voltage-zero closing), but used instead for transformer switching, then the transformer inrush and the consequent system impacts would be maximized. This is not recommended. Possible solutions include dynamic adjustment of synchronous closing times depending on the equipment being energized or assignment of specific breakers to specific energization operations, which would complicate operating practices and reduce flexibility. For example, breakers 1, 2, 3, and 5 at Devon could be programmed for voltage-zero cable or line switching, and breakers 4 and 6 programmed for voltage-peak transformer switching. In the event of an outage of breakers 3 or 5, the associated cable or line could be initially energized only from the remote end (Singer or Beseck), and then hot-synched at Devon. Since this presents a more complex application which could be prone to operator error, or require a very complex interlocking scheme, pre-insertion resistors provide a more robust solution to energize either the cable or the transformer and are preferred at Devon.
Based on power quality evaluation, either pre-insertion resistors or synchronous closing could be applied at Singer for both cables and transformers. However, the dc offset current issue for cable switching should be thoroughly examined by the breaker manufacturer if synchronous closing is to be considered.
Circuit Breaker Recovery Voltage
Various cable de-energization and fault clearing cases were simulated to evaluate circuit breaker recovery voltage. Both transient and sustained recovery voltages were observed in these cases. Critical fault clearing cases with sustained voltage across the breaker contacts near 750 kV exceed test values defined in ANSI C37.06 and should be reviewed with the breaker manufacturer (Cases NSF-1, 2, 3, 7, 8 and SDF-1, 7). An example case is shown in Figure 5-2. These cases indicate the need for a higher TOV capability required for the breaker or could possibly be a driver for a higher circuit breaker voltage rating if the manufacturer cannot provide the capability with a 362 kV breaker.
Transient recovery voltages (TRVs) in other cases, in which the peak is observed during the first half cycle of opening, were below the levels defined for 362 kV breakers in ANSI C37.06. However, a more detailed TRV analysis is recommended for the breakers at Devon which would be used to de-energize the Devon-Beseck line while the series reactor is

GE Power Systems Energy Consulting NU Phase 2 Final Report.doc 5-8
inserted. Clearing a fault on the line side of the reactor is a critical case for the TRV of the breaker adjacent to the reactor and requires a high-frequency model of the exact hardware and stray capacitances of the associated equipment. If TRV limits are exceeded, a shunt capacitor could be added between the breaker and series reactor to remedy the situation. This type of microsecond-level TRV analysis was not within the scope of this study, but should be considered particularly for this series reactor configuration.
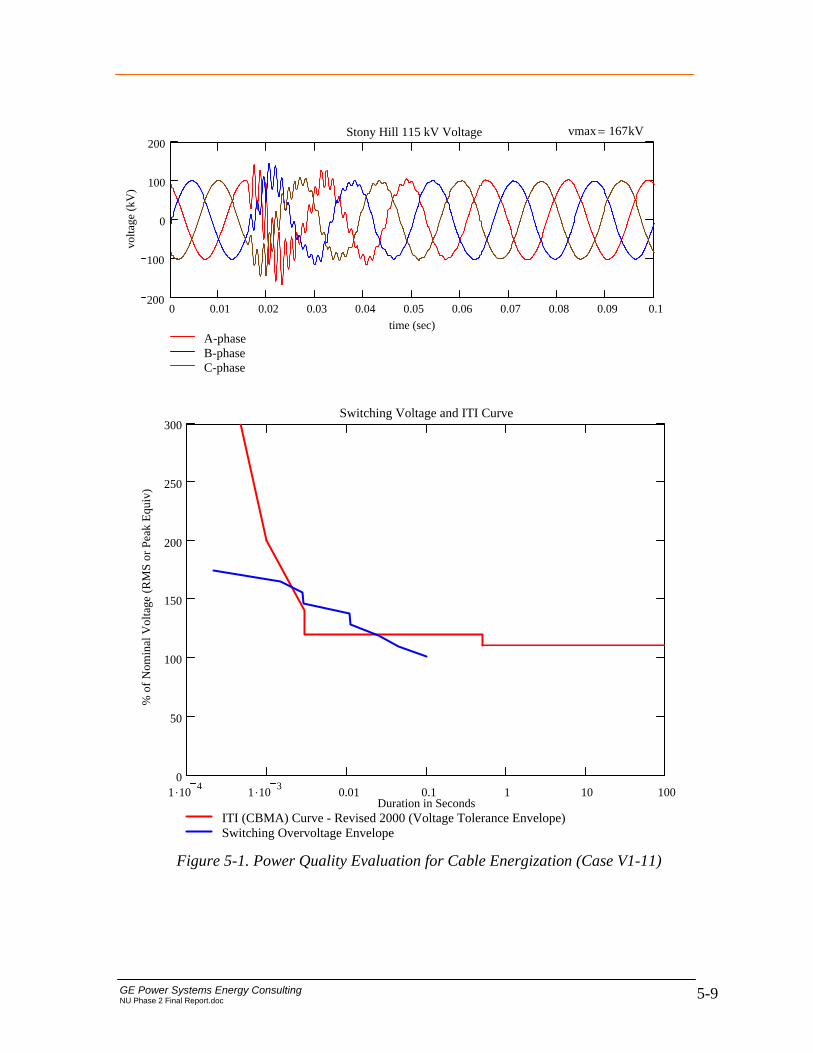
GE Power Systems Energy Consulting NU Phase 2 Final Report.doc 5-9
0 0.01 0.02 0.03 0.04 0.05 0.06 0.07 0.08 0.09 0.1200
100
0
100
200
A-phaseB-phaseC-phase
Stony Hill 115 kV Voltage
time (sec)
volta
ge (k
V)
vmax 167kV=
1 .10 4 1 .10 3 0.01 0.1 1 10 1000
50
100
150
200
250
300
ITI (CBMA) Curve - Revised 2000 (Voltage Tolerance Envelope)Switching Overvoltage Envelope
Switching Voltage and ITI Curve
Duration in Seconds
% o
f Nom
inal
Vol
tage
(RM
S or
Pea
k Eq
uiv)
Figure 5-1. Power Quality Evaluation for Cable Energization (Case V1-11)
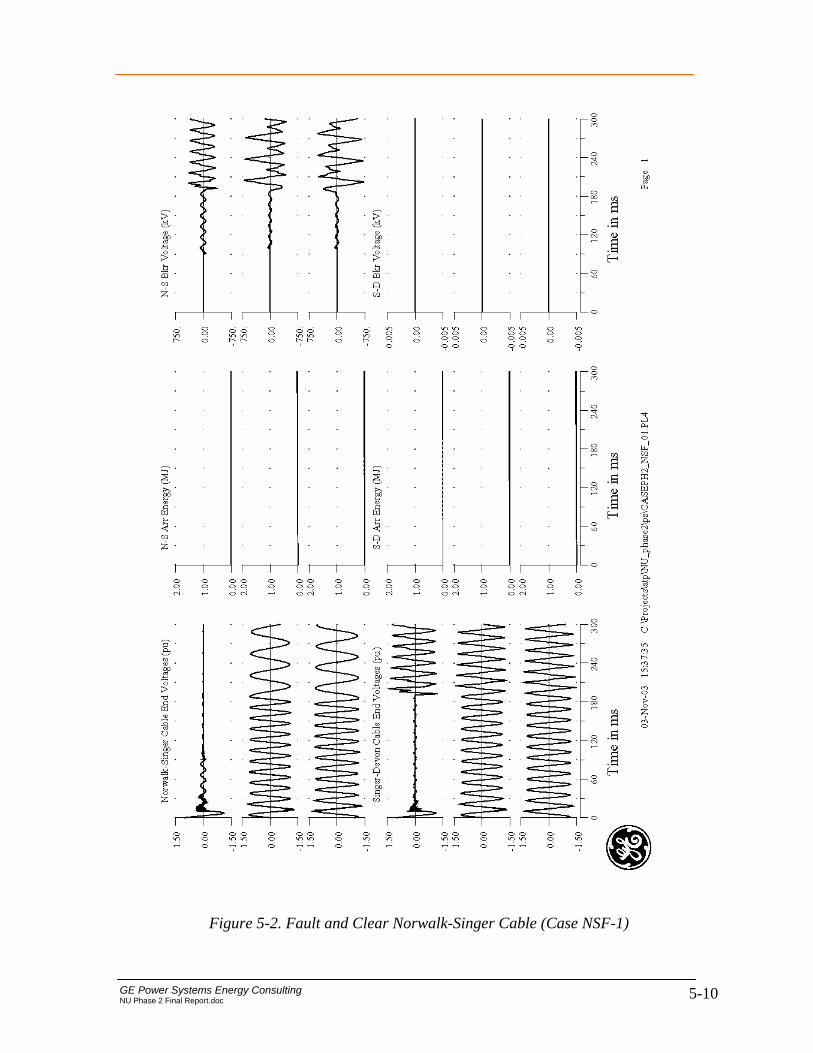
GE Power Systems Energy Consulting NU Phase 2 Final Report.doc 5-10
Figure 5-2. Fault and Clear Norwalk-Singer Cable (Case NSF-1)

GE Power Systems Energy Consulting NU Phase 2 Final Report.doc 5-11
Surge Arrester Considerations
Competing factors in selection of a surge arrester’s voltage rating are:
1. Select a voltage rating low enough that the arrester’s voltage protective level coordinates with equipment insulation levels to protect against lightning and switching transients, and
2. Select a sufficient voltage rating which can withstand the expected temporary overvoltage levels without damage or failure of the arresters.
The 294 kV surge arrester rating was modeled for study in Phase 2 at the cable ends to provide adequate protection against high switching and lightning transients while also providing acceptable arrester temporary overvoltage withstand capability. According to the GE Tranquell (MOV) arrester application guide, the 294 kV arrester is capable of 1.19 pu MCOV, 1.73 pu TOV for 1 s, and 2100 kJ over a 1 minute period and 1800 kJ for a single arrester operation. The switching surge protective level is 590 kV for the 294 kV arrester. Minimum BIL for Phase 2 is 1050 kV and minimum BSL is 759 kV, resulting in a switching surge protective ratio of 1.29. This is above the minimum recommended protective ratio of 1.15 for switching surges. Impulse protective ratios are a function of the details of the station’s physical layout, and their calculation is not within the scope of this study. Insulation coordination within the substation for impulse protection should be confirmed.
Surge Arrester Energy Duty
Surge arrester energy was evaluated by simulating a single-pole restrike during cable de-energization. Arresters were modeled at the cable ends with a high V-I curve, and then critical cases were re-evaluated with a low V-I curve at the location with the highest energy. This conservatively addresses the issue of energy duty sharing between arresters.
Figure 5-3 shows an energy duty simulation case for the surge arresters on the Norwalk-Singer cable. In this case, the cable is de-energized by opening breakers at Singer and Norwalk, and a restrike occurs at the Norwalk 115 kV breaker due to a stuck breaker at Norwalk 345 kV, causing voltage and current flow to be re-established (Case NS-14-AR). Despite some optimistic claims, no breaker is restrike free, and surge arresters should be rated to survive the energy duty in such cases. In this case, a low V-I curve was modeled at the Singer cable end. After the restrike on one phase, the arrester conducts with an energy duty of almost 1000 kiloJoules (kJ). The duty is within the energy capability of 1800 kJ for the 294 kV rating.
Surge Arrester Temporary Overvoltage Duty
Temporary overvoltages (TOVs) were observed in various fault clearing scenarios. The highest TOVs were observed in stub fault and clear cases, where a 3-phase-to-ground or 1-phase-to-ground fault was applied at Norwalk or Singer 345 kV and then cleared after 5 cycles. The transformer inrush contributes to high TOVs following the fault clearing. Twelve timing cases were performed in each scenario to vary the fault application and
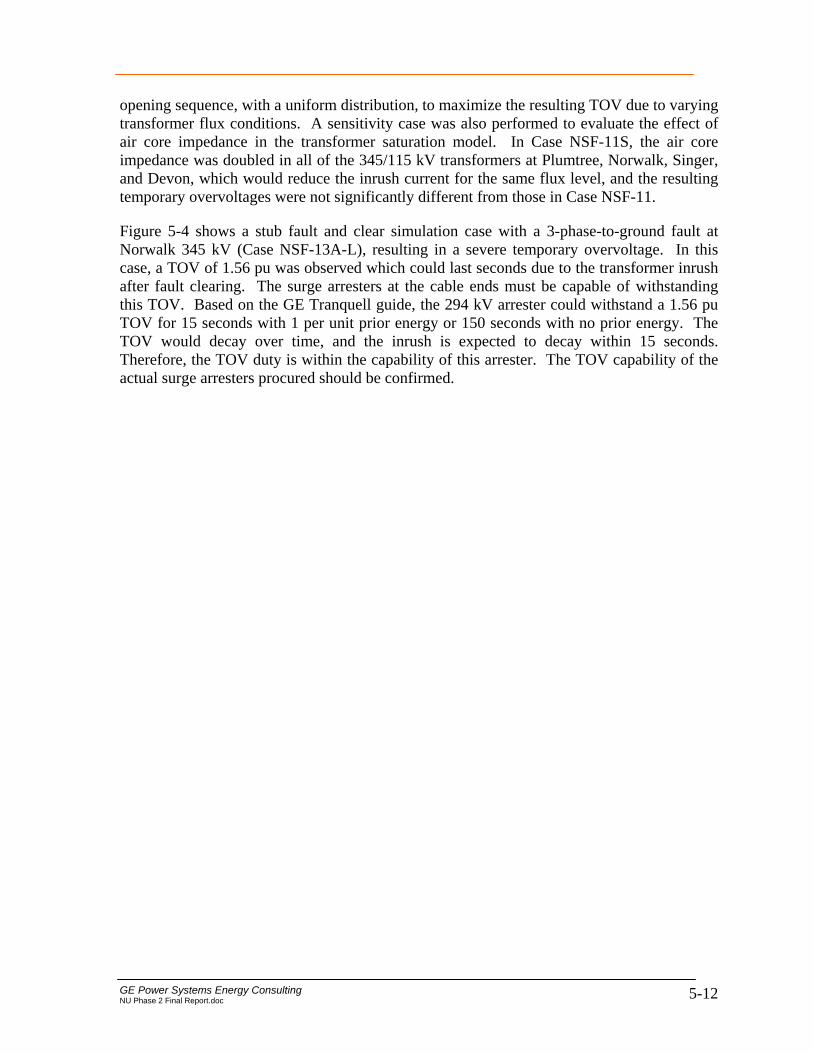
GE Power Systems Energy Consulting NU Phase 2 Final Report.doc 5-12
opening sequence, with a uniform distribution, to maximize the resulting TOV due to varying transformer flux conditions. A sensitivity case was also performed to evaluate the effect of air core impedance in the transformer saturation model. In Case NSF-11S, the air core impedance was doubled in all of the 345/115 kV transformers at Plumtree, Norwalk, Singer, and Devon, which would reduce the inrush current for the same flux level, and the resulting temporary overvoltages were not significantly different from those in Case NSF-11.
Figure 5-4 shows a stub fault and clear simulation case with a 3-phase-to-ground fault at Norwalk 345 kV (Case NSF-13A-L), resulting in a severe temporary overvoltage. In this case, a TOV of 1.56 pu was observed which could last seconds due to the transformer inrush after fault clearing. The surge arresters at the cable ends must be capable of withstanding this TOV. Based on the GE Tranquell guide, the 294 kV arrester could withstand a 1.56 pu TOV for 15 seconds with 1 per unit prior energy or 150 seconds with no prior energy. The TOV would decay over time, and the inrush is expected to decay within 15 seconds. Therefore, the TOV duty is within the capability of this arrester. The TOV capability of the actual surge arresters procured should be confirmed.

GE Power Systems Energy Consulting NU Phase 2 Final Report.doc 5-13
Figure 5-3. Trip with Restrike – Norwalk-Singer Cable (Case NS-14-AR)

GE Power Systems Energy Consulting NU Phase 2 Final Report.doc 5-14
Figure 5-4. Stub Fault and Clear at Norwalk (Case NSF-13A-L)

GE Power Systems Energy Consulting NU Phase 2 Final Report.doc 5-15
115 kV Equipment Duty and Power Quality
Equipment duty at 115 kV buses should be evaluated for all cases with respect to surge arrester impacts. In addition, overvoltage duration should be evaluated in comparison to the ITIC volt-time curve for routine energizing cases. In many cases simulating uncontrolled energization, breaker restrikes, and 345 kV faults, there were high overvoltages observed at 115 kV capacitor bank locations, particularly at Rocky River and Stony Hill. Simulations were performed with variations of capacitor banks in service to further analyze the potential for voltage magnification of transients at the 115 kV capacitor bank locations. With the controlled closing technologies that are recommended for cable and transformer energization, the study results indicate that the power quality at 115 kV capacitor bank locations and 115 kV stations near the Phase 1 and 2 cables is acceptable for routine switching events, based on the ITIC curve evaluation.
The highest 115 kV overvoltages were observed during fault cases, where controlled closing provides no mitigation. The most severe overvoltages occurred as the result of the fault application. The fault initiates natural-frequency oscillations of the 345 kV system. Evidently, these oscillations coincide with resonances involving the 115 kV capacitor banks. There is a widely-documented phenomenon, called voltage magnification, where oscillations between two coupled resonant circuits can result in magnified voltage oscillations in the second circuit due to oscillations in the first. Magnification is most severe when the driving circuit (the 345 kV system in this case) has a much larger capacitance than the driven system (115 kV capacitor bank). This phenomenon is most commonly reported as the result of switching a large capacitor bank in the vicinity of a smaller capacitor bank nearby on a lower-voltage system. However, in the case of the Phase 2 system, the 345 kV fault oscillations appear to instigate this magnification phenomenon.
Transient overvoltages on the 115 kV system need to be evaluated with respect to arrester discharge characteristics. NU has a variety of arrester types and ratings at 115 kV, including 90 kV and 96 kV rated conventional silicon carbide (SiC) arresters and modern metal oxide varistors (MOVs). The switching-surge discharge voltage of a typical 90 kV MOV is 1.80 pu at 500 Amps, and the minimum sparkover of the 90 kV SiC arrester is about 1.83 pu. Thus, many of the transients simulated in this study would have driven arresters into conduction. Arrester energy duty needs further evaluation for the 115 kV susbstations which are subject to magnified overvoltages. The older silicon carbide arrester technology is ill-suited for application near large capacitances, and it is recommended that NU review the use of SiC arresters for potential replacement with metal-oxide arresters, especially at shunt capacitor bank locations.
The critical transient cases for 115 kV surge arrester duty were 345 kV faults and breaker restrike cases. For example, a 2.5 pu transient voltage was observed at Rocky River during a fault and clear case of the Norwalk-Singer cable. Surge arresters were not modeled in the 115 kV system, but would discharge significant current in this case.
Faults and uncontrolled transformer switching on the 345 kV system also resulted in temporary overvoltage conditions at the 115 kV level. The ability of the 115 kV arresters to withstand this temporary overvoltage duty also needs to be evaluated.

GE Power Systems Energy Consulting NU Phase 2 Final Report.doc 6-1
6. Conclusions and Recommendations
With the appropriate selection of equipment and implementation of operating practices, Phase 2 can be operated consistent with Northeast Utilities’ expectations for transient and harmonic distortion impact.
Harmonic analysis results indicate a general shift of driving-point impedance resonances down toward lower frequencies with the Phase 2 additions. However, the magnitude of the impedance resonances are generally lower with Phase 2 than with Phase 1, due to the strengthening of the system with the 345 kV loop through Beseck. Resonances are seen below the 3rd harmonic frequency throughout the Phase 1 and Phase 2 cable region. Resonances are also appearing locally near 5th, 7th, and 11th harmonics. The resonant peak magnitudes are generally lower at 5th harmonic but higher at some locations. The 5th and 7th harmonic resonances appear to be more dependent on local conditions. Comparison of Phase 1 to Phase 2 indicates that ambient distortion at 11th harmonic may be amplified in Phase 2.
The estimated voltage distortion levels are relatively high at the 5th harmonic frequency in Phase 2 with all capacitor banks in service, particularly at Norwalk and Glenbrook 115 kV, and they are also marginally high at Norwalk, Singer, and Devon 345 kV. Although the harmonic distortion levels which will occur with the addition of the Phase 2 system cannot be precisely predicted, the results show that there is an expectation that the planned cable additions will increase the risk of voltage distortion levels at individual harmonic orders exceeding accepted limits. NU provided some harmonic measurements gathered over a one week period in early August. Average voltage distortion levels were exceeding 1% at Norwalk at 3rd and 5th harmonics. Since impedance resonances and voltage distortion levels are highly dependent on local conditions of capacitor banks in service, it is difficult to predict the voltage distortion levels that could exist in Phase 2. For this reason, no specific actions at this time are recommended to NU. If excess distortion does become an observed problem, NU’s options are to de-commission certain capacitor banks, avoid certain capacitor status configurations, or to convert some of the capacitor banks into harmonic filters.
Uncontrolled energization of the cable would result in unacceptable power quality impact and overvoltages at other system locations. Circuit breakers equipped with 350 ohm pre-insertion resistors provide a vast improvement in power quality during cable energization operations by softening the transients at near and remote buses. Synchronous closing was also evaluated and is an option worthy of further consideration at Singer and Devon. However, pre-insertion resistors for cable switching at Norwalk were determined to be necessary to ensure adequate system power quality. Synchronous closing provides acceptable power quality when switching the cables from Singer and from Devon; however, further consideration is required to examine the breaker’s capability to interrupt dc offset current when the cable is nearly 100% compensated and to investigate operational strategies at Devon due to sharing of breakers. At Devon, the same breaker could potentially be used to switch the Devon-Singer cable and Devon transformer, and another breaker could be used to switch the Devon-Beseck line and Devon transformer. Pre-insertion resistors provide a

GE Power Systems Energy Consulting NU Phase 2 Final Report.doc 6-2
more robust solution, but synchronous closing could be considered at Singer and Devon provided these issues are investigated.
The results of transformer switching simulations indicate that either resistor pre-insertion or synchronous closing is necessary to avoid temporary overvoltages and distortion when transformers are energized. Resistor pre-insertion, using the same resistor size and insertion time, has been determined to provide acceptable performance for both cable and transformer switching. The results also indicate that uncontrolled closing of the Norwalk, Singer, and Devon transformers yields marginal power quality in some cases.
Pre-insertion resistors are recommended for transformer energization at Norwalk, as designed for in Phase 1. The same breaker could be used to energize a cable or a transformer at Norwalk, and pre-insertion resistors are acceptable in this regard.
Based on power quality evaluation, either pre-insertion resistors or synchronous closing could be applied at Devon. However, the same breaker could be used to energize a cable or a transformer, and the preferred switching strategy for synchronous closing differs for cables and transformers. Also, the same breaker could be used to energize the Devon-Beseck line and Devon transformer. Synchronous closing for transformers would normally be at voltage peaks to minimize the inrush, in contrast to voltage zeros for cable or line energization. Since this presents a more complex application which could be prone to operator error, or require a very complex interlocking scheme, pre-insertion resistors provide a more robust solution to energize either the cable or the transformer and are preferred at Devon.
Based on power quality evaluation, either pre-insertion resistors or synchronous closing could be applied at Singer for both cables and transformers. However, the dc offset current issue for cable switching should be thoroughly examined by the breaker manufacturer if synchronous closing is to be considered.
Critical fault clearing cases with sustained voltage across the breaker contacts near 750 kV exceed test values defined in ANSI C37.06 and should be reviewed with the breaker manufacturer. These cases indicate the need for a higher TOV capability required for the breaker or could possibly be a driver for a higher circuit breaker voltage rating if the manufacturer cannot provide the capability with a 362 kV breaker.
Study results indicate that 294 kV rated surge arresters at the cable ends provide acceptable energy capability, temporary overvoltage capability, and switching surge protective ratio. Surge arrester parameters and capabilities should be confirmed for the actual arresters procured.
With the closing technologies that are recommended in place for cable and transformer energization, the study results indicate that the power quality at 115 kV capacitor bank locations and 115 kV stations near the Phase 1 and 2 cables is acceptable based on the ITIC curve evaluation. High overvoltages were observed at some 115 kV capacitor bank locations, particularly at Rocky River and Stony Hill during fault and restrike events. The natural-frequency oscillations of the 345 kV cable system due to application of a 345 kV system fault appear to interact with the resonance of the 115 kV capacitor banks, greatly
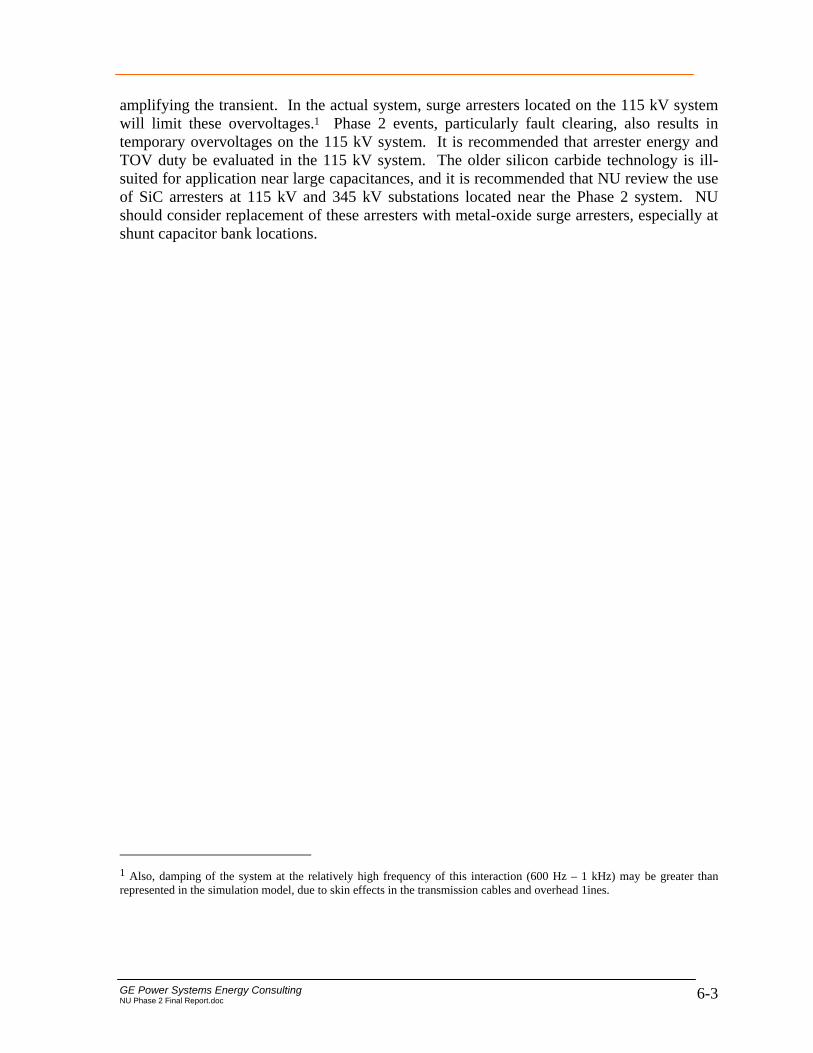
GE Power Systems Energy Consulting NU Phase 2 Final Report.doc 6-3
amplifying the transient. In the actual system, surge arresters located on the 115 kV system will limit these overvoltages.1 Phase 2 events, particularly fault clearing, also results in temporary overvoltages on the 115 kV system. It is recommended that arrester energy and TOV duty be evaluated in the 115 kV system. The older silicon carbide technology is ill-suited for application near large capacitances, and it is recommended that NU review the use of SiC arresters at 115 kV and 345 kV substations located near the Phase 2 system. NU should consider replacement of these arresters with metal-oxide surge arresters, especially at shunt capacitor bank locations.
1 Also, damping of the system at the relatively high frequency of this interaction (600 Hz – 1 kHz) may be greater than represented in the simulation model, due to skin effects in the transmission cables and overhead 1ines.

GE Power Systems Energy Consulting NU Phase 2 Final Report.doc A-1
Appendix A – Driving-Point Impedance Plots

GE Power Systems Energy Consulting NU Phase 2 Final Report.doc B-1
Appendix B – Power Quality Analysis Plots

GE Power Systems Energy Consulting NU Phase 2 Final Report.doc C-1
Appendix C – Switching Simulation Case Plots