erp1970 appendixes 1
TRANSCRIPT

Appendix A
UNEMPLOYMENT AND THE ECONOMY
Digitized for FRASER http://fraser.stlouisfed.org/ Federal Reserve Bank of St. Louis

Digitized for FRASER http://fraser.stlouisfed.org/ Federal Reserve Bank of St. Louis

CONTENTSPage
UNEMPLOYMENT AND THE ECONOMY 147UNEMPLOYMENT STATISTICS AND THEIR INTERPRETATION 147
UNEMPLOYMENT AND LABOR MOBILITY 148
THE DURATION OF UNEMPLOYMENT 151
UNEMPLOYMENT AMONG DIFFERENT GROUPS 152
List of Tables and ChartsTablesA-l . Unemployed Persons by Reason for Unemployment, 1969 149A-2. Unemployment by Age, Sex, and Race, 1969 152A—3. Selected Measures of Unemployment, 1969 153A-4. Distribution of Activities of Persons 16-21 Years of Age, 1968-69 154A-5. Distribution of Activities of Persons 16-21 Years of Age by Sex and Race,
1968-69 155ChartA-l . Unemployment Rate and Duration 150
145
Digitized for FRASER http://fraser.stlouisfed.org/ Federal Reserve Bank of St. Louis

Digitized for FRASER http://fraser.stlouisfed.org/ Federal Reserve Bank of St. Louis

Unemployment and the Economy
The unemployment rate occupies a prominent place in the array of eco-nomic statistics that indicate the overall state of the economy. This centralposition is to a large extent attributable to the fact that it serves as a broadbut direct index of the extent to which the mandate of the Federal Govern-ment embodied in the Employment Act of 1946 is being fulfilled.
Much of the attention the unemployment rate receives, however, is aresult of its role as an indicator of economic waste and public welfare.As a Nation we are highly and properly sensitive to the problem, of theperson seeking employment and unable to find a job. We need to know asmuch as possible about the numbers and characteristics of the unemployed,and the reasons they are not working, so that the most effective remediescan be devised. In the management of economic policy it is essential tosee this complex picture clearly in order to formulate a judgment about therelative emphasis to be placed on general measures to enlarge employmentopportunities and on other special-purpose programs to deal with morespecific manpower problems. This appendix examines information bearingon the character and composition of unemployment in our recent experience.
UNEMPLOYMENT STATISTICS AND THEIR INTERPRETATIONUnemployment is usually accompanied by an interruption or decline
in the income flow that often represents the principal source of livelihoodfor a family or individual. Unemployment can, therefore, cause substantialhardship, particularly if it occurs for the family breadwinner and if itpersists for a considerable period of time. The implications of unemploy-ment and loss of income for economic well-being and morale provide amplejustification for public concern about unemployment and for governmentpolicies to reduce its incidence and to cushion its impact when it occurs.
While these social implications of unemployment are widely recognized,and appropriately given great emphasis, some other facets of unemploy-ment in the economy and the interpretation of the unemployment ratehave received much less recognition and discussion.
The unemployment rate is sometimes viewed as an indicator of wastedresources in the economy. In its simplest formulation this view often restson the notion that labor services lost through involuntary unemploymentare irretrievably lost, and that the loss serves no economic purpose. It canlegitimately be argued that the loss in labor services is not restricted to theperiod of idleness if unemployment is accompanied by loss of income
147
Digitized for FRASER http://fraser.stlouisfed.org/ Federal Reserve Bank of St. Louis

that results in a decline in the health and well-being of workers. Inaddition, loss of proficiency in skills and loss of motivation and morale ac-companying idleness may further increase the waste of human resourcesthat involuntary unemployment entails. Nevertheless this view of unemploy-ment as an important source of waste is applicable to only a part of actualunemployment and that portion declines as lower unemployment rates areachieved.
The level of the unemployment rate and the numbers of unemployedpersons in various subcategories are often taken to indicate the narrow seg-ment on which the incidence of slack in the economy falls—the unemployed.The cost to society of unemployment is then viewed as the earnings loss im-plied for those experiencing unemployment. Viewed in the context of aggre-gate economic policy, the cost of economic conditions or policies that resultin increased unemployment thus appears to be concentrated on those in thefraction of the labor force reported as unemployed. While these costs areborne disproportionately by some groups, the portion of the work force ex-periencing unemployment over a period of time is much larger than the un-employment rate suggests. Moreover, involuntary part-time employment,other forms of underemployment, and nonparticipation in the labor force asa result of poor prospects for obtaining employment are not reflected in theunemployment rate. Some unemployment is a byproduct of labor market ad-justments such as entry into the labor force, seasonal variation in manpowerrequirements, and changes in the composition of demand. Although its originsmay be inherent in the operation of a free labor market, even under condi-tions of high demand, such unemployment may cause serious problems forsome workers.
Recent unemployment rates have been low compared to our historicalexperience since World War II. The interim goal of a 4-percent averageannual unemployment rate, set out in the early sixties, has been surpassedfor 4 years (1966-69), and in this period the unemployment rate was at itslowest level since the Korean conflict in the early fifties. The primarypolicy emphasis has now shifted from one of reducing slack in the economyand further decreasing unemployment to one of monetary and fiscal restraintto contain the forces of inflation. Thus an examination of the character andcomposition of unemployment in our recent experience will indicate thedimensions of the labor market adjustment process under high employmentconditions.
UNEMPLOYMENT AND LABOR MOBILITYThe American economy has been characterized by growth and tech-
nological change. This has been accompanied by a shifting pattern of out-put and resource use. A highly mobile labor force has facilitated the ad-justment processes necessary to accommodate rapid and continued change.New employment opportunities constantly open up providing more pro-ductive and higher paying jobs than in other sectors of the economy. In-creasing productivity and rising wages have resulted from this continuing
148
Digitized for FRASER http://fraser.stlouisfed.org/ Federal Reserve Bank of St. Louis

reallocation of labor to more productive employment as well as from im-provement in workers' skill levels and an increasing supply of more produc-tive capital inputs.
Many workers are able to change jobs without an intervening periodof unemployment, and many of those leaving school or reentering thelabor force have jobs lined up in advance. But obtaining new employmentoften involves time and effort in search of the most suitable and productiveopportunities consistent with workers' skills and preferences. Time spentin search of the most suitable employment in a generally active labor marketcan be regarded as a constructive activity on the part of some workers. Inthose cases it should not be regarded as a waste of resources, just as timespent in schooling, skill training, or other activities to upgrade earningpower are not regarded as economic waste. There is a cost to the workerand to the economy of such "frictional" unemployment, but improvementsin job status, earnings, working conditions, and job satisfaction are off-setting benefits.
Ways should be sought to reduce this cost, without losing the attendantbenefits. For example, information plays a crucial role in the process ofsatisfactorily matching workers with jobs. Providing job information maybe a worthwhile social investment, decreasing the time and effort workersmust typically spend in search of suitable employment and improving laborutilization. The Department of Labor has long played a leading role ingathering and disseminating job market information, and tr̂ is Administra-tion is accelerating the development and introduction of systems such as theJob Bank and experiments in computerized matching of workers with jobs.
Many job changes with accompanying periods of unemployment are aresult of voluntary turnover, workers leaving their previous employment insearch of more favorable alternatives. In 1969, 15 percent of the unem-ployed voluntarily left their last job (Table A - l ) . In addition, many ofthose unemployed were entering or reentering the labor force—49 percentin 1969. These workers who entered or reentered the labor force are activelyusing this time in an effort to find suitable jobs. Unemployment for workersin these categories often is not strictly involuntary. For many of them it canbe described more properly as time voluntarily devoted to obtaining pro-ductive employment, improved job status, or more suitable and perhapshigher paid employment.
T A B L E
Total unemployment
Lost last jobLeft last jobReentered labor forceNever worked before
A—1.— Unemployed persons
Reason
by reason for unemployment, 1969
Number(thousands)
2,831
1,017436965413
Percentagedistribution
100
36153415
Note.—Detail will not necessarily add to totals because of rounding.Source: Department of Labor, Bureau of Labor Statistics.
149
Digitized for FRASER http://fraser.stlouisfed.org/ Federal Reserve Bank of St. Louis

The rapid pace of technological change contributing to rising livingstandards leads to changes in the pattern of labor use that often require someinvoluntary job changes. In addition, the seasonal nature of some work,secondary effects of work stoppages, and temporary adjustments in pro-duction and inventories result in involuntary loss of employment. In 1969,36 percent of those unemployed left their last job involuntarily. Most wereunemployed for only a short time. One out of two were unemployed lessthan 5 weeks as compared to slightly over 4 weeks for those who became un-employed for reasons other than job loss.
The nature of the job search required to obtain suitable employmentfor those workers experiencing unemployment is indicated by the amountof time the typical unemployed worker spends in search of employment. In1969, the median duration of unemployment was less than 4.5 weeks (ChartA - l ) . The search period required for the typical unemployed worker toobtain employment varies with the level of the unemployment rate. Since1965, it has been less than 5 weeks. Thus the predominant share of those un-employed spend a relatively short time in search of suitable jobs. Someworkers experiencing frequent short periods of unemployment are, neverthe-less, seriously affected by unemployment that is typically of short duration.
Chart A - l
PERCENT
Unemployment Rate and Duration
WEEKS
12SEASONALLY ADJUSTED
UNEMPLOYMENT RATE- ! /(Left scale)
MEDIAN DURATION OFUNEMPLOYMENT
(Right scale)
I I I I I I I I 1 I I I 1 I I I I I I I I I I I I I I I I I I I I I I I I I I I I I I I 1 I I I I I I I I
10
1955 57 59 61 63 65 67 69
-^UNEMPLOYMENT AS PERCENT OF CIVILIAN LABOR FORCE.
SOURCES: DEPARTMENT OF LABOR AND COUNCIL OF ECONOMIC ADVISERS.
I 5 O
Digitized for FRASER http://fraser.stlouisfed.org/ Federal Reserve Bank of St. Louis

Many workers, of course, enter or leave the labor force without sufferingany unemployment. In 1968, for example, over 90 million persons workedat some time during the year. (Data for 1969 are not yet available.) Slightlyover 10 million of those who worked were unemployed at some time duringthe year. Hence over 80 million persons worked in 1968 and experienced nounemployment even though the average number employed was less than76 million. Viewed in a slightly different manner, over 32 million personsworked less than 50 weeks in 1968. But less than 9 million (27 percent) ofthese part-year workers experienced some unemployment. The rest of thosewho worked less than a full year entered or voluntarily left the labor forceduring the year. In addition, many workers who worked a full year changedjobs without experiencing any intervening unemployment. In manufactur-ing alone, a sector accounting for over 25 percent of average employmentin 1968, Bureau of Labor Statistics data indicate that almost 11 million jobchanges and new hires occurred—a number almost equal to the total num-ber of persons experiencing unemployment throughout the entire economyin that year. These data illustrate the amount of flux in the labor force. Theyalso indicate that changing jobs and obtaining employment typically requirefar less search time than is indicated by the median duration of unemploy-ment, since those statistics refer only to workers experiencing unemployment.
THE DURATION OF UNEMPLOYMENTAn increase in the unemployment rate obviously results in additional
persons experiencing unemployment. It is less generally recognized thatpart of the increase in the unemployment rate is attributable to a lengthen-ing in the time that workers must typically spend in search of suitableemployment. More people are unemployed because of layoffs and aninability to find other employment immediately. Others who enter thelabor force or who left previous employment are more likely than beforeto go through a period of job search instead of finding suitable employmentimmediately. Since the increase in the period of time typically required tofind work is reflected in the reported unemployment rate, the number ofadditional people experiencing unemployment over a period of time isproportionately less than the increase in the number reported as unemployedat any given time.
An increase of 1 percentage point in the unemployment rate would, onthe basis of past experience, be expected to result in an increase of about1.4 weeks in the median time required for those becoming unemployed toobtain jobs. Thus, from the point of view of both the larger number of workersexperiencing unemployment and the longer average duration of unem-ployment, higher unemployment rates increase the costs that must be in-curred to find suitable jobs by those entering the labor force or changingemployment.
Workers most seriously affected by unemployment and increases in theunemployment rate are the long-term unemployed. In 1968, for example,over 900,000 workers experienced more than 6 months of unemployment
Digitized for FRASER http://fraser.stlouisfed.org/ Federal Reserve Bank of St. Louis
during the year, more than half of them having more than one intervalof unemployment. Yet the number unemployed more than 6 months atany given time averaged about 156,000. Thus even this group of long-termunemployed is subject to substantial turnover.
For the long-term unemployed, searching for suitable employment isextremely costly, and the consequences for family income when the principalearner is unemployed for a long period are likely to be severe. Many ofthese workers undoubtedly have handicaps impairing their ability to getand hold jobs. Manpower training programs to improve their employabilityor special programs to give them access to job opportunities are required.Fortunately, their numbers are relatively small. There were 133,000 reportedas unemployed for 6 months or more in 1969 monthly statistics; 42,000 ofthese were married males with wives present. Although they represent a smallgroup in a labor force of over 80 million, the costs unemployment imposeson them justify strong manpower policies to improve their employmentprospects and further reduce the number in this group.
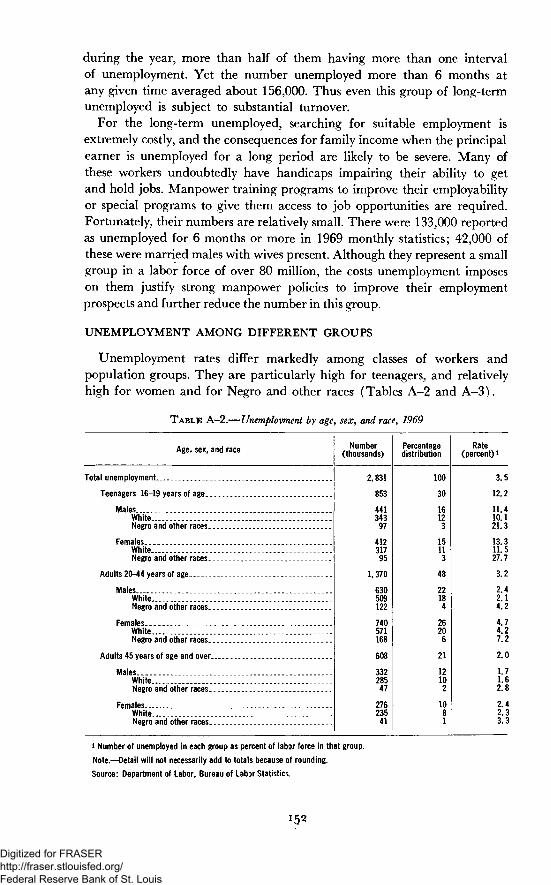
UNEMPLOYMENT AMONG DIFFERENT GROUPS
Unemployment rates differ markedly among classes of workers andpopulation groups. They are particularly high for teenagers, and relativelyhigh for women and for Negro and other races (Tables A-2 and A-3).
TABLE A—2.— Unemployment by age, sex, and race, 1969
Age, sex, and race Number(thousands)
2,831
853
441343
97
412317
95
1,370
630509122
740571168
608
332285
47
276235
41
Percentagedistribution
100
30
1612
3
1511
3
48
2218
4
2620
6
21
1210
2
1081
Rate(percent) i
Total unemployment
Teenagers 16-19 years of age. _
MalesWhiteNegro and other races.
FemalesWhiteNegro and other races.
Adults 20-44 years of age-
MalesWhiteNegro and other races..
FemalesWhiteNegro and other races..
Adults 45 years of age and over..
MalesWhite....Negro and other races..
FemalesWhiteNegro and other races..
3.5
12.2
11.410.121.3
13.311.527.7
3.2
2.42.14.2
4.74.27.2
2.0
1.71.62.8
2.42.33.3
i Number of unemployed in each group as percent of labor force in that group.
Note.—Detail will not necessarily add to totals because of rounding.
Source: Department of Labor, Bureau of Labor Statistics.
Digitized for FRASER http://fraser.stlouisfed.org/ Federal Reserve Bank of St. Louis

TABLE A-3.—Selected measures of unemployment, 1969
Total unemployment
Race:WhiteNegro and other races
Selected type of worker:Blue collarWhite collar
Sex:MaleFemale
Marital status:Male:
Married __ _Other.
Female:MarriedOther
Measure Number(thousands)
2,831
2,261570
1,154780
1,4031,428
582821
689739
Rate(percent)
3.5
3.16.4
3.92.1
2.84.7
1.57.1
3.95.8
Note.—Detail will not necessarily add to totals because of rounding.
Source: Department of Labor, Bureau of Labor Statistics.
Teenagers and Young People
Almost 40 percent of the unemployed in 1969 were persons 16-21, al-though this age group comprised only 13 percent of the labor force. Theunemployment rate for persons 16-21 years of age was 10.4 percent in1969, while that for persons 22 years of age and over was 2.4 percent. Sincethe overall unemployment rate was 3.5 percent, the high rates for persons16-21 years of age contributed 1.1 percentage points to the overall rate.But the high unemployment rates of young workers give a misleading im-pression of the incidence of unemployment among teenagers as a group aswell as of their welfare implications.
The pattern of activities of persons in the 16-21 age class differs markedlyfrom that for older persons. The primary activity of nearly half (45.5 per-cent in 1969) of the persons in the civilian population age 16-21 years oldis schooling. Although their unemployment rate was 10.4 percent, only 3.9percent of all the persons in this age class were both unemployed and notattending school.
Examining only annual averages obscures the large seasonal variationin the labor force and employment that occurs in this age class. During theschool year (October 1968-May 1969) 58.9 percent were attending school(Table A-4). The percentage in school dropped to 6.5 percent in thesummer months (July and August 1969) and the unemployment rate ofthe 16-21 year age group increased from 9.8 to 10.1 percent. The per-cent of those in this age class who were unemployed and not in school in-creased from 2.7 to 6.5 percent. The number in the labor force, however,increased by more than one-third. This short-term increase for the summermonths occurs for a period averaging about 3 months or less.
*53
Digitized for FRASER http://fraser.stlouisfed.org/ Federal Reserve Bank of St. Louis

T A B L E A—4.—Distribution of activities of persons 16-21 years of age, 1968-69
Activity
Percentage distribution of civilian noninstitutional population 16-21years of age, total
Major activity, going to school:In civilian labor force:
EmployedUnemployed..
Not in labor force.
Major activity, other:In civilian labor force:
EmployedUnemployed..
Not in labor force.
Unemployment rate, persons 16-21 years of age (percent):In schoolNot in school
1969 annualaverage
100.0
13.01.7
30.8
35.53.9
15.1
11.79.9
School year,October 1968-
May 1969
100.0
17.32.1
39.6
27.22.7
11.1
10.79.2
Summermonths,
July andAugust 1969
100.0
1.2.2
5.0
58.26.5
28.9
15.310.0
Source: Department of Labor, Bureau of Labor Statistics.
During the school year 2.1 percent of those in the 16-21 year age classwere in school and unemployed. During most of the school year over 90percent of those unemployed and in school were interested in only part-time work. In the summer months about 25 percent were looking forpart-time work. Even in the large short-term bulge in the labor forceoccurring in the summer months only 4.8 percent of the population inthis age class was unemployed, not in school, and looking for full-timework.
Unemployment rates, particularly in the summer months and for Negroand other nonwhite races, are comparatively high for persons in the 16-21year age class (Table A-5). This is in part a result of the large seasonalchange in the labor force that occurs in the summer months. For this ageclass entry and reentry into the labor force are also much more prevalentthan for older workers. This is a period in which a large share of the transi-tion between schooling and attachment to the work force is accomplished.
Persons in this age class are particularly vulnerable to unemploymentbecause many are seeking their first job. Moreover, many of the earlyschool-leavers enter the labor force without skills or qualifications that areeasily recognizable by employers. Many are inexperienced at searching forwork and often change jobs frequently to explore different types of employ-ment. The large share of those in this age class that are usually searchingfor employment, their inexperience in job search, and the relative lack ofinformation both on the part of employers and job seekers are all factorscontributing to the high unemployment rates they experience. Lack offamily and other commitments also often makes their attachment to workand to any given job more casual than that for older workers.
X54
Digitized for FRASER http://fraser.stlouisfed.org/ Federal Reserve Bank of St. Louis

TABLE A-5.—Distribution of activities of persons 16-21
Period, sex, and race
School year, October 1968-May 1969:
Males:White. .Negro and other races
Females:WhiteNegro and other races
Summer months, July and August 1969:
Males:WhiteNegro and other races
Females:W h i t e . . . . . . . . . . .Negro and other races
years of age by sex
Percent of noninstitutionalpopulation 16-21 years of age
Inschool
67.859.2
52.947.5
6.26.6
6.38.6
Unemployed
Inschool
2.53.5
1.42.2
.2
.1
.2
.4
Not inschool
2.25.0
2.46.0
5.912.7
5.510.4
and race, 1968-69
Unemployment rate(percent),
persons 16-21years of age
Inschool
9.722.2
9.425.2
11.69.1
19.327.3
Not inschool
7.714.4
8.019.7
7.917.6
9.6. 21.1
Source: Department of Labor, Bureau of Labor Statistics.
The earning capability of many workers in this age class is low relativeto that for older, more experienced workers. A large fraction is also inter-ested in only part-time work, and part-time jobs typically pay lower wagesthan full-time, long-term job commitments. Higher minimum wage levelsand expanding coverage requirements may, therefore, be significant factorsinfluencing recent high unemployment rates for persons in this age class.
The welfare and income implications of unemployment among youngpersons are somewhat less serious than for other groups such as adultmarried men. Many of these young persons are part of larger familyunits. The contribution of working teenagers to average family income in1966 was about 10 percent. More than three-quarters of those who workedearned less than $1,000. Moreover, many unemployed teenagers are fromfamilies that are relatively well-to-do. Over 30 percent of unemployedteenagers were in families with annual incomes of more than $10,000;about the same fraction were in families with incomes of less than $5,000.
WomenUnemployment rates for women are also relatively high. In 1969, the
unemployment rate for females was 4.7 percent compared to 2.8 percentfor males. Nearly half of unemployed women were married with husbandspresent. In a large fraction of these families the husband was undoubtedlyemployed, and employment for the wife would represent a secondarysource of income. Among the 739,000 unemployed females not marriedor whose husbands are not present, many are young persons withthe special reasons for high unemployment already discussed. Since therewere 412,000 unemployed female teenagers in 1969, they account for a
J55
Digitized for FRASER http://fraser.stlouisfed.org/ Federal Reserve Bank of St. Louis

large fraction of the unemployed females who were not married or whosehusbands were not present.
Negro and Other Races
Unemployment rates for Negroes and other minority races are roughlydouble those for whites, a pattern that has prevailed since the late fifties.The higher unemployment rate for Negro and other races reflects in parttheir different labor force composition. Standardizing for age and sex dif-ferences in the labor force decreases the unemployment rates for Negro andother races from 6.4 to 6.0 percent, but the adjusted rate is still almostdouble that for whites (3.1 percent). Standardizing for years of schooling,industry, occupation, and the like would further decrease the relative un-employment rate of Negro and other races. But the need for adjustmentsof this sort simply reflects an historical pattern of discrimination and disad-vantage that more recent policies to improve employment qualificationsand opportunities have only begun to ameliorate.
An additional 290,000 jobs for unemployed Negroes and members ofother races in 1969 would have made their unemployment rate equal to thatof whites. This is about 20 percent of the annual increase in average employ-ment in each of the last 5 years. Focusing on the additional jobs requiredfor members of Negro and other races to bring their unemployment ratedown to the level for whites, however, gives a misleading impression of thenature of the problem. The problem is not that 290,000 additional membersof Negro and other races are totally unable to obtain employment. In 1969,for example, 29,000 persons of Negro and other races were reported as un-employed for 6 months or more in a typical month. The fraction of thoseunemployed who were unemployed for 6 months or more was slightly higherfor Negro and other races than for whites—5.1 compared to 4.6 percent.Bringing the unemployment rate for Negro and other races down to the levelprevailing for whites requires long-term policies designed to improve the dis-tribution of education, skill levels, occupational and industrial affiliation,and job opportunities.
156
Digitized for FRASER http://fraser.stlouisfed.org/ Federal Reserve Bank of St. Louis