eradicating child poverty: the role of key policy areas
TRANSCRIPT
Addressing in-work poverty
Peter Kenway
November 2008
This report describes how the rise of poverty among children in working-families is undermining the drive to end child poverty as a whole, and what can be done about it.
The existence of ‘in-work’ poverty has only been officially recognised in the last couple of years. Yet the steady upward trend and number of children involved mean that it should be given high priority. The report includes an in-depth analysis of the progress that has been made on in-work poverty among children since the start of the government’s poverty programme in the late 1990s.
Key features of the report include:
discussion of the gradual recognition of in-work poverty affecting children;
a review of the evidence on in-work poverty (how many and who it affects, how it has and will change);
analysis of the effect of tax credits on in-work poverty;
examination of the government’s new approach;
proposals for what can be done to meet the challenge of progression including universal child care and tax reform.
•
•
•
•
•
www.jrf.org.uk
Eradicating child poverty: the role of key policy areas
List of figures and tables 3
Executive summary 4
Introduction 6
1 The challenge of in-work poverty 7
2 An analysis of the problem 10
3 What can be done? 18
Notes 25
References 29
About the author 31
Contents
� Contents
List of figures and tables
Figures
1 Number of children in poverty, by family work status, 1979–�005/06, Great Britain 1�
� Percentage of all children in poverty by work status and family type, �006 14
3 Children in working families in in-work poverty, or who need tax credits to escape it 15
Tables
1 Child population, and child poverty shares and risks, average of �003/04 to �005/06 11
� Children in working families by family work status, average of �003/04 to �005/06 (%) 16
3List of tables and figures
Executive summary
This report looks at the subject of poverty among children in working families – children in ‘in-work poverty’ for short – and what should be done about it. It rests on an in-depth analysis of the evidence on the progress that has been made on in-work poverty among children since the start of the government’s poverty programme in the late 1990s. Its key findings are:
After falling in the early years of the Labour Government’s anti-poverty strategy, the number of children in in-work poverty has now returned to the level that it was at when Labour came to office. The net overall effect of policy on in-work poverty is zero.
By contrast, there has been a continuing fall in the number of children in poverty who belong to workless households. As a result, in-work poverty’s ‘share’ of total child poverty has been drifting up gradually, and has now reached, or exceeded, 50%.
Tax credits now lift around one million children in working families out of poverty. But this has been cancelled out by steadily rising number of children who need tax credits to avoid in-work poverty, up from around two million in the mid-1990s to nearly three million in �005/06. It is not, therefore, that tax credits have ‘failed’ but rather that the underlying problem, of work providing insufficient income, has got worse.
Most children in in-work poverty belonging to families who are only ‘partly working’ (that is, where the jobs done are part time only, or where one adult is not working at all, or where at least one adult is self-employed). Although this would seem to imply that poverty in these families could be avoided if the adults worked more, ‘partly working’ families are not unusual, half of all children in working families belonging to this group.
•
•
•
•
The key conclusion from this analysis is that building on what has gone is no longer enough. While myriad individual policies, including on pay and skills, all have their part to play, what is needed are some new, big ideas that can change the framework within which individual policies play out. For example:
The creation of a system of free, universal childcare. The basic argument for it stems from the fact that while the poverty risk for ‘part-working’ families is large, ‘part-working’ is still a perfectly normal family status in our society. As a result, if it is not to be divisive, reducing the extent of part-working in the interests of cutting in-work poverty require changing a society-wide norm. Universal childcare provision could be the spur to that change, and to be universal it would need to be free. But while this can be seen as the logical endpoint of a number of government objectives, it is a far from foregone conclusion that the public would agree. A proper public debate is therefore required.
A comprehensive review of the tax, tax credit and benefit systems with the twin objectives of cutting the tax paid by low-income working households and reducing the extraordinarily high marginal effective tax rates many of them face. By so doing, low-income working families would be better able to improve their financial position through their own efforts (e.g. by working a little longer, or getting slightly better paid) than they are now. ‘Allowing’ families to escape poverty in this way, by lowering their marginal tax rates, entails the recognition that the state may be a part of the problem as well as part of the solution. If this is at odds with the long-standing emphasis on ‘helping’ people out of poverty, it is nevertheless a much better complement to the emerging emphasis within government thinking on ‘progression’.
•
•
4 Executive summary

Some may dismiss such ideas as unrealistic. In our view, the opposite is the case: if the legacy of nearly ten years of a committed anti-poverty policy is zero net progress on in-work poverty, the unrealistic idea is that ‘more of the same’ can possibly be enough.
5Executive summary
6 Introduction
Introduction
In order to eradicate child poverty we need to provide opportunities for their parents to work. For most people of working age, the best way to avoid poverty and social exclusion is to be in paid work. But the enormous economic and social changes of the past 50 years, the reduction in demand for unskilled labour, the changing nature of employment patterns and family structure have left key groups in society stranded and unable to compete in the labour market. (DSS, 1999, p. 9)
Children in ‘in-work poverty’ is a shorthand referring to children in families where at least one of the parents is working but where the household income is below the official poverty line.
If in-work poverty were to exist to any great extent, it would call into question the assertion that has been at the heart of the government’s child poverty strategy since it began, namely, that ‘work (for those who can) is the route out of poverty’.
On the face of it, this assertion appears wholly sensible, supported as it is by the fact that most children in working families are not in poverty.
But for a workless family in poverty, facts about ‘most families’ may not be very relevant if they reflect the experience of many whose earnings are way beyond what the parents in this family could reasonably expect to get. Instead, these parents would surely and sensibly look to the experience of their friends, neighbours and acquaintances, asking whether those among them who were in work – in the kind of work that they themselves would be likely to do – were really that much better off.
And here, suppose there was another ‘fact’, quite consistent with the first, namely, that among the children in poverty in the UK, at least as many belonged to working families as to workless ones. If that were so, and if the workless family in poverty were to see the equally numerous ‘in-work poor’ as the proper point of reference for their own prospects, two unpalatable possibilities would arise.
First, that even several tens of pounds a week extra income might not be worth the time, the money, or indeed the risk associated with taking a job that would still leave them and their family in poverty.
Second, that even if they were to take a job, they might very well still be in poverty.
In such a situation, an anti-poverty strategy based on ‘work’ would face two mortal threats: of neither succeeding according to its own lights nor endearing itself to those whom it was supposed to benefit. It might take several years for this to become clear. But once it had, the choice would be stark: either find a way of eliminating this flaw at the heart of the strategy, or give up all hope of eliminating child poverty.
The question is: is this the choice which now confronts New Labour’s anti-poverty strategy?
7The challenge of in-work poverty
1 The challenge of in-work poverty
This report is concerned with the subject of poverty among children in working families – children in ‘in-work poverty’ for short – and what should be done about it.1
It draws on the insights gleaned from a now decade-long study monitoring the progress on poverty and social exclusion, a study whose first fruits, setting out Labour’s poverty inheritance, appeared even before Mr Blair’s historic pledge in January 1999 to end child poverty within a generation (Howarth, et al., 1998). Those insights, as far as all aspects of poverty as it is currently measured are concerned, rest on our analysis of the government’s annual Households Below Average Income (HBAI) datasets, themselves drawn from the annual Family Resources Surveys, which go back to 1994/95.
Throughout this report, our measure of poverty is what can nowadays fairly be called the official one, namely a household income which is 60% or less of the median household income in the year in question.� This so-called ‘relative’ measure reflects the dominant definition, usually attributed to Peter Townsend, of poverty as something that is itself inherently relative. Along with the other reports in this collection, we use the ‘after housing cost’ (AHC) version of this measure. This is not the basis in which the government has chosen to express its �010 child poverty target but it was using it for the �004/05 target. Since that target has by no means yet been met, even though the latest published data is for �006/07, it seems to us entirely reasonable to continue using the AHC measure at least for the time being.
The changed nature of the child poverty challenge
The unavoidable background for this report is the path that has been followed by overall child poverty, both since the government’s baseline year of 1998/99 and particularly since �004/05, the year in
which the first target of reducing child poverty by a quarter was due to have been met. In our view, it is essential to recognise that the challenge of ending child poverty has changed as a result of what has become apparent over the past two years.
In �006, when the �004/05 statistics were first published, the consensus view was that, although the government had fallen short of its target by 0.3 million, there was no reason to think that there was anything fundamentally wrong with the strategy that had been pursued. In particular, not only had the fall in child poverty (0.8 million to 3.6 million) been substantial, there had been a fall in every year. The government, it seemed, was clearly on the right road, the only problem for debate being what it had to do in order to go faster. Against that background, differences of opinion were ones of degree rather than principle.
The �005/06 statistics, published in �007, were a shock to this consensus. Far from falling further, as had been hoped, the overall child poverty numbers rose, taking the overall level back up to where it had been in �00�/03, half a million short of the target for �004/05. But as one year’s numbers can never be decisive, the question of whether this was a real change of fortune or merely a blip had to wait for the �006/07 statistics. When these appeared in the summer of �008, showing a further rise in the overall level of child poverty, they were therefore decisive: although the latest rise was slight, it confirmed that the momentum up to �004/05 had now been lost.
This poses a different sort of challenge. With progress ended, perhaps even replaced now by regress, it is no longer enough just to ask how much more of the same needs to be done. Instead, the possibility must be considered either that something else needs to be done as well or even that something else needs to be done instead. In-work poverty in particular needs to be looked at in this way. Unlike differences over matters of degree, where common ground can be found in the desire
8 The challenge of in-work poverty
to do more, this is terrain where the potential for fundamental disagreement with government is very much greater.
The gradual emergence of in-work poverty as a problem
Until recently, a report on in-work poverty would have struggled to find an audience. The earliest reference that we have found to it is in the government’s own Opportunity for All for �000, where one of the functions of what was to become the Working Tax Credit was to ‘relieve in-work poverty’ (DWP, �000, p. 91). The earliest reference to it as a problem with a life of its own was in a �00� report of ours where, against a background of no overall improvement in the all-Scotland poverty numbers up to that point, we noted a fall in the numbers who were unemployed and in poverty and a rise in the numbers in poverty in work (Kenway, et al., �00�, p. 7).3 Although subsequent UK-wide monitoring reports continued to emphasise the unsatisfactory trends, it was still to be several years before the subject began to be recognised by official reports as a problem that needed attention.
The �004 report of the House of Commons Work and Pensions Committee, Child Poverty in the UK (House of Commons Work and Pensions Committee, �004) showed no signs of seeing in-work poverty as a problem. Since the Committee – reflecting informed opinion at that time – thought that the government was on track to meet its �004/05 child poverty targets, this may not be surprising. Yet even three years later, when the Treasury Select Committee’s report on the �007 Budget was expressing concern at the then recent small rise in the latest child poverty statistics (for �005/06), in-work poverty was still not discussed (House of Commons Treasury Committee, �007). Meanwhile, the Joseph Rowntree Foundation’s own What Will it Take to End Child Poverty? (Hirsch �006) listed several factors that would reduce the risk of in-work-poverty (increased tax credits and in-work benefits, increased relative wages for the poor, increased working hours in poor households), although its modelling exercise only included the first of these (Hirsch, �006).
The breakthrough came with Lisa Harker’s report for the Department for Work and Pensions
(DWP) at the end of �006 entitled Delivering on Child Poverty: What would it take? Although starting out from the DWP’s natural welfare-to-work perspective, Harker broke through those bounds as she stressed the need to reach out beyond the DWP’s client group, in particular to the ‘nearly half of children in poverty now liv(ing) in families where there is someone in work’. ‘It will be necessary’, she went on ‘to significantly reduce levels of poverty among this group in order to reach both the �010 and �0�0 targets’ (Harker, �006, p. 47).
Besides identifying low pay, families relying on one earner and single/dual earners not working enough hours as the causes of in-work poverty, the report also ‘reached out’ beyond the DWP, arguing to the Treasury that the �010 and �0�0 targets would not be met without further financial support for families with children. Among the measures mentioned were higher Child Benefit for second and subsequent children and higher Child Tax Credits, as well as the policy governing the annual uprating of these benefits.
In its response, Working for Children (DWP, March �007), the DWP both acknowledged the extent of the problem of in-work poverty and the importance of couple families within it.4 Accepting Harker’s view that welfare-to-work needed to be ‘attuned to the needs of both couple and lone parent families’, the paper announced the intention of extending the support available under New Deal Plus for Lone Parents to all couples. It stressed the importance of job retention and progression, with skills seen as a key determinant of both ‘employment stability’ and rate of pay. It also flagged up its Partners’ Outreach pilots aimed at second earners, especially in the Pakistani and Bangladeshi communities.
A subsequent green paper, however, mainly concerned with increasing employment, stressed the importance of making work pay. ‘We do not wish to repeat the US experience’, it said, ‘where welfare reform resulted in many lone parents moving into work, but remaining mired in poverty’ (DWP, �007, p 45). This is as clear a statement against in-work poverty as it possible to imagine. On a specific point, the paper cited employer discrimination as a ‘major factor in explaining employment disadvantage’ among minority ethnic groups (DWP, �007, p 51). A report at the start of
9The challenge of in-work poverty
�008 from the Institute for Public Policy Research (IPPR) gave the subject a further boost, helped by that organisation’s public profile and perceived proximity to government. Building on earlier research, its principal recommendation was for a change to the Working Tax Credit to make it more supportive of couple families (Cooke and Lawton, �008).
With a foreword signed by the Prime Minister and four other Secretaries of State, Ending Child Poverty: Everybody’s business, published as part of the �008 Budget (DCSF �008), marks the highest point thus far reached in the official recognition of in-work poverty as a problem. Besides examining both its extent and possible causes, the report also identified some ways in which it could be addressed. A closer analysis of that diagnosis will serve as the point of departure for our discussion of what needs to be done.
Exactly what status in official thinking does in-work poverty now have? In places, it is possible to conclude that it is now on a par with poverty arising from worklessness (HM Treasury, et al., �008).5 On balance, however, moving from worklessness into work continues to retain the priority that has long been attached to it, albeit now carefully and precisely qualified. As we move on to look at the evidence on in-work poverty, the following statement of the government’s position in �008 is worth repeating:
Work is the surest route out of poverty but not an immediate guarantee: a combination of low wages and/or low hours in low skilled jobs may mean that working families remain in poverty. Parents may face constraints that limit their ability to earn a sufficient income or progress in the workplace. (HM Treasury, et al., 2008, p. 20)
10 An analysis of the problem
2 An analysis of the problem
This section of the report undertakes a detailed analysis of the statistics on in-work poverty, both to present a clear overall picture of where matters stand as well as to break the problem down in order to identify the relative importance of different factors.
How many children are in in-work poverty?
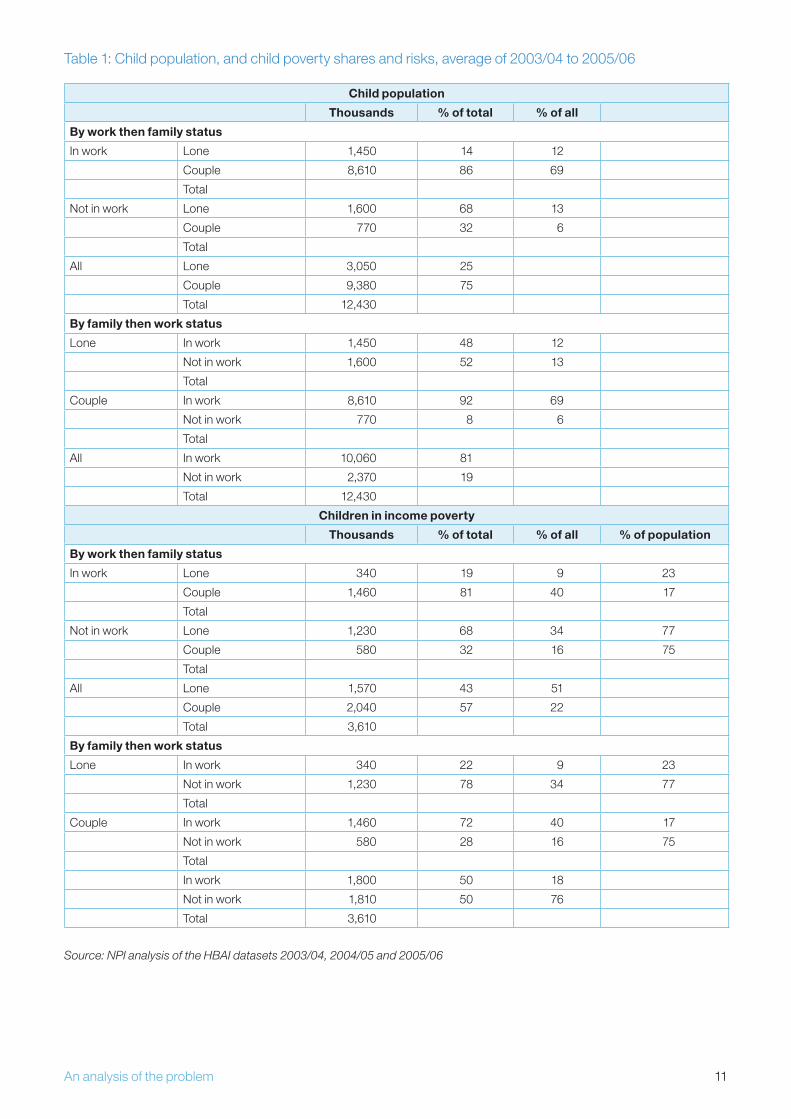
Averaging over the three most recent years for which detailed data is available, there are 1.8 million UK children who belong to families in in-work poverty.6 This represents half (50%) of all children in poverty (the poverty ‘share’) and nearly a fifth (18%) all children in working families (the poverty ‘risk’). Table 1 presents a selection of these numbers, the highlights of which are as follows.
Of the 1.8 million children in in-work poverty, 340,000 belong to lone-parents families. These 340,000 represent:
as poverty shares, one-fifth of all children in in-work poverty (19%), one-fifth of all children in lone-parent families in poverty (�3%) and one-tenth of all children in poverty (9%)
as poverty risks, a quarter of all children in working, lone-parent families (�3%).
The other 1,460,000 belonged to couple families. They represent:
as poverty shares, four-fifths of all children in in-work poverty (81%), four-fifths of all children in couple families in poverty (78%) and two-fifths of all children in poverty (40%)
as poverty risks, one-sixth of all children in working couple families (17%).
•
•
•
•
There are two main points here. The first is the proportion of all children in poverty who are in in-work poverty: a half. So the ‘hypothetical’ fact thrown into the Introduction is therefore, of course, a real one, and in-work poverty’s near equal status with workless poverty in official thinking is wholly justified.
The second point is that the great majority of children in in-work poverty belong to couple families. This high in-work share comes about despite the risk for children in couple families being somewhat lower than that for children in lone-parent families (17% compared with �3%).7 It is this very high share that the IPPR and others have in mind when suggesting changes to tax credits to provide extra support for couples.
How has this number changed over time?
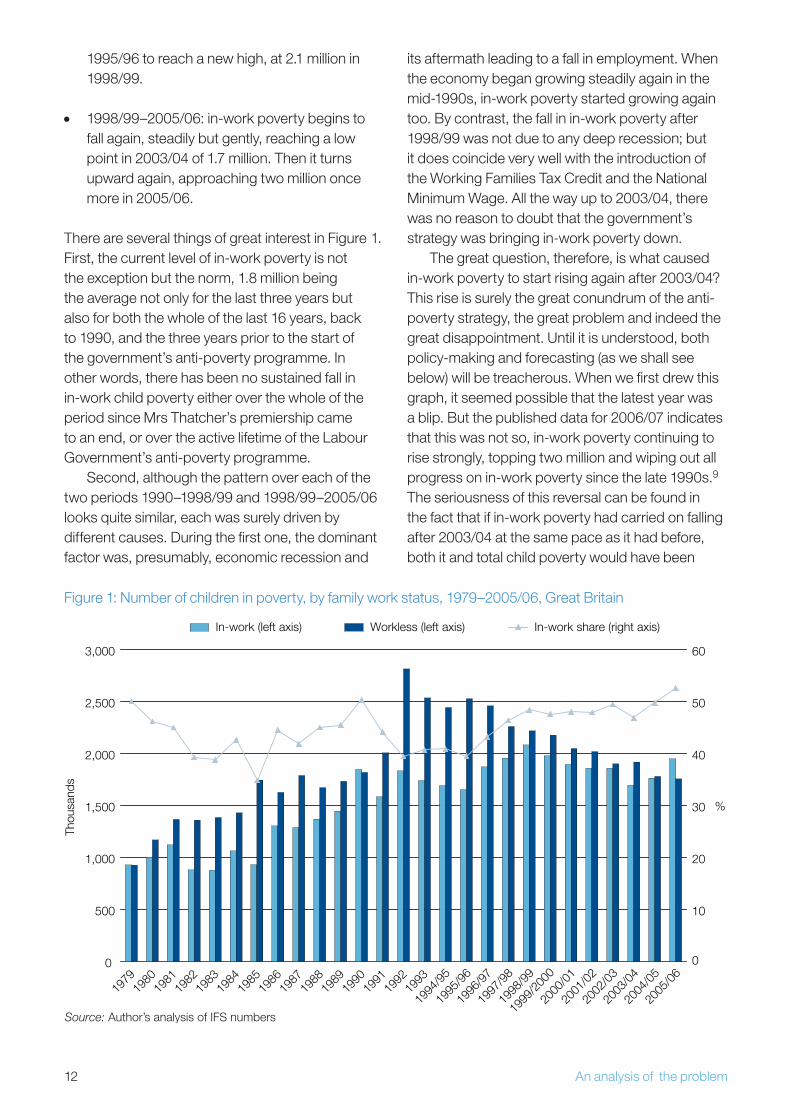
How does the average of 1.8 million children in in-work poverty over the last three years compare with the situation in the recent, and not so recent, past? Figure 1 shows the total number of children in poverty each year since 1979, divided between those in workless families and those in working ones.8 Dealing with in-work poverty first, four phases can be identified: a steady period when things used to be better; a short period when things got worse rapidly; and two periods in which slow but steady progress was subsequently reversed.
1979–85: in-work poverty is basically steady, fluctuating by no more than 100,000 either side of the average of about one million.
1985–90: in-work poverty almost doubles in five years, to peak at a figure of 1.8 million.
1990–98/99: after a gentle fall from the 1990 high, in-work poverty begins to rise again from
•
•
•
11An analysis of the problem
Table 1: Child population, and child poverty shares and risks, average of �003/04 to �005/06
Child population
Thousands % of total % of all
By work then family status
In work Lone 1,450 14 1�
Couple 8,610 86 69
Total
Not in work Lone 1,600 68 13
Couple 770 3� 6
Total
All Lone 3,050 �5
Couple 9,380 75
Total 1�,430
By family then work status
Lone In work 1,450 48 1�
Not in work 1,600 5� 13
Total
Couple In work 8,610 9� 69
Not in work 770 8 6
Total
All In work 10,060 81
Not in work �,370 19
Total 1�,430
Children in income poverty
Thousands % of total % of all % of population
By work then family status
In work Lone 340 19 9 �3
Couple 1,460 81 40 17
Total
Not in work Lone 1,�30 68 34 77
Couple 580 3� 16 75
Total
All Lone 1,570 43 51
Couple �,040 57 ��
Total 3,610
By family then work status
Lone In work 340 �� 9 �3
Not in work 1,�30 78 34 77
Total
Couple In work 1,460 7� 40 17
Not in work 580 �8 16 75
Total
In work 1,800 50 18
Not in work 1,810 50 76
Total 3,610
Source: NPI analysis of the HBAI datasets 2003/04, 2004/05 and 2005/06
1� An analysis of the problem
1995/96 to reach a new high, at �.1 million in 1998/99.
1998/99–�005/06: in-work poverty begins to fall again, steadily but gently, reaching a low point in �003/04 of 1.7 million. Then it turns upward again, approaching two million once more in �005/06.
There are several things of great interest in Figure 1. First, the current level of in-work poverty is not the exception but the norm, 1.8 million being the average not only for the last three years but also for both the whole of the last 16 years, back to 1990, and the three years prior to the start of the government’s anti-poverty programme. In other words, there has been no sustained fall in in-work child poverty either over the whole of the period since Mrs Thatcher’s premiership came to an end, or over the active lifetime of the Labour Government’s anti-poverty programme.
Second, although the pattern over each of the two periods 1990–1998/99 and 1998/99–�005/06 looks quite similar, each was surely driven by different causes. During the first one, the dominant factor was, presumably, economic recession and
•
its aftermath leading to a fall in employment. When the economy began growing steadily again in the mid-1990s, in-work poverty started growing again too. By contrast, the fall in in-work poverty after 1998/99 was not due to any deep recession; but it does coincide very well with the introduction of the Working Families Tax Credit and the National Minimum Wage. All the way up to �003/04, there was no reason to doubt that the government’s strategy was bringing in-work poverty down.
The great question, therefore, is what caused in-work poverty to start rising again after �003/04? This rise is surely the great conundrum of the anti-poverty strategy, the great problem and indeed the great disappointment. Until it is understood, both policy-making and forecasting (as we shall see below) will be treacherous. When we first drew this graph, it seemed possible that the latest year was a blip. But the published data for �006/07 indicates that this was not so, in-work poverty continuing to rise strongly, topping two million and wiping out all progress on in-work poverty since the late 1990s.9 The seriousness of this reversal can be found in the fact that if in-work poverty had carried on falling after �003/04 at the same pace as it had before, both it and total child poverty would have been
Source: Author’s analysis of IFS numbers
0
500
1,000
1,500
�,000
�,500
3,000
1979
1980
1981
198�
1983
1984
1985
1986
1987
1988
1989
1990
1991
199�
1993
1994
/95
1995
/96
1996
/97
1997
/98
1998
/99
1999
/�00
0
�000
/01
�001
/0�
�00�
/03
�003
/04
�004
/05
�005
/06
Thou
sand
s
%
10
0
�0
30
40
50
60
In-work (left axis) Workless (left axis) In-work share (right axis)
Figure 1: Number of children in poverty, by family work status, 1979–�005/06, Great Britain
13An analysis of the problem
around three-quarters of a million lower by �006/07 than they actually turned out to be. The �004/05 target would have been reached and surpassed. The �010 target, although still ambitious, would have been feasible.
In-work poverty in relation to workless poverty
The picture on workless poverty shown in Figure 1 is completely different: an almost uninterrupted downward trend since the early 1990s.10 As a result, the recent three-year average of 1.8 million is 0.4 million lower than the average for the last 16 years and 0.6 million lower than the average for the three years 1995/96–1997/8. Not only therefore has there been a clear downward trend but the pace of decline has also been faster during the period of the active anti-poverty policy than before. Moreover, unlike in-work poverty, this fall has been continuing year by year since �003/04, up to and including �006/07.11
Up to a point, the fall in workless poverty can be expected to have had an adverse impact on in-work poverty. As the population of working families grows, so the number of them in poverty will rise even if the proportion in poverty stays the same. In order to work out how big this impact might have been, we use the average of the last three years before the anti-poverty strategy began (1995/96–97/98) as the baseline. By �001/0�, the number of children in working families had risen relative to this baseline by about 400,000. This was made up of a rise of fully half a million in lone-parent families offset by a small fall in couple families. The question then is: what poverty rate did this extra 400,000 face?
One possibility is that the rate they faced was no different from the average rate. Since most of them belong to lone-parent families, that means a rate of about �5%, implying an increase in in-work poverty above what it would otherwise have been of 100,000.1� Alternatively (in line with the suggestion in the Introduction), if the families of these children faced a higher in-work poverty rate than those already in work, the effect would have been that much larger. So, for example, a 50% rate would have raised in-work poverty above what it would otherwise have been by �00,000.
It must be said that even after poring over the entrails of these statistics, we can find no evidence to support the idea that the marginal poverty rate has been higher than the average rate; in that sense, the suggestion from the Introduction that it might be lacks foundation at least as far as lone-parent families are concerned.13 Nevertheless, the important point here is that whatever the rate, it cannot contribute to an explanation of why in-work poverty started rising again because the overall number of children in working families has been broadly steady from �001/0� onwards. Put another way, the analysis would contribute towards an explanation of why the anti-poverty strategy was not doing as well as hoped, but it would not contribute to an explanation of why the paths of in-work and workless poverty diverged so abruptly after �003/04.14
In-work’s future share of poverty
A consequence of these contrasting fortunes is that in-work poverty’s share of total child poverty shown in Figure 1 has been drifting up gradually since 199�, from 40% to 50%. That is the range it has moved since 1979. Since the child poverty target for �010 and the �0�0 goal of abolition (which is not interpreted as zero) are for overall child poverty only, what sort of share of that total could in-work poverty reasonably be expected to take? The default answer is somewhere between 40% and 50%, but is that right?
There is nothing in the near term to suggest this upward trend in the in-work proportion is going to change. As part of its �008 ‘Green Budget’ report, the Institute for Fiscal Studies (IFS) updated its forecast for the level of child poverty, including in-work child poverty, up to �010/11, taking account of all announced policies to do with tax credits, Child Benefit etc. According to that forecast, while the overall rate of child poverty is due to fall over the five years from �005/06 up to �010/11, the in-work share will rise by a further 4 percentage points. On our figures, that would imply a rise from 53% to 57%.15 The trouble with this forecast, however, is that the �006/07 numbers alone show a further rise in the in-work share of almost 3% compared with a year earlier. This giddy rise in in-work poverty
14 An analysis of the problem
is playing havoc even with the most careful of forecasts.
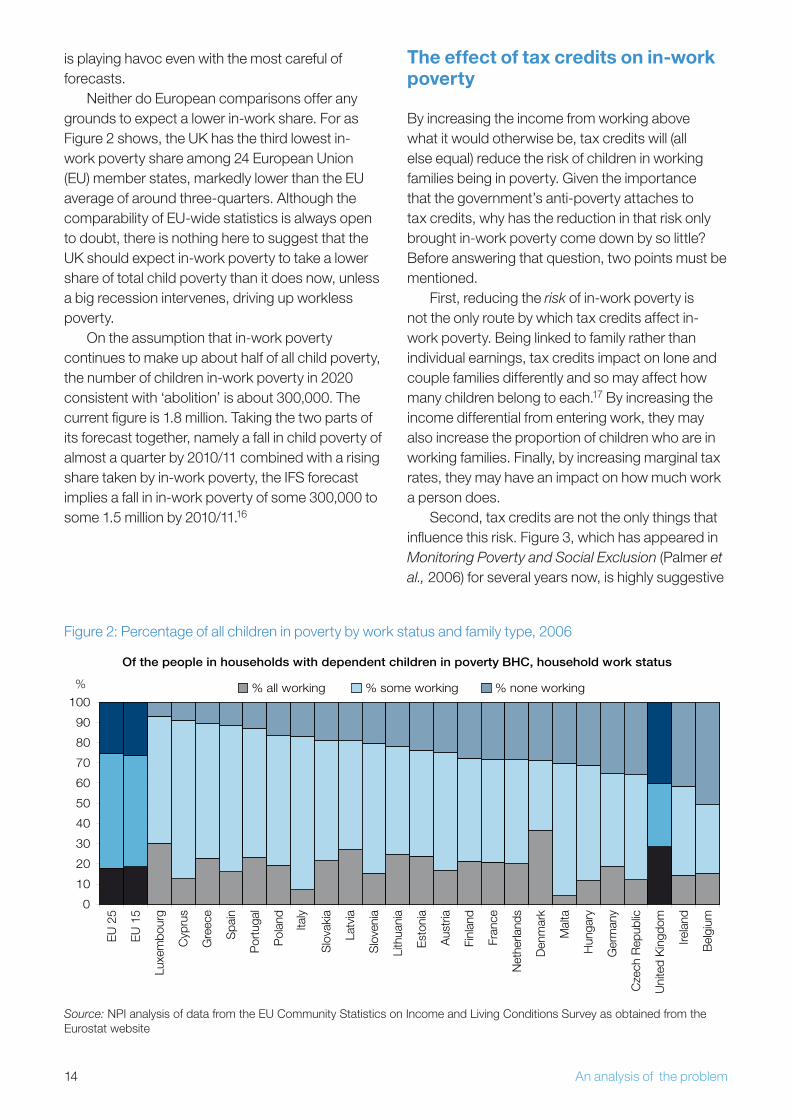
Neither do European comparisons offer any grounds to expect a lower in-work share. For as Figure � shows, the UK has the third lowest in-work poverty share among �4 European Union (EU) member states, markedly lower than the EU average of around three-quarters. Although the comparability of EU-wide statistics is always open to doubt, there is nothing here to suggest that the UK should expect in-work poverty to take a lower share of total child poverty than it does now, unless a big recession intervenes, driving up workless poverty.
On the assumption that in-work poverty continues to make up about half of all child poverty, the number of children in-work poverty in �0�0 consistent with ‘abolition’ is about 300,000. The current figure is 1.8 million. Taking the two parts of its forecast together, namely a fall in child poverty of almost a quarter by �010/11 combined with a rising share taken by in-work poverty, the IFS forecast implies a fall in in-work poverty of some 300,000 to some 1.5 million by �010/11.16
The effect of tax credits on in-work poverty
By increasing the income from working above what it would otherwise be, tax credits will (all else equal) reduce the risk of children in working families being in poverty. Given the importance that the government’s anti-poverty attaches to tax credits, why has the reduction in that risk only brought in-work poverty come down by so little? Before answering that question, two points must be mentioned.
First, reducing the risk of in-work poverty is not the only route by which tax credits affect in-work poverty. Being linked to family rather than individual earnings, tax credits impact on lone and couple families differently and so may affect how many children belong to each.17 By increasing the income differential from entering work, they may also increase the proportion of children who are in working families. Finally, by increasing marginal tax rates, they may have an impact on how much work a person does.
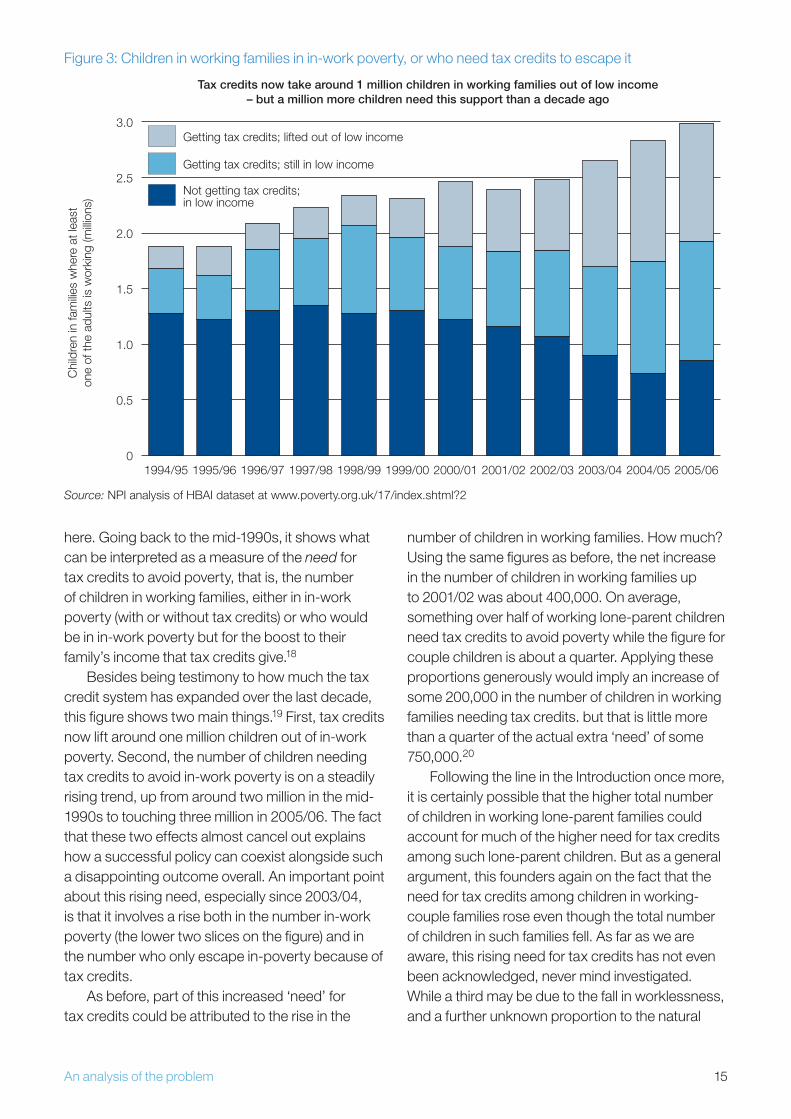
Second, tax credits are not the only things that influence this risk. Figure 3, which has appeared in Monitoring Poverty and Social Exclusion (Palmer et al., �006) for several years now, is highly suggestive
%
Source: NPI analysis of data from the EU Community Statistics on Income and Living Conditions Survey as obtained from the Eurostat website
Of the people in households with dependent children in poverty BHC, household work status
0
10
�0
30
40
50
60
70
80
90
100
EU
�5
EU
15
Luxe
mbo
urg
Cyp
rus
Gre
ece
Spa
in
Por
tuga
l
Pol
and
Italy
Slo
vaki
a
Latv
ia
Slo
veni
a
Lith
uani
a
Est
onia
Aus
tria
Finl
and
Fran
ce
Net
herla
nds
Den
mar
k
Mal
ta
Hun
gary
Ger
man
y
Cze
ch R
epub
lic
Uni
ted
Kin
gdom
Irela
nd
Bel
gium
% all working % some working % none working
Figure �: Percentage of all children in poverty by work status and family type, �006
15An analysis of the problem
here. Going back to the mid-1990s, it shows what can be interpreted as a measure of the need for tax credits to avoid poverty, that is, the number of children in working families, either in in-work poverty (with or without tax credits) or who would be in in-work poverty but for the boost to their family’s income that tax credits give.18
Besides being testimony to how much the tax credit system has expanded over the last decade, this figure shows two main things.19 First, tax credits now lift around one million children out of in-work poverty. Second, the number of children needing tax credits to avoid in-work poverty is on a steadily rising trend, up from around two million in the mid-1990s to touching three million in �005/06. The fact that these two effects almost cancel out explains how a successful policy can coexist alongside such a disappointing outcome overall. An important point about this rising need, especially since �003/04, is that it involves a rise both in the number in-work poverty (the lower two slices on the figure) and in the number who only escape in-poverty because of tax credits.
As before, part of this increased ‘need’ for tax credits could be attributed to the rise in the
number of children in working families. How much? Using the same figures as before, the net increase in the number of children in working families up to �001/0� was about 400,000. On average, something over half of working lone-parent children need tax credits to avoid poverty while the figure for couple children is about a quarter. Applying these proportions generously would imply an increase of some �00,000 in the number of children in working families needing tax credits. but that is little more than a quarter of the actual extra ‘need’ of some 750,000.�0
Following the line in the Introduction once more, it is certainly possible that the higher total number of children in working lone-parent families could account for much of the higher need for tax credits among such lone-parent children. But as a general argument, this founders again on the fact that the need for tax credits among children in working-couple families rose even though the total number of children in such families fell. As far as we are aware, this rising need for tax credits has not even been acknowledged, never mind investigated. While a third may be due to the fall in worklessness, and a further unknown proportion to the natural
Figure 3: Children in working families in in-work poverty, or who need tax credits to escape itC
hild
ren
in fa
milie
s w
here
at l
east
one
of th
e ad
ults
is w
orki
ng (m
illion
s)Tax credits now take around 1 million children in working families out of low income
– but a million more children need this support than a decade ago
Source: NPI analysis of HBAI dataset at www.poverty.org.uk/17/index.shtml?�
0
0.5
1.0
1.5
�.0
�.5
3.0Getting tax credits; lifted out of low income
Getting tax credits; still in low income
Not getting tax credits; in low income
�005/06�004/05�003/04�00�/03�001/0��000/011999/001998/991997/981996/971995/961994/95
16 An analysis of the problem
turnover in the population of children in working families, there is also the possibility that tax credits themselves are part of the cause, for example, encouraging some to work shorter hours to take advantage of the fact that tax credits make up a lot of the income lost.
What difference does the amount of work make?
Working families can vary a lot in the amount of work that they do (for example, two adults full time versus just one adult in a two adult family working part time) and, clearly, this makes a big difference to the likelihood of being in poverty. To see how much, children in working families can be divided into four work status groups namely: those where at least one adult is working full time and the second (if there is one) is working at least part time; those where at least one person is self-employed; couple families where one works full time and one not at all; and part-time earner only families. All but the third of these groups contains children in lone-parent and in couple families. As a shorthand, the first group can be described as ‘fully working’ and the other three as ‘partly working’.
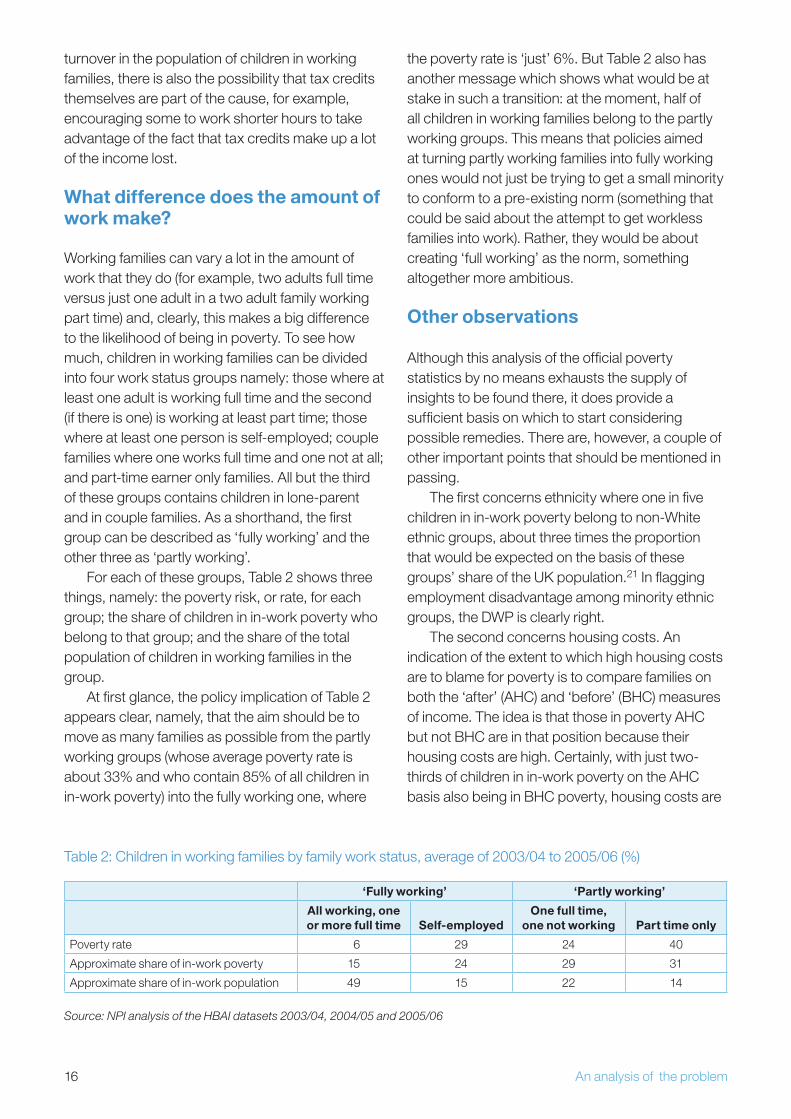
For each of these groups, Table � shows three things, namely: the poverty risk, or rate, for each group; the share of children in in-work poverty who belong to that group; and the share of the total population of children in working families in the group.
At first glance, the policy implication of Table � appears clear, namely, that the aim should be to move as many families as possible from the partly working groups (whose average poverty rate is about 33% and who contain 85% of all children in in-work poverty) into the fully working one, where
the poverty rate is ‘just’ 6%. But Table � also has another message which shows what would be at stake in such a transition: at the moment, half of all children in working families belong to the partly working groups. This means that policies aimed at turning partly working families into fully working ones would not just be trying to get a small minority to conform to a pre-existing norm (something that could be said about the attempt to get workless families into work). Rather, they would be about creating ‘full working’ as the norm, something altogether more ambitious.
Other observations
Although this analysis of the official poverty statistics by no means exhausts the supply of insights to be found there, it does provide a sufficient basis on which to start considering possible remedies. There are, however, a couple of other important points that should be mentioned in passing.
The first concerns ethnicity where one in five children in in-work poverty belong to non-White ethnic groups, about three times the proportion that would be expected on the basis of these groups’ share of the UK population.�1 In flagging employment disadvantage among minority ethnic groups, the DWP is clearly right.
The second concerns housing costs. An indication of the extent to which high housing costs are to blame for poverty is to compare families on both the ‘after’ (AHC) and ‘before’ (BHC) measures of income. The idea is that those in poverty AHC but not BHC are in that position because their housing costs are high. Certainly, with just two-thirds of children in in-work poverty on the AHC basis also being in BHC poverty, housing costs are
Table �: Children in working families by family work status, average of �003/04 to �005/06 (%)
‘Fully working’ ‘Partly working’
All working, one or more full time Self-employed
One full time, one not working Part time only
Poverty rate 6 �9 �4 40
Approximate share of in-work poverty 15 �4 �9 31
Approximate share of in-work population 49 15 �� 14
Source: NPI analysis of the HBAI datasets 2003/04, 2004/05 and 2005/06

17An analysis of the problem
important. However, almost all of the other one-third have below-average income BHC, with half of them being only just above the BHC poverty line. Any worry that the poverty numbers are picking up well-paid lawyers struggling with a million pound mortgage can be discounted.��
18 What can be done?
3 What can be done?
Discussion of what can be done to end in-work poverty can only proceed from a coldly realistic assessment of where things now stand. For external commentators with no responsibilities that is an easy position to adopt. For government and politicians, as well as those campaigning organisations that have supported their actions, it is certainly not. It is awkward enough that in-work poverty among children is mainly a problem of working couples when the anti-poverty strategy itself is so focused on workless lone parents. But the fact that recent reversals now mean that there has been no progress at all on in-work poverty under this government must be almost impossible to accept. Yet until it is, there can now be no prospect of even coming close to abolishing child poverty.
How adequate is the government’s new approach?
We have already argued that the government’s latest report on what to do about child poverty (Ending Child Poverty: Everybody’s business, DCSF �008) represents a big step forward in the official recognition of in-work poverty among children. The question now, however, is whether the policies it is proposing represent a big step forward too.
In summary, the document proceeds by taking the government’s current approach and then building on it in a number of ways. The parts of the current approach to do with in-work poverty include: measures to make work pay; ensuring access to flexible, affordable, quality, local childcare; increasing opportunities for parents to develop the skills needed to progress in work; and rights to flexible working and parental leave (HM Treasury, et al., �008, p. 36). The main additional elements set out in the report include (HM Treasury, et al., �008, chapter 5):
An emphasis on job retention and progression (for example, in-work advisory support for lone parents; a focus on the acquisition of skills).
•
A new duty on local authorities to secure sufficient childcare for working parents.
Further financial support (for example, increases in Child Benefit and the Child Tax Credit; reforms to child maintenance arrangements, higher benefit take-up).
A focus on increasing the amount of paid work done by a family (especially via an in-work credit to support additional earners within a family to enter work).
Without going into detail here, it is impossible to see the above list as constituting a dramatic new direction for government policy. Both the childcare and financial elements use existing instruments and institutions: in essence, more of the same albeit somewhat beefed up. The emphasis on job retention and progression, although certainly an important theme for those in in-work poverty, relies chiefly on improved skills and qualifications as the means to achieve it. The one genuinely new element is the focus on getting second earners into work; the means for doing so, however, seems to lie once more with tax credits.
What accounts for this cautious, gradualist approach? The answer is surely that the government’s document simply does not recognise that there has been no sustained improvement in in-work poverty. In particular, while it does analyse the characteristics of families in poverty, it no where refers to the fact that in-work child poverty has recently gone up again, or that the net effect over the lifetime of its strategy, has been nil.�3 For such an important document, that is any unacceptable omission. Deprived of that perspective, there can be no grounds for suspecting that ‘a bit more of the same’ may no longer be up to the job.
What makes this surprising is the fact that the document does recognise something that resembles the problem we picked up above in the analysis of tax credits, namely, that somehow, there is an underlying trend towards things getting worse.
•
•
•
19What can be done?
We put it in terms of the fact that the need for tax credits to avoid poverty seemed to be growing all the time. The document does not focus explicitly on tax credits but makes a slightly wider point, namely, that ‘had the Government done nothing other than simply uprate the tax and benefit system, there might have been 1.7 million more children in poverty than there are today’ (HM Treasury, et al., �008, p. 5).�4 Yet despite leading off on this point, however, no explanation is offered as to why this might be so.
This leads directly to our first conclusion. In a way it is one we are reluctant to make because a call from within the research community for more research sounds like special pleading. But until it is understood what is driving these unfavourable trends and their apparent manifestations (especially regarding tax credits and the sustained upturn in in-work poverty), there is no firm ground on which specific policy recommendations can rest. In particular, heroic efforts to work out how much extra money will be required to achieve some chosen outcomes are entirely without value unless we can estimate, and add in, the extra that is required to hold the numbers at the present level. In short, then, understanding what has gone wrong and why is the first requirement.
Pay and the indirect role of government
Despite all this, however, the document does break new ground, not just in its recognition of in-work poverty, but of the importance it attaches to pay, hours and progression. At first sight, it may seem as if the most radical of these is pay, implying perhaps that the National Minimum Wage is no longer the government’s last word on this subject. In fact, however, there is nothing of substance in the document to support that view. Rather, the government seems to believe that the keys to higher pay are greater skills and better qualifications.
While low pay cannot be completely disconnected from low skills and low productivity, neither is the link between them necessarily direct, immediate or binding. This is surely one of the lessons of the way the Minimum Wage was uprated faster than either prices or average earnings, chiefly
during Lord Turner’s tenure as chair of the Low Pay Commission.�5 While it would be ridiculous to think that there is anything like complete freedom to set wages at any level, it would also be wrong to think that there is no freedom at all. Moreover, government, or rather the public sector, is a big employer of low-paid workers, with around a quarter directly employed within the sector across the UK as a whole.�6 Although it is only a tentative first step, it is of interest that in the light of its ‘solidarity’ objective, the Scottish Government’s public sector pay policy for �008/09 asks that specific consideration be given to the lowest-paid groups of staff (�008, para. �8).
At this point, however, we must step back. For while above-average pay increases for low-paid workers, whether somehow linked to training or not, will certainly have some impact on in-work poverty, it is implausible to suppose that government can do very much directly to alter the distribution of earnings as between low earners and those on around average earnings. A return to the steady upward pressure on the Minimum Wage might be helpful but, beyond that, it will be labour market forces, in which we include the activities of trade unions, which will be decisive in bringing about sustained change.�7
The fact, however, that the government’s direct role is limited does not mean that it has no role to play: on the contrary, developments in the labour market play out within a framework that the government itself does much to influence. The laws it passes constitute one part of this. The tax, benefit and tax credit systems, along with the levels of public expenditure, constitute another. The leadership it exercises, by signalling its priorities (as in the manner of the Scottish Government above) is a third. In short, there are legal, fiscal and moral elements to the framework within which the labour market functions and government influences all of them.
This conclusion points us towards a very different anti-poverty strategy from the one that has been pursued these past 10 years. Instead of relying on the most direct route by which government can affect family incomes, via tax credits, this approach emphasises the government’s indirect role in shaping the settings within which individuals and organisations make
�0 What can be done?
their decisions. And what idea should motivate the government as it seeks to exercise its influence? What, in other words, should be the dominant motif of a new strategy to deal with in-work poverty, displacing the idea most closely associated with the direct route, of ‘helping’ people out of poverty?
The answer, we suggest, is closely connected with that idea of ‘progression’, that the government should be in the business of allowing, enabling and encouraging people to make their own way out of poverty. If that is not just to be empty rhetoric, we need to explain in concrete, practical terms what it means. In order to do that, we need first to reflect on how the ‘progression’ fits in with the other ideas that make up modern thinking about how to deal with poverty. What we discover when we do is that ‘progression’ actually challenges some of the basic tenets of anti-poverty thinking.
First among these is the idea that the way to think about poverty is in terms of distinct states. So we talk of a family being ‘in poverty’ or ‘not in poverty’; and of being ‘in work’ or ‘not in work’. Second is the belief that these states can be clearly ranked, ‘poor and workless’ being the least desirable, ‘poor and in work’ coming next, with ‘not poor and in work’ being the most desirable.�8 Third, the movement between these states is supposed to be uni-directional, from the worst towards the best. But once we start thinking about how people actually progress between these states, and how they value them, the limitations and even error of these ways of thinking becomes apparent.
The challenge of progression
Worklessness to work (and back)A companion report in this collection by Martin Evans and Lewis Williams challenges both the first and third of these ideas (�008). Far from being distinct states, where someone moves from ‘workless’ to ‘work’, Evans and Williams note how low-paid workers, especially those working part time, shuttle between work and not-work. So workers in occupations classified as ‘elementary’ – the lowest paid – also have the highest likelihood of being unemployed; and job exit rates for lone parents are highest among those who have recently entered work, or among those in part-time low-paid jobs (Evans and Williams, �008, section 4).
Aggregate statistics show this merry-go-round too with almost half the men, and a third of the women, making a new claim for Jobseeker’s Allowance having last claimed that benefit less than six months ago.�9
Evans also points to the connections between sickness and low pay (and low-paid occupations). Participants in a discussion organised by ATD Fourth World in Camberwell, London, on 14 May �008, spoke of the way that short-term, unplanned childcare demands arising from sickness can impinge on employment, up to and including losing one’s job. The conclusion we draw from this is that the social security system needs to be such that it recognises this connectedness between ‘work’ and ‘not-work’ or, to put this another way, takes account of the path that people have travelled into worklessness. This, however, takes us beyond the limits of this report into the subject of welfare reform.30
How to get families working fullyOn the face of it, Table � shows quite clearly that the problem of in-work poverty usually arises when their parents are not ‘fully working’ (‘fully working’ means either a lone parent working full time or a couple where one works full time and one at least part time). In view of the very different poverty risks associated with being fully as opposed to partly working, the logical conclusion of this is that what needs to be done is to convert as many ‘partly working’ families into ‘fully working’ ones as possible. And indeed, one aspect of this, namely moving second adults into paid work, is in its own words a ‘key priority’ for government (HM Treasury, et al., �008, p. 6�).31
This conclusion, however, rests on the assumption that to be ‘not poor in work’ is necessarily preferable to being ‘poor in work’. Of course, while anyone would no doubt prefer more money to less, all other things being equal, all other things are certainly not equal when it comes to choosing between being fully or partly working. Whether by choice, necessity or both, many families are only ‘partly working’ so as to better allow them to fulfil their parental duties and indeed to enjoy the company of their children too.3� For some, ‘more time’ may be preferable to ‘more money’, especially if the job on offer promises
�1What can be done?
only dull and boring work and if most of the extra incomes ends up going on childcare.33
Now if ‘partly working’ was a state largely confined to families in poverty, then it could be argued that, in seeking to increase the amount of paid work performed, the government was merely trying to get them to conform to a social norm. But, as Table � also shows, it is not just poor children who belong to ‘partly working’ families. Instead, half of all children in working belong to this group. To expect poor families to move towards becoming ‘fully working’ cannot therefore be justified on the basis of conformity to the norm. Instead, it is demanding of them something that many other parents choose not to do.34
The conclusion we draw is that if government really believes that poor families need to become ‘fully working’ in order to overcome child poverty, then they should not just seek to make that change for poor families but should instead seek to make it for all. There are two reasons for saying this. The first is moral, to avoid the double standard we have just been talking about. But the second is practical: high-quality childcare is the key to increasing the amount of paid work performed by adults with children but it is no use offering such provision if it is not taken up. The key to take-up, given quality, is to make it free.
A companion report by Jane Waldfogel and Alison Garnham is instructive here. They report that parents perceive there to be a shortage of ‘good quality, affordable, and reliable childcare’ even while statistics show significant vacancies among providers. Similarly, they also report that as providers struggle to achieve financial viability, so a third of parents think that cost is a barrier (Waldfogel and Garnham, �008, p. 3). By contrast, the take-up of free, good quality educational provision for three and four-year-olds is almost universal (Waldfogel and Garnham, �008, p. 10).
Waldfogel and Garnham conclude that one of things that government should do is to expand that provision by increasing the number of hours a week that it is available for, and extending it also to two-year-olds. We go further: if the government wants to overcome the problem of partly working families, why not announce the intention to develop a system of free universal childcare? By design, this would be for the benefit of all, but those who would be benefit
most, those whose situation would be transformed by it, would be low-income, working – and indeed non-working – families.
It certainly cannot be taken for granted that, as a country (or countries), we want to move in this direction. Neither can it be taken for granted that there will be anything like agreement over the nature of that provision (for example, education versus play). A proper public debate is needed and what its outcome would be is unknown. But at least such a debate would be an honest one, about all families across society as whole, not just about a disadvantaged minority. This approach is also one which Scotland, Wales or Northern Ireland could consider following even if England did not.
While critics will point to the cost of such a proposal, they should also acknowledge the costs of the alternative. Poorly funded, paid-for childcare is not only bound to be of poorer quality on average but is also likely to contribute to in-work poverty among those employed there.35 We would also point out that the government has a target of an 80% employment level. Since that percentage has not moved outside the range 74%–75% since the start of the decade, something decisive needs to be done if it is to be reached. The creation of a high-quality childcare sector for all, funded by the state, would be one way of moving towards it.
Allowing families to improve themselvesLast but not least, the idea of progression challenges the sharp distinction that is drawn among working families according to whether their income is a little above, or a little below, the conventional income poverty line. If the sharp distinction between ‘work’ and ‘workless’ is wrong because the boundary between them is porous, this one is wrong because the boundary is ragged. We would argue that for the purpose of monitoring, this does not matter as long as other, nearby thresholds are monitored too (as indeed they are by government).36 For policy purposes, on the other hand, it may matter a great deal. To see why, we now need to pay attention to the costs of the tax credit system.
In the first instance, the tax credit system is a good way of providing targeted financial support both to children in low-income families generally and to children in low-income, working families
�� What can be done?
in particular (once their weekly hours of work exceed 16 and then again 30). All else being equal, families would no doubt be pleased to receive this support. Once again, however, all else is not equal. One problem is the cost to the individual family of involvement with the tax credit system.37 But although such problems are very real, there is always hope that over time, the system may evolve so as to reduce to an acceptable level.
Another problem is deeper, flowing from the very nature of tax credits as a means-tested benefit. Having lifted a family’s income to a particular level, the combined tax, tax credit and benefit systems then conspire to make it difficult for that family to increase their income a little further, whether by working a little longer or by securing a slightly higher rate of pay. This is because of the amount that income tax, national insurance and the ‘taper’ on tax credits deduct from any extra gross earnings. To be precise, any working family receiving tax credits (in excess of the near-universal ‘family element’) stands to lose approximately 70 pence of every extra pound of earnings, or 95 pence if the family is also in receipt of Housing Benefit and Council Tax Benefit.38 In effect, they face marginal ‘tax’ rates of 70% and 95%.
If the poverty line were a real boundary, life just below it being markedly worse than life just above, then an arrangement that lifted working families over that boundary might very well be thought worth the cost of leaving them hard-pressed to progress much further. But that is definitely not the case here: the poverty line – indeed any particular level of income – is an arbitrary line drawn in the sand. It is not a real boundary. Life just to one side of it is not qualitatively different from life just to the other. In these circumstances, lifting a family to some particular level of income may risk marooning them in a place they would still rather not be.
These high ‘marginal effective tax rates’ are not just a problem because of what they do to income. They are also a considerable drag on any initiative aimed at allowing people to work their way out of poverty. For example, they are a major disincentive to raising productivity through skills acquisition or other forms of investment since a worker is bound to be less inclined to go the trouble of acquiring an extra skill if 70% of the higher pay that might result disappears into Treasury coffers. Similarly, this
disincentive impacts adversely on the employer who wants to share the benefits of a productivity-raising investment with their employees.
These high rates are also a disincentive to the second adult entering work. In response, the government would presumably point to the mooted in-work credit for second earners and partners of those who are unemployed.39 This, however, like any tax credit, answers a different problem. So yes, it is indeed a way of increasing the financial gain from entering work; but no, it does nothing – indeed can do nothing – to improve the family’s capacity to increase its income further. The problem of high marginal effective tax rates cannot be addressed by the mere addition of a new tax credit.
Once we accept that the key to the solution of in-work poverty is to improve families’ capacity to increase their income and not just to lift it to some arbitrary level, we have to conclude that the marginal effective rate of tax that low-income working families face must be cut. It is absurd that low-income working families face rates of at least 70% when top rate earners face just 41%. ‘Cut’ here, therefore, does not mean just 1% or �%; it must mean something like �0% or more, to bring it much closer to what others pay.
There are basically two ways to cut these rates.40 One is by reducing the tax credit taper. The other is by cutting the tax rate proper (to be understood here to include national insurance contributions). Both have a role to play. Taking the tax credits first, reducing the taper is far from prohibitively expensive. For example, IFS researchers have estimated that reducing the taper by five percentage points, from the current 39% down to 34%, would cost £1.4 billion, around 10% of the amount currently going on tax credits (Brewer, et al., �008, p. 5�).41 It should also be borne in mind that this is the gross cost, which will be higher than the net cost because one of the effects of the cut can be expected to be a boost to employment earnings and therefore tax revenues.
At this point, we can anticipate an objection: putting money into reducing the taper rather than adding to the maximum amount of tax credit support goes against the principle of giving ‘help to those who need it most’. Before the revised tax credit system introduced in �003, and certainly before the original one introduced in 1999, the
�3What can be done?
argument that support should be focused on those who had the least carried great weight. But thanks to the increases that have been made, the combined value of Child Benefit and Child Tax Credit (about £70 for the first child and above £50 for the second and subsequent) is now equal to or greater than the amount that the poverty statistics imply is necessary to keep a child out of poverty.4� In the absence of any other yardstick, this shows that the raising the maximum value of benefits and tax credits for children is no longer automatically the priority.43
Turning to income tax proper, there are basically three ways of doing things: reduce the standard rate, re-introduce the starting rate or increase personal allowances. In practice, and although it goes completely against its recent withdrawal, it is a combination of the latter two that is needed. The reason for saying that is that the earnings range most relevant to in-work poverty is up to something around £�0,000, only half the level up to which standard rate tax now applies.44
The trade-off between a lower starting rate of tax and higher personal allowances is more complex. Conventional economic wisdom always seems to favour increasing personal allowances on the grounds that those at the bottom gain more under that option than under the other. But once the marginal rate of tax is deemed to be important too, it is no longer the case that the increased personal allowance option is obviously the right choice: a smaller tax cut in exchange for a lower marginal tax rate may be preferable.45 A small starting rate band, as existed until recently, is little help. But a large band, eventually covering half the current standard rate band, would be a different proposition. Increases in the personal allowance, in effect, a �0% cut in the marginal ‘tax’ rate for those thereby taken out of tax altogether, is likely to have a part to play in reducing the extraordinarily high rates faced by people facing marginal rates of above 70%.
Similar issues apply to the two main social security benefits that low-income working families are able to receive, namely Housing Benefit and Council Tax Benefit. The so-called income ‘disregards’ and tapers on these play an analogous role to the personal allowance and marginal rates within income tax. The fact that half the children in
poverty belong to households that get no Council Tax Benefit should be grounds enough alone for raising the income disregard.46 But raising the disregard alone without reducing the taper delivers a lump improvement but does nothing to reduce the maximum size of the overall marginal ‘tax’ rate.
We do not underestimate either the complexity of the tax, tax credit and benefit systems or the difficult state of the public finances. Although we can identify individual elements of these systems that need changing, fitting them together is a different task altogether. Our final conclusion, therefore, is that government should now undertake a thorough and comprehensive review of these systems in order both to reduce the amount of tax paid by low-income, working families and to bring about a substantial reduction in the effective marginal rate of tax they face. The motivation from a poverty perspective for doing this is not just by ‘cutting taxes at the bottom’ to lift more children in working families out of poverty. Rather, it is also to make it much easier for low-income working-age families, with and without children, to increase their incomes, above what they get now in net pay and tax credits, through their own efforts.
Once more, people will ask: how much will it cost? In their analysis of this question, IFS developed a package whose cost is estimated at £9 billion a year (Brewer, et al., �008, p. 3). Whether any complete reform from government would include all of this is of course unknown. Is £9 billion a lot? Well, it is only about two-thirds of 1% of national income. And it is also exactly what the reduction in the basic rate of income tax to �0 pence cost. So it is a large sum, but it is not unthinkable.
In truth, however, to ask how much this will cost is the wrong question. It is wrong in the narrow sense that cuts in the marginal rate of ‘tax’ can be expected to lead to an increase in economic activity and therefore government revenues. But it is also wrong in the much broader sense that what we are talking about here is a new guiding principle for the anti-poverty strategy at least as far as in-work poverty is concerned. On its own, it will not be enough. All the usual panoply of factors – higher pay, higher skills, more and better childcare etc – will have come into play too. What we are arguing is that this change is needed to give those changes

�4 What can be done?
a much better chance of working. And of allowing people themselves as much freedom as possible to reach a level of income that they regard as adequate, not one that the government determines is sufficient.
�5Notes
Notes1 In the interests of sparing an already convoluted
concept from further qualification (‘in-paid-work poverty’), it is to be understood throughout this report that ‘work’ means ‘paid work’ only; unpaid labour, usually performed at home, is therefore excluded.
� In working out where households come in the overall income distribution, incomes are ‘equivalised’ using standard factors (based on OECD scales) in order to reflect differing household compositions. So, for example, all of the following are at the same point on the income distribution as a two-adult household with an income of £100: a single adult with £58; a lone parent and one child under 14 with £78; or two adults and two children, one under 14 and one 14 and over and still at school with £168.
3 In turn, in-work poverty’s appearance in Kenway, et al. (�00�) reflected prompting by dissident Scottish economists who had seemed strangely unimpressed with what passed for orthodoxy in London.
4 Throughout this report we use the shorthand of ‘lone parent’ and ‘couple’ to differentiate between children living with one parent and those living with two.
5 On the equal status of in-work poverty, see, for example, the statement on page 7 of HM Treasury, et al. (�008): ‘Families are poor because they are workless or in low-paid work, but the causes of low-paid work and worklessness are multiple, complex and overlapping’.
6 Although statistics have now been published for �006/07, the three most recent years for which the dataset has been published are the three up to �005/06 only. All our detailed analyses are for these three years. But where the published statistics for �006/07 are in a suitable form, we refer to them when appropriate.
7 Reflecting the fact (as per Table 1) that 86% of children in working families belong to couple families and just 14% to lone parent ones. Overall, 75% of all children belong to couple families and �5% to lone parent ones.
8 Since data for Northern Ireland does not exist in the period from 1994/95–�00�/03, this long series is for Great Britain rather than the UK. Since the Northern Ireland figures only add about 50,000 to both in-work and workless child poverty, this makes little or no difference to totals rounded to the nearest 100,000.
9 The figure for �006/07 is �.1 million (source: IFS).
10 It should be noted that some of the individual figures in the years preceding 1994/95 are very much more uncertain than the later ones. In particular, the 199� spike in workless poverty is almost certainly a blip.
11 The figure for �006/07 is �.1 million (source: IFS).
1� The inherent statistical uncertainty in these numbers is such that any difference of less than 100,000 is simply not worth bothering about. In these ‘what if’ exercises, therefore, we will only use suitably round numbers – hence the �5%.
13 If the marginal rate were higher than the average rate, one would expect to see the average rise year by year as the population of children in working families grew. With the additional 500,000 children in working lone-parent families over the period representing an increase of a third, the evidence of this effect should be visible if it exists; nothing of the sort, however, is to be seen.
14 Neither does this mean that this type of argument has nothing to contribute. For besides families shifting from worklessness to work, families also enter, leave and change their position within this group as babies are born and as 16 or 18-year-olds cease to be counted as children. The net growth in the group of children in working families (which is what we have been considering here) is a
�6 Notes
good deal smaller than the natural turnover within it caused by the arrival and departure of more than half a million children each year. The possibility that the families of entrants to the group have higher in-work poverty risks than the families of leavers certainly cannot be ruled out, particularly as it applies to children in couple families where the poverty rate has recently been rising. The suggestion in the Introduction therefore lacks foundation; but it has not been disproven.
15 (Source: IFS, private communication.) The IFS forecast of a 4% rise is on the before housing costs (BHC) basis. We have assumed that that will also apply to AHC numbers shown here.
16 IFS forecasts apply to BHC. This method takes the proportional fall in BHC poverty (�3%) and applies it to the AHC total, along with the rising in-work share, up from 50% to 54%.
17 Note, however, that there is no sign that tax credits have done this. Although the �5% of all children now in lone-parent families is way above the 10% at the end of the 1970s, there has been no significant change in the proportion since the late 1990s, that is, over the period during which the tax credit system has been in force.
18 In the period to 1998/99 when the first version of tax credits (Working Families Tax Credit) was introduced, the numbers refer to those receiving the predecessor social security benefit, Family Credit.
19 Note that another group of tax credit beneficiaries, namely those in working families who would not be in poverty even if they did not receive them, are not show.
�0 Seven hundred and fifty thousand is the difference between the ‘need’ for tax credits between the periods 1995/96 to 1997/98 and �003/04 to �005/06.
�1 The white/non-white ethnic grouping used here treats places White British and White Other in
the former category and all 14 other groups, including various mixed ethnic groups, in the Non-White.
�� Of the children in (AHC) poverty, half are in families with a mortgage, a quarter are in social rented accommodation and a tenth are in families who own their homes outright.
�3 Since the government prefers the BHC measure, it is looking at different figures from the ones presented here. It is true that on the BHC basis, the position is not quite so bleak, in-work child poverty having stayed flat in �004/05, meaning that there have only been two years so far when it has been rising rather than three. Nevertheless, the rise in �005/06 took it back to its average for the three years 1995/96 to 1997/98. Although it did not stress the point, the IPPR described the �005/06 figure of 1.4 million as ‘the same number as in 1997’ (Cooke and Lawton, �008, p. 6).
�4 Interestingly, the Secretary of State, Mr Purnell, chose to repeat this very point in his department’s press release announcing the publication of the �006/07 poverty statistics (DWP, �008).
�5 This may be partly to do with the fact that the National Minimum Wage was set at a low level to begin with.
�6 (Source: Labour Force Survey at www.poverty.org.uk/52/index.shtml?�) Among workers of all ages, �3% were employed by the public sector in �007. Among those aged �5 to retirement, the proportion is markedly higher (just under 30%), reflecting the high concentrations of low-paid young adults in the retail, wholesale, hotel and restaurant sectors.
�7 One factor that hampers trade unions playing such a role is the very low level of trade union membership among low-paid workers, just 15% of those earning less than £7 an hour (in �007) belonging to a union compared with 45% for those earning between £15 and £�0 an hour
�7Notes
(source: Labour Force Survey at www.poverty.org.uk/57/index.shtml?�)
�8 It is an interesting question where the fourth state, ‘not poor and not in work’, might fit. While many would think it the most desirable, a government that was too attached to the Protestant work ethic might not.
�9 (Source: NPI analysis of the data from the Juvos cohort at www.poverty.org.uk/57/index.shtml?�) Despite the fall in unemployment, those proportions are unchanged from a decade ago.
30 What this means more specifically is that the system should recognise and treat differently those who have previously been in work, something which is the essence of an insurance-based approach. Since Beveridgean elements continue to survive in our modern, means-tested dominated system, this is less to advocate a new idea than to propose the revival of an old one, albeit in modern form. The question of principle here concerns what paths should confer entitlement. Having been in paid work is certainly one. But presumably various forms of unpaid work (notably those with caring responsibilities) should count too.
31 In line with the importance now being attached to the ‘partly working’ status, HM Treasury, et al. (�008) flag up the need for further research in order to improve our understanding of households containing part-time workers (p. 6�) and self-employed households (p. 63).
3� For example, the flexibility to cope with unforeseen if not unexpected events like sickness. Note also the cri de Coeur from one lone parent: “I wanted to be with my kids; is that a crime?”, reported in Davies (�008).
33 Another companion report by Simmonds and Bivand (�008) contains some interesting evidence on working parents’ aspirations regarding their hours of work. Among those doing part-time jobs, around three times as many want to lengthen their hours as want to
shorten them. By contrast, among those doing full-time jobs, two-and-a-half times as many want to shorten their hours as want to lengthen them.
34 By contrast, with some five sixths of children in working families, it can much more reasonably be argued that ‘working’ is a norm, even if ‘all working’ is not.
35 It should be stressed that these remarks refer to paid-for childcare (whether financed with the help of tax credits or not) and not voluntary childcare, for example, provided by another family member.
36 HBAI presents figures for thresholds at 50% and 70% of median income as well as 60%.
37 A report by Citizens Advice, which noted that tax credits were a major and growing area of work for their bureaux, pointed to the complexity of the system as well as overpayment and the regimes used to recover it as sources of confusion and hardship (Citizens Advice, �007).
38 Twenty pence income tax, 11 pence national insurance contribution and 39 pence tax credit ‘taper’. The Housing Benefit taper takes a further 65 pence and the Council Tax Benefit taper a further �0 pence of what is left over after income tax, national insurance and tax credits.
39 See the reference to the proposed piloting of such a scheme in HM Treasury, et al. (�008, p. 60).
40 In their measured way, researchers from the IFS describe the marginal rate ‘that many low to moderate earners face when having tax credits withdrawn’ as being ‘likely to be above the optimum’ (Brewer, et al., �008, p. �).
41 This estimate takes no account of any behavioural response.
4� This is based on the factor of 0.� per child used in the official poverty statistics to equivalise
�8 Notes
the incomes of different-sized households. In �006/07 prices �0% of the poverty line equals £39 AHC or £45 BHC. Allowing 10% for inflation over two years, these equate to £43 and £50 respectively in current prices.
43 The amounts for working-age adults, which are way below what this yardstick would imply, is a different matter. But that, being to do with welfare reform, is beyond the scope of this report.
44 Although note that its introduction, in 1999, was mentioned in Opportunity for All among the measures that would help make work pay (DSS, 1999, p. 11).
45 To give an example, anybody with a taxable income of at least £�,000 is indifferent between a £1,000 increase in the personal allowance and the re-introduction of a 10 pence starting rate of tax on the first £�,000 of taxable income. In both cases, they save £�00 and their marginal rate of income tax remains at �0%. By contrast, all those with taxable incomes below £�,000 gain less with the 10 pence starting rate than with the increased personal allowance but some face lower marginal tax rates under one scheme and others face a lower rate under the other. (With the increased personal allowance, those with taxable under £1,000 have a marginal rate of 0% while those with a taxable above that have a marginal rate of �0%. With the starting rate, they all face 10%.)
46 (Source: NPI analysis of HBAI, �005-06, at www.poverty.org.uk/42/index.shtml?�)
�9References
ReferencesBrewer, M., Saez, E. and Shephard, A. (�008)
Means-testing and Tax Rates on Earnings, Paper prepared for the Mirrless Review ‘Reforming the Tax System for the �1st Century’. London: Institute for Fiscal Studies (www.ifs.org.uk/mirrleesreview/press_docs/rates.pdf)
Citizens Advice (�007) Tax Credits: The current picture (www.citizensadvice.org.uk/pdf_tax_credits_english.pdf)
Cooke, G. and Lawton, K. (�008) Working Out of Poverty: A study of the low paid and the ‘working poor’. London: Institute for Public Policy Research (www.ippr.org/members/download.asp?f=%�Fecomm%�Ffiles%�Fworking%5Fout%5Fout%Fof%5Fpoverty%5F�3%Fjan%�E.pdf)
Davies, M. (�008) The Effects of Discrimination on Families in the Fight to End Child Poverty. York: Joseph Rowntree Foundation (www.jrf.org.uk)
DSS (Department of Social Security) (1999) Opportunity for All: Tackling poverty and social exclusion, Summary. London: DSS
DWP (Department for Work and Pensions) (�000) Opportunity for All. London: DWP
DWP (�007) In Work, Better Off: Next steps to full employment (www.dwp.gov.uk/welfarereform/in-work-better-off/in-work-better-off.pdf)
DWP (�007) Working for Children (www.dwp.gov.uk/publications/dwp/�007/childpoverty/childpoverty.pdf)
DWP (�008) Government Response to Households Below Average Income Figures (www.dwp.gov.uk/mediacentre/pressreleases/�008/jun/drc083-100608.asp)
Harker, L. (�006) Delivering on Child Poverty: What would it take?, Report for the Department for Work and Pensions (www.dwp.gov.uk/publications/dwp/�006/harker/harker-full.pdf)
Hirsch, D. (�006) What Will It Take to End Child Poverty? Firing on all cylinders. York: Joseph Rowntree Foundation
HM Treasury, DWP (Department for Work and Pensions) and DCSF (Department for Children, Schools and Families (�008) Ending Child Poverty: Everybody’s business (www.hm-treasury.gov.uk/media/3/F/bud08_childpoverty_1310.pdf)
House of Commons Treasury Committee (�007) The 2007 Budget (www.publications.parliament.uk/pa/cm�00607/cmselect/cmtreasy/389/389i.pdf)
House of Commons Work and Pensions Committee (�004) Child Poverty in the UK (www.publications.parliament.uk/pa/cm�00304/cmselect/cmworpen/85/85.pdf)
Howarth, C., Kenway, P., Palmer, G. and Street, C. (1998) Monitoring Poverty and Social Exclusion: Labour’s inheritance. York: Joseph Rowntree Foundation
Kenway, P., Fuller, S., Rahman, M., Street, C. and Palmer, G. (�00�) Monitoring Poverty and Social Exclusion in Scotland. York: Joseph Rowntree Foundation
Palmer, G., MacInnes, T. and Kenway, P. (�006) Monitoring Poverty and Social Exclusion, York: Joseph Rowntree Foundation
Simmonds, D. and Bivand, P. (�008) Can Work Eradicate Child Poverty? York: Joseph Rowntree Foundation (www.jrf.org.uk)
© Joseph Rowntree Foundation �008
First published �008 by the Joseph Rowntree Foundation
All rights reserved. Reproduction of this report by photocopying or electronic means for non-commercial purposes is permitted. Otherwise, no part of this report may be reproduced, adapted, stored in a retrieval system or transmitted by any means, electronic, mechanical, photocopying, or otherwise without the prior written permission of the Joseph Rowntree Foundation.
ISBN 97818593567�� (pdf)
The Joseph Rowntree Foundation has supported this project as part of its programme of research and innovative development projects, which it hopes will be of value to policy makers, practitioners and service users. The facts presented and views expressed in this report are, however, those of the authors and not necessarily those of the Foundation.
Joseph Rowntree Foundation The Homestead 40 Water End York YO30 6WP www.jrf.org.uk
Further copies of this report, or any other JRF publication, can be obtained from the JRF website (www.jrf.org.uk/bookshop).
A CIP catalogue record for this report is available from the British Library.
30

About the authorPeter Kenway is Director and co-founder of the New Policy Institute, an independent think tank focusing on social justice. Along with colleagues at the NPI, he has authored the Foundation’s annual Monitoring Poverty and Social Exclusion report since 1998.
31About the author