er references to be docketed attachment 5 · 2015-10-08 · by viral (e.g., lymphocystis sp.) or...
TRANSCRIPT

ER REFERENCES TO BE DOCKETED
ATTACHMENT 5
LASALLE COUNTY STATION
2013 FISH AND BENTHOS MONITORINGAND
HISTORICAL FISH AND BENTHOSCOMPARISONS
Prepared for:
Exelon Generation Company, LLC200 Exelon Way
Kennett Square, Pennsylvania
Prepared by:
BA Engineering, Science, and Technology, Inc.444 Lake Cook Road, Suite 18
Deerfield, Illinois 60015
May 2014

LASALLE COUNTY STATION
2013 FISH AND BENTHOS MONITORINGAND
HISTORICAL FISH AND BENTHOSCOMPARISONS
Prepared for:
Exelon Generation Company, LLC200 Exelon Way
Kennett Square, Pennsylvania
Prepared by:
EA Engineering, Science, and Technology, Inc.444 Lake Cook Road, Suite 18
Deerfield, Illinois 60015
Marty Sneen DateProject Manager
~hC~.AJ C ~aII~yu~o 5/28/2014DateDr. Richard Monzingo
Project Director
May 2014 104015004.03

TABLE OF CONTENTS
1. INTRODUCTION................................................. •............................... 1
2. METHODS ......................... ............................................................... 2
2.1 FISH ............. .......................................................................... 2
2.1.1 Field and Laboratory .............................................................. 22.1.2 Data Handling and Analysis .................................................... 3
2.2 Benthos.... ................................................................................ 4
2.2.1 Field and Laboratory............................................................. 42.2.2 Data Handling and Analysis..................................................... 5
2.3 PHYSICOCHEMICAL MEASUREMENTS .......... ............................... 6
3. RESULTS.......................................................................................... 7
3.1 FISH................................................................................. i...... 7
3.1.1 Electrofishing ........... .................................................... "..... 73.1.2 Seining ................................. ............................................ 83.1.3 DELT Anomalies ................................................................... 93.1.4 Relative Weight .................................................................. 9
3.2 BENTHOS ................................................................................ 9
3.2.1 Hester-Dendy ....................... ............................................. 103.2.2 Ponar and Kick Net Samples ............ ......................................... 10
4. DISCUSSION ................. .................................................................. 12
4.1 FISH ..................................................................................... 12
4.1.1 Operational Studies............................................................. 124.1.2 Pre-Operational Studies........................................................ 134.1.3 Summary ......................................................................... 15
4.2 BENTHOS............................................................................... 17
4.2.1 Operational Studies ............................................................. 174.2.2 Pre-Operational Studies ................................ ....... 18
i

TABLE OF CONTENTS (CONTINUED)
4.2.3 Sum m ary .....................................................20
5. REFERENCES................................................................................... 22
FIGURES
TABLES
APPENDIX A: LaSalle County Station Fish Data, August 2013
APPENDIX B: LaSalle County Station Benthic Macroinvertebrate Data, August 2013
ii

Number
LIST OF FIGURES
Title
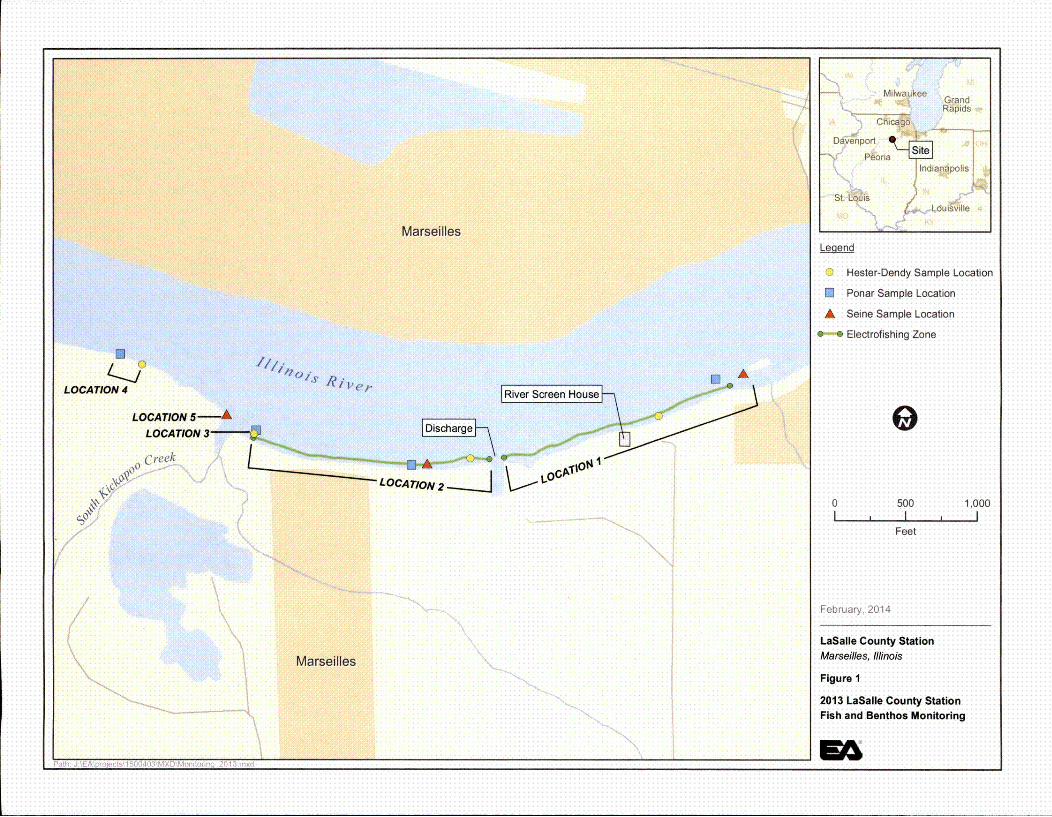
2013 LaSalle County Station Fish and Benthos Monitoring1
iii

LIST OF TABLES
Number Title
1 Intercept (a) and Slope (b) Parameters for Standard Weight (Ws) Equations withMinimum Total Lengths (mm) Recommended for Application
2 List of Common and Scientific Names of Fish Taxa Collected Near LaSalle Station,August 2013
3 Number, Biomass, and Relative Abundance of Fish Collected Near LaSalle Station,August 2013
4 Fish Captured at each Electrofishing and Seining Location near LaSalle Station, August2013
5 Summary of DELT (Deformity, Erosion, Lesion, and Tumor) Anomalies on FishCaptured by Electro fishing and Seining near LaSalle Station, August 2013
6 Mean Relative Weights of Fish Collected near LaSalle Station, August 2013
7 Benthic Macroinvertebrate Taxa Collected from the Illinois River in the Vicinity of
LaSalle County Station, August 2013
8 Density (#/in2) and Relative Weight (%) for Benthic Macroinvertebrate Taxa Collected
in Hester-Dendy Samples near LaS alle Station, August 2013
9 Density (#/m2) and Relative Weight (%) for Benthic Macroinvertebrate Taxa Collected
in Ponar Samples near LaSalle Station, August 2013
10 Density (#/m2) and Relative Abundance (%) for Benthic Macroinvertebrate TaxaCollected in Ponar Samples from the Rock River near Byron Station, August 1999
11 Pre-operational HD Mean Density (#/m2) and Total Taxa Richness for Locations 1 - 4on the Illinois River, 1974 - 1978
12 Pre-operational Ponar and Dip Net Mean Density (#/m2) and Total Taxa Richness forLocations 1 - 4 on the Illinois River and Locations 5 and 6 on South Kickapoo Creek,1974- 1978
iv

1. INTRODUCTION
Fish, benthos, and physicochemical monitoring was conducted during summer 2013 in theIllinois River upstream and downstream of the LaS alle County Station to collect current aquaticbiological information needed to support preparation of the Environmental Report as part of aU.S. Nuclear Regulatory Commission (NRC) license renewal application. The 2013 data werecompared with historical data to determine if changes in the Illiiiois River have occurred thatcould be related to station operation.
LaSalle County Station is located near the Illinois River in LaSalle County about 75 milessouthwest of Chicago and 11 miles southeast of Ottawa, Illinois. Makeup cooling water iswithdrawn from the Illinois River at river mile 249.5, four miles north of LaSalle County Stationand three miles upstream of the Marseilles Dam. LaSalle County Station has two generatingunits and a closed cycle cooling system that uses a perched cooling pond. Blowdown water fromthe cooling pond discharges into the Illinois River 275 meters downstream of the makeup waterintake structure.
The 2013 monitoring program was comprised of two primary elements.
* Fish sampling using electrofishing and seining gear, and collection of associated
physicochemical measurements at locations sampled during previous monitoring efforts.
* Benthos sampling using artificial substrate samplers and a grab sampler at locations thatwere established during pre-operational studies.
The objectives of the 2013 LaSalle program were to:
* Determine the current species composition, relative abundance, and distribution of fishwithin the study area and compare results with available historical data and pre-operational studies.
* Determine current taxa richness, density, and relative abundance of benthos within thestudy area and compare results with available historical data and pre-operational studies.
BA Engineering, Science, and Technology (BA) was contracted by the Exelon GenerationCompany, LLC to perform these tasks.
1

2. METHODS
2.1 FISH
Fish sampling was conducted at three locations in the Illinois River (Locations 1 and 2) and onelocation in the mouth of South Kickapoo Creek (Location 5) downstream of the blowdowndischarge (Figure 1). The river locations represent Sampling areas upstream of the cooling lakeblowdown discharge (Location 1) and downstream of the discharge point (Location 2). Riverand creek locations were the same as those sampled during pre-operational studies. Fishsampling was conducted during August 2013.
2.1.1 Field and Laboratory
Fish were sampled by electrofishing and seining. Electro fishing was conducted using a boat-mounted boom-type electrofishing system utilizing a 230-V, 5,000 W, 3-phase AC generatorequipped with volt/amp meters and a safety cut-off switch. Sampling began no earlier than one-half hour after sunrise and did not extend beyond one-half hour before sunset. Each location wassampled in a downstream direction for 500 meters and time elapsed was recorded. The crewconsisted of a boat driver and one dipper; each equipped with long-handled, 3/16-inch mesh dipnets for retrieval of stunned fish. Shoreline seining was the second collection method used ateach location. A straight seine 25 ft long by 6 ft deep with 3/16-inch ace mesh was used. Twoseine hauls were made at each location in a downstream direction, each covering approximately15 meters of shoreline. Seining and electrofishing were conducted on different days to avoidpotential bias caused by each sampling effort.
All fish collected were identified to the lowest possible taxonomic level and counted. For eachgear type, at each location, up to 25 randomly selected individuals of each species weremeasured for total length (millimeters) and weighed (grams). Any remaining individuals of aspecies were counted and batch weighed. Minnow species (Cyprinidae), excluding carp,goldfish, or carp/goldfish hybrids, were counted and batch weighed only. Specimens that couldnot be positively identified in the field were preserved in 10% formalin and returned to thelaboratory for positive identification. In the laboratory, fish were processed in the same manneras in the field. Fish identifications were conducted utilizing current taxonomic keys orpublications including Becker (1983), Pflieger (1975), Smith (1979), and Trautman (1981).
All fish collected were examined for external anomalies. External anomalies were classified asDELT anomalies (deformities, _erosions, lesions, and _tumors; Ohio EPA 1987, 1989), externalparasites, or "other" abnormalities. The following is a review of DELT anomalies and theircauses in freshwater fishes (Ohio EPA 1989):
1) Deformities - These anomalies can affect the head, spine, fins, and have a variety ofcauses including toxic chemicals, viruses, bacteria (e.g., Mycobacterium sp.), andprotozoan parasites (e.g., Myxosoma cerebalis) (Ohio EPA 1989).
2) Erodedfins - These are the result of chronic disease principally caused by flexibacteriainvading the fins causing a necrosis of the tissue (Post 1983). Necrosis of the finsmay also be caused by gryodactylids, a small trematode parasite (Ohio EPA 1989).
2

For this study, fin erosion was separated into three categories: slight erosion -<1/3of fin eroded; moderate erosion -1/3 -2/3 of fin eroded, and severe erosion ->2/3 offin eroded.
3) Lesions and Ulcers - These appear as open sores or exposed tissue and can be causedby viral (e.g., Lymphocystis sp.) or bacterial (e.g., Flexibacter columnaris,Aeromonas spp., Vibrio sp.) infections (Ohio EPA 1989).
4) Tumors - Tumors result from the loss of carefully regulated cellular proliferativegrowth in tissue and are generally referred to as neoplasia. Tumors in wild fishpopulations can be the result of exposure to toxic chemicals. Baumann et al. (1987)identified polynuclear aromatic hydrocarbons (PAHs) as the cause of hepatictumors in brown bullheads in the Black River (Ohio). Viral infections (e.g.,Lymphocystis) can also cause tumors. Parasites (e.g., Glugea anomala andCeratomyxa shasta; Post 1983) may cause tumor-like masses, but are notconsidered tumors. Parasite masses can be squeezed and broken between the thumband forefinger whereas true tumors are firm and not easily broken (Ohio EPA1989).
Only those anomalies visible to the naked eye were recorded. The exact counts of anomaliespresent (e.g., the number of tumors or lesions per fish) were not recorded. An external anomalyis defined as the presence of externally visible skin or subcutaneous disorders, and is expressedas percent of affected fish among all fish processed (Ohio EPA 1989).
2.1.2 Data Handling and Analysis
Field and laboratory data were entered on forms compatible for computer entry followingserialization, diga-coding, and QA/QC checks. Data were managed in a SAS format (Release8.2) to provide flexibility in reporting study results. Data developed from electrofishing andseining were reported as number and percent abundance for each species and kept separate bylocation, gear type, and sampling period. Electrofishing data were also reported as catch-per-effort (CPE, number/hr) by location and sampling period. Relative weight (Wr) was calculatedfor all applicable species. All observed occurrences of DELT anomalies were summarized intabular form and reported as percent occurrence by species for each sampling period.
Fish condition was evaluated using the relative weight (Wr) index (Wege and Anderson 1978). Thisindex represents a refinement of the relative condition factor concept and allows forinterpopulational comparisons by making the standard weight-length regression species-specificrather than population-specific. Relative weight was calculated as:
Wr = W/Ws x 100
Where W is the measured weight, Ws is the standard weight and Wr is the length-specific standardweight predicted by a weight-length regression constructed to represent the species as a whole.Length-specific standard weight functions are in the form:
log 10 Ws = a + (b x lOgl0 total length)
where a (intercept) and b (slope) account for genetically determined shape characteristics of a
3

species and yield Wr values of 100 at particular times of the year for fish that have been well fed(Anderson and Gutreuter 1983).
Intercept, slope, and minimum length values for the Ws equation have been published for 36 speci~esand one hybrid (Bister et al. 2000; Anderson and Neumann 1996; Murphy et al. 1991) (Table 1).Minimum lengths are established because the accuracy in weighing fish decreases markedly forsmaller individuals and minimum lengths represent the length at which the variance to mean ratio forlog10 sharply increases (Murphy et al. 1991).
Appendix A provides the LaSalle County Station fish data.
2.2 BENTHOS
Benthos sampling was conducted at the four locations in the Illinois River (Locations 1, 2, 3, and4) that were established during preoperational studies (Figure 1). Sampling was conductedupstream of the intake (Location 1), immediately downstream of the blowdown discharge(Location 2), downstream of the blowdown discharge and upstream of South Kickapoo Creek(Location 3), and downstream of South Kickapoo Creek (Location 4). Each location wassampled using Hester-Dendy (HD) artificial substrate samplers and a Ponar grab sampler.Artificial substrates were set in June and retrieved in the August. Ponar samples were collectedin August when the artificial substrates were recovered.
2.2.1 Field and Laboratory
Each modified HD artificial substrate sampler consisted of eight 3x3-inch plates constructedfrom 1/8, inch tempered hardboard and twelve 1/8 plastic spacers. The plates and spacers werearranged on a 1/4 inch eyebolt so that each sampler had three 1/8 inch spaces, three 1/4 inchspaces, and one 3/8 inch space among the plates. The total surface area of a single sampler,excluding the eyebolt, was 0.093 m2 (1.01 2ft2). A single HD sample consisted of a five HDsampler array, arranged on a single cinder block, and deployed on the stream bottom. DuplicateHD sets were deployed at each location to minimize the potential loss of samplers (e.g., fromvandalism). The HD samplers were set on 19 June 2013 and retrieved approximately eightweeks later on 12 August 2013. Retrieval of the HiDs was accomplished by enclosing thesamplers in a fine-mesh container and then carefully lifting the sampler array and container tothe surface. The HDs were placed into a single labeled container, and preserved with 10%formalin.
The Ponar samples were collected in conjunction with the HD sample retrieval. Ponar samplesfrom each location consisted of four composite grab samples at each location using a full-sized523 cm2 (81 in 2) Ponar dredge sampler. Each sample was sieved in the field using an U.S.Standard No. 35 (500 pm) mesh sieve and preserved. The material obtained in each sample wasexamined to qualitatively determine substrate characteristics and percent composition.
Upon arrival at the laboratory, the samples were logged in and accounted for. Based onmeasured current velocity, the amount of silt/debris caught on the samplers and the numbers andtypes of organisms observed during retrieval, one of the duplicate HD arrays from each locationwas initially processed. The second HD array was kept as a backup. The five HDs from each
4

array were disassembled in a water filled enamel pan and cleaned of organisms and debris. Thismixture was then passed through a No. 60 (250 jtm mesh) U.S. Standard Testing Sieve andpreserved in labeled containers containing 10% formalin.
Sorting of each HD and Ponar grab sample was conducted in gridded petri dishes under adissecting stereo-scope at 10OX magnification. The samples were initially pre-picked to removeany large or rare taxa (less than 20 individuals/sample) prior to subsampling. When necessary, aMotoda sample splitter was used to subsample until a manageable number of organisms wasachieved. A minimum of 250 organisms was removed from the fractionated samples.Organisms from all sample types were sorted to higher taxonomic levels (generally Class orOrder level) and preserved separately in labeled vials containing 70% ethyl alcohol. Sortedsamples were routinely checked by experienced EA personnel to assure a consistent level ofquality and sorting efficiency.
Macroinvertebrate identifications were made to the 'lowest practical taxonomic level using themost current literature available. Chironomidae (midge) larvae were cleared in 10% potassiumhydroxide and mounted in CMC-10 on glass slides prior to identification. For all sample types,specimens were enumerated, coded, and recorded on a standard laboratory bench sheet for dataprocessing.
2.2.2 Data Handling and Analysis
The following data were used for spatial and temporal comparisons:
* 1) Density (no./m2) - Density is the total number of individuals collected within a squaremeter. Extremely high or low density relative to other locations may be indicative ofenvironmental stress.
2) Relative Abundance (%) - Relative abundance is the percent each taxon composes withina sample. Dominance by one taxon or relatively few taxa may suggest greaterenvironmental stress.
3) Dominant Taxa - Based on relative abundance, similarities in the top five dominant taxaamong stations suggests balance within the benthic community. Numerical dominanceby one or a few taxa may suggest impairment.
4) Total Taxa Richness - Total number Of different types of macroinvertebrates. Generally,the higher the taxa richness, the better the quality of the benthic community.
5) EPT Taxa Richness - Collectively, Ephemeroptera, Plecoptera, and Trichoptera arereferred to as EPT. EPT richness is the number of taxa identified from these groups.Since EPT taxa are generally considered to be intolerant of environmental stress, a
* relatively higher number of EPT taxa typically represent a quality benthic community.
6) Tolerance Values - DeveloPed by the Illinois Environmental Protection Agency (IEPA1 987; Tetra Tech 2007) tolerance values are used to generally characterize theenvironmental sensitivity of the benthic community. The tolerance values were derived
5

for individual macroinvertebrate taxa and reflect an increasing level of pollutiontolerance from 0 (least tolerant) to 11 (most tolerant). A benthos community dominatedby taxa with lower tolerance values is typically indicative of a healthy benthiccommunity while a higher tolerance values suggest some degree of impairment.
Appendix B provides the LaS alle County Station macroinvertebrate data.
2.3 PHYSICOCHEMICAL MEASUREMENTS
Water temperature, dissolved oxygen concentration, percent oxygen saturation, specificconductance, and water transparency using a Secchi disk were measured at each electrofishinglocation. All measurements, except Secchi depth, were made at mid-depth in the water column.Instruments Used to measure temperature were checked against a calibrated thermometer.Instruments used to measure DO were calibrated before each measurement. In addition,immediately before each sampling day, they were checked against the Winkler method asspecified in Standard Methods for the Examination of Water and Wastewater (current edition).The conductivity meter was also checked against a standard before each electro fishing samplingday. Percent oxygen saturation was determined from the relationship between dissolved oxygenin the water and water temperature.
6

3. RESULTS
3.1 FISH
In total, 23 species among seven families were collected by electro fishing and seining from thestudy area in 2013 (Table 2). Diversity was highest among the carp/minnow, sunfish, and suckerfamilies, which were represented by 12, four, and three species, respectively.
The three locations sampled in August 2013 yielded a total of 1,295 fish weighing 21.2 kg (Table3). Emerald Shiner (78 percent), Spotfin 'Shiner (10 percent), Gizzard Shad (4 percent), BullheadMinnow (2 percent), and Sand Shiner (2 percent) were the five most abundant species collected,comprising nearly 94 percent of the total catch. Gizzard Shad (21 percent), Smallmouth Buffalo(20 percent), Freshwater Drum (18 percent), Common Carp (10 percent), Emerald Shiner (9percent), Channel Catfish (7.5 percent), and Golden Redhorse (6 percent) dominated the catch interms of biomass (Table 3). No endangered or threatened species were collected during thisstudy (Illinois Endangered Species Protection Board 2011).
3.1.1 Electrofishing
Electro fishing yielded 79 of the 1,295 total fish (61 percent) collected during the 2013 survey(Table 3). Fourteen species were collected, dominated by Gizzard Shad (48 percent), SpotfinShiner (16.5 percent), Smalimouth Buffalo (6 percent), Golden Redhorse (5 percent),Smallmouth Bass (4 percent), and Freshwater Drum (4 percent). All remaining species wererepresented by only one or two individuals.
Overall, catch rates (CPEs) were generally similar at the two electro fishing locations sampled in2013 where 74 fish/hour were collected at Location 1 upstream of the LaSalle County Stationdischarge compared to 86 fish/hour collected at Location 2 downstream (Table 4). Gizzard Shadand Spotfin Shiner dominated the catch at both locations. However, Gizzard Shad wereconsiderably more abundant downstream of the plant's discharge (28 fish) compared to upstreamof it (10 fish),' whereas Spotfin Shiner were more abundant upstream (9 fish) compared todownstream (4 fish). All remaining species were collected in low numbers and were fairlyevenly distributed between the two zones sampled (Table 4). However, species richness wasmoderately higher upstream of the plant's discharge (13) compared to downstream of it (9),driven in large part by the reduced number of sunfish species collected downstream (1)compared to upstream (4). The increased number and diversity of sunfish collected upstream ofthe LaSalle County Station's discharge may be attributable to better habitat quality, particularlyregarding instream cover. Eight species, Gizzard Shad, Emerald Shiner, Spotfin Shiner,Smallmouth Buffalo, Golden Redhorse, Channel Catfish, Largemouth Bass, and FreshwaterDrum were collected at both sampling locations (Table 4).
Sport fish species collected during the 2013 electrofishing survey included Channel Catfish,Green Sunfish, Bluegill, Smallmouth Bass, Largemouth Bass, and Freshwater Drum.
*Collectively, these species comprised 16.5 percent of the total catch by number with individualspecies contributions ranging from 1 to 4 percent of the total catch (Table 4). Most of the
7
aforementioned sport fish species were represented by only one to two individuals, consistingprimarily of Age I or II fish, with the exception of Channel Catfish. Two Channel Catfishmeasuring 365 and 500mm, likely representing Age III and Age V fish respectively, were collected(Appendix A). No young-of-year (YOY) sport fish were collected in 2013.
Water quality measurements collected at each location during the 2013 electro fishing survey aresummarized below:
(C) (rag/L) (% Saturation) (ptS/cm) (cm)Location Temperature Dissolved Oxygen Dissolved Oxygen Specific Conid. Secchi
1 27.7 10.2 128 767 682 28.1 8.5 108 945 64
Overall, water quality measurements varied only slightly throughout the study area. Watertemperature and specific conductance values were only slightly higher downstream of the plant'sdischarge compared to upstream of it, whereas dissolved oxygen and percent saturation weremarginally higher upstream. DO concentrations were consistently above the General Useminimum standards effective 16 May 2013 of 3.5 ppm at any time August through February(Illinois General Assembly Administrative Code 35). Water clarity was comparable upstreamand downstream of the plant and was adequate for the field crew to observe and retrieve fishstunned by the electrofishing gear. All of the physicochemical measurements were within therange of values suitable to the native fish fauna of the Illinois River.
3.1.2 Seining
Fourteen species were represented among the 1,216 fish collected seining (Table 4). EmeraldShiner (83 percent), Spotfin Shiner (9.5 percent), Bluntuose Minnow (2 percent), and SandShiner (2 percent) dominated the catch. These four species comprised nearly 97 percent of allfish collected. No other species comprised more than 1% of the numerical catch.
Emerald Shiner and, to a lesser extent, Spotfin Shiner strongly dominated the catch at eachlocation, comprising 91 to 97 percent of all fish collected. Location 5, near the mouth of SouthKickapoo Creek, was the most productive of the three locations sampled in tenms of both speciesrichness and the total number of fish collected (Table 4). For example, Location 5 yielded 906fish comprised of 12 species compared to 65 to 245 fish comprised of three to six species atLocations 2 and 1, respectively. The better production at Location 5 is likely due to its proximityto South Kickapoo Creek, as well as habitat diversity and suitability of that location to seining.Location 5 contains extensive shallow areas with clean sand, gravel, and cobble which isgenerally better seining habitat compared to upstream locations. Seven species were collectedexclusively at Location 5, including several stream dwelling species such as Central Stoneroller,Silverjaw Minnow, and Suckermouth Minnow, which are likely waifs from South KickapooCreek (Table 4). In contrast, Emerald Shiner and Spotfin Shiner, the two most abundant speciescollected seining overall, were collected at all three sampling locations. They comprised 91 to97 percent of the catch at each location.
8

3..1.3 DELT Anomalies
DELT anomalies are most relevant for this study because a clear relationship has beenestablished between the incidence (percentage) of DELT anomalies and water quality (Ohio EPA1989). Percent DELT anomalies were low among all fish collected by electrofishing andseining during the 2013 survey. For example, only two of the 1,295 fish collected (0.2 percent)exhibited DELT anomalies (Table 5). Two Freshwater Drum, one collected upstream of theplant's discharge and one downstream, were each afflicted with a single DELT anomaly (erodedfins), resulting in an overall affliction rate of 0.1 percent at Locations 1 and 2 (Table 5). No fishcollected at Location 5 seine exhibited DELT anomalies. An increase in the affliction rate ofDELT anomalies usually indicates stress and environmental degradation. The presence ofdeformities, erosions, lesions, and tumors can indicate environmental stress when a largepercentage of the population is afflicted. The low incidence of DELT anomalies observed in thelocal fish community during this study does not suggest any obvious environmental stressors inthis portion of the Illinois River.
No external parasites or other abnormalities were observed on any fish collected during the 2013study.
3.1.4 Relative Weight
Inherent in the development of standard weight (Ws) equations used to calculate relative weight(Wr) of fish is the objective of modeling the growth form of a species for individuals in better-than-average condition for management purposes. A mean Wr value close to 100 for a broadrange of size groups may reflect optimal health and utilization of food resources for a givenpopulation (Anderson and Gutreuter 1983). Mean Wr values considerably less than 100 maysuggest low food availability and/or disruption of feeding relationships or the presence of variousenvironmental stressors. However, relative weights can also be influenced by several factorsinclUding sex, fish size, and spawning condition.
In total, 53 fish comprised of 9 species that met the minimum length criteria for the Wr equationswere collected in 2013 (Table 6). Only two of the nine species collected (Gizzard Shad andSmallmouth Buffalo) were represented by five or more specimens and will be the focus of thisdiscussion. All remaining species were collected in such low numbers rendering those data lessmeaningful. The mean Wr for Gizzard Shad for locations combined was 91 and was slightlyhigher downstream of the plant's discharge (92) than upstream (89), whereas the mean Wr forSmallmouth Buffalo was 78, but again slightly higher downstream (80) compared to upstream(76). The mean relative weight of 78 observed for Smallmouth Buffalo is less than ideal,•suggesting food availability and/or feeding relationships for this bottom feeding species may notbe optimal in this portion of the Illinois River, at least for those few individuals that werecollected in 2013 (Table 6).
3.2 BENTHOS
During 2013, benthic macroinvertebrate sampling was conducted at four locations on the IllinoisRiver that had been established during pre-operational studies for the LaSalle County Station
9

(Figure 1). HD samples were retrieved from three of four locations. Both sets of HD samplersthat were deployed at Location 1 were missing upon retrieval and appeared to have beenvandalized. However, Ponar samples were collected successfully at all four locations.
Overall, the benthos collections yielded 61 total taxa (Table 7). Chironomidae was the most taxarich group with 21 taxa followed by Ephemeroptera and Bivalvia with eight taxa each.
3.2.1 H-ester-Dendy
The three HD samples yielded a combined 31 total taxa (Table 8). Chironomidae were the mosttaxa rich group with 10 taxa while Ephemeroptera and Trichoptera each contributed five taxa tothe total HID richness. Total taxa richness was highest among Locations 3 and 4 (23-25 taxa),and slightly lower at Location 2 (Table 8). As with total taxa, EPT richness was highest amongLocations 3and 4 (9-10 taxa) and lower at Location 2 with five taxa (Table 8).
Total density (no./m 2) was similar and substantially higher at Locations 3 and 4 compared to'Location 2 (Table 8). The higher densities observed at Location 3 was due to high numbers ofDicrotendipes spp., which composed 35 percent of the total density at Location 3 (Table 8). AtLocation 4, several taxa contributed to elevated density including Maccaffertium integrum,Cheumatopsyche, and Dicrotendipes spp. Overall, dominant taxa among the three locationsexhibited some similarities but no longitudinal trends.
HD Dominant Taxa in Order of Percent AbundanceLocation 2 Location 3 Location 4C. fraternus D. modestus Cheumatopsyche
D. neomodestusTurbellaria D. simpsoni M. integrum
D. modestus C. fraternus D. modestusHydroptila Glyptotendipes Stenacron
M. integrum Stenacron D. neomodestus
Based on the environmental tolerance values developed by the Illinois Environmental ProtectionAgency (IEPA 1987; Tetra Tech 2007), the only tolerant taxon among the dominants wasGlyptotendipes. In contrast, the remaining dominant taxa are considered facultative to slightlyintolerant. Dicrotendipes modestus was among the dominant taxa at each of the three locationswhile Maccaffertium integrum, Cyrnellus fraternus, and Dicrotendipes neomodestus were amongthe dominant taxa at two of the three locations.
3.2.2 Ponar and Kick Net Samples
The Ponar grab samples from the four locations yielded 42 total taxa and seven EPT taxa (Table9). Chironomidae was the most taxa rich group with 15 taxa while eight Bivalvia and fourEphemeroptera taxa were also observed. Total taxa richness was highest among Locations 1 and3 (20-29 taxa) and noticeably lower at Locations 2 and 4 with 16 to17 taxa (Table 9). Despitethe differences in total taxa richness, more pollution sensitive, EPT richness was generallysimilar among the locations, ranging from three to five taxa (Table 9).
10

Total density (no./m2) was highest at Location 3 while noticeably lower and similar at Locations1, 2, and 4 (Table 9). The higher density observed at Location 3 was due almost exclusively tothe elevated abundance of the nonindigenous sideswimmer, Apocorophium lacustre,. whichaccounted for 70 percent of the total abundance. Ponar distribution of abundance was relativelysimilar throughout the study area. Tubificidae and the nonindigenous Asiatic clam, Corbiculafluminea, were among the dominant taxa at each location while Cryptochironomus andPolypedilum halterale grp. were among the dominants at three of the four locations.
Ponar Dominant Taxa in Order of Percent AbundanceLocation 1 Location 2 Location 3 Location 4Tubificidae A. lacustre A. lacustre Tubificidae
P. halterale grp. Tubificidae Tubificidae Corbicula flumineaCryptochironomus Chironomus Cryptochironomus P. halterale grp.Corbicula fluminea Corbicula fluminea Corbicula fluminea Cryptochironomus
Elimia P. halterale grp. Caenis P. scalaenum grp.C. fraternus
Based on JEPA environmental tolerance values (IEPA 1987; Tetra Tech 2007), relativelytolerant taxa such as Tubificidae, Chironomus, and Cryptochironomus were abundant at alllocations. Relatively intolerant or facultative taxa such as Polypedilum halterale grp. andCorbiculafluminea were present at each location but were generally less abundant than moretolerant taxa.
Ponar substrate composition varied somewhat among the locations. Locations 1 and 4 had fewersubstrate types with higher amounts of fine material and detritus. In contrast, Locations 2 and 3had more diverse substrate composition that trended toward coarser material.
Ponar Percent Substrate Comp ositionSubstrate 1 2 3 4
Cobble 5 5Gravel 5 45 45 15Coarse Sand - 60 30 10Fine Sand 20 10 20 15Silt 10 40Clay 5Detritus 15 10 5 30
In the absence of water quality impacts, benthic community quality generally increases withhabitat and substrate complexity. This corresponds with the Ponar results from Location 3,which had the highest total and EPT taxa richness as well as relatively more diverse substratecomposition (Table 9). However, there was no consistent relationship between benthiccommunity quality and substrate composition at the remaining three locations.
11

4. DISCUSSION
4.1 FISH
Annual construction/preoperational biomonitoring studies were conducted in the Illinois River inareas uPstream and downstream of the LaSalle County Station's river intake screenhouse anddischarge location from 1974-1978, prior to the station becoming operational in January andOctober 1984. In addition to the current 2013 study, post operational fish and benthic studieswere conducted in 1999 (EA 2000). The 1999 study was conducted in response to an extendedperiod of low water levels and high water and air temperatures. It was part of a broader upperIllinois River program which in some cases utilized slightly different sampling protocols. Whereappropriate, results of the current study (i.e., fish condition, species composition, relativeabundance, and catch rates) were compared to prior pre/post operational studies to determine ifchanges in the Illinois River have occurred that could be related to station operation.
4.1.1 Historical Operational Studies
The 1999 study included five electrofishing surveys from July through October at threelocations, one upstream of the discharge and two downstream of it. The two electrofishinglocations sampled during the current study were similar to two of the three locations sampled in1999, utilizing the same electrofishing gear. The third location sampled in 1999 was a far fieldzone established downstream of South Kickapoo Creek. All electrofishing zones were 500 m inlength for both studies. For comparative purposes, only the results from the August 1999 surveyfor the two locations immediately upstream and downstream of the LaSalle County Stationdischarge were compared to the current August survey. Seining was not discussed as this gearwas not utilized during the 1999 study.
Overall, species Composition was generally similar between August electrofishing surveys in1999 and 2013, with'Gizzard Shad, Smallmouth Buffalo, and Freshwater Drum consistentlyamong the top five most abundant species collected (EA 2000). These three species comprised52 percent (1999) to 59 percent (2013) of the total catch for locations combined. In contrast, therelative abundance of some species, such as Spotfin Shiner and Bluegill, were quite differentbetween years. For example, Spotfin Shiner was the second most abundant species collected atboth locations in 2013, but was not collected upstream of the plant's discharge and wasrepresented by less than 3 percent of the catch downstream of it in 1999 (EA 2000). Similarly,Bluegill represented 9 to 14.5 percent of the catch upstream and downstream of the plant,respectively, in 1999 but was uncommon upstream and absent downstream of the plant duringthe current study.
In total, 14 species were collected electrofishing at the two locations sampled in August 2013compared to 19 in 1999 (EA 2000). The reduced species richness observed in 2013 was mostpronounced among native minnows as five species were collected in 1999 compared to twoduring the current study. The August electrofishing survey in 1999 yielded 12 species upstreamof the LaSalle County Station discharge and 16 species downstream, compared to 13 and ninespecies collected during the current study, respectively. Differences in species richness betweenstudy years, particularly downstream of the station discharge, were typically associated with
12

incidental catches of less commofi species such as Rosyface Shiner, Bullhead minnow,Quillback, Black Buffalo, Rock Bass, and Black Crappie; all of which were represented by asingle specimen in 1999.
The total number of fish collected at each 500 m zone was very similar spatially within a givenyear, but considerably higher in 1999 compared to 2013. For example, 75 fish were collectedupstream of the plant's discharge in 1999 compared to 76 downstream, whereas 36 fish werecollected upstream in 2013 compared to 43 downstream (EA 2000). Gizzard Shad dominatedthe catch at both locations in 2013, whereas Gizzard Shad and Smallmouth Buffalo dominatedthe catch upstream and downstream, respectively, in 1999. The higher catches observed in 1999were attributable to increased numbers of most species encountered (e.g., Gizzard Shad[primarily upstream], Smallmouth Buffalo, Green Sunfish, Bluegill, Freshwater Drum, andChannel Catfish).
No species listed as endangered or threatened by Illinois were observed during operational fishsurveys (IiESPB 2011).
The overall affliction rate of DELT anomalies was much lower in 2013 (0.2 percent) comparedto 1999 (6.6 percent). Furthermore, only one species collected in 2013 (Freshwater Drum)exhibited a DELT anomaly compared to the affliction of 13 species in 1999 (EA 2000,). Thehighest affliction rates in 1999 were among bottom feeding species such as Channel Catfish,Black Buffalo, River Carpsucker, Freshwater Drum, and Common Carp.
4.1.2 Pre-Operational Studies
Construction/preoperational baseline biomonitoring studies were conducted annually from 1974-1978 near the LaSalle County Station (Bio-Test 1975; Nalco 1976, 1977, 1978; and Hazelton1979). Seasonal fish sampling was conducted by seining (five locations) and electrofishing (twolocations) in February (seining only), May, August, and November. Two of the five seinelocations were Illinois River locations (one upstream and one downstream of the plant'sdischarge) and three were located within South Kickapoo Creek (SKC), including one near theconfluence with the Illinois River. Three of the five seine locations and both electrofishinglocations were the same as those sampled in 2013. Each electrofishing location was sampled for500 m, utilizing a 230-V, 3-phase AC generator. Seine samples were collected using a 25-ft x 6-ft seine with ¼-inch mesh by making two or three hauls at each river location and one haul ateach creek location. Electrofishing samples were collected on four consecutive days (foursamples collected) each survey period, whereas seine samples were collected on two consecutivedays at the three SKC locations and four consecutive days at the two Illinois River locations. K-factors were determined by species for immature and adult fish. All fish collected wereexamined for external disease, parasitism, and abnormalities.
As indicated below, the combined data for all gear types show that species richness in the IllinoisRiver and SKC was generally comparable during the five year study period:
13

Study YearOverall 197.._4 197_.55 197._66 1977 197._88# Fish 6,638 3,068 7,681 10,146 4,260# Species 43 42 41 41 36
IL River# Fish 2,172 1,716 5,990 6,627 2,036# Species 29 32 30 34 29
S. Kick. Crk.# Fish 4,466 1,352 1,691 3,519 2,224# Species 30 27 27 28 23
The combined data for all gear types also show that overall (Illinois River and SKC combined)species richness ranged from 36 in 1978 to 43 in 1974. Temporally, species richness varied onlyslightly within each study area ranging from 29 to 34 within the Illinois River and 23 to 30 inSKC. Species richness was typically higher in the Illinois River compared to SKC within agiven year. Total numbers of fish collected by electrofishing and seining during the five yearperiod varied moderately from year to year. Numbers of fish were generally comparable in1974, 1975, 1976, and 1978 (range = 3,068 to 7,681) and moderately higher in 1977 when over10,000 fish were collected. Species composition was equally consistent among years within theIllinois River.• For example, Emerald shiner, Gizzard Shad, and Common Carp were consistentlyamong the four most abundant species collected each year from 1974 through 1978.Collectively, these three species comprised 86 to 94 percent of the annual catch from the illinoisRiver. Species dominance within SKC was not nearly as consistent on a year to year basis.Emerald Shiner, Creek Chub, and Silver Jaw Minnow were the most abundant species collectedin SKC, collectively comprising 47 to 64 percent of the total catch on an annual basis. Otherabundant species collected within SKC included Central Stoneroller, Bluntnose Minnow, WhiteSucker, Southern Redbelly Dace, and Green Sunfish.
Species richness has remained nearly constant among the two electrofishing locations combined,varying from 23 to 25 from 1974 through 1978. By location, 12 to 21 species were collectedannually upstream compared to 17 to 22 species collected downstream. Annual meanelectrofishing CPEs (# fish/hour) were comparable upstream of the plant (range = 59-168) anddownstream (52-153) during the five years of studies and were generally higher in 1975 and1977 in both areas. The higher CPEs observed in 1975 and 1977 were due to higher catches ofthe most common species, i.e. Emerald Shiners and Gizzard Shad. Seasonally, CPEs at both"locations were generally highest in August and lower in May and November, except in 1978when CPEs were highest in November.
Emerald Shiner was the most abundant species collected seining at Locations 1 and 2 in theIllinois River from 1974 through 1978, comprising 72 to 99 percent of the catch. Over the fiveyear period, Location 1, upstream of the plant's discharge, yielded 8 to 17 species compared to 7to 21 species collected downstream. As expected, species richness was more variable amongthe three SKC locations from 1974 through 1978, where 19 to 24 species were collected at thedownstream most location (near mouth), 15 to 23 at the middle reach, and 4 to 12 at the furthest
14

upstream location. Similarly, dominant species varied from year to year as well. For example,Emerald Shiner consistently dominated the seine catch near the mouth, but was generallyuncommon from the middle reach, and was absent upstream, whereas Creek Chub, SilverjawMinnow, Bluntnose Minnow, and Fathead Minnow dominated the catches at the middle andupper locations from 1974 through 1978. The observed differences in species richness andspecies composition at the three SKC locations is likely attributable to stream size and habitatquality. In wadable streams, there is a well-established, direct relationship between streamsize and species richness (OEPA 1987). Thus, one would expect fewer species at thoselocations with smaller drainage areas (e.g., headwater sites) and more species at downstreamlocations. Thus, the lower number of species collected within the upper reach in SKC (range= 4 to 12) compared to that near the mouth (19 to 24), is likely due, in part, to stream sizeand proximity to the Illinois River.
Condition factors (K) were determined for individuals of 13 species collected seasonally fromthe river and creek stations from 1974 through 1978. Similar to relative weight (Wr) calculationused in the operational studies, differences in values can be caused by a variety of environmentaland biological factors (e.g., food availability and standing crop). Changes in condition canindicate that a factor or combination of factors have altered the growth characteristics of anindividual. Condition factors were reported by season and by life stage (i.e., juveniles andadults). Condition factors were similar between years among species collected in sufficientnumbers to reflect a reliable index and were not statistically different upstream and downstreamof the plant's discharge. In August, K Factors among the most abundant species ranged from1.45 to 1.62 for Common Carp, 1.00 to 1.24 for Gizzard Shad, and 2.15 to 2.28 for GreenSunfish. These values are in the range reported in the literature (Carlander 1969 and 1977).
The incidence of external parasites, disease, and physical abnormalities was assessed on all fishcollected during the five year period from 1974 through 1978. Blackspot was the most commonexternal parasite observed during the study period. External parasites were most common amongEmerald Shiners and Green Sunfish. Exophthalmus (popeye) was a cOmmon disease amonggoldfish upstream and downstream of the plant in 1974 and 1975, and upstream of the plant in1978 where 27 percent of the goldfish were afflicted. This disease was not observed in 1976 or1977. Deformed and eroded fins were most common physical abnormalities observed during the
•five year period. Affliction rates of deformed and eroded fins were highest among CommonCarp.
4.1.3 Summary
The fish community in the Illinois River is comprised of a variety of forage, game/sport, andcommercial/rough fish as would be expected in a Midwestern river of its Size. Thepreoperational and operational fish assemblages were generally similar as they shared forage fishsuch as Emerald Shiner, Spotfin Shiner, Spottail Shiner, and Gizzard Shad; game species such asChannel Catfish, Bluegill, Green Sunfish, Smalimouth Bass, and Largemouth Bass; andrough/commercial species such as Common Carp, Smallmouth Buffalo, and redhorse species.The dominant species collected in the Illinois River (i.e., Gizzard Shad, Emerald Shiner,Smalimouth Buffalo, and Freshwater Drum) were consistent during preoperational andoperational studies
15

Fish species richness was comparable for the preoperational sampling period (1974 to 1978) andoperational sampling periods (1999 and 2013). For example, during the 1974 to 1978 baselinestudies, electrofishing species richness ranged from 16 to 19 species in August, compared to 19species in 1999 and 14 species in 2013. Diversity among species collected seining was slightlylower, but comparable, as six species were collected upstream of the plant's discharge and threeto 12 species/location downstream in 2013 compared to 8 to 17 species/location upstream and 7to 21 species/location downstream from 1974 to 1978. The slightly higher species richnessvalues observed during the baseline studies is likely due to the increased level of effort duringthose studies, which included four sampling passes over four days at each seine andelectrofishing zone in the Illinois River, compared to the more typical 2013 study when only asingle pass was conducted.
The mean operational electrofishing CPEs (# fish/hour) in 2013 were similar upstream (74) anddownstream (86) of the plant and were in range of preoperational values observed upstream (59to 168) and downstream (52 to 153) from 1974 through 1978. CPEs were not discussed for the1999 study because they were calculated based on distance (# fish/kin) rather than time (#fish/hour) as was done during the preoperational studies and the current study.
The percent DELT anomalies was lower in 2013 (0.2 percent) compared to 1999 (6.6 percent).Only Freshwater Drum exhibited DELT anomalies compared to 13 species in 1999. Externalparasites and disease were not observed on fish collected during the current study. Duringpreoperational studies, blackspot was the most common external parasite observed;Exophthalmus (popeye) was a common disease among goldfish in 1974 and 1975, and upstreamof the plant in 1978; and deformed and eroded fins were most common physical abnormalitiesobserved during the five year period.
No species on the Illinois list of endangered and threatened species have been reported from thepreoperational and operational studies near the LaSalle County Station discussed herein.
Collectively, these data suggest that the operation of the LaSalle County Station has notimpacted the resident fish populations near the plant in a negative manner. It is reasonable toexpect that if the operation of the LaSalle County Station was adversely affecting fishpopulations, then it would be manifested in comparatively lower catches, significantly reducedspecies diversity, and/or increased affliction of external anomalies during the operational studiesconducted near, and particularly downstream of, the plant; these trends have not been apparent.
The NPDES permit for LaSalle County Station was renewed in July 2013 by the JEPA. Afteragency review of the renewal application and other data available to agency staff, it wasdetermined that LaSalle County Station, as operated, was in compliance with environmentalregulations, in particular thermal and discharge issues. Special Condition 3 states, "This facility[LaS alle] meets the criteria for establishment of a formal mixing zone for thermal dischargespursuant to 35 1AC 302.102" and proceeds to define the parameters for the LaSalle mixing zone,which are the State's standard. Special Condition 15 states:
"The facility utilizes a closed-cycle recirculating cooling system, a 2058 acre
16

cooling pond, for cooling of plant condensers and is determined to be theequivalent of Best Technology Available (BTA) for cooling water intakestructures to prevent/minimize impingement mortality in accordance with the BestProfessional Judgment (BPJ) provisions of 40 CFR 125.3 because it allows thefacility to only withdraw the amount of water necessary to maintain the coolingpond level rather than the entire volume used for cooling of the plant condensers.
In order for the Agency to evaluate the potential impacts of cooling water intakestructure operations pursuant to 40 CFR 125.90(b), the permittee. shall prepareand submit information to the Agency outlining current intake structureconditions at this facility, including a detailed description of the current intakestructure operation and design, description of any operational or structural
•modifications from original design parameters, source waterbody flowinformation as necessary.
'• The infornation shall also include a summary of historical 316(b) related intakeimpingement and/or entrainment studies, if any, as well as current impingementmortality and/or entrainment characterization data; and shall be submitted to theAgency within six (6) months of the permit's effective date.
Upon the receipt and review of this information, the permit may be modified torequire the submittal of additional information based on a Best ProfessionalJudgment review by the Agency. This permit may also be revised or modified inaccordance with any laws, regulations, or judicial orders pursuant to Section316(b) of the Clean Water Act".
LaSalle County Station is conducting a bi-weekly impingement study of the make-upwater intake. In addition, a study to assess entrainment of the make-up water intake willbegin in April 2014. The two studies are anticipated to be completed within the firstquarter of 2015 and the results will be available in the second quarter of 2015.
4.2 BENTHOS
As with the fisheries studies, benthic sampling was a component of the pre-operational aquaticmonitoring program that was conducted from 1974 to 1978 (Bio-Test 1975; Nalco 1 976, 1977,•and 1978; and Hazelton 1979). In addition, the benthic macroinvertebrate community wasassessed as part of studies conducted near the LaSalle County Station in 1999 (EA 2000). Themost •recent year of analysis was 2013 and those results are presented in Section 3 of this report.Although the pre-operational and operational studies have differed in terms of effort, duration,and taxonomic treatment, the Sampling methods (i.e., HD artificial substrates and/or Ponardredge) and locations were similar among survey years.
4.2.1 Historical Operational Studies
In addition to the 2013 benthic survey, one previous operational benthic macroinvertebratesurvey has been conducted in 1999 near LaSalle County Station (EA 2000). As part of this
17
survey, duplicate Ponar grabs of 523 cm 2 each were collected from Locations 1, 2, and 4 (Figure1). Benthic sampling was conducted once in August (Table 10), twice in September, and once inOctober. The Ponar samples were processed in the same manner as described in Section 2 forthe 2013 survey.
During the 1999 surveys, 34 total taxa were observed (EA 2000). Chironomidae was the mosttaxa rich group with 12 taxa. Total taxa richness for the combined locations was similar amongthe sampling events. Spatially, taxa richness was higher downstream of the LaS alle Stationdischarge at Locations 2 and 4 during each sampling event and for the trips combined. InAugust, both total and EPT richness were slightly higher at Locations 2 and 4 compared toLocation 1 (Table 10).
Density (#/m2) was highest in August and similar among the three later sampling events (EA2000). Density was consistently higher downstream of the LaSalle Station discharge atLocations 2 and 4 during each sampling event and for trips combined. In August, density wasnoticeably higher at Locations 2 and 4 compared to Location 1 (Table 10). At all locations andduring each sampling event, the benthic community was dominated by Oligochaeta andChironomidae.
Results of the 1999 surveys indicated that the benthic community near the LaSalle Station iscomparable to other areas on the Illinois River but generally of poor quality. The benthiccommunity was dominated by relatively tolerant taxa at all locations and during each samplingevent. Overall, no discernable spatial or temporal trends were consistently observed that suggestthe benthic community was adversely affected by LaSalle County Station.
4.2.2 Pre-Operational Studies
Pre-operational benthic macroinvertebrate studies conducted from 1974 to 1978 included Ponarand HD sample collections from Locations 1, 2, 3, and 4 on the Illinois River (Figure 1) as wellas qualitative dip net collections at two locations in South Kickapoo Creek (Bio-Test 1975;Nalco 1976, 1977, and 1978; and Hazelton 1979). Sampling was conducted in February, May,August, and November of each year. With some exceptions, four Ponar grabs (530 cm2 each)and four HD samplers (0.05 m2 each) were collected during each sampling event from theIllinois River locations along with qualitative dip net samples from South Kickapoo Creek. Asdescribed in the reports, HD sampler loss or other factors prevented successful HD and/or Ponarsampling at various locations during the five years of study. However, these occurrences weregenerally uncommon.
Despite seasonal and annual differences for specific parameters, general trends in the benthicmacroinvertebrate community were notably similar over the five study years. Total taxa richnessfor all locations and sample types combined ranged from 100 taxa in 1978 to 156 taxa in 1977(Bio-Test 1975; Nalco 1976, 1977, and 1978; and Hazelton 1979). Environmentally tolerantOligochaeta and Chironomidae consistently were the most taxa rich and numerically abundant inthe HD and Ponar samples. Environmentally intolerant EPT taxa richness ranged from 12 taxain 1974 and 1978 to 21 taxa in 1975. However, most EPT taxa were observed in the SouthKickapoo Creek collections and, except for the seasonal occurrence of one or two taxa, generally
18

represented less than five percent of the total abundance in the Illinois River HD and Ponarsamples.
HD total taxa richness varied annually and seasonally among locations but some trends wereevident. In four of the five years of study, total taxa richness among the four locations waslowest in February and highest in August (Table 11). Spatially, total richness was highest atLocation 3 during 12 of 20 sampling events and lowest at Location 4 in 11 of 20 samplingevents. Totaltaxa richness was consistently lower at Location 4 in 1977 and 1978. Roadconstruction activities and a washout of a township road crossing over South Kickapoo Creekoccurred in 1976 and 1977 (Nalco 1978 and Hazelton 1979). These events resulted in increasedbedload movement and deposition of fine sediment at Location 4 and likely contributed to lowertaxa richness in 1977 and 1978.
As with HD taxa richness, density varied annually and seasonally among locations. However,HD density was consistently lower in February each year and highest in August for four of thefive study years (Table 11). The low densities in February were attributed to cool watertemperatures and the corresponding effects on benthic macroinvertebrate activity, such as drift,emergence, and recruitment (Bio-Test 1975; Nalco 1976, 1977, and 1978; and Hazelton 1979).Spatially, density was slightly more variable compared to taxa richness. Nonetheless, spatialtrends for the two parameters were similar with density being highest at Location 3 for 10 of 20surveys and lowest at Location 4 during nine of 20 sampling events. With few exceptions,Chironomidae were generally the dominant group in terms of abundance and regardless of studyyear, sampling event, or location.
Ponar and dip net (i.e., natural substrate) total taxa richness also varied annually and seasonallyamong locations. However, as was observed in the HD results, the natural substrate datapresented consistent trends. In each of the five years of study, total taxa richness among the fourIllinois River locations and two South Kickapoo Creek locations was higher in February andlower in either May or November (Table 12). Spatially, total richness was highest at Location 4during 11 of 20 sampling events and lowest at Location 1 in 12 of 20 sampling events.
Density in the natural substrate samples was clearly more variable than taxa richness for eithersample type as well as HD density. In three of five study years, density was highest in February,however, none of the four sampling periods consistently produced the lowest density (Table 12).The higher densities in February were attributable to the increased abundance of.Oligochaeta andoften appeared to correspond with higher flow conditions (Bio-Test 1975; Nalco 1976, 1977, and1978; and Hazelton 1979). Oligochaeta abundance typically decreased each year from Februaryto November. Among locations, density was lowest at Location 1 for seven of the 20 samplingevents, which was consistent with total taxa richness for the natural substrate samples. However,there was no corresponding spatial relationship with highest density at Location 3 and taxarichness. Temporally and spatially, Oligochaeta and Chironomidae were generally the dominantgroups in the natural substrate samples with some variability associated with substratecomposition among locations.
Overall, the five Years of pre-operational surveys indicate that the Illinois River benthicmacroinvertebrate community was composed of facultative and environmentally tolerant
19

organisms; not atypical of a large river in the immediate, post-Clean Water Act era. Althoughseasonal and spatial trends were evident, the patterns observed in the benthic community wereattributable to natural seasonal variation and/or substrate composition. None of the trends'observed were related to construction activities associated with the LaSalle County Station
4.2.3 Summary
Comparisons between the pre-operational and operational benthos surveys are challenging duelargely to variations in sampling methods such as different types of modified HDs (nine roundplates 0.05 m2 [rarely used now] versus five square plates 0.093 in2), number of sampling events,and differences in taxonomic resolution among studies. In addition, the effects of inherentchanges that have occurred in the Illinois River and watershed (e.g., land use, introduction ofexotic species, etc.) over nearly 40 years are not completely understood. Despite thesedifferences and challenges, the pre-operational, 1999, and 2013 results exhibited somesimilarities.
For the August HD results, Chironomidae was the dominant group in terms of richness anda~bundance in both the pre-operational and 2013 studies (Bio-Test 1975; Nalco 1976, 1977, and1978; Hazelton 1979; and Table 8). In addition, Dicrotendipes was among the most commontaxa identified from HD samples collected during the 1974-1978 pre-operational surveys andwas the most abundant Chironomidae taxa in each of the three HD locations in 2013.
Pre-operational HD taxa richness for the five August sampling events ranged from 13 taxa atLocation 4 in 1977 to 34 taxa at Location 1 in 1975 with an average August richness of 25 taxafor the five years combined (Table 11). In comparison, HD taxa richness among the threeAugust 2013 operational samples ranged from 18 taxa at Location 2 to 25 taxa at Location 4(Table 8). Given that the pre-operational assessments identified Oligochaeta to genus/specieslevel while the 2013 surveys treated Oligochaeta as a single taxon, the 2013 HD taxa richnesswas clearly similar to or higher than historical results.
Pre-operational HD density for the five August sampling events ranged from 1 ,285/m2 atLocation 4 in 1976 to 13,410/in2 at Location 3 in 1977 with an average August density of4,329/in2 for the five years combined (Table 11). In comparison, HD density among the threeAugust 2013 stations was similar to the pre-operational results and ranged from 1 ,546/m2 atLocation 2 to 5,246/in 2 at Location 3 (Table 8).
Among the August Ponar results, Oligochaeta and Chironomidae were among the two mostabundant groups during both pre-operational and operational studies (Bio-Test 1975; Nalco1976, 1977, and 1978; Hazelton 1979; Tables 9 and 10). Specifically, Tubificidae,Cryptochironomus, and Polypedilum spp. were among the dominant taxa observed at the IllinoisRiver locations during August pre-operational and operational study periods.
Pre-operational Ponar taxa richness for the five August sampling events and four Illinois Riverlocations ranged from seven taxa at Locations 1 and 2 in 1975 to 26 taxa at Location 4in 1975with an average August richness of 12 taxa for the five years combined (Table 12). Ponar taxarichness among the three August 1999 operational samples ranged from 10 taxa at Location 1 to
20

12 taxa at both Locations 2 and 3 (Table 10). Ponar taxa richness among the four August 2013operational samples ranged from 16 taxa at Location 2 to 29 taxa at Location 3 (Table 9). Giventhat the pre-operational assessments and the 1999 operational surveys identified Oligochaeta togenus/species level while the 2013 study treated Oligochaeta as a single taxon, the 2013 Ponartaxa richness was clearly similar to or higher than historical results.
Pre-operational Ponar density for the five August sampling events and four Illinois Riverlocations ranged from 1 19/mn2 at Location 1 in 1975 to 5,741/in2 at Location 4 in August 1977with an average August density of 1,302/ni 2 (Table 12). Ponar density among the three August1999 operational samples ranged from 698/mi2 at Location 1 to 2,095/in2 at Location 2 (Table10). In comparison, August 2013 Ponar density ranged from 608/nm2 at Location 1 to 2,607/mi2 atLocation 3; within the range observed during the pre-operational surveys and nearly identical tothe 1999 results (Table 9).
Although some differences in the benthic community were evident among study years, overall,the 2013 benthic community in the Illinois River near the LaS alle County Station was rathersimilar to the pre-operational and historic operational benthic community. Community structureremained generally consistent as evidenced by the dominant taxa among studies. In addition,trends observed nearly 40 years ago were evident in the 2013 collections. In both surveys,longitudinal changes appeared to be partly due to differences in substrate composition rather thanconstruction or operation of the LaSalle County Station. Just as the 1974-1978 and 1999 benthicsurveys showed no effects related to pre-operational and operational activities, the 2013 surveysupports these historical data in demonstrating no operational effects.
21

5. REFERENCES
Anderson, R.O. and S.J. Gutreuter. 1983. Length,.Weight, and Associated Structural Indices.Pages 283-300. In Nielsen, L.A. and D.L. Johnson (Eds.). Fisheries Techniques.Southern Printing Company, Inc., Blacksburg, VA.
Anderson, R.O. and R.M. Neumann. 1996. Length, Weight, and Associated Structural Indices.Pages 447-482. In (Murphy, B.R. and D.W. Willis, Eds.) Fisheries Techniques, 2ndEdition. Am. Fish. Soc., Bethesda, MD.
Baumann, P.C., W.D. Smith, and W.K. Parland. 1987. Tumor frequencies and contaminant•concentrations in brown bullhead from an industrialized river and a recreational lake.Trans. Am. Fish. Soc. 116(1):79-86.
Becker, G.C. 1983. Fishes in Wisconsin. The University of Wisconsin Press. Madison, WI.
Industrial Bio-Test Laboratories, Inc. (Bio-Test). 1975. Aquatic Monitoring Program for theConstruction Phase of the LaSalle County Station, 1974. Prepared for CommonwealthEdison Company, Chicago, IL.
Bister, T.J., D.W. Willis, M.L. Brown. 2000. Proposed standard weight (Ws) equations andstandard length categories for 18 warmwater nongame and riverine fish species. N. Am.Jour. Fish. Mgt. 20:570-574.
Carlander, K.D. 1969. Handbook of Freshwater Fishery Biology, Vol. 1. Iowa State UniversityPress, Ames.
_______1977. Handbook of freshwater fishery biology, Volume 2. The IowaState University Press, Ames, Iowa, USA.
EA Engineering, Science, & Technology, Inc. 2000. Final Report Lasalle Station AquaticMonitoring 1999, Rm 249.7-248.8. Prepared for Commonwealth Edison Company,Chicago, IL.
Hazelton Environmental Sciences Corporation (Hazelton). 1979. Aquatic Monitoring Programfor the Construction Phase of the LaSalle County Station, 1978. Prepared forCommonwealth Edison Company, Chicago, IL.
Illinois Endangered Species Protection Board (IESPB). 2011.. Checklist of Endangered andThreatened Animals and Plants of Illinois. Effective 11 February 2011. IllinoisEndangered Species Protection Board, Springfield, IL.http://www.dnr.illinois.gov/ESPB/Documents/ETChecklist20 11 .pdf
Illinois Environmental Protection Agency (IEPA). 1987. Field and Laboratory MethodsManual: Section C, Macroinvertebrate Monitoring. IEPA. Springfield, IL. 55 pp.
22

Murphy, B.R., D.W. Willis, and T.A. Springer. 1991. The relative weight index in fisheriesmanagement: status and needs. Fisheries 16(2): 30-28.
Nalco Environmental• Sciences (Nalco). 1976. •Aquatic Monitoring Program for theConstruction Phase of the LaSalle County Station, 1975. Prepared for CommonwealthEdison Company, Chicago, IL.
________*1977. Aquatic Monitoring Program for the Construction Phase of the LaSalleCounty Station, 1976. Prepared for Commonwealth Edison Company, Chicago, IL.
______*1978. Aquatic Monitoring Program for the Construction Phase of the LaSalleCounty Station, 1977. Prepared for Commonwealth Edison Company, Chicago, IL.
Ohio Environmental Protection Agency. 1987 (Updated November 8, 2006). Biological criteriafor the protection of aquatic life: Vol. II. Users manual for biological field assessment ofOhio surface waters. Div. Water Quality Monitoring and Assess., Surface Water Sect.,Columbus, OH.
Ohio Environmental Protection Agency. 1989 (Updated November 8, 2006). Biological criteriafor the protection of aquatic •life: Vol. III. Standardized field and laboratory methods forassessing fish and macroinvertebrate communities. Div. Water Quality Monitoring andAssess., Surface Water Sect., Columbus, OH.
Pflieger, W.L. 1975. The Fishes of Missouri. Missouri Department of Conservation. JeffersonCity, Missouri.
Post, G. 1983. Textbook of fish health. TFH Publication, Inc. Neptune City. 256 pp.
Smith, P. 1979. The Fishes of Illinois. Univ. of Illinois Press, Urbana, IL.
Tetra Tech, Inc. 2007. Illinois Benthic Macroinvertebrate Collection Method Comparison andStream Condition Index Revision, March 2007. Prepared for JEPA, Springfield, IL. 122pp.
Trautman, M.B. 1981. The Fishes of Ohio. Ohio State Univ. Press, Columbus. 782 pp.
Wege, G.J. and R.O. Anderson. 1978. Relative weight (W,.): A new index of condition forlargemouth bass. Pages 79-9 1 in Novinger G.D. and J.G. Dillard, eds. New approachesto the management of small impoundments. North Central Division, Am. Fish. Soc.,Special Publication 5.
23

FIGURES
Marseilles
LOCATION 4'//°s IRiiVer A
A
LCTOLOCATION 3- [Discharge
.,, ooC reek . .. -° '
Co LOCATION 2
LeQend
0 Hester-Dendy Sample Location
[] Ponar Sample Location
A Seine Sample Location
*0Etectrofishing Zone
0
0 500 1,000
Feet
February, 2014
Marsille
LaSalle County StationMarseilles, Illinois
Figure 1
2013 LaSalle County StationFish and Benthos Monitoring

TABLES

Table 1. Intercept (a) and Slope (b) Parameters for Standard WeightTotal LenQths (mm) Recommended for Applicatior~a).
(Ws) Equations with Minimum
MinimumSlope (b) Length
Species Intercept (a)
Longnose garGizzard shadRainbow trout (lentic)Brook troutChinook salmonNorthern pikeCommon carpGolden shinerBigmouth buffaloSmallmouth buffaloRiver carpsuckerWhite suckerShorthead redhorseBlack bullheadYellow bullheadBrown bullheadChannel catfishFlathead catfishWhite perchWhite bassYellow bassStriped bassHybrid MoroneRock bass "Green sunfishPumpkinseedWarmouthBluegillLargemouth bassSmallmouth bassBlack crappieWhite crappieSaugerWalleyeYellow perchFreshwater drum
-6.8 11-5.376-4.898-5.085-4.661-5.437-4.639-5.593-5.069-5.298-4.839-4.755-4.841-4.974-5.374-5.076-5.800-5.542-5.122-5.066-5.142-4.924-5.201-4.827
-4.915-5.179-5.180-5.374-5.316-5.329-5.618-5.642-5.492-5.453-5.386-5.419
3.4493.1702.9903.0432.9013.0962.9203.3023.1183.2082.9922.9402.9623.0853.2323.1053.2943.2303.1363.0813.133
3.0073.1393.0743.1013.2373.2413.3163.1913.2003.3453.3323.1873.1803.2303.204
2001801201302001002O005015020013010010013060
13070
13080
11570
1501158060508080
15015010010070
150100100
Reference or developer
Bister et al. (2000)Anderson and Gutreuter (1983)Simpkins and Hubert (unpublished)Whelan and Taylor (1984)Halseth et al. (1990)Willis (unpublished)Bister et al. (2000)Liao et al. (1995)Bister et al. (2000)Bister et al. (2000)•Bister et al. (2000)Bister et al. (2000)Bister et al. (2000)Bister et al. (2000)Bister et al. (2000)Bister et al. (2000)Brown et al. (1995)Bister et al. (2000)Bister et al. (2000)Brown and Murphy (1991)Bister et al. (2000)Brown and Murphy (1991)Brown and Murphy (1991)Bister et al. (2000)Bister et al. (2000)Liao et al. (1995)Bister et al. (2000)Hillman (1982)Wege and Angerson (1978)Kolander et a1. (1993)Neumann and Murphy (1991)Neumann and Murphy (1991)C.S. Guy (unpublished)Murphy et al. (1990)Willis et al. (1991)Blackwell et al. (1995)
(a) Sources: Bister et al. 2000, Anderson and Neumann 1996, and Murphy et al. 1991.

Table 2. List of Common and Scientific Names of Fish Taxa Collected near LaSalle Station, August 2013.
COMMON FAMILY NAME
HERRINGSCARPS AND MINNOWS
COMMON NAME SCIENTIFIC NAME
GIZZARD SHADCENTRAL STONEROLLERSPOTFIN SHINERCOMMON CARPEMERALD SHINERSILVER JAW MINNOWBIGMOUTH SHINERSPOTTAIL SHINERROSYFACE SHINER
SAND SHINERNotropis sp.SUCKERMOUTH MINNOWBLUNTNOSE MINNOWBULLHEAD MINNOW
SMALLMOUTH BUFFALOGOLDEN REDHORSESHORTHEAD REDHORSE
CHANNEL CATFISH
BROOK SILVERSIDE
GREEN SUNFISHBLUEGILLSMALLMOUTH BASSLARGEMOUTH BASS
DRUMS AD CROAKRS AplESnotusErunnieM
•Dorosoma cepedianumCampostoma anomalumCyprinella spilopteraCyprinus carpioNotropis atherinoidesNotropis buccatusNotropis dorsalisNotropis hudsoniusNotropis rubellus
Notropis stramineusNotropis sp.Phenacobius mirabilisPimephales notatusPimephales vigilax
Ictiobus bubalusMoxostoma erythrurumMoxostoma macrolepidotum
Ictalurus punctatus
Labidesthes sicculus
Lepomis cyanellusLepomis macrochirusMicropterus dolomieuMicropterus salmoides
SUCKERS
NORTH AMERICAN CATFISHES
NEW WORLD SILVERSIDES
SUNFISHES
DRUMSANDCROAKERS Aplodinotus grunniens

Table 3. Number, Biomass, and Relative Abundance of Fish Collected near.LaSalle Station, August 2013.
ELECTRO FISHING SEINE GEARS COMBINED MinimumLength (mm)
MaximumLength (mm)SPECIES KG KG %/ KG %/
GIZZARD SHAD . 38 48.1 4.283 22.5 9 0.7 0.096 4.4 47 3.6 4.379 20.7 86 345
CENTRAL STONEROLLER 1 1.3 0.002 0.0 2 0.2 0.004 0.2 3 0.2 0.006 0.0 -- --
COMMON CARP 1 1.3 2.100 11.1 .. .. .. .. - 1 0.1 2.100 9.9 550 550
SILVERJAW MINNOW .. .. .. ..- .4 0.3 0.005 0.2 4 0.3 0.005 0.0 ....-
EMERALD SHINER 2 2.5 0.004 0.0 1,010 83.1 1.876 85.4 1,012 78.1 1.880 8.9 ....-
BIGMOUTH SHINER .. .. ... ..- 2 0.2 0.001 0 2 0.2 0.001 0.0 ....-
SPOTTAIL SHINER .. ..- -- -- 1 0.1 0.002. 0.1 1 0.1 0.002 0.0 ....-
ROSYFACE SHINER .. .. .. .. - 2 0.2 0.001 0 2 0.2 0.001 0.0 ....-
SPOTFIN SHINER 13 16.5 0.023 0.1 115 9.5 0.064 2.9 128 9.9 0.087 0.4 ....-
SAND SHINER .. .. .. .. - 21 1.7 0.017 0.8 21 1.6 0.017 .0.1 .....
Notropis sp. -- . .. .. .. 3 0.2 0.001 0 3 0.2 0.001 0.0 ....-SUCKERMOUTH MINNOW .. .. .. .. - 2 0.2 0.003 0.1 2 0.2 0.003 0.0 ....-
BLUNTNOSE MINNOW .. .. .. .. - 27 2.2 0.038 1.7 27 2.1 0.038 0.2 ....
BULLHEAD MINNOW .. .. .. .. "- 9 0.7 0.003 0.1 9 0.7 0.003 0.0 ....-
SMALLMOUTH BUFFALO 5 6.3 4.185 22.0 .. .. .. .. - 5 0.4 4.185 19.7 356 430GOLDEN REDHORSE 4 5.1 1.221 6.4 .. .. .. .. - 4 0.3 1.221 5.8 200 390SHORTHEAD REDHORSE 2 2.5 0.850 4.5 .. .. .. .. - 2 0.2 0.850 4.0 355 385
CHANNEL CATFISH 2 2.5 1.600 8.4 .. .. .. ...- 2 0.2 1.600 7.5 365 500BROOK SILVERSIDE .. .. .. .. - 8 0.7 0.006 0.3 8 0.6 0.006 0.0 ....-
GREEN SUNFISH 1 1.3 0.004 0.0 .. .. .. .. - 1 0.1 0.004 0.0 55 55
BLUEGILL 2 2.5 0.028 0.1 .. .. .. .. - 2 0.2 0.028 0.1 88. 90SMALLMOUTH BASS 3 3.8 0.324 1.7 1 0.1 0.079 3.6 4 .0.3 0.403 1.9 145 242LARGEMOUTH BASS 2 2.5 0.560 2.9 .. .. .. .. - 2 0.2 0.560 2.6 274 288FRESHWATER DRUM . 3 3.8 3.820 20.1 .. .. .. .. - 3 0.2 3.820 18.0 435 512
TOTAL FISH 79 1 I100 119.004 1I 100 I1,216 1j 100 1 2.196 1I 100 I1,295 1 I100 1I21.200 1I 100TOTAL SPECIES 14 14 .23
NOTE: 0.0 indicates less than 0.05

Table 4. Fish Captured at each Electrofishing and Seining Location near LaSalle Station, August 2013.
ELECTROFISHING
SPECIESGIZZARD SHADCENTRAL STONEROLLERCOMMON CARPEMERALD SHINERSPOTFIN SHINERSMALLMOUTH BUFFALOGOLDEN REDHORSESHORTHEAD REDHORSECHANNEL CATFISHGREEN SUNFISHBLUEGILLSMALLMOUTH BASSLARGEMOUTH BASSFRESHWATER DRUM
TOTAL FISHTOTAL SPECIESCPE (FISH/HOUR)
SEINING
SPECIESGIZZARD SHADCENTRAL STONEROLLERSILVER JAW MINNOWEMERALD SHINERBIGMOUTH SHINER
1 2 Locations CombinedNo. %No. %No.%
101
19222112311
27.82.8
2.825
5.65.65.62.82.85.68.32.82.8
100
1
432
2.32.39.3
74.7
28 65.1
1 2.3
38112
135422123
.'2
3
791480
48.11.31.32.5
16.56.35.12.52.51.32.53.82.53.8
100
12
2.34.7
100361374
439
86
1 2 5 Locations CombinedNo. %No. %No. %No.%
924
817
10.20.4
90.2
924
1,0102
0.70.20.3
83.10.2
1572
64.10.8
36 55.4

Table 4. Continued
SPOTTAIL SHINERROSYFACE SHINERSPOTFIN SHINERSAND SHINERNotropis sp.SUCKERMOUTH MINNOWBLUNTNOSE MINNOWBULLHEAD MINNOWBROOK SILVERSIDESMALLMOUTH BASS
12
6773
0.827.3
2.91.2
27 41.5 2114
225
281
0.1
2.31.5
0.22.80.20.90.1
100
12
1152132
27981
0.10.29.51.70.20.22.20.70.70.1
100
2 3.17 2.9 I--
TOTAL FISHTOTAL SPECIES
2456
100 653
100 90612
1,21614

Table 5. Summary of DELT (Deformity, Erosion, Lesion, and Tumor) Anomalies on FishCaptured by Electrofishing and Seining near LaSalle Station, August 2013.
LOCATION1 2
DELT DELT
LOCATIONS COMBINED5
DELT DELIT EXAM DELTSPECIESGIZZARD SHADCENTRAL STONEROLLERCOMMON CARPSILVER JAW MINNOWEMERALD SHINERBIGMOUTH SHINERSPOTTAIL SHINERROSYFACE SHINERSPOTFIN SHINERSAND SHINERNotropis sp.SUCKERMOUTH MINNOWBLUNTNOSE MINNOWBULLHEAD MINNOWSMALLMOUTH BUFFALOGOLDEN REDHORSESHORTHEAD REDHORSECHANNEL CATFISHBROOK SILVERSIDEGREEN SUNFISHBLUEGILLSMALLMOUTH BASSLARGEMOUTH BASSFRESHWATER DRUM
TOTAL FISHPERCENT DELT ANOMALIES
-- 47-- 3
-- 4-- 1012-- 2-- 1
-- 2-- 128-- 21-- 3-- 2-- 27
--- 9-- 5-- 2-- 2-- 8-- 1
-- 2-- 4
-- 1 223 66.7
10.1
10.1 0
20.2
1295 0.2

Table 6. Mean Relative Weights of Fish Collected near LaSalle Station, August 2013.
SPECIES N MEAN
GIZZARD SHAD 9 89
COMMON CARP --
SMALLMOUTH BUFFALO 2 76
SHORTHEAD REDHORSE 2 73
CHANNEL CATFISH 1 102
LOCATION1 2 5
MINIMUM MAXIMUM N MEAN MINIMUM MAXIMUM N MEAN MINIMU
78 101 24 92 73 105 - - --
91 -- - -
84 -- - -
1 91
80 3 80
91
7473
70
LOCATIONS COMBINEDJM MAXIMUM N MEAN MINIMUM MAXIMUM
- 33 91 73 105
-- 1 91 91 91
-- 5 78 73 84
-- 2 73 70 . 76
- 2 91 80 102
-- 2 114 110 118
91 91 3 92 85 100
76
102 102 1 80 80 80 -- - -
BLUEGILL
SMALLMOUTH BASS
LARGEMOUTH BASS
FRESHWATER DRUM
SPECIES COMBINED
2 114
2 93
1 88
1 84
20 89
110
85
88
84
70
118
100
88
84
118
1 91
1 90
2 91
32 90
90 90 -- - - 2 89
3 8888
73
93 -- -
105 1 91
88
84
70
90
93
11891 91 53 90

Table 7. Benthic Macroinvertebrate Taxa Collected from the Illinois River in theVicinity of LaSalle County Station, August 2013.
TURBELLARIA (flatworms)ENTOPROCTA
Urnatella gracilisECTOPROCTA (bryozoans)
Plumatella
ANNELIDAOligochaeta (aquatic worms)
TubificidaeHirudinea (leeches)
Placobdella
CRUSTACEAAmphipoda (sideswimmers)
Hyalella azteca
GammarusApocorophium lacustre
ARACHNOIDEA (watermites)
Hydracarina
I NSECTAEphemeroptera (mayflies)
ProcloeonMaccaffertium integrum
Maccaffertium terminatum
Stenonema femoratum
StenacronTricorythodes
Caenis
HexageniaOdonata (damselflies and dragonflies)
ArgiaStyl urus
Trichoptera (caddisflies)
CheumatopsycheHydropsyche orrisPotamyia flavaHydroptila
OecetisCyrnellus fraternus
Coleoptera (beetles)DubiraphiaMacronychus glabratus
Stenelmis
Diptera (true flies)Ceratopogonidae
ChaoborusChironomidae (midges)
Proclad iusAblabesmyia janta
Ablabesmyia mallochiLa bru ndin ia
Nanocladius distinctus
AxarusChi ronom us
Cryptochironomus
Dicrotendipes lucifer
Dicrotendipes modestusDicrotendipes neomodestus
Dicrotendipes simpsoniGlyptotendipes
Paracladopel maPolypedilum flavum
Polypedilum halterale grp.Polypedilum scalaenum grp.
Pseudoch ironom us
RheotanytarsusTanytarsus
Xenochironomus
MOLLUSCAGastropoda (snails)
Ferrissia
Elimia
Bivalvia (mussels & clams)
Corbicula fluminea
Sphaerium
Unionidae
Amblema plicata
Quadrula pustulosa
Obliquaria reflexa
Leptodea fragilis
Dreissena polymorpha
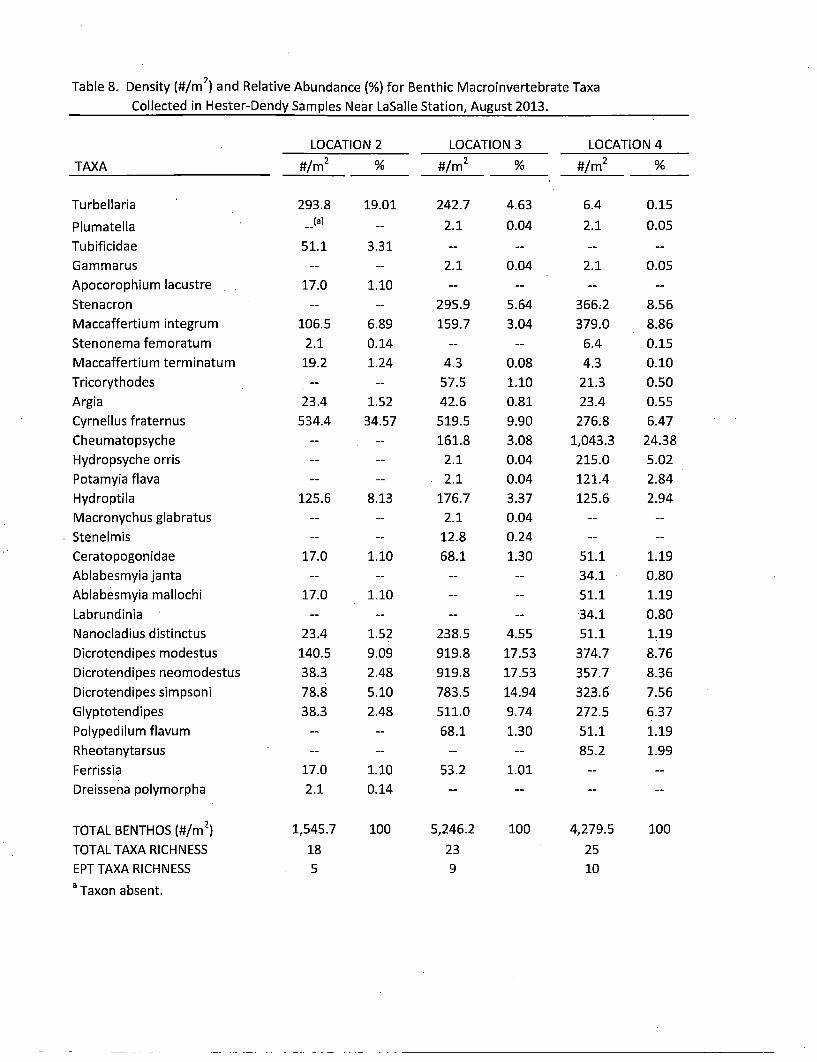
Table 8. Density (#/m 2) and Relative Abundance (%) for Benthic Macroinvertebrate TaxaCollected in Hester-Dendy Samples Near LaSalle Station, August 2013.
LOCATION 2TAXA #/m2 %___
LOCATION 3#/m2 %___
LOCATION 4
TurbellariaPlumatella
Tubificidae
Ga mma rusApocorophium lacustre
Stenacron
Maccaffertium integrum
Stenonema femoratum
Maccaffertium terminatum
Tricorythodes
Argia
Cyrnellus fraternus
Cheumatopsyche
Hydropsyche orris
Potamyia flava
Hydroptila
Macronychus glabratus
Stenelmis
Ceratopogonidae
Ablabesmyia jantaAblabesmyia mallochi
LabrundiniaNanocladius distinctus
Dicrotendipes modestus
Dicrotendipes neomodestus
Dicrotendipes simpsoni
Glyptotendipes
Polypedilum flavum
Rheotanytarsus
FerrissiaDreissena polymorpha
TOTAL BENTHOS (#/m 2)
TOTAL TAXA RICHNESS
EPT TAXA RICHNESS
aTaxon absent.
293.8 1'c(a)
51.1 3
17.0 1
106.5 6
2.1 C
19.2 1
23.4 1
534.4 3z
9.01 242.72.1
-- 2.1L.IO --
-- 295.95.89 159.7
1.14 --
L.24 4.3
-- 57.5/.52 42.6
4.57 519.5
-- 161.8-- 2.1-- 2.1
3.13 176.7
-- 2.1-- 12.8
/.10 68.1
125.6
17.0
17.0
23.4
140.5
38.378.838.3
17.0
2.1
1,545.7
18
5
8
4.630.04
0.04
5.64
3.04
0.08
1.10
0.81
9.90
3.08
0.04
0.04
3.37
0.04
0.24
1.30
4.55
17.53
17.53
14.94
9.74
1.30
1.01
100
6.42.1
2.1
366.2
379.0
6.4
4.3
21.3
23.4
276.8
1,043.3
215.0
121.4
125.6
51.1
34.1
51.1
34.1
51.1
374.7
357.7
323.6
272.5
51.1
85.2
4,279.5
25
10
0.150.05
0.05
8.56
8.86
0.15
0.10
0.50
0.55
6.47
24.38
5.02
2.84
2.94
1.19
0.80
1.19
0.80
1.19
8.76
8.36
7.56
6.37
1.19
1.99
1.10
1.52
9.09
2.48
5.10
2.48
1.10
0.14
1O00
238.5
919.8
919.8
783.5
511.0
68.1
53.2
5,246.2
23
9
100

Table 9. Density (#/m2) and relative abundance (%) for benthic macroinvertebrate taxa collected inPonar samples near LaSalle Station - August 2013.
LOCATION 1 LOCATION 2 LOCATION 3 LOCATION 4
TAXA
Urnatella gracilis
Tubificidae
Placobdella
Hyalella azteca
Gammarus
Apocorophium lacustre
Hydracarina
Procloeon
Stenacron
Caenis
Hexagenia
Stylurus
Cyrnellus fraternus
Hydroptila
Oecetis
Du bi raph ia
Sten elImis
Chaoborus
Proclad ius
Ablabesmyia mallochi
Axarus
Chi ronom us
Cryptochironomus
Dicrotendipes neomodestus
Dicrotendipes lucifer
Dicrotendipes simpsoni
Glyptotendipes
Pa raclad opel ma
Polypedilum halterale grp.
Polypedilum scalaenum grp.
Pse udoch ironom us
Tanytarsus
Xenochironomus
Elimia
Corbicula fluminea
Sphaen u m
* Unionidae
Amblema plicata
Quadrula pustulosa
Obliquaria reflexa
4.8296.6
(a)
4.8
4.8
4.8
9.6
4.8
0.7948.82
0.79
0.79
0.79
1.57
0.79
196.1 32.03
AO 0 tl -0
301.4 11.56
'H-
20
,1
.. ..- 4.8 0.18
.. ..- 33.5 1.28)0.9 32.81 1832.2 70.28
fl 7SR ....
583.6
4.8
23.9
9.6
58.37
0.48
2.39
0.96
9.6 1.56
4.8 0.78
4.8 0.18
43.1 1.65
9.6
4.8
4.8
4.8
4.8
1.57
0.79
0.79
0.79
0.79
....- 43.1 1.65
....- 9.6 0.374.8 0.78 19.1 0.73
....- 14.4 0.55
1IAA ")9
4.8 0.48
4.8 0.48
9.6 0.96
4.8 0.48
4.8 0.48
67.0 11.02
-.
9.6 1.57
71.8 11.81 1
14.4 2.36 1
28.7 4.72
33.5 5.51 2
."t'. '-t £-.•'t ....
....- 9.6 0.37
....- 9.6 0.3731.3 13.28 23.9 0.92
....- 62.2 2.399.6 1.56 28.7 1.10
....- 4.8 0.18
....- 4.8 0.18
....- 4.8 0.1819.1 3.12 19.1 0.73
14.4 2.34 9.6 0.37
....- 14.4 0.554.8 0.78 ....-
....- 4.8 0.189.6 1.56 23.9 0.92
28.7 4.69 57.4 2.20
4.8 0.78 ....-
....- 4.8 0.18
....- 4.8 0.18
....- 4.8 0.18
....- 4.8 0.18
52.6
4.8
4.8 0.48
100.5 10.05
28.7 2.87
14.4 1.44
143.5 14.35
5.26
0.48

Table 9 (cont.)
LOCATION 1 LOCATION 2 LOCATION 3 LOCATION 4
TAXA
Leptodea fragilisDreissena polymorpha
TOTAL BENTHOS (#/m 2 )
TOTAL TAXA RICHNESS
EPT TAXA RICHNESS
aTaxon absent.
4.8 0.79....- 4.8 0.18
607.520
4
100 612.316
3
100 2607.229
5
100 999.817
3
100

Table 10. Density (#/m 2) and relative abundance (%) for benthic macroinvertebrate taxacollected in Ponar samples near LaSalle Station - August 1999. (EA 2000)
LOCATION 1TAXA #/m 2
__ _
LOCATION 2 LOCATION 4
Aulodrilus limnobiusAulodrilus pigueti
Pristina/Pristinella
Stephensoniana trivandrana
Branchiura sowerbyi
Ilyodrilus ternpletoni
Limnodrilus cervix
Limnodrilus hoffmeisteriLimnodrilus profundicola
Limnodrilus udekemianusImm. tub. w/bifid chaetae
Imm. tub. w/hair & pectinate chaetae
CentroptilumHexagenia limbata
Stylurus notatus
Du bira phia
Chironomidae
Cryptochironomus
Dicrotendipes neomodestus
Paratendipes basidensPolypedilum halterale grp.
Corbicula fluminea
TOTAL BENTHOS (#/m2 )
TOTAL TAXA RICHNESS
EPT TAXA RICHNESS
-• = Taxon absent
9.6-- 9.6 0.46
1.37 19.1 0.91
72
-- -- 9.6
.. ..- 162.6
96 1.37 220.1'6.5 10.96 229.6
!8.7 4.11 38.396 1.37 28.7
62.6 23.29 1100.3
....- 28.7
....- 9.6
....- 9.6q 1 •7 --
0.46
7.76
10.5010.96
1.83
1.37
52.51
1.37
0.46
0.46
9.619.1
9.6
47.8
19.1
95.7
181.8
19.1.
1004.6
67.0
19.1
0.531.050.53
2.63
1.055.26
10.00
1.0555.26
3.68
1.05
€
9.6191.4
9.6
133.9
47.8
698.4
10
0
1.3727.40
1.37
19.18
6.85
47.8
181.8
2.28 124.4-- 9.6
8.68 191.4
100 1817.8
12
1
6.84
0.53
10.5
100100 2095.3121

Table 11. Pre-operational HD mean density (#/m 2) and total taxa richness for Locations1 - 4 on the Illinois River, 1974 - 1978. (Bio-Test 1975; Nalco 1976,1977, 1978; and
Hazelton 1979)
Locations
Sample Year/Event 1 2 3 4
1974February
Mean Density 30 15 25 --
Total Taxa Richness 5 3 4 --
May
Mean Density 1,355 1,320 2,330 --
Total Taxa Richness 15 12 18 --
August
Mean Density 4,330 3,435 5,800 5,285
Total Taxa Richness 23 25 23 25
November
Mean Density 2,620 2,760 2,770 2,130
•Total Taxa Richness 20 16 18 16
1975February
Mean Density -- 65 305 80Total Taxa Richness -- 6 13 10
MayMean Density 1,250 985 1,235 1,040
Total Taxa Richness 16 17 21 11
August
Mean Density 2,635 2,745 4,575 2,175
Total Taxa Richness 34 30 29 29
NovemberMean Density 2,445 3,570 2,940 1,820
Total Taxa Richness 19 21 22 22
1976February
Mean Density 195 150 330 120
Total Taxa Richness 12 13 15 9
MayMean Density 945 975 1,105 1,100
Total Taxa Richness 11 9 15 10
August.Mean Density 1,755 1,655 1,595 1,285Total Taxa Richness 22 26 28 25
NovemberMean Density 1,465 3,650 3,585 2,920Total Taxa Richness 19 19 19 13

Table 11 (cont.)
LocationsSample Year/Event 1 2 34
1977February
Mean Density 85 70 -- 80
Total Taxa Richness 4 4 -- 4May
Mean Density 10,500 10,785 9,385 8,150
Total Taxa Richness '20 21 23 20
August
Mean Density 8,325 8,070 13,410 6,360
Total Taxa Richness 17 16 15 13November
Mean Density •1,620 860 2,295 800.
Total Taxa Richness 19 15 21 12
1978February
Mean Density 180 100 -- 115Total Taxa Richness 3 6 -- 7 _
MayMean Density 3,680 3,335 1,370 635
Total Taxa Richness 15 15 14 10
AugustMean Density 3,510 3,893 2,210 3,535Total Taxa Richness 30 30 29 27
November
Mean Density 3,515 3,655 1,820 2,195
Total Taxa Richness 22 27 27 17

Table 12. Pre-operational Ponar and dip net mean density (#/m2) and total taxa richnessfor Locations 1 - 4 on the Illinois River and Locations 5 and 6 on South KickapooCreek, 1974 - 1978. (Bio-Test 1975; Nalco 1976,1977, 1978; and Hazelton 1979)
Sample Year/Event
Locations123 4 56
1974February
Mean Density
Total Taxa Richness
May
Mean Density
Total Taxa Richness
August
Mean Density
Total Taxa Richness
November
Mean Density
Total Taxa Richness
1975February
Mean Density
Total Taxa Richness
May
Mean Density
Total Thxa Richness
August
Mean Density
Total Taxa Richness
November
Mean Density
Total Taxa Richness
1976February
Mean Density
Total Taxa Richness
MayMean DensityTotal Taxa Richness
AugustMean DensityTotal Taxa Richness
November
Mean DensityTotal Taxa Richness
1,21510
627
2749
6589
39412
1,999 3,270 1,76822 32 32
806
359
10
148
5
254
22
346
9
297
7
203
7
74716
6298
4828
1,27721
97818
49216
84612
45422
61015
1,09721
538
1,87528
87926
1,65815
2,68333
22516
66215
11010
1,01942
1,33817
37416
34516
916
46716
2,34514
381
28517
1,25327
4,79137
2846
1197
32613
522
1,04026
1,696 2,•32520 31
907
326
9
246
7
43512
24613
27410
41115
40212
994
31713
33110
22712
52027
29312
19812
1569
11312
46810
3786
4398

Table 12 (cant.)
Locations
Sample Year/Event
1977February
Mean Density
Total Taxa Richness
May
Mean DensityTotal Taxa Richness
August
Mean Density
Total Taxa Richness
November
Mean Density
Total Taxa Richness
1978February
Mean DensityTotal Taxa Richness
May
Mean DensityTotal Taxa Richness
August
Mean DensityTotal Taxa Richness
November
Mean DensityTotal Taxa Richness
1 2 3 4 5 6
3,63814
5,9729
3,56310
8227
4,470 4,84819 14
3,48223
12,97013
1,87123
2,56114
9,05312
4,71612
1,5459
5,330 4,87110 10
5,741 5,273 2,73613 18 24
1,39410
1,60210
1,24315
72313
2228
88820
3878
35412
50114
2,42421
6,26532
2507
32113
44411
18910
47714
869
13
1,61636
43021
42520
1,85819
47726
170
13
893
16
430
11
57612
1,32815

APPENDIX A
LaSalle County Station Fish DataAugust 2013

APPENDIX A - LaSa lie Station Fish DataSITE: ILLINIOS RIVER GEAR: ELECTRO LOCATION: 1 SAMPLING DISTANCE (in): 500 SAMPLING DURATION (min): 29START DATETIME: 13AUG13:12:32 END DATETIME: 13AUG13:13:01
LENGTH WEIGHT PLUSSPECIES Wr (ims) (g) COUNT
GIZZARD SHAD 78 255 .140GIZZARD SHAD 88 228 110GIZZARD SHAD 95 240 140GIZZARD SHAD 87 225 105GIZZARD SHAD 85 259 160GIZZARD SHAD 89 260 170GIZZARD SHAD 101 215 105GIZZARD SHAD 94 229 120GIZZARD SHAD 85 248 140GIZZARD SHAD 135 29CENTRAL STONEROLLER1EMERALD SHINER 1SPOTFIN SHINER 9SMALLMOUTH BUFFALO 80 370 700
SMALLHOUTH BUFFALO 73 379 685GOLDEN REDHORSE 365 440GOLDEN REDHORSE. 271 210SHORTHEAD HEDHORSE 76 355* 390SHORTHEAD REDHORSE 70 385 460CHANNEL CATFISH 102 500 1250GREEN SUNFISH- 55 4BLUEGILL 110 90 14BLUEGILL 118 88 14SHALLHOUTH BASS 85 195 85SMALLMOUTH BASS 100 242 200SNALLMOUTH BASS 145 39LARGEHOUTH BASS 88 288 300FRESHWATER DRUM 84 475 1200
BATCHWEIGHT ANOMALY 1 ANOMALY 2 ANOMALY 3
22
17*Missing Scales*Regen. Scales
Regen. Scales
*Regen. Scales
*Moderate Erosion Regen. Scales Other
SITE: ILLINIOS RIVER GEAR: ELECTRO LOCATION: 2 SAMPLING DISTANCE (m): 500 SAMPLING DURATION (mink: 30START DATETINE: 13AUG13:10:40 END DATETINE: 13AUG13:11:10
SPECIES
GIZZARD SHADGIZZARD SHADGIZZARD SHADGIZZARD SHADGIZZARD SHADGIZZARD SHADGIZZARD SHADGIZZARD SHADGIZZARD SHADGIZZARD SHADGIZZARD SHADGIZZARD SHADGIZZARD SHADGIZZARD SHADGIZZARD SHADGIZZARD SHADGIZZARD SHADGIZZARD SHADGIZZARD SHADGIZZARD SHADGIZZARD SHADGIZZARD SHADGIZZARD SHADGIZZARD SHADGIZZARD SHADGIZZARD SHADCOMMON CARPEMERALD SHINERSPOTFIN SHINERSMALLMOUTH BUFFALOSMALLMOUTH BUFFALOSMALLMOUTH BUFFALOGOLDEN REDHORSEGOLDEN REDHORSECHANNEL CATFISHLARGEMOUTH BASSFRESHWATER DRUMFRESHWATER DRUM
Wr
7382
105103
79100103101
9693
101979690949384
100787682989877
91
8184
80908893
LENGTH WEIGHT(nsm) (g)
345 340192 60195 80210 100209 75205 90196 80215 105175 66202 82198 75180 60227 120208 90211 88202 80214 95200 70204 88264 155284 192285 210250 165212 98215 80
550 2100
430 1050425 1100356 650390 480200 91365 350274 260512 1610435 1010
PLUSCOUNT
3
14
BATCHWEIGHT
320
ANOMALY 1 ANOMALY 2 ANOMALY 3
Regen. Scales
Regen. Scales
FungusSlight Erosion Other
A-i

SITE: ILLINIOS RIVER GEAR: SEINESTART D)ATETIME: 12AUG13:18:53
SPECIES
EMERALD SHINEREMERALD SHINEREMERALD) SHINERBIGZ4OUTH SHINERROSYFACE SHINERSPOTFIN SHINERSPOTFIN• SHINERSPOTFIN SHINERSAND SHINERSAND SHINERNatropis sp.BULLHEAD MINNOWBULLHEAD MINNOW
SITE: ILLINIOS RIVER GEAR: SEINESTART D•ATETIME: 12AUG13:18:05
SPECIES
EMERALD SHINEREMERALD SHINERSPOTFIN SHINERSPOTFIN SHINERBLUNTNOSE MINNOW
SITE: ILLINIOS RIVER GEAR: SEINESTART DATETIME: 12AUG13:17:55
SPECIES~
GIZZARD SHADGIZZARD SHADGIZZARD SHADGIZZARD SHADGI ZZARD SHADGI ZZARD SHADGIZZARD SHADGIEZARD SHADGIZZARD SHADCENTRAL STONEROLLERS ILVERJAW MINNOWEMERALD SHINEREMERALD SHINEREMERALD SHINEREMERALD SHINEREMERALD SHINERSPOTTAIL SHINERSPOTFIN SHINERSPOTFIN. SHINERSPOTFIN SHINERSAND SHINERSAND SHINERSUCEERMOUTH MINNOWBLUNTNOSE MINNOWBULLHEAD MINNOWBROOK SILVERSIDESMALLMOUTH BASS
APPENDIX A (cont.)LOCATION: 1 SAMPLING DISTANCE (m):
END DATETIME: 12AUG13:19:04SAMPLING DURATION (rai) : ii
LENGTH WEIGHT PLUSWr (mmn) (g) COUNT
* * 112* . 22* . . 23* * * 2* * * 2* * * 6
BATCHWEIGHT ANOMALY 1 ANOMALY 2
15552-1-16
ANOMALY 3
3 158 35 223 6 1
1 1* 6 1* * * 1 1
LOCATION: 2 SAMPLING DISTANCE (in):END DATETIME: 12AUG13:18:41
SAMPLING DURATION (min): 36
LENGTH WEIGHT PLUSWr (nf) (g) COUNT
* * * 34* * * 2* . 24- . * 3
BATCHWEIGHT ANOMALY 1 ANOMALY 2 ANOMALY 3
331
351
2 4
LOCATION: 5 SAMPLING DISTANCE (mn): * SAMPLING DURATION (min): 15END DATETIME: 12AUG13:1B:10
WrLENGTH WEIGHT PLUS
(mm) (g) COUNT
113 1586 797 1195 10
106 14102 12
90 9
BATCHWEIGHT ANOMALY 1 ANOMALY 2 ANOMALY 3
* 96 10
* * - i00* * * 401* * * 313
11* * * 5* * * 5
* * * 25
91 187 79
4-
53
206826644
12
1521
1313
3416
A-2

APPENDIX B
LaSalle County Station Benthic Macroinvertebrate DataAugust 2013
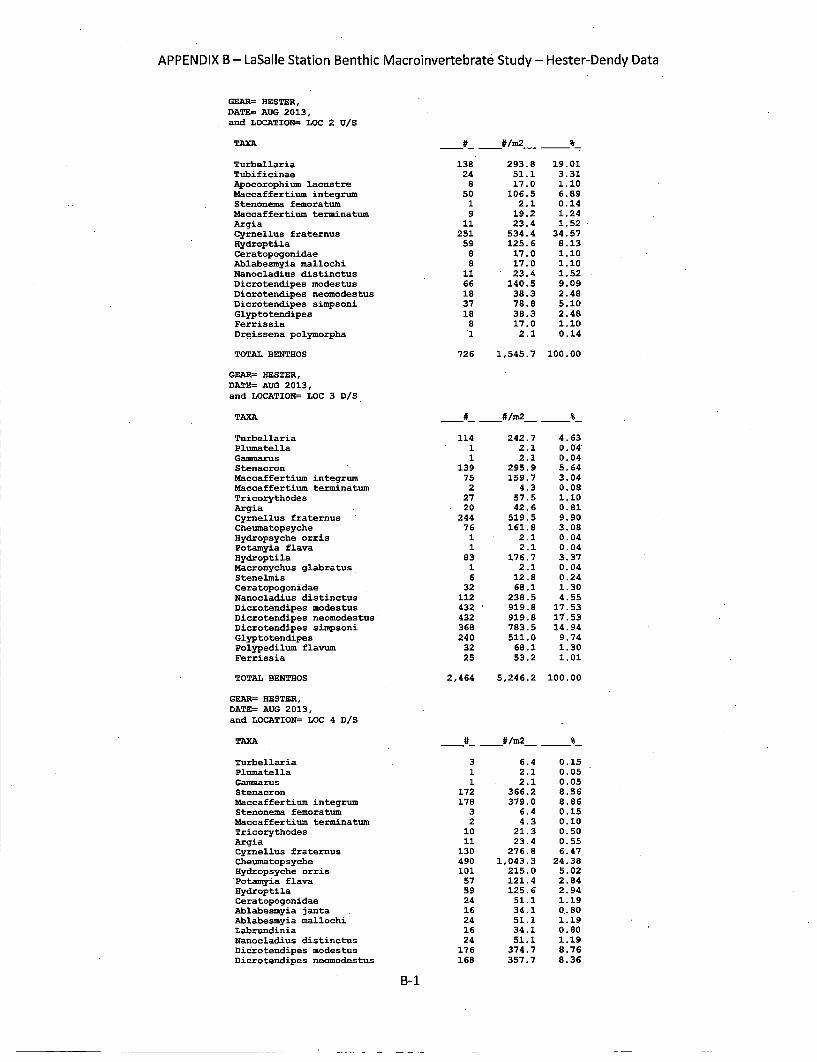
APPENDIX B - LaSalle Station Benthic Macroinvertebrate Study - Hester-Dendy Data
GEAR= HESTER,DATE= AUG 2013,and LOCATION= LOC 2 U/S
TmX *# __#/zn2_ %__
Turbellaria 138- 293.8 19.01Tubificinae 24 51.1 3.31Apocorophium lacustre 8 17.0 1.1I0Maccaffer tium integrum 50 106.5 6.89Stenonema femoratum 1 2.1 0.14Maccaffertium terminatum 9 19.2 1. 24Argia 1i 23.4 1. 52Cyrnellus fraternus 251 534.4 34.57Hydroptila 59 125.6 8.13Ceratopogonidae 8 17.0 1.1i0Ablabesmyia mallachi 8 17.0 1.1i0Nanocladius distinctus 11 23.4 1.52Dicrotendipes modestus 66 140.5 9.09Dicrotendipes neomodestus 18 38.3 2.48Dicrotendipes simpsoni 37 78.8 5.1i0Glyptotendipes 18 38.3 2.48Ferrissia 8 17.0 1.1I0Dreissena polymorpha 1i 2.1 0.14
TOTAL BENTHOS 726 1,545.7 100.00
GEAR= HESTER,DATE= AUG 2013,and LOCATION= LOC 3 D/S
TmX #__* __#/zn2_ %__
Turbellaria 114 242.7 4.63Plumatella 1 2.1 0.04"Gammarus 1 2.1 0.04Stenacron 139 295.9 5.64Maccaffertium integrum 75 159.7 3.04Maccaffertiuma terminatum 2 4.3 0.08Tricorythodes 27 57.5 1.1I0Argia 20 42.6 0.81Cyrnellus fraternus 244 519.5 9.90Cheumatopsyche 76 161.8 3.08Hydropsyche orris 1 2.1 0.04Potamyia flava 1 2.1 0.04Hydroptila 83 176.7 3.37Macronychus glabratus 1 2.1 0.04Stenelmis 6 12 :8 0.-24Ceratopogonidae 32 68.1 1. 30Nanocladius distinctus 112 238.5 4.55Dicrotendipes modestus 432 ' 919.8 17.53Dicrotendipes neomodestus 432 919.8 17.53Dicrotendipes sizspsoni 368 783.5 14.94Glyptotendipes 240 511.0 9.74Polypedilum flavum 32 68.1 1. 30Ferrissia 25 53.2 1. 01
TOTAL BENTHOS 2,464 5,246.2 100.00
GEAR= HESTER,DATE= AUG 2013,and LOCATION= LOC 4 D/S
TmX __#_ __#/ni2_ %__
Turbellaria 3 6.4 0.15Plumatella 1 2.1 0.05Gairrnarus 1 2.1 0.05Stenacron 172 366.2 8.56Maccaffertium integrum 178 379.0 8.86Stenonema femoratum 3 6.4 0.15Maccaffertium terminatum 2 4.3 0.1I0Tricorythodes 10 21.3 0.50Argia 11 23.4 0.55Cyrnellus fraternus 130 276.8 6.47Cheumatopsyche 490 1,043.3 24.38Hydropsyche orris 101 215.0 5.02Potamyia flaya 57 121.4 2.84Hydroptila 59 125.6 2.94Ceratopogonidae 24 51.1 1.19Ablabesmyia janta 16 34.1 0.80Ablsbesmyia msallochi 24 51.1 1. 19Labrundinia 16 34.1 0.80Nanocladius distinctus 24 51.1 1.19Dicrotendipes modestus 176 374.7 8.76Dicrotendipes neomodestus 168 357.7 8.36
B-i

APPENDIX B (cont.)
Dicrotendipes sjimpsoni 152
Glyptotendipes 128Palypedilum flavum 24Rheotanytarsus 40
323.6272.5
51.185.2
7.566.371.191.99
TOTAL BENTHOS 2,010 4,279.5 100.00
LASALLE STATION BENTHIC X4ACROINVERTEBRATE STUDY - PONAR DATA
GEAR= PONAR,DATE= AUG 2013,and LOCATION= LOC 1
TAm 0 #__/sQ ___
Urnatella gracilisTubificinaeHyalella aztecaApocorophium lacustreProcloeonCaenisHexageniaOecetisDubiraphiaChaoborusProcladiusAblabesmyia mallochiCryptochironomusDicrotendipes sisipsoniParacladopelmaPolypedilum halterale grp.Polypedilum scalaenum grp.ElimniaCorbicula flumineaLeptodea fragilis
TOTAL BENTHOS
1 4.862 296.6
1 4.81 4.81 4.82 9.61 4.82 9.61 4.81 4.81 4.81 4.8
14 67.02 9.64 19.1
15 71.83 14.46 28.77 33.51 4.8
0.7948.820.790.790.791.570.791.570.790..790.790.79
11.021.573.15
11.812.364.725.510.79
127 607.5 100.00
GEAR= PONAR,DATE= AUG 2013,and LOCATION= LOC 2
TmX 0 #__/m2_ %__
TubificinaePlacobdellaApocorophium lacustreHydracarinaCaenisHexageniaOecetis.ProcladiusChironomusDicrotendipes neomodestusPolypedilumi halterale grp.Polypedilumi scalaenum grp.TanytarsusElimiaCorbicula flumiineaSphaeriuxn
TOTAL BENTHOS
41 196.11 4.8
42 200.91 4.82 9.61 4.81 4.83 14.4
17 81.32 9.64 19.13 14.41 4.82 9.66 28.71 4.8
32.030.78
32.810.781.560.780.782.34
13.281.563.122.340.781.564.690.78
128 612.3 100.00
GEAR= PONAR,DATE= AUG 2013,and LOCATION= LOC 3
TmX # /m2 %__
TubificinaeHyalella aztecaGasmarusApocorophiumi lacustreStenacronCaenisCyrnellus fraternusHydroptilaOecetisStenelmisAblabesmyia mallochiAxarusChironomusCryptochironomusDicrotendipes neomodestusDicrotendipes luciferGlyptotendipes
63 301.41 4.87 33.5
383 1,832.21 4.89 43.19 43.12 9.64 19.13 14.42 9.62 9.65 23.9
13 62.26 28.71 4.81 4.8
11.560.181.28
70.280.181.651.650.370.730.550.370.370 .92
2.391.100.180.18
B-2

APPENDIX B (cont.)
ParacladopelmaPolypedilum halterale grp.Polypedilum scalaenum grp.PseudochironomusXenochironomusElimiaCorbicula flumineaUnionidaeAmblema plicataQuadrula pustulosaObliquaria reflexaDreissena polymorpha
TOTAL BENTHOS
1 4.84 19.12 9.63 14.41 4.85 23.9
12 57.41 4.81 4.81 4.81 4.81 4.8
0.180.730.370.550.180.922.200.180.180.180.180.18
545 2,607.2 100.00
LASALLE STATION BENTHIC NACROINVERTEBRATE STUDY - PONAR DATA
GEAR= PONAR,DATE= AUG 2013,and LOCATION= LOC 4
TAX *_ __#1ms2_ _
TmXTubificinaeNyalella aztecaGamsmarusApocorophium lacustreCaenisHexageniaStylurusCyrnellus fraternusAblabesmyia msallochiCryptochironomusDicrotendipes neomodestusParacladopelmtaPolypedilumn halterale grp.Polypedilum scalaenum grp.ElimiaCorbicula fluminea
122 583.61 4.85 23.92 9.61 4.81 4.82 "9.61 4.81 4.8
11 52.61 4.81 4.8
21 100.56 28.73 14.4
30 143.5
58.370.482.390.960.480.480.960.480.485.260.480.48
10.052.871.44
14.35
TOTAL BENTHOS 209 999.8 100.00
B-3