equity theory and fair inequality: a neuroeconomic study earned money by working, and a neuronal...
TRANSCRIPT

Discussion paper
SAM 19 2015ISSN: 0804-6824August 2015
INSTITUTT FOR SAMFUNNSØKONOMI
DEPARTMENT OF ECONOMICS
This series consists of papers with limited circulation, intended to stimulate discussion.
Equity theory and fair inequality: a neuroeconomic study
BYAlexander W. Cappelen, Tom Eichele, Kenneth Hugdahl,Karsten Specht, Erik Ø. Sørensen AND Bertil Tungodden

Equity theory and fair inequality: aneuroeconomic study
Alexander W. Cappelen1, Tom Eichele2,3, Kenneth Hugdahl2,4,5,6,7,Karsten Specht2,8, Erik Ø. Sørensen1, and Bertil Tungodden1
1Department of Economics and The Choice Lab, NHH NorwegianSchool of Economics
2Department of Biological and Medical Psychology, University ofBergen, Norway
3Department of Neurology, Section for Clinical Neurophysiology,Haukeland University Hospital, Bergen, Norway
4Division of Psychiatry, Haukeland University Hospital, Bergen,Norway
5Department of Radiology, Haukeland University Hospital, Bergen,Norway
6KG Jebsen Center for Neuropsychiatric Disorders, University ofBergen, Norway
7NORMENT, Center of Excellence, University of Oslo, Norway8Department of Clinical Engineering, Haukeland University
Hospital, Bergen, Norway
1

Abstract
The present paper reports results from the first study designed to ex-amine the neuronal responses to income inequality in situations in whichindividuals have made different contributions in terms of work effort. Weconducted an experiment that included a prescanning phase in which theparticipants earned money by working, and a neuronal scanning phase inwhich we examined how the brain responded when the participants evalu-ated different distributions of their earnings. We provide causal evidenceof the relative contribution of work effort being crucial for understandingthe hemodynamic response in the brain. We found a significant hemody-namic response in the striatum to deviations from the distribution of incomethat was proportional to work effort, but found no effect of deviations fromthe equal distribution of income. We also observed a striking correlationbetween the hemodynamic response in the striatum and the self-reportedevaluation of the income distributions. Our results provide the first set ofneuronal evidence for equity theory and suggest that people distinguish be-tween fair and unfair inequalities.
Keywords: fairness; inequality; striatum; equity theoryJEL Code: D63
The study of inequality, its sources and consequences, has been a core issue inall of the social sciences and in the philosophical literature on distributive justice.Important normative theories have argued that income inequalities are inherentlyunfair (Rawls, 1971), whereas other theories, in particular libertarianism and lib-eral egalitarian theories of justice (Nozick, 1974; Dworkin, 1981; Arneson, 1989;Roemer, 1998), argue that income inequalities can be fair if they reflect morallyrelevant differences. This theoretical debate is mirrored in the political debate ontax, welfare, and health policies, where a key question is whether some inequal-ities should be accepted as fair. In particular, a core issue in the design of taxand welfare policies is how to handle income inequalities caused by differencesin work effort, productivity or risk-taking. Similar issues arise in the discussionof how to handle inequalities in health due to life style choices. Moreover, inthe private sector, heated debates about the fairness of workplace inequalities inearnings are common (Card et al., 2012).
Preferences for income distribution have been extensively studied in both con-trolled economic experiments and surveys, and the nature of such preferences hasbecome one of the major questions in behavioral research in social psychology andeconomics. Important papers in behavioral economics have studied how peoplerespond to different income distributions and have documented, using economicexperiments, that people dislike unequal outcomes and are willing to make a trade-off between their own income and equality Fehr and Schmidt (1999); Bolton andOckenfels (2000); Engelmann and Strobel (2004). An extensive and influential
2

literature on equity theory in social psychology has studied how perceptions offairness in social situations depend on the relationship between input and output.The main result reported in this literature is that people find it fair that the in-come (output) of a person is in proportion to the work effort (input), and that theydislike deviations from a proportional distribution (Adams, 1965; Walster et al.,1973; Leventhal, 1980). In line with equity theory, more recent papers in behav-ioral economics, studying distributive behavior in situations in which people haveearned the money being distributed, have found that the majority of people acceptincome inequalities as fair if the inequalities correspond to differences in contri-butions (Cappelen et al., 2007, 2010, 2013; Frohlich et al., 2004; Konow, 2000).Thus, there is evidence suggesting that people are averse both to deviations froman equal income distribution and to deviations from an income distribution in pro-portion to work effort.
An important neuroeconomic study by Tricomi et al. (Tricomi et al., 2010)provided suggestive neuronal evidence of inequality aversion. There is, however,no direct neural evidence of how the brain evaluates an income distribution in sit-uations in which people have made different contributions in terms of work effort.The present paper reports from the first neuroimaging study designed to examinehow the brain responds to the distribution of income in such situations. As such, itis also the first study to examine the neuronal basis for equity theory. We focus ontwo main questions. First, we examine whether a person’s contribution in termsof work effort affects the way in which the brain’s reward system responds to dif-ferent income distributions. Addressing this question also allows us to examinehow the brain’s reward system responds to deviations from a proportional incomedistribution, and to compare this response with the response to deviations from anequal income distribution and to an increase in own income. Second, we studyhow the hemodynamic response in the brain to distributions of earned incomecorrelates with the self-reported evaluations of the same income distributions.
To address these questions, we designed an experiment with two phases: aprescanning phase, in which the participants earned money by working on a real-effort task, and a scanning phase, in which we used functional magnetic resonanceimaging (fMRI) to examine how different regions of the brain responded when theparticipants evaluated different distributions of their earnings. The participantswere 47 male students from the Norwegian School of Economics.
In the prescanning phase of the experiment, each participant was randomly as-signed to work on repetitive office work, stuffing envelopes, and entering recordsinto a database, for a specific length of time. Roughly half of the participants(23 subjects) were randomly assigned to work for 60 min, whereas the remainingparticipants were randomly assigned to work for either 30 or 90 min (12 subjectsin each group). All participants were told that their earnings would be based onan hourly wage of 500 NOK (approximately 85 USD), but that a random process
3

could interfere so that their final payment would not necessarily be the same astheir earnings.
In the scanning phase, the participants where matched with another participantand each pair worked for 120 min in total and the sum of their earnings was 1000NOK. We had three conditions that differed only with respect to how much theparticipant in the scanner had contributed in terms of work effort. In the 30:90condition, the participant in the scanner had worked for 30 min and was matchedwith someone who had worked 90 min. Participants in the 60:60 condition hadworked for 60 min and was matched with someone who had also worked for 60min, and the participant in 90:30 condition had worked 90 min and was matchedwith someone who had worked 30 min. For the participant in the scanner, theshare of total work effort in the three conditions was thus either 25%, 50% or75% depending on the condition.
While inside the MR-scanner, the participants rated a sequence of 51 possibledistributions of the total earnings on a scale that ranged from very bad (-5) tovery good (+5). How much each participant in the pair had contributed in termsof work effort and earnings was common knowledge. Interspersed with the ratingtrials were 30 control trials. In the control trials, no income distribution was shownand the task of the participants was only to tick off a specific number on the ratingscale. The control trials allowed us to distinguish between the neural responsethat resulted from motor and visual stimulation when ticking off a number on therating scale and the neural response that resulted from the subjective evaluation ofan income distribution.
A key feature of the design was that participants who disliked deviations froma proportional income distribution would respond differently to an increase in ownincome depending on which condition they were in. For such participants, an in-crease in own income beyond 250 NOK would have two counteracting effects inthe 30:90 condition: they would like getting more money for themselves, but theywould dislike the increase in the deviation from a proportional income distribu-tion. For a participant in the 90:30 condition, however, an increase in their ownincome would result in both more money for themselves and a reduction in thedeviation from a proportional income distribution, as long as their own incomewas below 750 NOK. We would therefore predict that participants in the 90:30condition valued an increase in own income more than did participants in the30:90 condition for own income ranging between 250 and 750 NOK (Prediction1). Similarly, we would predict that participants in the 60:60 condition valued anincrease in own income more than did those in the 30:90 condition in the intervalbetween 250 and 500 NOK (Prediction 2), and that they valued an increase in ownincome less than did those in the 90:30 condition in the interval between 500 and750 NOK (Prediction 3).
4

1 ResultsFigure 1 shows the average subjective rating of the income distributions as a func-tion of own income for the participants in the three conditions. The participants inthe three conditions had earnings of 250, 500 and 750 NOK respectively, as indi-cated in the figure. We observe that the way in which participants evaluate a givenincome distribution differ between the conditions. We also note that the subjectiveratings flatten out and, strikingly, even tend to drop, when the participant receiveda share of total income that was much larger than their earnings. The subjectiveratings also show that the participants evaluated income inequalities very differ-ently in the three conditions. For example, the income inequality (250 NOK, 750NOK) was given a neutral rating by the participants who had worked for 30 min(where the inequality corresponded to differences in earnings); in contrast, it wasgiven a highly negative rating by the participants who had worked for 60 or 90min (where the inequality did not correspond to differences in earnings).
In the study of the neuronal underpinnings of the behavioral results, we fo-cus on the response in the striatum. The striatum is a key part of the emotionalcircuitry of the brain and plays an important role in motivating and regulating be-havior (Kompus et al., 2012). Furthermore, the striatum has been associated withsocial preferences and moral choices in many earlier studies (Bartels and Zeki,2000; Bault et al., 2011; Harbaugh et al., 2007; Hsu et al., 2008; Fliessbach et al.,2007; Lane et al., 1997; Moll et al., 2006; Sanfey, 2007; Tabibnia et al., 2008; Tri-comi et al., 2010). In the striatum we identify the left and the right caudate nucleusas regions of interest because experimental trials produced significantly differentblood- oxygen-level-dependent (BOLD) response compared with control trials inthese two regions. Both regions are indicated in Figure 2A. For the two striatalregions we find a significant negative correlation between the subjective ratingsand the BOLD response (p < 0.01 for both regions), which means that decreasedblood activation in these regions is associated with increased subjective valuation.
In Table 1, we test whether the BOLD response in the two striatal regions andthe subjective rating are in line with our three predictions. Columns 1-3 report theresults from regressions testing the prediction that participants who worked for 90min have a stronger response to an increase in own income than do participantswho worked 30 min (Prediction 1). We find that this indeed was the case: themarginal effect of own income on both the BOLD response and the subjectiverating was smaller for those participants who worked for 30 min than it was forthose who worked for 90 min in the relevant interval of own income. The differ-ence between the two conditions is statistically significant for the subjective rating(p = 0.016) and for the left caudate nucleus (p = 0.043), but not for the right cau-date nucleus (p = 0.141). The difference in the marginal effects of own income isillustrated in Figure 2B. The results reported in columns 4-6 and columns 7-9 also
5

provide support for our two additional predictions. In the relevant intervals of ownincome, we find that the response to an increase in own income for participantswho worked for 60 min is stronger than for those who worked for 30 min, whichis in line with Prediction 2 (subjective rating, p = 0.017; left caudate nucleus,p = 0.075; and right caudate nucleus, p = 0.150), and weaker than for those whohad worked 90 min, which is in line with Prediction 3 (subjective rating, p < 0.01;left caudate nucleus, p = 0.049; and right caudate nucleus, p = 0.251). Our re-sults thus provide strong causal evidence of the effect of relative work effort onboth the BOLD response in the striatum and the subjective evaluations. The dif-ferences between the three conditions furthermore provide suggestive evidenceof the participants being concerned with deviations from a proportional incomedistribution.
In Table 2 we report the results from regressions in which we directly examinehow the participants respond to deviations from a proportional income distribu-tion. We find that deviation from proportionality is significantly correlated withboth the subjective rating (p < 0.01) and the BOLD response in the two striatalregions (p < 0.01 for the left caudate nucleus, and p = 0.045 for the right cau-date nucleus). We interpret this result as providing the first set of evidence of aneuronal basis for the acceptance of income inequalities that correspond to differ-ences in work effort. The regressions reported in Table 2 also estimate the effectof deviations from equality. We observe that deviations from equality, in contrastwith deviations from proportionality, has no significant effect on the subjectiverating or the BOLD response in the two striatal regions.
Using the estimates in Table 2, we compare the effect of a reduction in thedeviation from proportionality with the effect of an increase in own income. Ourestimates imply that a reduction in the deviation from proportionality of 10 per-centage points results in the same BOLD response as an increase in own incomeof 73 NOK in the left caudate nucleus and the same BOLD response as an increasein own income of 45 NOK in the right caudate nucleus. For the subjective rating,we find that a reduction in the deviation from proportionality by 10 percentagepoints has the same effect as an increase in own income of 34 NOK.
In addition to the two regions in the striatum, we also identified several regionsin the prefrontal cortex where experimental trials produced significantly differentBOLD response from control trials. The analysis of the BOLD responses in theseregions, which is reported in the supplementary material, did not show a clear pat-tern for how these regions respond to own income or to deviations from propor-tionality. However, it is interesting to observe that deviations from proportionalityhad a significant effect on the BOLD response in the left inferior frontal gyrus.This result suggests that cognitive processes in the prefrontal cortex are involvedin the evaluation of fair and unfair inequalities Almas et al. (2010).
6

2 DiscussionThe present study has examined how participants respond to different distributionsof a fixed sum of earned income between themselves and another participants. Wehad three experimental conditions that differed only with respect to the work effortof the participants. We found a strong effect of the conditions on the participantsBOLD response in the striatum to an increase in own income (and a correspondingdecrease in the income to the other participant). We also found strong evidence ofthe participants being concerned with deviations from a proportional income dis-tribution. In contrast, we did not find evidence of participants disliking deviationsfrom an equal income distribution. We interpret this as showing that concerns foroutcome equality is of relatively little importance in situations in which incomehas been earned through work effort. This results is particularly striking since oursample is from a Scandinavian country that is among the most egalitarian coun-tries in the world.
The fact that we did not find any significant BOLD activation in the striatumin response to deviations from equality also sheds light on the neuronal evidenceof inequality aversion that was reported in the paper by Tricomi et al. (2010). Intheir experiment, there was no difference in the participants’ contributions and, asa result, any deviation from an equal distribution would also be a deviation froma distribution in proportion to contributions. Thus, their finding is consistent withour results, because the neuronal response obtained using their design may wellreflect a concern for a proportional distribution of income.
These results can be seen as adding to the literature on the role of social com-parisons in the evaluation of income to self. Bault et al. (2011) showed that thestriatal response to an economic gain depends on whether the gain was smalleror larger than the gain of a counterpart. Our results can be interpreted as show-ing that such social comparisons also take into account the relative contributionof the counterpart. Our results are also complementary to the results reported byVostroknutov et al. (2012), who find that the response in the prefrontal cortex toan income inequality is sensitive to whether the inequality was a result of luck orskill.
Our paper has documented a striking similarity between the effect of our con-ditions on the subjective ratings and on the BOLD response in the striatum. Thesubjective ratings and the BOLD response also provided similar pictures of thetrade-off between own income and deviations from proportionality. We interpretthis as showing that attitudes to income distribution have a neuronal basis in thebrain’s reward system.
7
A materials
A.1 ParticipantsForty-seven neurologically and psychiatrically healthy male individuals took partin this study.1 The mean age was 24.8 years (range, 20–33 years) and six par-ticipants were left-handed. Prior to fMRI measurement, participants gave writ-ten informed consent. The study was performed according to the Declaration ofHelsinki.
When participants arrived for the experiment, they were given a detailed gen-eral information sheet regarding the manner in which the experiment would pro-ceed. The sessions were held over three weekends in the spring of 2011 at Hauke-land University Hospital, and participants were given a participation and trans-portation allowance (450 NOK in total), in addition to the payment from the ex-periment.
Apart from an initial check of signed consent forms, all identification of be-havior and payment in the experiment was based on a random number that eachparticipant drew from a bowl when they arrived for the experiment.
A.2 Behavioral tasksThe experiment consisted of two phases: a prescanning phase, in which the par-ticipants earned income by working on a real-effort task, and a scanning phase,in which we used functional magnetic resonance imaging (fMRI) to examine howdifferent regions of the brain responded when the participants evaluated differentdistributions of their earnings. In the prescanning phase of the experiment, eachparticipant was randomly assigned to work either 30, 60, or 90 min performingrepetitive office work, stuffing envelopes, and entering records into a database.They were told that their earnings would be based on a hourly wage of 500 NOK(approximately 85 USD), but that a random process could interfere so that theirpayment from the experiment would not necessarily be the same as their earnings.
In the scanning phase, the participants were matched with a participant whohad worked either the same length of time, or with a participant who had worked adifferent length of time. The total working time for a pair was always 120 min, thetotal earnings of the pair was always 1000 NOK, and the amount earned by eachparticipant was common knowledge. Each participant was then asked to evaluatea sequence of possible distributions of the total earnings between the two of themon a scale from very bad (-5) to very good (+5). See Figure S1 in the supplemen-tary material for screenshots. In total they made 51 such evaluations. Since the
1Forty-eight students were recruited, but one did not show up.
8

participants evaluated ex post distributions of the earned income, there were noincentive effects of the different distributions; therefore, efficiency considerationsdid not affect the evaluations. Interspersed with the rating trials were 30 controltrials. In the control trials, no income distribution was shown and the task of theparticipants was only to tick off a specific number on the rating scale.
The number of seconds at each stage is indicated in the screenshots in the sup-plementary material for a sequence of one experimental trial and one control trial(Figure S1): 1 s for fixation, 2 s for showing the income distribution, 4 s for evalu-ating the income distribution on the rating scale (or ticking off a number in case ofthe control trials), and an interval between trials of varying length (randomly dis-tributed between 1 and 7 s) to increase temporal resolution. This averaged 11 s pertrial (range, 8 - 14 s). Before entering the scanner, the screenshots were explainedto the participants and they were trained on using the handgrip that controlled theinterface. The hand that was used to hold the grip for the experimental interfacewas randomly allocated.
A.3 Image AcquisitionData acquisition was performed on a 3T GE Signa Excite scanner. Thirty slices (3mm thickness, 2.3×2.3×2.3 mm voxel size, 0.3 mm interslice gap) were obtainedin an interleaved fashion parallel to the anterior commissure – posterior commis-sure (AC-PC) line, using a single-shot gradient echo-planar imaging (EPI) se-quence (repetition time, 2000 ms; echo time, 30 ms; bandwidth, 116 kHz; flip an-gle, 90◦; 96×96 pixel matrix; field of view 220 mm). Prior to functional scanning,a high-resolution anatomical brain image was recorded from each participant.
A.4 Image PreprocessingAll image processing and statistical analyses were performed using the statisticalparametric mapping software SPM8. First, all images were realigned to the firstimage in the time-series to correct for head movement, and movement related im-age distortions were corrected by applying an unwarping procedure. Second, theimages were normalized to the Montreal Neurological Institute (MNI) referencespace. The transformation into the MNI space was estimated by warping an av-eraged image, which was created during the realignment procedure, into the MNIspace. Subsequently this transformation was applied to each image of the time se-ries. Normalized data were resliced to a cubic voxel size of 3 mm3 and smoothedwith a Gaussian kernel (8 mm FWHM).
9

A.5 Statistical Parametric MappingThe statistical analysis was based on the general linear model framework, im-plemented in SPM. First, a design matrix was specified, in which the onset andduration of the experimental and control trial were specified. In addition, foreach condition, the trial-by-trial responses were included as an additional regres-sor. The model was fitted to the data by applying a high-pass filter with a cutofffrequency of 128 s. Thereafter, contrasts between the parameter estimates weredefined. Group analyses were estimated by combining these individual contrastsin one-sample t-tests. First, a one-sample t-test was used for comparing the ex-perimental with the control condition. This analysis was performed by applying afamily-wise-error (FWE) corrected statistical threshold of p(FWE)< 0.05 and athreshold of at least 20 voxels per cluster.
A.6 Single-trial DataTo study the neuronal responses to different types of inequality in the regionsof interest, we estimated individual hemodynamic response functions (HRFs) us-ing the method reported in Eichele et al. (2008). For each participant and regionof interest (ROI) separately, the empirical event-related hemodynamic responses(HRs) were deconvolved by forming the convolution matrix of all trial onsets withan assumed kernel length of 20 s, and multiplying the pseudoinverse of this matrixwith the filtered and unit variance normalized ROI time course. Single-trial am-plitudes were recovered by fitting a design matrix containing separate predictorsfor each trial onset, convolved with the estimated HR onto the ROI time course.The single trial weights (scaling coefficients (β ), were estimated using multiplelinear regression.
There was a significant negative correlation between the subjective ratings andthe BOLD response in the two striatal regions (p < 0.01 for both regions). In theanalysis, the sign of the single-trial data was normalized such that the marginalBOLD response to own income in the striatal regions coincided with that of thesubjective ratings.
B Analysis of Single-trial DataThe single trial data were analyzed using Stata, version 13.1, for each region sep-arately.
The estimates of condition contrasts in subjective rating and BOLD responsepresented in Table 1 are based on the following regression:
yit = γi +β1xit +β2(Ti× xit)+ εit , (1)
10

where i index individuals, Ti is a dummy for which condition the individual wasin, and t index trials. All regressions are estimated on the ranges of own income(xit) relevant to the hypotheses that is tested. BOLD responses are normalized toindividual unit variance, and the γis are fixed effects for individuals.
In Table 2 we report an OLS regression of the subjective rating and the BOLDresponse in the left and right caudate nucleus on own income, deviation fromproportionality and deviation from equality. The regression is given by
yit = γi +β1xit +β2|xit−mi|
max |xit−mi|+β3|xit−500|
500+ εit , (2)
where mi is the participants earnings, |xit −mi| is the deviation from a propor-tional income distribution, and |xit − 500| is the deviation from an equal incomedistribution.
Acknowledgments: We are grateful to Dan Benjamin, Colin Camerer, Marja-Liisa Halko, Magnus Johannesson, Shachar Kariv and Arno Riedl for valuablecomments; Turid Randa and Roger Barndon for radiographic work; Heike Eichele,Sebastian Fest, Anja Haukeland, and Kristin Henriksen for excellent research as-sistance. This project was financed by the Research Council of Norway (grant185831) and was administered by The Choice Lab, NHH Norwegian School ofEconomics.
ReferencesAdams, Stacy J. (1965). “Inequity in social exchange,” Advances in Experimental
Social Psychology, 2: 267–299.
Almas, Ingvild, Alexander W. Cappelen, Erik Ø. Sørensen, and Bertil Tungod-den (2010). “Fairness and the development of inequality acceptance,” Science,328(5982): 1176–1178.
Arneson, Richard (1989). “Equality and equal opportunity for welfare,” Philo-sophical Studies, 56(1): 159–194.
Bartels, Andreas and Semir Zeki (2000). “The neural basis of romantic love,”NeuroReport, 11(17): 3829–3834.
Bault, Nadege, Mateus Joffily, Aldo Rustichini, and Giorgio Coricelli (2011).“Medial prefrontal cortex and striatum mediate the influence of social compari-son on the decision process,” Proceedings of the National Academy of Sciences,108(38): 16044–16049.
11

Bolton, Gary E. and Axel Ockenfels (2000). “ERC: A theory of equity, reciprocity,and competition,” American Economic Review, 90(1): 166–193.
Cappelen, Alexander W., Astri Drange Hole, Erik Ø. Sørensen, and Bertil Tun-godden (2007). “The pluralism of fairness ideals: An experimental approach,”American Economic Review, 97(3): 818–827.
Cappelen, Alexander W., James Konow, Erik Ø. Sørensen, and Bertil Tungodden(2013). “Just luck: An experimental study of risk taking and fairness,” Ameri-can Economic Review, 103(3): 1398–1413.
Cappelen, Alexander W., Erik Ø. Sørensen, and Bertil Tungodden (2010). “Re-sponsibility for what? Fairness and individual responsibility,” European Eco-nomic Review, 54(3): 429–441.
Card, D., Alexandre Mas, Moretti Enrico, and Saez Emmanuel (2012). “Inequalityat work: The effect of peer salaries on job satisfaction,” American EconomicReview, 102(6): 2981–3003.
Dworkin, Ronald (1981). “What is equality? Part 2: Equality of resources,” Phi-losophy and Public Affairs, 10(4): 283–345.
Eichele, Tom, Stefan Debener, Vince D. Calhoun, Karsten Specht, Andreas K.Engel, Kenneth Hugdahl, D Yves von Cramon, and Markus Ullsperger (2008).“Prediction of human errors by maladaptive changes in event-related brain net-works,” Proceedings of the National Academy of Sciences, 105(16): 6173–6178.
Engel, Christoph (2011). “Dictator games: A meta study,” Experimental Eco-nomics, 14(4): 583–610.
Engelmann, Dirk and Martin Strobel (2004). “Inequality aversion, efficiency, andmaximin preferences in simple distribution experiments,” American EconomicReview, 94(4): 857–869.
Fehr, Ernst and Klaus M. Schmidt (1999). “A theory of fairness, competition andcooperation,” Quarterly Journal of Economics, 114(3): 817–868.
Fliessbach, K., B. Weber, P. Trautner, T. Dohmen, U. Sunde, C. E. Elger, andA. Falk (2007). “Social comparison affects reward-related brain activity in thehuman ventral striatum,” Science, 318(5854): 1305–1308.
Frohlich, Norman, Joe Oppenheimer, and Anja Kurki (2004). “Modeling other-regarding preferences and an experimental test,” Public Choice, 119(1-2): 91–117.
12

Harbaugh, William T., Ulrich Mayr, and Daniel R. Burghart (2007). “Neural re-sponses to taxation and voluntary giving reveal motives for charitable dona-tions,” Science, 316(5831): 1622–1625.
Hsu, Ming, Cedric Anen, and Steven R. Quartz (2008). “The right and the good:distributive justice and neural encoding of equity and efficiency,” Science,320(5879): 1092–1095.
Kompus, K., K. Specht, L. Ersland, H. T. Juvodden, H. van Wageningen, K. Hug-dahl, and R. Westerhausen (2012). “A forced-attention dichotic listening fmristudy on 113 subjects,” Brain and Language, 121: 240–247.
Konow, James (2000). “Fair shares: Accountability and cognitive dissonance inallocation decisions,” American Economic Review, 90(4): 1072–1091.
Lane, Richard D., Eric M. Reiman, M. M. Bradley, P. J. Lang, Geoffrey L. Ahern,Richard J. Davidson, and Gary E. Schwartz (1997). “Neuroanatomical corre-lates of pleasant and unpleasant emotion,” Neuropschologia, 35(11): 1437–1444.
Leventhal, Gerald S. (1980). What Should Be Done with Equity Theory?, chap-ter 2, Springer, pp. 27–55.
Moll, Jorge, Frank Krueger, Roland Zahn, Matteo Pardini, Ricardo de Oliveira-Souza, and Jordan Grafman (2006). “Human fronto-mesolimbic networks guidedecisions about charitable donation,” Proceedings of The National Academy ofScience, 103(42): 15623–15628.
Nozick, Robert (1974). Anarchy, State, and Utopia, New York: Basic Books.
Rawls, John (1971). A Theory of Justice, Cambridge, MA: Harvard UniversityPress.
Roemer, John E. (1998). Equality of Opportunity, Cambridge, MA: Harvard Uni-versity Press.
Sanfey, Alan G. (2007). “Social decision-making: Insights from game theory andneuroscience,” Science, 318(5850): 598–602.
Tabibnia, Golnaz, Ajay B. Satpute, and Matthew D. Lieberman (2008). “Thesunny side of fairness: Preferences for fairness activates reward circuitry (anddisregarding unfairness activates self-control circuitry),” Psychological Sci-ence, 19(4): 339–347.
13

Tricomi, Elizabeth, Antonio Rangel, Colin F. Camerer, and John P. O’Doherty(2010). “Neural evidence for inequality-averse social preferences,” Nature,463(7284): 1089–1091.
Vostroknutov, Alexander, Philippe N. Tobler, and Aldo Rustichini (2012). “Causesof social reward differences encoded in human brain,” Journal of Neurophysi-ology, 107: 1403–1412.
Walster, Elaine, Ellen Berscheid, and William G. Walster (1973). “New directionsin equity research,” Journal of Personality and Social Pscychology, 25(2): 151–176.
14

−5
05
(mean)
rating
0 250 500 750 1000Own income
30 vs 90 minutes
−5
05
(mean)
rating
0 250 500 750 1000Own income
60 vs 60 minutes
−5
05
(mean)
rating
0 250 500 750 1000Own income
90 vs 30 minutes
Figure 1: Subjective ratings in the scannerThe graphs show the mean and standard error of the subjective rating in the scan-ner for each of the 51 possible distributions of income. The subjective rating inthe three graphs corresponds to the participants who worked for 30, 60, and 90min, and was matched with participants who worked for 90, 60, and 30 min re-spectively. The participants’ earnings in each condition are indicated by a verticalline.
15

Figure 2: Regions of interestPanel A indicates the two regions in the striatum, the left and right caudate nu-cleus, in which experimental trials produced significantly different blood-oxygen-level-dependent (BOLD) responses from control trials. Other displayed areas areregions that were located outside the striatum in which we also found differencebetween experimental and control trials, that were significant at a family wiseerror (FWE)-corrected threshold of p(FWE) < 0.05, and had at least 10 voxelsper cluster. A complete list of these regions is reported and analyzed in the sup-plementary material. Panel B reports the marginal effect of own income on thesubjective rating and the BOLD response in the left and right caudate nucleus forparticipants in the 30:90 condition and the 90:30 condition in the interval between250 and 750 NOK.
16

Tabl
e1:
Eff
ects
ofth
eco
nditi
ons
Pred
ictio
n1
Pred
ictio
n2
Pred
ictio
n3
BO
LD
BO
LD
BO
LD
Subj
ectiv
eC
auda
tenu
cleu
sSu
bjec
tive
Cau
date
nucl
eus
Subj
ectiv
eC
auda
tenu
cleu
s
ratin
gsle
ftri
ght
ratin
gsle
ftri
ght
ratin
gsle
ftri
ght
Ow
nin
com
e1.
343∗∗∗
1.23
8∗∗∗
1.11
9∗∗∗
1.89
2∗∗∗
1.16
01.
302∗
1.75
1∗∗∗
1.59
9∗∗
0.75
4(0
.153
)(0
.409
)(0
.265
)(0
.165
)(0
.759
)(0
.677
)(0
.348
)(0
.760
)(0
.948
)
Ow
nin
com
e×30
:90
cond
ition
-0.9
19∗∗
-1.1
80∗∗
-0.7
00-1
.306∗∗
-2.1
15∗
-1.5
80(0
.354
)(0
.551
)(0
.459
)(0
.520
)(1
.151
)(1
.073
)
Ow
nin
com
e×
60:6
0co
nditi
on-1
.614∗∗∗
-2.2
13∗∗
-1.3
68(0
.490
)(1
.086
)(1
.170
)St
anda
rder
rors
inpa
rent
hese
s∗
p<
0.1,∗∗
p<
0.05
,∗∗∗
p<
0.01
Not
e:T
heta
ble
repo
rts
OL
Sre
gres
sion
sw
ithin
divi
dual
fixed
effe
cts
ofth
esu
bjec
tive
ratin
gan
dth
eB
OL
D-r
espo
nse
inth
ele
ftan
dri
ghtc
auda
tenu
cleu
son
own
inco
me
and
the
inte
ract
ion
betw
een
own
inco
me
and
cond
ition
s.A
llre
gres
sion
son
lyin
volv
eob
serv
atio
nsfr
omth
ere
leva
ntco
nditi
ons
and
the
rele
vant
inte
rval
s.T
hein
divi
dual
fixed
effe
cts
capt
ure
the
dire
ctef
fect
ofea
chtr
eatm
ent.
Pred
ictio
n1:
the
resp
onse
toow
nin
com
eis
low
erin
the
30:9
0co
nditi
onth
anin
the
90:3
0co
nditi
onon
x 1∈(2
50,7
50).
Pred
ictio
n2:
the
resp
onse
toow
nin
com
eis
low
erin
the
30:9
0co
nditi
onth
anin
the
60:6
0co
nditi
onon
x 1∈(2
50,5
00].
Pred
ictio
n3:
the
resp
onse
toow
nin
com
eis
low
erin
the
60:6
0co
nditi
onth
anin
the
90:3
0co
nditi
onon
x 1∈[5
00,7
50).
Mar
gina
leff
ects
fors
ubje
ctiv
era
tings
are
per1
00N
OK
;for
BO
LD
resp
onse
s,th
eyar
est
anda
rdde
viat
ions
per1
000
NO
K.
17

Table 2: Effects of deviation from proportionalityBOLD
Subjective Caudate nucleus
ratings left right
Own income(in 100s NOK) 1.119∗∗∗ 0.645∗∗∗ 0.632∗∗∗
(0.116) (0.212) (0.194)
Deviation from proportionality -3.777∗∗∗ -4.708∗∗∗ -2.833∗∗
(1.161) (1.611) (1.373)
Deviation from equality 0.372 1.550 -0.468(0.970) (1.698) (1.594)
Standard errors in parentheses∗ p < 0.1, ∗∗ p < 0.05, ∗∗∗ p < 0.01
Note: The table reports OLS regressions of the subjective rating and the BOLD-response in the left and right caudate nucleus on own income, deviation fromproportionality and deviation from equality. Deviation from proportionality anddeviation from equality are measured relative to the maximum deviation possible.BOLD outcomes are measured in units of 1/10 standard deviation.
18

C Supplementary material: The experimentFigure S1 shows the in-scanner screenshots.2
D Supplementary material: Results for all 20 re-gions
We identified 18 regions in addition to the two regions in the striatum, where treat-ment trials produced significantly different BOLD response from control trials. InTable S1–S4 we report all the results that are reported in the main paper for thefull set of 20 regions, together with MNI coordinates.
E Supplementary material: Robustness of the mainresults
In Table S5 we report robustness of the specification of the main model in thepaper (Table 2).
The first three columns of Table S5 report a variation of Table 2 in the mainpaper where we use absolute deviations instead of the “relative to max deviation”formulation used in the main paper:
yit = γi +β1xit +β2|xit−mi|+β3|xit−500|+ εit , (S3)
We observe qualitatively the same pattern as in the paper.The last two columns of Table S5 report on a variant of the Table 2 in the the
main paper in which we include fixed effects for each possible subjective tick-off,(identified by including the control trials) and an indicator for the current trialbeing a control trial (in which all monetary outcomes are zero):
yit = γi +Cit +Rr(it)+β1xit +β2|xit−mi|
max |xit−mi|+β3|xit−500|
500+ εit , (S4)
in which Rr(it) is a dummy indicator for the subjective rating (or forced tick-off) rby individual i in trial t. Again we observe much the same (only slightly attenu-ated) results as reported in the main paper.
2Figures and tables at the end of this document.
19

F Supplementary material: Analysis of the post-scannerdictator game
A concern when conducting distributive games in a scanner is there might bestrong experimenter demand effects since participants might feel particularly scru-tinized. The results from the post-scanner dictator game allow us to address thisconcern. Figure S2 shows the share of the endowment given to the other partic-ipant in the post-scanner dictator game. The mean share given to others is 0.28(standard error 0.03), and 17 out 47 participants gave nothing to the other partic-ipant. This result is similar to the result from earlier experiments with students,which suggests that the the present design did not invoke a strong experimenterdemand effect (Engel, 2011).
Data from the post-scanner dictator game also allow us to examine whetherthe information collected in the scanner is predictive of behavior in a distributivesituation outside the scanner. In Table S6 we observe that is the case: the amountgiven in the dictator game is significantly correlated with both subjective ratingsand BOLD measures in the striatum.
20

(a) Fixation, 1s. (b) Report on income, 2s. (c) Evaluation of income, 4s.
(d) Waiting, random interval. (e) Fixation, 1s. (f) Control for income report, 2s.
(g) Control for evaluation, 4s. (h) Waiting, random interval.
Figure S1: The trials in the scannerIn the scanner, participants were exposed to a total of 51 evaluation trials with different income distributions and 30controls, in a randomized sequence. The panels above show a sub-sequence of one evaluation trial and one controltrial. In both (c) and (g) the participant used buttons on a grip to tick of his evaluation or the control number. Thegrip had two buttons, one to press (and keep depressed) to move left, and one to move right. The interface wasprogrammed using E-Prime version 2.Translations: (b): “You worked: 30 min”, “The other worked: 90 min”. “You earn: 120 NOK”, “The other earns:880 kr”. (c, added): “How do you like this outcome?”, “Very badly—Very well”. (f): Same text as (b), amountsX’d out. (g, bottom): “Please tick off 2 on the scale below:”.
4Figure S1: The trials in the scanner
In the scanner, participants were exposed to a total of 51 evaluation trials withdifferent income distributions and 30 controls, in a randomized sequence. Thepanels above show a sub-sequence of one evaluation trial and one control trial. Inboth (c) and (g) the participant used buttons on a grip to tick of his evaluation orthe control number. The grip had two buttons, one to press (and keep depressed)to move left, and one to move right. The interface was programmed using E-Primeversion 2.Translations: (b): “You worked: 30 min”, “The other worked: 90 min”. “Youearn: 120 NOK”, “The other earns: 880 kr”. (c, added): “How do you like thisoutcome?”, “Very badly—Very well”. (f): Same text as (b), amounts X’d out. (g,bottom): “Please tick off 2 on the scale below:”.
21

0.1
.2.3
.4F
raction
0 .1 .2 .3 .4 .5Share given to others
Figure S2: Share given in post-scanner dictator gameShare given is the share of the endowment (200 NOK) given to the other partici-pant in the dictator game, where the dictator had to choose between 11 alternativeshares: 0,0.1,0.2, . . . ,1. In a pair, one participant was randomly drawn to deter-mine outcome for both.
22
ID-code:
Decision 2
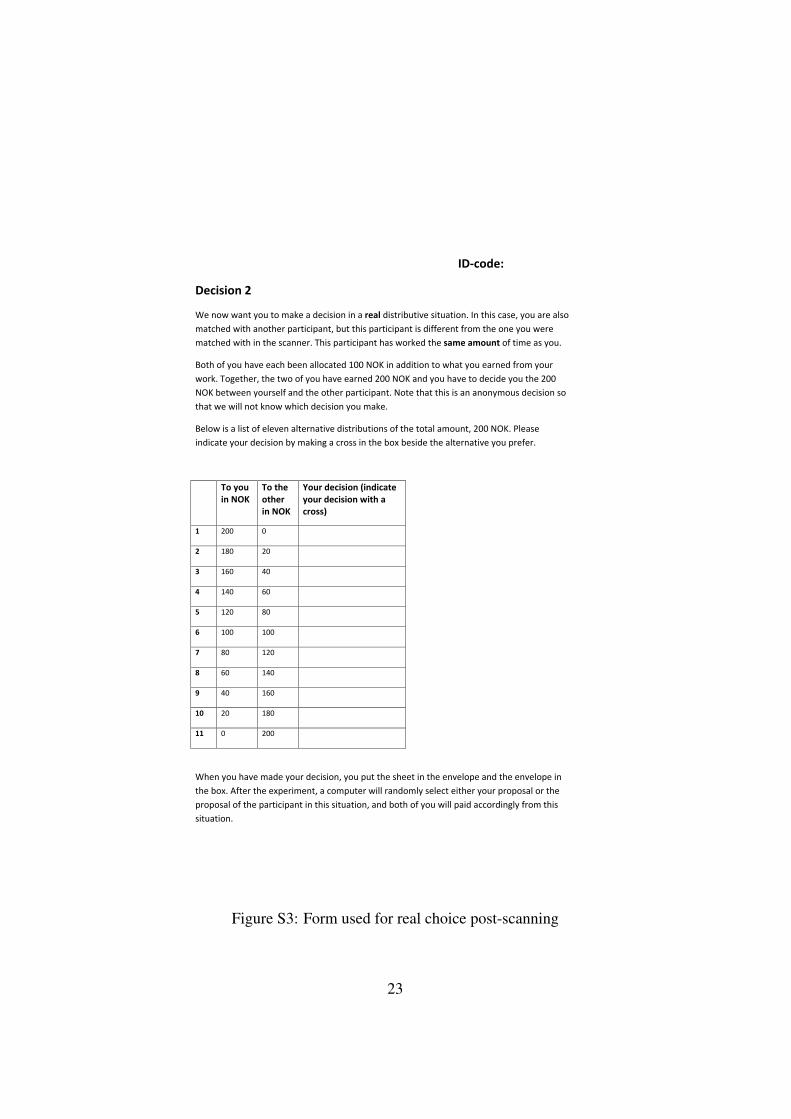
We now want you to make a decision in a real distributive situation. In this case, you are also matched with another participant, but this participant is different from the one you were matched with in the scanner. This participant has worked the same amount of time as you.
Both of you have each been allocated 100 NOK in addition to what you earned from your work. Together, the two of you have earned 200 NOK and you have to decide you the 200 NOK between yourself and the other participant. Note that this is an anonymous decision so that we will not know which decision you make.
Below is a list of eleven alternative distributions of the total amount, 200 NOK. Please indicate your decision by making a cross in the box beside the alternative you prefer.
To you in NOK
To the other in NOK
Your decision (indicate your decision with a cross)
1 200 0
2 180 20
3 160 40
4 140 60
5 120 80
6 100 100
7 80 120
8 60 140
9 40 160
10 20 180
11 0 200
When you have made your decision, you put the sheet in the envelope and the envelope in the box. After the experiment, a computer will randomly select either your proposal or the proposal of the participant in this situation, and both of you will paid accordingly from this situation.
Figure S3: Form used for real choice post-scanning
23

Tabl
eS1
:Res
ults
onpr
edic
tion
1in
each
ofth
e20
sele
cted
regi
ons
Ow
nin
com
eO
wn
inco
me
×30
:90-
cond
ition
Reg
ion
Coo
rdin
ates
Des
crip
tion
para
met
erSt
d.er
r.pa
ram
eter
Std.
err.
1-4
,24,
40L
eft/r
ight
Ant
erio
rcin
gula
tegy
rus,
Supp
lem
enta
ryM
otor
Are
a-0
.261
0.33
7-0
.473
0.48
12
34,-6
6,44
Rig
htA
ngul
arG
yrus
,Inf
erio
rPar
etia
lLob
e-0
.411
0.56
21.
567∗∗
0.67
63
-32,
22,-4
Lef
tInf
erio
rFro
ntal
Gyr
us,I
nsul
a0.
401
0.57
3-0
.333
0.66
74
-36,
-74,
-46
Lef
tCer
ebel
lum
0.01
00.
402
0.60
20.
586
5-3
8,-5
6,40
Lef
tAng
ular
Gyr
us,I
nfer
iorP
aret
ialL
obe
-0.3
930.
555
0.85
00.
664
6-4
0,44
,-2L
eftM
iddl
eFr
onta
lGyr
us0.
149
0.40
8-0
.515
0.56
47
12,2
4,-4
Rig
htC
auda
teN
ucle
us1.
119∗∗∗
0.26
5-0
.700
0.45
98
30,2
8,-4
Rig
htIn
feri
orFr
onta
lGyr
us,I
nsul
a0.
719
0.60
1-0
.710
0.71
09
-14,
22,-2
Lef
tCau
date
Nuc
leus
1.23
8∗∗∗
0.40
9-1
.180∗∗
0.55
110
34,-6
6,-3
4R
ight
Cer
ebel
lum
-0.3
930.
443
0.82
30.
506
11-2
4,-1
00,-4
Lef
tInf
erio
rocc
ipita
lgyr
us-0
.035
0.33
50.
597
0.46
012
-22,
46,3
0L
eftM
iddl
eFr
onta
lGyr
us-0
.123
0.43
70.
186
0.59
913
2,-8
8,2
Lef
t/rig
htL
ingu
alG
yrus
-0.3
050.
440
0.07
60.
545
14-4
6,18
,40
Lef
tMid
dle
Fron
talG
yrus
0.43
10.
569
-0.6
390.
688
15-8
,-84,
-28
Lef
tCer
ebel
lum
0.88
9∗0.
479
-0.9
810.
677
164,
-28,
26R
ight
Post
erio
rCin
gula
teG
yrus
0.35
60.
282
-0.4
990.
479
1740
,-86,
-10
Rig
htIn
feri
orO
ccip
italG
yrus
0.18
40.
341
0.13
70.
490
18-6
,54,
36L
eftS
uper
iorM
edia
lFro
ntal
Gyr
us-0
.003
0.61
90.
160
0.73
919
46,4
,24
Rig
htIn
feri
orFr
onta
lGyr
us0.
841
0.51
8-0
.824
0.65
720
-44,
8,28
Lef
tInf
erio
rFro
ntal
Gyr
us0.
915∗∗
0.43
2-1
.252∗∗
0.52
0
Thi
sta
ble
refe
rsto
the
regr
essi
onfr
omth
em
ain
pape
ron
Pred
ictio
n1,
onal
lof
the
regi
ons
sele
cted
inth
ein
itial
who
lebr
ain
anal
ysis
.In
the
mai
npa
per,
we
repo
rtth
ere
sults
for
regi
ons
7an
d9.
The
regi
ons
are
liste
din
term
sof
decr
easi
ngnu
mbe
rsof
sele
cted
voxe
ls.C
oord
inat
esar
ein
MN
Ispa
ce.
24

Tabl
eS2
:Res
ults
onpr
edic
tion
2in
each
ofth
e20
sele
cted
regi
ons
Ow
nin
com
eO
wn
inco
me
×30
:90-
cond
ition
Reg
ion
Coo
rdin
ates
Des
crip
tion
para
met
erSt
d.er
r.pa
ram
eter
Std.
err.
1-4
,24,
40L
eft/r
ight
Ant
erio
rcin
gula
tegy
rus,
Supp
lem
enta
ryM
otor
Are
a-0
.063
0.79
1-2
.431∗∗
1.13
72
34,-6
6,44
Rig
htA
ngul
arG
yrus
,Inf
erio
rPar
etia
lLob
e0.
053
0.63
00.
168
1.06
53
-32,
22,-4
Lef
tInf
erio
rFro
ntal
Gyr
us,I
nsul
a1.
510
0.96
6-2
.223
1.37
94
-36,
-74,
-46
Lef
tCer
ebel
lum
-1.9
38∗∗∗
0.70
51.
989∗
1.10
95
-38,
-56,
40L
eftA
ngul
arG
yrus
,Inf
erio
rPar
etia
lLob
e0.
531
0.88
0-0
.809
1.22
1
6-4
0,44
,-2L
eftM
iddl
eFr
onta
lGyr
us0.
366
0.67
9-1
.118
1.32
27
12,2
4,-4
Rig
htC
auda
teN
ucle
us1.
302∗
0.67
7-1
.580
1.07
38
30,2
8,-4
Rig
htIn
feri
orFr
onta
lGyr
us,I
nsul
a-1
.062
0.89
51.
807
1.31
39
-14,
22,-2
Lef
tCau
date
Nuc
leus
1.16
00.
759
-2.1
15∗
1.15
110
34,-6
6,-3
4R
ight
Cer
ebel
lum
-0.7
580.
800
0.97
91.
361
11-2
4,-1
00,-4
Lef
tInf
erio
rocc
ipita
lgyr
us1.
791∗∗∗
0.60
4-3
.577∗∗∗
1.19
412
-22,
46,3
0L
eftM
iddl
eFr
onta
lGyr
us0.
862
1.05
60.
019
1.35
913
2,-8
8,2
Lef
t/rig
htL
ingu
alG
yrus
-0.6
361.
059
-1.1
001.
635
14-4
6,18
,40
Lef
tMid
dle
Fron
talG
yrus
-0.2
970.
708
-1.7
601.
327
15-8
,-84,
-28
Lef
tCer
ebel
lum
-0.0
050.
760
-1.4
021.
242
164,
-28,
26R
ight
Post
erio
rCin
gula
teG
yrus
0.54
10.
924
0.59
11.
533
1740
,-86,
-10
Rig
htIn
feri
orO
ccip
italG
yrus
0.96
00.
821
-2.2
93∗
1.30
918
-6,5
4,36
Lef
tSup
erio
rMed
ialF
ront
alG
yrus
2.29
0∗∗∗
0.83
6-2
.861∗∗
1.27
319
46,4
,24
Rig
htIn
feri
orFr
onta
lGyr
us-1
.284∗
0.69
90.
052
1.17
720
-44,
8,28
Lef
tInf
erio
rFro
ntal
Gyr
us0.
928
0.75
6-1
.791
1.29
8
Thi
sta
ble
refe
rsto
the
regr
essi
onfr
omth
em
ain
pape
ron
Pred
ictio
n2,
onal
lof
the
regi
ons
sele
cted
inth
ein
itial
who
lebr
ain
anal
ysis
.In
the
mai
npa
per,
we
repo
rtth
ere
sults
for
regi
ons
7an
d9.
The
regi
ons
are
liste
din
term
sof
decr
easi
ngnu
mbe
rsof
sele
cted
voxe
ls.C
oord
inat
esar
ein
MN
Ispa
ce.
25

Tabl
eS3
:Res
ults
onpr
edic
tion
3in
each
ofth
e20
sele
cted
regi
ons
Ow
nin
com
eO
wn
inco
me
×60
:60-
cond
ition
Reg
ion
Coo
rdin
ates
Des
crip
tion
para
met
erSt
d.er
r.pa
ram
eter
Std.
err.
1-4
,24,
40L
eft/r
ight
Ant
erio
rcin
gula
tegy
rus,
Supp
lem
enta
ryM
otor
Are
a-1
.144
1.15
01.
452
1.41
02
34,-6
6,44
Rig
htA
ngul
arG
yrus
,Inf
erio
rPar
etia
lLob
e0.
803
0.89
5-0
.390
1.17
93
-32,
22,-4
Lef
tInf
erio
rFro
ntal
Gyr
us,I
nsul
a0.
614
1.10
5-2
.273
1.43
74
-36,
-74,
-46
Lef
tCer
ebel
lum
0.62
20.
602
0.52
90.
961
5-3
8,-5
6,40
Lef
tAng
ular
Gyr
us,I
nfer
iorP
aret
ialL
obe
-0.1
951.
104
0.41
81.
370
6-4
0,44
,-2L
eftM
iddl
eFr
onta
lGyr
us0.
375
0.66
6-0
.467
0.98
57
12,2
4,-4
Rig
htC
auda
teN
ucle
us0.
754
0.94
8-1
.368
1.17
08
30,2
8,-4
Rig
htIn
feri
orFr
onta
lGyr
us,I
nsul
a0.
566
1.22
0-0
.193
1.42
39
-14,
22,-2
Lef
tCau
date
Nuc
leus
1.59
9∗∗
0.76
0-2
.213∗∗
1.08
610
34,-6
6,-3
4R
ight
Cer
ebel
lum
-0.1
210.
691
0.55
71.
035
11-2
4,-1
00,-4
Lef
tInf
erio
rocc
ipita
lgyr
us0.
055
0.77
60.
269
1.11
312
-22,
46,3
0L
eftM
iddl
eFr
onta
lGyr
us0.
410
1.32
10.
054
1.61
413
2,-8
8,2
Lef
t/rig
htL
ingu
alG
yrus
1.24
91.
128
-0.8
331.
482
14-4
6,18
,40
Lef
tMid
dle
Fron
talG
yrus
0.41
91.
134
-0.1
391.
431
15-8
,-84,
-28
Lef
tCer
ebel
lum
0.44
11.
358
-0.9
661.
675
164,
-28,
26R
ight
Post
erio
rCin
gula
teG
yrus
0.06
61.
101
-0.9
781.
351
1740
,-86,
-10
Rig
htIn
feri
orO
ccip
italG
yrus
0.35
70.
946
0.53
01.
207
18-6
,54,
36L
eftS
uper
iorM
edia
lFro
ntal
Gyr
us1.
260
1.16
1-3
.356∗∗
1.44
419
46,4
,24
Rig
htIn
feri
orFr
onta
lGyr
us1.
623
0.90
1∗-2
.726∗∗
1.24
920
-44,
8,28
Lef
tInf
erio
rFro
ntal
Gyr
us2.
517∗∗
1.05
4-1
.426
1.42
9
Thi
sta
ble
refe
rsto
the
regr
essi
onfr
omth
em
ain
pape
ron
Pred
ictio
n3,
onal
lof
the
regi
ons
sele
cted
inth
ein
itial
who
lebr
ain
anal
ysis
.In
the
mai
npa
per,
we
repo
rtth
ere
sults
for
regi
ons
7an
d9.
The
regi
ons
are
liste
din
term
sof
decr
easi
ngnu
mbe
rsof
sele
cted
voxe
ls.C
oord
inat
esar
ein
MN
Ispa
ce.
26

Tabl
eS4
:Tab
le2
estim
ates
inea
chof
the
20se
lect
edre
gion
sD
evia
tions
from
Ow
nin
com
epr
opor
tiona
lity
equa
lity
Reg
ion
Des
crip
tion
para
met
erSt
d.er
r.pa
ram
eter
Std.
err.
para
met
erSt
d.er
r.
1L
eft/r
ight
Ant
erio
rcin
gula
tegy
rus,
Supp
lem
enta
ryM
otor
Are
a0.
299
0.19
11.
739
1.75
3-1
.086
2.29
82
Rig
htA
ngul
arG
yrus
,Inf
erio
rPar
etia
lLob
e-0
.287
0.20
8-4
.591∗∗
2.07
10.
661
1.86
63
Lef
tInf
erio
rFro
ntal
Gyr
us,I
nsul
a-0
.411∗
0.23
23.
037
2.15
01.
329
2.37
44
Lef
tCer
ebel
lum
-0.1
340.
193
-3.1
40∗
1.82
7-1
.883
1.75
35
Lef
tAng
ular
Gyr
us,I
nfer
iorP
aret
ialL
obe
0.09
60.
196
-2.4
142.
084
2.14
72.
274
6L
eftM
iddl
eFr
onta
lGyr
us-0
.065
0.18
41.
802
1.79
90.
646
1.97
77
Rig
htC
auda
teN
ucle
us-0
.632∗∗∗
0.19
42.
833∗∗
1.37
30.
468
1.59
48
Rig
htIn
feri
orFr
onta
lGyr
us,I
nsul
a-0
.405∗
0.22
01.
597
2.32
9-2
.357
2.37
19
Lef
tCau
date
Nuc
leus
-0.6
45∗∗∗
0.21
24.
708∗∗∗
1.61
1-1
.550
1.69
810
Rig
htC
ereb
ellu
m-0
.074
0.19
5-3
.436∗∗
1.59
01.
483
2.03
2
11L
eftI
nfer
ioro
ccip
italg
yrus
-0.3
38∗
0.19
8-0
.446
1.55
40.
462
1.96
512
Lef
tMid
dle
Fron
talG
yrus
-0.2
370.
211
-0.2
202.
087
0.34
72.
476
13L
eft/r
ight
Lin
gual
Gyr
us0.
389
0.24
31.
124
1.97
7-6
.048∗∗
2.62
614
Lef
tMid
dle
Fron
talG
yrus
-0.2
060.
232
2.11
82.
272
-3.0
622.
300
15L
eftC
ereb
ellu
m-0
.270
0.19
43.
986∗
2.37
2-1
.862
2.54
1
16R
ight
Post
erio
rCin
gula
teG
yrus
0.07
80.
198
0.98
11.
777
1.44
52.
340
17R
ight
Infe
rior
Occ
ipita
lGyr
us-0
.340∗
0.17
9-0
.041
1.71
6-1
.845
2.08
618
Lef
tSup
erio
rMed
ialF
ront
alG
yrus
-0.0
170.
220
2.39
22.
218
1.62
82.
360
19R
ight
Infe
rior
Fron
talG
yrus
-0.0
020.
218
2.74
02.
046
-1.3
521.
978
20L
eftI
nfer
iorF
ront
alG
yrus
-0.3
64∗
0.20
64.
231∗∗
1.82
6-4
.397∗∗
2.14
9
27

Tabl
eS5
:Rob
ustn
ess
ofre
sults
inTa
ble
2Su
bjec
tive
BO
LD
ratin
gsC
auda
teN
ucle
us
Abs
olut
eA
bsol
ute
devi
atio
nsW
ithco
ntro
ls
devi
atio
nsle
ftri
ght
left
righ
t
Ow
nin
com
e(i
n10
0sN
OK
)1.
119∗∗∗
0.64
5∗∗∗
0.63
2∗∗∗
0.62
6∗∗
0.65
4∗∗∗
(0.1
16)
(0.2
12)
(0.1
94)
(0.2
49)
(0.2
31)
Dev
iatio
nfr
ompr
opor
tiona
lity
(in
100s
NO
K)
-0.5
18∗∗∗
-0.6
51∗∗∗
-0.3
90∗
-3.9
86∗∗∗
-2.3
54∗
(0.1
70)
(0.2
37)
(0.2
00)
(1.4
67)
(1.3
89)
Dev
iatio
nfr
omeq
ualit
y(i
n10
0sN
OK
)-0
.042
0.16
8-0
.180
0.72
3-1
.595
(0.1
80)
(0.3
42)
(0.3
15)
(1.5
98)
(1.5
20)
Obs
erva
tions
1175
1175
1175
2585
2585
Stan
dard
erro
rsin
pare
nthe
ses
∗p<
0.1,∗∗
p<
0.05
,∗∗∗
p<
0.01
Not
e:T
heta
ble
repo
rtsO
LS
regr
essi
onso
fthe
subj
ectiv
era
ting
and
the
BO
LD
-res
pons
ein
the
left
and
righ
tcau
date
nucl
eus
onow
nin
com
e,de
viat
ion
from
prop
ortio
nalit
yan
dde
viat
ion
from
equa
lity.
Dev
iatio
nfr
ompr
opor
tiona
lity
and
devi
atio
nsfr
omeq
ualit
yar
em
easu
red
inab
solu
tete
rms
(in
100s
ofN
OK
)in
the
first
thre
eco
lum
ns,w
here
asin
the
mai
npa
per
itis
mea
sure
dre
lativ
eto
the
max
devi
atio
n(w
hich
diff
ers
byco
nditi
on).
BO
LD
outc
omes
are
mea
sure
din
units
of1/
10st
anda
rdde
viat
ion.
Inth
ela
sttw
oco
lum
ns,
indi
cato
rsar
eal
soin
clud
edfo
rea
chof
the
11ra
ting
leve
lsan
dfo
rth
etr
ial
bein
ga
cont
rolt
rial
(the
sear
ele
ftou
toft
heta
ble)
.In
alls
peci
ficat
ions
,ind
ivid
uall
evel
fixed
effe
cts
are
incl
uded
butn
otre
port
edin
the
tabl
e.
28

Table S6: Correlates of share given
Variable correlated with share given p-value
Subjective rating 0.03BOLD: Right caudate nucleus 0.02BOLD: Left caudate nucleus 0.04
Note: Reported are p-values for tests that the correlation between the variableand the share given in the post-scanner dictator game is different from zero. TheBOLD measures are summarized at the individual level by the regression coeffi-cient of the outcome and own income (at or above the fair level). The regressionsare run for one individual at a time, with the variance of outcome variables stan-dardized.
29

Issued in the series Discussion Papers 2014
2014 01/14 January, Kurt R. Brekke, Tor Helge Holmås, and Odd Rune Straume, “Price
Regulation and Parallel Imports of Pharmaceuticals”. 02/14 January, Alexander W. Cappelen, Bjørn-Atle Reme, Erik Ø. Sørensen, and
Bertil Tungodden, “Leadership and incentives”. 03/14 January, Ingvild Almås, Alexander W. Cappelen, Kjell G. Salvanes, Erik Ø.
Sørensen, and Bertil Tungodden, “Willingness to Compete: Family Matters”. 04/14 February, Kurt R. Brekke, Luigi Siciliani, and Odd Runde Straume,
“Horizontal Mergers and Product Quality”. 05/14 March, Jan Tore Klovland, “Challenges for the construction of historical price
indices: The case of Norway, 1777-1920”. 06/14 March, Johanna Möllerström, Bjørn-Atle Reme, and Erik Ø. Sørensen, “Luck,
Choice and Responsibility”. 07/14 March, Andreea Cosnita-Langlais and Lars Sørgard, “Enforcement vs
Deterrence in Merger Control: Can Remedies Lead to Lower Welfare?” 08/14 March, Alexander W. Cappelen, Shachar Kariv, Erik Ø. Sørensen, and Bertil
Tungodden, «Is There a Development Gap in Rationality?” 09/14 April, Alexander W. Cappelen, Ulrik H. Nielsen, Bertil Tungodden, Jean-
Robert Tyran, and Erik Wengström, “Fairness is intuitive”. 10/14 April, Agnar Sandmo, “The early history of environmental economics”. 11/14 April, Astrid Kunze, “Are all of the good men fathers? The effect of having
children on earnings”. 12/14 April, Agnar Sandmo, “The Market in Economics: Behavioural Assumptions
and Value Judgments”. 13/14 April, Agnar Sandmo, “Adam Smith and modern economics”. 14/14 April, Hilde Meersman, Siri Pettersen Strandenes, and Eddy Van de Voorde,
“Port Pricing: Principles, Structure and Models”.

15/14 May, Ola Honningdal Grytten, “Growth in public finances as tool for control: Norwegian development 1850-1950”
16/14 May, Hans Jarle Kind, Tore Nilssen, and Lars Sørgard, “Inter-Firm Price
Coordination in a Two-Sided Market”. 17/14 May, Stig Tenold, “Globalisation and maritime labour in Norway after World
War II”. 18/14 May, Tunç Durmaz, “Energy Storage and Renewable Energy” 19/14 May, Elias Braunfels, “How do Political and Economic Institutions Affect
Each Other?” 20/14 May, Arturo Ormeño and Krisztina Molnár, “Using Survey Data of Inflation
Expectations in the Estimation of Learning and Rational Expectations Models” 21/14 May, Kurt R. Brekke, Luigi Siciliani, and Odd Rune Straume, “Hospital
Mergers with Regulated Prices”. 22/14 May, Katrine Holm Reiso, “The Effect of Welfare Reforms on Benefit
Substitution”. 23/14 June, Sandra E. Black, Paul J. Devereux, and Kjell G. Salvanes, “Does grief
transfer across generations? In-utero deaths and child outcomes” 24/14 June, Manudeep Bhuller, Magne Mogstad, and Kjell G. Salvanes, «Life Cycle
Earnings, Education Premiums and Internal Rates of Return”. 25/14 June, Ragnhild Balsvik, Sissel Jensen, and Kjell G. Salvanes, “Made in
China, sold in Norway: Local labor market effects of an import shock”. 26/14 August, Kristina Bott, Alexander W. Cappelen, Erik Ø. Sørensen, and Bertil
Tungodden, “You’ve got mail: a randomized field experiment on tax evasion” 27/14 August, Alexander W. Cappelen, Sebastian Fest, Erik Ø. Sørensen, and
Bertil Tungodden, “The freedom to choose undermines the willingness to redistribute.”
28/14 August, Marianne Bertrand, Sandra Black, Sissel Jensen, and Adriana Lleras-
Muney, “Breaking the Glass Ceiling? The Effect of Board Quotas on Female Labor Market Outcomes in Norway.”
29/14 August, Astrid Kunze, “The family gap in career progression”.

30/14 September, Ragnhild Balsvik and Morten Sæthre, “Rent Sharing with Footloose Production. Foreign Ownership and Wages Revisited”.
31/14 October, Nicola D. Coniglio and Giovanni Pesce, “Climate Variability and
International Migration: an empirical analysis” 32/14 November, Kurt R. Brekke, Armando J. Garcia Pires, Dirk Schindler, and
Guttorm Schjelderup, “Capital Taxation and Imperfect Competition: ACE vs. CBIT”
33/14 November, Jan I. Haaland and Anthony J. Venables, “Optimal trade policy
with monopolistic competition and heterogeneous firms”. 34/14 December, Rolf Aaberge, Kai Liu, and Yu Zhu, “Political Uncertainty and
Household Savings”.

2015
01/15 January, Antonio Mele, Krisztina Molnár, and Sergio Santoro, “On the perils
of stabilizing prices when agents are learning”. 02/15 March, Liam Brunt, “Weather shocks and English wheat yields, 1690-1871”. 03/15 March, Kjetil Bjorvatn, Alexander W. Cappelen, Linda Helgesson Sekei, Erik
Ø. Sørensen, and Bertil Tungodden, “Teaching through television: Experimental evidence on entrepreneurship education in Tanzania”.
04/15 March, Kurt R. Brekke, Chiara Canta, Odd Rune Straume, “Reference pricing
with endogenous generic entry”. 05/15 March, Richard Gilbert and Eirik Gaard Kristiansen, “Licensing and
Innovation with Imperfect Contract Enforcement”. 06/15 March, Liam Brunt and Edmund Cannon, “Variations in the price and quality
of English grain, 1750-1914: quantitative evidence and empirical implications”. 07/15 April, Jari Ojala and Stig Tenold, “Sharing Mare Nostrum: An analysis of
Mediterranean maritime history articles in English-language journals”. 08/15 April, Bjørn L. Basberg, “Keynes, Trouton and the Hector Whaling Company.
A personal and professional relationship”. 09/15 April, Nils G. May and Øivind A. Nilsen, “The Local Economic Impact of
Wind Power Deployment”. 10/15 May, Ragnhild Balsvik and Stefanie Haller, “Ownership change and its
implications for the match between the plant and its workers”. 11/15 June, Kurt R. Brekke, Chiara Canta, Odd Rune Straume, “Does Reference
Pricing Drive Out Generic Competition in Pharmaceutical Markets? Evidence from a Policy Reform”.
12/15 June, Kurt R. Brekke, Tor Helge Holmås, Karin Monstad, and Odd Rune
Straume, “Socioeconomic Status and Physicians’Treatment Decisions”. 13/15 June, Bjørn L. Basberg, “Commercial and Economic Aspects of Antarctic
Exploration ‐ From the Earliest Discoveries into the 19th Century”. 14/15 June, Astrid Kunze and Amalia R. Miller, “Women Helping Women?
Evidence from Private Sector Data on Workplace Hierarchies”

15/15 July, Kurt R. Brekke, Tor Helge Holmås, Karin Monstad, Odd Rune Straume,
«Do Treatment Decisions Depend on Physicians Financial Incentives?” 16/15 July, Ola Honningdal Grytten, “Norwegian GDP by industry 1830-1930”. 17/15 August, Alexander W. Cappelen, Roland I. Luttens, Erik Ø. Sørensen, and
Bertil Tungodden, «Fairness in bankruptcy situations: an experimental study». 18/15 August, Ingvild Almås, Alexander W. Cappelen, Erik Ø. Sørensen, and
Bertil Tungodden, “Fairness and the Development of Inequality Acceptance”. 19/15 August, Alexander W. Cappelen, Tom Eichele,Kenneth Hugdah, Karsten
Specht, Erik Ø. Sørensen, and Bertil Tungodden, “Equity theory and fair inequality: a neuroconomic study”.

NorgesHandelshøyskole
Norwegian School of Economics
NHHHelleveien 30NO-5045 BergenNorway
Tlf/Tel: +47 55 95 90 00Faks/Fax: +47 55 95 91 [email protected]