equity in european educational system
TRANSCRIPT

8/2/2019 Equity in European Educational System
http://slidepdf.com/reader/full/equity-in-european-educational-system 1/151

8/2/2019 Equity in European Educational System
http://slidepdf.com/reader/full/equity-in-european-educational-system 2/151
Edited by:
Department of Theoretical and Experimental Education
University of Liège
Boulevard du Rectorat 5 (B32)
B – 4000 Liège
Belgium
Tél. : 00 32 4 366 20 75
Fax : 00 32 4 366 28 55
e-mail : [email protected]
©Service de Pédagogie théorique et expérimentale

8/2/2019 Equity in European Educational System
http://slidepdf.com/reader/full/equity-in-european-educational-system 3/151
The authors wish to convey their sincere gratitude to the European Commission’s representatives, who supported themthroughout the project: Mr. A. Hingel (Head of Unit), Mrs. A.Vegliante, Mr. J.-Y. Stefani and Mrs. Y. Villar.
The authors also benefited from the valuable advice of therepresentatives of Eurydice, and, in particular, would like to thank
Mrs. A. Delhaxhe for her contribution.
They also wish to thank the Direction de l’Évaluation et de la Prospective [Directorship of Evaluation and Estimates] and, particularly, Mrs. Nauze-Fichet for drawing the sample intended for the survey about justice.
Other experts were consulted and the authors would like toemphasise the role of Professor P. Bréchon (IEP, Grenoble), aswell as that of Mr. Ch. Monseur (Acer).
Finally, the authors would like to thank Anne Matoul (Frenchtranslation) and Céline Géron (layout of the indicators) for their availability and the quality of their job.

8/2/2019 Equity in European Educational System
http://slidepdf.com/reader/full/equity-in-european-educational-system 4/151

8/2/2019 Equity in European Educational System
http://slidepdf.com/reader/full/equity-in-european-educational-system 5/151
Contents Introduction 7
Part I.
Devising indicators of equity in educational systems.
Why and how ? 9Why devise indicators of the equity in educational systems 10
Equality and Equity 12
Eight guiding principles for a set of indicators 17
Part II.
A set of 29 indicators on the equity of educational systems 27
A. Context of inequalities in education 32
1. Individual consequences of inequalities in education 32
2. Economic and social inequalities 363. Cultural resources 40
4. Aspirations and perceptions 46
B. Inequalities in the education process 52
1. Quantity of education received 52
2. Quality of education received 56
C. Inequalities in education results 64
1. Skills 64
2. Personal development 68
3. School careers 70
D. Social and political effects of inequalities in education 72
1. Education and social mobility 72
2. Benefits of education for the disadvantaged 76
3. Collective effects of inequalities 78
Part III.
Equity in European educational systems.
An interpretation of the 29 indicators 91
Introduction 93
1. What is the importance of inequalities within the educational systems of the European
Union ? 95
2. What advantages are produced by education in the European Union Member States ?3. Do the European Union’s educational systems have a role in amplifying or reducing contextual inequalities ? 110 4. To what extent do educational inequalities benefit the disadvantaged and encourage social
mobility ? 128
Conclusions 136
The next steps 140
References 143

8/2/2019 Equity in European Educational System
http://slidepdf.com/reader/full/equity-in-european-educational-system 6/151
8/2/2019 Equity in European Educational System
http://slidepdf.com/reader/full/equity-in-european-educational-system 7/151
Introduction
Equity in the European Educational Systems. A Set of Indicators is the result
of collaboration between six European university teams, and was carried out as
part of the Socrates 6.1.2. programme, with the support of the EuropeanCommission.
The project is intended to measure and compare the equity of the education
systems in the European Union Member States1. As a result, decision-makers
and users will be better informed about equity in the existing systems. This is
intended to help decision-makers to refine their educational policies.
This publication reports on a several-year period of work on the issue of theequity of educational systems. It is structured into three main sections:
A first part, entitled Devising indicators of equity in educational systems: whyand how ?, defines the concepts of equality and equity, and presents the
framework of indicators and its guiding principles.
The second part, A set of 29 indicators on equity in the educational systems, presents the twenty-nine indicators built in the context of this project and
organized according to the framework.
The third part, The equity of European educational systems. An interpretationof the 29 indicators, presents an analytical interpretation of the equity indicators.
1 When this project started in May 2001, the European Union had 15 member states. The indicators created and presented here concern these 15 countries (plus Norway and Switzerland). A few of them only include some data
related to the new member states. In the long run, the set of indicators should be extended to the 25 member states the EU has today.

8/2/2019 Equity in European Educational System
http://slidepdf.com/reader/full/equity-in-european-educational-system 8/151

8/2/2019 Equity in European Educational System
http://slidepdf.com/reader/full/equity-in-european-educational-system 9/151
PART 1
Devising indicators of equity in
educational systems. Why and how ?

8/2/2019 Equity in European Educational System
http://slidepdf.com/reader/full/equity-in-european-educational-system 10/151
10
Why devise indicators on the equity of
education systems ?The work carried out here in the context of Action 6.1.2 of the Socrates Programme was made
possible by the European Commission and the national contributions of the participating partners. It was initiated by certain members of the ad hoc group on equity issues (OECD)
convened in Geneva by Norberto Bottani and Walo Hutmacher. A publication by this group
(Hutmacher, Cochrane and Bottani, 2001) provided a first theoretical framework of indicators(Meuret, 2001b) on which basis the current project took shape.
Indicators measuring inequalities have been appearing for a long time in international publications dealing with education, particularly in the OECD Education at a Glance, and in Key data on education in Europe, the regular publication of the European Commission
prepared by Eurydice. The various reports produced as a result of international evaluations of
student achievement (for instance, OECD, 2001; Beaton et al., 1996) also contain indicatorson inequalities. In addition, several international education research programmes have
proposed comparisons (Shavit and Blossfeld, 1993; Müller and Karle, 1993) in important
fields like social inequalities in school careers. Other international surveys ( European Households Panel , European Value Survey, Luxembourg Income Study, etc.) also provideinteresting relevant information, as do certain national surveys. However, the latter do pose
sizeable compatibility issues.
The new feature of this work is its systematic – by determining the principles to propose some
points of reference in a broad and relatively new field – and comparative approach to equityin European educational systems.
This comparative approach has been adopted for several reasons. It seems that in Europe,equity in education is rapidly becoming a major political issue. Furthermore, the publicationof indicators can help to raise and to structure the related democratic debate. Even in the
1960’s, when scientists of different countries demonstrated the persistence of social
inequalities in school careers, this field did not really represent such a political problem asnow. Except perhaps in the UK, citizens did not consider national governments to responsible
for the inequalities in education that were felt as injustice and did not select the politiciansaccording to their (in)ability to reduce such inequalities. Quantitative democratisation in terms
of access to education and wealth across Europe undoubtedly helped to hide new and less
obvious inequalities.
However, in other countries, fairness in education became a political issue. In the UnitedStates, for instance, the Supreme Courts of several states had to rule on complaints made by
associations fighting for civil rights against the organization of certain educational systems.
Kentucky is the most famous example. While education was not a matter decided at thefederal level of authority, educational choices played an important role in the last presidential
campaign. In Europe, this type of concern has not yet emerged with the same acuteness, but itis likely to grow quickly.
European citizens are becoming more demanding in relation to an education system perceived
both as expensive, and which no longer offers guaranteed career prospects in the future. At
the same time, the social consequences of failure at school are considered to be increasinglyimportant. Moreover, the idea that children and young people must also be treated justly is
gaining ground. Consequently, educative systems are being given increasingly precise targets,which are, in some cases, quantified, in terms of both efficiency and equity.

8/2/2019 Equity in European Educational System
http://slidepdf.com/reader/full/equity-in-european-educational-system 11/151
11
At the same time, there is developing criticism of redistribution of wealth as practised in its
classic form by the Welfare state, since this practice is considered as personal-responsibility
reductive. That criticism is leading to an emphasis on the financing and management of education as the principal means available to the state to maintain, within limits that are
compatible with justice, not only inequality of opportunities, but also inequality of income2.
Once the state recognizes this as one of its major tasks, individuals are also going to caremore about the equity with which education is distributed. Therefore, education, and the
equity of its distribution, will become a stronger political issue, in the terms outlined above.
Some indications of this can already be seen. For instance, a French survey conducted in July2000 involving four hundred parents, showed that only 31 % of “employee” parents,compared with 65 % of “executive” parents, found that “secondary education schools treated
students equally” (Challenge, 2000). At the same time, another survey conducted in
Switzerland, pointed out that 70 % of Swiss adults considered that school itself has aconsiderable responsibility in creating educational inequalities (Hutmacher, 2001).
However, people do not judge governments’ approach to education only in terms of equity.
They also take an interest in the way in which the distribution of educational assets respectstheir rights. For example, freedom to choose schools may constitute a basic, or even aconstitutional right, that is difficult to limit through a concern for fairness (Brighouse, 2000).
They are also interested in the efficiency of their educational system, i.e. its cost, its internaland external efficiency, and its capacity to pass on skills that are useful to society and to the
nation. An emphasis on equity should not replace these other concerns. On the contrary,
citizens can and do demand both efficiency and equity. They are no longer prepared to settlefor speeches merely explaining existing inequalities either as the regrettable necessities of
competition for efficiency, or the absence of efficiency by a virtuous choice in favour of theweakest members of society. They require clear and simple evidence about efficiency and
equity, since they can no longer settle for indicators only about the former ( Education at a
Glance, for example) and pious wishes about the latter. It is for this reason that it is essentialto publish indicators about the equity of educational systems with the intention of providing
useful information to citizens as well as to those responsible for the educational system. Theseindicators are intended to provide a needed supplement to the information already available
about costs and results.
Before presenting the guidelines adopted to select the indicators we propose, and the results
for the indicators themselves, the following chapter introduces the reasons for preferring theidea of ‘equity’ to the idea of ‘equality’.
2 Pay inequalities are partly due to a mismatch between supply and demand for skilled workers, which in turndepend on training policies.
8/2/2019 Equity in European Educational System
http://slidepdf.com/reader/full/equity-in-european-educational-system 12/151
12
Equality and EquityBeyond formal equality
A comentator talking about equity rather than equality may be suspected of having abandonedsafe territory based on a clear concept for the minefield of a fuzzy concept. For some of
supporters of egalitarian views and unintended danger of this new approach of equity would
be the justifification of unjustifiable inequalities to the benefit of dominant socio-economicgroups. Therefore, some futher explanation of this point is required before we describe the
indicators themselves.
It is true that equity is currently a more difficult concept than equality, and that it allows, in
principle at least, the existence of some inequalities. Nevertheless, it is a concept that allowsus to go beyond a purely superficial examination, to perform a multidimensional analysis. In
fact, a strictly egalitarian vision, which would aim to give everyone the same treatment, while
ignoring the characteristics of each individual at the outset or even the results in terms of reproduction of the initial inequalities, would force us to question its very foundations,
precisely for reasons of equality since, in this case, a strict equality of treatment would ignoreother kinds of inequality. Therefore, a majority of commentators – political philosophers or
economists – who endeavour to define equity consider that an equitable situation is fairer overall than the strictly egalitarian approach. However, some authors like Nozick (1974) and
libertarian authors in general, argue that inequalities that are produced by a process which
does not infringe "legitimate property rights” are themselves legitimate. This leads them toassert that all public policies aimed at reducing such inequalities are, by nature, illegitimate
(for a presentation of libertarian theories, see for example Kymlicka, 1999 or Van Parijs,1991).
The well-known question of Amartya Sen (1992): “ Equality of what?” enables us to
understand better why we need to go beyond the concept of formal equality. Indeed, a widelyaccepted principle of justice – meritocracy – allows infinite inequalities in levels of schooling,
provided that they reward individual “merit”, which is difficult to define. And the onlyequality in education which almost everyone agrees with, the equality of opportunities, is a
hypothetical equality only. As Rawls (1987) says: “Assuming that there is a distribution of
natural assets, those who are at the same level of talent and ability, and have the samewillingness to use them should have the same prospects of success, regardless of their initial
place in the social system” (p. 73). This approach relies on concepts with questionableoperationalisation: talent, ability and motivation; how can they be measured or even assessed?
The social inequalities in relation to school are, on the other hand, so obvious that we mustcriticize their scale or be pleased when they are reduced, but it is a quite different matter todecide whether fairness requires, whatever the cost in the other dimensions, exact equality of
school careers between social groups. In fact, what the concept of fairness answers to Sen’squestion is “equality of persons”, political equality and equality in dignity. The discussion
about equity begins when it is necessary to define the assets that should be equalized
according to this principle (Sen, 1982) or which principles of distribution equity demands for each type of good (Rawls, 1971;Walzer, 1983).
Let us accept, for the time being, the general idea that a fair educational system is a system
that treats all pupils as equals and which aims to encourage a fair society, in which essential
assets are distributed in accordance with the rules of justice and which encouragescooperation on an equal footing. One immediately understands that such a definition of equity
demands that certain educational assets are distributed equally – quality of teachers, years of

8/2/2019 Equity in European Educational System
http://slidepdf.com/reader/full/equity-in-european-educational-system 13/151
13
entitlement or levels of funding, for example – but that other assets are distributed in
proportion to individual contribution – marks, punishment perhaps, the careers open to
qualifications, for example. Also that the inequalities in anything else should not be“excessive”, that more of certain assets are given to the best pupils (longer education) and
more of other assets to the less able pupils (better ratio of students to teaching staff or
specialized education). This summary suggests that a strictly egalitarian approach isimpossible and that we must take account of a multiplicity of principles of justice, and assets
connected with education or groups of individuals. To answer Sen, it must be specified whichequalities we are talking about and, in doing this, we envisage the ensuing discussion in termsof equity.
Education : Equality of what ?
Adapted from Grisay (1984), the following table (Table 1) gives an overall vision of the fivemajor principles of equality in terms of education, and presents the postulates and the
consequences of these various principles of justice. The first concept, not specified by Grisay
and marked “A”, refers to a “natural”, or libertarian concept. Only concepts B to E, reallydraw on the principles of equality (see also Demeuse, Crahay, Monseur, 2005).
Concerning these, whether we talk about equal opportunities, equal treatment, equal
achievement or equal results, we stumble into practical or theoretical limitations connectedwith the adoption of a particular theory.
In the first case (B), the wish is that all individuals or groups have the same opportunities toreach a given level in the system. The social background must not influence success at school,
but this is subject to criticism by those who claim that this leaves the possibility open to biasof giving better educational conditions to those with greater ability with differing socio-
cultural fit to the educational programme available. This is traditionally known as the
“Matthew effect”
3
.In the second case (C), the same school is claimed for all: the same educational conditions aregiven to all, but this is open to criticism from those who think that some people, because theysuffer from a disadvantage of one kind or another, need better educational conditions.
In the third case (D), it is required that all students reach an already set up and shared
objective. Equality of results is desired, at least for a certain level of agreed knowledge, but
this comes up against those who claim that by pursuing this objective, the best pupils aredeprived of the possibility of progressing as far as possible, which is referred to as the “Robin
Hood effect”4.
Finally, in the last case (E), it is expected that the individuals leaving the school system have
the same opportunities to use their acquired skills, develop themselves as persons living in thesociety and value their competencies.
3 " For to him who has will more be given, and he will have abundance; but from him who has not, even what he
has will be taken away”. (Matthew, Ch. 13:12).
4 Like Robin Hood, who robbed the rich and redistributed to the poor, the time the teachers should devote to theweakest pupils to help them to progress would be taken from the best pupils.

8/2/2019 Equity in European Educational System
http://slidepdf.com/reader/full/equity-in-european-educational-system 14/151
14
Table 1. Five principles of equality in education (adapted from Grisay, 1984, p. 7).
Assumed Admitted Criticized Recommended
A – No interest in equity: “natural” or “libertarian” position
Birth, strength or belonging toa particular group determine
rights. Liberty can only suffer from forced redistribution.
Reproduction and maintenanceof the "natural" order and
differences based on fair acquisition.
Possibly, inequalities in groupsof peers. Interventions contrary
to liberty.
A stable order, a sharing of functions (society of castes,
orders, etc.) or a system basedon liberty of the actors.
B – Equality of access or opportunities
The existence of talents, of
potential or natural aptitudes.These define the level or
threshold that the individualmay hope to achieve.
Unequal results, provided that
they are proportional toaptitudes at the start.
Existence of courses of studyof unequal value.Inequality of treatment.
The fact that merit is not the
only criterion for access to themost highly-regarded courses.
Socio-cultural bias affectingguidance tests.Imperfections in the
evaluations responsible for thefact that, although of equal
competence, one pupilsucceeds and another fails.
Objective and scientific
detection of talents, andscientific methods of
orientation.Equality of access to longcourses of study, for children of
equal aptitude from advantagedand disadvantaged
backgrounds.A school made to measure, i.e.
a varied system of options andcourses of education adapted to
the ability of students.
Aid to gifted pupils fromdisadvantaged backgrounds(scholarships, etc.).
C – Equality of treatment
The capacity of all to undertake
basic learning, and therefore benefit from basic education.
The existence of natural talents,
potential or aptitudes.Unequal results, on the
condition that pupils were ableto benefit from learning
conditions of equivalentquality.
Unequal quality of teaching,
responsible for unequalachievement.
Elite schools, ghetto schools,streamed classes, explicit and
implicit courses of study thatengender unequal quality of
education.
The Single-level or
Comprehensive school, and particularly, the common core
for lower secondary education.
D – Equality of achievement or academic success
Potential for extended learning.
Individual characteristics(cognitive or affective) can bemodified. Differences in
learning styles.
Differences in results beyond
the essential skills.
The ideology of talents.
Negative discrimination(including streamed classes,courses, elite schools and
ghetto schools), i.e. all thesituations where unequal
quality of teaching amplifiesthe inequalities at the outset.
Equality of achievement for the
essential skills. Positivediscrimination, masterylearning, formative assessment,
as well as all the supportmechanisms aimed at reducing
the initial inequalities.
E – Equality of social fulfilment
Different individual,
motivational and culturalcharacteristics, but without anyhierarchy existing between
them.
Differences in profile of the
results.
The existence of a single
standard for excellence. An“elite” culture and a “sub-culture”.
Individualized instruction.
From equality to equity
While the set of equity indicators presented here lets this debate between different
understandings of equality continue, its main objective is to initiate a discussion about theequity of educational systems in a broader aspect. The “theories” presented above – at least
about equality of access or opportunities (B), about equality of treatment (C) and about
equality of achievement or academic success (D) - are limited in a double sense. First, theyare “local” theories about justice, which consider education as a final asset (except for the
final principle about equality of social fulfilment (E)). The consequence of the distribution of education on social justice – what can be called external equity, by analogy with the
difference made by the economists between internal efficiency and external efficiency of
education – is not taken into account. For instance, discussions about equality of assets do notconsider the nature of the “main skills” that are to be reached, those skills being linked to the
8/2/2019 Equity in European Educational System
http://slidepdf.com/reader/full/equity-in-european-educational-system 15/151
15
skills required for adult life. Secondly, they are “intuitionist” theories (in Rawls’ meaning,
1972) because they rely on several principles of justice that are not organized into a hierarchy
because they are not explained and, consequently, that are likely to contradict each other. For instance, equality of treatment can be supported by defenders of the equality of results who
think that the first one will be sufficient to achieve the second, as well as by the defenders of
the “principle of natural reward” who think that the reward (in this case, what is learnt) willthen be proportionate to the effort (Trannoy, 1999).
A pessimistic summary of this situation would be that it is, therefore, not worth measuring
inequalities in education at all, since their consequences on the really important inequalities(that affect adult life) are not known, or because the same resultant inequalities may beconsidered as unfair by some and as legitimate by others. However, such a summary would
be misjudged, for a number of reasons. Perhaps most simply, inequalities in education are
important in themselves because for the students education is a large part of their life andschool their society. In addition, there seems to lie beneath all of these conflicting versions of
equality a common latent notion of fairness (or ‘equity’).
Since the publication of A Theory of Justice by Rawls in 1972, a debate has been ongoingwithin political philosophy. Several general theories have been developed, in which it is
possible to imagine justice in education while avoiding “local” and “intuitionist” approaches:
including, Walzer’s (1997) theory of spheres of justice, Sen’s (1982, 1992) theory of capabilities, or the theories of responsibility of (Arneson (1989) andRoemer (1996), among
others. These all require that rewards should be proportionate to “efforts” and, consequently,
that inequalities of “talents” or threshold starting points, for which individuals are notresponsible, should be balanced by opposite inequalities of “resources”.
For our objective of creating a set of indicators of equity, it is important to note that none of
these theories is universally recognized. The existence of several theories does not mean they
invalidate each other, but rather leads to consider the issue of justice within a framework of the discussion they provoke. Thus, a set of indicators is useful because it provides an
important input to the equity debate. International comparisons are all the more important because an inequality, however the theories of justice judge it, is all the more inequitable if it
is clearly avoidable (Whitehead, 1991). The inevitability of inequality is a favourite argumentof the defenders of not taking action. Of course, the fact that no country has succeeded in
avoiding an inequality is not enough to prove it unavoidable. It may just mean that none of
those countries did what was needed to avoid that inequality. But there is an asymmetry here.If the inequality is clearly reduced by one or more countries, then the others must countenance
some blame for not doing likewise if that inequality is deemed unjustified in theory.
The indicators presented here are intended to provide input to the debate on justice in
education, by offering some elements of response to the following questions:
(1) To what extent do specific educational inequalities have major social consequences for individuals ? What is the importance of those inequalities ?
Are they due mainly to the context, or to the process, of the educational system ? Are they used to help the disadvantaged?
(2) What is the importance of educational inequalities between girls and boys or between groups of different social, economic or national origins? To what extent are they due to the societal context or rather due to the process of theeducational system ? To what extent are they aggravated by the society or the
labour market ?

8/2/2019 Equity in European Educational System
http://slidepdf.com/reader/full/equity-in-european-educational-system 16/151
16
(3) To what extent does being below an apparent minimum skill threshold haveimportant consequences for individuals in and outside the school context ? What is the proportion of individuals who find themselves below that threshold? What
proportion of each group is beneath that threshold? Is the fact of being belowthe threshold due mainly to the socio-economic context or rather to the
educational system itself?

8/2/2019 Equity in European Educational System
http://slidepdf.com/reader/full/equity-in-european-educational-system 17/151
17
Eight guiding principles for a set of indicatorsTo devise the indicators successfully in a systematic and collegial way, the multi-disciplinaryinternational team drew up a preliminary framework. This provides the structure for the
indicators presented in the second part of this publication. The structure adopted has beenmodelled through examining existing literature which generated several guiding principles
and helped determine the design and selection of the indicators.
A first principle
Principle 1
The indicators must enable discussion in the context of the various existing principles of
justice, and not fit only one of them.
In order to answer, as broadly as possible, the various questions that arose, without predetermining the answer according to a particular principle, it was considered necessary to
create a considerable variety of indicators, so that differing visions of justice can be comparedwith the available data.
The main approaches to justice applicable to education are, if the libertarian5
andcommunitarian6 principles are excluded :
• Utilitarianism, which judges equity by the maximisation of the overall quantity of education passed on, or by the relevance of the meritocratic sorting process combined
with an optimum definition of the various levels of education to be attained. In theinitial analysis, this refers rather to an approach based on efficiency;
• Rawls’ theory, which stipulates that, under control of certain liberties, the
production of education should encourage the “fair equality of social opportunities”and that other inequalities of education, in particular the inequalities of skills between
the more and less educated, must be turned to the benefit of the most disadvantaged7.
• Walzer’s theory of spheres of justice (1997), for which the criterion is thatinequalities in education must be independent from the inequalities observed in other
spheres (such as economical and political);
• Responsibility theory (Roemer, 1996, Fleurbaey, 1996) endeavours to combineseveral principles to imagine a fair allocation of resources between individuals defined
by their "talent” – this word defines everything for which they are not responsible –
and their effort – for which they are responsible (Fleurbaey, 1996). Thus, according to
Arneson (quoted by Fleurbaey, 1996), what is important are not the resources owned by the individuals, but rather well in which way these resources help the individuals to
5 These are a juridical approach and do not come under an approach using indicators. Although libertarians
could perhaps be interested in indicators about the degrees of liberty offered by educational systems. 6 We shall not be dealing with communitarian theories either (Sandel, Taylor), which are presented andcompared with liberal theories in Berten et al. (1997) and in Kymlicka (1999). They stipulate that equity can
only be founded on more fundamental values than itself, those values that weld the community together, andtherefore the definition of a just society may vary from one community to another, which probably invalidates
attempts like ours.
7 On the application of Rawls’ Theory of Justice to education, see Meuret (1999). For a presentation of thesetheories in greater depth, see Benadusi (2001) and Meuret (2001a).

8/2/2019 Equity in European Educational System
http://slidepdf.com/reader/full/equity-in-european-educational-system 18/151
18
act or to be. Trannoy (1999) applies it to education, proposing a combination of the
principle of compensation (“Equal achievement for equal work”) and the principle of
natural reward (“Equal resources for equal talent) during the school career of a singleindividual.
• Sen’s theory (1982, 1992), which stipulates that individuals must have equalcapabilities to achieve modes of "functioning” that they have reasons to enhance.
According to this first principle, the fields that would be covered had to be selected, and a
joint method of collecting and processing the data had to be determined. The adopted
procedure was structured by devising a two-dimensional framework in which the equityindicators would be incorporated. The first axis of the framework – the horizontal axis which
structures it into columns – serves as the theoretical support for collection, analysis and presentation of the data. The second axis – the vertical axis that cuts the framework into rows
– enables us to determine and structure the fields of research (Table 2, p.24).
Structuring the framework into columns
Two guiding principles led to the organisation of the framework in columns.
Principle 2
The relevant educational inequalities for the majority of assets distributed in the context
of educational systems may be grouped into three main families: discrepancies between
individuals, inequalities between groups, and the proportion of individuals who find
themselves below a minimum threshold.
The contribution of Rawls, Walzer and Sen’s theories led us to consider justice in education
from three angles.
1. Individual skill inequalities must not jeopardize social cooperation.
The first approach, which corresponds to the first column of the framework, is that of inequalities between individuals. But why should we be interested in inequalities between
individuals? It is important to be interested in them, first of all, for political reasons. Rawls(1987) is less in favour of a redistribution of a social democrat type than of am “owner
democracy”, in which the inequalities of primary income are limited. In his account, political
equality and thus, the quality of the democratic process is better assured in this way. If toolarge an inequality of wealth threatens political equality, then too large a skill inequality also
threatens it. Furthermore, fair equality of opportunities as well as a small gap between theskills of the least and the best qualified are conditions required to enable everybody to feel
part of social life, on an equal basis, which is undoubtedly the final objective of this theory of
Justice8.
If school helps to “make a society altogether”, it must not produce too large discrepancies between individuals. Rawls produces another argument concerning the skill level attained,
when compared with others. If this constitutes one of the bases of self-respect, then the
Rawlsian rules are to be applied, particularly the one asserting that fair education inequalitiesare those that turn out to be necessary to maximise the self-respect (or education) of the
individuals who have the least of it. So it appears that we may increase the level of the
8 « When the individuals trust the pleasure they can have when applying their own capacities, they are ready to
appreciate the perfection of the others, particularly when the plurality of their excellences find a place in a formof life of which everyone does accept the objectives. » (1987)

8/2/2019 Equity in European Educational System
http://slidepdf.com/reader/full/equity-in-european-educational-system 19/151
19
highest, only if the level of the lowest ones increases still more, so as to reduce the gap as has
been observed in some developed countries (e.g. Gorard 2000).
On the other hand, it is necessary to analyse individual inequalities via an economic approach.
OECD (2001) mentions that “the issues of reciprocal understanding and adjustment in theinstitutions” as a reason to limit the inequalities at school.But is it possible to attribute to the
school, rather than to intelligence, effort or family background differences, the mainresponsibility for the production of individual skill inequalities? While this idea can seem
exaggerated, it should be noted that school, from the nursery level onwards, seems to increase
the inequalities produced by these three sources, favouring systematically the strongest rather than the weakest, through teachers’ least conscious and most daily behaviours, through themost ordinary and, so far, the least perceived aspects of the school life. School itself, through
its present organisation, increases the inequalities of capacities between individuals,
theoretically for the good of all.
One of the limitations of this approach is that a measure, on a common scale, of the skills of those who left the education system the earliest and the latest, is not easy to design. It is more
practical to assess the discrepancies observed towards the end of compulsory education, at theage of 15. However, it seems that the skill differences measured at that age are not withoutexternal consequence: in the IEA surveys, the countries where the mathematics skill
discrepancies are the largest are also the countries where wage inequalities are the mostimportant (Bedart & Ferrall, 2003).
2. The social membership of an individual must not handicap his/her school success.
The second, which corresponds to the second column in table 1, is that of inequalitiesbetween groups. It illustrates the principle of equal opportunities and that of the independence
of spheres.
It is well-established that educational attainment varies systematically by social and economicgroups. In nearly all studies, differences have been found post hoc in the attainment of boys
and girls, different language and ethnic groups, and different social class backgrounds. It is
also becoming clearer that these categories of differential attainment interact in such a waythat it is not feasible to suggest that the categories themselves are the determinants of success
at school (Gorard and Smith 2004). Differences between ethnic groups, for example, may bedisguised versions of social class differences combined with language differences (or, of
course, vice versa). An equitable school system would be one in which outcomes were in no
way determined by membership of one or more of these groups, and in which appropriate(compensatory) allowance was made for different points of origin.
3. No student may leave the educative system while being below the minimum skill
threshold, in order to have a decent life in the modern society.
We can refer this threshold as the equality of “functionings” of Sen (1982, 1992) –
particularly the one he defines as: “having self respect” – or to the “basic curriculum” thateveryone must master, according to Walzer (1997). Being below certain skills thresholds is
probably the educational situation that can have the most serious social consequences for theindividual. Of course, the definition of the threshold and therefore of skills that are situated
below and beyond it, may vary. Several documents from the European Commission refer to
the “employability” of individuals by the productive machine. Other authors refer tominimum skills to participate in democratic life, and to assert one’s rights (Gutmann, 1999;
Benadusi, 2001).
It is also necessary to note the presence of certain special groups below the threshold. Indeed,it is relevant to observe whether most individuals below a threshold belong to a similar social

8/2/2019 Equity in European Educational System
http://slidepdf.com/reader/full/equity-in-european-educational-system 20/151
20
group (see above), or, on the other hand, appear to share no common background
characteristics.
In the pilot study that was carried out9, 10 % of students questioned chose the first principle as
the most important to them; 53 % the second principle, and 37 % the third (indicator A.4.2).These principles correspond, to varying degrees, to criteria of justice found among students.
Principle 3
Among relevant categories for individuals, the most important are those from which the
individual cannot escape.
The ideas inherent in the second column of the framework, the examination of inequalities between groups, led us to determine the criteria to define and differentiate categories of
individuals. Our choice will be imperfect, because the concept of “what is important” ishistorically determined. Many observers from thirty-five years ago would not have seen any
great problem if inequalities between boys and girls did not appear in such a system. Actually,
establishing relevant categories is more a matter for political or social movements than for
administrators or philosophers themselves (Orfield, 2001). However, the authors hope that thedevised system of indicators will be able to identify what is “causing problems” from the
point of view of justice according to the shared conscience of our time. It is one of the reasons
that made them undertake a survey on the student’s criteria of justice.
The priority categories must be, in the authors’ opinion, those to which the individual belongs
whether he/she wants to or not. One might consider, for example, that geographicalinequalities are less important than others are, to the extent that it is possible to leave an
under-resourced region, in a way that it is not possible to change social or national origins,
and sex10
or a disability at birth.
In general, we calculated indicators for three categories, according to individuals’ socio-
economic status, national origin and sex.
Structuring the framework into rows
Once these three angles of approach were determined for analysing justice in education, it was
necessary to make a selection of the areas of research that would enable several concepts of justice to exist side by side, in accordance with our first principle, and, in accordance with the
objective of the project, to compare different educational systems, particularly on the basis of
the assets they produce.
Principle 4
Among the assets distributed by the educational system, we need to concentrate on thosewhere fair distribution is most important for individuals or for the democratic life of the
country.
9 For details about the European pilot survey on the feelings on justice at school, see the annex online :http://www.ulg.ac.be/pedaexpe/equite/.
10 A certain amount of attention needs to be paid to the interactions between categories (girls and boys fromminorities do not have the same behaviour, or the same careers at school), and the fact that the assets that pose a problem may not be the same from one category to another. For example, it is difficult to claim today that girls
are disadvantaged from the viewpoint of the duration of their studies, while they may be disadvantaged for certain courses of study or for certain aspects of the process.

8/2/2019 Equity in European Educational System
http://slidepdf.com/reader/full/equity-in-european-educational-system 21/151
21
The assets distributed by the educational system are the immediate results of schooling
(knowledge, attitudes, skills, qualifications), as well as its mediate results (social position,
professional status, employability) and certain aspects of the educational process (length of schooling, public spending on schooling), as well as minor assets whose repeated distribution
has a high impact on shaping the pupils (punishments, reprimands, smiles, friends, etc.). The
assets that form part of the process are less “final” than those of the first two categories, butthey have the advantage of really being assets distributed by the system: skills, qualifications
and even more so professional status are, in reality, the result of the use by individuals of services received from the educational system and not direct products from this system.
Principle 5
It is important to measure not only inequalities in the results of education, such as
performance or careers, but also inequalities upstream of the education system and
those that affect the teaching process itself.
Our objective is to provide evidence on the equity of education systems, not simply on equity
in the education situation of each country. Our comparative perspective leads to social or economic inequalities located upstream of the education system. Therefore, we must consider
both the social context within which education systems function and the fairness of the
processes that characterize that functioning. Educational inequalities are related to bothexternal and internal phenomena.
Sociology has improved our comprehension of external mechanisms, and proposes less
deterministic theories, that are more open to the possibility of corrective action than thirty
years ago (Benadusi, 2001; Duru-Bellat, 2002). However, it is clear that external factors havean influence. Shavit and Blossfeld (1993) concluded that the fall in educational inequality
observed in a small number of countries (Sweden, Netherlands) is explained rather by a fall insocial inequalities, or the greater security acquired by the poorest people in these countries,
rather than by educational reforms. It is logical to think that the greater the inequalities in acountry (in wealth, social capital, cultural capital), the more unequal are the resources thateach person can devote to education, and the greater the mobilization of these resources by
those who possess them, in order to ensure, via success at school, that their children will besuccessful. The measurement of certain dimensions of the context, located upstream of the
educational systems, is therefore necessary to understand educational inequalities and to
pronounce judgement on equity in education systems. If system A has the same educationalinequalities as system B, while country A is much more inegalitarian than B, then one has to
conclude that education system A is fairer than B, because its compensating effect is actuallystronger.
However, we know that these external inequalities also act through internal inequalities. Some pupils (from poor families or other countries) receive less attention from teachers than other
pupils (Sirota, 1988). Another example: the later the branching point between short and longcourses of study is situated in a school career, the later the differences in income will come
into the cost/benefit calculation for individuals (Boudon, 1973). Furthermore, we know thatcertain purely internal inequalities can have perceptible effects: pupils labelled as poor, those
who have to repeat a year whatever their social origin, may receive less attention due to the
effect of unequal expectations. We also know that weak and disadvantaged pupils – who aresometimes, but not always, the same – make less progress than other pupils during a period,
due less to their initial handicap (the weak ones) or external handicap (disadvantaged), thandue to the fact that they have poorer learning conditions than other pupils (Grisay, 1997).
Bringing together weaker pupils is not to their advantage (Slavin, 1987, 1990) or is harmful tothem (Vandenberghe et al., 2001; Duru-Bellat et Mingat,1997), which leads one to consider

8/2/2019 Equity in European Educational System
http://slidepdf.com/reader/full/equity-in-european-educational-system 22/151
22
that the stratified of socially segregated nature of classes and schools in a school system will
be an iniquitous factor.
According to some theories, the conditions for these inequalities arising do not matter, while
for others –responsibility theory, for example – they are fundamental. If inequalities between pupils can be explained by the fact that resources of lower quality have been given to young
pupils with fewer “talents”, instead of seeking to overcome that weakness by allocating better quality resources, they are unjust. On the other hand, inequalities are not deemed unjust if
they are due to differences in will on the part of pupils or, if they are very young, of their
parents11
. So we also need to provide elements that help to answer the question: does thefunctioning of the education system play a compensatory role in relation to the inequalitiesthat we inherit, or does it aggravate them?
Principle 6
It is important to understand injustices connected with school life, such as the way
pupils are treated by the institution, its employees or their classmates.
While we should take an interest in the educational process, it is not only in inequalities in process leading to inequalities in the results of education; it is also that some of them areimmediately unfair as part of the pupils’ experience. Although the fact that some pupils are
humiliated (Merle, 2002), or despised (Dubet, 1999), may have no long-term impact on their
school career, these pupils will still suffer, and will still be victims of inequity. For a longtime, the importance of the school experience was played down. If this is less the case today,
that is not only because we are more aware of the role that it plays in the creation of learning
inequalities (see above), it is also that it forms an essential element of the political judgementthat users (parents, pupils) form of the equity of the system and, through that, about the
institutions of their country. That is why we attempted to measure the injustice that affectsthis daily experience for pupils, by questioning a sample of eighth-grade pupils, and their
teachers, on the feeling of justice at school via a pilot survey conducted in a sample of schoolsin the five partner countries. The results of this exploratory study should be viewed withcaution. The indicators derived from this study are still considered ‘experimental’
12.
Principle 7
Because a fair education system is also a system that favours social fairness, the
indicators must relate not only to educational inequalities, but also to the social and
political effects of those inequalities.
Equity in educational systems also depends on phenomena that are located upstream, if oneaccepts the idea that a fair educational system is not only a system that distributes education
equitably, but also a system that distributes education in such a way that it makes societyfairer.
11This topic should be developed since that “individual will” could be altered by a realism censuring more the
less advantaged groups, in such a way that “Nobody has never studied in my family” or “Workers do not go touniversity”, etc. Further phenomena also interfere with what could be considered as personal aspirations: feelingof betraying one’s original group, social pressure, lack of figures that would help to identify oneself, feature of
strangeness or of abstraction of some domains, … The review of personal socio-occupational expectationsaccording to the membership group helps to throw light on the debate (Gorard and Rees, 2002 and the following
indicator A.3.3).
12 For more information about the coordination, design and administration of the study on the feeling of justice,we refer the reader to the technical annex, which is available online : http://www.ulg.ac.be/pedaexpe/equite/.

8/2/2019 Equity in European Educational System
http://slidepdf.com/reader/full/equity-in-european-educational-system 23/151
23
The system of indicators explores the social effects of educational inequalities. That
exploration can take two forms, individual or collective. The individual arrangement explores
the social consequences, for an individual, of being near the top or bottom of a schoolhierarchy, as defined by both opportunities and outcomes. The collective arrangement
explores the effects on social justice of the allocation and use of resources that the education
system places at society’s disposal, in particular by the most educated people.An example of the relevance of an exploration of the individual effects is as follows. One
observes, comparing several countries, that educational equality is greater in those where
credentialism is less pronounced, i.e. where the role of qualifications in access to employmentis less marked (Duru-Bellat, 1998), as if it is possible to afford greater educational equalitywhen this has no consequences for social inequality. However, if lower inequality of
opportunities in education has the consequence that social reproduction uses other channels
than education, the gains will be less than if it led to greater social mobility. Likewise, if inequalities in education between nationals and recent immigrants are particularly low, but the
barriers to join the labour market mean that immigrants cannot find a job that matches their
qualifications, then the effect of the equity of the education system on social equity will beweakened accordingly.
The collective effects of educational inequalities may be illustrated in the following way, by
drawing on the difference principle proposed by Rawls (1987). Depending whether doctors ina country only treat the rich, or rich and poor alike, the spending allocated to training them
will be unfair or could be fair. Similarly, depending on whether economic growth benefits the
poorest or not, the spending on training of skilled workers, engineers, researchers, managers, bankers, corporate lawyers, who contribute to that growth, will have been more or less fair.
Depending on whether the most educated people leave school with a feeling of solidarity withthe poorest, or on the contrary with contempt and arrogance, and depending on whether they
devote more or less time, outside work, to activities in favour of these categories, the
education system will have been more or less fair.
Principle 8
The system of indicators must measure inequalities, but also the perception of them; it
must also identify the judgement of citizens about equity in the current education
system, and the criteria underlying those judgements.
As we announced in the introduction, a special place must be kept for judgements about
educational equity expressed by the citizens or by the educational actors.
However powerful the social mechanisms that produce education inequalities are, they canonly be exercised if citizens tolerate them. In other words, a majority of citizens consider the
inequalities, as at least insufficiently unjust to accept the cost of a political battle against thesemechanisms, or a majority of citizens is not so sure about the injustice that they would seek to
remedy it. If equity in education is a political problem, of course it is important to know that
judgement and the criteria on which it is based. Questioning citizens from European UnionMember States was beyond our means in this study but, we carried out a study with students
and teachers from our five countries. This related not only to the justice with which pupils aretreated, as we saw before, but also to the idea the people questioned have about an idealised
fair educational system –based on their criteria of justice and their judgement on the equity of
the educational system in general.
Such a survey is not without difficulties. Questioning individuals about their criteria and
feelings of justice may provide biased answers in three ways: the influence of the socialenvironment may act on the criteria, and make comparisons difficult from one country to

8/2/2019 Equity in European Educational System
http://slidepdf.com/reader/full/equity-in-european-educational-system 24/151
24
another; ignorance of the possible may make some respondents find a situation ‘just’ when it
is not; ignorance of the fate of the others may bias, on given criteria, the comparison between
them, and therefore the feeling of justice. So, the pupils of working-class establishments andtheir parents may, for example, find their conditions of education fair due to ignorance of
what the conditions are in other schools.
Dubet (2001) highlighted a sort of systemic effect: when an educational system allows fewer children from poor backgrounds to scale the heights of school achievement, leaving the others
in lower-quality courses of study, it generates a greater impression of justice, and less
resentment. Where, on the other hand, children of the poor and the rich take the same courseof study, there is a greater sense of inequality even where actual inequality of social chanceshas actually been reduced between the two periods.
However, such biases may be less important than portrayed. For example, the International Justice Project , carried out in 1991-92 in thirteen countries, half of which were countries from
the “West”, and half from the “East”, about sentiments and criteria of justice of adults,showed that individual merit was valued equally in both groups. According to Marshall,
Swift, Routh and Burgoyne (1999), this challenged the idea that the norms of justice of individuals depend on the social environment.
We do not claim that we will come up with a “definitive” measurement of injustice whileresearching into feelings of justice. It is rather a question of initiating a process of measuring
inequalities, comparing them with theories of justice and to criteria of justice declared by theactors and their feelings of justice. It is a matter of recognizing that the theories are uncertain,
as illustrated by the debates between them, and that they cannot be separated from a
consideration of feelings of justice, albeit not well founded on their part. It is also a matter of encouraging deliberation in which feelings of justice are enlightened by the measurement of
inequalities and discussion about criteria of justice, and where the latter is enlightened in
return by the other two
13
.Our Model
We can now model the theoretical framework of indicators of equity of education systems
(table 2). Its vertical axis will be cut into a quaternary structure: context of inequalities in
education; inequalities in the education process; inequalities in education (internal results);and social and political effects of inequalities in education (external results). The horizontal
axis of the framework will follow a ternary structure: inequalities between individuals;inequalities between categories (according to gender, socio-economic origin, nationality); and
individuals or groups beneath a threshold of equity.
13 Actually, this movement is similar to that which, according to Rawls, serves to construct the theoriesthemselves. Deduce the principles of justice – the three principles of his own theory, for example – from
principles or a fundamental, abstract situation (in the case of his theory, that which creates the veil of ignorance),then compare those principles with our “well-considered feelings”. This is the movement that he describes as
“reflexive equilibrium”. Considering the debates between theorists of fairness, we can see that they practice suchreflexive equilibrium: the general form of the criticisms that they usually make is that the theory criticized is precisely a situation that cannot be considered unfair, or vice versa, that it finds a situation unfair that commonsense tells us is fair. For example, Sugden (1993) analyses the reproach that Sen made of Rawls’ theory that it
“presupposes a wish to live together in equality” and therefore cannot assert that even where this wish is absent,a government must feed its people if they do not have the vital minimum.

8/2/2019 Equity in European Educational System
http://slidepdf.com/reader/full/equity-in-european-educational-system 25/151
25
Table 2. The theoretical framework of indicators on the equity of educational systems
Inequalitiesbetween
individuals
Inequalitiesbetween
categories
Individuals / categories
between thethreshold
ou
A. Context of inequalities in education
A.1. Individual consequences of education14
A.2. Economic and social inequalities
A.3. Cultural ressources
A.4. Aspirations and perceptions
B. Inequalities in the education process
B.1. Quantity of education received
B.2. Quality of education received
C. Internal results – Inequalities ineducation
C.1. Cognitive skills
C.2. Personnal development
C.3. School careers
D. External results – Social and political
effects of inequalities in education
D.1. Education and social mobility
D.2. Benefits of education for the disadvantaged
D.3. Collective effects of inequalities
Taking account of the available data, we operationalised this theoretical framework for
devising equity indicators into twenty-nine examples presented in the second part of thisvolume. Their chronological organization follows the vertical axis of the framework (context,
process, internal results, external results), while the three dimensions of the horizontal axis
(inequalities between individuals, between categories and thresholds of equity) are present in
the commentaries and the graphs. Depending on the principle of justice which guides thereader, his/her reading of this framework will differ. A meritocrat will be more attentive to
inequalities between groups than to inequalities between individuals. A Rawlsian will bemore inclined to attach importance to the question of the social customs of the most highly
educated. A libertarian may be shocked that one can even ask this question, and so on
This framework is intended to be read in the following way: the inequalities affecting the
internal results and the process, will point out, on an equal scale, an iniquity in the educationsystem, especially where:
1. their consequences on the future life of pupils are important (external results);
2. they must be allocated to the education system (process) rather than social inequalities themselves (social and cultural context);
14 The use of the term « consequences » can seem surprising or irrelevant in the part about the educational background. It reflects the difficulty for the authors to locate some elements as results or as backgroundelements, the results of education developing in the long run into educational background elements. The
presentation of the framework is linear but it could be more easily considered in a circular way (like Demeuseand Baye do, 2005).
≠ ≠

8/2/2019 Equity in European Educational System
http://slidepdf.com/reader/full/equity-in-european-educational-system 26/151
26
3. they are used less to benefit the most disadvantaged, and they have a seriousimpact on the judgement by citizens or users relating to the justice of theeducational system and they convert into a loss of trust into institutions and reduced socio-political participation.
In principle, this line of reasoning can be put forward for each of the three criteria of justice(the three columns) of the framework, because some of the questions raised above correspond
better to any one criterion of justice more than others. So that, when set out according to the
criteria, the questions above could be re-formulated like this:
1. What is the importance of inequalities in the educational systems of the European Member States ?
2. What are the advantages related to education in the European Member States ?
3. Do European educational systems amplify or reduce contextual inequalities ?
4. To what extent do educational inequalities benefit the disadvantaged and encourage social mobility ?
The second part of this volume shows the indicators calculated for the 15 countries whichconstituted the European Union when this work was undertaken. The third part answers the
four questions above.
We hope that this structure and the data supplied will encourage and contribute to the
reflection about equity in each of the European educational systems in particular, and aboutthe equity of our shared values in general.

8/2/2019 Equity in European Educational System
http://slidepdf.com/reader/full/equity-in-european-educational-system 27/151
PART 2
A set of 29 indicators on the equity of
the educational systems

8/2/2019 Equity in European Educational System
http://slidepdf.com/reader/full/equity-in-european-educational-system 28/151

8/2/2019 Equity in European Educational System
http://slidepdf.com/reader/full/equity-in-european-educational-system 29/151
29
The second part of the work is completely devoted to the 29 indicators built to judge the
equity in the European educational systems. The indicators are organized according to the
theoretical framework presented in the first part of this work.
Each indicator is presented on a double structured page. The figure 1 shows the organization
of this typical sheet and the information it contains. This structure limits the place devoted tothe comments but allows the adoption of an identical approach for all the indicators. The aim
of such a structure of data is to ensure their legibility at best and to let the possibilities in the
interpretation of the collected data open.
Figure 1: Typical sheet for the presentation of the indicators
Title of the
indicator
Positionoccupied by
the indicator in the system
Summary
Commentson graphsand tables
Sources
Inequalitiesbetween
categories
Individuals
below thethreshold
Technical notes
Countries for which data are available
Comments,reading notes
The left page includes the indicator title of the indicator, the comments, the used sources and
a brief technical note. This technical note can be completed, in certain cases, by a more
detailed methodological appendix.
Below the left pages, the coloured boxes are used to show the European countries for whichthe data is available. When the data left for one country, the correspondent box is white; if the
date is partially available, the box for this country is lightly coloured. Finally, the countries
for which the data are completely available have a stronger coloured box.
The right page presents the collected data in tables and or graphs; according to the three
columns of the theoretical framework. This page gives the position of the indicator in the
global system (numbered indications above on the right, used colour and the frame situated on
the extreme right is brought to the fore). The indicators of context are in blue, those
concerning processes in yellow, those about internal results in green and those about external
results in red.

8/2/2019 Equity in European Educational System
http://slidepdf.com/reader/full/equity-in-european-educational-system 30/151
30
Some of the 29 indicators are derived from the European survey on the feelings of justice at
school. They can be distinguished from the others by a grey tint page, because of their
experimental nature (see technical annex1).
1 http://www.ulg.ac.be/pedaexpe/equite/
8/2/2019 Equity in European Educational System
http://slidepdf.com/reader/full/equity-in-european-educational-system 31/151
31
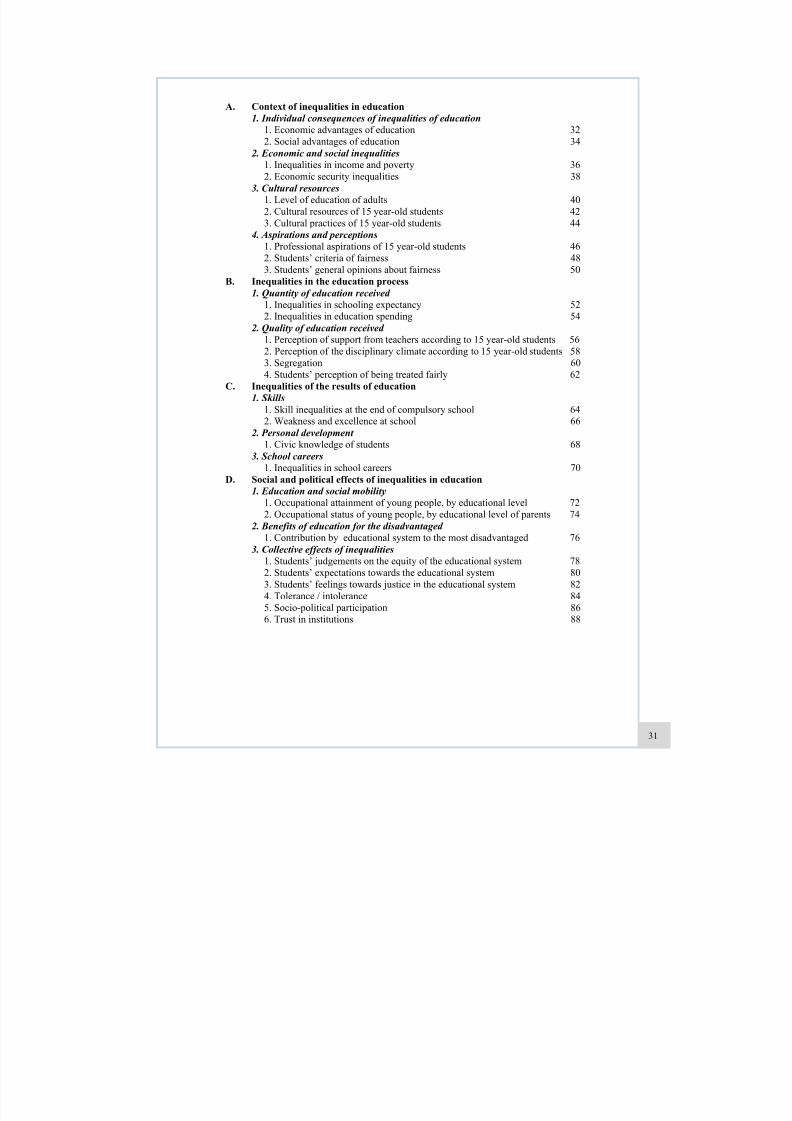
A. Context of inequalities in education
1. Individual consequences of inequalities of education
1. Economic advantages of education 32
2. Social advantages of education 34
2. Economic and social inequalities
1. Inequalities in income and poverty 36
2. Economic security inequalities 38
3. Cultural resources
1. Level of education of adults 40
2. Cultural resources of 15 year-old students 42
3. Cultural practices of 15 year-old students 44
4. Aspirations and perceptions
1. Professional aspirations of 15 year-old students 46
2. Students’ criteria of fairness 48
3. Students’ general opinions about fairness 50B. Inequalities in the education process
1. Quantity of education received
1. Inequalities in schooling expectancy 52
2. Inequalities in education spending 54
2. Quality of education received
1. Perception of support from teachers according to 15 year-old students 56
2. Perception of the disciplinary climate according to 15 year-old students 58
3. Segregation 60
4. Students’ perception of being treated fairly 62
C. Inequalities of the results of education
1. Skills
1. Skill inequalities at the end of compulsory school 642. Weakness and excellence at school 66
2. Personal development
1. Civic knowledge of students 68
3. School careers
1. Inequalities in school careers 70
D. Social and political effects of inequalities in education
1. Education and social mobility
1. Occupational attainment of young people, by educational level 72
2. Occupational status of young people, by educational level of parents 74
2. Benefits of education for the disadvantaged
1. Contribution by educational system to the most disadvantaged 76
3. Collective effects of inequalities1. Students’ judgements on the equity of the educational system 78
2. Students’ expectations towards the educational system 80
3. Students’ feelings towards justice in the educational system 82
4. Tolerance / intolerance 84
5. Socio-political participation 86
6. Trust in institutions 88

8/2/2019 Equity in European Educational System
http://slidepdf.com/reader/full/equity-in-european-educational-system 32/151
The additional in-
come earned by a
tertiary education
graduate comparedwith that of a person
with qualification
from primary educa-
tion rises, on aver-
age, to 64% among
men and to 45%
among women.
In terms of employ-
ment rate, the ad-
vantage for women
with a tertiary edu-
cation diploma com-pared with those
who have only a
qualification from
primary education is
over 100 %. For
men, this advantage
rises only to 25 %.
Finally, on average,
the financial return
of an additional year
of education rises to
7 % for men and to 6
% for women.
The measurement of income corresponds to a person’s total salary and income during the calendar year preceding the survey.
It includes all amounts received by way of salary, bonus, 13th month, and other annual bonuses. It is generally exempt from
employer’s contributions to tax and social security, but gross of personal taxation and social security contributions. The incomeunder consideration relates to salaried employment. Norway and Sweden also include the income of the self-employed.
In this case, the employment rate corresponds to the ratio between people in paid employment and the total number of people of working age.
The return of education is estimated using the logarithm of gross hourly salary (AUT, GRE, ITA, NDL and ESP use the net
salary failing other data). The value of the return (r) is estimated in the following Mincer equation: ln(y)=a+r.S +b.EXP+c.EXP2 where S is the number of years of schooling completed, and EXP is the professional experience. The coeffi-
cient r (tab. 2) corresponds to the first derivative of ln(y) relative to S and represents the percentage income growth following
an increase in the duration of education by 1 year. In effect, dln(y)/dS=(dy/y)/ds=r
The economic advantages of education are mainly of two kinds: higher pay levels (higher salary)and a higher employment rate (greater propensity to obtain employment and lesser risk of unemployment). The economist tradition focuses on the first effect. Most of researches point out the
first effect. However, a substantial proportion of the effects of qualifications obviously is reflected interms of the status that those persons occupy in relation to the labour market, especially women.
The two dimensions (income and employment) are illustrated in the context of this indicator inTable 1, which is based on the data from the Luxembourg Income Study. We observe that, on average,the additional income earned by a tertiary education graduate compared with a person with
qualifications from primary education only rises to 64 % among men and to 45 % among women.
Table 1 also gives the effects of education on the probability of obtaining gainful employment(employment rate). This variable is particularly sensitive to the level of education, especially in thecase of women. On average, among the countries examined, we observe that the advantage for womenwith a tertiary education diploma rises to over 100 %. Among men, the effect rises to only 25 %. As
for the income aspect, there are great differences according to the country. But this time, the dividingline is intra-European: we observe that the effect of a tertiary diploma on female employment rates is
quite simply massive in countries like Italy or the Netherlands, since the gap there is over 200 % between women with low qualifications (primary) and those who hold a higher education (tertiary).
It is also useful to refine the measurement of the individual consequences, in particular on pay, to
take account of career seniority. Becker’s theory of human capital (1964) indicates that individualsacquire skills and knowledge that can be exploited in the labour market essentially via two channels:education – our key preoccupation – and professional experience. Everything indicates that experienceas such does indeed influence salary levels. It is only logical to extract from the measurement of therelationship between education and income the part which corresponds to professional experience. In practice, this boils down to calculating – for a given level of professional experience – the percentage
of income growth corresponding to a unit increase in the number of years of education. Table 2 showsthe results obtained for a group of EU countries, and for Norway and Switzerland, studied as part of
the PURE project.
We can see that the return per additional year of education is generally of the order of 7 % for menand of 6 % for women. However, the situation varies quite widely depending on the country. InIreland, Greece, the Netherlands, Portugal and France there is the greatest gender-related differentialin return. It is virtually zero in Austria, in Finland and in Norway. We should point out that thesedifferences in return between the genders prevail when professional experience is equivalent. Thedifferences that are highlighted point towards discrimination between men and women, which is not
due to the fact that women spend less time in employment due to childbirth.
Economic advantages of education
Sources:
Luxembourg income study,http://www.lisproject.org.
PURE (Public Funding and
Private Return to Education,http://www.etla.fi/PURE)
Becker (1964, Human Capital. A Theoretical and Empirical
Analysis with Special Referenceto Education. Chicago Univer-
sity Press
32 B DK D EL E F IRL I L NL A P FIN S UK CH NO

8/2/2019 Equity in European Educational System
http://slidepdf.com/reader/full/equity-in-european-educational-system 33/151
A.1.1.
Table 1. Employment rate and salary: graduates from tertiary education versus those with qualifications
from primary education (25-59 year olds)
Table 2. Rate of return for a year of education
Source: Luxembourg Income Study
Source : PURE (1995)
* Old Länders
Country Year
Employment rate of graduates
from primary education (%)
Employment rate of graduates
from tertiary and primary
education (%)
Ratio of graduates from terti-
ary and primary salaries (%)
Male Female Male Female Male Female
GERMANY 1994 78 54 19 52 57 56
ITALY 1995 78 21 12 72 70 66
NETHERLANDS 1991 69 15 35 93 60 43
FINLAND 1995 72 66 30 38 75 73
SWEDEN 1992 91 81 06 18 55 41
UNITED KINGDOM 1995 70 60 28 35 72 96
NORWAY 1995 85 61 12 47 33 67
Mean 75 49 25 13 64 45
Country Male Female Difference
DENMARK 6 6 1GERMANY* 8 7 1
GREECE 6 4 2
SPAIN 7 6 2
FRANCE 8 6 2
IRELAND 9 7 3
ITALY 6 5 2
NETHERLANDS 6 5 2
AUSTRIA 7 7 0
PORTUGAL 10 8 2
FINLAND 9 9 0
SWEDEN 4 3 1
UNITED KINGDOM 9 8 2
NORWAY 5 5 0
SWITZERLAND 9 8 1
Mean 7 6 1
D
. E x t e r n a l R e s u l t s
C . I n t e r n a l R e s u l t s
B . P r o c e s s
A . C o n t e x t
33

8/2/2019 Equity in European Educational System
http://slidepdf.com/reader/full/equity-in-european-educational-system 34/151
By convenience are mentioned here the « effects » of education, but in fact, the indicators only measure associations between
the fact to have completed tertiary education and the fact to get such or such social advantage. They cannot pretend to make
a relation of cause and effect since the observed association can be created by the action of a third variable, acting both on
schooling and social advantage.
Several indicators are established from PISA 2000 data. Consequently, they do not cover all educated adults of the country,
but only the parents of a 15-year-old child. In some respects, this “bias” is positive: the parental vocational status is thus
measured at an age at which it is relatively stable. In other respects, it is less positive: the advantages for people who have no
children are not taken into account. The effect of education is undoubtedly more direct on the first job, which led Shavit and
Müler (1998) to take this one in their international comparisons. .
The aggregation of these indicators results from a simple algebraic addition of the number of times the countries distinguishthemselves in one sense or the other (i.e. they belong to the country group where the indicator is particularly strong or weak),
weighting by a coefficient 3 the indicators on status and unemployment and by a coefficient 1 the other indicators. For in-
stance, Greece receives a 3 (for status), a -3 (employment), -1 (cultural practices) =0 (communication with the parents) + 0
(achievement in reading literacy). score in reading litteracy = -1.
These indicators aim to understand the value of a successful school career via the measurement of social advantages associated with it. The greater the advantages are, the more unfairness in thedistribution of education becomes an issue. The indicator compares the possession of a desirable
characteristic among those who have received higher education and those who have not.Some effects are felt on working life here dealt with by the vocational status and the chances to get a
job. The link between education and vocational status is very strong in some countries (Spain, Greece,Portugal) and in Finland. It is particularly weak in the United Kingdom, Sweden and Norway. As to protection against unemployment, Spain, Greece, Portugal and, to a lesser extent, Italy where theeffect of education is low, set themselves apart from the United Kingdom, Sweden and Switzerland,
where it is particularly high.
Other effects of education have an impact on private life. They have been highlighted concerninghealth, marriage, independence, the probability of living in a nuclear family, as well as to skillsacquired at school and the probability of access to continuing education, which may or may not belinked to a job. We only have international comparisons on the latter two aspects. The skills gap inwritten comprehension between people drawn from the two extremes of the school career is
particularly pronounced in Ireland, Norway and Portugal, and low in the United Kingdom, Swedenand Switzerland. In Portugal, Italy and Luxembourg, the participation to continuing education isnoticeably higher for the graduates from tertiary education than for those who have not completed
secondary education.
Yet other effects relate to children’s education: the children of more educated people appear to be in
better health, do better at school, etc. Here are compared inequalities between children whose parentscompleted higher education and others, not only in terms of reading literacy, but also in other desirable characteristics: cultural practices and the quality of communication with parents. Theinfluence of parents’ education on cultural practices is particularly pronounced in the United
Kingdom, Austria, and Germany and particularly low in Greece, Ireland, and Sweden. The link between the education received by parents and the quality of communication with their children is
lower than the previous one. The countries where it is most pronounced are Spain, Portugal andSwitzerland; those where it is lowest are Belgium, Finland, Greece, and Sweden. The advantage in the
marks of pupils is highest in Denmark, the United Kingdom, and Switzerland, and lowest in Ireland,Portugal, Norway and Sweden.
By aggregating* these various criteria into a summary (see below), it emerges that Switzerland, andthen to a lesser extent Portugal are the countries where success at school has the greatest consequences
from a social viewpoint, while it is of lesser importance in Norway and particularly in Sweden.
The consequences of
education on the pro-
fessional status are
greater in Spain, Por-tugal, Greece and
Finland. They are
weaker in the United
Kingdom, Norway
and Sweden.
On the other hand, in
terms of protection
against unemploy-ment, the conse-
quences of education
are weak in Spain,
Portugal and in
Greece. It is particu-
larly great in theUnited Kingdom,
Sweden and Switzer-
land.
The reading achieve-
ment gaps linked to
the levels of educa-
tion are very impor-
tant in Ireland, Nor-
way and Portugal,
and the chances to
take part to continu-ing education are
much more impor-
tant for the most edu-
cated in Portugal,
Italy and Belgium.
In terms of conse-
quences of parents’
education on chil-
dren’s education, the
advantage on thechildren’s reading
skills is the greatest
in countries such asDenmark, the United
Kingdom and Swit-
zerland.
Sources:
Calculations from PISA data.
European social statistics, La-bour Force Survey – Results
2000, detailed tables; Eurostat
theme 3, pp. 182 and 183.
OECD, 2002, Literacy in the Information Age.
OECD, Education at a Glance,
2002.
Social advantages of education
34 B DK D EL E F IRL I L NL A P FIN S UK CH NO

8/2/2019 Equity in European Educational System
http://slidepdf.com/reader/full/equity-in-european-educational-system 35/151
A.1.2.
Table 1. Social advantages of schooling in higher education
(1) Index of professional status (ISEI index) of parents who completed a course of higher education (ISCED 5,6)*100/index of professional status of the
other parents (simple average of values obtained by fathers and mothers) (OECD, 2001)
(2) Unemployment rate of individuals from 25 to 49 years who left school before the second stage of secondary education – unemployment rate of indi-viduals from 25 to 49 years who completed higher education successfully)*100/(unemployment rate of individuals from 25 to 49 years who left
school before the second stage of secondary education) (‘EUROSTAT).
(3) Average score of 20-25 year-olds who completed higher education* 100/average score of 20-25 year-olds who did not reach the second stage of secondary education (OECD, 2002a)
(4) Rate of participation of 25-65 year-olds in continuing education activities whether linked to a job or not: value for individuals who have completed
higher education / value for individuals who left school before the second stage of secondary education (OECD, 2002b)
(5) Deviation of the PISA index of cultural activities depending on whether both parents received higher education (ISCED 5-6) or not, measured in
proportion to the standard deviation of the distribution of the index for parents who did not both receive higher education. Standard errors in pa-rentheses (OECD, 2001)
(6) Deviation of an index of parent-child communication depending on whether both parents received higher education (ISCED 5-6) or not, measured in proportion of the standard deviation of the distribution of the index for parents who did not both receive higher education.
(7) Increase in the score for reading literacy for an additional year of education for the parents (ECD, 2001)
All the indexes increase with the advantages that are received from education. They are described in detail in the methodological annex http://
www.ulg.ac.be/pedaexpe/equite/
D . E
x t e r n a l R e s u l t s
C . I n t e r n a l R e s u l t s
B . P r o c e s s
A . C o n t e x t
35
Country
Consequences on
personal lifeConsequences on children’s education
(15-year olds)
Status
(2000)
(1)
Job
(2000)
(2)
Reading skills
(3)
Continuing
education
(1995-2000)
(4)
Cultural practices
(2000 )
(5)
Communication
with parents
(2000)
(6)
Score for reading
literacy
(2000)
( 7)
BELGIUM 145 74 119 5,2 0,4 (0,0) 0,1 (0,0) 2,6 (0,5)
DENMARK 141 63 118 2,1 0,4 (0,0) 0,4 (0,0) 9,4 (0,7)
GERMANY 135 73 123 3,8 0,6 (0,0) 0,4 (0,0) 5,4 (0,9)
GREECE 149 21 - - 0,2 (0,0) 0,2 (0,0) 3,2 (0,6)
SPAIN 152 32 - - 0,5 (0,0) 0,4 (0,0) 3,6 (0,4)
FRANCE 142 65 - - 0,5 (0,1) 0,3(0,0) 2,7 (0,5)
IRELAND 136 - 130 3,9 0,2 (0,0) 0,2 (0,0) 2,2 (0,8)
ITALY 147 35 - 5,8 0,5 (0,1) 0,3 (0,0) 2,6 (0,6)
LUXEMBURG 148 - - - 0,6 (0,1) 0,2 (0,0) 2,5 (0,5)
NETHERLANDS 136 53 120 2,2 0,5 (0,1) 0,3 (0,0) -
AUSTRIA 141 74 - - 0 ,6 (0,1) 0 ,3 (0,0) 4,3 (0,6)
PORTUGAL 152 21 127 6,9 0,5 (0,1) 0,4 (0,0) 1,1 (0,6)
FINLAND 149 62 120 2,1 0,4 (0,1) 0,2 (0,0) 3,7 (0,5)
SWEDEN 132 76 117 1,9 0,3 (0,0) 0,2 (0,0) 1,1 (0,9)
UNITED KINGDOM 131 82 117 2,3 0,6 (0,1) 0,3 (0,0) 5,5 (0,7)
SWITZERLAND 136 75 115 2,8 0,5 (0,1) 0,4 (0,0) 6,1 (0,7)
NORWAY 133 32 125 2,6 0,3 (0,0) 0,2 (0,0) 2,0 (0,8)
Consequences on
professional life

8/2/2019 Equity in European Educational System
http://slidepdf.com/reader/full/equity-in-european-educational-system 36/151
The concept of income used by the Luxembourg Income Study is that of disposable income, i.e.
+ Gross wages and salaries + Farm self-employment income + Non-farm self- employment income [= Total Earnings EARN-
ING]
+ Cash property income [= Factor Income] + Private pensions + Public sector pensions [= PENSION]= Market Income
+ Social Retirement benefits + Child or family allowances + Unemployment compensation + Sick pay + Accident pay + Dis-
ability pay + Maternity pay V22 + Military/vet/war benefits + Other social insurance [=SOCI]+ Means-tested cash benefits + Near-cash benefits [= MEANSI]+ Alimony or Child Support + Other regular private income [= PRIVATI]+ Other cash in-
come
= Total Gross Income GI - Mandatory contributions for self-employed - Mandatory employee contribution
= PAYROLL- Income tax
= Disposable Income
The concept of poverty refers to the fact of not reaching an essential minimum live in society. This
concept can itself be understood in two ways. First of all, as an absolute level of resources, i.e. a“basket” of goods and services that are considered essential in order to escape from a situation of
poverty. Secondly, one may consider relative poverty. That approach has been adopted here. Povertycorresponds to a new situation where people have less than a certain percentage of the meandisposable income, i.e. the level that divides the population into two groups of equal size. The relative
poverty line in this case is set at 50 % of the mean income.
Graph 1 uses the data from the Luxembourg Income Study. It indicates, country by country, the percentage of children (individuals of less than 18 years of age) living in households where disposableincome is lower than the poverty line. That is a contextual measurement that it is important to takeinto account when we discuss the capability of an educational system to reduce the inequalities. Graph
1 reveals that on average, all countries combined, 9.87 % of children live below the poverty line, butwith great differences depending on the country. At the extremes, we find the USA (22.4 %), Italy
(20.2 %) and the United Kingdom (15.4 %) and on the other hand, Norway (3.9 %), Finland (2.8 %)
and Sweden (2.6 %).
Tables 1 and 2 use the PISA data. Table 1 contains the measurement of inequality based on astandard deviation of the measurement of family wealth. We can see that inequalities of family wealthare particularly strong in Portugal and Luxembourg, particularly by comparison with Finland and
Denmark.
Table 2 shows the discrepancies in family wealth according to the socio-economic profile (strong-
weak) and the nationality of the parents (nationals – foreigners) expressed as a percentage of astandard deviation. If countries and regions are ranked according to the “socio-economic profile”aspect, one can see that the least inequitable countries are situated in the North of Europe: Sweden, Norway, and Denmark. On the contrary, the most inequitable countries are situated in the South:Spain, Portugal. Still in Table 2, , the second dimension, the nationality of parents, has not a positivecorrelation with the previous dimension. Furthermore, no unambiguous tendency seems to show up.
Of course,, there are deviations that are sometimes significant, but may be in the opposite direction,depending on the country. Portugal seems to have a situation where the family wealth of youngsters of 15 years of age of foreign origin is higher than that of nationals. For other countries like Denmark,Sweden, or Austria, the deviation is in the “expected” direction: nationals are richer than immigrants
are.
Table 3 highlights the existing deviations in family wealth between the most disadvantaged 10 %and the average corresponding to the remaining 90 %. When these deviations are expressed inabsolute terms (i.e. without taking account of the degree of dispersion inherent in the country of origin), it appears that the situation is most satisfactory in Austria, Finland, France and Denmark. At
the other extreme, we find countries like Luxembourg, and Portugal.
Inequalities in income and poverty
On average, in all the
countries of the Euro-
pean Union com-
bined, 9.87 % of chil-dren are living in
families below the
poverty threshold,
although there are
large differences de-
pending on the coun-
try.
At the extremes, we
find Italy (20.2 %)
and the United King-
dom (15.4 %), and on
the other hand, Nor-way (3.9 %), Finland
(2.8 %), and Sweden
(2.6 %).
If we take an interest
in fairness as inequal-
ity in family wealth
according to the
socio-economic pro-
file, we observe that
the less inequitable
countries are in the
North of Europe
(Sweden, Norway,and Denmark) and
the countries in the
South appear to be
the most problematic
(Spain, Portugal).
Sources: Luxembourg income study
(http://www.lisproject.org). P I S A 2 0 0 0 . h t t p : / /
www1.oecd.org/els/PISA/
36 B DK D EL E F IRL I L NL A P FIN S UK CH NO

8/2/2019 Equity in European Educational System
http://slidepdf.com/reader/full/equity-in-european-educational-system 37/151
A.2.1.
Table 1. Inequality of family wealth measured by
standard deviation (wealth index)
Source: PISA (2000)
Graph 1. Percentage of children living in households
living below the poverty line
Source : PISA 2000
Table 2. Inequality of family wealth according to socio-
economic profile and the nationality of the parents
-0,32
A weak socio-economic profile corresponds to an index below the 1st
quartile of distribution (the weakest 25 %). A strong profile corresponds toan index higher than the 4th quartile of distribution (the strongest 75 %).
Table 3. Deviation between the poorest 10 % and the
rest of pupils in terms of family wealth
Country
Weak/strong
gap of socio-
economical
profiles
Nationals-
foreigners
gap
BELGIUM 0.69 0.04
DENMARK 0.56 0.51
GERMANY 0.69 0.48
GREECE 0.83 0.09
SPAIN 1.01 -0.06
FRANCE 0.76 0.25
IRELAND 0.75 0.03
ITALY 0.90 0.09
LUXEMBURG 0.89 0.44
NETHERLANDS* 0.53 0.20
AUSTRIA 0.56 0.44
PORTUGAL 1.31 -0.22
FINLAND 0.68 0.46
SWEDEN 0.44 0.50
UNITED KINGDOM 0.73 0.16
SWITZERLAND 0.59 0.13
NORWAY 0.49 0.36
Correlation ratio between socio-economical profile and nationality
-0.70
Country
Absolute
deviations
mean
Relative
deviations
mean
BELGIUM -1.46 -1.87
DENMARK -1.37 -1.80
GERMANY -1.57 -1.84
GREECE -1.51 -1.78
SPAIN -1.47 -1.77
FRANCE -1.43 -1.90
IRELAND -1.64 -1.96
ITALY -1.42 -1.81
LUXEMBURG -1.75 -1.94NETHERLANDS* -1.25 -1.83
AUSTRIA -1.35 -1.73
PORTUGAL -1.89 -1.93
FINLAND -1.36 -1.91
SWEDEN -1.62 -1.98
UNITED KINGDOM -1.5 -1.79
SWITZERLAND -1.44 -1.75
NORWAY -1.46 -1.88
Relative deviations corresponding to absolute deviations in relation to the
standard deviation
0 5 10 15 2 0 2 5
I
UK
A
IRL
E
D
DK
NL
F
B
L
FIN
S
NO
CH
Source: Luxemburg Income Study
* For this country, the rate of response is too low to guarantee good com- parability. D
. E x t e r n a l R e s u l t s
C . I n t e r n a l R e s u l t s
B . P r o c e s s
A . C o n t e x t
37
Country Standard deviation of wealth index
BELGIUM 0,78
DENMARK 0,76
GERMANY 0,85
GREECE 0,85
SPAIN 0,83
FRANCE 0,75
IRELAND 0,84
ITALY 0,79
LUXEMBURG 0,90
NETHERLANDS* 0,68
AUSTRIA 0,78
PORTUGAL 0,98
FINLAND 0,71
SWEDEN 0,82
UNITED KINGDOM 0,84
SWITZERLAND 0,83
NORWAY 0,78

8/2/2019 Equity in European Educational System
http://slidepdf.com/reader/full/equity-in-european-educational-system 38/151
The data presented comes from the “Labour Force Survey 2000” carried out jointly by the Statistical Office of the European
Communities (EUROSTAT) and the national statistical institutes of the 2001 EU Member States. This survey is based on therecommendations of the International Labour Organisation (ILO). Unemployed people as defined by the ILO, known as “non-
working people of working age” cover any persons having reached 15 years of age and are not in paid employment, but are
available to start working within two weeks, and are actively seeking employment. In this sense, one has to bear in mind that the concept of unemployment defined in these terms does not always allow particular aspects of the situation of each country to
be taken into consideration: the age limit for compulsory education, development of part-time jobs, degree of job insecurity,
etc.
Partly due to school education and the level of education achieved, the possession of a stable, paid job is a decisive factor of the well-being and the socio-economic security of all citizens and of all the2001 EU Member States (EU-15). The battle against unemployment and the increase in employment
rates are crucial objectives for the current and future development of the European Union.
Nevertheless, serious disparities remain between and within the 2001 EU Member States. In somecases, these disparities place a large number of individuals in excessively precarious and inequitablesituations compared with others. Since the security and economic status of parents, and therefore their children, is a factor that can strongly influence the progress of their schooling in general, the need to
emphasize these disparities appears to be elementary.
From a general viewpoint, dissimilarities appear in the average unemployment rate (ILO) in thevarious 2001 EU Member States, since this is lower than 3 % in Luxembourg and the Netherlands,while it is above 10 % in France, Italy, Finland, in Greece and in Spain. A certain gender inequality, tothe detriment of women, is also present in the majority of the 2001 EU Member States (Graph 1) and,
while the rate of male unemployment is sometimes slightly higher than the female unemployment rate(Ireland, Austria, Sweden, and the United Kingdom), the inequality between men and women on this
point is particularly pronounced in Belgium, France, and Italy, but especially in Greece and Spain,where it exceeds 10 percentage points.
The unemployment rate linked to the level of education (Graph 2) shows the influence of studies on
employment since, excepted in Greece and Portugal, people with an upper secondary diploma or, even better, a tertiary education diploma, present a broadly lower unemployment rate than the others.
Consequently, unemployment rate is all the higher in the populations with lower education levels.
The younger generations of workers (15-24 years) are, without exception, more severely affected
than their elders (Graph 3), except in Germany and Austria. In several countries and even in some of those where the average unemployment rate (ILO) is not particularly high, the difference is particularly blatant. The Netherlands is alone among the 2001 EU Member States with anunemployment rate among 15-24 year-olds below 6 %. On the other hand, that rate exceeds 25 % in
Finland, Greece, Italy, and Spain.
The situations in terms of unemployment linked to the nationality (Graph 4) are also to be noticedsince foreigners present unemployment rates much higher than national populations. This is particularly true for the foreigners not coming from a member state of the European Union, over all in
Belgium, France, Finland and Sweden, where their unemployment rate exceeds largely 20 %.
The duration and type of unemployment are also important. We know how much a prolonged periodof unbroken unemployment can have negative effects both on the economic security of a householdand on the probability of finding another job quickly. Starting out from the principle that the effects of such a situation are far from being positive on children’s schooling, those children where one or both parents are living in a situation of long-term unemployment (over 12 months) could be moredisadvantaged. In some countries, the proportion of long-term unemployed is lower than or just
reaches 30 % (Denmark, Luxembourg, the Netherlands, the United Kingdom, and Finland) ; whereas
in other countries, it exceeds 55 % (Greece, Italy and especially Belgium and Sweden).
Economic security inequalities
For the year 2000, the
average unemploy-
ment rate (ILO) in
the European Unionreaches 8 % for the
total population.
However, it still ex-
ceeds 10 to 14 % in
some cases (France,
I t a l y , F i n l a n d ,
Greece, and Spain).
It seems that the
women, the popula-
tions presenting a
weak training level,
the younger genera-tions and the foreign-
ers are more harshly
affected than other
categories since their
unemployment rates
sometimes largely
exceed 20 %.
Similar dispropor-
tions have been found
between the 2001 EU
Member States ac-
cording to the pro-
portion of long-termunemployed (over 12
months) .
Sources: EUROSTAT (2001). European
social statistics: Results of the
Labour Force Survey 2000. ILO (2000). Current interna-
tional recommendations onlabour statistics.
Standard international classifi-
cation of education (ISCED -97), UNESCO, 1997
38 B DK D EL E F IRL I L NL A P FIN S UK CH NO

8/2/2019 Equity in European Educational System
http://slidepdf.com/reader/full/equity-in-european-educational-system 39/151
A.2.2.
D
. E x t e r n a l R e s u l t s
C . I n t e r n a l R e s u l t s
B . P r o c e s s
A . C o n t e x t
39
0%
5%
10%
15%
20 %
25%
30 %
35%
B DK D EL E F IRL I L NL A P FIN S UK UE CH NO
15-24 25-49 50-64
Graph 5. Unemployment distribution, according to duration
Graph 2. Unemployment rate, by educational level
Source : EUROSTAT, 2001. Source : EUROSTAT, 2001.
Graph 1. Unemployement rate, by gender
Graph 4. Unemployment rate, by national origin
0%
10%
20 %
30 %
40 %
50%
60 %
70%
80 %
90 %
100%
B DK D EL E F IRL I L NL A P FIN S UK UE CH NO
Less than 6 months From 6 to 11months 12 months or more
0%
5%
10%
15%
20 %
25%
30 %
35%
B DK D EL E F IRL I L NL A P FIN S UK UE CH NO
Below upper sec. Upper secondary Tertiary
0%
5%
10%
15%
20%
25%
30%
35%
B DK D EL E F I RL I L NL A P FIN S UK UE CH NO
Natives Non natives (EU) Non natives (not EU)
Source : EUROSTAT, 2001. Source : EUROSTAT, 2001.
Source : EUROSTAT, 2001.
Graph 3. Unemployment rate, per age group
0%
5%
10%
15%
20 %
25%
30 %
35%
B D K D EL E F IRL I L NL A P F IN S UK UE CH NO
M en W o men T ot al

8/2/2019 Equity in European Educational System
http://slidepdf.com/reader/full/equity-in-european-educational-system 40/151
The data presented come from OECD databases and EUROSTAT. They were compiled from various national surveys.
Graphs 1 and 2: 2001 is the year of reference, but for Belgium, the Netherlands, Austria and Norway (2000).Graph 3: then year of reference is 1999, but for Ireland, Austria and Norway (1998).
The profiles of levels of education used are drawn from the new standard international classification of types of education
(ISCED-97) and the threshold adopted in that indicator is the completion of the second cycle of secondary education, or levels“3A”, “3B” and “long 3C” of ISCED-97. However, in some countries (France, the Netherlands and the United Kingdom) a
proportion of the training in secondary education does not meet the minimum criteria corresponding to long courses of educa-tion of level 3 in ISCED-97. On this basis, it is not uncommon that the figures obtained during national surveys are somewhat
higher than the data finally adopted in this indicator.
The social well-being and economic prosperity of a country are partly connected with the instructionand level of education of its population. Depending on which country we consider, the level of education may vary very markedly. Nevertheless, in addition to the average level of “human capital”
of a nation, the breakdown of the whole population between the various levels of education shouldalso be studied. This allows not only the degree of effectiveness of an educational system to beidentified, but also its degree of fairness. With this aim , the indicator compares the level of education
of the total population and that of the working population of each of the countries under consideration,
while breaking down the data by gender and age.
In eight of the 2001 EU Member States (Germany, Denmark, Sweden, Austria, Finland, France, the
United Kingdom and the Netherlands), over 60 % of the total population have at least completed thesecond cycle of secondary education (Graph 1). This reference level (ISCED-97, level 3) usually brings together the final years of secondary education in the 2001 EU Member States: it frequentlystarts at around 15 or 16 years of age, is rarely compulsory, and can be general, technical or professional. Most of the time, it is an indispensable stepping-stone to tertiary (higher) education. It
can be also observed that the situation is better when only the working population is considered.
The proportion of persons in the labour force who have completed at least the second cycle of secondary education exceeded 80 % in Germany, Denmark, Sweden and The United Kingdom but the
highest level in Spain is 35 % and 21 % in Portugal (Graph 1).
Overall, we note that there is a very substantial disparity on this criterion between SouthernEuropean countries (Portugal, Spain, Italy, and Greece), the Nordic countries (Denmark, Sweden, andFinland), and the Germanic countries (Germany and Austria), with the other 2001 EU Member States
in an average bracket.
So, while it appears that countries like Italy, Spain and Portugal are not very “effective” on thecriterion of average education of the adult population, they show however a greater homogeneity thanthe Nordic and Germanic countries, where the diversity in the breakdown of levels of educationattained by the population is much greater. In this respect, Finland’s example is particularlyinteresting: less than 30 % of the adult population of this country has a level of education below the
second cycle of secondary education. On the other hand, another 30 % have received tertiary (higher)education, and the remaining 40 % are situated between these two extremes, since they onlycompleted the second cycle of secondary education successfully. One can suppose that in such a case,heterogeneous family contexts will have a greater influence on the schooling of pupils than in more
homogeneous situations as they appear in Spain or Portugal.
A gender inequality still exists, since in 11 of the 2001 EU Member States, the proportion of persons
from 25 to 64 years of age who have not at least completed the second cycle of secondary education ismuch higher among women than among men (Graph 2). In Austria, the United Kingdom, Germany,
and Luxembourg, this disparity attains or even greatly exceeds 10 percentage points.
If we compare the level of education of young generations (25-34 and 35-44 year-olds) to that of
older populations (45-54 and 55-64 year-olds) (Graph 3), we observe that the proportion of peoplewho have not attained the level of the second cycle of secondary education is falling very clearly in all
the 2001 EU Member States and particularly in Germany, Finland, Belgium, Greece, and Spain.
Level of education of the adult population
Sources:
OCDE (2002). Education at a
Glance. The OECD indicators.
Paris : OECD.
OECD (2001). Education at a
Glance. The OECD indicators.
Paris: OECD.OECD (1999). Nomenclature of
education systems, user guide to
ISCED-97 in the OECD coun-tries.
On average, slightly
over 40 % of the
adult population of
the European Unionhas not yet completed
secondary education.
This rate sometimes
exceeds 50 %, or even
60 % in some coun-
tries (Spain, Portugal
and Italy).
Nevertheless, these
rates are falling all
the time as younger
generations (25-34
and 35-44 years of age) reach, on aver-
age, far higher levels
of education than
their elders).
In terms of differ-
ences between gen-
ders, there are still,
on average, fewer
women than men
who obtain at least an
education completing
the second cycle of
secondary education.While that inequality
is still significant in
certain countries, it is
far less pronounced
in others, or even
reversed.
40 B DK D EL E F IRL I L NL A P FIN S UK CH NO

8/2/2019 Equity in European Educational System
http://slidepdf.com/reader/full/equity-in-european-educational-system 41/151
0%
10%
20%
30%
40%
50%
60%
70%
80%
90%
100%
B DK D EL E F IRL I L NL A P FIN S UK CH NO
Below upper sec. Upper secondary Post-secondary Tertiary - short Tertiary - long
A.3.1.Graph 1. Level of education of the population
Graph 3. Population not having attained at least
education of the second cycle of secondary education,
by age group
Graph 2. Population not having attained at least
education in the second cycle of secondary education,
by gender
D
. E x t e r n a l R e s u l t s
C . I n t e r n a l R e s u l t s
B . P r o c e s s
A . C o n t e x t
41
Graph 1 presents, for the year 2001, the global population distribution (25-64 year olds) and the labour force population distribution 25-64 year olds) ac-
cording to the highest level of education attained (CITE-97).
Source : OCDE (2002).
Source : OCDE (2002). Source : OCDE (2001).
0%
10%
20 %
30 %
40 %
50%
60 %
70%
80 %
90 %
100%
B DK D EL E F IRL I L NL A P FIN S UK CH NO
Men Women
0%
10%
20%
30%
40%
50%
60%
70%
80%
90%
100%
B DK D EL E F IRL I L NL A P FIN S UK CH NO
25-34 ans 35-44 45-54 55-64
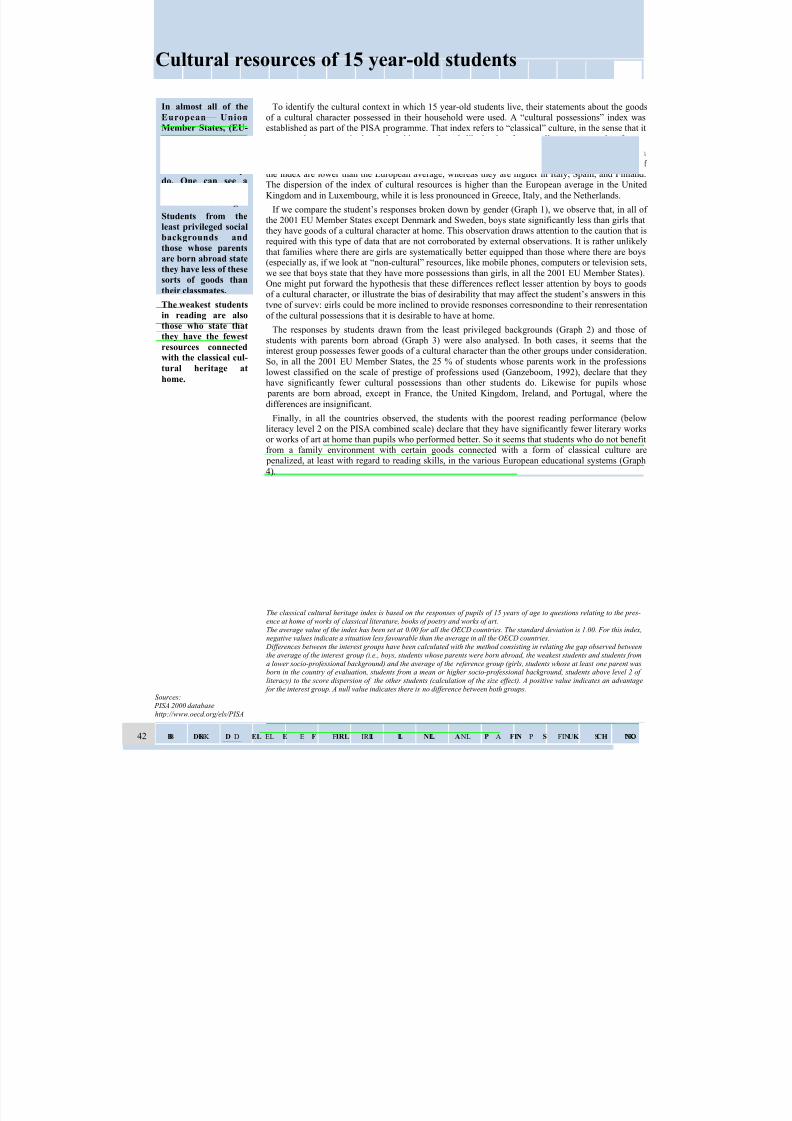
8/2/2019 Equity in European Educational System
http://slidepdf.com/reader/full/equity-in-european-educational-system 42/151
The classical cultural heritage index is based on the responses of pupils of 15 years of age to questions relating to the pres-
ence at home of works of classical literature, books of poetry and works of art.
The average value of the index has been set at 0.00 for all the OECD countries. The standard deviation is 1.00. For this index,negative values indicate a situation less favourable than the average in all the OECD countries.
Differences between the interest groups have been calculated with the method consisting in relating the gap observed between
the average of the interest group (i.e., boys, students whose parents were born abroad, the weakest students and students from
a lower socio-professional background) and the average of the reference group (girls, students whose at least one parent wasborn in the country of evaluation, students from a mean or higher socio-professional background, students above level 2 of
literacy) to the score dispersion of the other students (calculation of the size effect). A positive value indicates an advantage for the interest group. A null value indicates there is no difference between both groups.
To identify the cultural context in which 15 year-old students live, their statements about the goodsof a cultural character possessed in their household were used. A “cultural possessions” index wasestablished as part of the PISA programme. That index refers to “classical” culture, in the sense that it
concerns the presence in the students’ home of goods like books of poetry, literature or works of art.
The average value of the index, for all of the 2001 EU Member States (-0.05) is slightly lower thanthat of all OECD countries (0). In the Benelux countries, Denmark, and Ireland, the average values of the index are lower than the European average, whereas they are higher in Italy, Spain, and Finland.The dispersion of the index of cultural resources is higher than the European average in the United
Kingdom and in Luxembourg, while it is less pronounced in Greece, Italy, and the Netherlands.
If we compare the student’s responses broken down by gender (Graph 1), we observe that, in all of the 2001 EU Member States except Denmark and Sweden, boys state significantly less than girls thatthey have goods of a cultural character at home. This observation draws attention to the caution that isrequired with this type of data that are not corroborated by external observations. It is rather unlikely
that families where there are girls are systematically better equipped than those where there are boys(especially as, if we look at “non-cultural” resources, like mobile phones, computers or television sets,
we see that boys state that they have more possessions than girls, in all the 2001 EU Member States).One might put forward the hypothesis that these differences reflect lesser attention by boys to goodsof a cultural character, or illustrate the bias of desirability that may affect the student’s answers in thistype of survey: girls could be more inclined to provide responses corresponding to their representation
of the cultural possessions that it is desirable to have at home.
The responses by students drawn from the least privileged backgrounds (Graph 2) and those of students with parents born abroad (Graph 3) were also analysed. In both cases, it seems that theinterest group possesses fewer goods of a cultural character than the other groups under consideration.So, in all the 2001 EU Member States, the 25 % of students whose parents work in the professions
lowest classified on the scale of prestige of professions used (Ganzeboom, 1992), declare that theyhave significantly fewer cultural possessions than other students do. Likewise for pupils whose parents are born abroad, except in France, the United Kingdom, Ireland, and Portugal, where the
differences are insignificant.
Finally, in all the countries observed, the students with the poorest reading performance (belowliteracy level 2 on the PISA combined scale) declare that they have significantly fewer literary worksor works of art at home than pupils who performed better. So it seems that students who do not benefitfrom a family environment with certain goods connected with a form of classical culture are penalized, at least with regard to reading skills, in the various European educational systems (Graph
4).
Cultural resources of 15 year-old students
In almost all of the
European UnionMember States, (EU-
15) girls state thatthey possess more
goods of a cultural
character than boys
do. One can see aform of sensitivity to
this form of heritage.
Students from the
least privileged social
backgrounds and
those whose parents
are born abroad state
they have less of thesesorts of goods than
their classmates.
The weakest students
in reading are also
those who state that
they have the fewest
resources connectedwith the classical cul-
tural heritage at
home.
Sources: PISA 2000 database
http://www.oecd.org/els/PISA
42 B DK D EL E F IRL I L NL A P FIN S UK B DK D EL E F IRL I L NL A P FIN S UK CH NO
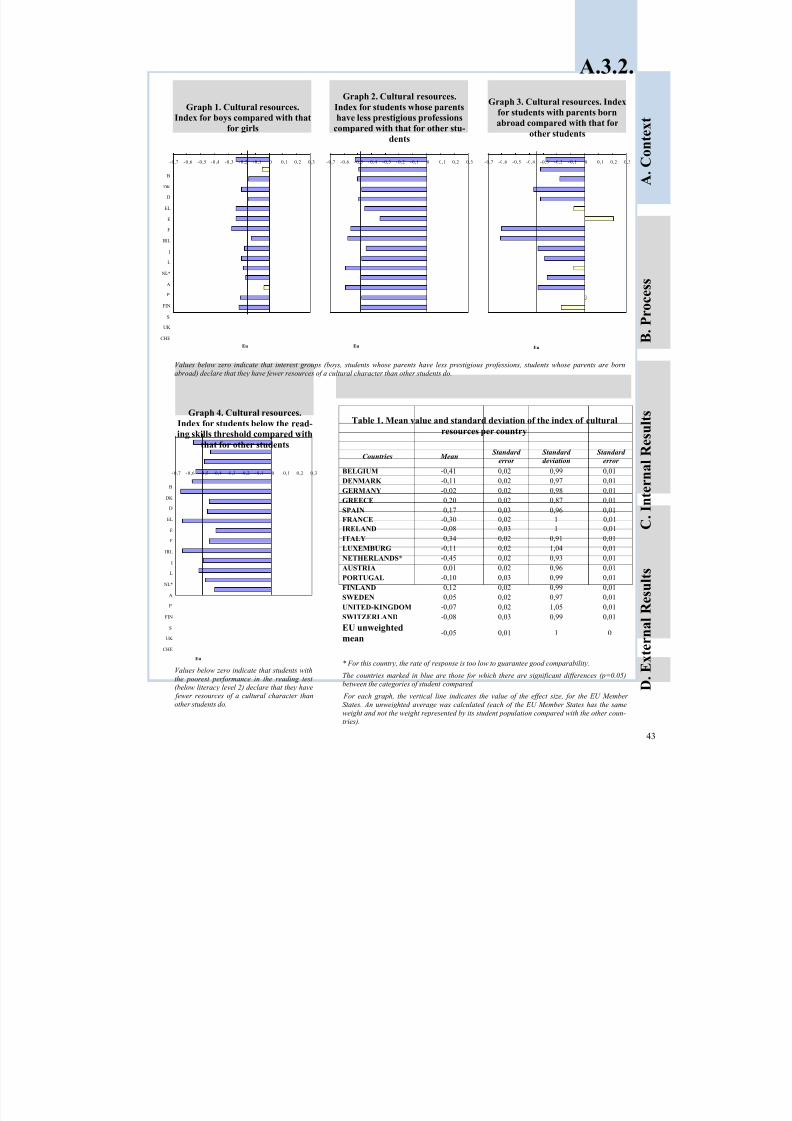
8/2/2019 Equity in European Educational System
http://slidepdf.com/reader/full/equity-in-european-educational-system 43/151
A.3.2.
Graph 4. Cultural resources.Index for students below the read-ing skills threshold compared with
that for other students
-0,7 -0,6 -0,5 -0,4 -0,3 -0,2 -0,1 0 0,1 0,2 0,3
B
DK
D
EL
E
F
IRL
I
L
NL*
A
P
FIN
S
UK
CHE
Eu
Values below zero indicate that students with
the poorest performance in the reading test
(below literacy level 2) declare that they have fewer resources of a cultural character than
other students do.
* For this country, the rate of response is too low to guarantee good comparability.
The countries marked in blue are those for which there are significant differences (p=0.05)
between the categories of student compared.
For each graph, the vertical line indicates the value of the effect size, for the EU Member
States. An unweighted average was calculated (each of the EU Member States has the same
weight and not the weight represented by its student population compared with the other coun-tries).
-0,7 -0,6 -0,5 -0,4 -0,3 -0,2 -0,1 0 0,1 0,2 0,3
B
DK
D
EL
E
F
IRL
I
L
NL*
A
P
FIN
S
UK
CHE
Eu
-0,7 -0,6 -0,5 -0,4 -0,3 -0,2 -0,1 0 0,1 0,2 0,3
Eu
-0,7 -0,6 -0,5 -0,4 -0,3 -0,2 -0,1 0 0,1 0,2 0,3
Eu
Graph 1. Cultural resources.
Index for boys compared with that
for girls
Graph 3. Cultural resources. Index
for students with parents born
abroad compared with that for
other students
Graph 2. Cultural resources.
Index for students whose parents
have less prestigious professions
compared with that for other stu-
dents
Values below zero indicate that interest groups (boys, students whose parents have less prestigious professions, students whose parents are born
abroad) declare that they have fewer resources of a cultural character than other students do.
D
. E x t e r n a l R e s u l t s
C . I n t e r n a l R e s u l t s
B . P r o c e s s
A . C o n t e x t
43
Countries Mean Standard
error
Standard
deviation
Standard
error
BELGIUM -0,41 0,02 0,99 0,01
DENMARK -0,11 0,02 0,97 0,01
GERMANY -0,02 0,02 0,98 0,01
GREECE 0,20 0,02 0,87 0,01
SPAIN 0,17 0,03 0,96 0,01
FRANCE -0,30 0,02 1 0,01
IRELAND -0,08 0,03 1 0,01
ITALY 0,34 0,02 0,91 0,01
LUXEMBURG -0,11 0,02 1,04 0,01NETHERLANDS* -0,45 0,02 0,93 0,01
AUSTRIA 0,01 0,02 0,96 0,01
PORTUGAL -0,10 0,03 0,99 0,01
FINLAND 0,12 0,02 0,99 0,01
SWEDEN 0,05 0,02 0,97 0,01
UNITED-KINGDOM -0,07 0,02 1,05 0,01
SWITZERLAND -0,08 0,03 0,99 0,01
EU unweighted
mean -0,05 0,01 1 0
Table 1. Mean value and standard deviation of the index of cultural
resources per country

8/2/2019 Equity in European Educational System
http://slidepdf.com/reader/full/equity-in-european-educational-system 44/151
The index of activities relating to classical culture is based on responses by pupils concerning the frequency with which the pupils went out in the year preceding the test to “visit a museum or art gallery”, “attend an opera, a ballet or a classical sym-
phony concert” and “watch live theatre”.
The mean of the index was set to 0.00 for all the OECD countries. The standard deviation is 1.00. The negative values of theindex indicate a less favourable situation than the average, in all OECD countries.
Differences between the interest groups have been calculated with the method consisting in relating the gap observed between
the average of the interest group (i.e., boys, students whose parents were born abroad, the weakest students and students from alower socio-professional background) and the average of the reference group (girls, students whose at least one parent was
born in the country of evaluation, students from a mean or higher socio-professional background, students above level 2 of literacy) to the score dispersion of the other students (calculation of the size effect). A positive value indicates an advantage for
the interest group. A null value indicates there is no difference between both groups.
In PISA, the index of “cultural activities” indicates the frequency with which students say that theyhave attended cultural events, like an opera or a play. Therefore, it is “classical” culture that is at issue
here.
Concerning cultural activities, the value of the index for all the 2001 European Union Member States (- 0.02) is slightly lower than the average of the OECD countries. For the EU, the lowest valuesare observed in the Netherlands and France, and the highest in Austria, Denmark, and Greece. Theaverage dispersion of the index of student’s cultural practices is slightly lower than that of all theOECD countries (0.97). It is tighter in Greece, Ireland, and Denmark (0.90), and greater in Austria and
Luxembourg (>1.00) (table 1).
If we compare students on the basis of individual characteristics, we can see that, in the EU, boysare significantly different from girls (with the difference favouring the girls), while for communicationwith parents and for activities connected with classical culture (Graph 1). The same applies in all 2001EU Member States (and the differences are significant everywhere), if one compares the quarter of
pupils whose parents occupy the least prestigious professions with all the other pupils (Graph 2).
For students whose parents were born abroad (Graph 3), the situation shows greater contrasts
between countries. The differences are significant in 10 EU Member States. They are in favour of the“non-natives” in Finland, Sweden, the United Kingdom, and Italy, and in favour of the “natives” in
Austria, Belgium, Germany, France, Greece, and Luxembourg.
Finally, if we focus on students below the reading skills threshold (pupils who have not reachedliteracy level 2 on the PISA combined scale), we note that they declare less intense cultural practicesthan better-performing pupils (the difference is significant in all the 2001 EU Member States and
Switzerland) (Graph 4).
Cultural practices of 15 year-old students
Concerning cultural
practices, signifi-
cantly more negative
responses are ob-served concerning
cultural practices
among boys, among
pupils drawn from
less privileged socio-
professional circles,
and among students
with the poorest
reading skills.
Sources: PISA 2000 database.
http://www.oecd.org/els/PISA
44 B DK D EL E F IRL I L NL A P FIN S UK CH NO
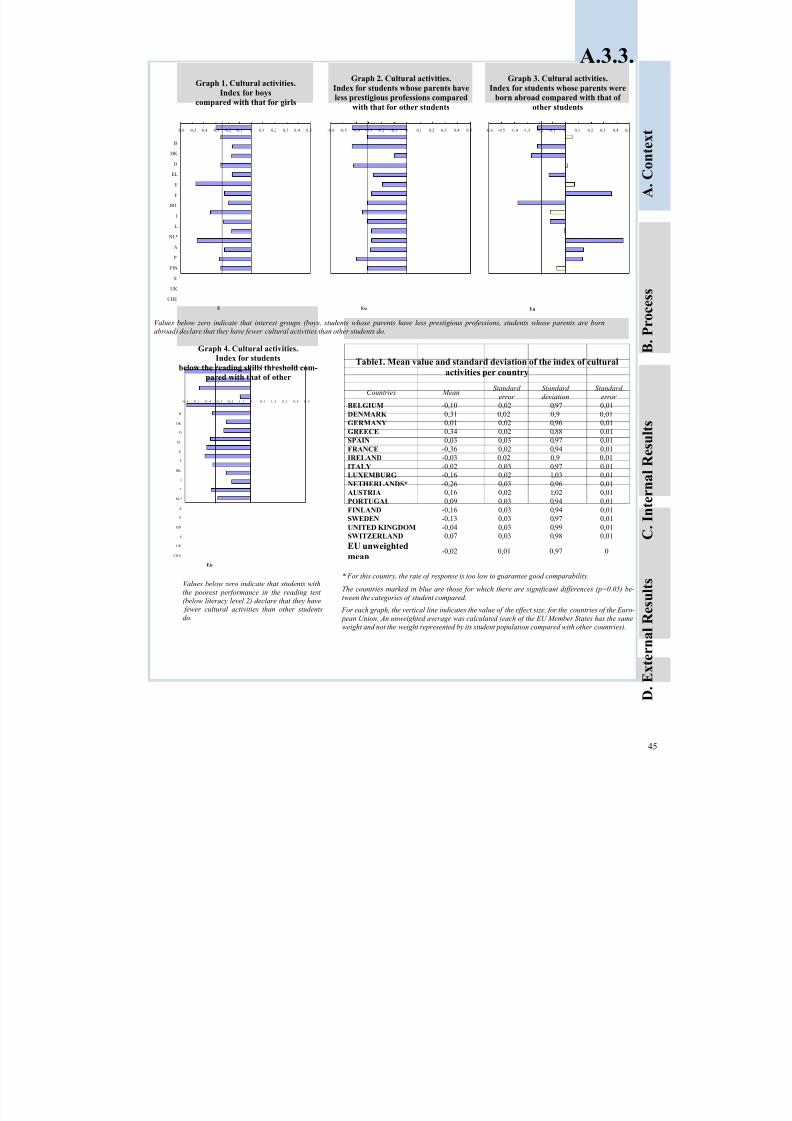
8/2/2019 Equity in European Educational System
http://slidepdf.com/reader/full/equity-in-european-educational-system 45/151
A.3.3.
* For this country, the rate of response is too low to guarantee good comparability.
The countries marked in blue are those for which there are significant differences (p=0.05) be-
tween the categories of student compared.
For each graph, the vertical line indicates the value of the effect size, for the countries of the Euro-
pean Union. An unweighted average was calculated (each of the EU Member States has the same
weight and not the weight represented by its student population compared with other countries).
-0,6 -0,5 -0,4 -0,3 -0,2 -0,1 0 0,1 0,2 0,3 0,4 0,5
Eu
-0,6 -0,5 -0,4 -0,3 -0,2 -0,1 0 0,1 0,2 0,3 0,4 0,5
Eu
-0,6 -0,5 -0,4 -0,3 -0,2 -0,1 0 0,1 0,2 0,3 0,4 0,5
B
DK
D
EL
E
F
IRL
I
L
NL*
A
P
FIN
S
UK
CHE
E
Graph 3. Cultural activities.
Index for students whose parents were
born abroad compared with that of
other students
Graph 2. Cultural activities.
Index for students whose parents have
less prestigious professions compared
with that for other students
Graph 1. Cultural activities.
Index for boys
compared with that for girls
D . E x t e r n a l R e s u l t s
C . I n t e r n a l R e s u l t s
B . P r o c e s s
A . C o n t e x t
45
-0, 6 -0, 5 -0, 4 -0, 3 -0, 2 -0, 1 0 0, 1 0, 2 0 , 3 0, 4 0, 5
B
DK
D
EL
E
F
IRL
I
L
NL*
A
P
FIN
S
UK
CH E
Eu
Graph 4. Cultural activities.
Index for students
below the reading skills threshold com-
pared with that of other
Countries MeanStandard
error
Standard
deviation
Standard
error
BELGIUM -0,10 0,02 0,97 0,01
DENMARK 0,31 0,02 0,9 0,01
GERMANY 0,01 0,02 0,96 0,01
GREECE 0,34 0,02 0,88 0,01
SPAIN 0,03 0,03 0,97 0,01
FRANCE -0,36 0,02 0,94 0,01
IRELAND -0,03 0,02 0,9 0,01
ITALY -0,02 0,03 0,97 0,01
LUXEMBURG -0,16 0,02 1,03 0,01
NETHERLANDS* -0,26 0,03 0,96 0,01
AUSTRIA 0,16 0,02 1,02 0,01
PORTUGAL 0,09 0,03 0,94 0,01
FINLAND -0,16 0,03 0,94 0,01
SWEDEN -0,13 0,03 0,97 0,01
UNITED KINGDOM -0,04 0,03 0,99 0,01
SWITZERLAND 0,07 0,03 0,98 0,01
EU unweightedmean
-0,02 0,01 0,97 0
Table1. Mean value and standard deviation of the index of cultural
activities per country
Values below zero indicate that interest groups (boys, students whose parents have less prestigious professions, students whose parents are born
abroad) declare that they have fewer cultural activities than other students do.
Values below zero indicate that students with
the poorest performance in the reading test
(below literacy level 2) declare that they have fewer cultural activities than other students
do.

8/2/2019 Equity in European Educational System
http://slidepdf.com/reader/full/equity-in-european-educational-system 46/151
The differences between the interest groups were calculated according to the method that relates the deviation observed be-
tween the average for the interest group (in this case, boys, students whose parents were born abroad, the weakest students and students from modest socio-professional backgrounds) and the average of the reference group (girls, students with at least one
parent born in the country of the test, parents of average or high social standing, students above literacy level 2) to the disper-
sion of the scores of other students (measure of the “effect size”). A positive value indicates an advantage for the interest group. A zero value indicates that there is no difference between the two groups.
To distinguish national origin, two categories are taken into account: a distinction is made between students both of whose parents are born abroad and all the other pupils.
Concerning students’ achievement, we compared the responses from students below or equal to level 1 on the PISA combined literacy scale with the responses of the other pupils.
For socio-professional origin, we compared the responses of the lower quartile to the responses of the other three quartiles.
The family and socio-economic environment in which pupils evolve are connected, to a greater or lesser extent, within the various educational systems, to the school performance of students (OECD,2001). It seems likely that these factors also have an influence on the professional aspirations of
pupils. In this case, we looked at the link between the socio-professional level of parents and the profession that young people of 15 years of age are considering entering. The indicator presentedconsiders the professional aspirations of students, together with their social origin, their gender, their
national origin, and their reading performance. It gives a measure of freedom or constraints withwhich 15 year-old students see their future, depending on their parents’ situation. It is the reason whyit can be considered as one of the incentives that can help more or less intensively the students’
commitment to their school career that will enable them to realize their professional objectives.
The professions that 15 year-olds declared that they wanted to carry out in the future were coded ona scale from 16 to 90, with the values at the bottom end of the scale being reserved for the least prestigious professions (Ganzeboom, De Graaf et Treinman, 1992). Greece, Spain and Portugal are particularly characterised by higher than average aspirations, and Austria, Germany, Switzerland, the Netherlands, and Luxembourg by lower socio-professional aspirations. The dispersion of professional
aspirations within each country differs little.In all the countries, except the United Kingdom, boys are significantly different from girls (Graph
1). In general, boys envisage carrying out less prestigious professions than girls, except inLuxembourg and the Netherlands, where the opposite tendency is observed. One could put forward
the hypothesis that, being less successful at school than their female classmates, or more rapidlyguided into less prestigious courses of study when education is organized in this way, boys aged 15
have fewer professional ambitions than girls.
The effect of social origin on professional expectations is very pronounced for all the 2001 EUMember States (Graph 2). If one separates the students into four groups of equal number, depending
on their parent’s profession, we observe significant differences between the responses from students inthe least disadvantaged group and those of the other three groups considered as a whole. The former have ambitions that are more modest on the international scale of professions, unless the latter havealready contributed to forming their professional ambitions. Furthermore, one can make exactly thesame observations if one compares the responses of the students with the poorest reading skills (belowliteracy level 2 on the PISA combined scale) with the answers of the students who performed best in
the PISA test (Graph 4).
On the other hand, differences relating to the parent’s place of birth are less pronounced (Graph 3).In ten of the 2001 EU Member States, one cannot establish significant differences depending on thiscriterion. In Switzerland and in Italy, students whose parents were born abroad tend to have lower
professional expectations than their classmates with at least one parent born in the country where theyare going to school, while in Luxembourg, France, Portugal, the United Kingdom, Sweden, and
Denmark, students whose parents are born abroad are generally considering more prestigious
professions than their classmates.
Professional aspirations of 15 year-old students
Students whose par-
ents work in the least
prestigious profes-
sions and those whohave very poor read-
ing skills have signifi-
cantly more modest
professional ambi-
tions than their class-
mates do from all the
countries of the Euro-
pean Union.
It seems that, for
these students, the
incentives to embark
on the more prestig-ious school careers,
or simply to continue
their education, are
less.
Sources: PISA 2000 database
http://www.oecd.org/els/PISA
46 B DK D EL E F IRL I L NL A P FIN S UK CH NO
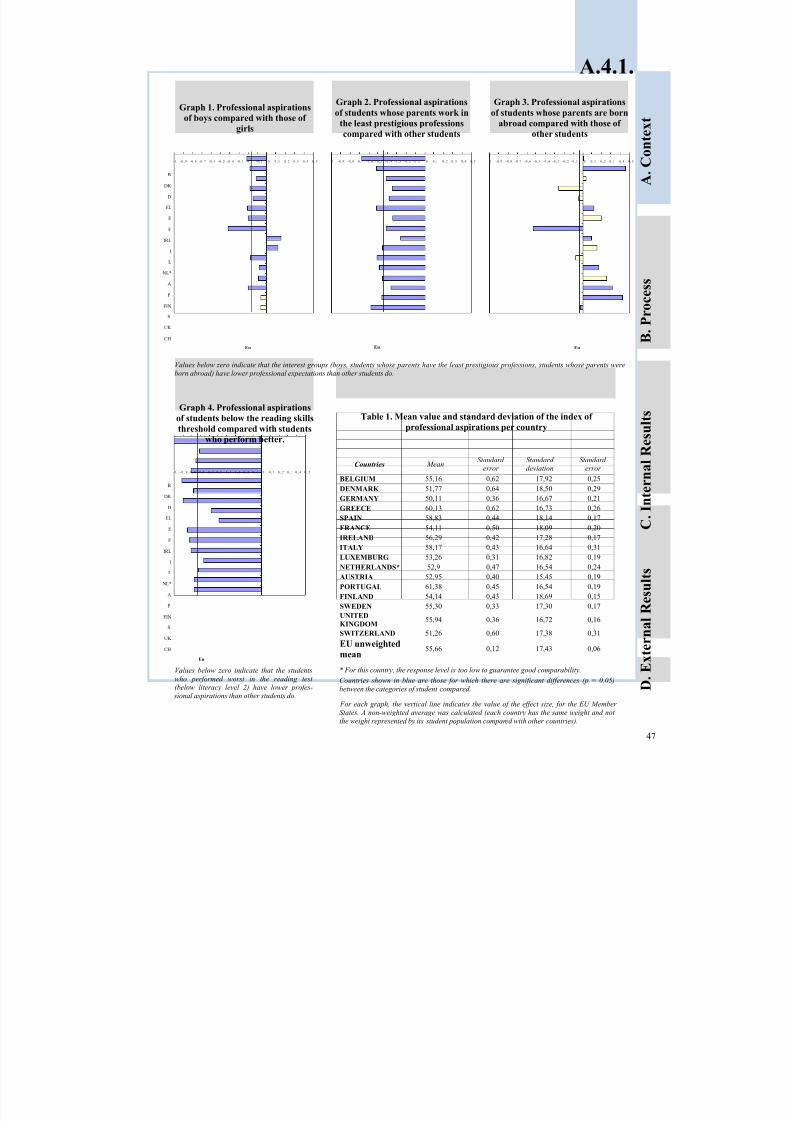
8/2/2019 Equity in European Educational System
http://slidepdf.com/reader/full/equity-in-european-educational-system 47/151
A.4.1.
Graph 3. Professional aspirations
of students whose parents are born
abroad compared with those of
other students
-1 -0, 9 -0, 8 -0, 7 -0 , 6 -0, 5 -0, 4 -0, 3 -0, 2 -0, 1 0 0 , 1 0, 2 0, 3 0 , 4 0, 5
Eu
Graph 1. Professional aspirations
of boys compared with those of
girls
-1 -0, 9 -0, 8 -0, 7 -0, 6 -0, 5 -0, 4 -0, 3 -0 , 2 -0, 1 0 0, 1 0, 2 0, 3 0, 4 0, 5
B
DK
D
EL
E
F
IRL
I
L
NL*
A
P
FIN
S
UK
CH
Eu
Graph 2. Professional aspirations
of students whose parents work in
the least prestigious professions
compared with other students
-1 -0, 9 -0 , 8 -0, 7 -0, 6 -0, 5 -0, 4 -0, 3 -0, 2 -0, 1 0 0, 1 0, 2 0, 3 0 , 4 0, 5
Eu
Values below zero indicate that the interest groups (boys, students whose parents have the least prestigious professions, students whose parents were
born abroad) have lower professional expectations than other students do.
Graph 4. Professional aspirationsof students below the reading skills
threshold compared with students
who perform better.
-1 -0, 9 -0, 8 -0 ,7 -0, 6 -0 ,5 -0, 4 -0, 3 -0, 2 -0, 1 0 0, 1 0, 2 0, 3 0, 4 0, 5
B
DK
D
EL
E
F
IRL
I
L
NL*
A
P
FIN
S
UK
CH
Eu
Values below zero indicate that the students
who performed worst in the reading test
(below literacy level 2) have lower profes- sional aspirations than other students do.
* For this country, the response level is too low to guarantee good comparability.
Countries shown in blue are those for which there are significant differences (p = 0.05)between the categories of student compared.
For each graph, the vertical line indicates the value of the effect size, for the EU Member
States. A non-weighted average was calculated (each country has the same weight and not
the weight represented by its student population compared with other countries).
D
. E x t e r n a l R e s u l t s
C . I n t e r n a l R e s u l t s
B . P r o c e s s
A . C o n t e x t
47
Countries MeanStandard
error Standard deviation
Standard error
BELGIUM 55,16 0,62 17,92 0,25
DENMARK 51,77 0,64 18,50 0,29
GERMANY 50,11 0,36 16,67 0,21
GREECE 60,13 0,62 16,73 0,26
SPAIN 58,83 0,44 18,14 0,17
FRANCE 54,11 0,50 18,09 0,20
IRELAND 56,29 0,42 17,28 0,17
ITALY 58,17 0,43 16,64 0,31LUXEMBURG 53,26 0,31 16,82 0,19
NETHERLANDS* 52,9 0,47 16,54 0,24
AUSTRIA 52,95 0,40 15,45 0,19
PORTUGAL 61,38 0,45 16,54 0,19
FINLAND 54,14 0,43 18,69 0,15
SWEDEN 55,30 0,33 17,30 0,17
UNITED
KINGDOM55,94 0,36 16,72 0,16
SWITZERLAND 51,26 0,60 17,38 0,31
EU unweighted
mean 55,66 0,12 17,43 0,06
Table 1. Mean value and standard deviation of the index of
professional aspirations per country

8/2/2019 Equity in European Educational System
http://slidepdf.com/reader/full/equity-in-european-educational-system 48/151
Data provided by a survey among 13-14 year old pupils from five European countries: Belgium (French Community), Spain
(Madrid), France (Paris), Italy (Rome), and the United Kingdom (Wales), between November and December 2002.
In the United Kingdom and Italian samples, there were relatively few students who stated that they were born outside the test country (2.3 % for United Kingdom and 5.0 % for Italy). The results for this category should be treated with caution.
There was a relatively high proportion of students who report that they receive low marks in school in Spain (22.9 % of the
sample) and a low number in the United Kingdom (2.7 % of the sample). It is important to remember that the students them- selves were asked to provide this estimate; it was not based on external evaluation of the achievement.
In order to determine the occupational category, the 10 categories (ISCO - 1 digit) coded in the questionnaire were amalga-mated into 2. The higher occupational status (between those of the father and of the mother) was used in this analysis.
* Data on non-native pupils are not available for France.
** Data on social category are not available for Italy.
Students were asked to give their opinions about what features ought to characterise an equitable
school. This indicator outlines criteria for equity and justice based on the students’ estimation of howthey should be treated by their teachers in school, as well as what constitutes acceptable academic
outcomes at the end of compulsory schooling.
The results suggest that the education setting, whether primary or secondary, makes little difference
to the students’ estimation of what constitutes fair treatment of students by their teachers (data of questions a and b correlate at around 0.85). In both sectors, a clear majority of students, mainly inMadrid and in Wales, felt that teachers should give equal attention to all pupils, and this was feltslightly more strongly by female pupils, and particularly strongly by the British students. In addition,in the other countries there was considerable support for the idea that more attention should be givento the least able pupils. This trend is particularly marked in the French Community of Belgium, in
Paris and Rome, as well as among students who reported achieving low marks, all regions taken intoaccount. There was almost no support among pupils from any of the countries for the notion that able
students should receive the most attention in class (Question a).
Students were also asked to determine the features of a fair school by considering the treatment of
pupils by teachers and the allocation of marks. Here the responses were evenly distributed betweencountries and between groups (question c). However, the students from Madrid especially reportedthat the most important criteria for equity was a school which would award marks reflecting theamount of work put in by a pupil, whereas the Welsh students especially felt that all pupils ought to betreated the same way in class. There is less overall agreement to the question on treating all pupils thesame way in class (question c) than for the similar question a . However, in the question c, studentshave to make a selection from four options. So while treating all pupils in the same way might be
important, it may not be as important as giving pupils marks which reflect their efforts.
In addition, the respondents were asked to describe an equitable system according to theopportunities pupils should have to succeed academically. Students in all groups were most concernedthat schools provide children with equal chances of success, regardless of their family background,
and this was especially marked among female pupils (Question d). However, in Rome, studentsgenerally attached a greater importance to the need for students to leave school with good basicknowledge and skills. Interestingly, relatively few students reported feeling that the achievement gap between the higher and the lower achievers ought to be narrow at the end of compulsory schooling – that is, they were apparently happy that an equitable system would eventually discriminate between
high and low achievers.
Table 1 (Questions a, b, c and d) shows the percentage of students who chose each statement thatmost corresponds to their opinion. The Tables show the responses for all students, plus those for students from the higher and lower occupational groups, both sexes, non-native students (those whostate that they were born outside the country where the survey took place), as well as for those who
state that their marks in school are considered as low.
Students’ criteria of justice
For most students, a
fair school would be a
school where each
student would receivethe same amount of
attention in class, and
in which the chances
of success are not
affected by the family
background.
There is almost no
support for the no-
tion that the most
able pupils should
receive the most at-
tention from teach-ers.
Sources:
European pilot survey about feelings of justice at school.
Student questionnaire
48 B DK D EL E F IRL I L NL A P FIN S UK CH NO

8/2/2019 Equity in European Educational System
http://slidepdf.com/reader/full/equity-in-european-educational-system 49/151
A.4.2.Table 1. Desired equity in teacher attention (a,b) and in the treatment of pupils (c,d)
Percentage of pupils’s agreement with each sentence
Area/CityHigher social
group
Lower social
groupBoys Girls
Non-natives
pupils
Pupils with low
marksAll students
a. For a primary school to be fair, its teachers must give
the same atten-
tion to all pupils.
French Com. 50.2 50.1 48.0 53.1 48.1 31.3 50.0
Madrid 66.2 72.4 66.9 69.1 77.9 58.0 68.1
Paris* 54.8 56.2 49.3 58.3 - 46.3 53.8
Rome** - - 47.4 50.9 53.6 44.8 48.8
Wales 85.7 86.6 84.2 88.8 76.5 72.2 86.6
more attention to
the most able
pupils.
French Com. 0.6 0.6 0.8 0.4 2.8 4.0 0.8
Madrid 1.5 3.4 2.6 1.4 4.4 4.2 2.0
Paris* 0.7 2.9 1.4 0.8 - 0 1.1
Rome** - - 0.9 0.4 0 1.1 0.6
Wales 1.1 2.5 2.4 0.7 0 11.1 1.5
more attention to
the least able
pupils.
French Com. 49.2 49.3 51.1 46.5 49.1 64.6 49.2
Madrid 32.3 24.2 30.5 29.5 17.7 37.8 29.8
Paris* 44.5 41.0 49.3 40.9 - 53.7 45.1
Rome** - - 51.7 48.7 46.4 54.0 50.6
Wales 13.2 10.9 13.4 10.5 23.5 16.7 11.9
b. For a secondary school to be fair, its teachers must give
the same atten-
tion to all pupils.
French Com. 54.8 53.4 53.3 56.0 55.0 29.7 54.4
Madrid 63.5 68.5 63.8 66.6 68.1 49.6 65.0
Paris* 58.1 67.0 56.9 60.4 - 51.3 58.6
Rome** - - 52.0 53.8 38.7 44.4 52.6
Wales 79.9 80.6 76.7 84.7 61.1 55.6 80.8
more attention to
the most able
pupils.
French Com. 1.7 0.3 2.1 0.8 3.6 2.0 1.7
Madrid 2.7 5.9 4.6 2.5 8.0 5.0 3.6
Paris* 2.4 3.9 4.9 1.0 - 3.8 3.0
Rome** - - 1.5 1.0 3.2 3.3 1.2
Wales 4.6 9.2 8.8 4.5 11.1 22.2 6.4
more attention to
the least able
pupils.
French Com. 43.4 46.3 44.6 43.2 41.4 68.3 43.9
Madrid 33.7 25.6 31.5 30.8 23.9 45.4 31.4
Paris* 39.5 29.1 38.2 38.5 - 45.0 38.4
Rome** - - 46.5 45.1 58.1 52.2 46.2
Wales 15.5 10.2 14.4 10.7 27.8 22.2 12.8
c. In your opinion, a school is fair if…
all the pupils are
treated in the
same way in class.
French Com. 29.3 33.5 28.9 31.6 24.3 30.6 30.2
Madrid 22.5 32.6 27.2 23.4 25.2 33.8 25.4
Paris* 26.9 34.3 30.2 26.9 - 30.1 28.5
Rome** - - 31.7 35.7 43.3 34.5 33.2
Wales 42.6 54.6 45.2 48.6 33.3 44.4 46.6
the marks the
pupils receive
reflect the quality
of their work.
French Com. 20.4 19.7 19.1 20.9 11.7 13.3 20.0
Madrid 10.6 10.1 9.4 11.2 10.4 9.6 10.3
Paris* 17.5 18.1 17.5 17.0 - 19.3 17.4
Rome** - - 27.0 18.6 30.0 19.0 23.0
Wales 11.4 7.3 11.2 9.1 5.6 11.1 10.0
all the pupils are
respected by the
teachers.
French Com. 21.8 21.1 21.2 22.3 32.4 34.7 21.8
Madrid 13.3 13.4 13.5 13.4 13.0 16.3 13.2
Paris* 21.5 21.0 17.5 23.9 _- 16.9 21.0
Rome** - - 10.8 15.0 10.0 8.3 12.7
Wales 23.7 17.1 18.4 22.4 27.8 0 21.2
the marks the
pupils receive
reflect the amount
of effort they have
put in.
French Com. 28.5 25.6 30.7 25.2 31.5 21.4 28.1
Madrid 53.6 44.0 49.9 51.9 51.3 40.4 51.1
Paris* 34.0 26.7 34.8 32.2 - 33.7 33.2
Rome** - - 30.5 30.7 16.7 38.1 31.1
Wales 22.3 21.0 25.1 19.9 33.3 44.4 22.2
d. In your opinion, a school is fair if…
all the pupils leave
school with a good
basic knowledge
and set of skills.
French Com. 37.5 38.0 38.3 37.8 38.0 30.7 37.8
Madrid 24.4 20.1 26.2 20.5 27.0 21.4 23.6
Paris* 31.3 29.0 32.8 29.1 - 34.6 31.2
Rome** - - 58.8 60.6 58.1 65.9 60.0
Wales 35.2 47.6 39.8 39.8 38.9 57.9 40.5
all the pupils have
the same chances of
academic success
regardless of their
family background
French Com. 51.5 53.3 48.3 54.8 51.9 48.5 51.7
Madrid 67.0 68.8 62.6 72.1 62.6 62.2 67.0
Paris* 61.2 59.8 55.6 64.7 - 49.4 59.9
Rome** - - 25.3 23.6 12.9 15.3 24.2
Wales 55.5 44.2 50.1 53.0 50.0 15.8 51.2
at the end of the
secondary school,
the gap between the
most and the least
able pupils is not
too significant.
French Com. 11.0 8.8 13.4 7.3 10.2 20.8 10.5
Madrid 8.7 11.2 11.2 7.4 10.4 16.4 9.4
Paris* 7.5 11.2 11.5 6.2 - 16.0 8.9
Rome** - - 15.9 15.8 29.0 18.8 15.8
Wales 9.3 8.3 10.1 7.2 11.1 26.3 8.3
D
. E x t e r n a l R e s u l t s
C . I n t e r n a l R e s u l t s
B . P r o c e s s
A . C o n t e x t
49

8/2/2019 Equity in European Educational System
http://slidepdf.com/reader/full/equity-in-european-educational-system 50/151
Data provided by a survey among 13-14 year old pupils from five European countries: Belgium (French Community), Spain
(Madrid), France (Paris), Italy (Rome), and the United Kingdom (Wales), between November and December 2002.
In the United Kingdom and Italian samples, there were relatively few students who stated that they were born outside the test country (2.3 % for United Kingdom and 5.0 % for Italy). The results for this category should be treated with caution.
There was a relatively high proportion of students who report that they receive low marks in school in Spain (22.9 % of the
sample) and a low number in the United Kingdom (2.7 % of the sample). It is important to remember that the students them- selves were asked to provide this estimate; it was not based on external evaluation of the achievement.
In order to determine the occupational category, the 10 categories (ISCO—1 digit) coded in the questionnaire were amalga-mated into 2. The higher occupational status (between those of the father and of the mother) was used in this analysis.
* Data on non-native pupils are not available for France.
** Data on social category are not available for Italy.
This indicator concerns “success” in life after schooling, and assesses the extent to which pupils believe that pay and success in a career are related to work, qualification, social background, or luck.There was general agreement with the statement that “It is fair that people are better paid because they
are better qualified” – a meritocratic principle. However, agreement was lower in Rome, amongfemale students and for those who felt that they received low marks (Table 1a). Agreement was the
highest in Wales.
Regardless of what was considered “fair”, students attributed success later in life almost equally tohaving worked hard at school (around 80 %), and working hard at their job (around 90 % agreementin Table 1b). Patterns here were similar across countries and groups. There was also limited support
for the idea that success was related to natural talent (around 50 %), and this was stronger in Rome
and in French speaking Belgium.
On the other hand, there was very little support for the notion that success was linked to whether or not an individual was lucky, or came from a privileged home or family background. Recent gender
discourse has suggested that female students attribute academic success to hard work, while malestudents are more likely to link success with luck or natural talent. There was some support for this
notion in this study, particularly among the male students’ higher attribution of success to naturaltalent. However, it must be remembered that both males and females overwhelmingly attribute
success to hard work.
Student’s general opinion about justice
There is considerable
agreement among all
countries and groups
of students that suc-cess in later life is due
to hard work at
school and in employ-
ment, mixed with
natural talent.
There is very little
support for the idea
that success is due to
luck or family privi-
lege.
A majority believed
that higher pay forhigher qualifications
is a fair principle.
Sources:
European pilot survey about feelings of justice at school.
Questionnaire for pupils.
50 B DK D EL E F IRL I L NL A P FIN S UK CH NO

8/2/2019 Equity in European Educational System
http://slidepdf.com/reader/full/equity-in-european-educational-system 51/151
Data provided by a survey among 13-14 year old pupils from five European countries: Belgium (French Community), Spain
(Madrid), France (Paris), Italy (Rome), and the United Kingdom (Wales), between November and December 2002. In the United Kingdom and Italian samples, there were relatively few students who stated that they were born outside the test
country (2.3 % for United Kingdom and 5.0 % for Italy). The results for this category should be treated with caution.
There was a relatively high proportion of students who report that they receive low marks in school in Spain (22.9 % of the sample) and a low number in the United Kingdom (2.7 % of the sample). It is important to remember that the students them-
selves were asked to provide this estimate; it was not based on actual performance data.
In order to determine the occupational category, the 10 categories coded in the questionnaire were amalgamated into 2. The
higher occupational status was used in this analysis.
* Data on non-native pupils are not available for France.
** Data on social category are not available for Italy.
This indicator concerns “success” in life after schooling, and assesses the extent to which pupils believe that pay and success in a career are related to work, qualification, social background, or luck.There was general agreement with the statement that “It is fair that people are better paid because they
are better qualified” – a meritocratic principle. However, agreement was lower in Italy, among femalestudents and for those who felt that they received low marks (Table 1a). Agreement was substantiallyhigher in the United Kingdom.
Regardless of what was considered “fair”, students attributed success later in life almost equally tohaving worked hard at school (around 80 %), and working hard at their job (around 90 % agreementin Table 1b). Patterns here were similar across countries and groups. There was also limited supportfor the idea that success was related to natural talent (around 50 %), and this was stronger in Italy andin French speaking Belgium.
On the other hand, there was very little support for the notion that success was linked to whether or not an individual was lucky, or came from a privileged home or family background. Recent gender
discourse has suggested that female students attribute academic success to hard work, while male stu-dents are more likely to link success with luck or natural talent. There was some support for this no-tion in this study, particularly among the male students’ higher attribution of success to natural talent.
However, it must be remembered that both males and females overwhelmingly attribute success tohard work.
Student’s general opinion about justice
There is considerable
agreement among all
countries and groups
of students that successin later life is due to
hard work at school
and in employment,
mixed with natural
talent. There is very
little support for the
idea that success is due
to luck or family privi-
lege. A majority be-
lieved that higher pay
for higher qualifica-
tions is a fair principle.
Sources:
European pilot survey about
feelings of justice at school.Questionnaire for pupils.
51
A.4.3.
Table 1. Opinions on equity and success factors
Area/CityHigher social
group
Lower social
groupBoys Girls
Non-natives
pupils
Pupils with low
marksAll pupils
a. It is fair that…
people are better
paid because they
are better qualified.
French Com. 61.0 49.1 66.4 50.3 67.0 49.0 58.2
Madrid 67.3 62.7 70.0 62.0 54.5 61.0 66.2
Paris* 63.2 48.5 66.0 53.9 - 50.6 60.4
Rome** - - 53.3 39.1 50.0 39.3 46.8
Wales 78.3 70.2 75.4 72.3 72.2 52.9 73.8
b. When a person has succeeded in life, it is because:
he/she has worked
hard at school.
French Com. 82.1 88.2 85.3 82.3 76.9 72.6 83.6
Madrid 77.9 83.0 78.4 79.9 84.9 72.3 79.1
Paris* 83.7 87.8 84.6 83.3 - 63.3 84.1
Rome** - - 76.8 63.5 89.3 63.4 70.7
Wales 87.5 89.3 86.1 89.0 76.5 83.3 88.1
he/she has worked
hard at his/her job.
French Com. 89.2 87.1 89.1 88.1 89.9 87.8 88.6
Madrid 94.1 95.7 93.6 95.6 96.4 92.3 94.2Paris* 91.4 90.9 91.5 88.6 - 90.9 90.1
Rome** - - 94.2 94.9 96.7 91.5 94.4
Wales 95.8 89.8 91.5 95.3 77.8 94.7 93.4
he/she has come
from a privileged
family.
French Com. 18.7 15.8 22.5 13.6 21.7 20.0 18.0
Madrid 29.7 30.4 35.4 23.7 28.4 36.6 30.4
Paris* 24.3 25.3 29.6 20.5 - 32.4 25.2
Rome** - - 25.7 23.0 19.2 19.3 24.4
Wales 22.3 30.2 30.3 17.4 17.6 26.3 25.1
he/she was naturally
talented.
French Com. 55.1 57.4 59.2 53.4 51.4 62.2 56.0
Madrid 40.0 37.8 42.0 36.8 35.8 43.0 39.6
Paris* 44.7 44.7 45.3 42.2 - 41.9 44.1
Rome** - - 64.6 60.3 66.7 54.5 62.6
Wales 41.6 40.8 44.7 38.4 44.4 36.8 41.8
he/she was lucky.
French Com. 24.6 28.0 25.3 26.1 30.0 39.8 25.7
Madrid 36.3 37.3 40.9 31.5 33.0 42.2 36.3
Paris* 26.8 35.1 28.3 29.8 - 34.2 29.1
Rome** - - 42.0 31.6 46.4 27.5 37.7
Wales 20.8 22.2 25.2 19.7 33.3 52.6 23.1
Table 1 shows the percentage of students who agree/strongly agree with each statement referring to their general opinions about justice. The Table shows
the responses for all students, plus those for students from the higher and lower occupational groups, both sexes, non-native students (those who state that
they were born outside the country of the test), as well as for those who state that their school marks are considered as low.
D . E x t e r n a l R e s u l t s
C . I n t e r n a l R e s u l t s
B . P r o c e s s
A . C o n t e
x t
51

8/2/2019 Equity in European Educational System
http://slidepdf.com/reader/full/equity-in-european-educational-system 52/151
In order to obtain net rates of schooling, the number of pupils/students of a given age group schooled in the system, all levelscombined, is divided by the number of the population of the same age group. The total of these net schooling rates is the school-
ing expectancy. These rates are listed in the methodological annex http://www.ulg.ac.be/pedaexpe/equite/ (Table 1).
Based on schooling levels at different ages, a weighted average by the number of school years is calculated for the 10 % who spent the longest period studying, and for the 10 % whose schooling lasted the shortest period. We give, for information, the
schooling expectancy per countries of 10 % of pupils who study for the longest period (methodological annex, Table 1), and
that for pupils who study for the shortest period is shown in the table opposite.
The quantity of education received may be the cause of inequalities of learning or academic and
professional careers between pupils. It is also one of the measurements of the effort that thecommunity – society and family – devotes to schooling a child. Therefore, the inequalities in duration
of education measure the inequalities in the efforts made to prepare young people for adulthood andworking life. They are part of the context of general growth in the duration of schooling, which may be accompanied by inequalities of increasing duration. For instance, for France, “the inter-decileintervals, which are indicators of inequalities of access to the educational system, considered in terms
of education length, increase from 1988-1989 to 1998-1999. The difference between the schoolinglength of the 10% of the less educated and the 10% of the most educated increased by one year during
that period (from 6.9 years as a difference in 88-89 to 7.9 years in 98-99)” (Merle, 2002).
Three indexes of inequalities in duration of schooling can be determined to characterize the
operation of the various educational systems. The first (A) relates to the duration of schooling of the10 % with the shortest period of schooling. The second index (B) relates to discrepancies in duration
between groups (men/women); the third (c) relates to the inequalities between individuals andconcerns the discrepancy in the duration of schooling between the 10 % of students who study the
longest and the 10 % who study for the least time. Schooling expectancy for the pupils with thelongest schooling and the mean schooling expectancy for all the educational systems are shown in the
methodological annex.
Pronounced differences can be observed between countries. Some countries are particularlyinegalitarian concerning the dispersion of schooling expectancy and concerning the duration of schooling for those who study for the shortest period (particularly Belgium, but also Austria,Denmark, and Portugal). Other countries are more egalitarian in these two dimensions (Sweden,
France, Ireland, and the Netherlands). On the other hand, countries like Germany, Finland and Norway diverge according to the chosen criteria: they educate their weakest pupils for quite a long
time, at the same time as displaying a rather pronounced dispersion of durations of schooling.
The index on inequalities of schooling between groups relates to differences in schooling
expectancy between men and women on entering the educational system. In the majority of countries,the schooling expectancy is higher for women than for men (from 0.4 year on average for OECDcountries). Deviations between the levels of schooling of the various countries are usually greater for women than for men. Some countries display substantial differences between the genders, in favour of women, particularly the Nordic countries (Denmark, Finland, Norway and Sweden) and the United
Kingdom.
Inequalities between schooling expectancy between the 10% leaving the system fastest and the 10 %who remain there longer, can vary by as much as three times from one country to another (5.5. yearsfor Ireland to 13.3 for Denmark). However, Ireland appears here to be an exception, since the other
countries present average differences much closer to those observed in Denmark.
Inequalities in school-
ing expectancy be-tween the 10 % who
spend the longest inschool, and those
whose schooling lasts
the shortest time may
vary by as much asthree times between
two extreme systems
(inequalities of 5.5
years for Ireland
compared with 13.2
for Austria, for ex-
ample).
They also highlightthe unequal situation
concerning the dura-
tion of the shortest
schooling (from 9.4
years for those with
the shortest schooling
in the Belgian educa-
tional system com-
pared with 10.8 years
in Germany, the
Netherlands, Norway,
or Sweden).
Finally, the indicatorshows that in general,
schooling expectancy
is higher for women
than for men, in the
majority of European
educational systems,
except in Austria,
Germany, the Neth-
erlands and Switzer-
land.
Sources:
Specific calculations carried out
on the basis of data supplied byOECD.
OECD (2001). Education at a glance. Paris : OECD.
Merle, P. (2002). La démocrati-
sation de l’enseignement;
Inequalities in schooling expectancy
52 B DK D EL E F IRL I L NL A P FIN S UK CH NO
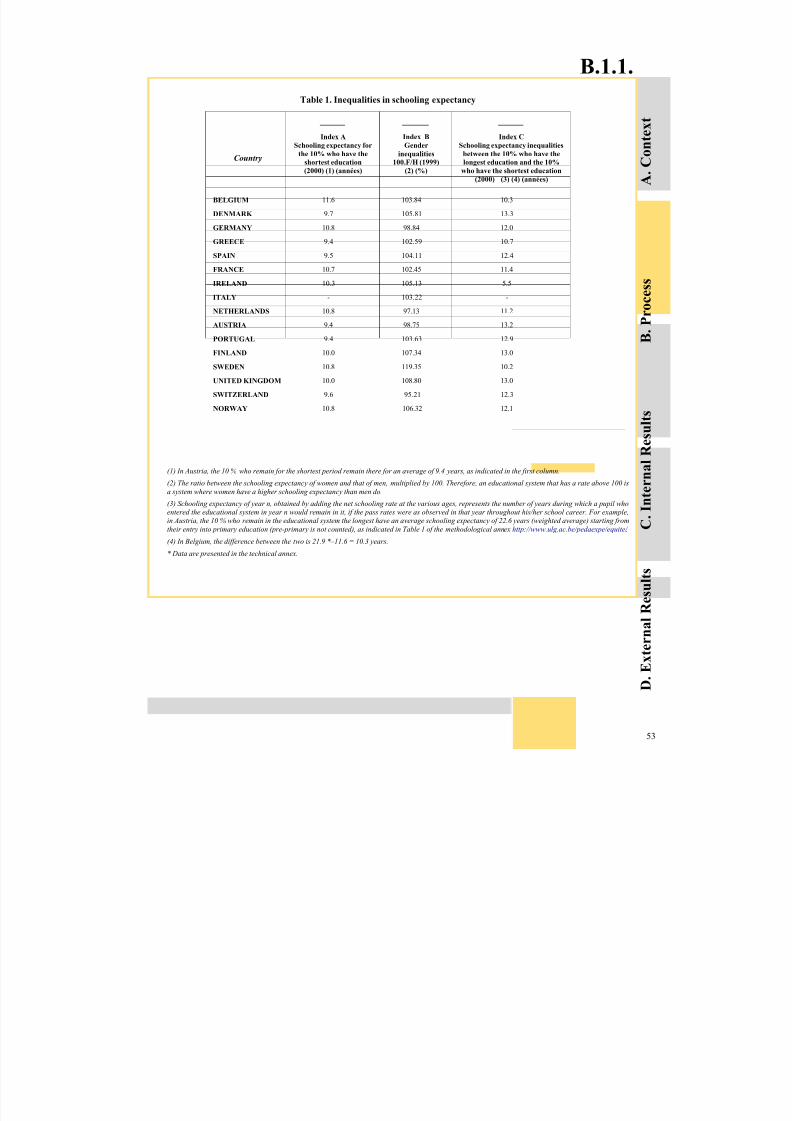
8/2/2019 Equity in European Educational System
http://slidepdf.com/reader/full/equity-in-european-educational-system 53/151
B.1.1.
Table 1. Inequalities in schooling expectancy
(1) In Austria, the 10 % who remain for the shortest period remain there for an average of 9.4 years, as indicated in the first column.
(2) The ratio between the schooling expectancy of women and that of men, multiplied by 100. Therefore, an educational system that has a rate above 100 is
a system where women have a higher schooling expectancy than men do.
(3) Schooling expectancy of year n, obtained by adding the net schooling rate at the various ages, represents the number of years during which a pupil who
entered the educational system in year n would remain in it, if the pass rates were as observed in that year throughout his/her school career. For example,
in Austria, the 10 % who remain in the educational system the longest have an average schooling expectancy of 22.6 years (weighted average) starting from
their entry into primary education (pre-primary is not counted), as indicated in Table 1 of the methodological annex http://www.ulg.ac.be/pedaexpe/equite/ .
(4) In Belgium, the difference between the two is 21.9 *–11.6 = 10.3 years.
* Data are presented in the technical annex.
D
. E x t e r n a l R e s u l t s
C . I n t e r n a l R e s u l t s
B . P r o c e s s
A . C o n t e x t
53
Country
Index ASchooling expectancy for
the 10% who have the
shortest education
(2000) (1) (années)
Index BGender
inequalities
100.F/H (1999)
(2) (%)
Index CSchooling expectancy inequalities
between the 10% who have the
longest education and the 10%
who have the shortest education
(2000) (3) (4) (années)
BELGIUM 11.6 103.84 10.3
DENMARK 9.7 105.81 13.3
GERMANY 10.8 98.84 12.0
GREECE 9.4 102.59 10.7
SPAIN 9.5 104.11 12.4
FRANCE 10.7 102.45 11.4
IRELAND 10.3 105.13 5.5
ITALY - 103.22 -
NETHERLANDS 10.8 97.13 11.2
AUSTRIA 9.4 98.75 13.2
PORTUGAL 9.4 103.63 12.9
FINLAND 10.0 107.34 13.0
SWEDEN 10.8 119.35 10.2
UNITED KINGDOM 10.0 108.80 13.0
SWITZERLAND 9.6 95.21 12.3
NORWAY 10.8 106.32 12.1

8/2/2019 Equity in European Educational System
http://slidepdf.com/reader/full/equity-in-european-educational-system 54/151
The countries that spend most on education are not necessarily those whose pupils obtain the bestresults or those who educate their pupils for the longest period (Mingat & Suchaut, 2000). Theinequalities in public spending within a single country for different individuals are nevertheless
important from the viewpoint of fairness. The spending on an individual can vary depending on theduration of his/her education, inequalities in spending between various levels of education and finally,differences in spending between establishments or classes at the same level of schooling (the main
determinant is the teaching staff complement of these establishments or classes). Inequalities in
spending are presented from the following two viewpoints:
· The relationship between public spending on a student in tertiary education (which educates the pupils who were most successful at school and from more privileged social backgrounds) and on
a pupil in primary education, which educates the whole population.· Up to the end of compulsory schooling, fairness requires that the educational system’s resources
should be distributed unequally to compensate the handicaps of certain populations of pupils. For that reason, the dispersion of teacher-pupil ratios and then the size of classes between certaindisadvantaged populations and the remaining population are presented (1).
European countries spent approximately twice as much for a student in tertiary education than for a primary school pupil (Austria, Finland, France, Greece, and Norway). The educational systems of Germany, Belgium, the United Kingdom, Sweden and even more so Ireland and the Netherlands giveeven greater precedence to students in tertiary education. The most egalitarian educational systems are
those of the following countries: Spain, Italy, Portugal and Denmark.
The Austrian educational system stands out due to its pronounced dispersion of teacher-pupil ratios
between the various establishments attended by 15 year-old students, unlike those of France, Italy,Portugal and even more so of the United Kingdom, Sweden and Switzerland. The position of thecountries sometimes differs if we take class sizes as the criterion: the dispersion of teacher-pupilratios, in relation to other countries, is lowest in Spain, France, Portugal, the United Kingdom than
that of class sizes, probably because these educational systems tend to break up large classes more,
which allows a fairer use of resources.
In all 2001 EU Member States, 15 year-old students from disadvantaged social backgrounds (2) aretaught, on average, in slightly smaller classes, particularly in Belgium, Austria, and France. InDenmark, Finland, Italy and the United Kingdom, and Sweden (3), disadvantaged pupils receive theleast of this kind of advantage. In some countries (Finland, Ireland, Italy, and the United Kingdom),
15 year-old students whose parents were born abroad are in classes of the same size, or slightly larger,than other pupils are. However, in the majority of educational systems, they are in smaller classes,especially in Belgium, the Netherlands, Austria, Luxembourg, and Switzerland. The weakest pupilsare not taught in larger classes in any country. They are taught in classes of the same size in the Latincountries (Spain, Italy, and Portugal) and the Scandinavian countries (Denmark, Norway, and to a less pronounced extent, Finland and Sweden), in smaller classes everywhere else, especially in Austria,
Belgium, and the Netherlands.
As to the use of educational resources, the countries are also quite different depending on their cultural region: the Latin countries spend less on higher education than the English-speaking
countries. Within a single generation, the distribution of resources between establishments or classesis more dispersed in the Latin countries, Austria and Belgium. Finally, among the countries where
resources are dispersed, the distribution is more favourable to pupils at risk in Austria, Belgium, and
France, but does not particularly favour them in Spain, Italy, and Portugal.
(1) The average effect of the teacher-student ratio was measured on the performance of pupils on the combined scale of liter-
acy. According to PISA, effects connected with this variable are non-linear. In general, the impact of this variable on pu-
pils’ results is rather modest. However, where the ratio exceeds 25 pupils, the performance in the three fields analysed by PISA falls significantly.
(2) The calculation was carried out for girls/boys, but countries where the two genders are taught in classes of significantlydifferent sizes are very few (except for Belgium, France, Greece and the Netherlands, where 15 year-old girls are taught in
classes that are, on average, slightly larger than those for boys).(3) While those from disadvantaged backgrounds are taught in smaller classes, they are generally not taught in establishments
with the highest teacher-pupil ratios, except in Belgium, France, Greece, Spain, and Sweden.
The countries where
the inequalities in
spending between
primary education(compulsory) and
tertiary education
(selective). are least
pronounced are
Spain, Italy, Portu-
gal, and Denmark.
It also seems that the
distribution of re-
sources between
schools or classes is
more dispersed in the
Latin countries, plusAustria and Belgium.
Among the countries
where the resources
are dispersed, the
distribution is in fa-
vour of pupils at risk
in Austria, Belgium,
and France, but does
not favour them in
Spain, Italy, and Por-
tugal.
Sources:
Calculations made from the
PISA databaseOECD (2002). Education at a
glance, 2002, Paris.
MINGAT, A. & SUCHAUT, B.(2000). African education sys-
tems. De Boeck (p.30: illustratethat it is not the countries that
spend most on education that
have the best results or educatetheir pupils for longer).
Inequalities in education spending
54 B DK D EL E F IRL I L NL A P FIN S UK CH NO

8/2/2019 Equity in European Educational System
http://slidepdf.com/reader/full/equity-in-european-educational-system 55/151
B.1.2.Table 1. Ratios of spending between primary and tertiary education, inequalities
in teacher-pupils ratios and class sizes
(1) public expenses per student indicate for each country the ratio between public expenses for a tertiary education student and for a primary education pupil.
The more the index value is high, the more the inequalities between expenses allowed for the tertiary education and for the primary education are important .
(OECD, 2002)
(3) The dispersion of the teacher-pupils (PISA data) gives the differences between schools for the number of full-time teachers divided by the number of the
students of the school.(4) unit= student (OECD, 2002)
(5) (6) (7) In those columns are indicated, for 100 students in a class of the complementary group, , the class size for the students from lower backgrounds,
foreign background and for those below the achievement level (PISA). (The standard errors are between brackets). (OECD, 2002)
Country
Inter-individuals inequalitiesInequalities between groups
for the class sizes
Class sizes
for students
below the
skills
threshold
Spending per
pupil
(1999)
(1)
Mean of the
class sizes
(2000)
(2)
Dispersion of
teacher-pupils
ratios
(2000)
(3)
Dispersion of
the class sizes
(2000)
(4)
Disadvantaged
social back-
ground
(2000)
(5)
Foreign origin
(2000)
(6)
BELGIUM 246 18.2 5.5 5.6 (0.1) 85 (1.5) 86 (3.0) 71 (2.4)
DENMARK 159 17.1 4.6 3.6 (0.1) 98 (1.3) 98 (3.0) 98 (1.7)
GERMANY 272 23.8 4.6 4.5 (0.1) 94 (0.9) 97 (1.1) 86 (1.2)
GREECE 196 24.8 5.1 5.0 (0.2) 94 (1.2) 95 (2.2) 92 (2.0)
SPAIN 157 23.8 4.8 6.2 (0.2) 93 (1.5) 95 (4.4) 94 (2.0)
FRANCE 190 26.6 3.7 5.9 (0.1) 90 (1.1) 97 (1.7) 78 (1.3)
IRELAND 320 22.4 5.9 5.5 (0.1) 92 (1.2) 101 (2.8) 78 (1.9)
ITALY 141 22 3.5 4.3 (0.1) 98 (1.0) 102 (4.2) 98 (1.9)
LUXEMBURG - 20.8 - 4.5 (0.1) 91 (1.0) 91 (0.8) 89 (2.4)
NETHERLANDS 295 23.2 - 4.9 (0.2) 92 (1.8) 88 (3.1) 73 (3.4)
AUSTRIA 184 18.3 8.1 6.7 (0.1) 89 (1.4) 91 (2.7) 76 (2.4)
PORTUGAL 138 21.3 3.9 5.8 (0.1) 96 (1.2) 96 (3.1) 95 (1.8)
FINLAND 196 18.6 4.5 3.2 (0.1) 97 (0.8) 100 (2.4) 90 (2.7)
SWEDEN 248 20.1 2.9 4.6 (0.1) 97 (1.0) 93 (1.9) 89 (1.7)
UNITED KINDOM 263 24.4 2.5 5.2 98 (1.2) 100 (1.4) 85 (1.5)
NORWAY 270 17.7 2.9 4.6 (0.1) 90 (1.3) 91 (1.4) 82 (1.9)SWITZERLAND 204 22.7 5.1 5.4 (0.4) 95 (1.7) 104 (2.2) 97 (2.6)
Students below
the skills thresh-
old
(2000)
(7)
D
. E x t e r n a l R e s u l t s
C . I n t e r n a l R e s u l t s
B . P r o c e s s
A . C o n t e x t
55

8/2/2019 Equity in European Educational System
http://slidepdf.com/reader/full/equity-in-european-educational-system 56/151
Perception of the support provided by teachers,
according to 15 year-old students
The literature on schooling efficiency suggests that it is beneficial for pupils, in particular thosewhose performance is low, to have teachers who show interest in their progress, want to make themadvance, and help them (OECD, 2001). The PISA 2000 evaluation questioned pupils on these various
aspects, and created a “teacher support” index. This indicator represents a facet of the “quality of theschool environment”.
The average value of the index for the 2001 EU Member States (-0.01) is comparable with that of allthe OECD countries (set at 0.00). At the European level, the lowest values of the index of perceptionof the support provided by teachers the are observed in the Benelux countries, Italy, Germany, andAustria. One can observe that the majority of these countries have a tradition of highly segregated
education (early streaming, repeating grades, specialized education, etc.). The highest values areobserved in Denmark, Sweden, Greece, Ireland, and Portugal. The dispersion of the index of
perception of the support provided by teachers is wider than the European average (average = 1.00) inLuxembourg, Ireland, Spain, and Austria, and is tighter in the Netherlands, Italy, Finland and
Denmark. (< 0.90) (Table 1).
When we compare the values of the index for boys and girls (Graph 1), we notice that for 10 of the
15 EU Member States, the girls’ answers are significantly more positive than boys’. This type of data, based on information from students, does not allow verification of whether there are genuinedifferences in the practices and attitudes of teachers in favour of girls – for example, it may concern adifference in perception. However, a difference based on gender, even if it is only perceived, may
indicate that girls feel that they have more support from their teachers.
In seven of the 2001 EU Member States, as well as in Switzerland, the differences between theresponses from the 25 % of pupils whose parents work in the least prestigious professions and other pupils are significant (Graph 2). In Denmark, students from the most disadvantaged social backgrounds feel that they receive the least support from their teachers. On the other hand, in
Germany, Luxembourg, the Netherlands, Italy, France, and Spain, they state that they receive greater support than students from more privileged backgrounds do. Similar observations can be made for
students whose parents were born abroad: in the Benelux countries, Germany, Switzerland, Finland,and Sweden, the students whose parents were born abroad state that they feel they are supported by
their teachers significantly more than their classmates are (Graph 3).
The situation of the pupils with the poorest reading skills (below PISA literacy level 2) is alsomixed. Rather surprisingly, there is no significant difference between them and their peers in themajority of the 2001 EU Member States. On the other hand, their responses are more negative thanthose of their counterparts in Denmark and the United Kingdom, while in Germany, Luxembourg,Switzerland, and Italy, they state that they receive their teacher’s support more than others do. Thismay reflect the policies that certain countries have set up in favour of low achievers, who may receive
special courses, or a more appropriate and individualized learning environment (Graph 4).
The index “teacher support” is based on the responses of 15 year-old pupils relating to the frequency with which they state:
“The teacher shows an interest in every student’s learning”, “The teacher gives students an opportunity to express opinions”,“The teacher helps students with their work”, “The teacher continues teaching until the students understand”, “The teacher
does a lot to help students”, and “The teacher helps students with their learning”.
For these indices, the international average was set at 0.00 for all the OECD countries and the standard deviation is 1.00. For
these indices, negative values indicate a situation less favourable than the average in all the countries of the OECD. Differences between the interest groups have been calculated with the method consisting in relating the gap observed between
the average of the interest group (i.e., boys, students whose parents were born abroad, the weakest students and students from a
lower socio-professional background) and the average of the reference group (girls, students whose at least one parent wasborn in the country of evaluation, students from a mean or higher socio-professional background, students above level 2 of
literacy) to the score dispersion of the other students (calculation of the size effect). A positive value indicates an advantage for
the interest group. A null value indicates there is no difference between both groups.
In 10 of the Euro-
pean Union Member
States, girls provide
significantly morepositive answers
than boys do about
the perception of the
support provided by
teachers.
In the Member
States where differ-
ences are observedfor students whose
parents work in the
least prestigious pro-
fessions and students
whose parents are
born abroad, com-pared with other
students, these inter-
est groups consider
that they receive
more support from
their teachers than
their classmates do.
The situation is
markedly different
for students with
poorer readingskills.
Sources:
Pisa 2000 database.http://www.oecd.org/els/PISA
OECD (2001). Knowledge and skills for life. First results from
Pisa 2000 . Paris : Author.
56 B DK D EL E F IRL I L NL A P FIN S UK CH NO

8/2/2019 Equity in European Educational System
http://slidepdf.com/reader/full/equity-in-european-educational-system 57/151
Graph 3. Index of support from
teachers for students whose
parents were born abroad,
compared with that for other
students.
-0,4 -0,3 -0,2 -0,1 0 0,1 0,2 0,3 0,4 0,5 0,6
Eu
Graph 1. Index of support from
teachers for boys
compared with that for girls
-0,4 -0,3 -0,2 -0,1 0 0,1 0,2 0,3 0,4 0,5 0,6
B
DK
D
EL
E
F
IRL
I
L
NL*
A
P
FIN
S
UK
CHE
Eu
-0,4 -0,3 -0,2 -0,1 0 0,1 0,2 0,3 0,4 0,5 0,6
Eu
Graph 2. Index of support from
teachers for students whose par-
ents have the least
prestigious professions compared
with that for other students.
B.2.1.
Values below zero indicate that interest groups (boys, students whose parents have the least prestigious professions, students whose parents were born
abroad) declare that they receive less support from teachers than other students do.
Graph 4. Index of support fromteachers for students
below the reading skills threshold
compared with that for other
students.
-0,4 -0,3 -0,2 -0,1 0 0,1 0,2 0,3 0,4 0,5 0,6
B
DK
D
EL
E
F
IRL
I
L
NL*
A
P
FIN
S
UK
CHE
Eu
Values below zero indicate that students with
the poorest performance in the reading test
(below literacy level 2) declare that they re-
ceive less support from teachers than other
students do.
* For this country, the rate of response is too low to guarantee good comparability.
The countries marked in blue are those for which there are significant differences (p=0.05)between the categories of student compared.
For each graph, the vertical line indicates the value of the effect size, for the EU Member
States. An unweighted average was calculated (each Member State has the same weight and
not the weight represented by its student population compared with other countries and not the
weight represented by its student population compared with other countries).
D
. E x t e r n a l R e s u l t s
C . I n t e r n a l R e s u l t s
B . P r o c e s s
A . C o n t e x t
57
Countries MeanStandard
error Standard deviation
Standard error
BELGIUM -0,28 0,02 0,93 0,01
DENEMARK 0,17 0,02 0,84 0,01
GERMANY -0,34 0,02 0,97 0,01
GREECE 0,14 0,02 0,97 0,02
SPAIN 0,09 0,03 1,05 0,01
FRANCE -0,20 0,03 0,97 0,01
IRELAND 0,13 0,03 1,04 0,01
ITALY -0,28 0,02 0,86 0,01LUXEMBURG -0,34 0,02 1,13 0,01
NETHERLANDS* -0,21 0,03 0,81 0,02
AUSTRIA -0,25 0,03 1,03 0,02
PORTUGAL 0,47 0,02 0,93 0,01
FINLAND 0,02 0,02 0,87 0,01
SWEDEN 0,21 0,02 0,9 0,01
UNITED
KINGDOM0,50 0,02 0,98 0,01
SWITZERLAND 0,01 0,03 0,96 0,02
EU unweighted
mean -0,01 0,01 0,99 0
Table 1. Mean value and standard deviation of the index of supportfrom teachers per country

8/2/2019 Equity in European Educational System
http://slidepdf.com/reader/full/equity-in-european-educational-system 58/151
The disciplinary climate in classrooms,
according to 15 year-old students
This indicator concerns the factors that may disrupt the learning climate, and which form part of what we have defined as being part of the school environment. Students were questioned about thefrequency of certain situations during their courses for the language of instruction. The questions
survey the working atmosphere within classes of 15 year-olds. The PISA disciplinary climate indexgives a measurement of the perception of the learning climate for the students questioned.
The value of the index for all the 2001 EU Member States is greater (0.10) than the average valuefor the OECD countries (set at 0.00). In Austria, Luxembourg, and Ireland, students have, on average,a more positive perception of the disciplinary climate in their class than in other 2001 EU Member States, while in Greece, the Netherlands, Italy, Sweden, Finland, Spain, and Belgium, the pupil’s
responses are, on average, more negative than in the EU as a whole. The dispersion of values of theindex for the EU as a whole is of the same order as that of the OECD countries. It is lower inDenmark, Portugal, Sweden, and Greece. On the other hand, the responses vary more between
students in Austria, Ireland, and Luxembourg.
In 8 of the 15 EU Member States (in 2001), we observe significant differences to the detriment of boys (Graph 1). In Germany, Luxembourg, Ireland, the United Kingdom, Italy, Spain, Portugal, and
Greece, boys report situations that disrupt the disciplinary climate in courses for the language of instruction more than girls do. Divergences between girls and boys on this type of data are a reminder of the need for caution when considering responses by students that are not backed up by externalobservations. In fact, gender-based differences may result from a divergence in the manner of
perceiving the same working environment in countries which do practise co-education, without gender differences between courses of study. It is also possible that where co-education is not practiced, that
15 year-old boys are grouped into classes where they do not benefit from a learning climate
comparable to that of girls.
It is also possible to think of a similar type of phenomenon when we compare the response of 25 %
of pupils whose parents have the least prestigious professions on the hierarchical occupational scale tothose of other students: in 4 of the 5 EU Member States where we observe significant differences between the two groups, they are unfavourable to the most disadvantaged, who report moredisruption. The latter group would suffer worse working conditions in class in Spain, Italy, Ireland,and the United Kingdom. Only Greek pupils coming from families that are more modest describe amore peaceful environment than their more privileged counterparts do (Graph 2). Greek students arealso different from those in other countries when we compare the situation of pupils whose parents
were born abroad to that of other students: they are the only ones to provide significantly morefavourable responses. In all the other countries analysed, the differences are insignificant, except for Italy, where children of parents born abroad claim to be in less peaceful working conditions than other
students (Graph 3).
In 10 of the EU Member States and in Switzerland, the low achievers in the reading test (below
literacy level 2 on the PISA combined scale), give significantly less positive responses than their counterparts do to items that compose the “disciplinary climate” index. The students with the poorest performance declare significantly more than others do that they are in classes where the learningenvironment is disrupted by noise or agitation by pupils. In the Benelux countries, France, and
Greece, the differences between students with better, or worse reading performance are insignificant(Graph 4).
The disciplinary climate index is based on the responses by 15 year-old pupils to questions relating to the following situations
in the courses for the language of instruction: “Students cannot work well”, “There is noise and disorder”, “At the start of
class, more than five minutes are spent doing nothing”, “The teacher has to wait a long time for students to quieten down”,“Students don’t listen to what the teacher says”, “Students don’t start working for a long time after the lesson begin”.
For this index, the international average was set at 0.00 for the OECD countries as a whole. The standard deviation is 1.00.
For these indices, negative values indicate a situation less favourable than average in all the OECD countries. Differences between the interest groups have been calculated with the method consisting in relating the gap observed between
the average of the interest group (i.e., boys, students whose parents were born abroad, the weakest students and students from alower socio-professional background) and the average of the reference group (girls, students whose at least one parent was
born in the country of evaluation, students from a mean or higher socio-professional background, students above level 2 of
literacy) to the score dispersion of the other students (calculation of the size effect). A positive value indicates an advantage for the interest group. A null value indicates there is no difference between both groups.
In half of the Euro-
pean Union Member
States, boys report
situations that dis-rupt learning in class
more than girls do.
In 10 of the Member
States and in Switzer-
land, the weakest
pupils state that they
are in less favourable
conditions than stu-
dents whose perform-
ance is better.
Sources: Pisa 2000 database.
http://www.oecd.org/els/PISA
58 B DK D EL E F IRL I L NL A P FIN S UK CH NO

8/2/2019 Equity in European Educational System
http://slidepdf.com/reader/full/equity-in-european-educational-system 59/151
B.2.2.
- 0,5 -0,4 -0,3 -0,2 -0,1 0 0,1 0,2 0,3 0,4
Eu
-0,5 -0,4 -0,3 -0,2 -0,1 0 0,1 0,2 0,3 0,4
Eu
Values below zero indicate that interest groups (boys, students whose parents have the least prestigious professions, students whose parents were born
abroad) perceive the disciplinary climate in their class less favourably than other students do.
Graph 4. Disciplinary climate. In-dex for students
below the reading skills threshold
with that of other students
-0,5 -0,4 -0,3 -0,2 -0,1 0 0,1 0,2 0,3 0,4
B
DK
D
EL
E
F
IRL
I
L
NL*
A
P
FIN
S
UK
CHE
E
Values lower than zero indicate that the stu-
dents with the poorest performance in the
reading test (below literacy level 2) perceivethe disciplinary climate of their class less
favourably than other students do.
Graph 3. Disciplinary climate. In-
dex for students whose parents
were born abroad compared with
that of other
students
Graph 2. Disciplinary climate.
Index for students with parents
with less prestigious
professions compared with that for
other students
Graph 1. Disciplinary climate. In-
dex for boys
compared with that for girls
* For this country, the rate of response is too low to guarantee good comparability.
The countries marked in blue are those for which there are significant differences (p=0.05)between the categories of student compared.
For each graph, the vertical line indicates the value of the effect size, for the countries of the
European Union. An unweighted average was calculated (each country of the Union has the
same weight and not the weight represented by its student population in comparison with theother countries).
-0,5 -0,4 -0,3 -0,2 -0,1 0 0,1 0,2 0,3 0,4
B
DK
D
EL
E
F
IRL
I
L
NL*
A
P
FIN
S
UK
CHE
Eu
D
. E x t e r n a l R e s u l t s
C . I n t e r n a l R e s u l t s
B . P r o c e s s
A . C o n t e x t
59
Countries MeanStandard
error
Standard
deviation
Standard
error
BELGIUM 0,12 0,03 1,01 0,02
DENMARK 0,20 0,02 0,77 0,02
GERMANY -0,10 0,02 1,02 0,02
GREECE 0,42 0,02 0,89 0,02
SPAIN 0,17 0,03 0,98 0,02
FRANCE 0,05 0,03 1,05 0,01
IRELAND -0,09 0,03 1,12 0,02
ITALY -0,12 0,02 1,11 0,01
LUXEMBURG 0,24 0,03 0,97 0,01
NETHERLANDS* 0,33 0,03 0,90 0,02
AUSTRIA -0,19 0,04 1,11 0,02
PORTUGAL 0,05 0,02 0,83 0,01
FINLAND 0,16 0,03 0,91 0,02
SWEDEN 0,19 0,02 0,85 0,02
UNITED
KINGDOM-0,02 0,03 1,03 0,02
SWEDEN -0,30 0,03 1,01 0,02
EU unweighted
mean 0,10 0,01 0,99 0
Table 1. Mean value and standard deviation of the index of
disciplinary climate per country

8/2/2019 Equity in European Educational System
http://slidepdf.com/reader/full/equity-in-european-educational-system 60/151
Segregation is a measure of the extent to which students with a specific characteristic are evenly (or unevenly) spread between the schools in one country. Of particular concern is the pattern for the mostdisadvantaged students in terms of achievement and family background. Equitable school systems
would not encourage the clustering together of students from poorer families, of similar occupationalclass, those born outside the test country, and those obtaining poor test scores. Such clustering couldlead to various forms of “ghettoisation” with all of the inequitable educational, social, and residential
consequences that this entails. Tables 1 and 2 are derived from PISA 2000 and TIMSS 1995. Theyillustrate between-school segregation for the 10 % of students with the lowest score in tests of reading,maths and science, and by parental occupation and family wealth. The Tables also illustratesegregation by female students, students who do not speak the test language at home, students whose parents were born outside the test country, and students who were born outside the test country. Ineach case, the segregation value denotes the percentage of the “minority” group who would have to
exchange school for there to be an even distribution of this group of students across schools in each
country.
Four preliminary points emerge from these tables. First, the segregation scores are very different in
scale for the considered student groups. For example, segregation by gender is generally much lower than segregation by test scores. Second, there is considerable variation between countries in their segregation scores for any one indicator. Segregation by gender in Ireland is four times that inFinland, whereas segregation by reading test score in Ireland is nearly half that of Belgium (and soon). Third, segregation by family wealth does not correlate highly with any other variable (even parental occupation). Fourth, the difference between the segregation scores for the same type of indices in PISA and TIMSS shows how sensitive these figures can be to sampling, age of students,
historical period, and the precise definition of variables. These four points together show that it is not possible to conclude overall that any one country has a more (or less) segregated school system than
another country.
Nevertheless, several interesting conclusions can be drawn when considering these segregationscores in interaction, and in comparison to school-level variables emerging from PISA. High
segregation by sex is largely a product of the existence of single-sex schools in the sample (r = 0.7 for
PISA) and/or academic and religious selection in allocating school places.
Countries that have highly segregated test scores in one subject (e.g. reading) also tend to havesimilar levels of segregation in other subjects (Maths and Science). These countries also appear to
have tiered schooling systems, or report allocating a high proportion of school places via academic
selection (r = 0.6 for PISA).
Segregation by parental occupation and by country of origin do not correlate consistently or highly
with any other of the measures used here. They are, presumably, measures of how mixed the intakesto schools are as a result of admission policies other than selection, and will also be a function of
population density and mobility and the nature of housing. Therefore, it would be safe to concludethat selection, and not social segregation as such, is responsible for the largest gaps in attainment.Overall, the Scandinavian countries of Sweden, Denmark, and Finland show less segregation on most
indices.
The data from PISA 2000 and TIMSS 1995 (population 2nd , 7
thand 8
thgrade students) was analysed using a variety of segrega-
tion indices, measuring the extent to which groups of students are evenly distributed between schools in each country. The index
illustrated here is the segregation index (S) which can be defined as the ‘proportion of the minority group of students who
would have to exchange schools for there to be an even distribution of this group across all schools’ (Gorard and Taylor 2002).S is caclulated through the formula : S=0.5* Σ (Ai /A-T i /T), where A represents the minority group, t, the total of the students and
i the grouping unit of the students. S gives similar results to other indices of the same type, such as the Dissimilarity index and
the Gini coefficient. The correlation between all indices and S was 0.9 or higher.
Segregation
Sources:
OECD, PISA 2000
NCES, TIMSS 1995Gorard, S., Taylor, C., (2002)
What is segregation? A com- parison of measures in terms of
strong and weak compositional invariance, Sociology, 36(4),
pp. 875-895.
60
Overall, the Scandi-
navian countries of
Sweden, Denmark,
and Finland show lesssegregation on most
indices.
B DK D EL E F IRL I L NL A P FIN S UK B DK D EL E F IRL I L NL A P FIN S UK CH NO

8/2/2019 Equity in European Educational System
http://slidepdf.com/reader/full/equity-in-european-educational-system 61/151
B.2.3.
Table 1. PISA
Table 2. TIMSS
The tables indicate the segregation values for each measure for both PISA and TIMSS. The segregation value denotes the percentage of the minority group
who would have to exchange places for there to be an homogeneous distribution of this group of students across schools in each country. Therefore, a larger
score represents a less equitable school system.* For this country, the rate of response is too low to guarantee good comparability.
Country Reading Maths ScienceFamily
Wealth
Parental
Occupation
GenderLinguistic
origin
Country of
origin
(parents)
Country of
origin
(student)
BELGIUM 66.2 64.6 65.1 26.0 36.1 21.9 60.9 35.9 44.6
Flemish Com. 59.3 56.5 61.3 18.8 33.5 26.1 62.9 37.0 51.2
French Com. 61.3 61.4 61.9 26.2 35.2 16.2 56.4 23.6 31.2
DENMARK 38.9 45.5 44.4 28.0 32.9 9.5 51.1 36.6 41.7
GERMANY 60.8 62.2 59.1 33.3 35.6 11.2 53.2 35.9 40.9
GREECE 58.4 57.1 55.0 26.3 43.3 12.5 68.2 33.8 47.8
SPAIN 40.0 40.0 45.0 28.0 31.6 9.9 75.4 41.2 56.9
FRANCE 56.3 56.2 56.4 31.4 30.5 11.9 59.7 29.1 47.2
IRELAND 39.0 38.4 42.7 29.5 28.8 29.7 79.7 27.9 45.4
ITALY 58.2 55.6 54.4 26.8 30.0 23.1 84.3 37.4 54.8
LUXEMBURG 40.8 37.2 40.0 23.2 23.7 12.3 25.4 12.6 23.7
NETHERLANDS* 66.0 61.6 64.7 23.3 30.3 10.2 57.8 32.5 41.4
AUSTRIA 61.8 62.1 63.1 24.1 36.4 28.4 53.3 38.9 48.7
PORTUGAL 48.1 51.8 48.5 36.4 39.7 7.5 70.0 35.6 34.9
FINLAND 27.4 34.4 34.3 21.0 35.8 7.3 74.7 50.2 54.7
SWEDEN 29.2 37.2 33.3 28.5 26.7 8.5 51.6 29.2 39.9
UNITED KINGDOM 42.8 49.1 48.0 26.3 30.8 16.0 71.3 38.2 45.8
England 39.4 45.4 47.2 28.3 31.7 14.7 63.3 41.3 44.4
Scotland 34.8 40.3 45.1 26.9 26.9 8.3 75.5 32.9 60.6
Northern Ireland 48.2 55.2 50.2 25.0 28.6 24.6 82.6 29.8 40.0
EU 48.8 50.5 50.4 28.0 33.4 14.9 62.4 41.2 47.5
Country Reading Maths ScienceFamily
Wealth
Parental
OccupationGender
Linguistic
origin
Country of origin
(parents)
Country of origin
(student)
BELGIUM
Flemish Com. - 47.2 32.2 - - 27.3 37.8 33.7 45.6
French Com. - 41.2 32.8 - - 13.3 37.7 20.4 35.2
DENMARK - 29.1 25.9 - - 6.8 51.1 34.7 38.2
GERMANY - 50.1 44.5 - - 11.3 40.7 35.9 37.7
GREECE - 27.0 24.4 - - 7.5 33.9 28.6 28.4
SPAIN - 28.1 27.8 - - 11.7 58.2 60.3 43.9
FRANCE - 33.1 25.6 - - 7.3 37.2 - -
IRELAND - 37.0 32.8 - - 29.0 64.5 23.3 38.3
ITALY - - - - - - - - -
LUXEMBURG - - - - - - - - -NETHERLANDS* - 50.9 40.8 - - 9.9 42.5 30.6 34.9
AUSTRIA - 45.9 42.6 - - 11.4 48.2 33.6 44.1
PORTUGAL - 25.3 24.9 - - 9.2 44.4 35.9 33.1
FINLAND - - - - - - - - -
SWEDEN - 34.4 34.4 - - 7.0 46.5 29.7 39.8
UNITED KINGDOM
England - 32.2 32.5 - - 15.8 55.5 40.2 41.4
Scotland - 29.6 28.0 - - 5.6 34.9 22.6 27.6
Northern Ireland - - - - - - - - -
EU - 36.9 32.9 - - 11.4 47.7 37.6 39.5
SWITZERLAND - 47.7 40.6 - - 7.2 29.3 22.1 32.0
NORWAY - 31.5 34.6 - - 8.4 53.7 39.1 41.5
D
. E x t e r n a l R e s u l t s
C . I n t e r n a l R e s u l t s
B . P r o c e s s
A . C o n t e x t
61

8/2/2019 Equity in European Educational System
http://slidepdf.com/reader/full/equity-in-european-educational-system 62/151
Data provided by a survey among 13-14 year old pupils from five European countries: Belgium (French Community), Spain
(Madrid), France (Paris), Italy (Rome), and the United Kingdom (Wales), between November and December 2002. In the United Kingdom and Italian samples, there were relatively few students who stated that they were born outside the test
country (2.3 % for United Kingdom and 5.0 % for Italy). The results for this category should be treated with caution.
There was a relatively high proportion of students who report that they receive low marks in school in Spain (22.9 % of the sample) and a low number in the United Kingdom (2.7 % of the sample). It is important to remember that the students them-
selves were asked to provide this estimate; it was not based on external evaluation of the achievement. In order to determine the occupational category, the 10 categories (ISCO –1 digit) coded in the questionnaire were amalga-
mated into 2. The higher occupational status (between those of the father and of the mother) was used in this analysis.
* Data on social category are not available for Italy.
This indicator measures how students perceive the treatment they receive at school. Theexplanations given by schools underlines the existence of an equality in the treatment for all pupils,which means an absence of partiality in the relationship between pupils and the educational staff,
above all teachers. The contrast between the explanations and the pupils’ daily experience at school iswhat we want to identify. It is not easy to assess the truthfulness of the opinions expressed by studentsabout how they feel they are treated at school. The method of collecting the information, a
questionnaire answered at their own school, and the possible concerns about the consequences of giving a certain opinion, could influence students to soften the expression of their personal experience,
attributing the hardest opinions to a “collective” feeling, where their own situation remains diluted.
In the five student samples participating in the survey, the percentage of students who agree with thesentence “Teachers treat me with justice” varies between 70.1 % for France and 78.2 % for Spain,which can be considered a high score. But when they are asked for their opinions about the sentence“The teachers respect all pupils” the level of agreement decreases in a remarkable way, especially for the United Kingdom and France, where just 49 % and 55.9 % of pupils, respectively, maintain thisassertion. If we consider the fact that most of those surveyed show their disagreement with the
statement “The teachers don’t have pupils who are their favourites”, we can point out somecontradiction between the support expressed for the first sentence and the support received by the next
ones.
The indicator is based in the information provided by a survey about the treatment received by
students at school, about the connections between rewards and punishments, about the objectivity in
pupils’ treatment and finally about their assessment of the justice of the marks received.
Tables 1 and 2 summarize this information for the student body, as well as the peculiarities that can be found when we introduce the variable “social and economic position of the father” and the variable“academic results of pupils”. The variable “gender” has not been included, given the wide coincidence
of opinions between boys and girls. In Table 1, the most obvious difference can be found among pupils who state that their school results are considered as low marks, who are much more critical thanthe rest of their schoolmates in relation to their perception of justice at school. The influence of thesocial position in the opinions about the existence of preferences among teachers must be emphasized.Much more pupils from the mid-high social background state the existence of these preferences;unlike the students coming from distinct social categories, these students think that teachers do not
show a lot of respect for students.
Table 2 shows the level of agreement with regard to punishments, rewards, and marks. Opinionvariations are observed between countries, although there is a common line in the sense that it is likelythat punishments are related to failures and a strong tendency that considers that the punishment of
some pupils is more likely than others because of the same failure. This opinion is much moresupported by pupils that have low marks at school and by pupils of highest status. Opinion about
rewards is quite favourable: pupils perceive a fair relation between rewards and merits. The judgementabout the adequacy of rewards in relation to the feeling of being treated with justice is more habitualat school than about adequacy of punishments. The third factor, marks, considered in the research area strong indicator in order to show that pupils think that marks received are suitable for the effort
made and are fair. These opinions are maintained by a high proportion of pupils and differences thatcould occur between several variables — countries, status and perception of school results — are
scarce, which endorses the belief that marks are a reward for effort and, except for pupils who are
considered as lower achievers, these marks are considered fair.
Students’ feeling of being treated with justice
Generally, and in
reference to their
own experience, stu-
dents feel that theyare treated with jus-
tice.
In this way, they con-
sider the marks they
receive to be fair.
However, when they
judge a teacher’s be-
haviour in relation to
a group of students,
their opinions be-
come more negative:
they consider thatteachers do not treat
pupils in an equal
way, and punish-
ments and rewards -
as an expression of
this treatment- differ
according to the yield
and the behaviour of
pupils.
Sources: European pilot survey about
feeling of justice at school.(2002)
Questionnaire for pupils.
62 B DK D EL E F IRL I L NL A P FIN S UK CH NO

8/2/2019 Equity in European Educational System
http://slidepdf.com/reader/full/equity-in-european-educational-system 63/151
Graph 1 summarizes the opinion of pupils about usual receivers of re-wards and punishments at school. In all countries, students have a higher
agreement with the statement “Teachers always punish the same pupils”
than with the statement “Teachers always reward the same pupils”.
59,8
35,2
47,8
43,7
64,9
64,4
55,9
37,9
48,6
69,4
0 10 20 30 40 50 60 70 80
Wales
Rome
Par is
Madrid
French Com.
It is always the sa me pupils who g et p unished
It is always the same pupils who get reward ed
Graph 1. Perception of justice of
punishments / rewards
B.2.4.
Table 1. General perception of justice at school.
Persentage of pupil’s agreement with the following
sentences
Table 1 shows the percentage of pupils who declare their agreement
(agree very much / agree) with certain statements about the perception of
justice in their daily life at school. The table shows the total answers givenby students, plus answers given by students from different socio-economic
background and from students who have low marks at school. Pupils that
belong to a Mid-High status and pupils with low marks are the most dis- senting ones.
Table 2. Relationship between punishments, rewards and
marks
Area/CityHighersocial
group
Lowersocial
group
Pupils
with
good
marks
Pupilswith low
marks
All
pupils
The teachers
treat me fairly.
French Com. 79 76 85 54 77
Madrid 78 78 88 64 78
Paris 74 65 79 52 70
Rome* - - 86 63 78
Wales 76 81 85 42 78
The teachers
don’t have
pupils who are
their favour-
ites.
French Com. 40 47 46 31 44
Madrid 36 42 43 34 40
Paris 22 40 31 28 33
Rome* - - 45 36 38
Wales 27 38 32 42 34
The teachers
respect all thepupils.
French Com. 64 68 72 44 65
Madrid 64 65 72 49 65
Paris 57 55 62 35 56Rome* - - 77 65 70
Wales 38 52 46 37 49
The other
adults in the
school treat the
pupils fairly.
French Com. 70 75 75 60 73
Madrid 73 76 74 73 75
Paris 60 65 59 58 60
Rome* - - - - -
Wales 72 68 73 58 70
French Com. 83 84 89 65 83
Madrid 82 81 90 70 81
Paris 73 71 79 57 72
Rome* - - 72 60 70
Wales 84 85 87 63 84
Pupils are
oriented fairly.
Table 2 shows the percentage of pupils who agree (agree very much / agree)
with the sentences referring to punishments, rewards, and marks. This table
includes the answers of the whole student body and the variations caused bythe inclusion of the variables social-economic position and academic results.
Differences between countries are remarkable, but a clear trend between
sentences and countries cannot be established.
Area/CityHighersocial
group
Lowersocial
group
Pupilswith
good
marks
Pupilswith low
marks
All
pupils
When pupils
get punished
they deserve it.
French Com. 65 69 67 54 67
Madrid 53 59 63 51 47
Paris 56 67 64 48 60
Rome* - - 63 63 63
Wales 51 58 60 29 55
The punish-
ments given
are fair.
French Com. 53 45 53 42 51
Madrid 61 64 68 56 62
Paris 45 55 50 38 48
Rome* - - 63 64 63
Wales 50 57 59 28 55
Some pupils
are punished
more than
others for the
same offence.
French Com. 70 69 70 70 69
Madrid 75 69 77 74 71
Paris 83 69 78 74 76
Rome* - - 52 40 51
Wales 75 67 71 88 70
It is always the
same pupils
who get pun-
ished.
French Com. 57 54 53 61 56
Madrid 63 66 60 73 64
Paris 65 71 68 63 65
Rome* - - 42 45 44
Wales 73 67 69 65 69
Pupils get
praised or
rewardedwhen they
deserve it.
French Com. 75 80 81 61 77
Madrid 72 75 77 73 73
Paris 75 79 79 67 62Rome* - - 80 67 74
Wales 80 84 83 59 82
Pupils get
praised or
rewarded
when they
deserve it.
French Com. 59 57 56 63 57
Madrid 60 54 49 76 56
Paris 63 67 60 69 63
Rome* - - 44 49 47
Wales 75 73 75 88 74
It is always the
same pupils
who get re-
warded.
French Com. 37 38 33 55 38
Madrid 46 52 38 65 49
Paris 47 51 43 58 48
Rome* - - 33 37 35
Wales 61 58 56 71 60
The marks
given by teach-
ers reflect the
effort made by
the pupil.
French Com. 80 81 82 70 79
Madrid 81 80 84 76 80
Paris 76 80 80 74 79
Rome* - - 81 75 75
Wales 76 85 84 68 81
French Com. 72 75 77 54 73
Madrid 71 71 81 64 72
Paris 72 69 76 62 72
Rome* - - 69 64 64
Wales 82 81 86 61 82
Pupils receive
fair marks.
D
. E x t e r n a l R e s u l t s
C . I n t e r n a l R e s u l t s
B . P r o c e s s
A . C o n t e x t
63

8/2/2019 Equity in European Educational System
http://slidepdf.com/reader/full/equity-in-european-educational-system 64/151
The 15-year old pupils who took part in PISA were tested on their skills in mathematics, reading, and science by means of stan-dardised questionnaires. Their results were aggregated in the form of a score which, while not being perfect, possesses the
advantage of being based on an illative theory. In this case, we use the score measurement produced by weighted maximum
likelihood, which is better suited to showing disparities between individuals than other score measurements presented in the PISA database.
The concept of fairness or justice in education is far from being universally agreed. Some peopleconsider fairness as final equality in results or learning. Others refer to the concept of equal opportunities. That concept is less “exacting” than the concept of equality of results. It consists of
demanding that each individual should be offered the possibility of attaining the same level, whatever his/her inherited traits and which are therefore imposed on him/her. The important nuance is that theachievement of equal opportunities is compatible with the continued existence of marked inequality in
results. Finally, some insist on extreme situations, requiring, for example, a measurement of discrepancies between the minority of individuals below a threshold of results, and the rest of the
population.
Table 1 gives a measurement of unfairness as inequality of learning or results. It is based on themeasurement of the standard deviation. This one supplies a measure of the relative concentration or dispersion of the student results in comparison with the average. We can see that the inequality of results is particularly pronounced in Belgium, Germany, and Luxembourg. It appears much lower in
the Netherlands, Spain, Ireland, and especially Finland.
In Table 2, we define fairness as equal opportunities, drawing a distinction between the aspects of
“socio-economic profile of parents”, “nationality”, and “gender”. Compared with the first of thesedimensions, the fairest situation is in Finland, Norway, Italy, and Austria: the pupils’ score in thesecountries is less dependent on their parents’ profile than elsewhere. On the other hand, countries likethe United Kingdom, Germany and Belgium record the highest levels of unfairness from this
viewpoint. Table 2 also illustrates the tendency towards unfairness in relation to nationality andgender. Via the correlation index shown at the bottom of Table 2, we can see that inequalities in
results according to nationality do not bear any real relation to inequalities according to socio-economic origin. The inequalities in results according to gender are of much lower intensity overallthan the others, and the important discrepancies favour the girls. The examination of the dataaccording to discipline reveals that these positive discrepancies in favour of girls are due to girls’
general propensity to perform better in the reading test.
Finally, Table 3 highlights the situation of pupils with a very low score. It gives a measurement of the proportion of the low achievers and of the discrepancy between the average score of these pupilsin mathematics, reading and science and those of the rest of the student population. The proportion of low achievers (PISA 2000) is particularly high in Germany, Italy and Portugal, and particularly low inDenmark, Finland and in the United Kingdom. The discrepancy becomes smaller in the following
order: Finland, Ireland, and Portugal. It is greatest in Belgium and Germany.
Inequalities in skills at the end of compulsory education
The inequalities of
results are particu-
larly pronounced in
Belgium, Germanyand Luxemburg.
In Finland, in Nor-
way and in Austria,
the results of the
pupils are less rela-
ted to the social ori-
gin than in the other
countries.
For the situation of
the weakest pupils,
that’s in Luxem-
burg, Belgium andGreece where the
gap with the stron-
gest pupils is the
most important.
Sources:OECD. 2000. Programme for
International Student Assess-ment (PISA) - http://www1
oecd.org/els/PISA
64 B DK D EL E F IRL I L NL A P FIN S UK CH NO
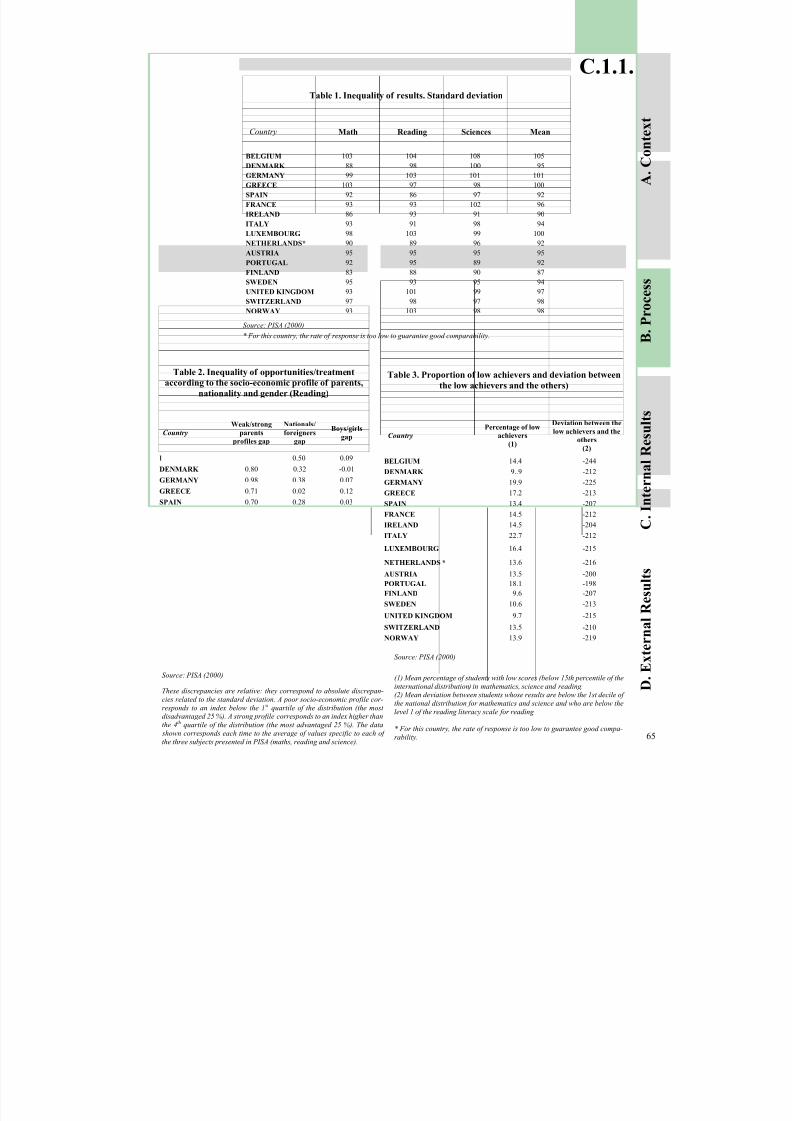
8/2/2019 Equity in European Educational System
http://slidepdf.com/reader/full/equity-in-european-educational-system 65/151
These discrepancies are relative: they correspond to absolute discrepan-
cies related to the standard deviation. A poor socio-economic profile cor-
responds to an index below the 1 st quartile of the distribution (the most disadvantaged 25 %). A strong profile corresponds to an index higher than
the 4th quartile of the distribution (the most advantaged 25 %). The data
shown corresponds each time to the average of values specific to each of
the three subjects presented in PISA (maths, reading and science).
Country
Weak/strong
parents
profiles gap
Nationals/
foreigners
gap
Boys/girls
gap
BELGIUM 0.98 0.50 0.09
DENMARK 0.80 0.32 -0.01
GERMANY 0.98 0.38 0.07
GREECE 0.71 0.02 0.12
SPAIN 0.70 0.28 0.03
FRANCE 0.85 0.43 0.05
IRELAND 0.74 -0.11 0.07
ITALY 0.62 0.23 0.13
LUXEMBOURG 0.90 0.61 0.08NETHERLANDS* 0.81 0.32 0.07
AUSTRIA 0.65 0.57 -0.04
PORTUGAL 0.91 0.09 0.04
FINLAND 0.54 0.28 0.20
SWEDEN 0.71 0.21 0.11
UNITED KING-
DOM0.93 0.09 0.05
SWITZERLAND 0.93 0.52 0.04
NORWAY 0.61 0.37 0.12
Correlation Ratio 0.20 -0.37
Country Math Reading Sciences Mean
BELGIUM 103 104 108 105
DENMARK 88 98 100 95
GERMANY 99 103 101 101
GREECE 103 97 98 100
SPAIN 92 86 97 92
FRANCE 93 93 102 96
IRELAND 86 93 91 90
ITALY 93 91 98 94
LUXEMBOURG 98 103 99 100
NETHERLANDS* 90 89 96 92
AUSTRIA 95 95 95 95
PORTUGAL 92 95 89 92
FINLAND 83 88 90 87SWEDEN 95 93 95 94
UNITED KINGDOM 93 101 99 97
SWITZERLAND 97 98 97 98
NORWAY 93 103 98 98
C.1.1.
Table 2. Inequality of opportunities/treatment
according to the socio-economic profile of parents,
nationality and gender (Reading)
Table 1. Inequality of results. Standard deviation
Source: PISA (2000)
(1) Mean percentage of students with low scores (below 15th percentile of the
international distribution) in mathematics, science and reading.(2) Mean deviation between students whose results are below the 1st decile of
the national distribution for mathematics and science and who are below the
level 1 of the reading literacy scale for reading
* For this country, the rate of response is too low to guarantee good compa-
rability.
Source: PISA (2000)
* For this country, the rate of response is too low to guarantee good comparability.
D
. E x t e r n a l R e s u l t s
C . I n t e r n a l R e s u l t s
B . P r o c e s s
A . C o n t e x t
65
Table 3. Proportion of low achievers and deviation between
the low achievers and the others)
Country
Percentage of low
achievers
(1)
Deviation between the
low achievers and the
others
(2)
BELGIUM 14.4 -244
DENMARK 9..9 -212
GERMANY 19.9 -225
GREECE 17.2 -213
SPAIN 13.4 -207
FRANCE 14.5 -212
IRELAND 14.5 -204
ITALY 22.7 -212
LUXEMBOURG 16.4 -215
NETHERLANDS * 13.6 -216
AUSTRIA 13.5 -200
PORTUGAL 18.1 -198
FINLAND 9.6 -207
SWEDEN 10.6 -213
UNITED KINGDOM 9.7 -215
SWITZERLAND 13.5 -210
NORWAY 13.9 -219
Source: PISA (2000)
8/2/2019 Equity in European Educational System
http://slidepdf.com/reader/full/equity-in-european-educational-system 66/151
The Sen index was initially designed as an index for measuring poverty. This poverty index has been transposed to the educa-
tion system as a school weakness and school excellence index, relating to the reading, maths, and science skills of 15 year-old
pupils. The discrepancy between these two indices is then given for each country. It takes simultaneously into account the rateof weak/strong pupils in the country, the intensity of the school weakness/excellence and the discrepancy of strong/weak scores.
More technical information are available in the annex. The data that enables to evaluate the Sen (T = the percentage of weak
pupils in the country, I: the intensity of the weakness of weak pupils and G: the score discrepancy of the weakest pupils) arealso available in the annex.
Three indicators were devised, inspired by an index proposed by Sen (1976), to measure the scale of
weakness and excellence at school from PISA scores (OECD, 2001). These indicators of weakness andexcellence at school, enable three parameters to be taken into account at the same time: the percentage
of weak (or strong) pupils in the education system, the intensity of the weakness (or excellence), andthe dispersion of the scores of those weak (or strong) pupils. From these two indicators of weaknessand excellence at school, the distance between these two groups of pupils is measured. The analyses
relate to the three fields evaluated in PISA (maths, reading, and science).
The values exhibited by the school weakness indicator show a great variety in maths, reading andscience. They also enable us to differentiate between countries above the European average (2001 EUMember States) for school weakness (Greece, Germany, Italy, Luxembourg, and Portugal) in the threefields evaluated by PISA. Likewise, this school weakness indicator allows a number of countries below
the European average to be identified, with regard to the situation of weak pupils. In the three fieldstaken simultaneously, the education systems of Ireland, the Netherlands, Finland, Sweden, and the
United Kingdom seem to perform particularly well, since the index grows with the weakness of the
pupils.
Likewise, a school excellence index was calculated to analyse the situation of the strongest pupils.The education systems which stand out because their school excellence indicators are above theEuropean average (Germany, Belgium, the Netherlands, Finland, Sweden, and the United Kingdom)are those which, apart from Germany and Belgium, have the lowest school weakness indicators. Thishigh score can be explained by the three components of the index, but particularly by the first, i.e. thefact of having a higher than average percentage of excellent pupils. Other education systems arecharacterized by an excellence index below the European average (Greece, Italy, Luxembourg,
Portugal, and Spain in particular), once again in the three domains under consideration. Thisobservation can be explained, in the same way, particularly by the first component of the index, i.e. the below-average percentage of excellent pupils. Here we find the education systems with a relatively
high school weakness index.
The difference between these two groups can be proposed based on these two indices of schoolweakness and excellence. It enables the distance separating the situation of the strongest pupils from
those with the poorest scores to be measured. It is devised as the total of the two previous indices.
That distance between weak and strong pupils is the most important in the following countries:Belgium, Germany, Greece, Luxembourg, and Portugal. However, in some educative systems, this
high value may be due to a particularly high school weakness index (as in the case of the Greek education system, for example), while it may be due to a strong school excellence index for others(Germany). Education systems which stand out simultaneously with a high excellence index and alower weakness index (like that of Finland or Sweden) do not appear as particularly elitist according tothe devised indicator. On the contrary, the gap between the weakest and the strongest is lower than the
European average.
Weakness and excellence at school
The Netherlands,
Finland, Sweden and
the United Kingdom
distinguish themsel-ves by school excel-
lence indexes higher
than the average and
by the least impor-
tant school weakness
indexes.
Countries such as
Greece, Italy, Luxem-
bourg, Portugal as
well as Spain present
an excellence index
lower than the ave-rage.
Furthermore, these
last ones have also
the systems that pre-
sent a high school
weakness index. As
far as the discrepancy
between strong and
weak pupils is
concerned, it is the
most important in
Belgium, Germany,
Greece, Luxembourgand Portugal.
Sources:
SEN A. (1976): "Poverty : An
Ordinal Approach To Measure-ment”, Econometrica, vol 44, n°
2, pp 219-231
COHEN SOLAL M., LOISY C.(2001), "Transferts sociaux et
pauvreté en Europe", Solidaritéet Santé, N°4, pp 89-100.
Data: OECD, International Programme for Monitoring the
Learning of Pupils, 2000
66 B DK D EL E F IRL I L NL A P FIN S UK CH NO

8/2/2019 Equity in European Educational System
http://slidepdf.com/reader/full/equity-in-european-educational-system 67/151
-3
-2,5
-2
-1,5
-1
-0,5
0
0,5
1
1,5
2
Faiblesse ExcellenceWeak-
ness
Excellence
-4
-3
-2
-1
0
1
2
3
Faiblesse ExcellenceWeak-
nessExcellence
C.1.2.
Table 1. Indexes of school weakness and excellence in maths, reading and science
Graph 1. Distance between school weakness and excellence in-dexes in maths
The school weakness and excellence indices are reported for each country.
The level of each of the columns gives the elitism index of the education
system; that index is the sum of the excellence index and the weaknessindex. For example, the Finnish education system has a quite low elitism
index in maths (1.3). In the fields evaluated by PISA, similarities appear in
the ranking of education systems, particularly with regard to the countries situated at the extremes (low or high elitism index).
Graph 3. Distance between school weakness and excellence in-
dexes in reading
Graph 2. Distance between school weakness and excellence
indexes in science
* For this country, the rate of response is too low to guarantee good comparability.
D
. E x t e r n a l R e s u l t s
C . I n t e r n a l R e s u l t s
B . P r o c e s s
A . C o n t e x t
67
-3,5
-3
-2,5
-2
-1,5
-1
-0,5
0
0,5
1
1,5
2
Faiblesse ExcellenceWeak-
ness
Excellence
CountrySchool weakness index School excellence index
Math Reading Science Math Reading Science
BELGIUM 1.2 1.3 1.5 1.2 0.9 0.7
DENMARK 0.8 1.3 1.5 0.6 0.6 0.5
GERMANY 1.4 1.6 1.1 0.8 0.8 0.8
GREECE 3.4 2.0 1.9 0.3 0.3 0.3
SPAIN 1.7 1.0 1.3 0.3 0.3 0.5
FRANCE 0.9 1.1 1.2 0.7 0.6 0.7
IRELAND 1.0 0.7 0.6 0.5 1.1 0.8
ITALY 2.4 1.2 1.4 0.2 0.4 0.4
LUXEMBOURG 3.0 3.2 2.4 0.2 0.2 0.2
NETHERLANDS* 0.4 0.5 0.5 2.0 1.3 1.4
AUSTRIA 1.1 1.3 0.7 0.8 0.6 0.8
PORTUGAL 2.3 1.8 1.4 0.2 0.4 0.3
FINLAND 0.4 0.4 0.5 0.9 1.3 1.1
SWEDEN 1.1 0.8 0.8 0.7 0.8 0.7
UNITED KINGDOM 0.8 0.9 0.6 1.0 1.2 1.2
UE 1.4 1.2 1.1 0.6 0.7 0.6
SWITZERLAND 0.8 1.4 0.9 1.1 0.6 0.6
NORWAY 1.2 1.5 1.1 0.5 0.7 0.6

8/2/2019 Equity in European Educational System
http://slidepdf.com/reader/full/equity-in-european-educational-system 68/151
Data used for preparing this indicator come from the Civic Education Study promoted by IEA. The study started in 1994 and lasted until 2001. The main data collection was done in 1999. The target population was defined as 14-year-old students, even
if mean ages varied between 14.1 (Belgium – French Community) and 15.3 (Hong Kong). The Data was collected through atest of civic knowledge and attitudes via a survey using questionnaires completed by students, teachers, and schools. Samples
included between 112 and 185 schools per country.Civic knowledge scores were calculated through responses given to a test of 38 questions, 25 of which refer to knowledge of
content and 13 to skills in interpretation. All of them were presented in a multiple-choice format.
It is not easy to measure personal and social development of young people. This is a complexconstruct in which different dimensions can be identified. It should also be recognized that some of these dimensions are neither easily accessible nor measurable. Nevertheless, it is a central aspect for
assessing the effects of education. That difficulty has forced researchers and policy-makers to look for some proxy measures to assess that complex reality.
One of the most attractive fields related to personal and social development concerns civicknowledge and attitudes. The ways in which young people demonstrate that they are ready toundertake their role as citizens in our democracies are certainly a major field of analysis to assess theeffectiveness of education systems. In 1999, a comparative study was started by the International
Association for the Evaluation of Educational Achievement (IEA), whose results were presented in2001. This study provides us with interesting data about civic knowledge and attitudes of 14-year-old
students in 28 countries.
This indicator is based on the IEA’s Civic Education Study, considering data from 2001 EU
countries only plus Switzerland.
Table 1 shows that those 2001 EU Member States have a slightly higher mean in civic knowledge
than the international mean. This is mainly due to low achieving students (P5) getting a higher scorethan the international fifth percentile. High achieving students (P95) have a similar score to studentsfrom other countries. Results vary from one country to another. Finland gets a very high score and
Greece and Italy are not far behind. On the other hand, Belgium (French Community) and Portugal
got the lowest scores among the fifteen countries of the European Union.
The dispersion of results is of special interest in this case. Table 1 and Graph 1 show that countriesdiffer in the dispersion of results. Switzerland, Portugal, and Belgium (French Community) have
closer scores between high and low achievers (P95-P5). All of them have dispersion values below 57.On the other hand, Italy, Greece, Finland, and Denmark have dispersion values over 66. As anaverage, the EU countries which participated plus Switzerland have a P95-P5 difference slightly over the international mean. It can be said that EU countries have some differences in the dispersion of
civic knowledge results, even if those differences are not excessive.
Table 1 shows that there is some relation between dispersion and scores. Low achievers usually havea smaller dispersion (Portugal), while high achievers usually have a wider dispersion (Greece, Italy,
Finland).
Table 2 shows differences existing between male and female students. There are some countries in
which girls do better than boys, as is the case in Belgium (French Community). On the contrary, insome other countries boys do better than girls do (Denmark, Switzerland). As an average, the participating EU countries plus Switzerland do not show significant differences between boys andgirls. Gender differences are in all cases not very important, nor significant. At that age, results are not
that different between boys and girls.
Some differences in
the civic knowledge of
14-year-old students
are observed in Euro-pean countries (EU-
15). In 1999, scores
varied between 94.74
and 109.29, which is a
significant difference.
The EU mean was
slightly above the in-
ternational mean
(101.06 instead of
100).
Dispersion inside
every country alsovaried, from the less
spread distributions
in Switzerland and
Portugal to the most
spread in Italy,
Greece and Finland.
These last countries
also got the highest
scores for the top fifth
percentile.
In general, high
achieving countries
got a wider dispersionof results than low
achievers.
Sources:
Torney-Purta, J., Lehmann, R.,Oswald, H. and Schulz, W.
(2001): Citizenship and Educa-tion in Twenty-eight Countries.
Civic Knowledge and Engage-
ment at Age Fourteen, Amster-dam, IEA.
Civic knowledge of students
68 B DK D EL E F IRL I L NL A P FIN S UK CH NO

8/2/2019 Equity in European Educational System
http://slidepdf.com/reader/full/equity-in-european-educational-system 69/151
40 60 80 100 120 140 160
CH
P
B (French Com.)
EU Mean
D
International Mea n
S
UK (England )
DK
FIN
EL
I
Graph 1 shows country disper-
sions in Civic Knowledge scores
between the lowest and highest achievers. A longer bar means a
wider dispersion of results. Bars
placed more to the right side
tend to be longer, showing that
high results correspond to wider differences.
Table 2. Civic Knowledge at Age 14: Gender differences
Table 2 shows gender differ-
ences between boys and girls
in Civic Knowledge at age fourteen. In some countries
boys do better than girls do
(Denmark, Switzerland), whilein others girls do better than
boys do (Belgium – French
Community, Greece, Italy).
The differences are not very
high, the EU mean being closeto 0.5.
Graph 1. Civic Knowledge at Age 14: Dispersion from percentiles 5 to 95
C.2.1.
Table 1. Civic Knowledge at Age 14 (Scores and percentiles)
Table 1 shows the mean
scores obtained at age four-teen in Civic Knowledge.
(International mean brought
up to 100) It also includesaverage scores for percentiles
5 and 95 (the score below
which are located the weakest
5% and the score above whichare located the strongest 5%)
and the difference between
them. In general, the higher scores correlate with the
wider dispersions. Differences
among EU countries are not
excessive, but significant in some cases.
Country Mean ES P5 P95 P95 - P5
BELGIUM
(French Com.)95 0.94 70 127 57
DENMARK 100 0.54 69 134 65
GERMANY 100 0.50 74 135 61
GREECE 108 0.76 76 145 68
ITALY 105 0.77 77 146 69
PORTUGAL 96 0.73 73 127 55
FINLAND 109 0.68 79 145 66
SWEDEN 99 0.78 72 134 62
UNITED KINGDOM
(England)99 0.62 73 135 62
SWITZERLAND 98 0.80 74 128 54International Mean 100 0.16 71 135 61
EU Mean 101 - 74 136 63
D
. E x t e r n a l R e s u l t s
C . I n t e r n a l R e s u l t s
B . P r o c e s s
A . C o n t e x t
69
Country Mean Scores for Girls Mean Scores for Boys Difference Value
BELGIUM (French Com.) 97 93 5
DENMARK 99 102 -3
GERMANY 99 101 -1
GREECE 109 107 2
ITALY 106 104 2
PORTUGAL 96 97 -1
FINLAND 110 108 2
SWEDEN 100 99 1UNITED KINGDOM
(England)99 100 0
SWITZERLAND 97 100 -2
International Mean 100.4 99.7 0.7
EU Mean 101.7 101.2 0.5
8/2/2019 Equity in European Educational System
http://slidepdf.com/reader/full/equity-in-european-educational-system 70/151
Qualifications are the most tangible result of schooling. They are used by many contacts, includingemployers, to form an idea of an individual’s capabilities. They confer prestige, income, and other social benefits. Therefore, researchers, those responsible for education systems and citizens
themselves are most attentive to inequalities in school careers. Inequalities between individuals, evenif they do reflect their respective educational merits, may be perceived as unfair if they threaten socialcooperation. The dispersion in duration of theoretical school careers as designated by qualifications
would be a good indicator of this. In the absence of a way of calculating this, one can approach it viathe dispersion of the actual duration of schooling, including grade-repeating, proposed in sectionB.1.1, or via the homogeneity of school careers (col. 1): the school systems where a large majority of young people leave at the same level produce a category within which many individuals may feelequal. This is the case in Germany, Austria, Switzerland, and Portugal. On the other hand, in Belgium
and the United Kingdom, school careers are less homogenous.
The inequality of school careers between groups is a good clue to the inequality of opportunities,even if it is not measured perfectly. The increased risk of leaving the school system very early (col. 2)for children in disadvantaged categories is particularly high in Belgium and particularly low in
Finland and Sweden. On the other hand, the increased chances of having a long school career (col. 3and 4) for children of privileged categories are high in Italy and Germany, and low in Finland, the
Netherlands, and Sweden.
In most of the fifteen countries of the European Union , girls go on to higher education more often
than boys do (col. 5). That is not the case in the education systems in Germany, Austria, Luxembourgand Switzerland. The advantage held by girls is particularly pronounced in Finland and Portugal. The
education systems that are closer to equality on this point are the Netherlands and the United
Kingdom.
The minimum career necessary to have reasonable prospects of finding work and not being
threatened with social marginalization probably differs from one country to another. However, if weconsider that leaving school before the second cycle of secondary education (col. 6) must entail a risk in this respect, it is Portugal that has the highest proportion of pupils who run that risk, followed by, toa lesser extent, Spain, Italy, and Luxembourg; in Switzerland and the Nordic countries (Denmark,
Norway, Finland, and Sweden) the proportion is the lowest.
These indicators show that certain countries appear egalitarian or inegalitarian depending on thecriterion under consideration. For instance, the educational system of Switzerland may be consideredegalitarian because few students leave early, but, at the same time, as inegalitarian because girls haveless access to tertiary education than boys. However, we can observe that two countries are mentionedat least twice among the most egalitarian countries, without ever being mentioned among the most
inegalitarian (the Netherlands and Sweden) and that two countries are in the opposite situation
(Belgium and Italy).
In Germany, Austria,
Portugal, and in
Switzerland, the
school careers arehomogenous: a large
majority of students
leave at the same
level of the educa-
tional system.
In Finland, Sweden,
and the Netherlands,
the influence of social
origin on school ca-
reer is particularly
low.
The proportion of pupils with a very
short school career is
lowest in Scandina-
vian countries and
Switzerland.
Sources:
(1), (5), (6): OECD, Educationat a Glance, 2002.
(4): Shavit,Y. and Blossfeld, H.
P., 1993, Persistent inequalities,Westview Press, Boulder; Duru-
Bellat,M. and Kieffer, A., 1999,
La démocratisation de l’ensei-
gnement revisitée, Cahiers del’IREDU, Dijon.
(2) and (3): Iannelli,C., 2002,
Parental Education and Young people’s educational and La-
bour Market Outcomes: A com-
parison across Europe, in Ko- gan, I. and Müller,W., School to
Work transition in Europe, Mannheimer Zentrum fûr Eu-
ropäisches Sozial Forschung.
Inequalities in school careers
Col (1): The modal (i.e. most frequent) level of training attained by individuals from 25 to 34 years of age is one of the follow-
ing three: before the second cycle of secondary education (ISCED 1 or 2), second cycle of secondary education (ISCED 3 or 4),
tertiary (ISCED 5 or 6). It is the first in Spain, Luxembourg and Portugal, the third in Ireland, and the second in the other countries.
Col (2) to (5): The same value of the ratio in two countries may relate to two very different quantities. So in col (5), the 130 for
Italy corresponds to schooling of 13% of women and 10% of men, while the 133 by Norway corresponds to 40% of women and 30% of men. The basic data is shown in the methodological annex.
Col (2) and (3): the population consists of young people between 15 and 35 years of age in 2000, who left school for the first time in the previous 10 years (5 years for Finland and Sweden). These indicators show the way school functioned between 1970
and 2000.
Col (4): See the methodological annex http://www.ulg.ac.be/pedaexpe/equite/
70 B DK D EL E F IRL I L NL A P FIN S UK CH NO

8/2/2019 Equity in European Educational System
http://slidepdf.com/reader/full/equity-in-european-educational-system 71/151
C.3.1.
Table 1. Inequalities in school career
Country
Inter-individuals
inequalitiesInequalities between groups
Proportion of pupils below the
threshold of com-
petences
Percentage of
individuals from
25-34 year-olds
having reached the
modal level of
education
(2001)
(1)
Early drop out
whom parents
received short/long
education
(2000)
(2)
Ratio of chances to
obtain a tertiary
degree related to
parents education
level
(2000)
(3)
Influence of social
origin on the
highest educational
level attaint
(4)
Percentage of
tertiary graduate
women from 25-34
year-olds. linked to
the same percent-
age for men
(2001)
(5)
Percentage of 25-
34 year-olds who
have left before
upper secondary
education
(2001)
(6)
BELGIUM 39 8.7 3 - 118 25
DENMARK 57 - - - 136 13GERMANY 63 - - 26 to 28 % 87 15
GREECE 49 3.3 2.3 - 128 27
SPAIN 43 3.6 2 - 122 43
FRANCE 43 4.3 2.3 20% 115 22
IRELAND 48 - - - 111 27
ITALY 45 3.5 6.8 26 to 28 % 130 43
LUXEMBURG 41 - - - 88 41
NETHERLANDS 48 - - 11% 96 26
AUSTRIA 68 2.4 2.9 - 87 17
PORTUGAL 68 - - - 170 68
FINLAND 49 1.6 1.1 - 153 13
SWEDEN 54 1.8 1.8 - 114 9
UNITED KINGDOM 38 - - 17% 97 32
SWITZERLAND 66 - - - 48 8
NORWAY 58 - - - 133 7
(1) In Belgium, the educational level at which 25-34 year-olds most frequently left school is the second cycle of secondary education, which is, in Bel-
gium, the modal level of education for this age bracket. 39% of individuals in this age bracket left at that level.(2) In Greece, 20% of children whose parents left school before the second cycle of secondary education, i.e. at ISCED levels 1 or 2, leave school at those
same levels ISCED 1 or 2, while that is the case of only 6% of children whose parents attended higher education, i.e. ISCED levels 5 or 6. The indica-
tor is 20/6= 3.3.(3) Among two young people who have left the education system in Spain recently, the first of parents who attended higher education, the second of par-
ents who left school before the second cycle of secondary education, the situation where the former has a higher education degree and the latter does
not is twice as likely as the other way around. The indicator is the odd ratio, in this case 2.0.
(4) The social origin of pupils, defined by the profession and the highest level of qualifications achieved by their father, explains, for recent cohorts in France, approximately 20% of the variation in educational level attained by pupils at the end of their school career.
(5) In Denmark, 34 % of women from 25 to 34 years of age have received higher education compared with 25% of men in the same age bracket. Theindicator is 34,100/25 = 136
(6) In Spain, 43 % of individuals from 25 to 34 years of age left the education system before the second cycle of secondary education (ISCED 1 or 2).
D
. E x t e r n a l R e s u l t s
C . I n t e r n a l R e s u l t s
B . P r o c e s s
A . C o n t e x t
71
8/2/2019 Equity in European Educational System
http://slidepdf.com/reader/full/equity-in-european-educational-system 72/151
In the last column of the table, the Pearson Correlation Ratio (PCR) is defined as the square root of the ratio between the vari-ance of the means of the ISEI index respect to the three educational levels (numerator) and the ISEI sample total variance
(denominator). The PCR is a non-negative number less than or equal to one, proportional to the level of mean dependence
between the two variables (=0 null dependence; =1 maximum dependence).
The ad hoc module on transition from school-to-work from the EU Labour Force Survey (EU LFS) was used to analyse the influence of young (15-35 years old) people’s educational attainment on early
occupational status in eight European countries.
We are not dealing here with a social mobility indicator, but a status attainment indicator. Actually,mobility indicators always regard inequalities among social groups (with different social origins),while in this case inequalities among individuals are measured. For this reason, social origin is not
included in the construction of this indicator.
According to a meritocratic point of view, it can be asserted that a high correlation betweeneducational level and professional status means a high level of equity, and inversely. From another point of view, it can be asserted that a high correlation between these dimensions implies thateducational systems participate more powerfully in the process of production of social inequalities.
And that, in this case, a high level of educational equity should be ensured.
The table is based on data reported in Iannelli (2002), concerning young people who left educationfor the first time in the previous 10 years (5 years for Finland and Sweden). Educational attainmenthas been recoded into three levels (ISCED: 1/2, 3/4, 5/6). Young people's occupational status is
measured by the International Socio-Economic Index of Occupational Status (HISEI), ranging from16 (the lowest level) to 90 (the highest level), proposed in Ganzeboom, De Graaf and Treiman (1992).The proposed indicator is the Pearson Correlation Ratio (PCR), reported in the last column of the table
(see below).
The comparison among eight European countries in the table allows the detection of differences inthe level of mean dependence represented by the Pearson Correlation Ratio. The strength of theassociation in Belgium is relatively strong; while it is weaker in the Scandinavian countries and
Austria. France and the Southern European countries are in the middle.
It is worth noting that previous comparative research (Shavit & Müller, 1998) found the strongestlink between education and ISEI in Germany, Switzerland and Netherlands, the weakest one in the
United Kingdom and the United States, with Sweden, Italy and France in the middle.
For all the countries
considered here, the
impact of the level of
education is quite im-portant but it varies
significantly between
countries.
The impact is stronger
in the less egalitarian
education systems and
weaker in the more
egalitarian systems.
Sources:
European Union Labour ForceSurvey, Eurostat (2000).
Occupational attainment of the young people,
by educational level
72 B DK D EL E F IRL I L NL A P FIN S UK CH NO

8/2/2019 Equity in European Educational System
http://slidepdf.com/reader/full/equity-in-european-educational-system 73/151
Country
Highest educational attainment
TotalPearson
CorrelationRatio*
Lower secondary or less Upper secondary Tertiary
HISEI class
mean%
HISEI class
mean%
HISEI class
mean% % N
BELGIUM 32.3 17 36.6 42 57.5 41 100 2930 0.68
GREECE 31.3 15 40.2 58 58.7 27 100 7654 0.63
SPAIN 30.8 35 36.6 22 52.4 43 100 14909 0.6
FRANCE 33.3 20 38 42 53.3 37 100 19444 0.64
ITALY 33.7 29 43.2 56 60 14 100 17331 0.63
AUSTRIA 34.1 15 40.8 74 65 11 100 4632 0.57
FINLAND 35 12 36.6 56 56.6 32 100 3576 0.57
SWEDEN 36.2 14 39 62 58.3 24 100 1872 0.53
D.1.1.
Table 1. Occupational status (HISEI means) according to highest educational attainment by young people,
when leaving initial education/training
*Pearson correlation ratios are computed slightly modifying the total means.
The PCR is proportional to the level of mean dependence between the two variables (=0 null dependence; =1 maximum dependence).
D
. E x t e r n a l R e s u l t s
C . I n t e r n a l R e s u l t s
B . P r o c e s s
A . C o n t e x t
73
8/2/2019 Equity in European Educational System
http://slidepdf.com/reader/full/equity-in-european-educational-system 74/151
In the first Table, the effects of parents' education (social origin) on the ISEI index are estimated by OLS regression parame-
ters. Gross, direct, and indirect (mediated through education) effects are measured by parents’ education regression coeffi-cients and their percentage reduction when the young educational attainment is included in the model. The 7 occupational
classes in the EGP * schema have been reduced to 3, for statistical reasons (number of subjects).
(* List of professions)
The purpose of this indicator is to present the influence of the parental level of education on the
occupational status of the young. The stronger the influence, the less fair the system is. Three distinctmeasurements of this influence are presented here. The first one shows the ovrall influence of the
parental level of education, the second one the direct influence, and the third one the indirect influence(which is mediated by the level of education). The second way of influence implies a social inequity,
the third an educational inequity.
The figures in the first Table, reported in Iannelli (2002), concern young people aged 15-35 who lefteducation for the first time in the previous 10 years (5 years for Finland and Sweden). The data sourceis the European Union Labour Force Survey, 2000 ad hoc module on transitions from school-to-work.The three columns of the Table 1 are the first group of proposed indicators. The first two columns arethe International Socio-economic Index of Occupational Status (ISEI) predicted average increase for
young people having parents with tertiary education compared to those with parents with secondaryeducation or less, obtained as linear regression coefficients of parents' education respectively in the
regression model having as independent variables: only gender and parents' education (Model 1);gender, parents' education and educational attainment of the young (Model 2). Therefore, coefficients
in the first column measure the gross effect of parents' education on young people's occupationalstatus and those in the second column measure the direct effect. The indirect effect (mediated through
education) is represented by a proxy: the relative reduction (in percent) of the effect of parental
education of Model 1 to Model 2.
In the first Table, the effect of the parents’ education is evident in all the 12 countries but it isusually smaller in the Northern countries and larger in some Eastern countries (Hungary and Romania,in particular) and in Belgium, with the others European countries in an intermediate position. The
gross effect is highly correlated both with direct and indirect effects, and a high percentage of thegross effect appears to be mediated by education, especially where the gross effect is large. Direct andindirect effects are also correlated; partial exceptions are Slovenia and Spain where the direct effect is
high in respect to the indirect effect.
The overall or gross effect of parental education (Column 1) is obvious for the eight countries. It isnevertheless more limited in Sweden and much more in Finland. It is stronger in Greece, Italy, Spainand Belgium. France and Austria are in an intermediate position. The same order can be observed inthe two remaining columns of the table, but not without some significant differences. The directeffect, which is linked to a inequality of the social system rather than to the education system, is thestrongest in Greece, Spain and Italy. It is the weakest in Sweden and Finland. The indirect effect,
which involves the education system, is stronger in Belgium, then in Greece, Italy and France. Thiseffect is lower in Finland. Austria, Spain and Sweden have here an intermediate position. It is yet
noticeable that the indirect effect is not only influenced by the importance of the social inequalities ineducation, but also by the strength of the relationship between education and vocational status (levelof credentialism). It is thus possible that, for the country where this correlation is the strongest (see theIndicator D1.1), the indirect effect caused by the inequalities of the education system results
somewhat amplified.
The impact of pa-
rents’level of educa-
tion can be observed
in each country.
However, it is more
limited in Sweden
and Finland and
more important in
Greece, Belgium and
Spain.
Sources: European Union Labour Force
Survey, Eurostat (2000) .
European Community Household
Panel Survey, Eurostat (1998).
Occupational status of young people, by educational
level of parents
74 B DK D EL E F IRL I L NL A P FIN S UK CH NOB DK D EL E F IRL I L NL A P FIN S UK CH NO

8/2/2019 Equity in European Educational System
http://slidepdf.com/reader/full/equity-in-european-educational-system 75/151
D.1.2.
Table 1. Predicted average increase in the occupational status
for young people having parents with tertiary educationcompared to those with parents with lower-secondary education or less
CountryModel 1 *
(gross effect)
Model 2 **
(direct effect)
% reduction of model 1 to model 2
(indirect effect)
BELGIUM 14.45 5.36 62.9
GREECE 16.96 6.96 59.0
SPAIN 14.19 7.49 47.2
FRANCE 11.06 5.25 54.7
ITALY 15.07 6.41 57.5
AUSTRIA 9.05 4.79 47.1
FINLAND 5.99 4.12 31.2
SWEDEN 7.64 3.92 48.7
D
. E x t e r n a l R e s u l t s
C . I n t e r n a l R e s u l t s
B . P r o c e s s
A . C o n t e x t
75
In this table, the effects of parental education on the ISEI index are derived by regression coefficients in OLS regressions performed separately in each
country. Entries in the first and second columns represent the predicted average increase in the occupational status for young people having parents with
tertiary education compared to those with parents with lower secondary education or less.
* Entries in this column are OLS regression coefficients of parental education in the model having parental education as independant variable.
** Entries in this column are OLS regression coefficients of parental education in the model having education and individual’s education as independant variables

8/2/2019 Equity in European Educational System
http://slidepdf.com/reader/full/equity-in-european-educational-system 76/151
Contribution of the educational system to the
situation of the most disadvantagedThis indicator is inspired by the Principle of difference of Rawls’ theory about fairness. This principle
requires that “the social institutions are developed in such a way that the expectations linked to the worsesocial conditions are as good as possible” (Van Parijs, 2004). The education systems are involved in
these institutions.
To which conditions does the education system contribute to improve the expectations of those whowill be in the “worse social positions”?
(1) If it leads its weakest students (those are very likely to be in the “worse social positions”) till the end
of the compulsory education with a rather good level. It is not a matter of knowing how many people
did receive an insufficient education (C11 and C12), but rather which type of education the less
educated received. The answer is given here by the average of the first decile in two domains of thePISA 2000 programme, reading literacy and mathematics, both being considered as necessary to a
autonomous life. Here Belgium, Denmark, Finland and the United Kingdom distinguish themselves
positively, and Greece, Spain, Italy, Luxembourg and Portugal negatively.
(2) If it contributes to the national wealth growth. A recent study (Fayey, 2004) showed the well-being of
the poorest was correlated with the wealth of the European countries, in such a way that the well-
being of the poorest quarter in the richest countries was often higher than the level declare by the
richest quarter in the poorest countries. The index used here comes from a study conducted by the
OECD about the evolution of different productivity factors in the years 80’ and 90’. According tothis approach, the wealth growth per inhabitant linked to education evolution is the highest in Spain,
Greece, Ireland and Italy. This education evolution had the poorest impact on wealth growth in
Denmark, Switzerland and Norway.
(3) If the redistribution of wealth reduces the prevalence of poverty. The inequalities in education are
more consistent with fairness in a country where social transfers reduce the prevalence of poverty.This reduction is the most important in Denmark, Luxembourg and the Netherlands; it is the least
important in Greece, Italy and Portugal. The difference between the countries in the North of Europe,
where effective social policies reduce inequalities, with the countries of the South, where those
policies are absent or less targeted on the poorest people, is obvious.
(4) If the most educated are less distant from the most disadvantaged; if the most educated feel more
solidarity with the most disadvantaged and take part in associations that help them.
About education, Rawls writes that the fact we devote more attention to the better endowed is only
justified if that has the effect of “improving the long-term expectations of the most disadvantaged”. Inthis aspect, the education inequalities are only justified when the most educated people’s practices, in theglobal meaning of the word, contribute the most to these populations’ expectations. Taking the availabledata into account, we think this contribution is all the more important that they are socially not distantfrom them (i.e. they form couples together, they send their children in the same schools, …) and have
values or practices that show a feeling of solidarity with the most disadvantaged.
The percentage of the most educated who form a family with someone of a low social level is not highin any country, but it does reach nearly 30% in Ireland, Norway and Sweden, whereas the countries
where it is lowest are Luxembourg, Spain, Italy and Portugal.
The fact of sending children to secondary school in a school attended by students of a higher level isgreatly increased by the fact of having a higher education degree in Spain and Italy; but it is increased to
a lower extent in Ireland, the Netherlands and Denmark.
The propensity of the most educated to show solidarity feelings towards the most disadvantaged has been evaluated through their answers to questions about what fairness requires about the mostdisadvantaged people’s status in society. The answers show most solidarity in Germany, Greece, Spain
and Portugal; they show less solidarity in Ireland, the Netherlands and in the Scandinavian countries.
The picture is clearly different when we consider the practices of the most educated rather than their feelings. Those who are activist in associations inspired by values of solidarity are very numerous in the
Netherlands, Finland, Sweden, and are not numerous in Germany, Ireland and Greece.
If those indices are aggregated by giving to the first three ones an importance greater than to the
following four ones, its appears that the education system serves particularly the most disadvantaged people’s expectations in Belgium, Ireland, the Netherlands, Finland, Sweden and the United Kingdom
whereas it serves them to a particularly low extent in Greece, Italy, Luxembourg and Portugal.
The effects of the
education system on
a variety of very dis-
tinct variables, such
as the school level of the ;lowest achievers;
contribution to eco-
nomic growth, prac-
tices of the most edu-
cated, … - all thesevariables being able
to improve the situa-
tion of the most dis-
advantaged – are the
most important in
Belgium, Finland,Ireland, Sweden and
in the United King-dom, and are the
least important in
Greece, Italy and
Portugal.
76 B DK D EL E F IRL I L NL A P FIN S UK CH NO
Sources:
(1) (4) (5) Calculations from the
PISA database (2000).(2) OCDE (2002). Education at
a Glance. Indicator A14.
(6) and (7) Calculations fromdata of the European Value
Survey (EVS) (1999).
Van Parijs, Ph., (2004). What is
a just educational system? Mul-
tigr. Rawls, J. (1987). Théorie de la
justice. Seuil. Fahey, T. (2004). Who is disad-
vantaged in the enlarged EU ?
A comparison of the regional
and social exclusion perspec-
tives using quality of life indica-tors. Paper in the seminar of the
Changequal. network. Paris.
We greatly thank Ph. Van Parijs for his critical reading of the first version of the present indicator. We are the only responsible
for its inadequacy. Any reader of Rawls will understand that the inadequacy of the data available led us to make choices that donot match the rawlsien theory, for instance when we mention the “well-being” (a criteria refuted by Rawls who focuses on the
primary social goods) or when we make use of the “transfers whereas Rawls gives explicitly a greater importance to a lower inequality of primary incomes rather than to a redistribution. Of course, the aggregation of the various indices does not try to
deal exhaustively with the “long-term expectations” of the most disadvantaged. For this aggregation, (1) received a weight of 3,
(2) and (3) a weight of 2 and the remaining indices a weight of 1.
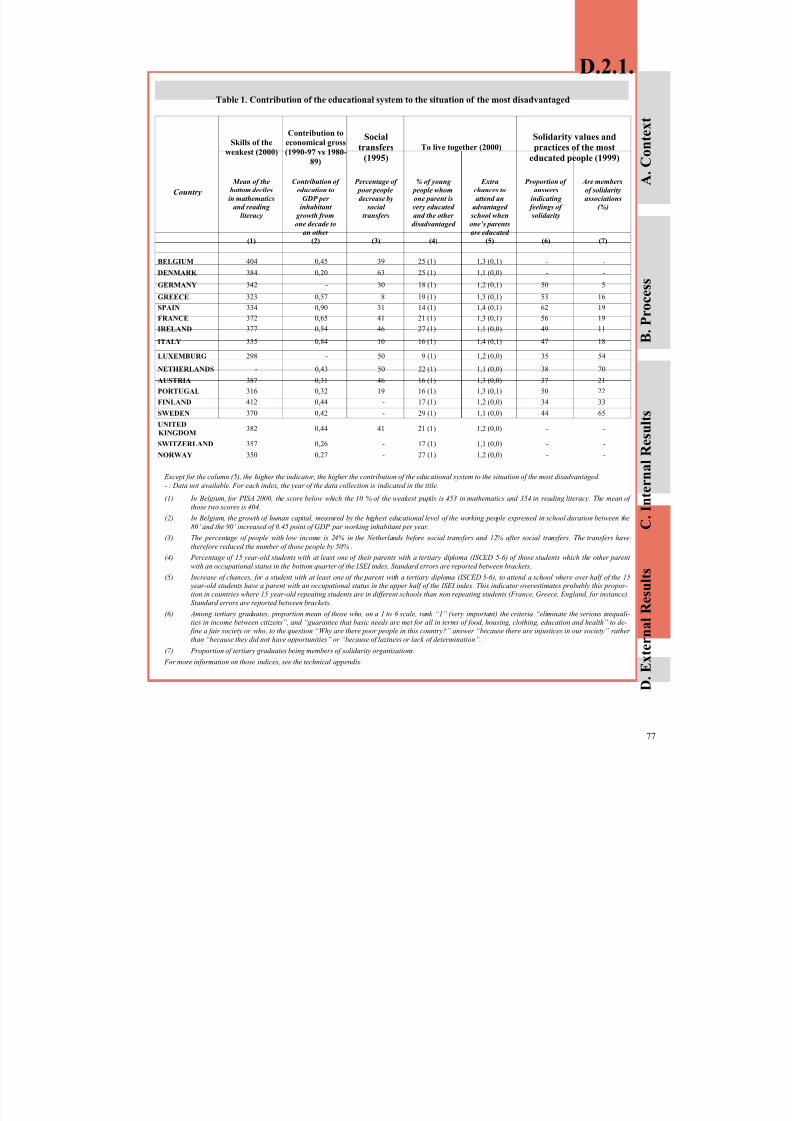
8/2/2019 Equity in European Educational System
http://slidepdf.com/reader/full/equity-in-european-educational-system 77/151
D.2.1.
Table 1. Contribution of the educational system to the situation of the most disadvantaged
Except for the column (5), the higher the indicator, the higher the contribution of the educational system to the situation of the most disadvantaged.
- : Data not available. For each index, the year of the data collection is indicated in the title.
(1) In Belgium, for PISA 2000, the score below which the 10 % of the weakest pupils is 453 in mathematics and 354 in reading literacy. The mean of
those two scores is 404.
(2) In Belgium, the growth of human capital, measured by the highest educational level of the working people expressed in school duration between the
80’ and the 90’ increased of 0.45 point of GDP par working inhabitant per year.
(3) The percentage of people with low income is 24% in the Netherlands before social transfers and 12% after social transfers. The transfers have
therefore reduced the number of those people by 50% .(4) Percentage of 15 year-old students with at least one of their parents with a tertiary diploma (ISCED 5-6) of those students which the other parent
with an occupational status in the bottom quarter of the ISEI index. Standard errors are reported between brackets.
(5) Increase of chances, for a student with at least one of the parent with a tertiary diploma (ISCED 5-6), to attend a school where over half of the 15 year-old students have a parent with an occupational status in the upper half of the ISEI index. This indicator overestimates probably this propor-
tion in countries where 15 year-old repeating students are in different schools than non repeating students (France, Greece, England, for instance).
Standard errors are reported between brackets.
(6) Among tertiary graduates, proportion mean of those who, on a 1 to 6 scale, rank “1” (very important) the criteria “eliminate the serious inequali-
ties in income between citizens”, and “guarantee that basic needs are met for all in terms of food, housing, clothing, education and health” to de-
fine a fair society or who, to the question “Why are there poor people in this country?” answer “because there are injustices in our society” rather
than “because they did not have opportunities” or “because of laziness or lack of determination”.
(7) Proportion of tertiary graduates being members of solidarity organizations.
For more information on those indices, see the technical appendix.
D
. E x t e r n a l R e s u l t s
C . I n t e r n a l R e s u l t s
B . P r o c e s s
A . C o n t e x t
77
Country
Skills of the
weakest (2000)
Contribution toeconomical gross
(1990-97 vs 1980-
89)
Socialtransfers
(1995)
To live together (2000)Solidarity values andpractices of the most
educated people (1999)
Mean of the
bottom deciles
in mathematics
and reading
literacy
(1)
Contribution of
education to
GDP per
inhabitant
growth from
one decade to
an other
(2)
Percentage of
poor people
decrease by
social
transfers
(3)
% of young
people whom
one parent is
very educated
and the other
disadvantaged
(4)
Extra
chances to
attend an
advantaged
school when
one’s parents
are educated
(5)
Proportion of
answers
indicating
feelings of
solidarity
(6)
Are members
of solidarity
associations
(%)
(7)
BELGIUM 404 0,45 39 25 (1) 1,3 (0,1) - -
DENMARK 384 0,20 63 25 (1) 1,1 (0,0) - -
GERMANY 342 - 30 18 (1) 1,2 (0,1) 50 5
GREECE 323 0,57 8 19 (1) 1,3 (0,1) 53 16
SPAIN 334 0,90 31 14 (1) 1,4 (0,1) 62 19
FRANCE 372 0,65 41 21 (1) 1,3 (0,1) 56 19
IRELAND 377 0,54 46 27 (1) 1,1 (0,0) 49 11
ITALY 335 0,84 10 16 (1) 1,4 (0,1) 47 18
LUXEMBURG 298 - 50 9 (1) 1,2 (0,0) 35 54
NETHERLANDS - 0,43 50 22 (1) 1,1 (0,0) 38 70
AUSTRIA 387 0,31 46 16 (1) 1,3 (0,0) 37 21
PORTUGAL 316 0,32 19 16 (1) 1,3 (0,1) 50 22
FINLAND 412 0,44 - 17 (1) 1,2 (0,0) 34 33
SWEDEN 370 0,42 - 29 (1) 1,1 (0,0) 44 65
UNITED
KINGDOM382 0,44 41 21 (1) 1,2 (0,0) - -
SWITZERLAND 357 0,26 - 17 (1) 1,1 (0,0) - -
NORWAY 350 0,27 - 27 (1) 1,2 (0,0) - -
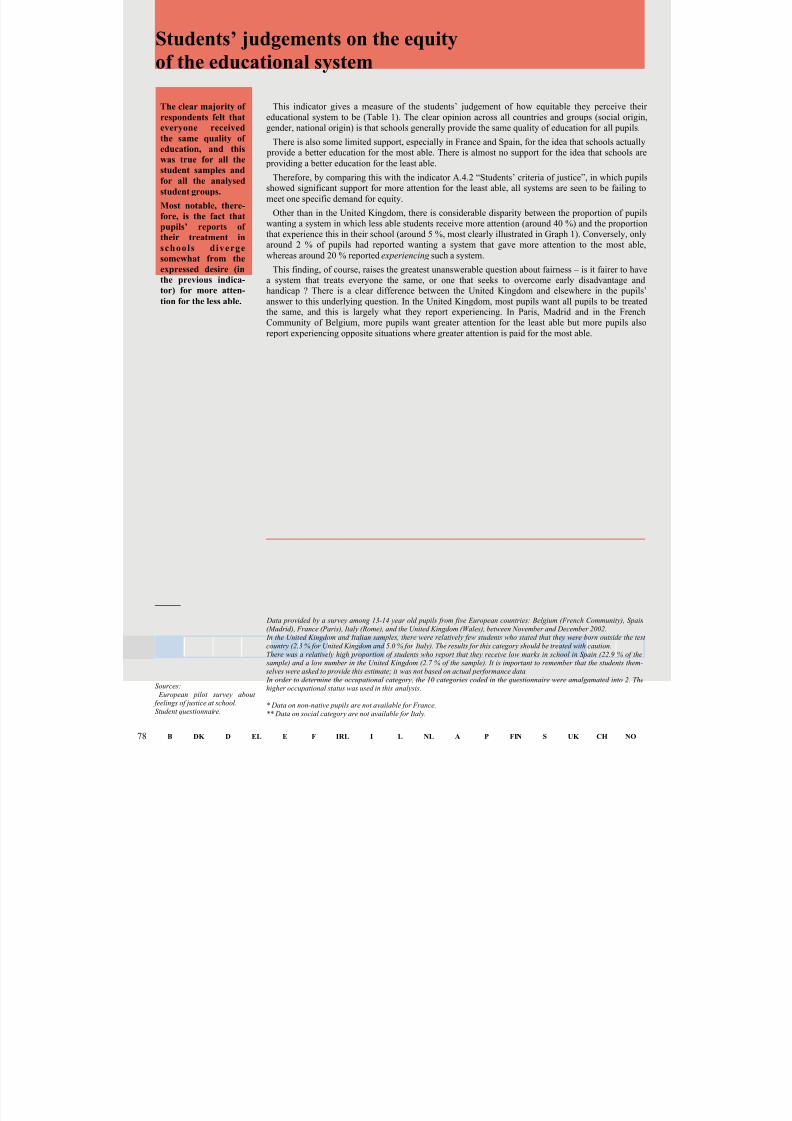
8/2/2019 Equity in European Educational System
http://slidepdf.com/reader/full/equity-in-european-educational-system 78/151
This indicator gives a measure of the students’ judgement of how equitable they perceive their
educational system to be (Table 1). The clear opinion across all countries and groups (social origin,
gender, national origin) is that schools generally provide the same quality of education for all pupils.
There is also some limited support, especially in France and Spain, for the idea that schools actually provide a better education for the most able. There is almost no support for the idea that schools are
providing a better education for the least able.
Therefore, by comparing this with the indicator A.4.2 “Students’ criteria of justice”, in which pupilsshowed significant support for more attention for the least able, all systems are seen to be failing to
meet one specific demand for equity.
Other than in the United Kingdom, there is considerable disparity between the proportion of pupilswanting a system in which less able students receive more attention (around 40 %) and the proportionthat experience this in their school (around 5 %, most clearly illustrated in Graph 1). Conversely, onlyaround 2 % of pupils had reported wanting a system that gave more attention to the most able,
whereas around 20 % reported experiencing such a system.
This finding, of course, raises the greatest unanswerable question about fairness – is it fairer to havea system that treats everyone the same, or one that seeks to overcome early disadvantage andhandicap ? There is a clear difference between the United Kingdom and elsewhere in the pupils’
answer to this underlying question. In the United Kingdom, most pupils want all pupils to be treatedthe same, and this is largely what they report experiencing. In Paris, Madrid and in the French
Community of Belgium, more pupils want greater attention for the least able but more pupils also
report experiencing opposite situations where greater attention is paid for the most able.
The clear majority of
respondents felt thateveryone received
the same quality of education, and this
was true for all the
student samples and
for all the analysed
student groups.
Most notable, there-
fore, is the fact that
pupils’ reports of
their treatment in
schools d iverge
somewhat from the
expressed desire (inthe previous indica-
tor) for more atten-
tion for the less able.
Sources: European pilot survey about feelings of justice at school.
Student questionnaire.
Students’ judgements on the equity
of the educational system
78
Data provided by a survey among 13-14 year old pupils from five European countries: Belgium (French Community), Spain
(Madrid), France (Paris), Italy (Rome), and the United Kingdom (Wales), between November and December 2002.
In the United Kingdom and Italian samples, there were relatively few students who stated that they were born outside the test
country (2.3 % for United Kingdom and 5.0 % for Italy). The results for this category should be treated with caution.
There was a relatively high proportion of students who report that they receive low marks in school in Spain (22.9 % of the sample) and a low number in the United Kingdom (2.7 % of the sample). It is important to remember that the students them-
selves were asked to provide this estimate; it was not based on actual performance data.
In order to determine the occupational category, the 10 categories coded in the questionnaire were amalgamated into 2. Thehigher occupational status was used in this analysis.
* Data on non-native pupils are not available for France.
** Data on social category are not available for Italy.
B DK D EL E F IRL I L NL A P FIN S UK CH NO

8/2/2019 Equity in European Educational System
http://slidepdf.com/reader/full/equity-in-european-educational-system 79/151

8/2/2019 Equity in European Educational System
http://slidepdf.com/reader/full/equity-in-european-educational-system 80/151
Data provided by a survey among 13-14 year old pupils from five European countries: Belgium (French Community), Spain
(Madrid), France (Paris), Italy (Rome), and the United Kingdom (Wales), between November and December 2002. In the United Kingdom and Italian samples, there were relatively few students who stated that they were born outside the test
country (2.3 % for United Kingdom and 5.0 % for Italy). The results for this category should be treated with caution.
There was a relatively high proportion of students who report that they receive low marks in school in Spain (22.9 % of the sample) and a low number in the United Kingdom (2.7 % of the sample). It is important to remember that the students them-
selves were asked to provide this estimate; it was not based on actual performance data. In order to determine the occupational category, the 10 categories coded in the questionnaire were amalgamated into 2. The
higher occupational status was used in this analysis.
* Data on social category are not available for Italy.
If students’ attitudes translated in work and effort at school appear in the first position, the quality of school education comes second. Although the percentages of agreement for the second item aresomewhat lower than for the first one, they exceed 80 % in all cases. The help that students receive at
home is valued similarly in Belgium (86 %), Spain (84 %), and the United Kingdom (84 %). France presents a somewhat lower percentage (79 %) and Italy presents a much lower number of students
(43 %) who agree with this proposition.
Intelligence effect on school progress is valued differently according to the country, with adifference of 20 points from one extreme to the other: 43 % for France and 69.5 % for the UnitedKingdom. Finally, according to the students, the level of schoolmates’ competence as an important
element for scholastic progress is taken into consideration. Again, Italian students are those who valuethis alternative the least, with a mere 14 % in agreement. On the contrary, almost half of the studentsfrom the United Kingdom surveyed are of the opinion that schoolmates’ level of competence is
important for their own progress.
Male and female students follow the general pattern, but with a shade of difference that should behighlighted: in all the countries females present somewhat higher percentages in the valuation of effort
as a determinant of progress than males, while males always surpass females in the valuation of intelligence. In the first case, though gender differences are very small, since bys and girls bothexceed 90 % in supporting this statement, we find nevertheless that by a few points, female studentshave a higher consideration of effort and work. In the second case, the valuation of intelligence, male
students highlight this criterion more vigorously than their female counterparts do. This tendency can
be appreciated especially in Italy, France, and Spain, as pointed out in graph 2.
Socio-economic conditions do not influence the opinion represented in these responses. Students of all social conditions maintain that personal effort and work is the main contributor for progress atschool. The differences show hardly any discrepancies and a pattern of behaviour related to social
status cannot be identified (Table 1). This unanimity disappears for other questions. For example, thesecond most quoted option “educational quality” is especially appreciated by students of a high status
and good marks, just as “support received at home”.
Personal effort, quality education, and family support seem to be the triad for predicting scholasticsuccess. Even those students with poor academic results maintain this order in their evaluation. Theresponsibility for progress is therefore shared among the students themselves (effort), the academic
institution (quality education), and the family (support at home).
In the opinion of the
majority of the stu-
dents in the five
countries included inthis study, effort and
work is the most im-
portant determinant
of scholastic pro-
gress, with more
than 95 % of stu-
dents in agreement,
affording strong reli-
ability given the una-
nimity in the re-
sponse.
Sources:
European pilot survey about feeling of justice at school.
Questionnaire for pupils
Student’s expectations towards
the educational system
80 B DK D EL E F IRL I L NL A P FIN S UK CH NO

8/2/2019 Equity in European Educational System
http://slidepdf.com/reader/full/equity-in-european-educational-system 81/151
Area/City Higher socialgroup
Lower socialgroup
Pupils with goodmarks
Pupils with lowmarks
All pupils
the amount of
effort he/she
puts in.
French Com. 96 98 98 88 97
Madrid 97 97 98 96 97
Paris 98 97 99 91 97
Rome* - - 97 96 97
Wales 97 96 97 84 96
his / her
intelligence.
French Com. 50 53 51 46 51
Madrid 60 64 63 64 63
Paris 36 56 38 52 43
Rome* - - 68 60 66
Wales 70 66 71 58 69
the standard of
the other pupils
in his/her classor school.
French Com. 35 32 32 34 34
Madrid 41 43 40 46 37
Paris 41 38 38 36 42
Rome* - - 13 14 15
Wales 48 50 50 50 49
the quality of
teaching he/she
receives at
school.
French Com. 91 86 90 80 88
Madrid 85 81 86 76 83
Paris 91 80 91 76 86
Rome* - - 90 76 85
Wales 91 89 93 79 89
French Com. 88 84 86 84 86
Madrid 84 85 88 80 84
Paris 84 73 82 74 79
Rome* - - 45 43 43
Wales 88 81 86 74 84
the quality of
the support he/
she receives at
home.
D.3.2.
Table 1. Expectations towards the educational system.
Percentage of pupil’s agreement with the following sentences: “The progress of a pupil depends on ...”
Graphs 1 and 2. Pupil’s agreement with the importance of work and intelligence
for progress at school, by gender
Graphs 1 and 2 show the answers given by
girls and boys, in the five countries, about
the importance of effort and intelligence tobe successful at school. In all cases, girls
and boys give more importance to effort,
but girls insist on effort, more than boys do
and boys appreciate intelligence more than
girls do.
The progress of a pupil depends on the am ount of effort he/she put in
90
92
94
96
98
100
French Com. Madrid P a ris Rome Wales
Girls Boys
The progress of a pupil depends on its inte lli gen ce
40
50
60
70
French Com. Madrid P aris Rome Wales
Gir ls Boys
Table 1 shows the percentage of pupils who declare their agreement (very much agree / agree) with the importance they give to different components of
progress. The table shows the total answers given by students, plus answers from a different socio-economic position and from students who have low marks. Pupils belonging to a low status and pupils who have declared their results are judged as low are the most dissenting ones.
D
. E x t e r n a l R e s u l t s
C . I n t e r n a l R e s u l t s
B . P r o c e s s
A . C o n t e x t
81

8/2/2019 Equity in European Educational System
http://slidepdf.com/reader/full/equity-in-european-educational-system 82/151
Data provided by a survey among 13-14 year old pupils from five European countries: Belgium (French Community), Spain
(Madrid), France (Paris), Italy (Rome), and the United Kingdom (Wales), between November and December 2002. In the United Kingdom and Italian samples, there were relatively few students who stated that they were born outside the test
country (2.3 % for United Kingdom and 5.0 % for Italy). The results for this category should be treated with caution.
There was a relatively high proportion of students who report that they receive low marks in school in Spain (22.9 % of the sample) and a low number in the United Kingdom (2.7 % of the sample). It is important to remember that the students them-
selves were asked to provide this estimate; it was not based on external evaluation of the achievement. In order to determine the occupational category, the 10 categories coded in the questionnaire were amalgamated into 2. The
higher occupational status was used in this analysis.
* Data on social category are not available for Italy.
The purpose of this indicator is to discover students’ opinions concerning justice in the educationalsystem in accordance with the repercussions of their schooling on academic and social life. Studentsmaintain two very clear positions. At school, students have the same possibilities of achieving good
marks if they apply themselves with the same capacity and willpower. Outside school, in society,neither the knowledge acquired, nor the preparation received by the students, independent of their academic behaviour, can be considered acceptable. In the first case, students are insufficiently
prepared for subsequent development. In the second case, differences in preparation between thestudents considered as being good or poor persist despite the long period of schooling in which, in
theory, they have received the same training.
Students from Paris, Rome and Madrid are more critical than their Belgian (French Community) andBritish (Wales) counterparts. At least two out of every three consider that the difference in students’
preparation is important, as opposed to the more trivial opinions of the rest (Table 1).
This opinion, except for the case of the French community of Belgium, is maintained with greater
emphasis by males, though the differences are not especially important (Graph 3).
A greater separation arises when we take into account socio-economic conditions. In all the
countries, belonging to a low status is related to a stronger agreement with the proposition “At the endof the secondary school, the gap between the most and least able pupils is not very important”.However, this is not the case, when considering positively the possibilities of equal opportunities at
school (Table 1).
We might consider that the opinion of students having declared poor marks has a direct relation tothe reprobation towards the different quality of preparation at school, but this is not the case: their opinions are not significantly different from the rest. Students question the first proposition more than
the other propositions, with a less favourable opinion as to the equality of opportunities for obtaininghigher marks. For pupils with low marks, it is not evident that students achieve the same results atschool, although their determination and capacities are similar, despite the fact that students with good
marks consider more often this to be the case.
With the same ca-
pacities and will-
power, students have
the same possibilityof obtaining good
marks at school: this
is the opinion of
three out of every
four students sur-
veyed.
They believe that
school is a neutral
field that does not
penalize students in a
similar situation in
order to achieve aca-demic success.
To the question
whether the aca-
demic preparation
they receive is suffi-
cient for living in
today’s society, the
collected data are
less clear.
Sources:
European pilot survey about feelings of justice at school.
Questionnaire for pupils.
Students’ feelings towards justice
in the educational system
82 B DK D EL E F IRL I L NL A P FIN S UK CH NO

8/2/2019 Equity in European Educational System
http://slidepdf.com/reader/full/equity-in-european-educational-system 83/151
D.3.3.
Area/CityHighest social
group ** Lowest social
group ** Pupils with good
marks Pupils with low
marks
pupils who have
the same abilities
and the same
willingness to do
well at school have
the same chances
of success.
French Com. 79 82 82 64 80
Madrid 72 74 76 69 71
Paris 72 77 78 69 75
Rome * - - 78 72 77
Wales 84 87 88 68 85
all pupils leave
school with suffi-
cient skills to live in
a modern society.
French Com. 58 60 60 55 59
Madrid 42 43 39 39 42
Paris 32 44 34 29 36
Rome * - - 54 43 53
Wales 68 64 68 50 67at the end of the
secondary school,
the gap between
the most and the
least able pupils is
not very important.
French Com. 47 49 47 44 47
Madrid 28 36 25 37 32Paris 22 33 27 23 28
Rome * - - 29 39 33
Wales 37 40 35 47 40
All pupils
Pupils who have the sam e abilities an d the same willin gness to do
well at school have the same chances of success.
25
35
45
55
65
75
85
Fre nch Com. Ma drid P a ris Rome Wale s
Girls Bo ys
Table 1. Feeling of justice towards the educational system.
Percentage of pupil’s agreement with the following sentences: “Today in your country ...”
Graphs 1, 2, and 3 show the answers given
by girls and boys in the five participating countries about the possibilities of obtain-
ing equal opportunities, competencies, and
preparation for the working life.
Graphs 1, 2, and 3. Feeling towards justice in the educational system, by gender.
Pupil’s agreement with the following sentences: “Today in your country ...”
All pupils leave school with sufficient sk ills to li ve in a modern
society.
25
35
45
55
65
75
85
Fre nc h Com. Ma drid P a ris Rome Wa les
Girls Boys
At the e nd of the s econdary school, the gap between the m ost and
the l east able pupils i s not very important.
25
35
45
55
65
75
85
Fre nc h Com. Madrid P ar is Rome Wale s
Girls Bo ys
Table 1 shows the percentage of pupils who declare their agreement (very much agree / agree) with the feeling of justice towards the educational system.
The table shows the total answers given by students, plus answers from different socio economic position and from students who have good and low marks.
D
. E x t e r n a l R e s u l t s
C . I n t e r n a l R e s u l t s
B . P r o c e s s
A . C o n t e x t
83

8/2/2019 Equity in European Educational System
http://slidepdf.com/reader/full/equity-in-european-educational-system 84/151
To build this indicator, we use the following question from the World Values Survey: “On this list are various groups of people.
Could you please sort out any that you would not like to have as neighbours?” We choose the following variables to build on
the indicator: 51 (People with a criminal record), 52 (people of a different race), 53 (Political extremists), 54 (Heavy drinkers),
55 (Emotionally unstable people), 56 (Muslims), 57 (Immigrants/foreign workers), 58 (People who have AIDS), 59 (Drug ad-
dicts), 60 (Homosexuals). We assign the following values for each answer: 1 for “mentioned”; 0 for “not mentioned”. Wecould have a score for each EU citizen from 0 (tolerant) to 10 (intolerant).
Both these values are associated with educational levels by using the Gamma of Goodman and Kruskal. This association meas-
ure presents values between –1 and +1, and it is significant starting from 0.1.Three educational levels are retained: low (5/6 years of schooling), middle (8/9 years), high (more than 9 years).
This indicator measures the level of tolerance/intolerance for the citizens of European countries andits relation to education. This component of educational effectiveness is often neglected but is also arelevant aspect for equity, provided that it would be proved that under-education is frequently
associated with intolerant attitudes which weaken social cohesion. The source of data is the WorldValues Survey – Second Wave (1990), Third Wave (1997).
If the average level of tolerance for the European countries (2001 EU Member States) would be positively correlated with the indicators concerning the equity of their educational systems, it could besustained that equity in education has a favourable impact on social life, even if other data are
necessary to confirm this hypothesis.
Similarly, if the level of tolerance would be positively correlated with the level of education, it could be asserted that inequalities in education are in favour of disadvantaged groups as internal and external
minorities, according to the Rawlsian principle of difference.
The average attitudes towards internal and external groups are shown in Table 1, which includes all
the EU countries plus Switzerland and Norway.
A clear association between the level of educational equity (as measured by indicators used in thisreport) does not appear, likely because many other variables influence this relationship. Generally, the
level of intolerance appears to be low towards both considered targets.
To measure the relationship between education and tolerance/intolerance attitudes, we use anassociation index (Gamma of Goodman and Kruskal). This is done for all EU countries participating
in the World Value Survey that include the level of education variable in their questionnaire, and for
Norway and Switzerland.
The association found between tolerance toward internal groups and educational level is not veryclear (see Table 2). Germany (old and new Länder ) and Norway present a low level of association:highly educated people are a little bit more tolerant toward the internal groups. It is only in Spain that
the educational level seems to have a significant impact on citizens' attitudes. It is likely that theinternal categories considered here are perceived as a concrete risk both by lower and by highly
educated European citizens.
The relationship to education is more significant and general when foreign groups are concerned:
here the higher the educational level, the higher the tolerance (see Table 3). All the countries analysed,except Finland, present a very clear association between high educational level and tolerant attitudes
toward foreign people.
From this evidence, it could be concluded that education hampers intolerance only when it results
from a prejudice rather than from a concrete risk.
The association
found between toler-
ance toward internal
groups and educa-tional level is not
very clear.
The relationship to
education is more
significant when for-
eign groups are con-
cerned: here the
higher the educa-
tional level, the
higher the tolerance.
Sources:
World Values Survey – Second
Wave (1990).World Values Survey – Third
Wave (1997).
Tolerance/intolerance
84 B DK D EL E F IRL I L NL A P FIN S UK CH NO

8/2/2019 Equity in European Educational System
http://slidepdf.com/reader/full/equity-in-european-educational-system 85/151
D.3.4.
Table 1. Tolerance/intolerance patterns toward internal groups
Table 2. Association between tolerance/intolerance patterns toward internal groups and educational level(Gamma of Goodman and Kruskal)
GERMANYold Länder
GERMANYnew Länder
SPAIN FINLAND SWEDEN SWITZERLAND NORWAY
γ 0.135 0.121 0.202 0.085 0.086 0.087 0.136
Table 3. Association between tolerance/intolerance patterns toward foreign groups and educational level(Gamma of Goodman and Kruskal)
GERMANYold Länder
GERMANYnew Länder
SPAIN FINLAND SWEDEN SWITZERLAND NORWAY
γ 0.305 0.225 0.328 0.047 0.339 0.310 0.226
For Tables 2 and 3, the higher the γ , the higher the association between tolerance and educational level. The association is not significant between –0.1 and
0.1.
D
. E x t e r n a l R e s u l t s
C . I n t e r n a l R e s u l t s
B . P r o c e s s
A . C o n t e x t
85
CountryTowards internal groups Towards foreign groups
Very
intolerant Intolerant Tolerant Very tolerant
Very
intolerant Intolerant Tolerant Very tolerant
BELGIUM 8.9 19.6 35.7 35.9 10.1 9.1 15.3 65.5
DENMARK 2.3 9.3 33.3 55.0 5.0 4.1 10.7 80.2
WEST GERMANY 2.2 14.7 44.5 38.6 0.8 2.2 8.9 88.1
EAST GERMANY 3.3 17.1 50.6 28.9 1.9 3.7 16.4 78.1
SPAIN 8.8 18.1 34.1 39.1 3.5 3.2 10.4 82.9
FRANCE 4.9 15.8 34.0 45.3 6.2 5.4 10.3 78.1
IRELAND 10.7 23.0 38.7 27.6 2.1 3.5 11.1 83.3
NORTH IRELAND 10.9 26.0 31.9 31.3 3.3 5.6 7.9 83.2
ITALY 17.4 23.5 30.7 28.3 6.7 4.7 10.3 78.3
NETHERLANDS 7.3 19.2 47.2 26.4 4.0 4.1 10.0 81.8
AUSTRIA 13.2 24.5 35.6 26.7 5.1 5.3 16.4 73.1
PORTUGAL 24.9 26.8 24.6 23.8 5.5 8.4 13.2 72.9
FINLAND 10.2 22.8 43.7 23.3 7.8 6.6 28.5 57.1
SWEDEN 4.2 16.1 51.7 28.0 2.4 1.7 10.1 85.8
UNITED KINGDOM 11.3 22.6 36.8 29.3 5.2 4.7 10.3 79.8
SWITZERLAND 4.3 15.3 42.8 37.5 5.1 3.4 14.6 76.9
NORWAY 8.6 21.3 50.9 19.1 6.5 4.0 14.6 75.0

8/2/2019 Equity in European Educational System
http://slidepdf.com/reader/full/equity-in-european-educational-system 86/151
The following question from the World Values Survey is used here: “Now I am going to read off a list of voluntary organiza-
tions; for each one, could you tell me whether you are an active member, an inactive member or not a member of that type of
organization?”. The following items were retained: 28 (Church or religious organization), 29 (Sport or recreation organiza-
tion), 30 (Art, music or educational organization), 31 (Labour union), 32 (Political party), 33 (Environmental organization), 34(Professional association), 35 (Charitable organization), 36 (Any other voluntary organization). For each item, there are three
possible answers: « active member », « inactive member », and « non member » .
Two indexes are built:1) Participation in economic and political organizations encompass organizations which have some, though sometimes
limited, link with the public debate in liberal-democratic countries: labour union, political party, environmental
organizations, professional associations;
2) Participation in other types of associations: church or religious organizations, sport, recreation, art, music or edu-
cation organizations, charitable and other kind of voluntary organization. Both these indexes are associated with different educational levels by using the Gamma of Goodman and Kruskal. This associa-
tion measure presents values between –1 and +1, and it is significant starting from 0.1.Three educational levels are retained: low (5/6 years of schooling), middle (8/9 years), high (more than 9 years).
This indicator measures the level of socio-political participation through membership in differentkinds of associations for citizens of European countries. This component of educational effectivenessis often neglected but is also a relevant aspect for equity, considering that if low education werefrequently associated with a lack of participation this would weaken the functioning of democracy and
of social capital formation. Furthermore, it can be sustained that in the countries where there is a clear correlation between educational level and socio-political participation, educational inequalities should be assessed more negatively in terms of equity.
The source of data is the World Values Survey – Second Wave (1990), Third Wave (1997). Two
domains of participation are distinguished here: les organisations économiques et politiques d’une part, et les autres types d’organisation d’autres part –par exemple, les organisations bénévoles,
religieuses et de loisirs (voir ci-dessous).
If the average level of socio-political participation for the European countries (2001 EU Member States) would be positively correlated with the indicators concerning the equity of their educationalsystems, ,it could be sustained that equity in education has a favourable impact on social life.
The average of the participation in economic and political organizations, and in other types of organizations are shown in the Table 1, which includes all the EU countries plus Switzerland and
Norway.A clear association between the level of educational equity (as measured by indicators used in this
report) does not appear, likely because many other variables influence this relationship.
The index of participation in economic and political association is generally very low (Table 1).Participation in other kinds of organizations (voluntary, religious, recreational, etc) results are a littlehigher (Table 1).
To measure the relationship between education and participation, an association index is used
(Gamma of Goodman and Kruskal). This is done for all EU countries participating in the World ValueSurvey that included the level of education variable in their questionnaire, and Norway andSwitzerland.
With regard to the participation in economic and political organizations (Table 2), the associationwith educational level is proven for Spain, Sweden, Finland, and Norway. On the contrary, in
Germany (new Länder in particular) and Switzerland an inverted association appears.With regard to the other types of organization (Table 3), the association is clearer and more linear.
For all countries (except Finland that doesn’t present a significant association) the higher the educationlevel, the higher the participation.
With regard to the
p a r t i c i p a t i o n i n
economic and political
organizations, the
association with theeducational level is
proven for Spain,
Sweden, Finland, and
Norway.
On the contrary, in
Germany (new Länder
in particular) and
S w i t z e r l a n d a n
inverted association
appears.
Sources:
World Values Survey – Second
Wave (1990).World Values Survey – Third
Wave (1997).
Socio-political participation
86 B DK D EL E F IRL I L NL A P FIN S UK CH NO

8/2/2019 Equity in European Educational System
http://slidepdf.com/reader/full/equity-in-european-educational-system 87/151
D.3.5.
Table 1. Index of participation in economic and political organizations
Table 2. Association between participation in economic and political organizations and educational level(Gamma of Goodman and Kruskal)
GERMANYold Länder
GERMANYnew Länder
SPAIN FINLAND SWEDEN SWITZERLAND NORWAY
γ -0.036 -0.314 0.412 0.490 0.427 -0.362 0.346
Table 3. Association between participation in other types of organizations and educational level(Gamma of Goodman and Kruskal)
GERMANY old
Länder GERMANY
new Länder SPAIN FINLAND SWEDEN SWITZERLAND NORWAY
γ 0.166 0.333 0.343 -0.091 0.291 0.193 0.281
For Tables 2 and 3, the higher the γ , the higher the association between socio-political participation and educational level. The association is not signifi-
cant between –0.1 and 0.1.
D
. E x t e r n a l R e s u l t s
C . I n t e r n a l R e s u l t s
B . P r o c e s s
A . C o n t e x t
87
CountryIn economic and political organizations In other types of organizations
Active Non active Not member Active Non active Not member
BELGIUM 2.0 6.3 91.7 5.6 7.2 87.1
DENMARK 2.2 17.9 80.0 4.8 9.0 86.2
WEST GERMANY 4.4 9.0 86.6 16.9 15.3 67.8
EAST GERMANY 4.1 7.1 88.8 10.5 9.8 79.7
SPAIN 3.0 6.9 90.2 9.3 10.6 80.1
FRANCE 2.1 2.1 95.7 5.0 4.1 90.9
IRELAND 1.3 3.8 94.9 5.3 6.9 87.8
NORTH IRELAND 1.2 4.4 94.4 5.1 8.8 86.1
ITALY 2.2 2.5 95.2 4.2 2.4 93.4
NETHERLANDS 2.1 14.9 83.0 8.4 20.6 71.0AUSTRIA 2.1 7.9 90.0 4.6 5.9 89.5
PORTUGAL 1.4 1.9 96.8 3.8 3.2 92.9
FINLAND 2.4 17.1 80.5 8.7 25.4 65.9
SWEDEN 6.3 20.6 73.1 14.6 16.3 69.1
UNITED KINGDOM 1.5 7.2 91.2 2.7 9.2 88.2
SWITZERLAND 7.2 12.2 80.6 17.0 15.0 67.9
NORWAY 7.1 16.6 76.3 14.1 16.4 69.6
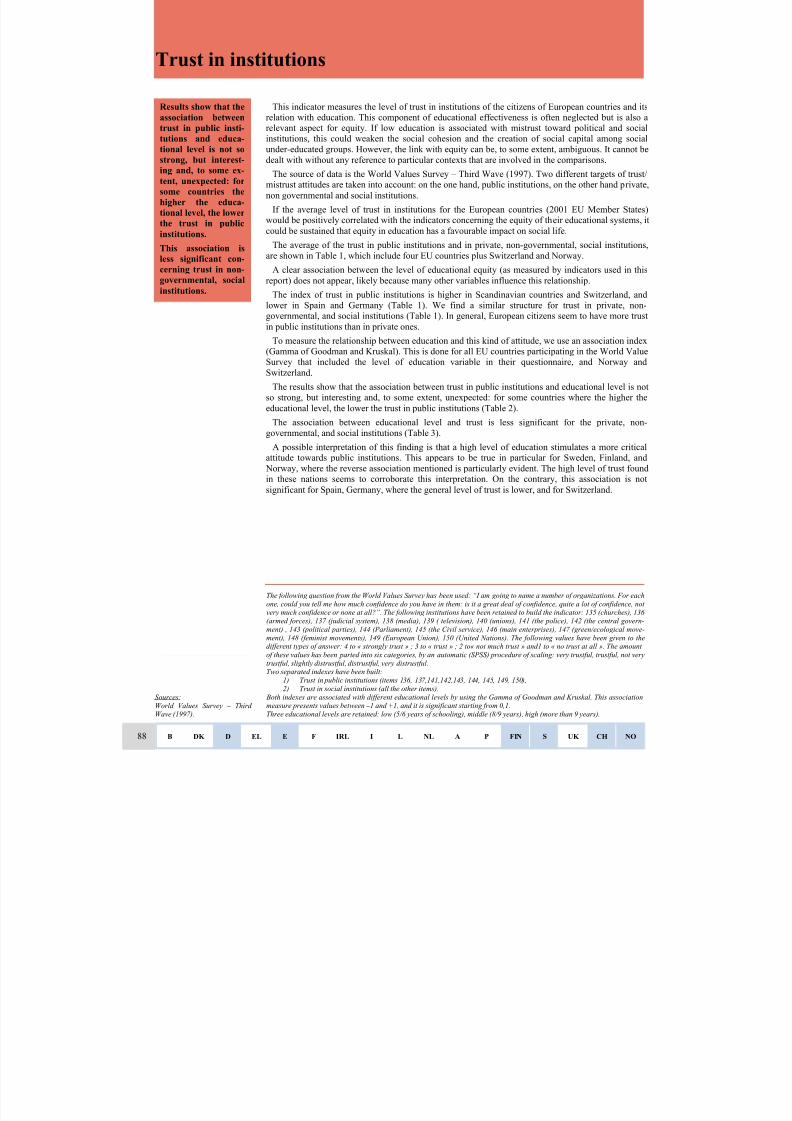
8/2/2019 Equity in European Educational System
http://slidepdf.com/reader/full/equity-in-european-educational-system 88/151
The following question from the World Values Survey has been used: “I am going to name a number of organizations. For each
one, could you tell me how much confidence do you have in them: is it a great deal of confidence, quite a lot of confidence, not very much confidence or none at all?”. The following institutions have been retained to build the indicator: 135 (churches), 136
(armed forces), 137 (judicial system), 138 (media), 139 ( television), 140 (unions), 141 (the police), 142 (the central govern-
ment) , 143 (political parties), 144 (Parliament), 145 (the Civil service), 146 (main enterprises), 147 (green/ecological move-
ment), 148 (feminist movements), 149 (European Union), 150 (United Nations). The following values have been given to thedifferent types of answer: 4 to « strongly trust » ; 3 to « trust » ; 2 to« not much trust » and1 to « no trust at all ». The amount
of these values has been parted into six categories, by an automatic (SPSS) procedure of scaling: very trustful, trustful, not very
trustful, slightly distrustful, distrustful, very distrustful.Two separated indexes have been built:
1) Trust in public institutions (items 136, 137,141,142,143, 144, 145, 149, 150);2) Trust in social institutions (all the other items).
Both indexes are associated with different educational levels by using the Gamma of Goodman and Kruskal. This associationmeasure presents values between –1 and +1, and it is significant starting from 0,1.
Three educational levels are retained: low (5/6 years of schooling), middle (8/9 years), high (more than 9 years).
This indicator measures the level of trust in institutions of the citizens of European countries and itsrelation with education. This component of educational effectiveness is often neglected but is also arelevant aspect for equity. If low education is associated with mistrust toward political and social
institutions, this could weaken the social cohesion and the creation of social capital among socialunder-educated groups. However, the link with equity can be, to some extent, ambiguous. It cannot be
dealt with without any reference to particular contexts that are involved in the comparisons.
The source of data is the World Values Survey – Third Wave (1997). Two different targets of trust/mistrust attitudes are taken into account: on the one hand, public institutions, on the other hand private,
non governmental and social institutions.
If the average level of trust in institutions for the European countries (2001 EU Member States)would be positively correlated with the indicators concerning the equity of their educational systems, it
could be sustained that equity in education has a favourable impact on social life.
The average of the trust in public institutions and in private, non-governmental, social institutions,
are shown in Table 1, which include four EU countries plus Switzerland and Norway.
A clear association between the level of educational equity (as measured by indicators used in thisreport) does not appear, likely because many other variables influence this relationship.
The index of trust in public institutions is higher in Scandinavian countries and Switzerland, andlower in Spain and Germany (Table 1). We find a similar structure for trust in private, non-governmental, and social institutions (Table 1). In general, European citizens seem to have more trust
in public institutions than in private ones.
To measure the relationship between education and this kind of attitude, we use an association index(Gamma of Goodman and Kruskal). This is done for all EU countries participating in the World ValueSurvey that included the level of education variable in their questionnaire, and Norway and
Switzerland.
The results show that the association between trust in public institutions and educational level is notso strong, but interesting and, to some extent, unexpected: for some countries where the higher the
educational level, the lower the trust in public institutions (Table 2).The association between educational level and trust is less significant for the private, non-
governmental, and social institutions (Table 3).
A possible interpretation of this finding is that a high level of education stimulates a more criticalattitude towards public institutions. This appears to be true in particular for Sweden, Finland, and
Norway, where the reverse association mentioned is particularly evident. The high level of trust foundin these nations seems to corroborate this interpretation. On the contrary, this association is not
significant for Spain, Germany, where the general level of trust is lower, and for Switzerland.
Results show that the
association between
trust in public insti-
tutions and educa-tional level is not so
strong, but interest-
ing and, to some ex-
tent, unexpected: for
some countries the
higher the educa-
tional level, the lower
the trust in public
institutions.
This association is
less significant con-
cerning trust in non-governmental, social
institutions.
Sources:
World Values Survey – Third Wave (1997).
Trust in institutions
88 B DK D EL E F IRL I L NL A P FIN S UK CH NO

8/2/2019 Equity in European Educational System
http://slidepdf.com/reader/full/equity-in-european-educational-system 89/151
D.3.6.
Table 1. Index of trust
Table 2. Association between index of trust in public institutions and educational level(Gamma of Goodman and Kruskal)
GERMANYold Länder
GERMANYnew Länder
SPAIN FINLAND SWEDEN SWITZERLAND NORWAY
γ 0.056 -0.013 0.021 -0.288 -0.156 -0.053 -0.262
Table 3. Association between index of trust in private, non-governmental, social institutions and educational level(Gamma of Goodman and Kruskal)
GERMANYold Länder
GERMANYnew Länder
SPAIN FINLAND SWEDEN SWITZERLAND NORWAY
γ 0.023 0.001 -0.081 -0.098 0.011 -0.063 -0.071
For Tables 2 and 3, the higher the γ , the higher the association between trust in institutions and educational level. The association is not significant between
–0.1 and 0.1.
D . E x t e r n a l R e s u l t s
C . I n t e r n a l R e s u
l t s
B . P r o c e
s s
A . C o n t e x t
89
In public institutions In private, non governmental and social institutions
Very
confident Confident
Not very
confident
Slightly
distrustful
Distrust-
ful
Very
distrustful
Very
confident Confident
Not very
confident
Slightly
distrustful
Distrust-
ful
Very dis-
trustful
GERMANYold Länder
6.5 18.8 31.7 21.7 14.8 6.5 0.9 13.0 18.8 24.9 36.3 6.2
GERMANYnew Länder
3.0 9.8 24.7 31.0 23.4 8.1 1.4 5.1 17.8 28.0 33.5 14.2
SPAIN 8..3 15.9 23.7 24.1 16.8 11.2 5.7 13.3 20.7 20.3 23.9 16.0
FINLAND 10.7 21.6 37.5 16.7 9.9 3.5 2.8 10.9 27.2 24.4 24.5 10.1
SWEDEN 11.3 24.4 25.4 18.6 13.5 6.8 4.8 15.4 27.2 22.3 18.2 12.2
SWITZERLAND 10.9 25.8 19.9 19.6 13.5 10.3 1.3 7.3 15.5 20.5 29.8 25.5
NORWAY 17.8 37.7 27.6 12.2 3.4 1.3 4.2 19.1 32.7 25.3 14.7 4.1
Country

8/2/2019 Equity in European Educational System
http://slidepdf.com/reader/full/equity-in-european-educational-system 90/151
8/2/2019 Equity in European Educational System
http://slidepdf.com/reader/full/equity-in-european-educational-system 91/151
PART 3
Equity in European
Educational Systems :
An interpretation of the 29 indicators

8/2/2019 Equity in European Educational System
http://slidepdf.com/reader/full/equity-in-european-educational-system 92/151

8/2/2019 Equity in European Educational System
http://slidepdf.com/reader/full/equity-in-european-educational-system 93/151
93
Introduction
In Part 1 of this report we present some the key underlying ideas about the nature of justice in
education, and in Part 2 we present 29 indicators of equity in education systems. We discuss
each of these indicators in isolation, making comparisons between the countries involved.
However there are several other ways that the indicators can be used, as it is illustrated in Part
3.
The first approach consists of using the variation between the presented countries to
determine some global questions about the existing links between a particular type of
inequalities and such or such variable. This is the approach adopted by Duru-Bellat, Mons and
Suchaut (2003), on the basis of an analysis of the PISA 2000 database. These authors, as
Crahay (1996, 2000), point out that the grade retention practice as well as the existence of
various education tracks are associated with students’ lower average achievements, with a lesssuccessful student elite, with a broader school achievement inequality between different social
categories and with the presence of more weak students within any system. It seems that
grade retention and track organization have no link with one approach to equity (equality and
discrepancies between individuals), but are harmful to equity defined according to two other
aspects (equality between categories and a proportion of students situated below a minimum
threshold). Duru-Bellat, Mons and Suchaut also point out the presence of a weak positive
relationship between a country’s average school results and the weak influence of the social
background on these results. Therefore, equality of opportunities (weak influence of the social
background) and efficiency (average school results) can be complementary rather than
contradictory objectives.
The second possible approach, which has been adopted here, consists in making comparisons
between countries, in terms of equity. This is a matter of forming a judgement on the equity
of the various educational systems, on the basis of the analysis of some inequalities measured
by the indicators. This comparison can be made on the basis of one of the theories of justice,
as a possible system of reference of what is considered as “just”.
According to Sen’s approach, for instance, justice can be measured mainly through the
proportion of students that are situated below a given threshold, with some indices inspired by
his own research works (C.1.2.). According to this author, there is no external or internal
factor which can counterbalance the injustice of the existence of such a population. According
to his Theory of Responsibility, it should be checked that results and career inequalitiesoriginate in differences of will, efforts of the pupils, and not in inequalities of contexts or
process. The indicators built here do not allow us to make a clear distinction between as to
cause.
Rawls’s approach is more complex to illustrate. For Rawls, the just equality of opportunities
has priority over the principle of difference: the just equality of opportunities should first be
checked, then we should make sure that the remaining inequalities serve the interest of the
most disadvantaged, through their tribute to the economic growth, social transfert or more
directly. It would be possible to consider that countries are more or less equitable according to
the equality of opportunities, then within a group of countries that would be similar in this
aspect, to consider that the most equitable are those where the contribution by the mosteducated to the expectations of the most disadvantaged is the most important.

8/2/2019 Equity in European Educational System
http://slidepdf.com/reader/full/equity-in-european-educational-system 94/151
94
While the approach adopted below is inspired by Rawls, it is more syncretic in the sense that
inequalities affecting internal results (C.1.1. to C.3.1.) as well as school processes (B.1.1.to
B.2.4.) reveal inequity in the educational system, which is all the more important because:
1. their consequences on the future life of pupils are significant (external results);
2. they are due to the education system (process) rather than social inequalitiesthemselves (economic, social and cultural context);
3. they are used to a lesser extent to help the disadvantaged, they seriously affect the
judgement that citizens or users make about the fairness of the education system,
and the result is a loss of trust in institutions and lower socio-political participation.
This line of reasoning may be put forward for each of the three criteria of fairness, i.e. the
three columns of the framework: inequalities between individuals; inequality between groups;
and, individuals beneath the threshold of equity.
In principle, some of the questions are a better match for one of the fairness criteria than theothers are. So that, broken down according to these criteria, it appears equally necessary for
education research in general, and for the public authorities, to be able to answer the
following four major questions as comprehensively as possible, in particular via international
comparisons:
1. What is the importance of inequalities within Europe’s education systems? Arethere differences – between countries and within them – from the viewpoint of their
degree of unfairness (particularly via the distribution of the system’s results)?
2. What benefits are connected with education in the various European countries and
what is the importance of social and economic (contextual) inequalities connected with the level of education? Is the influence of education in certain fields, such as
inter-generational social mobility or economic and social aspects of citizens’ lives, substantial?
3. Can European education systems have a role in amplifying or reducing contextual
inequalities? If this is the case, are the education systems themselves responsible for
the amplification or the reduction of certain inequalities?
4. To what extent do educational inequalities benefit the most disadvantaged populations, and encourage phenomena of upward social mobility, since it appears
that education can help the most disadvantaged citizens, particularly by giving them
educational resources that can be used on a daily basis, and putting the skills of better-educated citizens at their service? What is currently the importance of these
mechanisms?

8/2/2019 Equity in European Educational System
http://slidepdf.com/reader/full/equity-in-european-educational-system 95/151
95
1. The importance of skill and school career
inequalities within the education systems of
the European UnionSome of the indicators are about skill inequalities (C.1.1. and C.1.2.), some are about civic
knowledge inequalities (C.2.1.) and some others are about school career inequalities
(B.1.1.and C.3.1.). The following analysis only concerns skills and school careers. Duru-
Bellat, Mons and Suchaut (2003), for instance, showed that skill inequalities explain only half
of the school career inequalities.
The inequalities that affect skills and school careers are measured according to different
approaches of the set of indicators:
- Inequalities between individuals, and discrepancies in the results, i.e. the
difference between lowest and best pupils. Ideally, this approach would require a
measurement of the skill discrepancy between those who left the earlier and later the
educational system in terms of some skills, such as reading, written and spoken
expression, and mathematics and sciences. Such data are unavailable, thus the
indicators concern the discrepancies in results at the end of compulsory school, -
which can be considered as an estimation by proxy of the disparities in the mastery of
basic skills in reading, mathematics and science at the end of school -, the differences
of length of the school careers and the proportion of pupils who leave school at the
modal level of learning.
• Inequalities between groups and the influence of the membership category on the
skills or the school careers. Inequalities between groups are observed. The
importance and the systematic nature of these differences – it’s characteristics from
which individual can not escape : social origin, gender and nationality – limit strongly
the significance of the interpretation of differences in terms of personal liability.
• Equality of access to a minimum threshold of results, as it is supported by some
authors along the same line as Sen and his concept of “capabilities”. This approach is
quite similar to those requiring us to take into account extreme situations, by the
measurement of the discrepancies between the minority of individuals below a lowest
threshold and the rest of the population. Technically, in education, this leads us to
adopt an index from Sen (1976), which would take into account both the importance
of the disadvantaged subjects and the severity of that disadvantage. This index, first
built like an index of poverty, when applied to school results (C.1.2.), has the
advantage of capturing, both the percentage of pupils who do not reach a minimum
result threshold, and the average distance that keeps them from that threshold and the
variation in the results of those pupils. It is thus able to point out the extreme weakness
situations of some pupils.
From concept to measurement
We are taking an interest in cognitive skills, via analyses relating to the PISA results (OECD,
2002); school careers are considered through durations of schooling and qualifications (Labor forces survey).

8/2/2019 Equity in European Educational System
http://slidepdf.com/reader/full/equity-in-european-educational-system 96/151
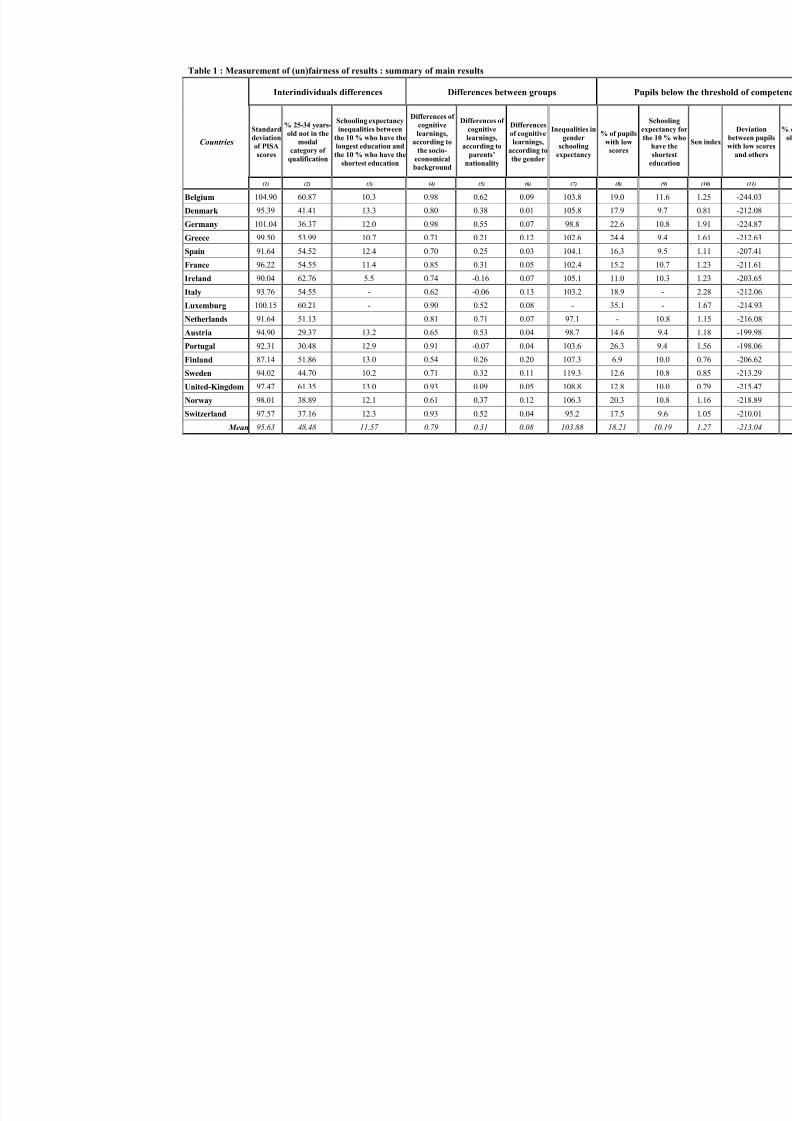
8/2/2019 Equity in European Educational System
http://slidepdf.com/reader/full/equity-in-european-educational-system 97/151
Table 1 : Measurement of (un)fairness of results : summary of main results
Interindividuals differences Differences between groups Pupils bel
Countries
Standard
deviationof PISA
scores
% 25-34 years-
old not in themodal
category of
qualification
Schooling expectancy
inequalities between
the 10 % who have thelongest education and
the 10 % who have the
shortest education
Differences of
cognitive
learnings,according to
the socio-
economical
background
Differences of
cognitive
learnings,according to
parents’
nationality
Differences
of cognitivelearnings,
according to
the gender
Inequalities in
genderschooling
expectancy
% of pupilswith low
scores
Schooli
expectanc
the 10 %have th
shorte
educati
(1) (2) (3) (4) (5) (6) (7) (8) (9)
Belgium 104.90 60.87 10.3 0.98 0.62 0.09 103.8 19.0 11.6
Denmark 95.39 41.41 13.3 0.80 0.38 0.01 105.8 17.9 9.7
Germany 101.04 36.37 12.0 0.98 0.55 0.07 98.8 22.6 10.8
Greece 99.50 53.99 10.7 0.71 0.21 0.12 102.6 24.4 9.4
Spain 91.64 54.52 12.4 0.70 0.25 0.03 104.1 16.3 9.5
France 96.22 54.55 11.4 0.85 0.31 0.05 102.4 15.2 10.7
Ireland 90.04 62.76 5.5 0.74 -0.16 0.07 105.1 11.0 10.3
Italy 93.76 54.55 - 0.62 -0.06 0.13 103.2 18.9 -
Luxemburg 100.15 60.21 - 0.90 0.52 0.08 - 35.1 -
Netherlands 91.64 51.13 0.81 0.71 0.07 97.1 - 10.8
Austria 94.90 29.37 13.2 0.65 0.53 0.04 98.7 14.6 9.4
Portugal 92.31 30.48 12.9 0.91 -0.07 0.04 103.6 26.3 9.4
Finland 87.14 51.86 13.0 0.54 0.26 0.20 107.3 6.9 10.0
Sweden 94.02 44.70 10.2 0.71 0.32 0.11 119.3 12.6 10.8
United-Kingdom 97.47 61.35 13.0 0.93 0.09 0.05 108.8 12.8 10.0
Norway 98.01 38.89 12.1 0.61 0.37 0.12 106.3 20.3 10.8
Switzerland 97.57 37.16 12.3 0.93 0.52 0.04 95.2 17.5 9.6
Mean 95.63 48.48 11.57 0.79 0.31 0.08 103.88 18.21 10.19

8/2/2019 Equity in European Educational System
http://slidepdf.com/reader/full/equity-in-european-educational-system 98/151

8/2/2019 Equity in European Educational System
http://slidepdf.com/reader/full/equity-in-european-educational-system 99/151
99
Column 8 shows, for each country, the proportion of pupils whose PISA score is below the
literacy level 2
A question emerges of the appropriateness of reference to an international skills threshold as
opposed to a strategy that consists of using a “local” threshold specific to each country/region:
for example, the 1st
decile of the distribution within each country. Is a reference thattranscends the frontiers of different systems legitimate? Is is possible to create a scale for
measuring skills that is common to a very diverse group of education systems? The answer is
tentatively yes, as exemplified by the PISA project. It appears difficult, once we are working
on the basis of PISA, to completely avoid the idea of an international reference framework.
That being said, we could work system by system, as we do for the majority of other
indicators. As we are dealing with skills thresholds, such an approach would be consistent
with the idea that the indispensable minimum skills for integration into society does not
correspond to a level but rather to a ratio (a certain deviation) between individuals who have
to live together. We believe this approach is relevant. We have not adopted it in its entirety
here, because we refer to it implicitly via all of the other indicators that we have calculated inthis section on the results. However, it is necessary to be aware that this perspective, which
we readily qualify as relativist leads us to consider that an individual with a given score may
be threatened with social exclusion if he lives in Finland (the country with the best level of
scores in PISA 2000) and a member of the “educated” class if he lives in Brazil (the country
with the lowest average score in PISA 2000). To conclude on this point, we should indicate
that this discussion on the right way to grasp the inequalities of the scores is very similar to
that which, for some years, has been the subject of argument between advocates of an
“absolute” or “objective” approach to poverty (whether or not people own a series of goods)
and defenders of the relative character of the phenomenon.
When we analyse the table 1, it appears that the proportions of students below theinternational threshold (whose poor performance in the reading test probably compromises
their ability to integrate into society) are extremely variable according to the country, since
the proportion oscillates between 7 % in Finland, 26 % Portugal to 35 % in Luxemburg
(column 8).
The Sen index (column 10), which also focuses on reading and an international definition of
the minimum threshold necessary for social integration, largely confirms this analysis.
The third index derived from PISA (column 11), founded on a national measurement of the
minimum threshold and relating to mathematics and science, gives an idea of the deviation in
terms of gross score between individuals below the threshold and the rest of the population.Since it is around 200 points, it appears quite simply gigantic, being equal to approximately
two standard deviations.
Schools careers
Table 1 allows the analyse of the schools careers too. The columns 2, 3, 7 , 9 and 12 present
data related to qualifications et schooling durations.
The EUO database (UNESCO, European Union, OECD) provides information about the level
of qualifications per age category, and served to build the second column of Table 1. That
second column shows inequality in the distribution of another “asset” produced by educationsystems: qualifications. In principle, some of them refer to a state of knowledge and skills.

8/2/2019 Equity in European Educational System
http://slidepdf.com/reader/full/equity-in-european-educational-system 100/151

8/2/2019 Equity in European Educational System
http://slidepdf.com/reader/full/equity-in-european-educational-system 101/151
Table 2: Measurements of (un)equity and analysis of results: summary in terms of ranking
Interindividuals differences Differences between groups Pupils b
CountriesStandarddeviation
of PISA
scores
% 25-34
years-oldnot in the
modal
category of
qualification
Schooling expectancy
inequalities between the 10% who have the longest
education and the 10 %
who have the shortest
education
Differences of
cognitivelearnings,
according to the
socio-economical
background
Differences of
cognitivelearnings,
according to
parents’
nationality
Differences
of cognitivelearnings,
according to
the gender
Inequalities ingender
schooling
expectancy
% of pupilswith low
scores
Schoexpectan
10 % wh
shortest
(1) (2) (3) (4) (5) (6) (7) (8) (
Finland 1 9 12 1 7 17 3 1
Sweden 7 7 2 7 9 13
Ireland 2 17 1 8 4 9 6 2
Denmark 9 6 15 9 11 1 5 9 1
Spain 3 11 10 5 6 2 7 7 1
Norway 13 5 8 2 10 15 4 12 Austria 8 1 14 4 14 5 14 5 1
France 10 12 6 11 8 6 12 6
Switzerland 12 4 9 15 12 3 16 8 1
Portugal 5 2 11 2 4 9 15 1
United-Kingdom 11 16 12 14 3 7 2 4
Italy 6 13 - 3 1 16 10 10
Netherlands 4 8 10 17 10 15 -
Greece 14 10 4 6 5 14 11 14 1
Germany 16 3 7 16 15 13
Belgium 17 15 3 17 16 12 8 11 Luxemburg 15 14 - 12 13 11 - 16

8/2/2019 Equity in European Educational System
http://slidepdf.com/reader/full/equity-in-european-educational-system 102/151

8/2/2019 Equity in European Educational System
http://slidepdf.com/reader/full/equity-in-european-educational-system 103/151
103
Figure 1 presents a first synthesis map reflecting the ranking of the countries, wich is related
to the results of education. This map is based on the ranking shown in table 2. It only
concerns EU countries (EU-15, 2001) for which data were available. We did not take care of
the ranking of Norway and Switzerland to build this map. These two countries are not
presented in colour.
The countries belonging to the group of the most equitable countries are the countries which
are on the first four ranks; the countries considered as the less equitable countries are the one
situated on the last four ranks. However, a rank could be occupied by several countries. If it
was the case, the number of equitable or less equitable countries could be higher than 4.
The more equitable countries – Finland, Sweden, Ireland, Denmark and Spain – are colored in
yellow; the less equitable countries – Luxemburg, Belgium, Germany, and Greece – are
colored in pink. The other countries are in green.
Figure 1: Importance of results inequalities (cognitive skills and career)

8/2/2019 Equity in European Educational System
http://slidepdf.com/reader/full/equity-in-european-educational-system 104/151
104
2. What advantages are tied to education in the
European Union Member States?
Even those commentators who are most resistant to an economic approach to education must
consider the possibility that the main merit of education is its effects, which are felt for a
lifetime: reading and expressing oneself more easily, being more cultivated, thinking more
independently, being more capable of inventing, etc. However, it is difficult to estimate
precisely the importance of the advantages tied to increasing skills acquired through education
(Demeuse, 2002) and which constitute part of what economists refer to as “human capital”.
Education is nevertheless an “intermediate product” and since educating people is a cost, it
constitutes an investment. Parents and young people themselves invest in education, in the
sense that they agree to spend on their education, or at least, even if education is free, lose out
on an “opportunity cost” – i.e. the value that they would have earned if they had occupied
their time by working instead of studying – in the hope of benefits accruing from a successfulschool career, higher, more numerous and more complex skills (Paul, 2005). Besides private
expenditure, there is also public investment in education (provision of infrastructure, payment
of teachers’ salaries, miscellaneous benefits, scholarships, etc.) (Bayenet et Demeulmester,
2005).
Some of the benefits of education can be directly converted into financial terms – higher
salary, lower risk of being unemployed – while others have a "non-market” value: cultural or
civic benefits, as well as belonging to a higher social category, a more prestigious job,
involving less risk of accidents, better health, the opportunity to give a better education to
one’s own children, etc.
Many studies have been carried out by economists on these effects, whether they are market
(OECD 2002b) or non-market effects (Mac Mahon, 1997). Their purpose is to improve the
calculation of the return from education.
Educational assets do not have the same value everywhere
The advantages associated with education are also important for measuring equity, for a
simple reason. If we share identical assets between individuals, whether the distribution is fair
or not does not depend on the value of the assets, but only on the equity of the sharing
process. This is confirmed by comparing the allocation received by each person with a
criterion of equity. On the other hand, many commentators will agree that the unfairness is of
the same nature, but of greater or lesser seriousness: it is the case if diamonds are shared out
less fairly than lumps of coal, or water in a desert rather than in a particularly wet region. An
injustice comparable to another from the sole viewpoint of equity will have more or less
important repercussions on the beneficiaries, depending on the nature and the value of the
assets in question.
If, in a given country, salaries hardly depend on a person’s school career, then an unfair
distribution of education would be less serious than if they were heavily dependent on it.
Likewise, if a country teaches young people to read by methods that do not give them an
appetite for reading, so that even those who are capable of reading well at school give up
reading as soon as the school no longer obliges them to read, and thus lose their reading skills,
unfair teaching of reading skills would not be so serious there (i.e. the problem would be one

8/2/2019 Equity in European Educational System
http://slidepdf.com/reader/full/equity-in-european-educational-system 105/151

8/2/2019 Equity in European Educational System
http://slidepdf.com/reader/full/equity-in-european-educational-system 106/151

8/2/2019 Equity in European Educational System
http://slidepdf.com/reader/full/equity-in-european-educational-system 107/151
107
Economic advantages
Private return from a tertiary education (1 and 2)4 Private return from an additional year of education, with a given level of professional experience (3
and 4)5 Increased salary associated with a tertiary education (5 and 6) Increased probability of finding gainful employment (7 and 8)
Social advantages
Reduction of the risk of unemployment (9) Effect on professional status (10) Thorough grasp of written comprehension as an adult (11) Probability of attending continuing training (12)
Advantages in relationships with children
The benefits accrued not directly by the person, but by his/her children or in the context of
relationships with children were also taken into account. This is an aspect of the benefits of
education whose importance was shown by Wolfe and Haveman (2000):
cultural practices of children (13); quality of communication between parents and children (14); educational skills of children (15).
We would have liked to be able to use other criteria like the effect of education on the risk of
coming into contact with the judicial system or on people’s state of health. The latter effect is
one of the most firmly established non-market effects of education (Gilleskie and Harrisonn,
1998). But we have not found suitable international comparisons, for example on the links
between qualifications and the individual’s perceived state of health, although such data is
collected at national level, in certain censuses, such as in Belgium (INS, 2001).
The results of the comparison are presented in table 3. All of the indicators were devised so
that a high value means that an increase in education is associated with a particularly highincrease in a desirable asset. This table is a synthesis of the indicators A.1.1 and A.1.2, to
which we have added the comparison of the private return of tertiary education (OECD, 2002,
p.147).
The shades of colour used in the following table mean that the countries concerned differ
from the others due to particularly pronounced values (in pink) or low values (in yellow) of
the indicator. The assignment of these two colours was carried out in a relative way: the pink
means that the country is among those which have either one of the four or five or even six
highest values if the 15 countries are classified for this indicator, or one of the two highest
values if only 6, 7, or 8 countries are classified. The green means that the country is among
those with an intermediate position for the indicator under consideration. The cells are left
blank where data is unavailable.
This method of working has been preferred to the total of rankings because the extent and
form of the distribution vary according to each criterion. This method of working enables us
to take into account, by distinguishing the countries by size, which are in the “leading group”
or the “trailing group” (if we can use a cycling metaphor). The method of calculation used is
equivalent to giving a weighting of 6 out of 15 to salary benefits, 3 out of 15 to benefits in
4
This indicator was borrowed from Education at a Glance, 2002, p. 147. The precise definition of other indicators is given with the indicators A.1.1. and A.1.2. (Part 2).5 This is the only criterion which does not compare populations with a tertiary degree to other populations.

8/2/2019 Equity in European Educational System
http://slidepdf.com/reader/full/equity-in-european-educational-system 108/151
108
terms of employment / unemployment, 2 out of 15 to effects in terms of status and prestige,
and 5 out of 15 to personal benefits and those connected with education of children.
In view of the limitations of this approach (non-exhaustive nature of criteria, disparities in
populations, periods taken into account, etc.), this classification should not be interpreted too
conclusively or too inflexibly.
It appears that the European countries where the advantages associated with better education
are lowest are Sweden, Norway, Greece and Ireland while they are more pronounced than
elsewhere in the United Kingdom, in Switzerland and in Finland. In the latter three countries,
to which we can probably add Germany and Luxemburg, equity of education is a particularly
crucial issue.
Other lessons can be gained from this analysis. Some countries have a homogenous profile:
their relative position does not appear to be different from one criterion to another. That is the
case of Sweden which belongs to the countries where the benefits associated with education
are least pronounced on almost all the criteria, or of France which is not distinguished itself neither positively nor negatively. On the other hand, Finland, Switzerland, Portugal and
United Kingdom belong to the countries where the benefits associated with education are the
strongest on almost all the criteria.
Others have a contrasting profile. In Italy, for instance, the benefits associated with education
are particularly high on one criteria, low on three others and in an intermediary position on
the last. The United Kingdom combines particularly high monetary benefits to education with
particularly low benefits in status of the profession entered.
We can also observe that this analysis “blurs” somewhat the usual geographical divides:
Nordic and Latin countries can be found both among the countries where the benefits of education are particularly high as well as the countries where they are low.
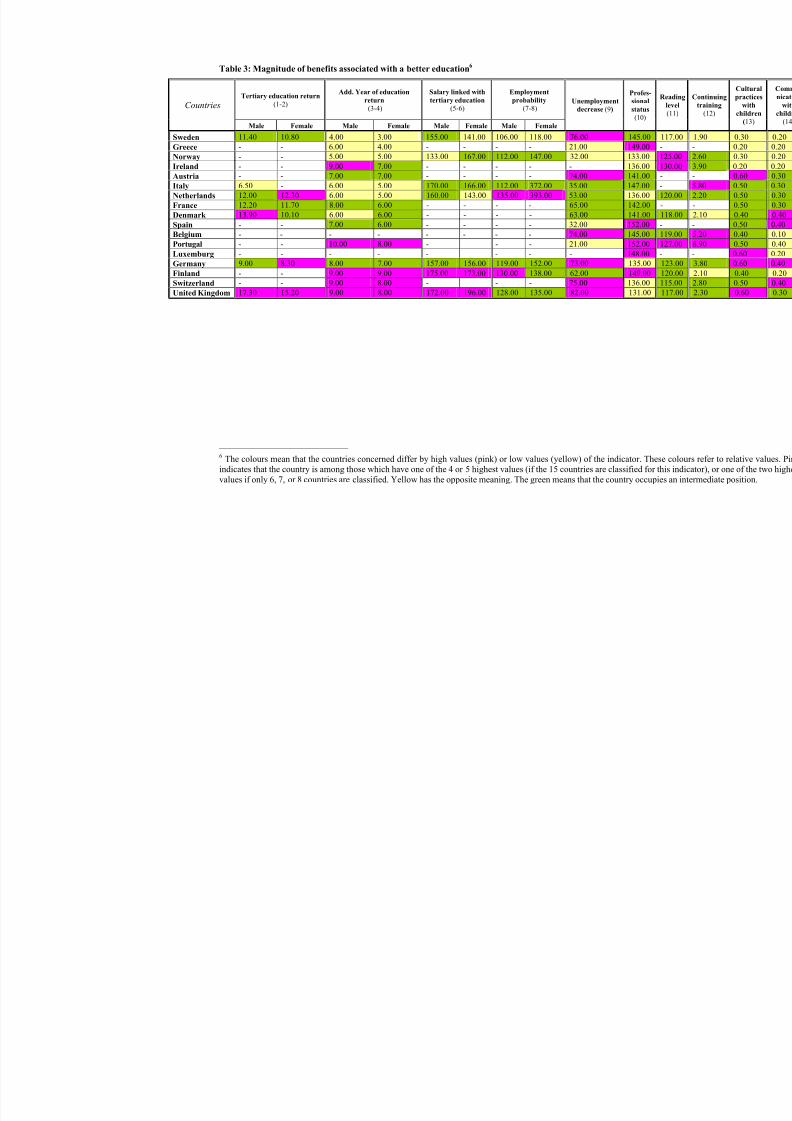
8/2/2019 Equity in European Educational System
http://slidepdf.com/reader/full/equity-in-european-educational-system 109/151
Table 3: Magnitude of benefits associated with a better education6
Tertiary education return
(1-2)
Add. Year of education
return
(3-4)
Salary linked with
tertiary education (5-6)
Employment
probability
(7-8) Countries
Male Female Male Female Male Female Male Female
Unemployment
decrease (9)
Profes-
sional
status
(10)
Rea
le
(1
Sweden 11.40 10.80 4.00 3.00 155.00 141.00 106.00 118.00 76.00 145.00 117Greece - - 6.00 4.00 - - - - 21.00 149.00 -
Norway - - 5.00 5.00 133.00 167.00 112.00 147.00 32.00 133.00 125
Ireland - - 9.00 7.00 - - - - - 136.00 130
Austria - - 7.00 7.00 - - - - 74.00 141.00 -
Italy 6.50 - 6.00 5.00 170.00 166.00 112.00 372.00 35.00 147.00 -
Netherlands 12.00 12.30 6.00 5.00 160.00 143.00 135.00 393.00 53.00 136.00 120
France 12.20 11.70 8.00 6.00 - - - - 65.00 142.00 -
Denmark 13.90 10.10 6.00 6.00 - - - - 63.00 141.00 118
Spain - - 7.00 6.00 - - - - 32.00 152.00 -
Belgium - - - - - - - - 74.00 145.00 119
Portugal - - 10.00 8.00 - - - 21.00 152.00 127
Luxemburg - - - - - - - - 148.00 -
Germany 9.00 8.30 8.00 7.00 157.00 156.00 119.00 152.00 73.00 135.00 123
Finland - - 9.00 9.00 175.00 173.00 130.00 138.00 62.00 149.00 120Switzerland - - 9.00 8.00 - - - 75.00 136.00 115
United Kingdom 17.30 15.20 9.00 8.00 172.00 196.00 128.00 135.00 82.00 131.00 117
6 The colours mean that the countries concerned differ by high values (pink) or low values (yellow) of the indicator. These cindicates that the country is among those which have one of the 4 or 5 highest values (if the 15 countries are classified for this
values if only 6, 7, or 8 countries are classified. Yellow has the opposite meaning. The green means that the country occupies a

8/2/2019 Equity in European Educational System
http://slidepdf.com/reader/full/equity-in-european-educational-system 110/151
110
The 4 first indicators distinguish between men and women. In all countries, the benefit associated
with education with regard to the prospects of obtaining gainful employment is higher for women
than for men. As to increased pay, the situation is more favourable to men, but changes according
to the indicator under consideration: the premium associated with higher education is higher for men in five countries out of seven and higher for women in two other countries. On the other
hand, the rate of return per additional year of education is greater for men in a majority of countries and equal for women and men in Austria, Denmark, Finland, and Norway.
Overall, therefore, equity in education does not seem to be, on examination of this clearlyincomplete data, more crucial for women than for men.
The figure 2 presents a second map, which is synthesising here the benefits associated with
education. It is based on the ranking from table 3. It only concerns EU countries (EU-15, 2001)
for which data were available. We did not take care of the ranking of Norway and Switzerland to
build this map. These two countries are not presented in colour.
The countries belonging to the group of the most equitable countries are the countries which are
on the first four ranks; the countries considered as the less equitable countries are the one situated
on the last four ranks. However, a rank could be occupied by several countries. If it was the case,the number of equitable or less equitable countries could be higher than 4.
On this map, the most equitable countries are in yellow – Sweden, Greece, Ireland and Austria – and the less equitable from the point of view of the benefits associated with education are in pink
: United Kingdom, Finland, Germany and Luxemburg.
Figure 2: Benefits associated with education

8/2/2019 Equity in European Educational System
http://slidepdf.com/reader/full/equity-in-european-educational-system 111/151
111
3. Do the European Union’s education systems
have a role in amplifying or reducing
contextual inequalities?School is not an island
School is not an island: much depends on the social and economic system in which it exists,
which can also modify it by contributing to a greater or lesser extent to reducing inequalities
that are considered unfair. Even if, as Boudon, Bulle and Cherkaoui (2001, p. 2) put it,
“School was probably the first institution called to take up the challenges thrown down by
social, economic and political changes for the future of societies. It was and still is, more than
ever before, the institution most exposed to the dangers engendered by the pressing social
expectations that it nurtures, and by the continual changes to which it is subject, and whose
consequences it is not in a position to control”. Giving school too much power to change iscertainly just as serious a mistake as giving it none at all, limiting it to a role as a marshalling
yard, facilitating reproduction of one generation to the next, with a greater or lesser dose of
meritocracy capable of reshuffling a small number of the cards.
What are the objectives actually assigned to school?
Not granting any power of change to education systems, and not adopting the tools intended
to measure equity in the processes set up to achieve change, is even less relevant if one
considers the concrete future objectives of European education and training systems. The
section “Increase the quality of education and training systems” of the work programme
provides that the basic skills must be brought within the reach of all, including the most
disadvantaged people, those who have specific needs, young people who have dropped out of school, and those undergoing training. The aspect “Facilitating access to education and
training for all” also shows the potential benefits of an approach focused on equity, not only
in terms of access to education and training (“Ensure that education and training are
accessible to all”), but also in terms of results (“Ensure fair access to the acquisition of skills”)
and internal processes (“Fully integrate the dimension of equality of opportunities into the
objectives and operation of education and training”)7.
While at a certain level of education, one can consider the question of specialization of
objectives, and lead certain individuals to differentiated expertise, and possibly a variable
individual return, this does not apply to basic schooling. Basic schooling must develop in all
pupils the skills necessary to participate fully in the Information Society. Once we focus ondeveloping the same basic skills among all individuals, there is a necessary link between
effectiveness and equity, framed in terms of equality of results.
If we consider matters from the viewpoint of equality of results, the idea of linking
effectiveness and equity appears to be an integral part of the principal of equality of learning
and its valuation by society. From this viewpoint, an education system will be considered
effective if, while raising the average level of knowledge, it reduces the overall variance of
internal and external results of the education system. In any case, this is the ideal advanced by
Bloom (1976) since, according to him, effective education is characterized by three joint
effects at the end of each phase of learning:
7http://europa.eu.int/scadplus/leg/en/cha/c11049.htm
8/2/2019 Equity in European Educational System
http://slidepdf.com/reader/full/equity-in-european-educational-system 112/151
112
a rise in the average standard of results;
a reduction in the variance of results;
a reduction in the correlation between the social origin of the pupil (and in general, his/her initialcharacteristics) and achievement.8 9
The latter aspect poses the problem of being able to discern an initial aptitude, which would
depend on individual characteristics and which would determine the results that aneducational action may have (Cronbach, 1967, p. 23 translated by Birzea, 1982, p. 108), and
the social determinants linked to the environment in which a child is born and brought up, and
which, if they are penalized by the education system, constitutes a curb on individual
development.
In a way, it is by focusing the objectives of school on a group of skills to be mastered by all
that certain education systems solve the problem: whatever the initial or social characteristics
may be, the mission of these systems is to implement the necessary resources so that everyone
can master the skills deemed to be fundamental for the development of every individual and
for society as a whole.
School is more a matter of right than aptitudes
As emphasised by John Dewey (1897), the debate about equality in education involves
questions about societal policy, and not only individual or social data: “Belief in equality is an
element of the democratic credo. It is not, however, belief in equality of natural endowments.
Those who proclaimed the idea of equality did not suppose they were enunciating a
psychological doctrine, but a legal and political one. All individuals are entitled to equality of
treatment by law and in its administration. Each one is affected equally in quality if not in
quantity by the institutions under which he ( sic) lives and has an equal right to express his
judgment, although the weight of his judgment may not be equal in amount when it enters
into the pooled result to that of others. In short, each one is equally an individual and entitled
to equal opportunity of development of his own capacities, be they large or small in range.Moreover, each has needs of his own, as significant to him as those of others are to them. The
very fact of natural and psychological inequality is all the more reason for establishment by
8 Coleman (1966, p. 72) writes on this subject: « Another way of putting this is to say that the schools are
successful only insofar as they reduce the dependence of a child’s opportunities upon his social origins. We canthink of a set of conditional probabilities : the probability of being prepared for a given occupation or for a givencollege at the end of high school, conditional upon the child’s origins. The effectiveness of the schools consists,in part, of making the conditional probabilities less conditional – that is, less dependent upon social origins. ».9 Miller (1977) clearly indicates the risk of only considering one aspect at a time, since the reduction in variance
of results obtained and belonging to a particular group may merely mask the increase in individual differencesnot attributable to belonging to that group. So, we can observe that belonging to the black minority is no longer that much of a disadvantage in itself, in relation to academic achievement or the possession of certain assets, butwe can also realize that the gap between the most well-off and the most disadvantaged, whatever their ethnic background, has widened in the same period of time. That is the appeal of the three criteria proposed by Bloom,and why they should be considered simultaneously. They are stricter, from an egalitarian perspective, than theRawlsian system that tolerates substantial differences between individuals, while enabling the fate of the most
disadvantaged to be improved in absolute terms.Walzer, in his book “Spheres of Justice” (1983) refers to this necessary independence between goods to ensurecomplex equality, in the absence of being able to achieve simple and absolute equalization of all individuals inall fields (see also Meuret, 2000a, p. 243). Michel (1999, pp. 76-77) explicitly makes the link between thisconcept of independence of “spheres” and that, which is more familiar to readers of Bourdieu, of “specific typesof capital”. These two ways of considering justice by independent distribution of various types of capital or
benefits through independent economic, administrative, educational, family, religious spheres, as proposed byWalzer, may be compared to the third condition posed by Bloom (the absence of a link between socio-economicstatus of parents and academic success).

8/2/2019 Equity in European Educational System
http://slidepdf.com/reader/full/equity-in-european-educational-system 113/151
113
law of equality of opportunity, since otherwise the former becomes a means of oppression of
the less gifted”10.
When we are considering the educational establishment, Dewey points out that above all, this
concerns a philosophical or legal position, and not a psychological given: as men are different
by nature, it is the Law that guarantees them equal rights. Since Dewey, compensatory
education and the wish to provide everyone with equal rights in terms of access, as well as in
success, have led to taking account of the pupil himself or herself in deciding the resources
that must be allocated to the various institutions: a child is no longer equal to a child, at least
when it is a question of allocating the resources necessary for each individual in response to
different needs but shared objectives.
Some go a long way in their concern to make school and society fairer. Husén (1972, p. 42),
in a document published by the OECD, has no hesitation in writing: “It is not enough to
introduce formal equality of access to education; children from diverse social backgrounds
must be given greater possibilities of access to intelligence, and to do this, accentuate the
inequality in pre-school institutions or in school itself. As far as differentiation in IQ is
concerned, it is already accomplished to a large extent before the child starts school. Thefamily, and above all, the cultural level of his/her friends (Coleman, 1961) continue to exert
an important influence. To equalize school results, it is necessary for society to take special
measures to compensate the shortcomings of the environment in which the child grows up,
and to supplement what may have been done at home. To achieve the objective of equality at
all costs, it may be necessary to act against the wishes of families who are indifferent or even
hostile to the measures envisaged by society11. The report by the Swedish Royal Commission
on pre-school establishments confirms this data”.
Husén (1972) emphasises how an approach based on talents can constitute a form of social
Darwinism: school exerts identical pressure on everyone, while selecting ruthlessly and
putting “the blame” on parents who do not take sufficient interest in the pupil’s progress, or on the pupils who do not have the talents, abilities or determination to advance.
Coleman (1973, p. 135) qualifies slightly the actions to be taken in relation to equal
opportunities: “For these two reasons, firstly because it is unachievable and secondly because
if it were achieved, it would lower the overall level of opportunities offered to children, the
ideal of equal opportunities is a false ideal. A society cannot take a decision, and make it
achievable, to create equal opportunities for all the children that form part of it. What it must
do is to decide how far its investment of public resources can go to reduce the size of
inequalities caused by private means”.
So the role of each individual cannot be entirely determined by essentially non-changeable
variables as defined by Bloom (1976) and school is not simply there to reveal potential that ismainly innate or linked to family resources which sanction the logic of “heirs” (Bourdieu and
Passeron, 1966; Bourdieu, Passeron and Chamboredon, 1970). It remains to be defined what
is tolerable with regard to social determinism, and in which fields this cannot be tolerated (for
example, what are the vital skills that all citizens must master in order to fully exercise their
rights and duties within a democratic society?).
Once the common minimum is established as an objective to be attained by all, the wish to
ensure genuine equality of results implies accepting the postulate of educability advanced by
Bloom (Bloom, 1976; Slavin, Karweit and Madden, 1989), to accept that school gives more to
those who have less, and to break with ideologies based on talents or (innate) aptitudes. In
10Translation made by the authors of this report.
11Emphasis added by the authors of this report.
8/2/2019 Equity in European Educational System
http://slidepdf.com/reader/full/equity-in-european-educational-system 114/151
114
terms of action, it is important to ensure that the education system assigns itself such an
objective among its ultimate aims. In the conviction that pupils’ performance is not fixed at a
given and permanent level by stable aptitudes, those who adhere to these principles are
attempting to reduce the scale of a series of forms of negative discrimination and demanding
voluntarist policies that result in the implementation of positive discrimination (Crahay, 2000;
Demeuse and Monseur, 1999; Slavin, Madden, Dolan and Wasik, 1996), whose realeffectiveness has yet to be demonstrated (Slavin and Fashola, 1998).
Analysts should verify that no public funds are being used to reinforce inequalities through,
for example, more coaching for pupils who are already advantaged, and their distribution
should be analysed, to check that it is appropriate to the identified requirements. To
summarise these objectives, Husén (1972, p. 43) put it very elegantly: “Paradoxically, we
could say that everyone should be given equal opportunities of unequal treatment with regard
to social differences”, long before the statement attributed in France to Minister Savary:
“Giving more to those who have less”.
Using indicators of equity
As we have seen, evaluating equity in education systems does not imply ruling out analysis of
their effectiveness. For some people, like Bloom, the two concepts are even synonymous.
However, we distinguish them here: for the two dimensions do not necessarily overlap, and
each enables a separate judgement to be made of the quality of education systems. With this
in mind, the construction of our framework of indicators of education systems has focused on
indicators of equity. These indicators were organized to enable analysis of systems that also
take account of external or “contextual” parameters. Even if internal processes of education
systems can reduce or increase inequalities between pupils, it is also important to take account
of economic, social, and cultural contexts of which the systems are a part.
To answer the question raised in this section, we are trying first of all to find out to what
extent contextual inequalities are observed to have been increased or reduced when anindividual leaves the education systems. Then we analyse to what extent education systems
are or are not responsible for these increases or reductions, in terms of internal processes.
Are increases or reductions in contextual inequalities observed within
school systems?
When you restrict your ambitions to a single study and when very varied information is
collected about the same individuals, greatly enhanced analyses can be carried out. That is
what PISA makes possible, by collecting data relating to skills (in reading, maths, and
science) and information about the profession of parents, their qualifications, the aspirations
of pupils, the way in which they describe their family and school environment (assistancereceived and available, funds and material resources, climate). The publications relating to
PISA and drafted under the responsibility of the OECD and relating to the first data collection
in 2000 have already found a large number of uses. It is not our aim to quote them all here,
but to show their diversity and the wealth of possibilities.
The PISA data allows, for instance, to highlight the impact of the socioeconomic and cultural
status of pupils taken individually and by schools12 on the performance of pupils in written
comprehension (OECD, 2001, p.216).
According to this analyse, in Belgium, when the average index of the socioeconomical and
cultural level of the establishment is increased by a half standard deviation, the increase is 56
12The average socio-economic status of pupils who attend the school.
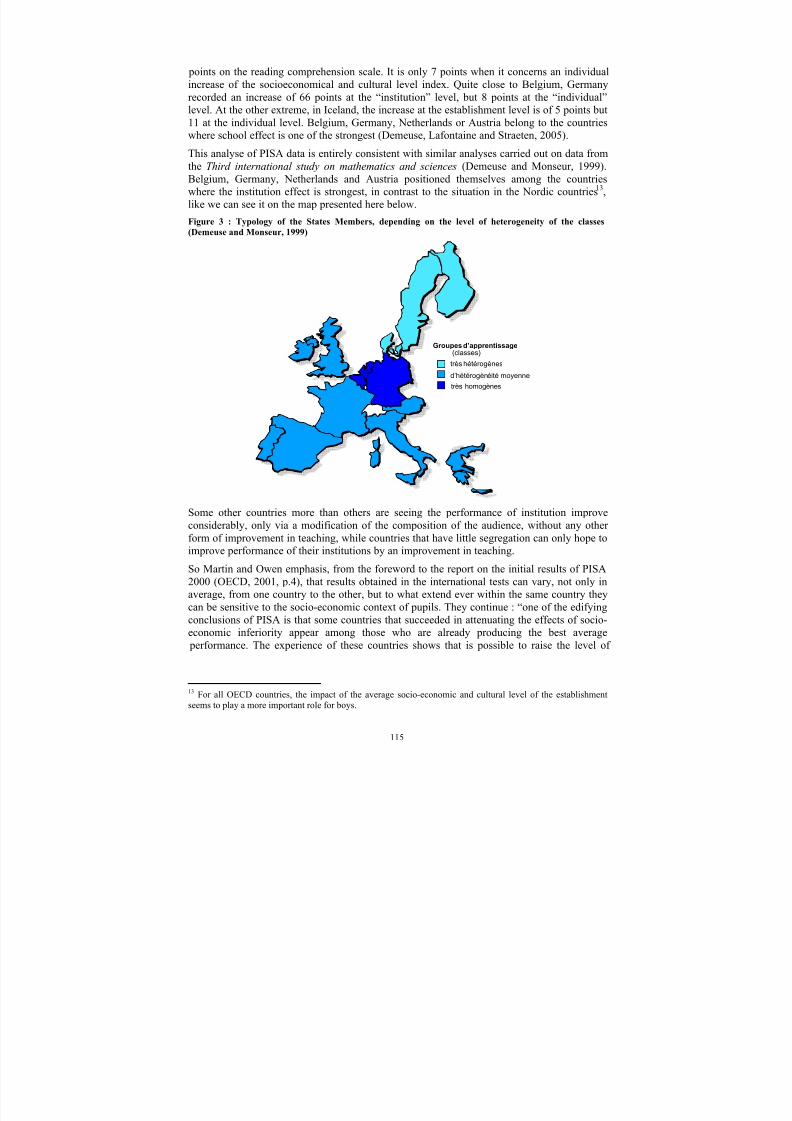
8/2/2019 Equity in European Educational System
http://slidepdf.com/reader/full/equity-in-european-educational-system 115/151
115
points on the reading comprehension scale. It is only 7 points when it concerns an individual
increase of the socioeconomical and cultural level index. Quite close to Belgium, Germany
recorded an increase of 66 points at the “institution” level, but 8 points at the “individual”
level. At the other extreme, in Iceland, the increase at the establishment level is of 5 points but
11 at the individual level. Belgium, Germany, Netherlands or Austria belong to the countries
where school effect is one of the strongest (Demeuse, Lafontaine and Straeten, 2005).
This analyse of PISA data is entirely consistent with similar analyses carried out on data from
the Third international study on mathematics and sciences (Demeuse and Monseur, 1999).
Belgium, Germany, Netherlands and Austria positioned themselves among the countries
where the institution effect is strongest, in contrast to the situation in the Nordic countries13,
like we can see it on the map presented here below.
Figure 3 : Typology of the States Members, depending on the level of heterogeneity of the classes
(Demeuse and Monseur, 1999)
d’hétérogènéité moyenne
très hétérogènes
très homogènes
Groupes d’apprentissage(classes)
Some other countries more than others are seeing the performance of institution improve
considerably, only via a modification of the composition of the audience, without any other
form of improvement in teaching, while countries that have little segregation can only hope to
improve performance of their institutions by an improvement in teaching.
So Martin and Owen emphasis, from the foreword to the report on the initial results of PISA
2000 (OECD, 2001, p.4), that results obtained in the international tests can vary, not only in
average, from one country to the other, but to what extend ever within the same country they
can be sensitive to the socio-economic context of pupils. They continue : “one of the edifying
conclusions of PISA is that some countries that succeeded in attenuating the effects of socio-
economic inferiority appear among those who are already producing the best average
performance. The experience of these countries shows that is possible to raise the level of
13For all OECD countries, the impact of the average socio-economic and cultural level of the establishment
seems to play a more important role for boys.

8/2/2019 Equity in European Educational System
http://slidepdf.com/reader/full/equity-in-european-educational-system 116/151
116
performance while reducing inequalities, and issues a challenges to other countries by
demonstrating that quality and equality are not incompatible”.
Moreover, analyses of the national socio-economic gradients also provides interesting
answers to the question about the link between performance and socio-economic status of
students (OECD, 2001, p.200-209). The data analysis shows that, if on average, in the OECD
zone, 20 % of the variation in reading performance of pupils (combined scale) is connected
with economic, social and cultural status, these proportion varies, for the European Union
Member States (2001), between 9 % in Finland and 24 % in Austria.
Are educational systems responsible for in the level of inequalities?
Highlighting mechanisms which do or do not encourage equity in and on leaving the
education systems is particularly complex due, in particular, to the fact that the school is part
of a particular society, and therefore it is not easy to identify the actual effect of the school
institution. First, the analyse focuses on the context of the different Europeans countries.
Insert 2 : Notes related to the categorisation of indexes presented in table 4
(1) In pink, countries where the proportion of children in poor households is highest
between 13.80 and 20.00% ; in green, from 7.70 to 12.20 % of children in poor householdsand in yellow, from 3.90 to 4.50 %. The blank boxes refer to missing data (A.2.1) (2) In pink, dispersion of household resources is over .84, in green, between .78 and .83, and inyellow, between .68 and .77. (A.2.1.) (3) In pink, the unemployment rate is over 10%, ingreen, between 5 and 9%, and in yellow, less than 5%. The blank boxes refer to missingdata (A.2.2). (4) In pink, over 45 % of adults have a low level of education; in green,
between 30 and 44%, and in yellow, between 15 and 29% of adults do not have a certificateof higher secondary education. The white boxes refer to missing data. (A.3.1.) (5) In pink,the cultural resources are more dispersed than average, in yellow, they are less so; in green,the dispersion of cultural resources is comparable with the average (A.3..2.) (6) In pink,
cultural practices are more dispersed than average; in yellow, they are less so; in green, thedispersion of cultural practices is comparable with the average (A.3.3.) (7) A single colour
is used: countries are comparable from this aspect. (A.4.1.)
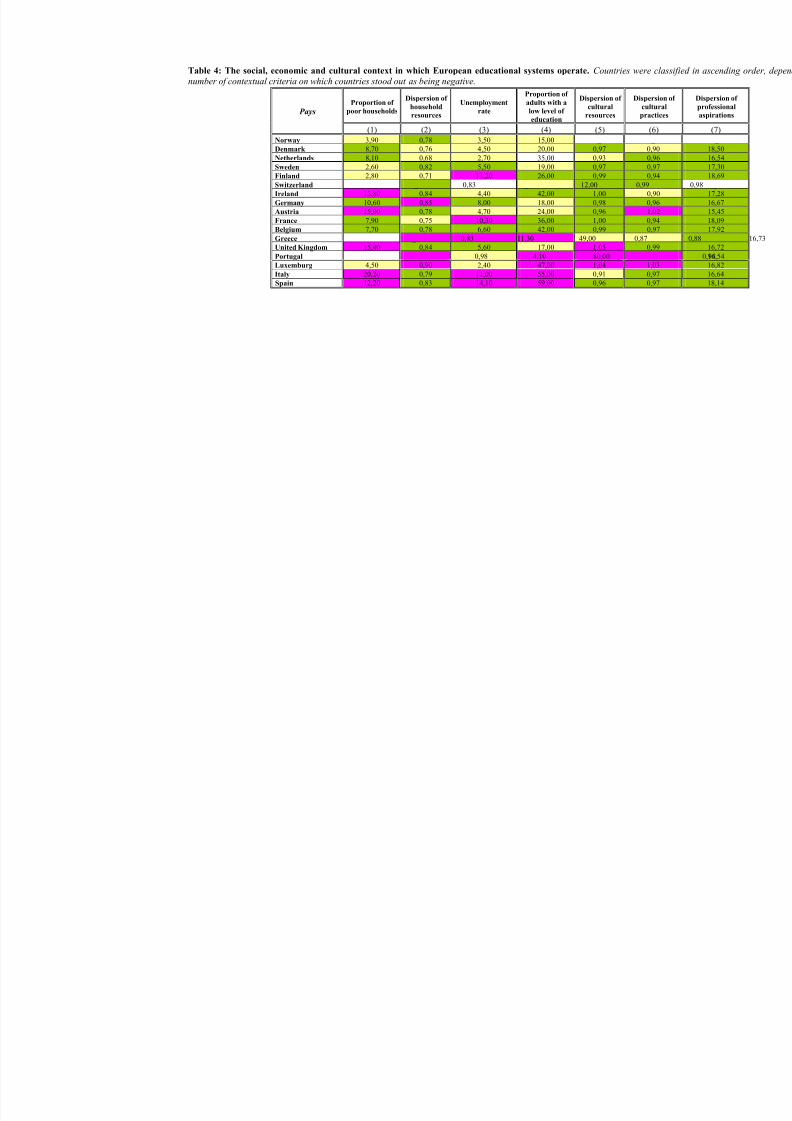
8/2/2019 Equity in European Educational System
http://slidepdf.com/reader/full/equity-in-european-educational-system 117/151
Table 4: The social, economic and cultural context in which European educational systems operate. Countries were classnumber of contextual criteria on which countries stood out as being negative.
Proportion of
poor households
Dispersion of
household
resources
Unemployment
rate
Proportion of
adults with a
low level of
education
Dispersion of
cultural
resources
Dispersion o
cultural
practices Pays
(1) (2) (3) (4) (5) (6)
Norway 3,90 0,78 3,50 15,00 _ _
Denmark 8,70 0,76 4,50 20,00 0,97 0,90
Netherlands 8,10 0,68 2,70 35,00 0,93 0,96
Sweden 2,60 0,82 5,50 19,00 0,97 0,97
Finland 2,80 0,71 11,20 26,00 0,99 0,94
Switzerland _ 0,83 _ 12,00 0,99
Ireland 13,80 0,84 4,40 42,00 1,00 0,90
Germany 10,60 0,85 8,00 18,00 0,98 0,96
Austria 15,00 0,78 4,70 24,00 0,96 1,02
France 7,90 0,75 10,30 36,00 1,00 0,94
Belgium 7,70 0,78 6,60 42,00 0,99 0,97
Greece _ 0,85 11,30 49,00 0,87
United Kingdom 15,40 0,84 5,60 17,00 1,05 0,99
Portugal _ 0,98 4,10 80,00
Luxemburg 4,50 0,90 2,40 47,00 1,04 1,03
Italy 20,20 0,79 11,00 55,00 0,91 0,97 Spain 12,20 0,83 14,10 59,00 0,96 0,97

8/2/2019 Equity in European Educational System
http://slidepdf.com/reader/full/equity-in-european-educational-system 118/151
118
The economic, social and cultural in which the Spanish, Italian and British education systems
operates seems to be harsher than in the other countries, while it seems more favourable in
Denmark and in the Netherlands. Figure 4 presents this ranking according to the context. It
only concerns EU countries (EU-15, 2001) for which data were available. We did not take
care of the ranking of Norway and Switzerland to build this map. These two countries are not
presented in colour.
The countries belonging to the group of the most equitable countries are the countries which
are on the first four ranks; the countries considered as the less equitable countries are the one
situated on the last four ranks. However, a rank could be occupied by several countries. If it
was the case, the number of equitable or less equitable countries could be higher than 4. The
countries with a favourable context are in yellow; the ones with more difficult context are in
pink.
Figure 4: Contextual inequalities
Moreover, table 5 provide information about the disparities between categories of individuals
concerning social, economic, and cultural welfare.

8/2/2019 Equity in European Educational System
http://slidepdf.com/reader/full/equity-in-european-educational-system 119/151
Table 5: Social, economic and cultural inequalities, depending on individual variables. The countries are classified in asccontextual criteria for which countries stand out in a negative way.
Family WealthUnemployment
rateLevel of education Cultural resources Cultural practices
Pays
Social
origin
National
origin
Male Female Male Female GenderSocial
origin
National
origin
Reading
achieve-
ment
GenderSocial
origin
National
origin
Rea
achi
me
Sweden 0,44 0,50 6,00 5,10 21,00 18,00 0,02 -0,59 0,08 -0,53 -0,23 -0,29 0,14 -0
Greece 0,83 0,09 7,50 16,90 46,00 51,00 -0,20 -0,47 0,22 -0,55 -0,17 -0,10 -0,27 -0
Ireland 0,75 0,03 4,40 4,20 45,00 40,00 -0,24 -0,34 -0,08 -0,45 -0,47 -0,19 0,07 -0
Netherlands 0,53 0,20 2,20 3,50 37,00 39,00 -0,18 -0,44 -0,41 -0,40 -0,35 -0,35 -0,12 -0
Finland 0,68 0,46 10,40 12,00 28,00 24,00 -0,17 -0,48 0,12 -0,50 -0,46 -0,28 0,45 -0
United Kingdom 0,73 0,16 6,20 4,90 31,00 43,00 -0,21 -0,47 -0,07 -0,48 -0,27 -0,40 0,13 -0
Denmark 0,56 0,51 4,00 5,00 18,0 21,00 -0,05 -0,49 -0,09 -0,44 -0,26 -0,31 0,05 -0
Spain 1,01 -0,06 9,70 20,50 58,00 60,00 -0,15 -0,49 0,17 -0,58 -0,26 -0,42 0,02 -0
Austria 0,56 0,44 4,80 4,60 18,00 31,00 -0,20 -0,47 0,03 -0,45 -0,24 -0,31 -0,12 -0
Portugal 1,31 -0,22 3,20 5,10 81,00 79,00 -0,19 -0,59 -0,10 -0,65 -0,17 -0,28 -0,01 -0
Switzerland 0,59 0,13 2,40 3,20 10,00 24,00 -0,22 -0,48 -0,05 -0,41 -0,26 -0,31 -0,07 -0
Germany 0,69 0,48 7,70 8,30 13,00 21,00 -0,15 -0,50 0,02 -0,49 -0,16 -0,43 -0,22 -0
Belgium 0,69 0,04 5,30 8,30 41,00 42,00 -0,24 -0,52 -0,37 -0,57 -0,30 -0,43 -0,22 -0
France 0,76 0,25 8,60 12,30 33,00 39,00 -0,24 -0,45 -0,29 -0,66 -0,16 -0,26 -0,13 -0
Italy 0,90 0,09 8,40 14,90 56,00 57,00 -0,27 -0,55 0,50 -0,47 -0,23 -0,28 0,36 -0
Luxemburg 0,89 0,44 1,80 3,20 42,00 53,00 -0,13 -0,57 0,09 -0,65 -0,20 -0,31 -0,37 -0

8/2/2019 Equity in European Educational System
http://slidepdf.com/reader/full/equity-in-european-educational-system 120/151

8/2/2019 Equity in European Educational System
http://slidepdf.com/reader/full/equity-in-european-educational-system 121/151
121
The populations in these two studies are slightly different since, in the former case, these are
pupils belonging to classes selected overall in the 7th and 8th grades, while in the latter, these
are 15 year-old students, at whatever point they have reached in the curriculum, who were
selected in various educational establishments sampled. The latter study, apart from its more
recent character, also offers the advantage of relating to three disciplines: reading in the
language of instruction, maths, and science, whereas the former only relates to maths andscience.
The analyses carried out on the data available for the majority of the EU Member States (all
the countries in the case of PISA) highlight a gender-based segregation in countries that still
have education organized on a religious basis, although this segregation is not usually
associated with a segregation in terms of results (Gorard and Smith 2004). On the other hand,
it appears that systems that practice little segregation at school level record low social
differences and relatively similar results between institutions. Systems which segregate
students between school by SES, even where (as in Germany) that is not the intention, tend to
increase differences in results between social groups. From this viewpoint, and without
having to sacrifice effectiveness for equity (quite the contrary) it appears that Finland, whoseaverage results are high and not very dispersed, can be compared with those of Germany,
where the average results are relatively poorer and their dispersion much more pronounced
(B.2.3). These results also concur with those of the study already mentioned (Demeuse and
Monseur, 1998) in the field of organization of educational systems in Europe.
The examination of differences in the process can also be continued in the field of education
spending. It is usually rather difficult, at least in the industrialized countries, to find a simple
relationship between overall education spending and academic achievement. However, it is
interesting, in the field that concerns us, to consider the relative allocation of resources within
each of the systems: who actually benefits from them? Is the priority basic education that is
compulsory for everyone, or tertiary education? (B.1.2).
Another approach consists of analysing the sharing-out of resources for a given level of
schooling, and in particular, for compulsory education. PISA also allows this to be done. It
emerges from the study that Austria stands out due to a pronounced dispersion of teacher-
pupil ratios between the various institutions attended by 15 year-old pupils. France, Italy,
Portugal and even more so the United Kingdom, Sweden, and Switzerland are characterized
by a more equal distribution.
The consideration of class sizes leads to a slightly different classification. This parameter is
particularly variable in Austria, as well as in Spain, France, and Portugal, while this is not the
case in Denmark or in Finland. In this field, the tendency in all European countries to teach pupils of disadvantaged social origin in smaller classes should be pointed out. This situation is
particularly pronounced in Belgium, Austria and in France. Positive discrimination policies
certainly have some influence on this observation. In the majority of countries, except in
Finland, Ireland, Italy, and the United Kingdom, students whose parents were born abroad
also tend to be taught in smaller classes. The weakest pupils are also taught in classes whose
size does not exceed that of classes attended by the strongest pupils, in all the countries of the
Union (2001). Austria, Belgium, and the Netherlands are the countries where the classes
attended by the weakest students are smallest.
Besides the material conditions, the climate in the classroom also constitutes a factor that is
often quoted among the variables that influence school results. It is via the questionnaire sentto students themselves that this factor was studied through the PISA results (B.2.2). A series
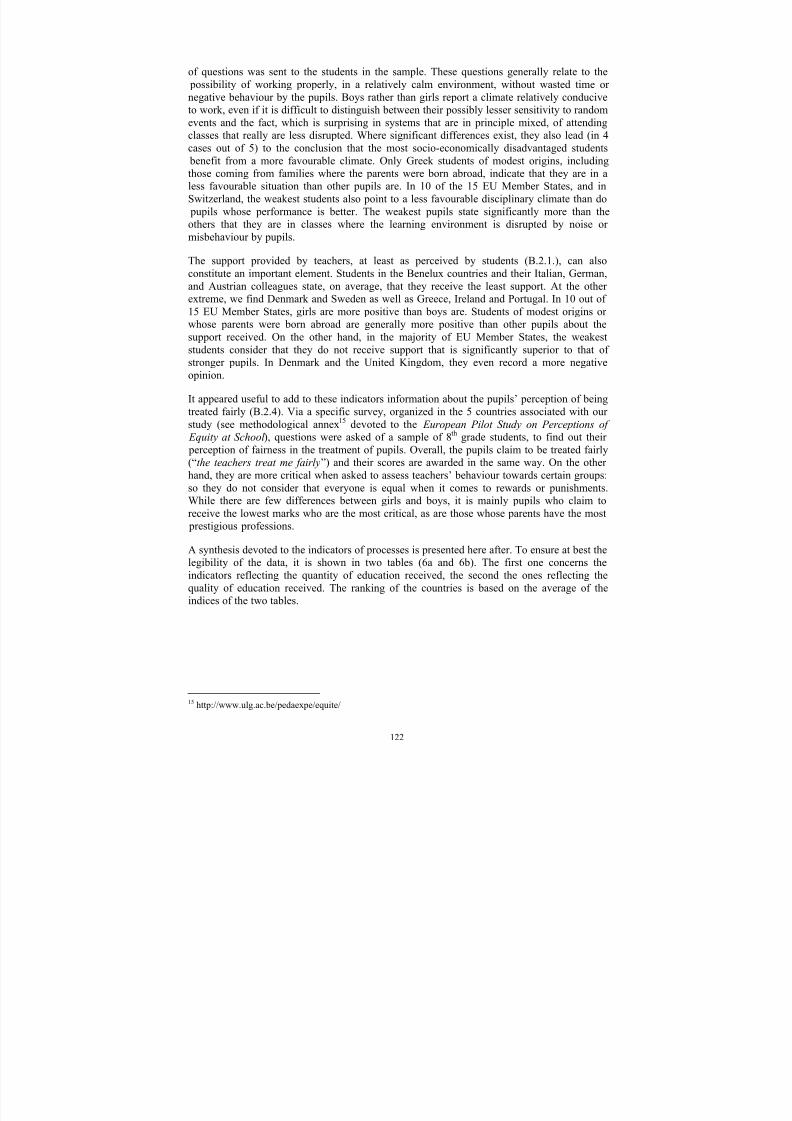
8/2/2019 Equity in European Educational System
http://slidepdf.com/reader/full/equity-in-european-educational-system 122/151
122
of questions was sent to the students in the sample. These questions generally relate to the
possibility of working properly, in a relatively calm environment, without wasted time or
negative behaviour by the pupils. Boys rather than girls report a climate relatively conducive
to work, even if it is difficult to distinguish between their possibly lesser sensitivity to random
events and the fact, which is surprising in systems that are in principle mixed, of attending
classes that really are less disrupted. Where significant differences exist, they also lead (in 4cases out of 5) to the conclusion that the most socio-economically disadvantaged students
benefit from a more favourable climate. Only Greek students of modest origins, including
those coming from families where the parents were born abroad, indicate that they are in a
less favourable situation than other pupils are. In 10 of the 15 EU Member States, and in
Switzerland, the weakest students also point to a less favourable disciplinary climate than do
pupils whose performance is better. The weakest pupils state significantly more than the
others that they are in classes where the learning environment is disrupted by noise or
misbehaviour by pupils.
The support provided by teachers, at least as perceived by students (B.2.1.), can also
constitute an important element. Students in the Benelux countries and their Italian, German,and Austrian colleagues state, on average, that they receive the least support. At the other
extreme, we find Denmark and Sweden as well as Greece, Ireland and Portugal. In 10 out of
15 EU Member States, girls are more positive than boys are. Students of modest origins or
whose parents were born abroad are generally more positive than other pupils about the
support received. On the other hand, in the majority of EU Member States, the weakest
students consider that they do not receive support that is significantly superior to that of
stronger pupils. In Denmark and the United Kingdom, they even record a more negative
opinion.
It appeared useful to add to these indicators information about the pupils’ perception of being
treated fairly (B.2.4). Via a specific survey, organized in the 5 countries associated with our study (see methodological annex15 devoted to the European Pilot Study on Perceptions of
Equity at School ), questions were asked of a sample of 8th grade students, to find out their
perception of fairness in the treatment of pupils. Overall, the pupils claim to be treated fairly
(“the teachers treat me fairly”) and their scores are awarded in the same way. On the other
hand, they are more critical when asked to assess teachers’ behaviour towards certain groups:
so they do not consider that everyone is equal when it comes to rewards or punishments.
While there are few differences between girls and boys, it is mainly pupils who claim to
receive the lowest marks who are the most critical, as are those whose parents have the most
prestigious professions.
A synthesis devoted to the indicators of processes is presented here after. To ensure at best thelegibility of the data, it is shown in two tables (6a and 6b). The first one concerns the
indicators reflecting the quantity of education received, the second the ones reflecting the
quality of education received. The ranking of the countries is based on the average of the
indices of the two tables.
15 http://www.ulg.ac.be/pedaexpe/equite/

8/2/2019 Equity in European Educational System
http://slidepdf.com/reader/full/equity-in-european-educational-system 123/151
123
Insert 3 – Notes related to the categorization of the indices presented in tables 6a and 6b
(1) In pink, spending on tertiary education is at least twice as high as spending for basic education; in yellow, itis less than one and a half times as high (B.1.2.) (2) In pink, the dispersion of teacher-pupil ratios betweenestablishments in the country is higher than 5 ; in yellow, it is lower than 3 (B.1.2.) (3) In pink, the dispersion of class sizes in the country is higher than 5 ; in yellow, it is lower than 4. (B.1.2.) (4) In pink, countries in which
categories of pupils being studied are in the least small classes, in yellow, where the categories of pupils
concerned are in the smallest classes (B.1.2)(5) In pink, the 4 countries that have the highest segregation index ;in yellow the 4 countries that have the lowest index (B.2.3) (6) et (7) For gender : in pink, the countries in whichthe value of the indices is lower than the EU average and is significantly less favourable for the categoriesconcerned ; in green, the countries in which the differences are significant but lower than the average value for the Union ; in yellow, the differences between categories are not significant. For social and national origins and
weak pupils: in yellow, the “high risk” category is significantly better treated, in green, no significant differencesand in pink, it is significantly less well treated (B.2.1 – B.2.2).
Table 6a : Inequalities in the education process (Quantity of education received).. Countries were classified in ascending order, depending on the number of contextual criteria on which they stand out negatively
Quantity of the education received
Schooling in small classes
Basic / tertiary
education
Teachers /
pupils ratioClass size Disadvantaged
social originNational origin Week pupils
Countries
(1) (2) (3) (4)
Sweden 248 2.9 4.6 97 93 89
Switzerland 270 2.9 4.6 90 91 82
Netherlands 295 _ 4.9 92 88 73
Denmark 159 4.6 3.6 98 98 98
Luxemburg _ _ 4.5 91 91 89
Germany 272 4.6 4.5 94 97 86
Finland 196 4.5 3.2 97 100 90
France 190 3.7 5.9 90 97 78
Portugal 138 3.9 5.8 96 96 95
Italy 141 3.5 4.3 98 102 98
Greece 196 5.1 5.0 94 95 92
Belgium 246 5.5 5.6 85 86 71
United Kingdom 263 2.5 5.2 98 100 85
Ireland 320 5.9 5.5 92 101 78
Austria 184 8.1 6.7 89 91 76
Spain 157 4.8 6.2 93 95 94
Norway 204 5.1 5.4 95 104 97
8/2/2019 Equity in European Educational System
http://slidepdf.com/reader/full/equity-in-european-educational-system 124/151
Table 6b : Inequalities in the education process (Quality of education received). Countries were classified in ascending ordcriteria on which they stand out negatively.
Quality of the education received
Segregation Disciplinary climate in the classes
ReadingParental
occupationGender
Linguistic
origin
National
originDispersion
Weak
pupilsGender
Social
origin
National
originDisCountries
5 6
Sweden 29.2 26,7 8,5 51,6 29,2 0,85 0,3 0,01 0,06 -0,02 0
Switzerland _ _ _ _ _ 1,01 0,17 0,04 0,01 0
Netherlands 66.0 30,3 10,2 57,8 32,5 0,90 -0,04 -0,01 -0,03 -0,04
Denmark 38.9 32,9 9,5 51,1 36,6 0,77 0,15 -0,02 0,04 -0,1
Luxemburg 40.8 23,7 12,3 25,4 12,6 1,11 0,03 0,14 -0,01 0,05
Germany 60.8 35,6 11,2 53,2 35,9 1,02 0,17 0,07 0,07 0 0
Finland 27.4 35,8 7,3 74,7 50,2 0,91 0,31 0,03 0,02 0,17 0
France 56.3 30,5 11,9 59,7 29,1 1,05 0,04 0,05 -0,05 0,05 0
Portugal 48.1 39,7 7,5 70 35,6 0,83 0,18 0,13 0,02 0,15 0
Italy 58.2 30 23,1 84,3 37,4 0,97 0,28 0,24 0,1 0,42 0
Greece 58.4 43,3 12,5 68,2 33,8 0,89 0,03 0,12 -0,11 -0,28
Belgium 66.2 36,1 21,9 60,9 35,9 1,01 -0,03 -0,03 -0,05 0,03
United Kingdom 42.8 30,8 16 71,3 38,2 1,03 0,39 0,08 0,11 0,08 0
Ireland 39.0 28,8 29,7 79,7 27,9 1,12 0,38 0,18 0,08 0,05
Austria 61.8 36,4 28,4 53,3 38,9 1,11 0,14 0,06 0,04 0,01
Spain 40.0 31,6 9,9 75,4 41,2 0,98 0,3 0,13 0,08 -0,07
Norway __ _ _ _ _ _ _ _ _

8/2/2019 Equity in European Educational System
http://slidepdf.com/reader/full/equity-in-european-educational-system 125/151

8/2/2019 Equity in European Educational System
http://slidepdf.com/reader/full/equity-in-european-educational-system 126/151

8/2/2019 Equity in European Educational System
http://slidepdf.com/reader/full/equity-in-european-educational-system 127/151
127
Figure 7: Differences between the results of education and the educational processes
This second comparison Results – Processes is similar to the former. It is not favourable to
Belgium, Germany and The Netherlands ; Luxemburg, Greece and Italy can be added to this
first group. The group of countries where the results of education are less inequitable than the
processes is composed by more or less the same countries than in the first exercise : Spain,Ireland, Finland. Austria and United Kingdom take place here too.
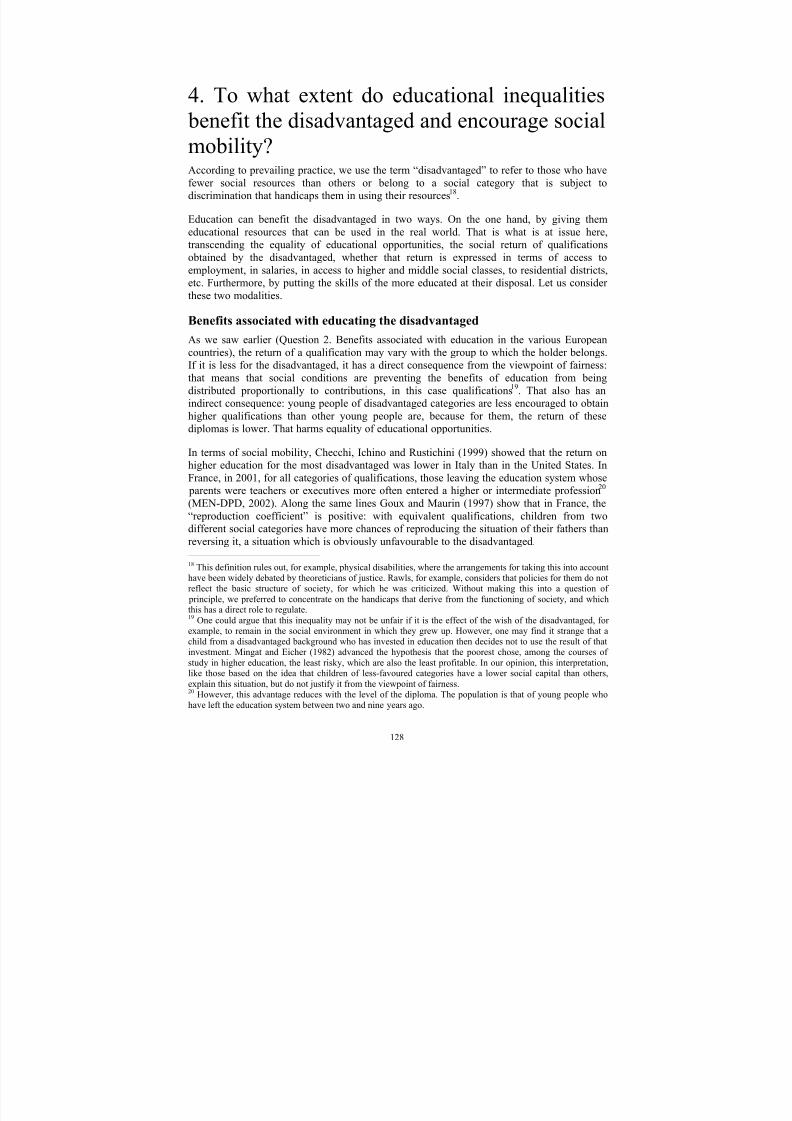
8/2/2019 Equity in European Educational System
http://slidepdf.com/reader/full/equity-in-european-educational-system 128/151
128
4. To what extent do educational inequalities
benefit the disadvantaged and encourage social
mobility?According to prevailing practice, we use the term “disadvantaged” to refer to those who have
fewer social resources than others or belong to a social category that is subject to
discrimination that handicaps them in using their resources18.
Education can benefit the disadvantaged in two ways. On the one hand, by giving them
educational resources that can be used in the real world. That is what is at issue here,
transcending the equality of educational opportunities, the social return of qualifications
obtained by the disadvantaged, whether that return is expressed in terms of access to
employment, in salaries, in access to higher and middle social classes, to residential districts,etc. Furthermore, by putting the skills of the more educated at their disposal. Let us consider
these two modalities.
Benefits associated with educating the disadvantaged
As we saw earlier (Question 2. Benefits associated with education in the various European
countries), the return of a qualification may vary with the group to which the holder belongs.
If it is less for the disadvantaged, it has a direct consequence from the viewpoint of fairness:
that means that social conditions are preventing the benefits of education from being
distributed proportionally to contributions, in this case qualifications19. That also has an
indirect consequence: young people of disadvantaged categories are less encouraged to obtain
higher qualifications than other young people are, because for them, the return of these
diplomas is lower. That harms equality of educational opportunities.
In terms of social mobility, Checchi, Ichino and Rustichini (1999) showed that the return on
higher education for the most disadvantaged was lower in Italy than in the United States. In
France, in 2001, for all categories of qualifications, those leaving the education system whose
parents were teachers or executives more often entered a higher or intermediate profession20
(MEN-DPD, 2002). Along the same lines Goux and Maurin (1997) show that in France, the
“reproduction coefficient” is positive: with equivalent qualifications, children from two
different social categories have more chances of reproducing the situation of their fathers than
reversing it, a situation which is obviously unfavourable to the disadvantaged.18 This definition rules out, for example, physical disabilities, where the arrangements for taking this into accounthave been widely debated by theoreticians of justice. Rawls, for example, considers that policies for them do notreflect the basic structure of society, for which he was criticized. Without making this into a question of
principle, we preferred to concentrate on the handicaps that derive from the functioning of society, and whichthis has a direct role to regulate.19
One could argue that this inequality may not be unfair if it is the effect of the wish of the disadvantaged, for example, to remain in the social environment in which they grew up. However, one may find it strange that achild from a disadvantaged background who has invested in education then decides not to use the result of thatinvestment. Mingat and Eicher (1982) advanced the hypothesis that the poorest chose, among the courses of
study in higher education, the least risky, which are also the least profitable. In our opinion, this interpretation,like those based on the idea that children of less-favoured categories have a lower social capital than others,
explain this situation, but do not justify it from the viewpoint of fairness.20 However, this advantage reduces with the level of the diploma. The population is that of young people whohave left the education system between two and nine years ago.

8/2/2019 Equity in European Educational System
http://slidepdf.com/reader/full/equity-in-european-educational-system 129/151
129
For inequalities in income associated with education, the results vary depending on the
country. Houle and Lémelin (2001) calculated that in Quebec, the return on education reduced
with the level of qualifications of the father. The review of the literature that they provided
with the results shows similar results in the United Kingdom, but the opposite in Greece,
Israel, France, and the United States, countries where the return of education increases with
social origin.
We only found internationally comparable data for one of the advantages associated with
education – access to a higher social category than that of one’s parents – and for three
countries: Spain, Italy and the United Kingdom. Taken from the European Community Household Panel , they reflect the current situation and social origin of individuals aged from
16 to 30 years in 1998, and provides information about the influence of the educational
system during the periods when that population was educated. It compares the social status of
these individuals according to whether the highest qualification that they obtained was a
higher education degree or the higher cycle of secondary education, or a qualification at a
lower level.
In these three countries, it is the United Kingdom where social mobility is greatest, whether
for the population as a whole, or for children of the disadvantaged classes. Nevertheless, it is
not in these countries that the contribution of education to this process is the highest.
For a young person belonging to a disadvantaged category, holding a higher education degree
increases the chances of belonging to a higher category than one’s parents do, and this applies
in the three countries. The increase is most marked in Italy: a young person in a
disadvantaged category has a 7 in 100 chance of belonging to a higher social category than his
parents if he has a low level of education, and a 40 out of 100 chance if he has a degree. The
degree multiplies his chances by 5.5, compared with 4.9 in Spain and only 1.4 in the United
Kingdom, where poorly educated young people are much more likely to be upwardly mobilethan in the other countries. That result, with regard to the respective positions of Italy and the
United Kingdom, is coherent with previous research (for example, Müller and Schavit, 1998).
However, this external benefit must be weighted by the internal equality (in the education
systems themselves) of chances: if children of manual workers have almost no chance of
entering higher education, the fact that the external benefit of this level of education is very
high for them does not mean that the benefit that they derive from education is very great.
One approach to measuring this benefit is to consider that it would be high in a country where
the following were observed simultaneously:
a strong link between social origin and level of education;
a direct link between low social origin and low social destination;
a strong link between education and social destination.
Which is where we get the idea that one can measure the benefits that the disadvantaged can
expect from education through the ratio of the third link to the first two.
The table 7 presents the increase in chances of being in a high position according to the
second term of the link (social destination or education) if we are in high position according
to the first term of the link (social origin or education.
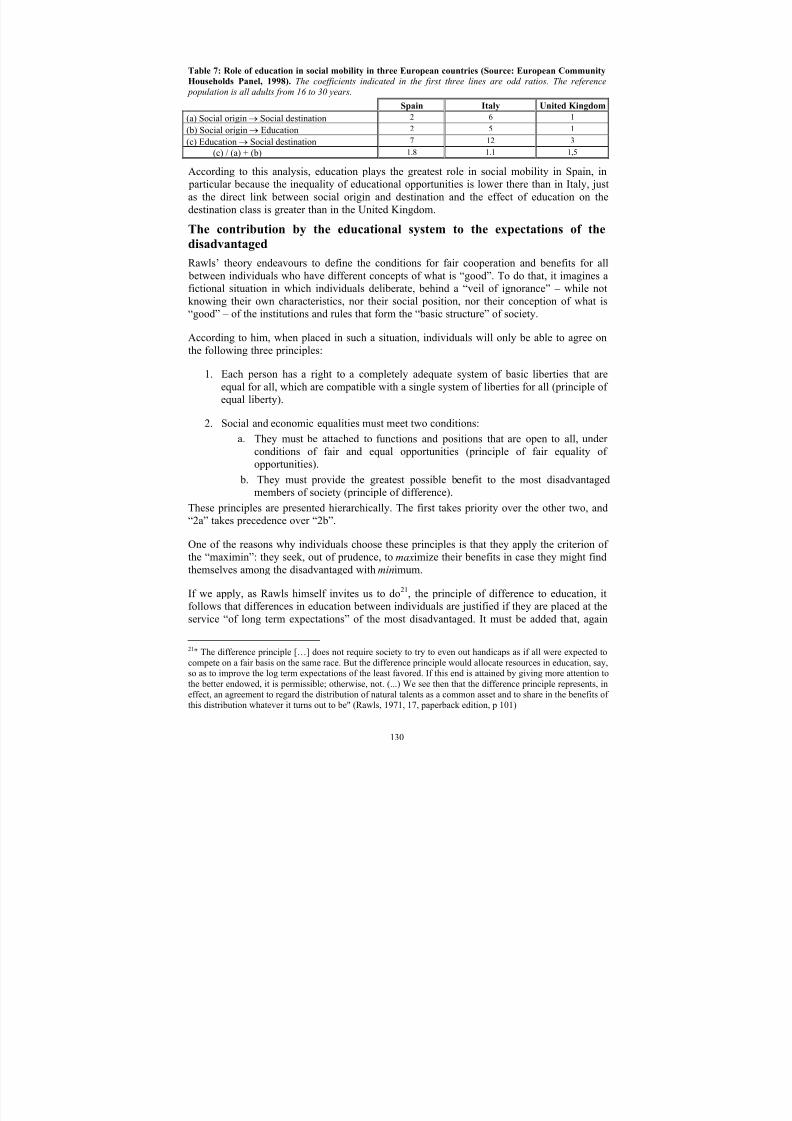
8/2/2019 Equity in European Educational System
http://slidepdf.com/reader/full/equity-in-european-educational-system 130/151
130
Table 7: Role of education in social mobility in three European countries (Source: European Community
Households Panel, 1998). The coefficients indicated in the first three lines are odd ratios. The reference population is all adults from 16 to 30 years.
Spain Italy United Kingdom
(a) Social origin→ Social destination 2 6 1
(b) Social origin→ Education 2 5 1
(c) Education→ Social destination 7 12 3
(c) / (a) + (b) 1.8 1.1 1,5
According to this analysis, education plays the greatest role in social mobility in Spain, in
particular because the inequality of educational opportunities is lower there than in Italy, just
as the direct link between social origin and destination and the effect of education on the
destination class is greater than in the United Kingdom.
The contribution by the educational system to the expectations of the
disadvantaged
Rawls’ theory endeavours to define the conditions for fair cooperation and benefits for all
between individuals who have different concepts of what is “good”. To do that, it imagines afictional situation in which individuals deliberate, behind a “veil of ignorance” – while not
knowing their own characteristics, nor their social position, nor their conception of what is
“good” – of the institutions and rules that form the “basic structure” of society.
According to him, when placed in such a situation, individuals will only be able to agree on
the following three principles:
1. Each person has a right to a completely adequate system of basic liberties that are
equal for all, which are compatible with a single system of liberties for all (principle of
equal liberty).
2. Social and economic equalities must meet two conditions:
a. They must be attached to functions and positions that are open to all, under
conditions of fair and equal opportunities (principle of fair equality of
opportunities).
b. They must provide the greatest possible benefit to the most disadvantaged
members of society (principle of difference).
These principles are presented hierarchically. The first takes priority over the other two, and
“2a” takes precedence over “2b”.
One of the reasons why individuals choose these principles is that they apply the criterion of the “maximin”: they seek, out of prudence, to maximize their benefits in case they might find
themselves among the disadvantaged with minimum.
If we apply, as Rawls himself invites us to do21, the principle of difference to education, it
follows that differences in education between individuals are justified if they are placed at the
service “of long term expectations” of the most disadvantaged. It must be added that, again
21" The difference principle […] does not require society to try to even out handicaps as if all were expected to
compete on a fair basis on the same race. But the difference principle would allocate resources in education, say,so as to improve the log term expectations of the least favored. If this end is attained by giving more attention to
the better endowed, it is permissible; otherwise, not. (...) We see then that the difference principle represents, ineffect, an agreement to regard the distribution of natural talents as a common asset and to share in the benefits of this distribution whatever it turns out to be" (Rawls, 1971, 17, paperback edition, p 101)

8/2/2019 Equity in European Educational System
http://slidepdf.com/reader/full/equity-in-european-educational-system 131/151

8/2/2019 Equity in European Educational System
http://slidepdf.com/reader/full/equity-in-european-educational-system 132/151
132
Initially, we tried to measure whether, in certain countries more than in others, professional
activity by the most educated was to the benefit of the poorest. This indicator relies on the
following principle: all other things being equal, in particular the inequality of equal
opportunities, an education system is fairer if the most qualified put the skills that they have
acquired at the service of the most disadvantaged. However, this attempt failed. On the one
hand, collecting relevant data appeared to be a job that was beyond the possibilities of this project, and on the other hand, this venture comes up against conceptual problems, related to
the fact that, while there are very clear-cut cases, where one could decide to limit an indicator,
and which generally relate to certain “professions” (lawyers, architects, doctors, teachers),
others are less clear: a corporate lawyer who works for a car manufacturer is also working for
that manufacturer’s poorest customers. More generally, anyone working in a business that
contributes to growth could claim, admittedly with varying degrees of justification, that the
fruits of that growth always spread in the end, and that therefore his work benefits the most
disadvantaged.
We also took an interest in living side by side: if the most educated people live in the same
districts as the poorest, they show more of their shared humanity, they raise the aspirations of young people in those districts, and are more equal. In France, for example, the population
census allows a calculation of segregation within zones of about 2000 inhabitants, and it is
probable that the same applies in many European countries, but we were unable to complete
this job in the context of this project. So we are interested in two aspects of living side by side
for which data is more easily accessible23: the fact of the “most educated” and
“disadvantaged” having children together, and the fact of sending their children to the same
schools. The results are very polarized from a geographical viewpoint. The most educated live
with the most disadvantaged more in Ireland, Norway and Switzerland) than in Portugal,
Austria and Luxemburg.
We also considered the values of the most educated. The idea is that the more the mosteducated people claim to share the values of solidarity, the more they should support
solidarity mechanisms or participate in solidarity actions. For example, gifted young girls
from poor backgrounds who received grants to attend a prestigious “college” in the USA, and
whose discourse demonstrates an intention to become “agents of change and lawyers serving
the disadvantaged” are evidence of a fairer education system than if they had just declared
their satisfaction at having the hope of joining the upper classes (Marantz-Cohen, 1998).
To do this, we used data drawn from the European Value Survey (EVS) of 1999. This reveals
a discrepancy between declared values and practices, at least those which are measured by the
EVS. We used three criteria showing acceptance of values of solidarity: considering
“eliminating the serious inequalities of income between citizens” as an importantcharacteristic of a fair society; considering “guaranteeing that the basic requirements are
satisfied for all” as an important characteristic of a fair society; considering that social
injustice explains the presence of the poor.
From the values point of view, France, Greece and Spain are in the leading group, while
Austria, Finland and Luxemburg are among the back markers. On the other hand, when it is a
matter of finding out whether the most educated are members of associations promoting
solidarity, the highest proportions are to be found in The Netherlands, Sweden and
Luxemburg, and the lowest are in Germany, Spain and Greece.
and Social Research Institute, Dublin. Présentation au colloque du réseau européen Changequal. Paris, 2004.23 In the PISA data, which means that it relates to parents of 15 year-old young people.

8/2/2019 Equity in European Educational System
http://slidepdf.com/reader/full/equity-in-european-educational-system 133/151
133
One possible interpretation is that in the countries that are fairer according to values than
according to their practices, subscribing to the values of solidarity would be mainly rhetoric.
Another possible interpretation is that in these countries, there is more reliance on action by
the State, possibly guided by the social movement, rather than on one’s own practice and
behaviour to move towards a fairer society.
The indirect effects involve financial redistribution mechanisms24. We used an indicator on
the measurement in which, in each country, social transfers reduce the proportion of people
on low incomes – supposing that the most educated are among the contributors to these
transfers, because they have the best salaries. The effect of such transfers is highest in
Denmark, the Netherlands, and Luxembourg, while in Greece, Italy, and Portugal, it is lower.
The classification of the countries on these various effects is shown in Table 8.
The table 8 synthesises the contribution of the educational system to the situation of the most
disadvantaged. The yellow indicates a more favourable situation towards the most
disadvantaged than in the other countries; the pink a less favourable situation. The Green
refers to an intermediary situation and blank boxes show where date is not available.
To summarize and than, try to catch the contribution of the educational system to the situation
of the most disadvantaged, a score has been calculated for each country, depending on the
number of times where indices were high (1), moderate (2) or low (3). The lower the score,
the greater is the contribution of the educational system to the situation of the most
disadvantaged.
Obviously, these scores have to be taken not as genuine measurements that enable countries
to be ranked, but as a convenient method of aggregating measurements that are, on the one
hand, imperfect and, on the other hand, partial according to two senses of the term: first of all,
for certain countries, not all the data is available (e.g. there are only two columns for Norway); then, data shown here only partially represents the dimensions that would have to
have been recorded to really measure the effects of relations between the educated and
disadvantaged. For example, we have no measurement of the feeling of superiority that may
affect the former in relation to the latter, or the feeling of inferiority that may affect the latter
in relation to the former and from which the latter might suffer. As we have seen, we have no
measurement of urban segregation, and neither do we have any measurement of the political
proximity of the former and the latter, etc.
The ranking we obtained shows that Sweden, The Netherlands, France, Belgium and
Denmark serve the expectations of the most disadvantaged more particularly than
Luxembourg, Germany, Greece and Portugal.
24 We decided not to consider the “fiscal rate of return” of education as such (see the discussion of this indicator in the technical annex D.2.1 : http://www.ulg.ac.be/pedaexpe/equite/ ).

8/2/2019 Equity in European Educational System
http://slidepdf.com/reader/full/equity-in-european-educational-system 134/151
Table 8: Contribution of the educational system to the situation of the poorest people25
Skills of the weakest
Contribution to the
economical growth (1990-97
vs 1980-89)
Social transfers To live together (2000)
Mean of the bottom
deciles in mathematics
and reading literacy
Contribution of education to
GDP per inhabitant growth
from one decade to another
Percentage of poor
people decrease by
social transfers
% of young people whom
arent is very educated and the
other disadvantaged
Extra chances to a
advantaged school w
parents are edu
Countries
(1) (2) (3) (4) (5)
Sweden 370 0,42 _ 29,00 1,10
Netherlands _ 0,43 50,00 22,00
France 372 0,65 41,00 21,00 1,30
Belgium 404 0,45 39,00 25,00 1,30
Denmark 384 0,20 63,00 25,00 1,10
Ireland 377 0,54 46,00 27,00 1,10Sain 334 0,90 31,00 14,00 1,40
Finland 412 0,44 _ 17,00 1,20
United Kingdom 382 0,44 41,00 21,00 1,20
Switzerland 357 0,26 _ 27,00 1,20
Norway 350 0,27 _ 17,00 1,10
Italy 335 0,84 10,00 16,00 1,40
Austria 387 0,31 46,00 16,00 1,30
Luxemburg 298 _ 50,00 9,00 1,20
Germany 342 _ 30,00 18,00 1,20
Greece 323 0,57 8,00 19,00 1,30
Portugal 316 0,32 19,00 16,00 1,30
25 The table is based on the data presented in indicator D.2.1.

8/2/2019 Equity in European Educational System
http://slidepdf.com/reader/full/equity-in-european-educational-system 135/151
135
The figure 8 is based on the ranking presented in table 8. It concerns only the EU countries
(EU-15, 2001) for which data were available. We did not take care of the ranking of Norway
and Switzerland to build this map. These two countries are not presented in colour.
The countries belonging to the group of the most equitable countries are the countries which
are on the first four ranks; the countries considered as the less equitable countries are the onesituated on the last four ranks. However, a rank could be occupied by several countries. If it
was the case, the number of equitable or less equitable countries could be higher than 4.
Figure 8: Contribution of the educational system to the situation of the most disadvantaged
***

8/2/2019 Equity in European Educational System
http://slidepdf.com/reader/full/equity-in-european-educational-system 136/151
136
Conclusions
The approach that we have proposed in the third part of this report relied mainly on four
questions:
1. Considering that the greater the benefits linked to education, the more important it isthat education should be shared out fairly, what are the benefits associated with
education in the countries of Europe?
2. What is the importance of inequalities of education? These inequalities are measured according to three principles of justice: inequalities between individuals which do not hinder social cooperation; inequalities between groups which do not contradict the
principle of equal opportunities; the lowest possible proportion of individuals without the minimum skills to lead a worthy and responsible life in modern society;
3. Considering that the more inequalities arise from unfair sharing-out of educational
resources, the more unfair they are, what is the role of the education system itself in
creating these inequalities?4. Starting from the idea that the inequalities are less unfair if they are turned to the
advantage of the disadvantaged, to what extent are the inequalities of education
turned to the benefit of the disadvantaged?
We will check here briefly the answer given to this four question in part 3. First, let us look if
the European countries are at a similar position (a favourable one in yellow, an intermediary
in green and in unfavourable one in pink) throughout the context, the processes and the
internal results ?
The table 9 presents the position of each country for the different ranking made in part 3. The
countries are in pink, green or yellow depending on their unfavourable, intermediary or
favourable position.
Table 9 : Synthesis of the different positions occupied by the EU countries for context, processes and
internal results
Context Processes Internal results
Belgium 9 11 16
Denmark 2 4 4
Germany 7 6 15
Greece 9 11 14
Spain 15 15 4
France 9 8 8
Ireland 7 13 3
Italy 15 9 13Luxemburg 15 5 17
The Netherlands 3 3 -
Austria 9 16 7
Portugal 14 9 10
Finland 4 6 1
Sweden 4 1 2
United Kingdom 13 13 10
Some countries are each time at the intermediary position. That is the case of Greece, France
and Portugal.
Only Sweden presents a favourable situation from the context point of view, the school
processes and the internal results. Some are in the group of countries where inequalities of
8/2/2019 Equity in European Educational System
http://slidepdf.com/reader/full/equity-in-european-educational-system 137/151
137
education are the less important for at least two criteria, like Finland, The Netherlands and
Denmark.
Two countries present a unfavourable situation for 2 criteria : Spain, where the context and
the processes seem to be particularly unfair and Luxemburg where the context is more
unfavourable than in the other countries.
And finally, a group of countries are situated sometimes negatively, sometimes positively and
even in a intermediary position.
A general overview of all the figure presented in part 3 allows a synthesis of the equity in the
European educational systems.
The figure 8 presents 5 of the 7 figures build in part 3 (figures 1, 2, 6, 7 and 8). The countries
are in a particular colour, depending on the more equitable, the intermediary or the less
equitable position they occupy.

8/2/2019 Equity in European Educational System
http://slidepdf.com/reader/full/equity-in-european-educational-system 138/151

8/2/2019 Equity in European Educational System
http://slidepdf.com/reader/full/equity-in-european-educational-system 139/151
139
Three groups of countries appear from this general view of all the rankings obtained at the
end of the four questions.
This first group includes the countries where inequalities of education seem to be the most
important : Germany, Belgium, Greece and, to a lesser extent, The Netherlands. Germany
appears, for each question, in pink − the colour of an unfair or less fair situation. Belgium and
Greece present important inequalities of results. Moreover, the Belgian and Dutch educationalsystems seem to play an amplifying role of contextual inequalities.
The second group is composed by the countries which, for at least three aspects, are in the
intermediary position : Italy, France, United Kingdom and, to a lesser extent, Portugal and
Denmark. However, Denmark is one of the countries where inequalities of results are the less
important and it is also one of the countries where benefits related to education are not so
strong.
Finally, a third group of countries emerges. This group includes the countries which seems the
more equitable ones, for each or at least three aspects : Sweden − which is in Yellow for each
question −, Ireland, Spain and Finland.
Throughout all the analyses presented in the report, we can see that, in some countries, theinequalities in education are homogenous, in that they are pronounced (Germany and to a
lesser extent Belgium) or small (Finland, Sweden, and to a less marked extent, Spain and
Ireland) according to the three criteria at the same time: inequalities between individuals,
between groups, proportion below the threshold. However, it also happens that the three
criteria give divergent results, which shows that it actually concerns different dimensions:
In general, we observe that inequalities can be low in countries where education has
pronounced external effects, which is the case for Ireland, while they can be relatively low in
countries where the effects of education are low. Therefore, our data do not confirm the
premise according to which inequalities are low in countries where education has few external
rewards.Inequalities of results have been considered through the cognitive skills and the school
careers. A quantitative measure of three of the main conceptions of equity has been produced,
by exploiting the distribution of levels of learnings in mathematics, reading and sciences and
variables as gender or socioprofessional status of parents. Strong inequalities appear from this
comparison : important gaps of achievement are observed between the countries.
Analysis of the education processes enables us to have an idea of the importance of the
systems themselves in the creation of inequalities. The chosen approach has been to calculate
a score that measures three types of inequality in the distribution of resources: disparities
between individuals, inequalities between groups, resources allocated to the weakest pupils.
The resources taken into account are spending per student, class sizes, teacher-student ratios,
the disciplinary climate, the support received from teachers, and the absence of academic or social segregation. According to this approach, the more egalitarian system is Sweden and the
less one is Austria.
One could consider using other indicators than those presented here. Above all, one could
conceive other methods of reading these indicators, for example more focused on
consistencies, whereas we opted for a comparative and distinctive approach, pursuing a single
principle of equity in the labyrinth of indicators, comparing equity, effectiveness and
efficiency, etc. Two overall results appear to us to emerge from this analysis: there are
definite differences in equity between education systems; there are definitely some education
systems that seem more (or less) fair than others on a large majority of the criteria, but for
many the judgement of their fairness varies, sometimes considerably, depending on how weread the data.

8/2/2019 Equity in European Educational System
http://slidepdf.com/reader/full/equity-in-european-educational-system 140/151
140
The next stepsThe lack of available data prevented us from calculating indicators that we nevertheless
considered important. Therefore, one must consider these deficiencies not as a lack of interest
by the authors, but as evidence of a genuine lack of available or useable data.The most cruelly lacking data, in our opinion, could be obtained from the following
information systems:
• A poll on judgments and criteria of fairness with regard to education on the
scale of the European Union taken among citizens, of the type that Hutmacher
(2001) presented for Switzerland ;
• A test which would enable to check wether, when young Europeans leave
initial education, they possess the minimum skills to live an independent and
responsible life. In the absence of such a test, we had to settle for measuring,
using PISA, the proportion of 15 years-old student who had skills below a given
threshold – but some of these students will remain in the system and acquireadditional skills;
• A system allowing to measure and compare, on the same scale, the skills of
students who leave the education system earlier and latest. Here too, we had to
settle for measuring the discrepancy in performance between the poorest and best
performers at the age of 15, using this as an approximate predictor for that gap at
the time when they will all leave initial education;
• A test that would enable to measure the basic skills of adults who have left
the education system, in relation to their personal characteristics26 ; in not yet
investigated field27
• A system allowing to measure the equality of access and results, in terms of
skills and personal well-being at the end of a continuing training, like Baye,
Mainguet et Mossoux (2005) suggest it.
We were missing other data :
• On the inequalities of economic, physical and social insecurity, to the extend
that in certain countries, gains in security of the working classes encouraged the
reduction of social inequalities (Shavit and Blossfeld, 1993).
• On social mobility : the education is indeed one of the factors allowing the
access to a better social position that the one of parents.
• The question of the equity is asked to the extend where education leads to acertain number of advantages. If its market advantages (salary, employment, ..)
are well documented, its non-market advantages are not so much documented.
We have not found international comparisons on the effect of the education on
health, work conditions, satisfaction at work, the conjugality, for instance.
26 Such a type of test is currently under way. This is the Adult Literacy and Lifeskills survey (Statistique Canada,
Educational Testing Service, OECD), which measures adults’skills in literacy, numeracy and problem-solving,in association with individual, economic and social characteristics of respondents, but few European countries
have found the sources of funding to take part so far. OECE is now examining the possibility to organize anInternational program for adults skills achievement (PIAAC).27 As far instance the field of foreign languages, because it is an important issue inside the European Union.
8/2/2019 Equity in European Educational System
http://slidepdf.com/reader/full/equity-in-european-educational-system 141/151

8/2/2019 Equity in European Educational System
http://slidepdf.com/reader/full/equity-in-european-educational-system 142/151

8/2/2019 Equity in European Educational System
http://slidepdf.com/reader/full/equity-in-european-educational-system 143/151
References

8/2/2019 Equity in European Educational System
http://slidepdf.com/reader/full/equity-in-european-educational-system 144/151

8/2/2019 Equity in European Educational System
http://slidepdf.com/reader/full/equity-in-european-educational-system 145/151

8/2/2019 Equity in European Educational System
http://slidepdf.com/reader/full/equity-in-european-educational-system 146/151
8/2/2019 Equity in European Educational System
http://slidepdf.com/reader/full/equity-in-european-educational-system 147/151

8/2/2019 Equity in European Educational System
http://slidepdf.com/reader/full/equity-in-european-educational-system 148/151
148
5-29.
Institut National des Statistiques (2001). Enquête socioéconomique générale 2001. Bruxelles :Ministère des Affaires économiques.
Kymlicka, W. (1999). Les théories de la justice. Paris: La Découverte. (traduction française
de Contemporary Political Philosophy, an introduction. Oxford: Oxford University Press,1992).
Lémelin, C., Houlle, D. (2001). Rendements de l’investissement en capital humain et origine sociale. Multigr .. Université du Québec.
Lévy, R., Joye, D., Guye, O., Kaufmann, V.(1997). Tous égaux? De la stratification auxreprésentations. Zürich : Seismo.
Mac Mahon, W. (1997). Recent advance in measuring the social and individual benefit of education. International Journal of Educational Research, 27(6).
Marantz-Cohen, R. (1998). Class consciousness and its consequences : the impact of an elite
education on mature working class women. American Educational Research Journal,35(3).
Marshall, G., Swift, A., Routh, Burgoyne, C.(1999), What is and what ought to be ? Popular beliefs about distributive justice in thirteen countries, European Sociological Review, 15(4), 349-367.
Merle, P. (2001). Les droits des élèves, droits formels et quotidien scolaire des élèves dansl’institution. Revue française de sociologie., 42-1, 81-115.
Merle, P. (2002). L’humiliation des élèves dans l’institution scolaire. Revue française de Pédagogie, 139.
Merle, P. (2001). Les droits des élèves, droits formels et quotidien scolaire des élèves dansl'institution. Revue française de Sociologie., 42-1, 81-115.
Meuret, D., (Ed.), (1999a). La justice du système éducatif . Bruxelles: De Boeck Université.
Meuret, D. (1999b). Rawls, l’éducation et l’égalité des chances. In D. Meuret, (Ed.). La justice du système éducatif . Bruxelles: De Boeck Université.
Meuret, D. (2000). Un canevas d’indicateurs pour comparer l’équité des systèmes éducatifs,mimeo, Dijon : IREDU.
Meuret, D. (2001a). School Equity according to the Theories of Justice. In W. Hutmacher, D.Cochrane, N. Bottani (Eds) In Pursuit of Equity in Education. Dordrecht: Kluwer
Academic Publishers.Meuret, D. (2001b). A system of equity indicators for educational systems. In W. Hutmacher,
D. Cochrane, N. Bottani (Eds) In Pursuit of Equity in Education. Dordrecht: Kluwer Academic Publishers.
Miller, T.C. (1977). Conceptualizing Inequality. Evaluation Studies Review Annual , p.334-349.
Mingat, A.,Eicher, J.C. (1982). Higher education and employment market in France. Higher Education, 11(2).
Mingat, A., Suchaut, B. (2000). Les systèmes éducatifs africains. Bruxelles: De Boeck.
Ministère de l’Education Nationale-DPD (2002). L’état de l’Ecole, 12. Paris. Monseur, C., Demeuse, M. (2001). Gérer l’hétérogénéité des élèves. Méthodes de

8/2/2019 Equity in European Educational System
http://slidepdf.com/reader/full/equity-in-european-educational-system 149/151
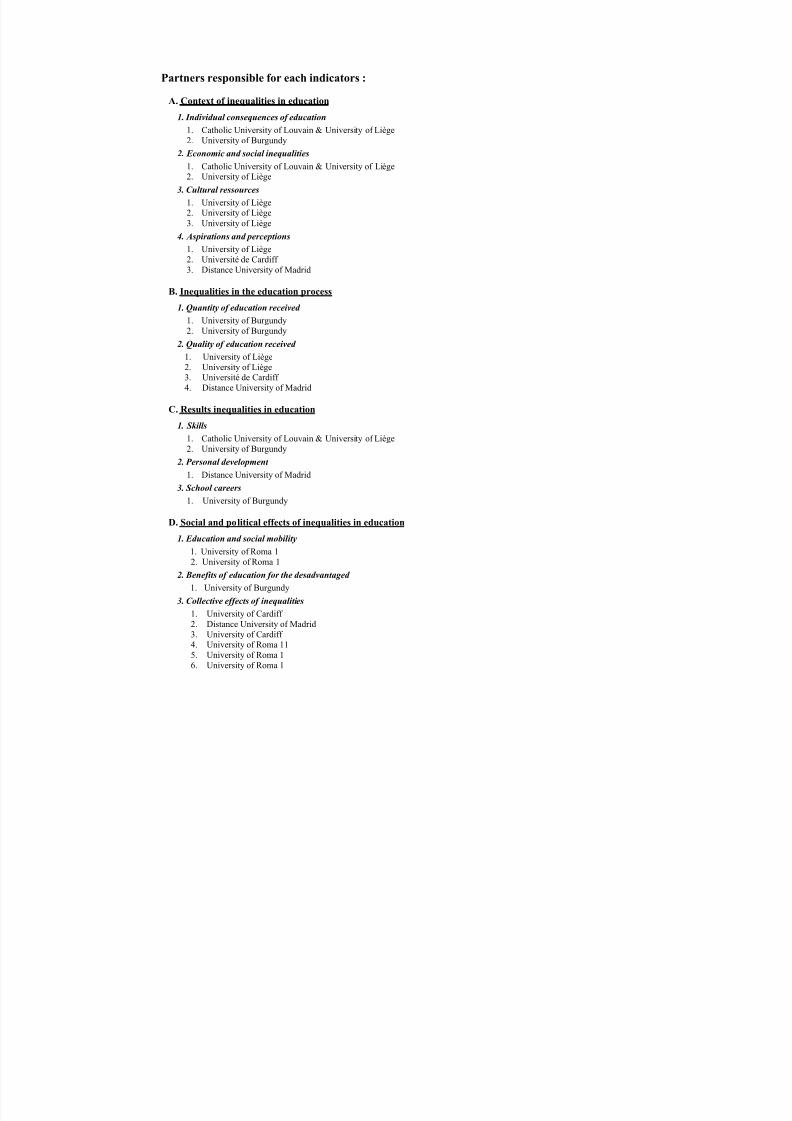
8/2/2019 Equity in European Educational System
http://slidepdf.com/reader/full/equity-in-european-educational-system 150/151
Partners responsible for each indicators :
A. Context of inequalities in education
1. Individual consequences of education
1. Catholic University of Louvain & University of Liège2. University of Burgundy
2. Economic and social inequalities
1. Catholic University of Louvain & University of Liège2. University of Liège
3. Cultural ressources
1. University of Liège2. University of Liège3. University of Liège
4. Aspirations and perceptions
1. University of Liège2. Université de Cardiff
3. Distance University of Madrid
B. Inequalities in the education process
1. Quantity of education received
1. University of Burgundy2. University of Burgundy
2. Quality of education received
1. University of Liège2. University of Liège3. Université de Cardiff 4. Distance University of Madrid
C. Results inequalities in education 1. Skills
1. Catholic University of Louvain & University of Liège2. University of Burgundy
2. Personal development 1. Distance University of Madrid
3. School careers
1. University of Burgundy
D. Social and political effects of inequalities in education
1. Education and social mobility
1. University of Roma 12. University of Roma 1
2. Benefits of education for the desadvantaged
1. University of Burgundy
3. Collective effects of inequalities
1. University of Cardiff 2. Distance University of Madrid3. University of Cardiff 4. University of Roma 115. University of Roma 16. University of Roma 1

8/2/2019 Equity in European Educational System
http://slidepdf.com/reader/full/equity-in-european-educational-system 151/151
Six university team collaborated to prepare this report
The project was coordinated by the University of Liège, Service de Pédagogie expérimentale (SPE)
Ariane BAYE [email protected] Marc DEMEUSE
Julien NICAISE
Anne MATOUL
Marie-Hélène STRAETEN [email protected]
Five other partner teams contributed to this project
For the University of Burgondy, IREDU, Institut de Recherche sur l’Éducation - Dijon
Denis MEURET
Sophie MORLAIX
For the University of Roma « La Sapienza », Dipartimento innovazione e società (DieS)
Luciano BENADUSI
Orazio GIANCOLA
Giuseppe R ICOTTA
Giuseppe BOVE (Université de Rome III)
For the University of Cardiff, School of Social Science
Stephen GORARD
Emma SMITH