equity in educational outcomes: moving beyond access · equity in educational outcomes: moving...
TRANSCRIPT

Equity in Educational Outcomes: Moving Beyond Access
Report of the Equity Analysis Project Team Fall, 2006

2
Table of Contents Introduction............................................................................................................................. 3 Equity in Educational Outcomes; Moving Beyond Access ..................................................... 4 The Equity Analysis Project at UW-Green Bay ...................................................................... 5 Equity Define .......................................................................................................................... 6 The Four Dimensions of Equity .............................................................................................. 6 The Dashboard Analogy......................................................................................................... 7 Caveats and Disclaimers........................................................................................................ 7 Equity Indicators Summary..................................................................................................... 8 Access Indicators ................................................................................................................... 8 A1 Institutional Access: Application, Admission and Enrollment ............................................ 8 A2 Access to Majors............................................................................................................... 12 A3 Performance in Gateway Courses .................................................................................... 12 Retention Indicators................................................................................................................ 14
R1 Retention to the Second Year.............................................................................. 14 R2 Graduation in Six Years....................................................................................... 16
Excellence Indicators.............................................................................................................. 18 E1 Academic Achievement: Cumulative GPA........................................................... 18 E2 Student Scholarship............................................................................................. 19
Institutional Receptivity Indicators .......................................................................................... 20 IR1 Race/Ethnic Composition of the Workforce…………………………………………20 IR2 Perceptions of Classroom Climate…………………………………………………...21 Conclusions, Recommendations, and Further Analysis ......................................................... 22

3
Introduction In response to a charge by Provost Sue Hammersmith, an Equity Analysis Project Team was convened in the Spring of 2006 to evaluate equity of educational outcomes for underrepresented students across four dimensions of equity: access, retention, excellence and institutional receptivity. The team was substantially guided in its approach to this task by the work of Dr. Estela Mara Bensimon and the Equity Scorecard Project at the USC Center for Urban Education, as well as the UW-System pilot project on this same topic that is simultaneously ongoing at selected UW campuses. The following report summarizes the equity indicators identified by the task force, current baseline data on each indicator, and the equity gaps between students of color and white students. The report is intended to generate a campus-wide dialogue, inform institutional planning, and motivate action to redress the inequities. This report was presented to the Chancellor’s Cabinet on November 28, 2006, and to the Chancellor’s Advisory Council on Diversity on December 4, 2006. It will be shared widely across the campus in the winter and spring of 2007. Even as the report is being shared, there is progress to report on actions that are already being taken in response to its findings:
• Continuing efforts to build upon the strong progress already being made to diversify the faculty and staff.
• A refocusing of multicultural recruitment efforts on local and regional markets in Green Bay and Northeast Wisconsin
• Purposeful efforts to increase the number of completed applications from students of color. • A pilot program of freshman seminars involving lower level gateway general education courses • The funding of two new faculty development grants to incorporate more active learning and student
engagement in gateway courses It is the hope of the Equity Analysis Project Team that this report will prompt a robust dialogue across campus about equity in educational outcomes for all students, and that these fledging efforts to address equity gaps will become the building blocks of a long term institutional commitment to this challenge.

4
Equity in Educational Outcomes: Moving Beyond Access 2006-07 begins the nineteenth consecutive year that UW-Green Bay has been actively engaged in planning, implementing and assessing goals and objectives related to diversity. Guided first by Design for Diversity (1988-1998) and subsequently by Plan 2008 (1998-2008), the campus has sought to increase the enrollment of students of color, address persistent gaps in the retention and graduation rates of underrepresented students, and build partnerships with K-12 schools and communities of color to broaden the educational pipeline and prepare ever more students from diverse backgrounds for participation in higher education. A primary goal of the past two decades has been access: increasing the numerical representation of students of color. UWGB has made uneven but overall steady progress in this regard. With 6.9% students of color, the freshman class of 2006 is the most diverse freshman class in the university’s history, and the total enrollment of undergraduate students of color has climbed from 167 in 1988 (3.3% of total) to 359 in 2006. The campus community and the Admissions Office in particular are to be commended for the sustained effort that has resulted in this success. There have been many other notable accomplishments in the areas of precollege programs, curriculum development, and workforce diversity, but no benchmark has been as closely tracked and regularly reported as enrollment. This is not to suggest that the campus has focused myopically on a single goal, or even on the wrong goal. Indeed, increasing the enrollment of students of color to numbers approaching a “critical mass” has been vital to the achievement of the larger goal of helping all UWGB students develop the multicultural knowledge, skills and competencies needed to interact productively and respectfully with people of different backgrounds. While increasing access for underserved and underrepresented students must continue to be a campus goal, it is time to begin to look at success through a different lens. In recent years, the national focus on diversity in higher education has begun to shift. Led by such organizations as the Association of American Colleges and Universities (AAC&U) and the Center for Urban Education (CUE) at the University of Southern California, attention has been refocused from enrolling ever more students of color to achieving equity in education outcomes for historically underrepresented students. This emerging focus emphasizes the connections between diversity and quality initiatives, appeals to the almost irrefutable notion of educational equity as a desirable institutional value, and stresses institutional accountability for differences in outcomes and performance, rather than attributing those differences exclusively to student characteristics and attributes. To paraphrase Edgar F. Beckham, senior fellow at AAC&U and emeritus dean of the college at Wesleyan University, if the primary question has been “How much diversity do you have?” the emerging question must be “How are your “diversity” students doing relative to other students?”. Only when we know this can we move to the most important question; “How intentionally are you using diversity as an educational resource to benefit all students?” (Beckham, E., Diversity at the Crossroads: Mapping Our Work Years Ahead) UW-Green Bay has enthusiastically engaged this national dialogue locally by initiating the Equity Analysis Project.
5
The Equity Analysis Project at UW-Green Bay The notion of equity as a focus for campus diversity efforts had its origins at a UWS-sponsored conference on national best practices in retention of students of color, held in Oconomowoc, WI in the fall of 2004. A presentation on the Equity Scorecard Project by Dr. Estela Mara Bensimon from the University of Southern California Center for Urban Education captivated the audience, and prompted the UW System to contract with USC to pilot the project at several campuses in the UW System. Originally selected as one of the pilot campuses, UWGB eventually withdrew from the UWS project to pursue equity analysis independently in a more expedited and campus-specific way. The members of the Equity Analysis Team included: Sue Hammersmith, Provost and Vice Chancellor for Academic Affairs Regan A.R. Gurung, Associate Dean, Liberal Arts and Sciences Michael Marinetti, Assistant Dean, Graduate and Professional Studies Debbie Furlong, Director of Institutional Research Michael Stearney, Assistant Dean for Enrollment and Academic Services, and M/D Coordinator The team met monthly throughout the spring and summer of 2006. Team members familiarized themselves with the literature on equity and diversity, and evaluated a significant volume of campus-specific data related to the primary dimensions of equity (access, excellence, retention and receptivity). The team also conducted a site visit at Madison Area Technical College, a school that adopted the Equity Scorecard in 2002. After much deliberation, the team identified nine key equity indicators which, taken collectively, represent the status of underrepresented students at UWGB on basic educational outcomes. The indicators are presented in this report as a foundation for a campus-wide discussion about what purposeful action steps might be taken to address inequities in educational outcomes. The work of the UWGB Equity Analysis Team was significantly influenced by the work of Dr. Estela Mara Bensimon and the Equity Scorecard Project at the USC Center for Urban Education. The campus team’s approach to equity research was profoundly shaped by the many articles, publications and presentations about the Equity Scorecard. The team has organized its findings under the same domains of equity (access, retention, excellence and receptivity) so that UWGB’s findings will be consistent in format with those of the UWS pilot schools project. The Equity Analysis Team gratefully acknowledges the contribution of Dr. Bensimon and her collaborators at CUE to this effort.

6
Equity Defined Equity in educational outcomes is achieved when students of color succeed in any of a variety of measures relative to their representation on campus. (Bauman, Bustillos, Bensimon, Brown, & Bartee, Achieving Equitable Educational Outcomes with All Students: the Institution’s Roles and Responsibilities, Association of American Colleges and Universities, 2005, p. 27) For example, educational equity would be achieved when students of color achieve grades of C or better in “gateway” courses at the same rate as majority students, relative to their representation on campus. Another example might be representation in honoraries. Thus, if students of color comprise 2% of the membership of Phi Kappa Phi, but 8% of the student population, there is inequity of representation of students of color in the honorary. Equity would be achieved when 8% of Phi Kappa Phi members are students of color. Four Dimensions of Equity There are any number of educational outcomes for which equity can be assessed. Using the model established by USC CUE, equity indicators are grouped into four categories. ACCESS indicators refer to equity of access to “programs and resources than can significantly improve life opportunities for underrepresented students.” (Bauman et al, p. 20) These include but are not limited to access to the institution, to programs of study, and to internships and independent studies. RETENTION indicators measure equity with respect to “continued attendance from one year to the next, through degree completion.” (Bauman et al, p. 21) Retention indicators might include retention at the institution, retention in academic programs, and degree completion rates. EXCELLENCE indicators are “measurements of achievement for historically underrepresented students.” (Bauman et al, p. 22) These include such measures as completion rates in highly competitive programs and the number and percent of students who graduate with honors. INSTITUTIONAL RECEPTIVITY indicators are “measures of institutional support that are influential in creating affirming environments for historically underrepresented students.” (Bauman et al, p. 22) Receptivity indicators include such measures as the racial/ethnic composition of the faculty and staff relative to the student body and the perceptions of classroom and institutional climate as measured by campus and/or national surveys.

7
The Dashboard Analogy The metaphor of a dashboard is helpful in conceptualizing the initial efforts of the Equity Analysis Project. The dashboard of an automobile provides a series of instruments that allows a driver to assess the functioning of the vehicle at a glance. Engine temperature, battery charge, oil pressure, etc can all be readily monitored, and indicator lights and gauges can prompt the need for a closer look into potential problems or irregularities. In much the same way, the Equity Analysis indicators can be used to assess the functioning of the institution with regard to the four primary dimensions of equity, and can suggest questions for deeper research and analysis into causes and remedies. The dashboard metaphor is also appropriate because it distinguishes indicators from the causes of and remedies for potential problems. If, for example, the oil pressure light on the dashboard comes on, this tells the driver nothing about either the cause of the problem (Leak? Oil pump failure? Something else?), or how to fix it (Add oil? Replace a gasket? Install a new oil pump?). It only indicates that there is an apparent problem that warrants attention. Similarly, the equity indicators can tell the institution where inequities in educational outcomes exist, but only deeper inquiry can uncover their causes and solutions. The Equity Analysis Team evaluated dozens of data sets to select the nine indicators to comprise the institution’s “dashboard”. While not comprehensive, they collectively provide a broad scan of equity at UWGB. Caveats and Disclaimers A prominent dimension of the USC Equity Scorecard is the use of disaggregated data to discern differences between race/ethnic groups and genders across equity indicators. A “fine-grained” analysis might reveal, for example, that the experience of African American students differs from that of Asian students on an equity dimension. Disaggregating of data is typically done at schools where minority enrollments are significant (30% - 40% of total enrollment). The Equity Analysis team deliberately chose not to disaggregate the UWGB data for several indicators, because the resulting sample sizes would be too small to be useful for analysis. Throughout its work and deliberations, the Equity Analysis team was acutely aware of the inequity of high school academic preparation of many students of color at UWGB. Indeed, it could be argued that much of the variance in the outcomes data can be explained by this variable alone. However, the committee felt strongly that the university bears a level of institutional accountability for assuring equitable outcomes for all of the students it admits. The focus of this work should not be on the reasons there are differences in outcomes, but rather on the actions that might be taken to mitigate or eliminate them.

8
UWGB EQUITY INDICATORS SUMMARY
Access
Equity of access to programs and resources
for underrepresented students.
Retention
Continued attendance from one year to the
next.
Excellence
Achievement for historically
underrepresented students.
Institutional Receptivity
Institutional support influential in creating
affirming environments.
A1. Institutional Access: Application, Admission and Enrollment Admissions funnel for new fall freshmen and new fall transfers
R1. Retention to the Second Year Number of new fall freshmen and new fall transfer students who persist to enrollment in a second year.
E1. Academic Achievement: Cumulative GPA Percentage of full-time, degree-seeking students with ≥ 24 credits in discrete GPA ranges.
IR1. Race/Ethnic Composition of the Workforce Minorities as a percent of all employees, full-time employees and full-time instructional employees.
A2. Access to Majors Percent of degree-seeking new fall freshmen with ≥ 24 credits in first year and a second terms GPA of ≥ 2.75
R2. Graduation in Six Years Number and percent of new fall freshmen and new fall transfer cohorts who graduate within six years of entering.
E2. Student Scholarship Participation in competitive scholarship activities.
IR2. Perceptions of Classroom Climate Responses of freshmen and seniors to five select questions on the National Survey of Student Engagement.
A3. Performance in Gateway Courses Percent of students earning “BC” or higher in selected introductory courses.
The Equity Indicators ACCESS INDICATORS A1. Institutional Access: Application, Admission and Enrollment Measure: The admissions funnel for new fall freshmen and new fall transfers, 2003, 2004, 2005 Equity Question: How do students of color progress through the admissions funnel relative to white students?

9
Baseline: ACCESS: New Undergraduate Applications, Admissions and Enrollments New Fall Freshmen
White or Unknown
Nonresident (International)
Asian Black Hispanic Indian U.S. Students of Color
Total Percent Students of Color
2003 2701 33 105 60 53 27 245 2979 8.2%
2004 2871 45 137 83 52 30 302 3218 9.4%
Applicants
2005 2983 39 140 83 64 40 327 3349 9.8%
2003 2501 12 80 43 44 18 185 2698 6.9%
2004 2389 17 103 32 36 22 193 2599 7.4%
Completed Applicants
2005 2519 19 109 43 56 28 236 2774 8.5%
2003 2132 9 69 27 30 10 136 2277 6.0%
2004 2094 14 82 26 27 17 152 2260 6.7%
Admitted Students
2005 2061 18 58 26 38 20 142 2221 6.4%
2003 910 2 32 8 9 8 57 969 5.9%
2004 934 4 35 11 11 11 68 1006 6.8%
Enrolled Students
2005 856 9 22 7 12 11 52 917 5.7%
New Fall Transfers
White or Unknown
Nonresident (International)
Asian Black Hispanic Indian U.S. Students of Color
Total Percent Students of Color
2003 1036 23 52 23 21 31 127 1186 10.7%
2004 1114 23 35 15 21 40 111 1248 8.9%
Applicants
2005 1242 18 55 26 20 43 144 1404 10.3%
2003 848 7 33 18 16 21 88 943 9.3%
2004 869 9 25 8 14 18 65 943 6.9%
Completed Applicants
2005 981 11 37 16 15 28 96 1088 8.8%
2003 789 7 24 13 15 17 69 865 8.0%
2004 724 7 21 8 14 15 58 789 7.4%
Admitted Students
2005 864 11 34 13 12 23 82 957 8.6%
2003 473 3 12 8 5 10 35 511 6.8%
2004 451 6 16 6 7 9 38 495 7.7%
Enrolled Students
2005 551 9 21 8 10 20 59 619 9.5%
The "Students of Color" group includes the four categories of U.S. minorities.

10

11
Admission “Funnel”: New Freshman
Gap: Students of color proceed through each step of the admissions process at lower rates than white students. Generally, the biggest gap is at the application completion stage. The smallest gap is at the admit:enroll rate. A2. Access to Majors Measure: The percent of degree-seeking fall new freshmen with > 24 graded credits in first year, and a second term cumulative GPA of > 2.75.

12
Equity Question: At the end of their first year, how does the access of students of color to the full array of majors at UWGB compare to that of white students, as a consequence of first year academic performance? Baseline: ACCESS: Performance Adequate to Apply for All Majors
Percent of New Fall Freshman with Spring Cumulative GPA of ≥ 2.75*
Achievement 2000-01 2001-02 2002-03 2003-04 2004-05 2005-06
Students of Color 50.0% 50.0% 59.3% 54.8% 42.5% 43.8%
Other Students 62.2% 63.0% 58.9% 68.4% 62.6% 58.0%
Gap -12.2% -13.0% 0.4% -13.6% -20.1% -14.2%
*Degree-seeking New Fall Freshmen with ≥24 Graded Credits in First Year Gap: In all years except 2002-03, there has been a double digit gap between white students and students of color in the percentage of students who have a second term GPA sufficiently high to enter the full array of majors at UWGB. This gap in GPA has the potential to narrow opportunities for students of color to pursue majors that have entrance requirements. A3. Performance in Gateway Courses Measure: The percent of students earning a “BC” or higher in selected introductory courses. Equity Question: How does the success of students of color in selected introductory courses compare to that of white students? Baseline: ACCESS: Performance in Gateway Courses

13
Percent Earning BC or Higher (≥ 2.5) in Selected Introductory Courses
Total Grades
% of Students of Color Earning ≥ 2.5
% of White Students Earning ≥ 2.5
Gap: S.O.C. - White
Chi Square
P value for Chi Square
Fall 1998 through Spring 2001 (3 years) Natural Sciences and Math MATH 101 INTERMEDIATE ALGEBRA 1660 48% 65% -17% 11.8 0.00 BIOLOGY 202 PRINCIPLES OF BIOLOGY I 1123 31% 55% -24% 12.6 0.00 ENV SCI 102 INTRO-ENVIR SCIENCES 2090 33% 50% -17% 14.6 0.00 HUM BIOL 102 INTRO TO HUMAN BIOLOGY 3059 32% 45% -13% 12.2 0.00 Humanities HUM STUD 101 FOUND OF WESTERN CULTURE I 1728 47% 63% -16% 9.1 0.00 HUM STUD 102 FOUND OF WESTERN CULTURE II 1279 47% 70% -23% 14.9 0.00 HUM STUD 201 INTRO TO HUMANITIES I 1520 67% 72% -5% 0.9 0.34 HUM STUD 202 INTRO TO HUMANITIES II 1496 74% 72% 2% 0.2 0.70
Writing Competency ENG COMP 100 COLLEGE WRITING 2572 67% 77% -10% 8.7 0.00 ENG COMP 105 EXPOSITORY WRITING 2171 75% 84% -9% 6.1 0.01 Social Sciences ECON 202 MACRO ECONOMIC ANALYSIS 1416 56% 76% -20% 14.8 0.00 ECON 203 MICRO ECONOMIC ANALYSIS 1255 44% 69% -25% 14.6 0.00 HUM DEV 210 INTRO TO HUMAN DEVELOPMENT 1416 63% 78% -15% 11.6 0.00 POL SCI 101 AMER GOVERNMENT & POLITICS 1704 48% 65% -17% 9.7 0.00 PSYCH 102 INTRODUCTION TO PSYCHOLOGY 2318 57% 75% -18% 18.1 0.00 SOCIOL 202 INTRODUCTION TO SOCIOLOGY 1074 44% 62% -18% 8.8 0.00 ACCESS: Performance in Gateway Courses Percent Earning BC or Higher (≥2.5) in Selected Introductory Courses
Total Grades
% of Students of Color Earning
% of White Students Earning ≥ 2.5
Gap: S.O.C. - White
Chi Square
P value for Chi Square

14
≥ 2.5
Fall 2003 through Spring 2006 (3 years) Natural Sciences and Math MATH 101 INTERMEDIATE ALGEBRA 1718 45% 59% -14% 9.8 0.00 BIOLOGY 202 PRINCIPLES OF BIOLOGY I 1180 50% 57% -7% 1.8 0.18 ENV SCI 102 INTRO-ENVIR SCIENCES 1752 36% 50% -14% 7.6 0.01 HUM BIOL 102 INTRO TO HUMAN BIOLOGY 2856 47% 64% -17% 21.7 0.00
Humanities HUM STUD 101 FOUND OF WESTERN CULTURE I 2249 64% 74% -10% 7.3 0.01 HUM STUD 102 FOUND OF WESTERN CULTURE II 1537 59% 74% -15% 11.9 0.00 HUM STUD 201 INTRO TO HUMANITIES I 1603 80% 81% -1% 0.0 0.88 HUM STUD 202 INTRO TO HUMANITIES II 1756 60% 72% -12% 7.2 0.01 Writing Competency ENG COMP 100 COLLEGE WRITING 2511 71% 82% -11% 15.3 0.00 ENG COMP 105 EXPOSITORY WRITING 2329 72% 88% -16% 30.9 0.00
Social Sciences ECON 202 MACRO ECONOMIC ANALYSIS 1008 60% 60% 0% 0.0 0.99 ECON 203 MICRO ECONOMIC ANALYSIS 1025 64% 76% -12% 3.6 0.06 HUM DEV 210 INTRO TO HUMAN DEVELOPMENT 1575 50% 72% -22% 22.3 0.00 POL SCI 101 AMER GOVERNMENT & POLITICS 1017 49% 71% -22% 15.0 0.00 PSYCH 102 INTRODUCTION TO PSYCHOLOGY 2187 66% 81% -15% 16.9 0.00 SOCIOL 202 INTRODUCTION TO SOCIOLOGY 1352 45% 68% -23% 19.4 0.00 Gap: In nearly all gateway courses, the percentage of students of color who earn a BC or better is at least 10% less than the percentage of white students who earn a BC or better. The gap in gateway course performance impacts first year GPA, and potentially impacts other indicators such as retention, access to majors, and participation in honoraries. RETENTION INDICATORS R1. Retention to the Second Year Measure: The number and percent of new fall freshmen and new fall transfer students who persist to enrollment in a second year, 2002, 2003, 2004. Equity Question: How does the rate of retention of students of color to their second year at the institution compare to that of white students? Baseline:

15
RETENTION: New Fall Freshmen
2002 Retained in 2003
% 2003 Retained in 2004
% 2004 Retained in 2005
%
African American
12 8 66.7% 8 3 37.5% 11 7 63.6%
Hispanic/ Latino
8 7 87.5% 9 8 88.9% 11 9 81.8%
American Indian
4 3 75.0% 7 4 57.1% 11 4 36.4%
Asian 8 5 62.5% 8 5 62.5% 12 8 66.7%
Southeast Asian
24 18 75.0% 24 19 79.2% 23 16 69.6% Stud
ents
of C
olor
Sub-Total 56 41 73.2% 56 39 69.6% 68 44 64.7%
White 821 680 82.8% 903 679 75.2% 921 701 76.1%
Non-resident 9 6 66.7% 2 1 50.0% 4 3 75.0%
Unknown 16 12 75.0% 6 6 100.0% 9 8 88.9%
Grand Total 902 739 81.9% 967 725 75.0% 1002 756 75.4%
White - Minority (FT) 10.1% 6.2% 11.6%
RETENTION: New Fall Transfer Students
2002 Retained in 2003
% 2003 Retained in 2004
% 2004 Retained in 2005
%
African American
1 1 100.0% 7 6 85.7% 5 3 60.0%
Hispanic/ Latino
3 2 66.7% 4 4 100.0% 6 5 83.3%
American Indian
13 6 46.2% 9 9 100.0% 9 6 66.7%
Asian 2 1 50.0% 2 2 100.0% 7 4 57.1%
Southeast Asian
5 3 60.0% 8 7 87.5% 9 8 88.9% Stud
ents
of C
olor
Sub-Total 24 13 54.2% 30 28 93.3% 36 26 72.2%
White 289 220 76.1% 430 318 74.0% 408 292 71.6%
Non-resident 5 5 100.0% 3 2 66.7% 6 3 50.0%
Unknown 1 0 0.0% 2 2 100.0% 4 4 100.0%
Grand Total 319 238 74.6% 465 350 75.3% 454 325 71.6%
White - Minority (FT) 22.0% -19.4% -0.7%
Gap: The retention of new freshmen students of color to the second year is 9% less than the retention of new freshmen white students, and the retention of transfer students of color is .8% less than the retention

16
of white transfer students. The gap in retention to the second year and subsequent differential attrition of students of color contributes to the double digit gap in 6-year graduation rate. R2. Graduation in Six Years Measure: The number and percent of new fall freshmen and new fall transfer cohorts who graduate within six years of entering the institution; 1997-2003, 1998-2004, 1999-2005 Equity Question: How does the six- year graduation rate for students of color compare to that of white students? Baseline: GRADUATION: New Fall Freshmen
1997 Graduated by August
2003
% 1998 Graduated by August
2004
% 1999 Graduated by August
2005
%
African American
7 0 0.0% 13 6 46.2% 9 1 11.1%
Hispanic/ Latino
5 0 0.0% 8 1 12.5% 6 1 16.7%
American Indian
8 1 12.5% 17 0 0.0% 17 3 17.6%
Asian 7 4 57.1% 5 1 20.0% 7 4 57.1%
Southeast Asian
12 5 41.7% 12 4 33.3% 13 4 30.8% Stud
ents
of C
olor
Sub-Total 39 10 25.6% 55 12 21.8% 52 13 25.0%
White
893 400 44.8% 968 444 45.9% 857 404 47.1%
Non-resident 8 3 37.5% 3 1 33.3% 15 9 60.0%
Unknown
6 2 33.3% 7 0 0.0% 6 3 50.0%
Grand Total 946 415 43.9% 1033 457 44.2% 930 429 46.1%
White - Minority (FT) 20.9% 23.9% 22.0%
Adult degree students are NOT included in the cohort or graduation rates; International non-resident students are included.

17
GRADUATON: New Fall Transfer Students
1997 Graduated by August
2003
% 1998 Graduated by August
2004
% 1999 Graduated by August
2005
%
African American
2 0 0.0% 2 1 50.0% 6 3 50.0%
Hispanic/ Latino
6 3 50.0% 6 3 50.0% 4 2 50.0%
American Indian
11 5 45.5% 14 9 64.3% 18 9 50.0%
Asian 1 0 0.0% 4 0 0.0% 1 0 0.0%
Southeast Asian
3 2 66.7% 3 3 100.0% 7 3 42.9% Stud
ents
of C
olor
Sub-Total 23 10 43.5% 29 16 55.2% 36 17 47.2%
White
464 230 49.6% 464 223 48.1% 431 200 46.4%
Non-resident 16 8 50.0% 11 4 36.4% 6 4 66.7%
Unknown
3 2 66.7% 0 0 N.A. 2 1 50.0%
Grand Total 506 250 49.4% 504 243 48.2% 475 222 46.7%
White - Minority (FT) 6.1% -7.1% -0.8%
Adult degree students are NOT included in the cohort or graduation rates; International non-resident students are included.
Graduation Trend 1992-1999
Full-time Degree-seeking New Freshmen: 6-year Graduation Rates
Fall White Freshmen Minority Freshmen (2) Cohort Students Graduates (1) Rate Students Graduates (1) Rate
1992 710 337 47.5% 53 9 17.0%
1993 699 338 48.4% 21 2 9.5%
1994 778 329 42.3% 40 8 20.0%
1995 779 331 42.5% 30 7 23.3%
1996 922 387 42.0% 45 11 24.4%
1997 877 397 45.3% 37 9 24.3%
1998 948 441 46.5% 53 12 22.6%
1999 849 403 47.5% 51 13 25.5%
(1) Students are tracked for six years; some will graduate after six years, but will not be counted here as graduates. Students who transfer to and graduate from another college are not counted as graduates on this table. Students who transfer here from another school are also not included on these tables. (2) The UW System focuses on U.S. citizens when studying racial and ethnic diversity. International students are not counted as minority students on these tables, regardless of their racial or ethnic heritage.
Gap: The six-year graduation rates of new fall freshmen students of color is 21.9% lower than that of white students. The gap has actually increased over the past 8 years. The six-year graduation rate of transfer students of color is much smaller, and is only .8% lower than that of white transfer students.

18
EXCELLENCE INDICATORS E1. Academic Achievement: Cumulative GPA Measure: Percentage of fulltime, degree-seeking students with > 24 credits in discrete GPA ranges, Spring 2001 and Spring 2006 Equity Question: How are students of color represented in critical GPA ranges, relative to white students? Baseline: EXCELLENCE: Academic Achievement Cumulative GPA at end of spring for all full-time degree-seeking undergraduates with ≥ 24 graded credits by the end of the spring
End of Spring 2000-01 End of Spring 2005-06 Achievement % of
Students of Color in this GPA
range
% of Students of Color Expected
Under Equity Conditions
Gap: Absolute difference
% of Students of Color in this GPA range
Percent of Students of
Color Expected Under Equity Conditions
Gap: Absolute difference
Under 2.0 6.5% 4.4% 2.1% 11.5% 5.8% 5.7%
2.00-2.749 6.7% 4.4% 2.3% 8.8% 5.8% 3.0%
2.75-3.499 4.1% 4.4% 0.3% 5.0% 5.8% 0.8%
3.50-3.749 1.2% 4.4% 3.2% 4.3% 5.8% 1.5%
3.75-4.0 1.8% 4.4% 2.6% 1.4% 5.8% 4.4%
Totals 4.4% 10.5% 5.8% 15.4%

19
Gap: Students of color are overrepresented among students who earn less than a 2.0 GPA, and underrepresented in all other GPA ranges. The total of all gaps has increased from 2001 to 2005. E2. Student Scholarship Measure: Participation in competitive scholarship activities: Phi Kappa Phi, internships and independent studies, and the Academic Excellence Symposium Equity Question: How do the rates of participation of students of color in competitive scholarship activities compare to that of white students? Baseline: EXCELLENCE: Student Scholarship
Number % of All
Students Students of Color presenting at the Academic Excellence Symposium
Student members of Phi Kappa Phi who are Students of Color:
Total membership, 1997 through 2005 16 2.3%
Students joining in the most recent initiation (2005) 3 4.3%
Students completing Internships (Calendar years 2003, 2004 and 2005) 48 5.2%
Students completing Independent Study (Calendar years 2003, 2004 and 2005) 42 5.3%
Students completing Honors in the Major (Calendar years 2003, 2004 and 2005) 4 4.2%
Gap: Students of color are underrepresented in all competitive student scholarship activities relative to their enrollment in the student population. The participation of students of color in some competitive scholarship activities is impacted by GPA eligibility. INSTITUTIONAL RECEPTIVITY INDICATORS IR1. Race/Ethnic composition of the workforce Measure: Minorities as a percent of all employees, full-time employees and full-time instructional employees, Fall terms, 1999, 2001, 2003, 2005. Equity Question: How does the representation of persons of color in the workforce compare to the representation of enrolled students of color? Baseline: RECEPTIVITY: Workforce Diversity
Minorities as a Percent of All Employees, IPEDS Fall Staff Surveys Survey Total Employees Full-time Employees Full-time
Instructional Employees
1999 5.8% 6.9% 12.6%
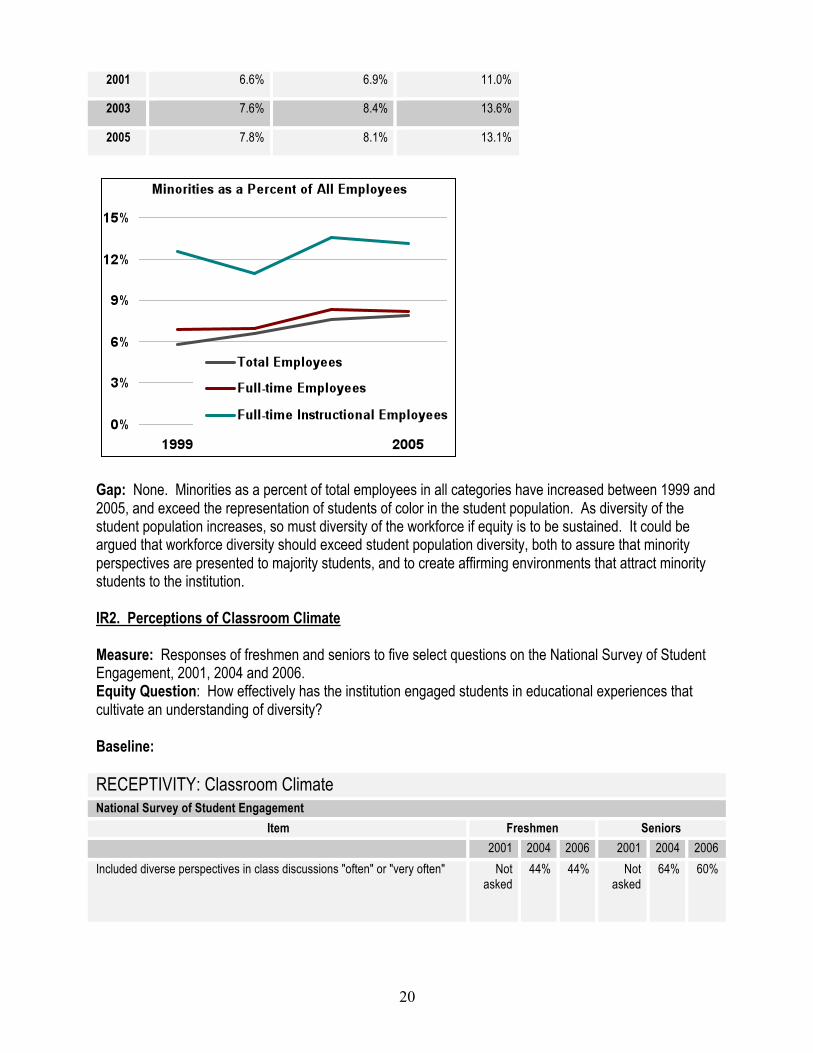
20
2001 6.6% 6.9% 11.0%
2003 7.6% 8.4% 13.6%
2005 7.8% 8.1% 13.1%
Gap: None. Minorities as a percent of total employees in all categories have increased between 1999 and 2005, and exceed the representation of students of color in the student population. As diversity of the student population increases, so must diversity of the workforce if equity is to be sustained. It could be argued that workforce diversity should exceed student population diversity, both to assure that minority perspectives are presented to majority students, and to create affirming environments that attract minority students to the institution. IR2. Perceptions of Classroom Climate Measure: Responses of freshmen and seniors to five select questions on the National Survey of Student Engagement, 2001, 2004 and 2006. Equity Question: How effectively has the institution engaged students in educational experiences that cultivate an understanding of diversity? Baseline: RECEPTIVITY: Classroom Climate
National Survey of Student Engagement Item Freshmen Seniors
2001 2004 2006 2001 2004 2006
Included diverse perspectives in class discussions "often" or "very often" Not asked
44% 44% Not asked
64% 60%

21
Had serious conversations with students of a different race or ethnicity that your own "often" or "very often"
28% 25% 28% 33% 37% 28%
Had serious conversations with students who are very different from you in terms of their religions beliefs, political opinions, or personal values "often" or "very often"
50% 46% 47% 50% 50% 42%
Institutional environment encourages contact among students from different economic, social, and racial or ethnic backgrounds "quite a bit" or "very much"
36% 41% 43% 27% 41% 40%
Institution contributed to understanding people of other racial and ethnic backgrounds "quite a bit" or "very much"
36% 33% 40% 48% 53% 46%
Conclusions, Recommendations and Further Analysis Several indicator “lights” on our dashboard are now illuminated, and they should capture our collective attention. The challenge now is to mobilize a commitment to action that is based in the evidence presented here. As an institution, we must deepen our understanding of the causes of the equity gaps, and begin to develop remedies for them. The nine primary indicators are but gross measures of equity in educational outcomes. Each indicator can (indeed, should) prompt additional questions, encourage more refined data gathering and analysis, and prompt connections to other existing campus research. For example; How are access and student success related to high school of origin? How might NCAA graduation and retention data be used to refine our understanding of student achievement? How does the equity gap in gateway courses with higher-than-average student of color enrollment compare to that of other gateway courses? These are but a sampling of the rich array of deeper questions that the indicators are intended to prompt. The Equity Analysis Team offers this report to the campus community in the hope that it will generate a campus-wide dialogue about equity in educational outcomes for all students. The simple awareness of

22
equity gaps is a necessary prerequisite for change, but awareness alone is insufficient. Nor will it serve our collective interests to spend time and energy either wringing our hands or pointing fingers of blame. Though it is not within the authority of this committee to demand or direct action in regard to these data, the committee offers this analysis in the hope that it serves as a springboard for an engaging discussion on how the university should proceed to better align its ideals with its actions, and how we might work as a community in the interests of achieving equitable educational outcomes for all students. Logical next steps are to share these results widely, develop a deepened understanding of each of these educational outcomes, distribute responsibility and accountability for them, and begin to systematically design and implement programs to address some or all of them. Ultimately, connecting this exercise to campus planning and resource allocation is also advised. The experiences of other “Equity Scorecard” universities who began this process many years earlier than UWGB can be instructive. After identifying a dozen equity indicators with gaps, Madison Area Technical College chose to focus its attention on a single indicator; the inequity of enrollments in selected high demand, high paying majors. MATC has recently directed attention and resources to attracting and supporting students of color in particular programs (Nursing, for example) in an effort to redress this inequity. At the conclusion of its Equity Scorecard project, Loyola Marymount University (Los Angeles, CA) conducted a series of town hall meetings on their campus. Convened by the president, the sessions invited deans, directors and department chairs to publicly present their reports, share results and brainstorm collaborative solutions. Notably, many of the solutions that were suggested and acted on did not involve new resources, only new internal practices and improved collaboration and communication. Upon receipt of LMU’s Equity Scorecard report, Father Robert Lawton, LMU President, thanked the LMU community for their willingness to honestly and publicly confront inequities in educational outcomes and for their commitment to inclusive excellence as an institutional value. But he thanked them most profusely for avoiding three temptations to which higher education institutions are unfortunately prone: the temptation to be overwhelmed by data, the temptation to the relish the knowledge gained without allowing it to lead to action, and the temptation to diffuse institutional improvement efforts by trying to do too much. (Bauman et al, p. 34) UWGB would do well to learn from these lessons.