equitable. description electricity gwhkwh per person% of total sindh-karachi10,0521,02013.5...
TRANSCRIPT

EQUITABLE

DescriptionElectricity
GWh KWh per person % of total
Sindh-Karachi 10,052 1,020 13.5
Sindh-Rural 5,241 255 7
Punjab 46,696 627 62.8Khyber Pakhtunkhwa 8,259 395 11.1
Balochistan 4,099 624 5.3
Pakistan 74,347 562 100
Province-WisePer Capita Electricity Consumption
FY 2009-10
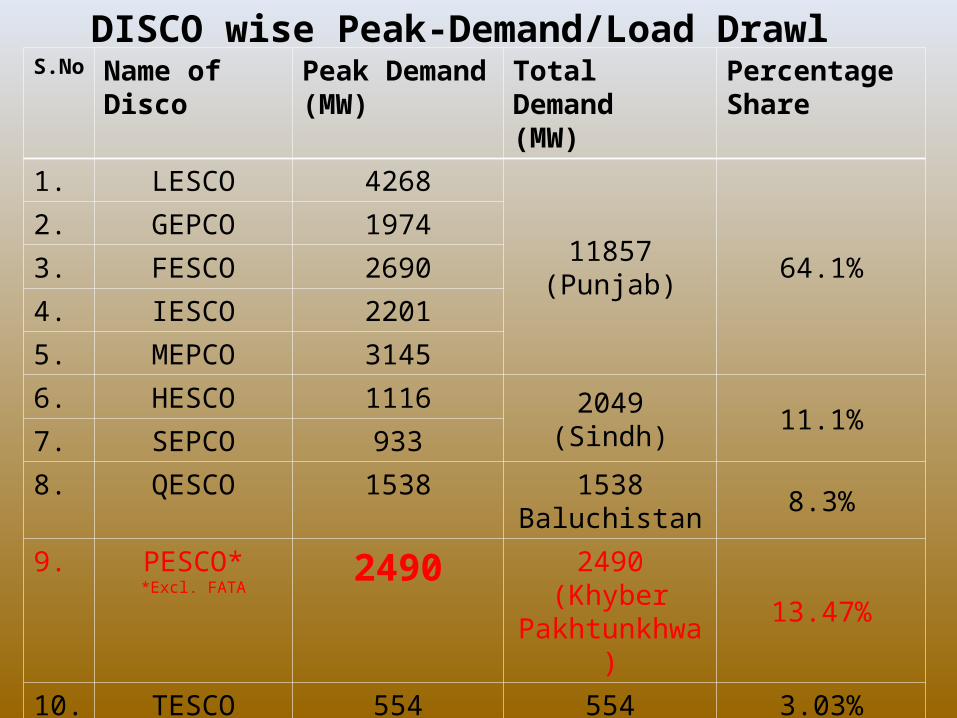
S.No Name of Disco Peak Demand (MW)
Total Demand(MW)
Percentage Share
1. LESCO 4268
11857(Punjab)
64.1%
2. GEPCO 1974
3. FESCO 2690
4. IESCO 2201
5. MEPCO 3145
6. HESCO 1116 2049(Sindh)
11.1%7. SEPCO 933
8. QESCO 1538 1538Baluchistan
8.3%
9. PESCO**Excl. FATA
2490 2490 (Khyber Pakhtunkhwa)
13.47%
10. TESCO 554 554 3.03%
TOTAL 18488
KESC 2196
DISCO wise Peak-Demand/Load Drawl


CRISIS IN CRISIS IN KHYBER PAKHTUNKHWAKHYBER PAKHTUNKHWA
IS BLOWING IS BLOWING OUT OF PROPORTIONSOUT OF PROPORTIONS

Quantum of Protests
Month No of protests
Remarks
June 2012 97 Approximate 3 protests per day in various districts
July 2012 158 Average 5 per day
1-7 August 2012 33 Average 5 per day in Ramzan
• The situation is being handled by the administration with great difficulty.
DURATION OF LOAD SHEDDING IN KHYBER PAKHTHWAUrban Rural
12 – 14 hours 16 - 20 hours
6

“(We will) ensure equitable load shedding in Country”
Recommendation No. 1– National Energy Summit, 9 th April 2012
Guiding Principle
“Equitable” does not just mean “EQUAL”
Other factors need to be weighed

Each Province may be supplied electricity out of the available generation as per its percentile proportion established above.
OR
Each Province may be required to shed load from its Maximum Demand at the percentile proportion out of the shortfall
Equitable Load shedding
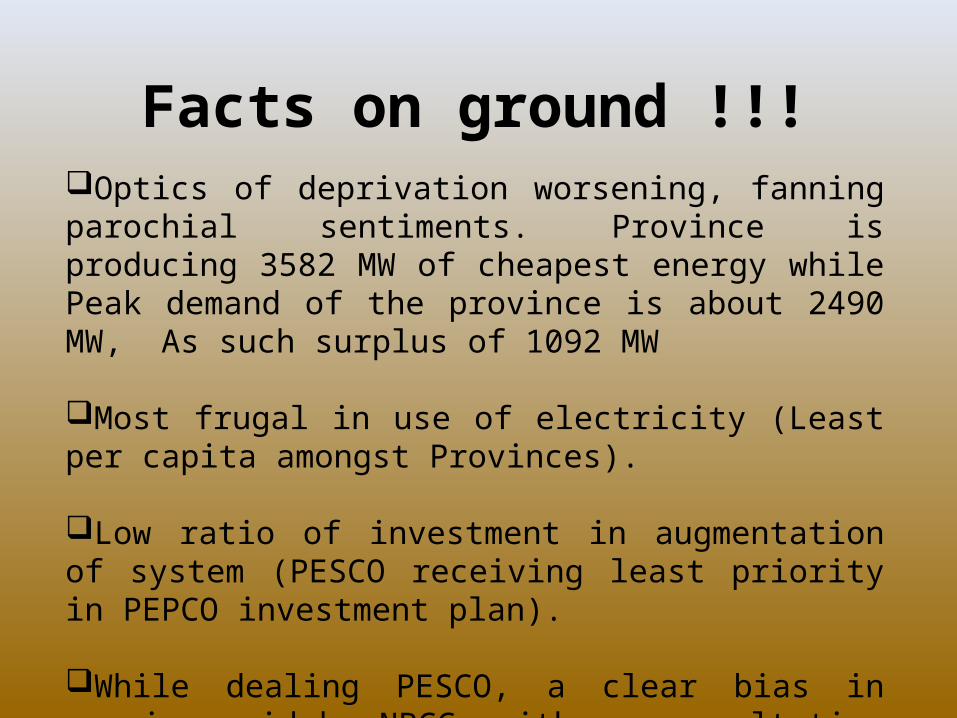
Facts on ground !!!Optics of deprivation worsening, fanning parochial sentiments. Province is producing 3582 MW of cheapest energy while Peak demand of the province is about 2490 MW, As such surplus of 1092 MW
Most frugal in use of electricity (Least per capita amongst Provinces).
Low ratio of investment in augmentation of system (PESCO receiving least priority in PEPCO investment plan).
While dealing PESCO, a clear bias in opening grid by NPCC, with no consultation of Province or provincial administration.
PunjabSindh
(Excl. KESC)KPK
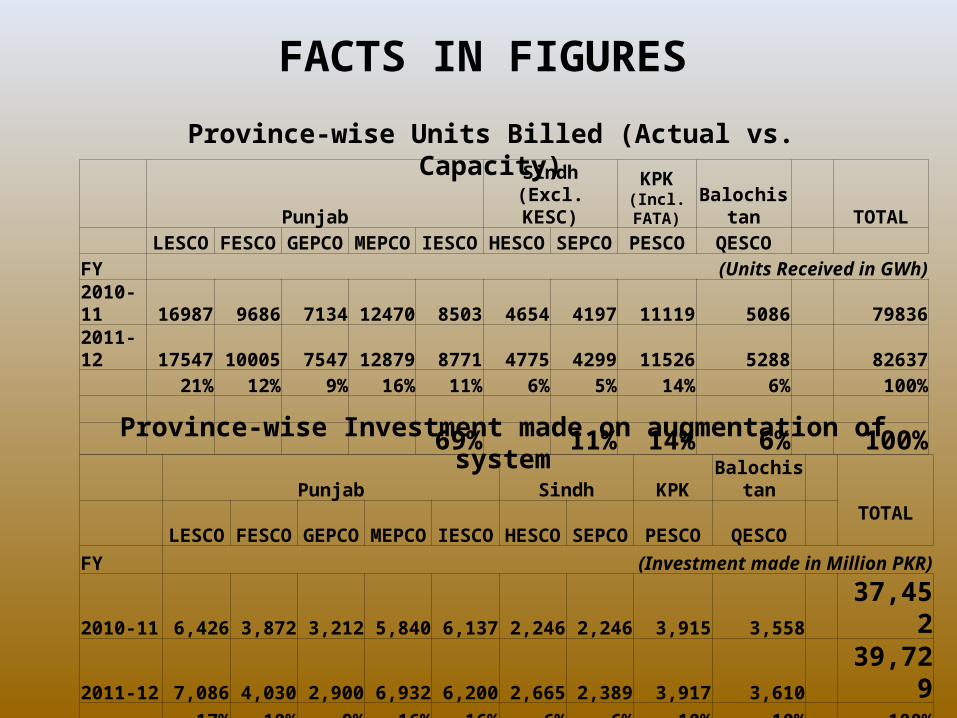
(Incl. FATA) Balochistan TOTAL LESCO FESCO GEPCO MEPCO IESCO HESCO SEPCO PESCO QESCO FY (Units Received in GWh)2010-11 16987 9686 7134 12470 8503 4654 4197 11119 5086 798362011-12 17547 10005 7547 12879 8771 4775 4299 11526 5288 82637 21% 12% 9% 16% 11% 6% 5% 14% 6% 100%
69% 11% 14% 6% 100%
FACTS IN FIGURES
Province-wise Units Billed (Actual vs. Capacity)
Punjab Sindh KPK Balochistan TOTAL
LESCO FESCO GEPCO MEPCO IESCO HESCO SEPCO PESCO QESCO FY (Investment made in Million PKR)
2010-11 6,426 3,872 3,212 5,840 6,137 2,246 2,246 3,915 3,558 37,4522011-12 7,086 4,030 2,900 6,932 6,200 2,665 2,389 3,917 3,610 39,729 17% 10% 9% 16% 16% 6% 6% 10% 10% 100% 18% 10% 7% 17% 16% 7% 6% 10% 9% 100%
68% 13% 10% 9%
Province-wise Investment made on augmentation of system

Province wise Domestic – Rural Consumers
Punjab Khyber Pakhtunkhwa Sindh Balochistan
FeedersLoad (MW) Feeders
Load (MW) Feeders
Load (MW) Feeders
Load (MW)
Total 2445 5985 557 2277 546 1280 159 521
Rural 1171 2527 418 1813 388 822 33 104
48% 42% 75% 80% 71% 64% 21% 20%
In case of any arrangement with higher load shedding on RURAL feeders, KPK is worst hit

PESCO SYSTEM PROFILES# Description Total # Overloaded %
Overloading
01 Power Transformers installed at grids / substations
192 125 66.1%
02 Transmission Lines feeding Grids / SSs
107 21 20%
03 11 KV Distribution Feeders
704 312 44.3%
RESULTS IN AT LEAST 300 MW LOADSHEDDING UNDER OPTIMUM
CONDITIONS (NO DEFICIT SCENARIO)

Date
Quota Allocated (MW)
Average Avg. Load Shedding Forced Shedding under Total (MW)
% Load Shed
Computed Demand (MW) Power Inflow
Carried out against
the instructions of NPCC/RCC
(MW) Quota (MW) Islamabad (MW)
1/7/2012 1153 2346 1278 800 268 1036 44%2/7/2012 1153 2502 1098 683 715 1398 56%3/7/2012 1153 2414 1220 696 498 1194 49%4/7/2012 1153 2476 1332 970 174 1144 46%5/7/2012 1153 2445 1370 969 106 1075 44%6/7/2012 937 2435 1367 926 301 1227 50%7/7/2012 878 2279 1378 796 41 837 37%8/7/2012 735 2131 1352 762 35 797 37%9/7/2012 911 2372 1423 927 35 962 41%
10/7/2012 1012 2416 1253 971 242 1213 50%11/7/2012 970 2470 1386 943 86 1029 42%12/7/2012 963 2331 1333 997 0 997 43%
13/7/2012 607 2132 1342 793 9 802 38%14/7/2012 677 2116 1407 705 0 705 33%15/7/2012 384 1999 1451 477 0 477 24%16/7/2012 816 2251 1454 782 30 812 36%17/7/2012 1015 2373 1383 979 114 1093 46%18/7/2012 833 2267 1407 779 0 779 34%19/7/2012 352 2120 1425 508 0 508 24%20/7/2012 365 2060 1434 477 47 524 25%21/7/2012 324 2022 1425 199 203 402 20%22/7/2012 234 2211 1476 195 355 550 25%23/7/2012 234 2388 1442 325 563 888 37%24/7/2012 234 2305 1273 448 584 1032 45%25/7/2012 234 2248 1391 500 357 857 38%26/7/2012 234 2174 1377 581 215 796 37%27/7/2012 234 2405 1335 571 500 1071 45%28/7/2012 234 2539 1201 511 783 1294 51%29/7/2012 234 2500 1243 536 716 1252 50%30/7/2012 234 2609 1345 408 856 1264 48%31/7/2012 234 2493 1279 452 759 1211 49%Average for the Month 2317 1351 667 277 943 41%
LOAD BEING SHED PRESENTLY (PESCO QUOTA + NPCC)

DAY Wednesday, August 01, 2012
TENTATIVE GENERATION AND LOAD SUPPLIED TO DISCOS
HOURS 02:00 03:00 04:00 05:00 06:00 07:00 08:00 09:00 10.00 11.00 12.00 13.00 14.00 15.00 16.00 17.00 18.00 19.00 20.00 21.00 22.00 23.00 24.00
DESCRIPTION LOAD (MW)
A - GENERATION. 11800 13000 12900 11900 11600 11600 12200 12200 12300 12400 12500 12500 12500 12500 12500 12000 12000 13200 13200 13200 13100 12100 11700
B - EXPORT TO KESC. 600 650 650 600 600 600 700 600 600 600 700 700 600 600 650 600 600 650 600 650 650 600 600
C - T & T LOSS. & AUXILIAR CONSUMPTION. (6% OF A)
708 780 774 714 696 696 732 732 738 744 750 750 750 750 750 720 720 792 792 792 786 726 702
D - LOAD SUPPLIED TO DISCOS (=A-B-C)
10492 11570 11476 10586 10304 10304 10768 10868 10962 11056 11050 11050 11150 11150 11100 10680 10680 11758 11808 11758 11664 10774 10398
PESCO ( 16% of D ) 1679 1851 1836 1694 1649 1649 1723 1739 1754 1769 1768 1768 1784 1784 1776 1709 1709 1881 1889 1881 1866 1724 1664
Actual Drawn by PESCO
1339 1268 1300 1471 1518 1577 1558 1523 1590 1394 1363 1336 1461 1283 1486 1490 1649 1545 1442 1405 1312 1494 1447
Difference -340 -583 -536 -222 -131 -71 -165 -215 -164 -375 -405 -432 -323 -501 -290 -219 -60 -336 -447 -476 -554 -229 -216
Actual Load Made Available
13%
11%
11%
14%
15%
15%
14%
14%
15%
13%
12%
12%
13%
12%
13%
14%
15%
13%
12%
12%
11%
14%
14%
A CLEAR ILLUSTRATION OF “INEQUITY” – ANY GIVEN DAY

PESCO
Tuesday, July 31, 2012(0100 TO 1100 HRS) Monday, July 30, 2012(1200 TO 2400 HRS)
TENTATIVE GENERATION AND LOAD SUPPLIED TO DISCOS
HOURS 01:00 02:00 03:00 04:00 05:00 06:00 07:00 08:00 09:00 10.00 11.00 12.00 13.00 14.00 15.00 16.00 17.00 18.00 19.00 20.00 21.00 22.00 23.00 24.00
DESCRIPTION LOAD (MW)
A - GENERATION. 11700 11900 13000 12700 11900 11700 11700 11700 12200 12200 12300 12400 12400 12400 12400 12400 11600 11600 13000 13000 13000 13000 11800 11700
B - EXPORT TO KESC.
600 650 600 650 650 650 650 700 600 600 600 600 600 600 600 600 600 700 600 650 600 700 650 600
C - T & T LOSS. & AUXILIAR CONSUMPTION. (6% OF A)
702 714 780 762 714 702 702 702 732 732 738 744 744 744 744 744 696 696 780 780 780 780 708 702
D - LOAD SUPPLIED TO DISCOS (=A-B-C)
10398 10536 11620 11288 10536 10348 10348 10298 10868 10868 10962 11056 11056 11056 11056 11056 10304 10204 11620 11570 11620 11520 10442 10398
PESCO ( 16% of D ) 1664 1686 1859 1806 1686 1656 1656 1648 1739 1739 1754 1769 1769 1769 1769 1769 1649 1633 1859 1851 1859 1843 1671 1664
Actual Power Drawn by PESCO on
31st July, 20121467 1425 1443 1123 1357 1647 1647 1625 1221 1450 1012 1369 1385 1151 1364 1309 1320 1451 1762 1513 1490 1406 1488 1657
Difference -196 -261 -416 -683 -329 -9 -9 -23 -517 -289 -742 -400 -384 -618 -405 -460 -329 -181 -97 -338 -369 -437 -183 -7
Actual Provision14%
14%
12%
10%
13%
16%
16%
16%
11%
13%
9%12%
13%
10%
12%
12%
13%
14%
15%
13%
13%
12%
14%
16%
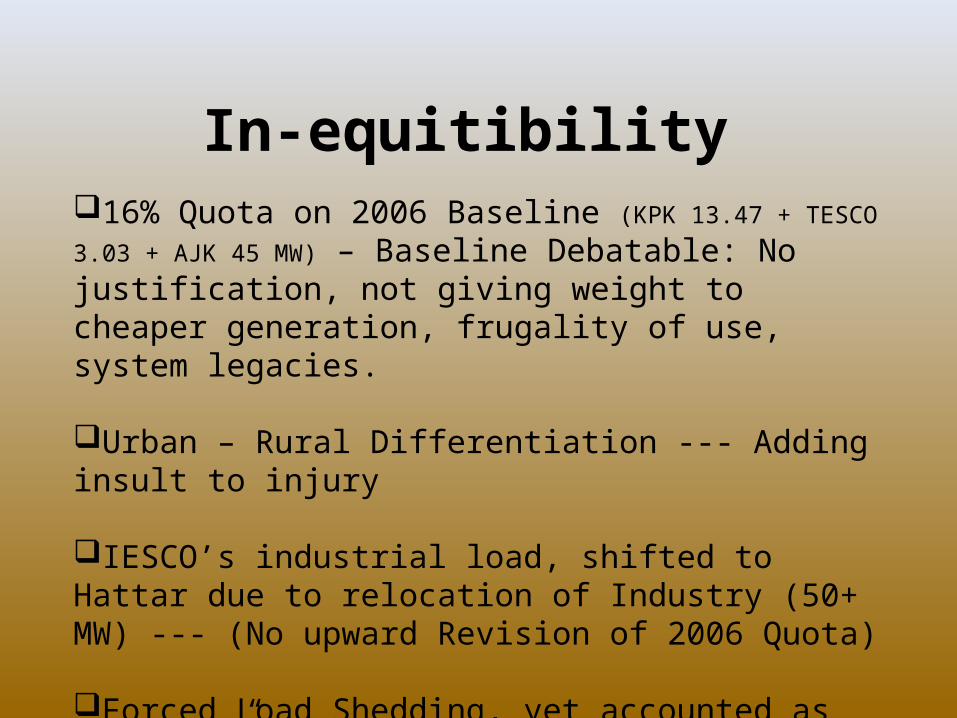
In-equitibility 16% Quota on 2006 Baseline (KPK 13.47 + TESCO 3.03 + AJK 45 MW) – Baseline Debatable: No justification, not giving weight to cheaper generation, frugality of use, system legacies.
Urban – Rural Differentiation --- Adding insult to injury
IESCO’s industrial load, shifted to Hattar due to relocation of Industry (50+ MW) --- (No upward Revision of 2006 Quota)
Forced Load Shedding, yet accounted as “Drawals”
Technological inadequacies, controverting “equitable” implementation.

Process ManagementManual and Crude (Not automated, phone calls – Hotline carriers, verbal commands/reporting)
Arbitrary/Whimsical (No or conflicting written directions – Lack of SOPs for forced opening of grids)
Technological inadequacies, controverting “equitable” implementation.
Responsibilities diffused, conduct and operations not predictable.
Distant Control – Indifference to Human Element
Real people, real miseriesPlaying into the whims and biases of operators/button-pushers
Conclusion“Equitable Load Shedding” as designed and perceivably implemented presently, is elusive, conceptually and in reality.
The enforcement regime is perpetuating unjust dispensation of power distribution in Khyer Pakhtunkhwa.
Centralized load-shedding control system, on one side disempowers the DISCO, while on the other, detracts from forthright responsibility and its accompanying appropriate conduct.
The centralized power system has failed to deliver, necessitating decentralization of both Generation and Distribution to the Provinces