epoc 2015 european powers of construction - deloitte 2015 european powers of construction 6 of the...
TRANSCRIPT

EPoC 2015European Powers of Construction

EPoC is an annual publication produced by Deloitte and distributed free of charge
Director Javier Parada, partner in charge of the Infrastructure Industry, Spain
Coordinated by Margarita Velasco Martín Alurralde Serra Raquel Sánchez Macías
Published by Communications, Brand and Business Development department
Contact Infrastructure Department, Deloitte Madrid Plaza Pablo Ruiz Picasso, S/N Torre Picasso 28020 Madrid, Spain Phone + 34 91 514 50 00 Fax + 34 91 514 51 80 June 2016

EPoC 2015 | European powers of construction
3
4 Introduction
5 Ranking of listed European construction companies
7 Top 50 EPoC – ranking by sales
8 Top 20 EPoC – ranking by market capitalisation
10 Outlook for the construction industry in the EU
15 Top 20 EPoC strategies: internationalisation and diversification
19 EPoC 2015 financial performance
31 Diversification of the EPoC 2015
33 Financing of EPoC 2015
35 Internationalisation: Business opportunities
44 Performance of non-European construction companies
51 Top 20 EPoC – Company profiles
Contents

EPoC 2015 | European Powers of Construction
4
European Powers of Construction 2015 examines the strategies and performance of the most representative listed European construction groups in terms of revenue, market capitalisation, internationalisation, diversification, indebtedness and other financial ratios.
Introduction
Welcome to the thirteenth edition of European Powers of Construction, our annual publication in which we identify and outline the major listed European construction groups. This publication examines the market position and performance of the main players in the industry in terms of revenue, market capitalisation, internationalisation, diversification, profitability, indebtedness and other financial ratios. Additionally, an analysis of the financial situation of the most representative non-European listed constructions groups is included.
As mentioned in last year’s publication, since 2014 the European construction industry has emerged from the recession, and showed moderate growth in both 2014 and 2015. Structural reforms are expected to strengthen economic recovery and lead to sustainable growth. Along these lines, and according to the forecast of the European Commission, there is a positive outlook for the near future.
As in 2014, we have included a section analysing EPoC financial performance. In 2015 the major companies’ aggregate sales and their market capitalisation index grew by 5% and 21%, respectively. It should be noted that the market value of our most significant EPoC in 2015 is already higher
than that obtained prior to the beginning of the financial crisis in 2007.
Internationalisation and diversification continue to play a major role in EPoC strategies. In 2015 international sales and non-construction sales remained in line with the previous year and represented around 52% and 24% of total sales, 9 percentage points higher and 5 percentage points lower, respectively, compared to 2010 figures.
We have also retained the section on company profiles, which focuses on the top 20 listed European construction companies in terms of revenue. For the selected companies, we present key data regarding ownership structure, main activities and divisions, international presence, goals and strategic objectives and selected financial data from the groups’ 2015 financial statements, compared to 20141 and 20131.
We hope that you find our EPoC 2015 analysis of the construction sector of interest, and that the information presented herein helps you to understand and assess the challenges and opportunities of this industry. As always, we welcome any ideas and suggestions you may have with regard to any of the topics covered.
1 Please note that prior years’ data corresponds in all cases to the audited financial statements for the relevant year, since we do not take into consideration subsequent restatements. In addition, we have converted the financial data of companies with functional currencies other than the euro into euros using the exchange rate prevailing at year-end for balance sheet data, and the average exchange rate for the year for statement of profit or loss data.

EPoC 2015 | European Powers of Construction
5
Ranking of listed European construction companiesThe sales volume ranking of the Top 50 EPoC 2015 is again led by Vinci, followed by ACS and Bouygues, all of which obtained sales in excess of EUR 30,000 million. The podium has remained constant since 2012, and represents 35% of total turnover obtained in 2015 by the Top 50 groups. Skanska, ranked in fourth position, represents less than half the amount of sales of our Top 3 EPoC.
Total sales of the EPoC grew by 5% compared to the previous year. This increase is largely a result of the growth achieved by the UK groups (partially explained by the impact of the appreciation of the pound sterling against the euro) as well as the positive performance of other groups such as Ferrovial, Salini Impregilo and OHL, the only non-UK companies in the Top 20 with sales increases above 10%. Within the Top 20, Carillion experienced the largest increase in sales (25% compared to euro sales in 2014; 13% excluding the effect of foreign exchange rates).
As in previous years, France dominates the Top 50 in terms of total sales and market capitalisation, with three companies, all in the Top 5. While French EPoC total sales remained in line with 2014, combined EBIT grew by 4% and their market capitalisation increased by 30%. The three companies (Vinci, Bouygues and Eiffage) all reported an increase of over 25% in market capitalisation.
Spain took second place in the ranking of total sales by country, with 6 companies ranked between 2nd and 28th place. In 2015 total sales of the Spanish EPoC groups and market capitalisation grew by 3% and 6%, respectively. Note should be made

EPoC 2015 | European Powers of Construction
6
of the positive performance of Ferrovial in 2015, with a 10% sales increase and a 27% increase in market capitalisation -being the only Top 10 company to achieve double-digit growth on both parameters- and Acciona, with a 41% increase in market capitalisation in 2015.
The United Kingdom has the largest number of companies in the Top 50, with a total of 13, but their relative size is smaller in comparison to French or Spanish companies. Some of the companies are engaged mainly in residential building construction. Sales of British EPoC groups increased by 21% to EUR 55,434 million (representing 8% growth excluding the effect of foreign exchange rates). Among the British groups, Carillion recorded the highest growth in terms of sales, explained by the strong performance of all its divisions, but also due to certain acquisitions completed in 2015 (Rokstad
Corporation and the Outland Group). Of note was the entry in the Top 20 of two new UK companies, the Kier Group and Taylor Wimpey, with euro-denominated sales increases of 22.9% and 29.8%, respectively (still a significant 12.3% and 16.9% in local currency). UK groups also recorded above-average performances in terms of market capitalisation. Since 2011, the market value of the UK groups has increased by 165%.
EPoC’s market capitalisation grew by 21% in 2015, a noteworthy figure in comparison with the 4% increase in the Eurostock index in the year. French, UK and Spanish groups, which represented 75% of EPoC’s total market value in 2015, increased their total market value by 30%, 38% and 6%, respectively. Overall, the improved outlook for the European economy contributed to the positive performance of our EPoC in the stock markets.
Country Number of companies
Sales 2015 (€ m)
Sum of Sales 2014
Variation 2015 vs 2014 (a)
Market Capitalisation
2015 (€ m)
Market Capitalisation
2014 (€ m)
Variation 2015 vs
2014FRANCE 3 85,006 85,789 (1%) 52,907 40,808 30%SPAIN 6 64,964 63,147 3% 32,636 30,721 6%UNITED KINGDOM 13 55,434 45,694 21% 41,356 29,871 38%SWEDEN 4 29,278 28,360 3% 14,567 14,125 3%AUSTRIA 2 16,263 15,485 5% 3,232 2,730 18%NETHERLANDS 4 12,558 12,484 1% 2,081 1,237 68%ITALY 3 8,936 8,097 10% 2,834 2,438 16%TURKEY 2 5,390 5,921 (9%) 6,176 7,346 (16%)PORTUGAL 2 3,926 4,048 (3%) 589 851 (31%)FINLAND 2 3,611 3,823 (6%) 977 762 28%BELGIUM 1 3,239 3,511 (8%) 2,762 2,152 28%GREECE 3 3,173 3,087 3% 776 377 106%SWITZERLAND 1 3,079 2,404 28% 861 887 (3%)NORWAY 1 2,707 2,876 (6%) 1,508 1,091 38%DENMARK 2 2,252 2,079 8% 843 670 26%GERMANY 1 1,656 1,560 6% 298 229 30%Total 50 301,472 288,365 5% 164,404 136,294 21%
Source: Bloomberg. Deloitte analysis

EPoC 2015 | European Powers of Construction
7
Top 50 EPoC – ranking by salesFY 2015
Rank 2015 Company Country FY End
Sales 2015 (€
m)
% Variation 2015 vs 2014 (a)
EBIT 2015 (€ m)
Market Capitalisation
2015 (€ M)
Ranking 2015 vs 2014 (b)
1 VINCI SA France Dec 15 38,518 (0%) 3,758 34,801 =2 ACTIV. DE CONSTR. Y SERV. SA (ACS) Spain Dec 15 34,925 0% 1,439 8,501 =3 BOUYGUES SA France Dec 15 32,428 (2%) 941 12,613 =4 SKANSKA AB Sweden Dec 15 16,363 4% 672 7,373 =5 EIFFAGE SA France Dec 15 14,060 1% 1,431 5,493 =6 STRABAG SE Austria Dec 15 13,123 5% 341 2,419 =7 BALFOUR BEATTY PLC United Kingdom Dec 15 11,633 7% (251) 2,528 =8 FERROVIAL SA Spain Dec 15 9,701 10% 901 15,270 =9 KONINKLIJKE BAM GROEP NV Netherlands Dec 15 7,423 1% (11) 1,387 � 110 NCC AB Sweden Dec 15 6,681 7% 325 3,088 � 311 ACCIONA SA Spain Dec 15 6,544 1% 627 4,528 =12 FOMENTO DE CONSTR. Y CONTRATAS SA (FCC) Spain Dec 15 6,476 2% 324 1,824 =13 CARILLION PLC United Kingdom Dec 15 6,320 25% 288 1,767 � 114 INTERSERVE PLC United Kingdom Dec 15 5,000 22% 101 1,025 � 415 BARRATT DEVELOPMENTS PLC United Kingdom Jun 15 4,931 30% 756 8,625 � 4 16 PEAB AB Sweden Dec 15 4,744 (1%) 108 2,082 � 117 SALINI IMPREGILO SPA Italy Dec 15 4,739 13% 273 1,98018 KIER GROUP PLC United Kingdom Jun 15 4,395 23% 80 1,909 � 319 OBRASCON HUARTE LAIN SA (OHL) Spain Dec 15 4,369 17% 685 1,575 � 120 TAYLOR WIMPEY PLC United Kingdom Dec 15 4,326 30% 870 8,974 � 3 21 ENKA INSAAT VE SANAYI AS Turkey Dec 15 4,105 (6%) 560 5,704 � 522 PERSIMMON PLC United Kingdom Dec 15 3,998 25% 863 8,427 � 223 MORGAN SINDALL PLC United Kingdom Dec 15 3,285 19% (14) 445 � 524 CFE Belgium Dec 15 3,239 (8%) 266 2,762 � 225 PORR AG Austria Dec 15 3,140 4% 88 813 =26 GALLIFORD TRY PLC United Kingdom Jun 15 3,079 45% 177 2,015 � 627 IMPLENIA AG Switzerland Dec 15 3,079 28% 81 861 � 328 SACYR VALLEHERMOSO SA Spain Dec 15 2,949 2% 148 939 � 229 ASTALDI SPA Italy Dec 15 2,855 8% 277 553 =30 VEIDEKKE ASA Norway Dec 15 2,707 (6%) (1) 1,508 � 331 MOTA ENGIL SGPS SA Portugal Dec 15 2,434 3% 168 457 =32 ORANJEWOUD NV Netherlands Dec 15 2,306 8% 39 471 N/A33 BELLWAY PLC United Kingdom Jul 15 2,339 30% 487 4,195 � 334 INTERIOR SERVICE GROUP PLC United Kingdom Jun 15 2,162 22% (14) 118 � 435 KELLER GROUP PLC United Kingdom Dec 15 2,152 8% 89 812 � 136 HEIJMANS NV Netherlands Dec 15 1,979 6% (29) 175 � 137 LEMMINKAINEN OYJ Finland Dec 15 1,879 (8%) 37 320 � 438 COSTAIN GROUP PLC United Kingdom Dec 15 1,814 36% 41 517 �639 YIT OYJ Finland Dec 15 1,732 (3%) 82 657 � 240 BAUER AKTIENGESELLSCHAFT Germany Dec 15 1,656 6% 91 298 � 141 ELLAKTOR SA Greece Dec 15 1,533 (1%) 29 250 � 142 TEIXEIRA DUARTE ENGENHARIA E CONSTRUÇOES SA Portugal Dec 15 1,492 (11%) 125 132 � 343 JM AB Sweden Dec 15 1,490 (5%) 160 2,024 � 344 PER AARSLEFF A/S Denmark Sep 15 1,376 20% 65 626 � 345 TREVI GROUP Italy Dec 15 1,342 7% (88) 302 =46 TEKFEN HOLDING AS Turkey Dec 15 1,285 (17%) 39 472 � 347 GEK TERNA Greece Dec 15 972 4% 79 153 N/A48 MT HOJGAARD Denmark Dec 15 876 (6%) 47 217 =49 BALLAST NEDAM NV Netherlands Dec 15 850 (27%) (50) 48 � 350 METKA Greece Dec 15 668 10% 113 373 N/A
(a) % variation is calculated over total sales included in 2014 s financial statements, without considering any subsequent restatement.(b) Financial data of companies with functional currency other than the Euro is converted into Euros, using the exchange rate prevailing at year end for balance sheet data, and the average
exchange rate for the year for income statement data.

EPoC 2015 | European Powers of Construction
8
Top 20 EPoC – ranking by market capitalisation
Since 2012 the Top 20 EPoC 2015 ranking by market capitalisation has been headed by Vinci, Ferrovial and Bouygues, which represent 38% of the total market capitalisation attained by our EPoC. Vinci achieved the highest increase in absolute terms (almost EUR 8,000 million), while Taylor Wimpey attained the most significant percentage growth (56%). Compared to 2014, the newcomers to the Top 20 ranking are Peab, Galliford and Salini Impregilo, which are ranked in 17th, 19th and 20th position, respectively.
Total aggregate market capitalisation of the EPoC jumped to EUR 143,402 million, which means that the market value of most of our EPoC is higher than it was prior to the beginning of the financial crisis in 2007. The stock market performance of EPoC was above the average growth rate achieved in the Eurozone: while the Euro
Stoxx 50 Index grew by 4% in 2015, market capitalisation of the Top 20 EPoC increased by 24% compared to 2014 (20% growth for the Top 50 full ranking).
At 31 December 2015, Vinci had reinforced its position as the European construction leader in terms of market value, increasing the gap with its closest rival, Ferrovial, from EUR 14,822 million in 2014 to EUR 19,531 million in 2015. Overall, total market capitalisation of French EPoC increased by 30%, compared to an 8% rise in the CAC 40 Index.
Total market capitalisation of the Spanish construction groups in the Top 20 EPoC increased by 16%, while the IBEX 35 index fell by 7%. Noteworthy were the 41% and 27% market capitalisation growths achieved by Acciona and Ferrovial.
Rank Company COUNTRY Market
Capitalisation (€ m) 2015
Market Capitalisation
(€ m) 2014
Variation 2015 vs
2014
Ranking change on
2014 1 VINCI SA FRANCE 34,801 26,851 30% -2 FERROVIAL SA SPAIN 15,270 12,029 27% -3 BOUYGUES SA FRANCE 12,613 10,070 25% -4 TAYLOR WIMPEY PLC UNITED KINGDOM 8,974 5,756 56% � 55 BARRATT DEVELOPMENTS PLC UNITED KINGDOM 8,625 5,998 44% � 36 ACTIV. DE CONSTR. Y SERV. SA (ACS) SPAIN 8,501 9,116 (7%) � 27 PERSIMMON PLC UNITED KINGDOM 8,427 6,198 36% -8 SKANSKA AB SWEDEN 7,373 7,505 (2%) � 39 ENKA INSAAT VE SANAYI AS TURKEY 5,704 6,712 (15%) � 3
10 EIFFAGE SA FRANCE 5,493 3,886 41% -11 ACCIONA SA SPAIN 4,528 3,218 41% -12 BELLWAY PLC UNITED KINGDOM 4,195 3,043 38% � 113 NCC AB SWEDEN 3,088 2,845 9% � 114 CFE BELGIUM 2,762 2,152 28% � 115 BALFOUR BEATTY PLC UNITED KINGDOM 2,528 1,877 35% � 416 STRABAG SE AUSTRIA 2,419 2,072 17% � 117 PEAB AB SWEDEN 2,082 1,732 20% � 518 JM AB SWEDEN 2,024 2,043 (1%) -19 GALLIFORD TRY PLC UNITED KINGDOM 2,015 1,361 48% � 620 SALINI IMPREGILO SPA ITALY 1,980 1,501 32% � 3
Source: Bloomberg

EPoC 2015 | European Powers of Construction
9
0 5000 10000 15000 20000 25000 30000 35000
VINCI
FERROVIAL
BOUYGUES
TAYLOR WIMPEY
BARRATT
ACS
PERSIMMON
SKANSKA
ENKA
EIFFAGE
ACCIONA
BELLWAY
NCC
CFE
BALFOUR
STRABAG
PEAB
JM
GALLIFORD
SALINI IMPREGILO
Market Capitalisation 2015 vs 2007
2007 2011 2015
1,980 + 8% vs 2007
2,015 + 127% vs 2007
2,024 + 62% vs 2007
2,082 + 75% vs 2007
2,419 - 56% vs 2007
2,528 - 14% vs 2007
2,762 + 201% vs 2007
3,088 + 96% vs 2007
4,195 + 97% vs 2007
4,528 - 66% vs 2007
5,493 - 12% vs 2007
5,704 - 47% vs 2007
7,373 + 36% vs 2007
8,427 + 156% vs 2007
8,501 - 39% vs 2007
8,625 + 69% vs 2007
8,974 + 209% vs 2007
12,613 - 36% vs 2007
15,270 + 173% vs 2007
34,801 + 47% vs 2007
There are six UK groups in this Top 20 ranking. Compared to 2014, their total market value rose by 43% (32% in local currency). The performance of these companies is outstanding considering the 5% drop in the FTSE 100 index. As at December 2015, these UK groups had exceeded the market value recorded at the end of 2007 by 102%.
Among other countries, it should be noted that there are four Swedish groups in the ranking, with a total market value of EUR 14,567 million (+3% compared to 2014). The Turkish Enka Group dropped two positions but is still ranked in the Top 10. Lastly, CFE, Strabag and Salini Impregilo’s market capitalisation grew by 28%, 17% and 32% in 2015.
The aggregate market capitalisation of our Top 20 EPoC at the end of 2015 was 12% and 96% higher than in 2007 (just before the financial crisis) and 2011, respectively. 13 of our Top 20 EPoC show market capitalisation increases in the period 2007-2015, with Taylor Wimpey and CFE leading the ranking (in relative terms) with 209% and 201% increases. On the contrary, 7 of our Top 20 EPoC suffered a market capitalisation decrease, with Acciona and Strabag experiencing the most significant decreases (66% and 56%, respectively).
.
EPoC 2015 | European Powers of Construction
10
Outlook for the construction industry in the EU
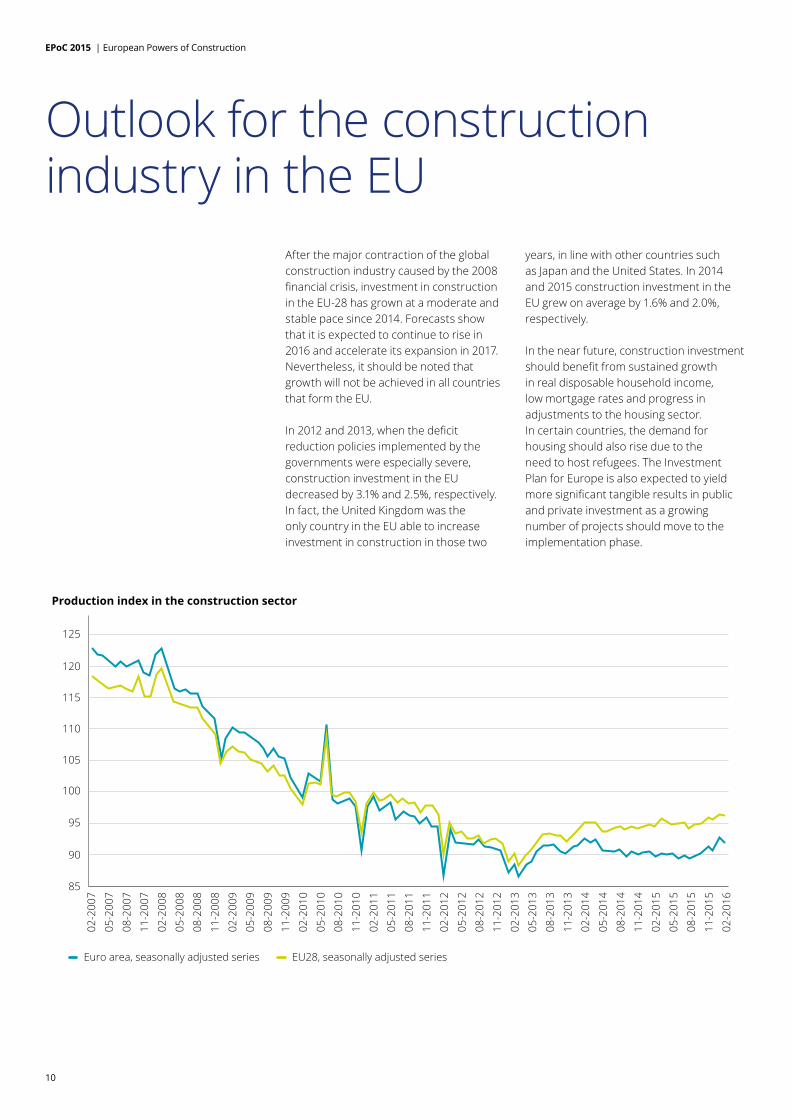
After the major contraction of the global construction industry caused by the 2008 financial crisis, investment in construction in the EU-28 has grown at a moderate and stable pace since 2014. Forecasts show that it is expected to continue to rise in 2016 and accelerate its expansion in 2017. Nevertheless, it should be noted that growth will not be achieved in all countries that form the EU.
In 2012 and 2013, when the deficit reduction policies implemented by the governments were especially severe, construction investment in the EU decreased by 3.1% and 2.5%, respectively. In fact, the United Kingdom was the only country in the EU able to increase investment in construction in those two
years, in line with other countries such as Japan and the United States. In 2014 and 2015 construction investment in the EU grew on average by 1.6% and 2.0%, respectively.
In the near future, construction investment should benefit from sustained growth in real disposable household income, low mortgage rates and progress in adjustments to the housing sector. In certain countries, the demand for housing should also rise due to the need to host refugees. The Investment Plan for Europe is also expected to yield more significant tangible results in public and private investment as a growing number of projects should move to the implementation phase.
Production index in the construction sector
125
02-2
007
05-2
007
08-2
007
11-2
007
02-2
008
05-2
008
08-2
008
11-2
008
02-2
009
05-2
009
08-2
009
11-2
009
02-2
010
05-2
010
08-2
010
11-2
010
02-2
011
05-2
011
08-2
011
11-2
011
02-2
012
05-2
012
08-2
012
11-2
012
02-2
013
05-2
013
08-2
013
11-2
013
02-2
014
05-2
014
08-2
014
11-2
014
02-2
015
02-2
016
05-2
015
08-2
015
11-2
015
120
115
110
105
100
95
90
85
Euro area, seasonally adjusted series EU28, seasonally adjusted series

EPoC 2015 | European Powers of Construction
11
An analysis of forecast EU construction investment in 2015, 2016 and 2017 highlights the following:
• According to the European Commission Spring 2016 European Economic Forecast, construction investment in the EU will grow in 2016 and 2017 by 2.4% and 3.1%. In this context, it should be noted that since our EPoC 2014 publication was released, expectations have been lowered, especially for 2016 (from 3.5% to the current 2.4%). Among the eurozone countries, the trend for coming years is expected to be in line with the figures projected for the EU as a whole.
Investment in construction, volume (percentage change on preceding year, 1997-2017)
5-year averages Spring 2016 forecast
1997-01 2002-06 2007-11 2012 2013 2014 2015 2016 2017
Belgium 0.2 2.7 1.5 3.4 (4.0) 4.1 1.4 1.2 3.2 Germany (1.7) (2.3) 1.3 0.5 (1.1) 2.9 0.3 2.8 1.9 Estonia 7.4 17.7 (5.7) (6.6) (2.8) (2.4) 2.0 3.3 4.0 Ireland 9.8 8.1 (18.4) (1.3) 12.4 9.7 8.9 11.7 9.4 Greece 4.8 3.7 (11.6) (16.3) (16.1) (16.4) (10.6) (3.5) 8.0 Spain 7.2 6.6 (8.4) (8.3) (7.1) (0.2) 5.3 3.5 5.1 France 3.4 3.0 (0.8) (1.7) (0.9) (3.1) (2.1) (0.1) 2.8 Italy 2.5 2.8 (4.1) (9.3) (8.0) (5.0) (0.5) 2.4 2.8 Cyprus 0.4 10.9 (4.3) (18.3) (21.0) (12.8) (5.2) 9.5 4.3 Latvia 13.0 18.0 (8.0) 20.0 (10.3) 3.8 (4.1) N/A N/ALithuania 4.2 13.9 (3.9) (4.4) 8.0 7.9 8.2 2.7 3.2 Luxembourg 5.7 3.7 1.7 (9.5) (1.0) 5.1 1.4 4.6 3.9 Malta N/A 4.2 (7.9) 16.9 (7.2) 16.9 (0.4) N/A N/ANetherlands 3.7 0.4 (2.2) (10.6) (6.6) 4.3 12.3 7.2 4.3 Austria (0.3) 0.2 (1.7) 2.2 (2.1) (1.0) (1.2) 0.8 1.3 Portugal 6.5 (3.8) (5.2) (20.0) (12.1) (3.0) 4.3 1.7 3.1 Slovenia 5.0 2.7 (7.8) (6.5) (7.8) 12.1 (5.3) (14.3) 3.9 Slovakia 1.6 6.7 (3.0) (8.8) 4.1 (3.9) 11.6 2.4 5.7 Finland 6.7 2.9 0.5 (5.1) (3.8) (3.3) (1.1) 3.1 2.1 Euro area 1.2 2.1 (2.9) (4.2) (3.6) (0.5) 0.9 2.3 3.0 Bulgaria N/A 18.6 (2.0) 9.5 (0.5) (4.1) 2.5 (4.4) (0.1)Czech Republic (4.0) 3.9 (0.5) (3.2) (5.0) 2.2 8.3 (4.1) 2.3 Denmark 2.7 5.0 (6.2) (0.9) (0.2) 2.4 0.6 1.5 2.6 Croatia N/A N/A N/A N/A N/A N/A N/A N/A N/AHungary 3.7 3.2 (5.8) (8.4) 10.9 11.0 3.7 0.2 3.8 Poland 6.0 4.1 7.4 (1.1) (5.0) 11.7 4.9 3.0 4.6 Romania (2.1) 11.5 4.7 15.2 (15.0) (2.9) 8.3 2.7 5.9 Sweden 2.9 6.1 (1.0) (0.3) (1.3) 15.1 10.0 4.4 3.1 United Kingdom 4.9 2.8 (3.3) 0.1 4.9 8.4 4.0 3.4 3.1 EU 2.4 2.4 (2.7) (3.1) (2.5) 1.6 2.0 2.4 3.1 USA 3.7 1.1 (7.8) 6.9 2.6 3.6 4.5 4.0 4.3 Japan (4.3) (3.5) (3.8) 2.9 4.5 (0.3) N/A N/A N/A
Source: European Commission.
• The Netherlands, Slovakia and Sweden achieved the highest growth rates in the EU for 2015 (above 10%). On the contrary, countries such as Greece, Cyprus and Slovenia reduced their investment in construction in 2015 compared to 2014.
• In 2016, the growing economies will be Ireland, Cyprus and the Netherlands while Greece, France, Slovenia, Bulgaria and the Czech Republic are expected to reduce investment in construction. Growth rates in 2017 are expected to be achieved by all EU-28 countries except Bulgaria.

EPoC 2015 | European Powers of Construction
12
• Despite the average growth rates for the EU-28 achieved in 2014 and 2015, they were well below (more than 2 percentage points) those achieved in the United States. Construction industry growth in the US is expected to continue to outperform EU-28 rates in 2016 and 2017.
• Lastly, despite the growth rates achieved in 2015 and the optimistic expectations for 2016 and 2017, investment in construction in the euro area is still 22% below the figures recorded in 2007. Belgium, Germany, Sweden and Poland are the only four countries with an increase in investment volume in that period, and there is a significant forecast decrease in construction investment in countries such as Greece (-74%), Ireland (-52%), Portugal (-48%), Spain (-44%), Romania (-39%) and Italy (-36%).
Construction Investment variation 2015-2007
(80) (70) (60) (50) (40) (30) (20) (10) 0 10 20 30 40
Poland
Sweden
Germany
Belgium
UK
Luxembourg
Czech Republic
Austria
France
Slovakia
Hungary
Finland
Netherlands
Euro Area
Denmark
Bulgaria
Italy
Romania
Spain
Portugal
Ireland
Greece (74)
(52)
(48)
(44)
(39)
(36)
(33)
(26)
(22)
(20)
(18)(18)
(17)
(16)
(12)
(9)
(8)
(5)
6
10
10
20
Source: Ameco
Source: Ameco, May 2015
Construction Investment in 2015 (€bn)
2015 2014 2013
0
50
100
150
200
250
300
Mal
ta
Cyp
rus
Lat
via
Est
onia
Slo
veni
a
Lux
embo
urg
Lith
uani
a
Bul
garia
Slo
vaki
a
Hun
gary
Gre
ece
Irel
and
Por
tuga
l
Cze
ch R
epub
lic
Rom
ania
Den
mar
k
Fin
land
Aus
tria
Sw
eden
Bel
gium
Pol
and
Net
herla
nds
Spa
in
Ital
y
Uni
ted
King
dom
Fra
nce
Ger
man
y
298
248 245
136
112
6247 45 46
35 23 22 18 18 14 14 8 11 7 5 4 5 3 3 3 1 1

EPoC 2015 | European Powers of Construction
13
Total construction investment in the EU amounted to EUR 1,434 billion, 5% higher than in 2014. Since 2013 the three largest construction markets in Europe have been Germany, France and the United Kingdom. The Top 5, which also includes Italy and Spain, represented 72% of total construction investment in the European Union in 2015. In those countries, construction investment represents between 9.6% and 11.4% of total GDP and grew by 5.4% in 2015. Nevertheless, among the major countries, France and Italy reduced their construction investment compared to the previous year.
Through the analysis of the construction investment / GDP ratios and GDP per capita, there seems to be a slight inverse correlation between GDP per capita and
construction investment as a percentage of GDP. In this context, the countries that recorded construction investment / GDP ratios of above 9% have an average GDP per capita of EUR 32,998, 28% lower than the average GDP per capita recorded by countries with inferior construction investment ratios (EUR 42,419, excluding Greece).
Furthermore, there seems to be a slight negative correlation between construction investment and GDP growth, which would contradict the widespread opinion that infrastructure investment is clearly pro-cyclical. The different stages of the infrastructure stock in each country and the low levels of construction investment in the majority of the countries in recent years might explain this apparent contradiction.
FRA
POL
FIN
GER BEL
UK
ROM HUN
AUT
LUX
IRLSWE
CZ ITA
NL DEN
SPA
SVK
BUL
0
10,000
20,000
30,000
40,000
50,000
60,000
4% 6% 7% 8% 9% 10% 11% 12%
GD
P PE
R CA
PITA
(€)*
Construction Investment/ GDP %**
85,000
GREPOR
Trend line excluding countries affected by PPS1 Trend line with all countries analyzed
R2= 0.0124
R2= 0.1822
Source: * International Monetary Fund ** Ameco 1 Ireland, Greece, Portugal, Spain, Hungary and Romania are affected by the Post-Programme Surveillance (PPS).

EPoC 2015 | European Powers of Construction
14
FRA
POR
POL
FIN
GER
BEL
ROM
HUN
AUT
GRE
SWE
CZ
ITA
LUX
NL
DEN
SPA SVK
BUL
(6.0%)
(4.0%)
(2.0%)
0.0%
2.0%
4.0%
6.0%
8.0%
4% 5% 6% 7% 8% 9% 10% 11% 12%
GD
P VA
RIAT
ION
*
Construction Investment/ GDP %**
IRL
R2= 0.0303
Source: * International Monetary Fund ** Ameco

EPoC 2015 | European Powers of Construction
15
Top 20 EPoC strategies: internationalisation and diversification
Taking into account the different levels of internationalisation and diversification achieved by the most significant EPoC in terms of total sales, four main categories were identified in previous editions of European Powers of Construction. Here we examine the 2015 performance across each of these four categories:
Domestic construction groupsThis category is composed of companies that are mainly focused on construction activities carried out in their domestic markets. This division is currently represented by Bouygues, Peab, Taylor Wimpey and Barratt Developments. In comparison with 2014, Vinci has moved to the “International construction groups” category after several years of increases in its internationalisation, while Taylor Wimpey is included in this analysis for the first time since 2015 (it was ranked 23rd in 2014).
Bouygues, 3rd in the ranking by sales volume and market capitalisation, has a strong presence in France. Although its international activity is significant (EUR 12,370 million in sales abroad), it still obtains over 60% of its revenue from the domestic market. In addition, over the last few years Bouygues has focused its portfolio on construction activities, which accounted for over 80% of total sales in 2015. Nevertheless, it should be considered that, given the significant value and growth of its international order book over the last years, Bouygues could be moved to the “International construction groups” category in the coming years.
There are two UK companies in this category: Barrat Developments and Taylor Wimpey. Their diversification and internationalisation levels are both below 5% since their total revenues are generated mainly through residential building construction based in the UK.
Peab, which is the third-largest Swedish listed construction group by sales, has not significantly changed its diversification strategy or its international presence since 2010. A strong Swedish housing market has strengthened its position as a “Domestic construction group”.
The groups included in this category obtained total sales of EUR 46,428 million in 2015. Up to 84% of their total income was obtained from construction activities, with 60% of total sales earned locally. The conversion of Vinci into an international construction group as well as the increasing internationalisation of Bouygues are examples of the trend towards internationalisation.
International construction groupsThis category is represented by construction groups with a relatively low level of diversification that obtain more than 40% of their total revenue beyond their domestic markets.
The Vinci Group, which was classified as a domestic construction group until 2014, moved to this category in 2015 as a result of its positive performance in foreign markets. Vinci’s international expansion gained momentum during the year and,
as a result, the group generated more than 40% of its revenue outside France for the first time ever in 2015. This increase is attributable to new contracts awarded outside France, in particular, roadworks in the United States and Central Europe, port works in Africa, and a large number of building and infrastructure projects in the Middle East and Asia.
ACS and OHL, the only Spanish companies in this category, recorded similar levels of diversification and internationalisation. These companies are the most diversified groups within this category, with non-construction sales representing over 20% of total revenue. While ACS’s international sales remain in line with 2014, OHL increased its sales abroad by 25% compared to the previous year. The positive figures achieved by OHL in the international marketplace are partially explained by its strong performance in the United States, Mexico and the Middle East.
Skanska’s international activities are mainly focused in America, and represented almost 80% of its total income in 2015. Its performance was particularly strong in Finland and Poland, while the US was negatively affected by cost increases in certain projects. Internationalisation and diversification rates did not significantly change in the year.
Balfour Beatty, which moved to this category in 2014 mainly due to the sale of Parsons Brinckerhoff (its most significant subsidiary in the professional services division), obtained around 55% of total sales abroad (52% in 2014). Its

EPoC 2015 | European Powers of Construction
16
0 10 20 30 40 50 60 70 80 90 100
0
10
20
30
40
50
60
70
80
90
100
INTERSERVE
KIER
EIFFAGE
CARRILLION
BARRATT TAYLOR WIMPEY
PEAB
FCC
ACCIONA
FERROVIAL
BOUYGUES
VINCI
NCC
BALFOUR
BAM
OHL
ACS
SKANSKA
SALINI IMPREGLIO STRABAG
Non
-con
stru
ctio
n re
venu
es /
tota
l rev
enue
s %
International revenues / Total revenues %
"Domestic" Conglomerates
"Domestic" Construction Groups
International Construction Groups
International Conglomerates
Variation from 2010 to 2015
Source: Deloitte analysis
non-construction activities, such as real estate or industrial and services activities, are not representative enough for Balfour Beatty to fall within the “International conglomerate” category.
The Italian group Salini Impregilo is classified as an “International construction group”, given that 85% of its sales are obtained abroad and its non-construction activities are not significant. International activities are performed across the five continents, mainly in Africa, the Middle East and the Americas. Some of the most representative international projects are the extension of the Panama Canal, Riyadh underground (line 3), the “Red Line North Underground” Doha Metro System and the Grand Ethiopian Renaissance Dam project.
The relatively small size of and fierce competition within their local markets in prior years boosted the internationalisation strategies of certain companies such as NCC (Sweden), Strabag (Austria) and
Konnilijke BAM (the Netherlands). In 2015 all of these companies obtained at least 50% of their total income abroad, with non-construction activities representing less than 5% of total sales.
In 2015, the “International construction” category included most of the companies in our Top 20 EPoC by sales (up to nine groups fall within this category). Total revenue recorded by these groups amounted to EUR 137,774 million compared to EUR 106,401 million in 2010.
Domestic conglomeratesThe “Domestic conglomerates” category is represented by companies that have diversified their business portfolio to non-construction activities but conduct most of their business in their respective local markets. Compared to 2014, the main novelty in this group is the UK group Kier, which in 2015 was ranked among the Top 20 groups in terms of total sales.
Carillion, whose internationalisation remained in line with the previous year, slightly reduced the diversification of its portfolio from 61% in 2014 to 59% in 2015. Non-construction activities are represented by the Support Services Division which maintains and operates buildings and infrastructures, notably for large property estates and for transport and utility networks.
Unlike Carillion, Interserve increased its international presence in 2015 due to its positive performance in markets such as Dubai, Oman and Qatar. This trend is expected to continue in the coming years as a result of the significance of its international backlog.
Eiffage, characterised by a growth strategy focused on local markets, continued to develop its energy and concession businesses. Nevertheless, as a result of the strong performance of the public works

EPoC 2015 | European Powers of Construction
17
division (construction), its diversification rate decreased to 43% of total sales. Activities in local markets accounted for 82% of the Group’s revenue.
Lastly, the UK group Kier obtained almost 49% of total sales from non-construction activities represented by its services division, which includes capabilities in highway maintenance, utilities and environmental services.
Since 2010 the groups included in this category have achieved a EUR 5,851 increase in total sales, obtaining total revenue of EUR 29,776 million.
International conglomeratesThe “International conglomerates” category, now represented by three companies, is composed of groups with highly diversified portfolios and a strong international presence.
In 2015 only three Spanish companies (Acciona, FCC and Ferrovial) were included in this group. The growth achieved by these players in the international marketplace offset the contraction noted in their local market, which was severely affected by the economic recession.
Ferrovial, the Spanish group ranked 8th in terms of total sales and 2nd in terms of market value, obtained 56% of total sales from non-construction activities and 72% from international operations. In May 2016, the Group strengthened the position of its services division with the acquisition of Broadspectrum, an Australian listed company with EUR 2,641 million in sales in 2015 that will increase its internationalisation and diversification levels in the coming year.
Acciona obtained around 50% of 2015 total sales outside Spain, mainly in Europe and in other OECD countries. It is worth noting that Acciona is one of the most diversified companies within our EPoC, with strong energy and logistic transport services divisions. Internationalisation and diversification rates rose in 2015 due to the development of certain significant projects such as the Peace River hydroelectric plant
in Canada and desalination and potable water treatment plants in Qatar.
In 2015 FCC recorded the highest level of diversification in the Top 20 Epoc in relative terms. However, the group’s international activities represented 47% of total sales, which is slightly lower than the average attained by our EPoC (52% average for the Top 20 companies). Some noteworthy international projects are the Riyadh underground (line 5) and the “Red Line North Underground” Doha Metro System which is being developed as a joint venture with Salini Impregilo.
Total sales recorded by the groups included in this category amounted to EUR 22,721 million in 2015. Up to 63% of total income was obtained from non-construction activities, while 59% was generated abroad.
Trends in internationalisation and diversification 2010-2015An analysis of changes in the degree of internationalisation and diversification since 2010 shows that most of our Top 20 EPoC have remained in the same category throughout this period. Nevertheless, the following considerations may be highlighted:
• In 2015 international sales and non-construction revenue represented 52% and 24.3%, respectively, of the total income recorded by the Top 20 EPoC. Internationalisation levels were almost 9 percentage points higher than in 2010, while diversification was approximately 5 percentage points lower.
• Among the French groups, since 2010 Vinci has reinforced its international presence in areas such as Europe (especially Germany and the United Kingdom), America, Asia and the Middle East. On the other hand, the importance of Bouygues’ non-construction business has dropped by 6 percentage points as a result of the growth of its construction activities and a slight contraction of the Media and Telecom businesses.
• With regard to the Spanish groups, ACS’s internationalisation rate increased by
51%, while diversification decreased by 38% after June 2011 as a result of the integration of Hochtief. Ferrovial’s international presence strengthened in markets such as the United States and United Kingdom. Also, Ferrovial has carried out remarkable development of its services division in recent years. On the other hand, since 2011 Ferrovial does not consolidate Heathrow Airports Holdings that is now an equity subsidiary. Since 2010 Acciona has strengthened its internationalisation strategy as well as its non-construction business, mainly due to the performance of the energy segment in international markets. The evolution noted for FCC is mainly a result of the deconsolidation of its Austrian construction subsidiary Alpine in 2013. Lastly, the contraction of the local market, together with the divestments of its Brazilian and Chilean concessions in 2012, impacted on the internationalisation and diversification levels attained by OHL.
• Among the UK groups, the main deviations were identified at Balfour Beatty, Interserve and Kier. As a result of the sale in 2014 of Parsons Brinckerhoff (professional services business), the importance of non-construction revenues for Balfour Beatty in relative terms decreased by 12%. On the other hand, Kier increased its diversification by 16 percentage points as a result of the positive performance of the Group’s services division. With regard to Interserve, it should be pointed out that sales in the UK rose by more than 50% since 2010, while the support services division has doubled its sales in recent years.
• Other significant variations relate to BAM and the Swedish group Peab. BAM’s international business has been consolidated as a result of the growth achieved in countries such as the United Kingdom. Peab has increased its diversification by 3% since 2010 as a result of the growth achieved by the industrial division.

EPoC 2015 | European Powers of Construction
18
(35%) (5%) 0% 5 10% 15% 20% 25% 55%
(40%)
(15%)
(10%)
(5%)
0%
5%
10%
15%
20%
25%
55%
Diversification level variation 2015 vs 2010
Average variation: 9%
Average variation: -5 %
Internationalisation level variation 2015 vs 2010 TAYLOR WIMPEY
ACS
SKANSKA STRABAG
BARRATT
CARRILLION
KIER GROUP
FCC
NCC AB
EIFFAGE
PEAB AB
VINCI
FERROVIAL
BALFOUR BEATTY SALINI IMPREGLIO
BOUYGUES
INTERSERVE
BAM
OHL
ACCIONA SA
Source: Deloitte analysis
2015-2010
Company Internationalization % variation
Diversification % variation
VINCI 5% (0%)ACS 51% (38%)BOUYGUES 7% (6%)SKANSKA (3%) 1% EIFFAGE 3% (2%)STRABAG (0%) 0% BALFOUR BEATTY 2% (12%)FERROVIAL 3% (7%)BAM 11% (2%)NCC AB 2% 0% ACCIONA SA 20% 20% FCC 1% 24% CARRILLION 2% 12% INTERSERVE 10% 4% BARRATT - (0%)PEAB AB 3% 3% SALINI IMPREGLIO 7% (10%)KIER GROUP 4% 16% OHL 13% (12%)TAYLOR WIMPEY (31%) 0% AVERAGE 9% (5%)

EPoC 2015 | European Powers of Construction
19
EPoC 2015 financial performance
2015 was a good year in terms of financial results for our Top 20 EPoC. Aggregate sales increased by 4%, aggregate EBIT by 17% and net income by 13%. In addition, our EPOC improved their financial structure by decreasing their indebtedness by 14%, thus improving their net debt to EBITDA ratio. The positive figures achieved boosted their market capitalisation, which grew by over 20% in the year. As a result, ratios such as enterprise value to EBITDA and net debt to market capitalisation were also improved.
The most notable aspects of the financial performance of our Top 20 EPoC are as follows:
EBIT marginThe analysis of EPoC 2015 profitability levels must be carried out by differentiating between the construction business and other activities. Based on the figures obtained in the last three years, the following conclusions may be drawn:
• EBIT Margins from construction activities have remained quite stable since 2013, while profitability from other activities has been more volatile. On average, construction margins reached 3.4% in 2015, a slight increase on the figures recorded in 2014 and 2013. The EBIT margin from non-construction activities increased significantly in 2015 to 13%, from 11.6% in 2014 and 8.9% in 2013. As a result of the foregoing, total EBIT margins reached 5.8% in 2015, representing substantial growth from the 5.1% and 4.5% achieved in 2014 and 2013, respectively.
• It is noteworthy that fourteen of the twenty groups analysed were able to improve their EBIT margin during the year. Only Balfour Beatty and BAM recorded negative total EBIT margins in
2015. Margins obtained by groups such as Taylor Wimpey, Barratt Developments and OHL are the highest of the Top 20 EPOC, mainly due to the weight of the residential building construction business in the case of the UK companies and the concession business in the case of OHL.
• With regard to construction activities, some UK housebuilders (Taylor Wimpey and Barratt Developments) recorded the highest construction margins, followed by Ferrovial, which recorded the highest margins among all companies mainly focused on civil engineering and industrial activities. Excluding the two housebuilders, average construction EBIT margins would be set at the level of 2.64% in 2015 and 2.55% in 2014.
• Worthy of note is the fact that three of the Top 20 EPoC recorded negative margins in their construction activity in 2015: FCC, OHL and Balfour Beatty (OHL and Balfour Beatty also recorded negative margins in 2014). In the case of the UK group, the losses recorded are due to historic issues in the UK, US and Middle East that resulted in profit write-downs and contract provisions. For the Spanish OHL Group, the losses recorded are explained by the increasing importance of projects in developed economies (with lower margins but higher cash conversion cycles) as well as the delay in the execution of certain contracts. FCC construction margins are impacted by restructuring costs incurred but also by the contraction of its domestic market.
Over the last six years, EBIT from construction activities has averaged 3.27% on sales, and EBIT from non-construction activities has averaged 12.11% for a total average EBIT margin of 5.48%.

EPoC 2015 | European Powers of Construction
20
EBIT / Sales
Construction activities Other activities Total
Company 2015 2014 2013 2015 2014 2013 2015 2014 2013
TAYLOR WIMPEY PLC 20.1% 18.5% 15.5% 22.0% 17.8% 13.5% 20.1% 18.5% 15.5% BARRATT DEVELOPMENTS PLC 15.4% 13.0% 9.7% 10.7% (5.9%) - 15.4% 13.0% 9.7% FERROVIAL SA 8.6% 7.9% 8.9% 9.8% 8.9% 11.4% 9.3% 8.4% 10.1% SALINI IMPREGILO SPA 5.9% 6.3% 7.3% - - - 5.8% 6.2% 6.8% NCC AB 4.9% 4.6% 4.7% - - (21.2%) 4.9% 4.6% 4.6% AVERAGE EPOC 3.4% 3.1% 3.2% 13.0% 11.6% 8.9% 5.8% 5.1% 4.5% VINCI SA 3.4% 3.5% 4.1% 44.7% 43.1% 39.3% 9.8% 9.4% 9.1% CARILLION PLC 3.3% 3.5% 1.8% 5.4% 5.8% 4.9% 4.6% 4.9% 3.7% BOUYGUES SA 3.2% 3.2% 3.9% 1.7% 0.7% 4.4% 2.9% 2.7% 4.0% ACTIV. DE CONSTR. Y SERV. SA (ACS) 3.1% 2.7% 2.4% 6.7% 9.9% 10.7% 4.1% 4.6% 4.3% SKANSKA AB 2.8% 3.5% 3.0% 19.5% 6.2% 19.2% 4.1% 3.8% 4.1% EIFFAGE SA 2.6% 3.3% 3.1% 20.2% 17.6% 16.9% 10.2% 9.7% 9.2% STRABAG SE 2.6% 2.3% 2.1% - - - 2.6% 2.3% 2.1% PEAB AB 2.1% 4.4% (0.5%) 3.3% 2.4% 12.1% 2.3% 4.0% 1.4% KIER GROUP PLC 1.9% 1.6% 1.7% 1.7% 0.7% 4.1% 1.8% 1.2% 2.5% ACCIONA SA 1.9% 1.4% 0.2% 13.4% 13.8% (45.8%) 9.6% 8.8% (26.8%)INTERSERVE PLC 1.0% 1.3% 2.2% 2.6% 1.9% 2.2% 2.0% 1.7% 2.2% KONINKLIJKE BAM GROEP NV 0.3% (0.9%) (0.1%) (14.3%) (12.9%) 12.8% (0.1%) (1.4%) 0.2% FOMENTO DE CONSTR. Y CONTRATAS SA (FCC) (1.0%) 1.3% (9.6%) 7.7% (8.8%) (1.3%) 5.0% (5.5%) (4.5%)OBRASCON HUARTE LAIN SA (OHL) (1.7%) (5.7%) 5.8% 66.0% 82.6% 86.3% 15.7% 16.5% 28.0% BALFOUR BEATTY PLC (4.4%) (5.9%) (0.5%) 4.8% 5.0% 2.3% (2.2%) (3.2%) 0.5%
* EBIT figures, as reported by these Groups, correspond to Operating income from ordinary activities
Net income attributableThe analysis of the net income obtained by the Top 20 EPoC in 2015 allows for the following conclusions to be drawn:
• Total net income obtained by the Top 20 EPoC increased by 13% to reach EUR 6,750 million in 2015. Fourteen of
EBIT Margin
0%
2%
4%
6%
8%
10%
12%
14%
16%
201520142013201220112010
Construcción activities Other activities Total Average 2010-2015
12.9%
6.6% 6.2%
4.0%
3.6%2.6%
3.2% 3.1%
3.4%3.27%
4.9%4.5%
5.1%5.8%
5.48%
13.6%12.4%
8.9%
13%
12.11%11.6%
our EPoC were able to increase their net income in 2015 compared to 2014. Total net income recorded by our EPoC represented 2.9%, 2.6% and 0.6% of total sales obtained in 2015, 2014 and 2013, respectively.

EPoC 2015 | European Powers of Construction
21
• Vinci remains the group with the highest net income of the Top 20 EPoC. Total net income amounted to EUR 2,046 million and represented 30% of total profit obtained by the groups analysed. Despite the fact that profit in 2015 was lower than in the previous year, it should be noted that 2014 was affected by the capital gain obtained on the sale of 75% of Vinci Park’s capital (renamed Indigo in 2015).
• Two Spanish groups are below Vinci in the profit ranking. Ferrovial increased its net income by 80%, to EUR 720 million (reaching the profit levels obtained in 2013 once again) mainly due to the positive performance of the airports and highways divisions. ACS’s net income grew slightly to EUR 725 million.
• Two groups in the Top 20 EPoC incurred losses in 2015: FCC and Balfour Beatty. In the case of Balfour Beatty the losses relate to the construction business, especially in the domestic market, while FCC has suffered losses also in the cement business and following the divestment of the street furniture business.
Net debt / net debt + equityThe highlights of the analysis of the net debt / (net debt + equity) ratio are as follows:
• As in previous years, the average net debt / (net debt + equity) ratio continued to decline as a result of a decrease in net debt plus an increase in total equity of our EPoC. Since 2012, the ratio has decreased by 8 percentage points to 40%.
• By country, the average ratios for Spanish, French and British companies were 50%, 49% and 4% in 2015.
Net Income attributable to the Group
2015 2014 2013
(500)(2,000) 0 500 1,000 (2,000)
BALFOUR
FCC
KIER
BAM
OHL
SALINI IMPREGILO
PEAB
INTERSERVE
STRABAG
CARILLION
ACCIONA
NCC
EIFFAGE
BOUYGUES
SKANSKA
BARRATT
TAYLOR WIMPEY
FERROVIAL
ACS
VINCI

EPoC 2015 | European Powers of Construction
22
• Eiffage and the Spanish groups FCC and Acciona continue to be the groups with the highest ratio while Strabag, Skanska, BAM, Barrat and Taylor Wimpey have sub-zero ratios due to their positive net cash positions.
Net debt / market capitalisationAfter analysing these ratios, the following conclusions may be drawn:
• The average net debt/market capitalisation ratio decreased from 0.54 to 0.38 as a result of the combination of a 14% decrease in net debt and a 23% increase in market capitalisation. By country, Spain, France and the United Kingdom recorded net debt/market capitalisation ratios of 0.7, 0.5 and 0.02, respectively. Although the Spanish groups have the highest ratios of the Top 20 EPoC, it should be noted that their net debt/market capitalisation ratio has fallen by 0.7 points since 2012. The aggregate net debt of the six Spanish companies
included in our Top 50 EPoC amounted to EUR 25,968 million in 2015, a 73% reduction on the EUR 94,597 million recorded in 2007.
• Until 2014, Eiffage recorded the highest net debt to market capitalisation ratio of our EPoC. However, in 2015 the company recorded the highest decrease (from 3.09 to 2.12) driven by both a reduction of net debt and an increase in market value. Other significant reductions in the ratio were achieved by OHL and Acciona. In the case of OHL, the proceeds from the EUR 1,000 million capital increase completed in 2015 were partially used to make significant debt repayments. The evolution noted for Acciona is mainly a result of the significant growth of the Group’s market value (40%).
• As in 2014, Strabag again recorded the lowest ratio as a result of the group’s net cash position (EUR 1,094 million).

EPoC 2015 | European Powers of Construction
23
(60%)
(40%)
(20%)
0%
20%
40%
60%
80%
100%
STR
ABAG
TAY
LOR
WIM
PEY
SKA
NSK
A
BAR
RATT
BAM
SAL
INI I
MPR
EGIL
O
CAR
ILLI
ON
KIE
R
BAL
FOU
R
BO
UYG
UES
PEA
B
NCC
ACS
INTE
RSER
VE
FER
ROVI
AL
VIN
CI
OH
L
ACC
ION
A
EIF
FAG
E
FCC
Total net debt / (Total net debt + Equity)
Average 2013 = 50%Average 2014 = 46%Average 2015 = 40%
Average 2012 = 48%
2015 2014 2013
Source: Deloitte analysis
Net Debt / Market Capitalisation
(0.50)
0.00
0.50
1.00
1.50
2.00
2.50
3.00
3.50
STRA
BAG
TAYL
OR
WIM
PEY
BAR
RATT
BAM
SKA
NSK
A
SAL
INI I
MPR
EGIL
O
KIER
BAL
FOU
R
CAR
ILLI
ON
NCC
PEAB
BOU
YGU
ES
FERR
OVI
ALACS
VIN
CI
INTE
RSER
VE
ACCI
ON
A
EIFF
AGE
OH
L
FCC
2015 2014 2013
Average 2013 = 0.64Average 2014 = 0.54Average 2015 = 0.38
Average 2012 = 0.84
Source: Bloomberg, Deloitte analysis

EPoC 2015 | European Powers of Construction
24
Market capitalisation / book value • In 2015 the average market capitalisation / book value ratio increased by 0.24 to reach 1.97, mainly due to the higher market capitalisation achieved by most of our Top 20 EPoC (market value rose by 23% in comparison with 2014). By country, the Swedish groups recorded the highest ratio (2.75) while France, Spain and the United Kingdom’s ratios were close to 2.
• As in previous years, FCC’s market capitalisation / book value ratio was significantly higher than those achieved by the other nineteen groups in our ranking. Nevertheless, FCC recorded the highest decrease in the year as a consequence of the sharp decrease (42%) in its market capitalisation.
• Excluding FCC, in 2015 nine of the Top 20 EPoC groups recorded market capitalisation / book value ratios above 2. Within this group, Skanska, NCC, ACS and Ferrovial achieved the highest figures. In 2015 only Strabag and OHL recorded market capitalisation / book value ratios below 1.
Intangibles and market value vs. book valueSome of our EPoC have been involved in significant M&A activities as part of their growth strategies. In some cases, the purchase price paid exceeded the value of the assets acquired, as the investor expected to recover its investments from increased cash flows in future years.
Not all those cash flows have materialised and, as a result, our EPoC have recorded significant impairment losses over the last few years. This means that analysts are focusing on the value of the intangible assets and goodwill that arose as a result of the aforementioned M&A transactions. Against this backdrop, the following paragraphs analyse the relationship between market capitalisation, book value and the intangible assets of our EPoC 2015. Four categories can be identified as follows:
• The first category (upper-left quadrant) is made up of groups at which market capitalisaton levels are higher than the book value and which have a relatively low level of intangible assets. This category includes all companies that
Market capitalisation / Book value*
0.0
0.6
1.2
1.8
2.4
3.0
3.6
4.2
4.8
12
650
TAY
LOR
WIM
PEY
OH
L
KIE
R
SAL
INI I
MPR
EGIL
O
PEA
B
BAR
RAT
INTE
RSER
VE P
LC
CAR
ILLI
ON
FCC
ACC
ION
A
NCC
BAM
FER
ROVI
AL
BAL
FOU
R
STR
ABAG
EIF
FAG
E
SKA
NSK
A
BO
UYG
UES
ACS
VIN
CI
2015 2014 2013
Average 2013 = 1.69Average 2014 = 1.73Average 2015 = 1.97
Average 2012 = 1.23
* Book value is equivalent to equity attributable to the equity holders
Source: Bloomberg, Deloitte analysis

EPoC 2015 | European Powers of Construction
25
recognise a low volume of intangible assets (and which, therefore, have a lower theoretical impairment risk compared to other EPoC), for which the stock markets trade at a premium to book value. In 2015 this category comprised six of our Top 20 EPoC companies. Taylor Wimpey, Peab, Ferrovial, Vinci, Skanska and NCC present market capitalisation / book value ratios above 2 and intangibles / market capitalisation ratios below 0.2.
• The second category (lower-left quadrant) includes six of the Top 20 EPoC. This group comprises entities with a low intangible assets volume for which the market is trading at a lower premium compared to the first category and also includes certain groups for which the stock market is trading at a discount to book value. Strabag and OHL are the only companies at which market capitalisation is lower than the book value and, simultaneously, the amount of intangible assets is below market value. Compared to 2014, the position of both groups according to these ratios has not significantly changed.
• The third category (lower-right quadrant) comprises companies with a higher intangible assets volume, for which the market trades at a lower premium than average or is trading at a discount to book value (Carillion). It could be considered that the stock markets are discounting the risk associated with the intangibles assets.
• Lastly, the fourth category (upper-right quadrant) represents companies (four out of the Top 20 EPoC) with a high volume of intangible assets, to which the market applies a significant premium to their book value, hence not discounting any relevant risk associated to them. Among the companies in this segment, we draw your attention to FCC. The low equity of the Spanish group has a significant impact on its ratios (being the company with the highest leverage percentage in the Top 20 EPoC ranking, as indicated previously).
• The average market capitalisation / book value ratio of the Top 20 EPoC increased by 13%, to 1.97, as a consequence of the growth in market value of each
0.0 0.1 0.2 0.3 0.4 0.5 0.6 0.7 0.8 0.9 1.0 3.0
0.0
0.5
1.0
1.5
2.0
2.5
3.0
7.0
NCC
SKANSKA
TAYLOR WIMPEY PEAB
FERROVIAL
VINCI
Mar
ket c
apit
alis
atio
n / B
ook
valu
e
Mar
ket d
isco
unt /
pre
miu
m o
ver
book
val
ue
SALINI IMPREGILO BARRAT BAM
ACCIONA STRABAG
OHL
ACS
KIER
BALFOUR
EIFFAGE
BOUYGUES
INTERSERVE PLC
FCC
CARILLION
Intangibles excluding concessions / Market capitalisation
Higher impairment risk
AVERAGE 2015: 0.28AVERAGE 2014: 0.32AVERAGE 2013: 0.34
AVERAGE 2015: 1.97AVERAGE 2014: 1.73AVERAGE 2013: 1.67
Source: Bloomberg, Deloitte analysis

EPoC 2015 | European Powers of Construction
26
group (22% on average). Additionally, the average intangible asset / market capitalisation ratio was 0.21 in 2015, in line with 2014.
Enterprise value / EBITDA • In 2015, the average enterprise value / EBITDA multiple increased from 7.8 to 8.3 as a result of the combination of an 11% increase in enterprise value and a 5% growth in the EPoC Top 20 EBITDA. This ratio has grown continuously for our TOP 20 EPoC since 2012.
• Compared to 2014, the Dutch group BAM recorded the highest increase in the enterprise value / EBITDA multiple as a result of the growth in both magnitudes. On the contrary, Interserve’s ratio decreased from 9.2 to 6.4, since EBITDA grew by 51% but enterprise value remained in line with 2014.
Enterprise value / EBITDA
(40) (30) (20) (10) 0 10 20 30
VINCI
ACS
BOUYGUES
SKANSKA
EIFFAGE
STRABAG
BALFOUR
FERROVIAL
BAM
NCC AB
ACCIONA
FCC
CARILLION
INTERSERVE
BARRATT
PEAB
SALINI IMPREGILO
KIER
OHL
TAYLOR WIMPEY
20142013
2015
Average 2013 = 7.4Average 2014 = 7.8Average 2015 = 8.3
Average 2012 = 6.7
10
5.8
15.4
4.1
12.2
11
6.4
7
9
8.3
11
22.5
19.3
(10.6)
1.6
7.9
8.5
6.3
4.8
8.3
• The companies that obtained the higher multiples are BAM, due to the very small EBITDA figure and market potentially already pricing the impact of the announced cost reduction program and Ferrovial, whose market capitalisation reflects the significant value and dividends –not included in the EBITDA figures- of certain infrastructure assets that the Group accounts for using the equity method (407 ETR and Heathrow). On the other hand, only Balfour Beatty recorded a negative enterprise value /EBITDA ratio.
• By country, the United Kingdom, Sweden, Spain and France recorded enterprise value / EBITDA ratios of 12.6, 9.6, 8.5 and 7.7 in 2015.
Net debt / EBITDAIn 2015 the average net debt/EBITDA ratio decreased by 0.5 to 2.3 times. This slight contraction is a combination of the net effect of a 5% increase in EBITDA and a decrease of total net debt. Since 2012, the ratio has been reduced by 0.8 points.
This ratio is headed by FCC and Eiffage, which are considered to be highly diversified groups. On the other hand, there are six companies with a negative ratio. Except for Balfour Beatty, the negative ratios are a result of the net cash position of these groups (Skanska, Barratt Developments, Taylor Wimpey, BAM and Strabag).
Cash to EBITDAIn 2015 the average cash to EBITDA ratio reached 1.1, slightly higher than in 2014. BAM is the company that achieved the highest cash to EBITDA ratio, followed by the Kier Group, both with ratios of over 2. Fourteen companies recorded cash to EBITDA ratios of over 1 and four groups between 0 and 1.

EPoC 2015 | European Powers of Construction
27
Net Debt/EBITDA
(4) (2) 0 2 4 6 8
STRABAG
BALFOUR
BAM
TAYLOR WIMPEY
BARRATT
SKANSKA
SALINI IMPREGILO
CARILLION
BOUYGUES
ACS
KIER GROUP
NCC
PEAB
INTERSERVE
VINCI
OHL
ACCIONA
FERROVIAL
EIFFAGE
FCC 6.7
5.4
(1.3)
4.4
4.4
4.1
2.21.9
1.21.5
1.5
1.1
1.1
0.8
0.1
(0.2)
(0.3)
(0.3)
(1.0)
(07)
20142013
2015
Average 2013 = 2.9Average 2014 = 2.8Average 2015 = 2.3
Average 2012 = 3.1
Cash to EBITDA
(4) (2) 0 2 4
BARRATT
BALFOUR
TAYLOR WIMPEY
INTERSERVE
OHL
EIFFAGE
VINCI
FCC
ACCIONA
FERROVIAL
CARILLION
SALINI IMPREGILO
PEAB
BOUYGUES
SKANSKA
ACS
STRABAG
NCC
KIER GROUP
BAM 2.91
2.05
(0.03)
1.48
1.43
1.34
1.301.28
1.251.25
1.21
1.16
1.08
1.07
1.04
1.00
0.98
0.72
(0.01)
0.22
20142013
2015
Average 2013 = 1.02Average 2014 = 1.00Average 2015 = 1.1
Source: Bloomberg, Deloitte analysis

EPoC 2015 | European Powers of Construction
28
Capital expenditure / salesConstruction activity generally does not require significant levels of capital expenditure. However, capital expenditure requirements are traditionally higher in more diversified groups.
The Top EPoC average capital expenditure / sales ratio reached 3.4% in 2015, compared to 3.2% in the prior year. However, the ratio obtained among the companies that fall within the “international conglomerate groups” stood at 5.6% and the ratios corresponding to the domestic and international construction groups were 4.54% and 2.97%, respectively.
In this context, highly diversified groups such as Ferrovial and OHL have significant investment levels, due to the importance
Capital expenditure / Sales*
0% 5% 10% 15% 20%
BARRATT
NCC
TAYLOR WIMPEY
CARILLION
INTERSERVE
BAM
KIER GROUP
PEAB
SKANSKA
ACS
STRABAG
ACCIONA
EIFFAGE
BALFOUR
VINCI
FCC
SALINI IMPREGILO
BOUYGUES
OHL
FERROVIAL 7.6%
6.8%
0.1%
6.3%5.9%
5.2%
4.2%
3.9%3.4%3.1%
3.0%
2.1%
1.4%1.3%
1.3%
1.0%
0.9%
0.7%
0.2%
0.2%
20142013
2015
Average 2013 = 5.1%Average 2014 = 3.2%Average 2015 = 3.4%
Average 2012 = 5.4%
* The ratios of these groups may be affected by the investments made in subsidiaries and associates** Excluding the impact of the investments made in subsidiaries and associates, 2013 ratios of OHL and Ferrovial would have been 9% and 10%, respectively
Dividend Yield
0% 5% 10% 35%
FCC
BAM
TAYLOR WIMPEY
BALFOUR
SALINI IMPREGILO
BARRATT
EIFFAGE
STRABAG
OHL
ACCIONA
KIER GROUP
VINCI
PEAB
FERROVIAL
SKANSKA
ACS
BOUYGUES
NCC
INTERSERVE
CARILLION 6.0%
4.5%
0.0%
4.5%
4.3%
4.1%
4.0%
3.5%3.4%3.0%
2.7%
2.5%2.2%
2.2%
2.1%
1.8%
1.0%
0.6%
0.0%
0.4%
20142013
2015
Average 2013 = 4.3%Average 2014 = 3.3%Average 2015 = 2.9%
Average 2012 = 6.0%
of their concession business. In 2015, Ferrovial made significant investments in connection with its US concessions. Also, Bouygues recorded an increase (1.6 percentage points) due to the significant capital expenditure of its telecom division.
Dividend yieldThe average dividend yield continues to decrease, following the trend from prior years. It fell from 6.0% in 2012 to 2.9% in 2015.
In 2015 only Carillion achieved dividend yield ratios of over 5%. On the other hand, dividend yields of Balfour, Taylor Wimpey and BAM remained below 1%. It should be noted that FCC has not been able to pay out any dividends since 2012.

EPoC 2015 | European Powers of Construction
29
(30%) (10%) (5%) 0% 5% 10% 15% 20% 25%
0.0
0.5
1.0
1.5
2.0
2.5
3.0
3.5
4.0
7.0
FCC
Mar
ket c
apit
alis
atio
n / B
ook
valu
e
BALFOUR KIER GROUP
ROE
AVERAGE 2015: 10.4%
AVERAGE 2015: 1.97%BAM
OHL STRABAG
ACCIONA
BOUYGUESSALINI IMPREGILO
EIFFAGE
PEAB
BARRATT
FERROVIAL
VINCI
CARILLION
INTERSERVE
TAYLOR WIMPEY
ACS
NCCSKANSKA
(*) Regression line without FCC and Balfour
R2=0.4023
Return on Equity (ROE)Average ROE for the TOP 20 EPOC reached 10.4% in 2015. Since 2012, ROE has increased by more than 4 percentage points. As in the two previous years, the companies with the highest ROE ratios were NCC and ACS, exceeding 20% each.
In addition, there seems to be a direct correlation between ROE and the market capitalisation recorded by our EPoC. Certain companies such as NCC, ACS, Skansa, and Taylor Wimpey recorded above-average ROE and market capitalisation / book value ratios.

EPoC 2015 | European Powers of Construction
30
Return on Equity
ROE 2015 ROE 2014 ROE 2013
(100%) (20%) 0% 20% 40%
BALFOUR
FCC
KIER GROUP
BAM
OHL
BOUYGUES
STRABAG
SALINI IMPREGILO
ACCIONA
PEAB
EIFFAGE
BARRATT
FERROVIAL
VINCI
CARILLION
INTERSERVE
TAYLOR WIMPEY
SKANSKA
ACS
NCC
Average 2013 = 2.3%Average 2014 = 10%Average 2015 = 10.4%
Average 2012 = 6.1%
21.42%
21.19%
16.50%
18.20%
15.96%
13.54%
13.53%
11.89%
11.32%
9.76%
9.71%
5.93%
5.47%
5.13%
5.12%
1.84%
1.11%
0.64%
(16.39%)
(25.22%)

EPoC 2015 | European Powers of Construction
31
Diversification of the EPoC 2015
The fierce competition that characterises local construction markets, as well as the traditionally low construction industry margins (the average construction EBIT / sales margin was 3.4% in 2015) are two factors that have influenced the EPoC companies to further diversify their portfolio of business segments. Furthermore, the EPoC companies can benefit from the diversification process because the new activities into which they enter frequently share common customers with the construction sector, and very often they cover a full range of services throughout the entire infrastructure
cycle, which allows them to increase the synergies generated between the different activities performed. Nevertheless, it should be noted that higher diversification usually leads to higher indebtedness, which is also discussed in the “Financing of the EPoC” article. A review of the margins obtained by our EPoC shows that there seems to be a direct correlation between the extent of the diversification strategy adopted and the margins obtained by our EPoC:
• FCC, Acciona, Interserve, Carillion, Ferrovial, Kier and Eiffage, which are
(5%) 0% 5% 10% 15% 20% 25%
0%
10%
20%
30%
40%
50%
60%
70%
80%
90%
100%
Non
- Co
nstr
ucti
on r
even
ues
/ Tot
al r
even
ues
%
EBIT / Total revenues %
BALFOUR
BAMSTRABAG
PEABBOUYGUES
ACS
SKANSKA
NCC
SALINI IMPREGILO
VINCI
OHL
BARRATT TAYLOR WIMPEY
INTERSERVE
KIER GROUP
CARILLION
FCCACCIONA
FERROVIAL
EIFFAGE
R2= 0.0121
Source: Deloitte analysis
considered to be diversified groups since they obtained more than 40% of their total sales from non-construction activities, recorded an average EBIT margin of 7.1% in 2015. On the other hand, companies that are focused on construction activities, such as NCC, Strabag, Taylor Wimpey, OHL, ACS, BAM and Vinci, inter alia, achieved an average EBIT ratio of 5.4%. This shows that diversified groups have an average EBIT margin 1.8 percentage points higher than that obtained by the construction-focused groups.

EPoC 2015 | European Powers of Construction
32
• Balfour Beatty and BAM, which obtain a significant percentage of their total sales from construction activities, recorded negative EBIT margins in 2015. In the case of the UK group, the losses recognised are due to issues in the UK, US and Middle East that resulted in profit write-downs and contract provisions. Losses recognised by the Dutch group BAM are due to negative results in the Netherlands incurred on various older non-residential projects.
• Although OHL achieved the highest profitability of our EPoC companies in 2014 -due to the relative size of its concession business-, the company dropped to second place in 2015, due to both the 0.8% decrease in its margin and the arrival of Taylor Wimpey in the Top 20 EPoC, with an EBIT / sales ratio of 20.1% in 2015. The Spanish group was closely followed by Barratt Developments (UK), which took advantage of the positive conditions of the UK housing market, resulting in an increased margin of 15.4%.
• The most significant variation is attributable to FCC. In 2015 it recovered from the losses recognised in 2014 as a result of impairment recorded in relation to the Group’s environment division. The Spanish company thereby achieved an EBIT margin of 5%, while its percentage of non-construction activities slightly increased by 2 percentage points. FCC’s non-construction activities offset the operating losses recognised by the construction division. On the other hand, Peab was significantly impacted by the write-down recognised in relation to one of its biggest construction projects (the Mall of Scandinavia).
• In terms of profitability by country, the French, Spanish, Italian and UK groups recorded the highest EBIT margins of 7.2%, 6.4%, 5.8% and 5.0%, respectively.
An analysis of the diversification strategies followed by our EPoC shows that, other than construction, Real Estate Development, Industrial & Services and
Company Construction Real Estate Development Concessions Industrial &
ServicesEnvironment
& Water Energy Telecom Other activities
VINCI SA l l l l l l l l
ACTIV. DE CONSTR. Y SERV. SA (ACS) l l l l l l l l
BOUYGUES SA l l l l l l l l
SKANSKA AB l l l l l l l l
EIFFAGE SA l l l l l l l l
STRABAG SE l l l l l l l l
BALFOUR BEATTY PLC l l l l l l l l
FERROVIAL SA l l l l l l l l
KONINKLIJKE BAM GROEP NV l l l l l l l l
NCC AB l l l l l l l l
ACCIONA SA l l l l l l l l
FOMENTO DE CONSTR. Y CONTRATAS SA (FCC) l l l l l l l l
CARILLION PLC l l l l l l l l
INTERSERVE PLC l l l l l l l l
BARRATT DEVELOPMENTS l l l l l l l l
PEAB AB l l l l l l l l
SALINI IMPREGILO SPA l l l l l l l l
KIER GROUP l l l l l l l l
OBRASCON HUARTE LAIN SA (OHL) l l l l l l l l
TAYLOR WIMPEY l l l l l l l l
l Sales over € 1,000 million l Sales below € 1,000 million l Relevant presence through equity investments l No presence or residual presence
Source: Deloitte analysis
Energy are the segments into which our EPoC have diversified the most. Only two companies (ACS and FCC) obtained sales of over EUR 1,000 million in the Environment & Water segment while just one company, Bouygues (France), has a significant presence in telecommunications through its investment in the TV channel TF1. Our EPoC companies are in many cases present in the concession business through equity investments. Without considering the companies accounted for using the equity method, only the French groups Vinci and Eiffage have concession revenues of over EUR 1,000 million. Other groups such as Bouygues, Strabag, Carillion, and the Spanish groups Ferrovial, ACS, Acciona and OHL are also present within the concession business, however their sales are below EUR 1,000 million. Some of our EPOC are also present in other services, with Ferrovial leading this activity in the Top 20.

EPoC 2015 | European Powers of Construction
33
Financing of EPoC 2015
The traditional construction business is generally characterized by low investment, tight margins and low working capital and financing needs. These factors explain why groups engaging solely in construction activities do not need relevant financing in order to carry out their activities. These factors explain why groups engaging solely in construction activities do not need significant financing in order to carry out their activities. However, the diversified groups involved in Public-Private Partnerships (PPPs) and Project Finance Initiatives (PFIs) in the financing of civil engineering, as well as the groups that have performed relevant mergers and acquisitions, have required significant external financing resources in order to perform such operations. As a result, they recognise high debt levels which are
figures obtained for recent years, the following conclusions may be drawn:
• Companies focused on construction activities do not necessarily require significant financing because the construction business is a cyclical activity which does not need notable investment, although the cash flows obtained are not as predictable as in other activities. For non-construction activities that include predictable expected cash flows and require significant investment (such as concessions), the indebtedness ratio usually increases.
• As in prior years, Vinci and Eiffage are still the groups with the highest net debt values of the EPoC 2015, but several differences may be identified between
(2,000) - 2,000 4,000 6,000 8,000 10,000 12,000 14,000
0%
10%
20%
30%
40%
50%
60%
70%
80%
90%
100%
Non
- Co
nstr
ucti
on r
even
ues
/ Tot
al r
even
ues
%
Net debt
BALFOUR
BAM
STRABAG
PEAB BOUYGUES
ACS
SKANSKA
NCC
SALINI IMPREGILO
VINCI
OHL
BARRATT
TAYLOR WIMPEY
INTERSERVE
KIER GROUP
CARILLION
FCC
ACCIONA
FERROVIAL
EIFFAGE
R2= 0.1116
Source: Deloitte analysis
reflected in the 2015 consolidated balance sheets of the EPoC.
As indicated in the “2015 Financial Performance” section, the average Net debt/EBITDA ratio was 2.3 in 2015, slightly lower than in 2014. The total indebtedness of our EPoC amounted to EUR 48,582 million, a 14% decrease on the 2014 figure. It seems that the EPoC are very concerned about maintaining indebtedness at a reasonable level (Net debt/EBITDA decreased from 3.1 times in 2012 to 2.3 times in 2015).
Prior years’ analyses of the correlation between indebtedness and diversification indicate that diversified companies often have higher net debt than pure construction companies. Based on the

EPoC 2015 | European Powers of Construction
34
those two companies. Indebtedness recognised by Vinci is explained by the size of the group rather than the diversification strategy adopted: Vinci’s net debt to EBITDA ratio is in line with the average achieved by the Top 20 EPoC (2.3) since it achieved 2.2 in 2015, while non-construction revenues are below 20%. On the contrary, Eiffage’s net debt to EBITDA ratio reached 5.4 in 2015 due to the fact that non-construction activities, which are centred on the concessions sector, constituted 43% of its total revenue.
• The Spanish conglomerates Acciona, FCC and Ferrovial have diversification levels above 50% and net debt exceeding EUR 4,500 million. While Acciona and Ferrovial reduced net debt in 2015 by 3% and 27% respectively, FCC increased its indebtedness by 9%. In the case of Ferrovial, the reduction noted is primarily explained by the deconsolidation of certain concessions. On the contrary, ACS, whose construction sales represent around 74% of total revenue, maintained net debt to EBITDA ratios below the
EPoC average. Lastly, OHL achieved a net debt to EBITDA ratio 1.07 points lower than in 2014: the proceeds from the capital increase performed in 2015 were partially used to make significant debt repayments. It is noteworthy that the overall net debt of the Spanish EPoC companies was reduced by 16% in 2015 and decreased from EUR 97 billion in 2007 to EUR 22 billion in 2015, mainly due to the divestment process following the financial crisis.
• The UK groups Carillion, Kier and Interserve managed to diversify their traditional construction businesses without incurring significant leverage, since the new activities performed relate mainly to support services that do not require significant financing. In fact, these three groups recorded a better cash position than in the previous year (EUR 802 million in 2015 vs. EUR 629 million 2014).
• Companies with lower diversification levels, such as Strabag, Balfour, BAM, Peab, NCC, Barratt, Skanska, Salini
Impregilo and Taylor Wimpey recorded net debt below EUR 500 million. Indeed, some of them achieved a net cash position, which supports the idea that pure construction activities do not involve significant levels of financing.
The indebtedness of our Top 20 EPoC has decreased by 22% since 2012, and has reached a current level of EUR 48,582 million. Similarly, the net debt to EBITDA ratio has improved, decreasing from 3.1 in 2012 to 2.3 points in 2015. This evolution is primarily a consequence of the companies’ focus on improving their financial situation after the financial crisis.
Our analysis is based on the debt as recognised in the 2015 financial statements of the respective EPoC companies. Consequently, the debt figures analysed do not include the debt of non-controlling interests accounted for using the equity method, joint ventures that are not fully consolidated and PFIs over which the respective company does not have control (which in some cases may be very significant).
Source: Deloitte analysis
(3) (2) (1) 0 1 2 3 4 5 6 7
0%
10%
20%
30%
40%
50%
60%
70%
80%
Non
- Co
nstr
ucti
on r
even
ues
/ Tot
al r
even
ues
%
Net Debt / EBITDA
STRABAG
BARRATT TAYLOR WIMPEY
BAM SKANSKA
SALINI IMPREGILO
NCC
BALFOUR
BOUYGUES
ACS
PEAB
VINCI
KIER GROUP
CARILLION INTERSERVE
ACCIONA
FERROVIAL
EIFFAGE
OHL
FCC
R2= 0.4898
Diversification vs Indebtedness
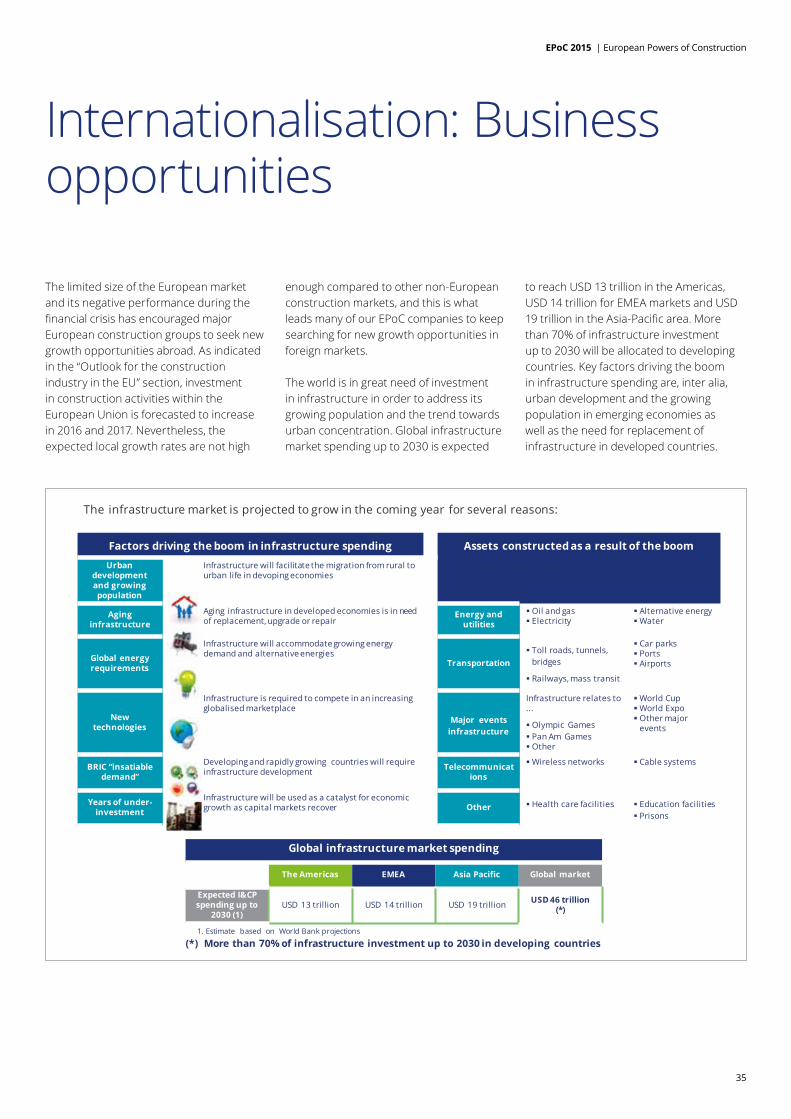
EPoC 2015 | European Powers of Construction
35
Internationalisation: Business opportunities
The limited size of the European market and its negative performance during the financial crisis has encouraged major European construction groups to seek new growth opportunities abroad. As indicated in the “Outlook for the construction industry in the EU” section, investment in construction activities within the European Union is forecasted to increase in 2016 and 2017. Nevertheless, the expected local growth rates are not high
enough compared to other non-European construction markets, and this is what leads many of our EPoC companies to keep searching for new growth opportunities in foreign markets.
The world is in great need of investment in infrastructure in order to address its growing population and the trend towards urban concentration. Global infrastructure market spending up to 2030 is expected
to reach USD 13 trillion in the Americas, USD 14 trillion for EMEA markets and USD 19 trillion in the Asia-Pacific area. More than 70% of infrastructure investment up to 2030 will be allocated to developing countries. Key factors driving the boom in infrastructure spending are, inter alia, urban development and the growing population in emerging economies as well as the need for replacement of infrastructure in developed countries.
Factors driving the boom in infrastructure spending Assets constructed as a result of the boomAsset types constructed as a esult of this infrastructure boom:Urban
development and growingpopulation
Infrastructure will facilitate the migration from rural to urban life in devoping economies
Aginginfrastructure
Aging infrastructure in developed economies is in need of replacement, upgrade or repair
Energy and utilities
Oil and gasElectricity
Alternative energyWater
Global energyrequirements
Infrastructure will accommodate growing energydemand and alternative energies
TransportationToll roads, tunnels, bridges
Railways, mass transit
Car parksPortsAirports
New technologies
Infrastructure is required to compete in an increasingglobalised marketplace
Major eventsinfrastructure
Infrastructure relates to ...
Olympic GamesPan Am GamesOther
World CupWorld ExpoOther majorevents
BRIC “insatiabledemand”
Developing and rapidly growing countries will requireinfrastructure development Telecommunicat
ions
Wireless networks Cable systems
Years of under-investment
Infrastructure will be used as a catalyst for economicgrowth as capital markets recover Other Health care facilities Education facilities
Prisons
Global infrastructure market spending
The Americas EMEA Asia Pacific Global market
Expected I&CP spending up to
2030 (1)USD 13 trillion USD 14 trillion USD 19 trillion USD 46 trillion
(*)
1. Estimate based on World Bank projections
(*) More than 70% of infrastructure investment up to 2030 in developing countries
The infrastructure market is projected to grow in the coming year for several reasons:

EPoC 2015 | European Powers of Construction
36

EPoC 2015 | European Powers of Construction
37

EPoC 2015 | European Powers of Construction
38
Less than 0Between 0 and 2Between 2 and 4Between 4 and 5Between 5 and 6Greater than or equal to 6Insufficient data
GDP growth forecast
02,0004,0006,0008,000
10,00012,00014,00016,00018,000
CARI
LLIO
N
FCC
OH
L
FERR
OVI
AL
VIN
CI
BOU
YGU
ES
BALF
OU
R
SKAN
SKA
ACS
2015 2014 2013
The Americas EPoC- sales (€ million)
0
2,000
4,000
6,000
8,000
10,000
12,000
14,000
16,000
VIN
CI
BO
UYG
UES
ACS
2015 2014 2013
Asia / Oceania EPoC- sales (€ million)
0200400600800
1,0001,2001,4001,6001,8002,000
ACS
CAR
ILLI
ON
BO
UYG
UES
VIN
CI
2015 2014 2013
Africa
0
2,000
4,000
6,000
8,000
10,000
12,000
TAYL
OR
WIM
PEY
OH
L
ACCI
ON
A
PEABFC
C
EIFF
AGE
NCCAC
S
BAM
FERR
OVI
AL
BOU
YGU
ES
SKAN
SKA
VIN
CI
COM
PAN
Y
2015 2014 2013
Rest of Europe EPoC- sales (€ million)
Source: International Monetary Found & Deloitte Analysis
13%
48%
35%
4%

EPoC 2015 | European Powers of Construction
39
As described above, international opportunities for our EPoC are significant and continue to increase as the years go by. However, construction has traditionally been considered to be a local business, since international projects carried out by European construction companies have sometimes given rise to negative experiences in both the past and present. In this context, companies should be aware of the difficulties they may face in order to make their international contracts profitable. The careful preselection of target countries and projects, acquiring a sound understanding of customers and subcontractors and assessing the convenience of working with local partners and/or acquiring local operators are key factors that may impact on the traditional narrow margins of construction activities. Therefore, the success of our EPoC companies when performing business abroad is highly dependent upon gaining a proper understanding of the characteristics of each individual international market.
In 2015 48% of total sales recognised by our EPoC from their domestic markets were obtained in European countries other than the home market of the respective EPoC. The Americas, Asia-Oceania and Africa represent 35%, 13% and 4% of total international sales recognised by the Top 20 EPoC Groups.
Most of our EPoC do not provide detailed margin information by geographical area, which makes it difficult to assess the profitability and cash flows obtained from the internationalisation process. We have split the Top 20 EPoC data into two categories for further analysis: the first group includes the Top 10 companies in terms of internationalisation levels, while the second category includes the Top 10 groups with the strongest focus on domestic markets. After considering several variables, the following conclusions may be highlighted:
0.6
0.8
1.0
1.2
1.4
201520142013
CTEBITDA Int CTEBITDA No Int
0.991.05
1.19
0.89
1.18
1.01
Most Internationalized EPoC
7.7%6.8% 6.7%
0.0%
2.0%
4.0%
6.0%
8.0%
2,000
4,000
6,000
8,000
10,000
2013 2014 2015
Ebitda Margin
Ebitda Margin
10.8% 11.0% 11.2%
4.0%
6.0%
8.0%
10.0%
12.0%
6,000
8,000
10,000
12,000
14,000
2013 2014 2015
Less Internationalized EPoC

EPoC 2015 | European Powers of Construction
40
• The average profitability of our Top 20 EPoC over the last three years has remained stable, at approximately 9%. Nevertheless, based on internationalisation level, some differences could be identified: EBITDA margin for groups focused on their local markets amounted to 11.2%, 4.5 percentage points above the average for the most internationalised EPoC. Far from being reduced, the gap between both groups is increasing every year.
• In 2015, Cash to EBITDA achieved by groups mainly focused on local markets increased from 0.89 in 2014 to 1.01 in 2015, while the ratio for the most internationalised groups remained stable. The total cash to EBITDA ratios obtained by the Top 20 EPoC were 1.07, 1.00 and 1.02 in 2015, 2014 and 2013, respectively.
As shown in the figure below, there seems to be an inverse correlation between the margins of construction activities and the level of internationalisation of the Top 20 EPoC. The groups with a higher level of internationalisation obtain lower EBIT margins in their construction business. This hypothesis is reinforced when analysing the detailed information on the construction margins by geographical area that certain of our EPoC include in their financial statements. Generally, EPoC companies have significantly higher margins in their home markets than in foreign markets. In this context, the category formed by internationalised groups such as ACS, Skanska, OHL and Strabag recorded an average EBIT margin on construction activities of 2.2% while the category formed by groups like Vinci, Bouygues, Carillion and Interserve recorded an average margin of 3.1%. Additionally, the management of working capital and the conversion of sales into cash used to be more successful in local markets, mainly due to a better knowledge of customers and subcontractors and a greater understanding of how to process and negotiate claims and change orders. However, a change in trend can be observed since 2014.
When comparing the level of internationalisation and the EBITDA multiple valuation achieved by our Top 20 EPoC, it also seems that there is an inverse correlation between both variables. Therefore, it could be assumed that a greater internationalisation process does not necessarily lead to a higher market value. Except for BAM, Ferrovial, Skanska and NCC, the most internationalised groups were not been able to achieve above-average EBITDA multiples.
Our 2015 EPoC companies currently operate worldwide and are present on all five continents. Overall, they obtained around 52% of their revenue outside their national borders. A summary of the trends within the international markets and the presence of our EPoC, by region, is as follows:
The AmericasWhen analysing the economic growth of the continent and forecasts for 2016, we must distinguish between North America and Latin America due to the particular characteristics of each area.
North AmericaIn 2015 the US construction sector continued the upturn that began in 2012, with increases in both the employment rate and reported billings. Labour market indicators continued to improve: employment grew significantly and the unemployment rate continued its downward trend. In this context, according to the US Bureau of Labour Statistics, it is noteworthy that the unemployment rate in the construction sector declined from 8.3% in December 2014 to 7.3% in December 2015. Unemployment rates in the construction industry are at their lowest levels since 2007.
Economic expansion in the United States is expected to continue at a moderate pace, supported by strengthening balance sheets, no further fiscal drag in 2016, and improving conditions within the housing market. Economic expansion is projected to level off at 2.4 percent in 2016, with a modest uptick in 2017.
In Canada economic growth is expected to recover to 1.5 percent in 2016, with the drag from the energy sector being partially offset by a more competitive currency and an expected increase in public investment, before it accelerates to 1.9 percent in 2017. The 10-year New Building Canada Plan, announced in 2013, is intended to offer funding options to assist a variety of public and private sector infrastructure projects. Job creation is expected to result from infrastructure projects, since every CAD 1 billion of infrastructure investment is expected to create around 11,000 jobs.
Latin AmericaIn Latin America and the Caribbean, overall growth in 2016 is expected to be negative for a second consecutive year (decreasing by 0.5%). However, across all countries in the region, economic activity is expected to strengthen in 2017, with growth picking up to 1.5%. There are substantial differences across regions and countries. While South America remains heavily affected by the decline in commodity prices, Mexico, Central America, and the Caribbean are beneficiaries of the US recovery and, in most cases, lower oil prices.
Although a few countries have initiated the structural reforms necessary to increase productivity and competitiveness, it is clear that recent slow growth has made the reform process even more difficult. Brazil remains in a deep recession while Peru’s economic growth will be supported by a major boost in mining production and infrastructure-related construction activity. The Chilean economy is facing strong headwinds but a gradual recovery might take shape in the second half of the year. Colombia’s real GDP has been recently expanding, strongly aided by improving domestic demand and a gradual increase in non-residential infrastructure-linked construction activity. Additionally, Mexican industry will benefit from structural reforms and the positive outlook for manufacturing in the US.
The presence of the EPoC 2015 in the Americas is mainly led by the following companies:

EPoC 2015 | European Powers of Construction
41
• As in the previous years, ACS is the EPoC leader in the American market. Its presence in the area was strengthened in 2011 as a result of the acquisition of the German listed group HOCHTIEF. The Spanish group obtained aggregate revenue of over EUR 16,000 million in the Americas (less than EUR 14,000 in 2014), mainly focused in the US and Canada, but also in Latin America. ACS operates in the US and Canada, which are considered to form the largest construction market in the world, through its subsidiaries Dragados, Turner, Flatiron, E.E. Cruz and Clark Builders, among others. Focusing on different activities, these companies have together covered the construction, civil engineering and infrastructure segments over the last few years. ACS’s
backlog in the Americas amounted to EUR 24,803 million and represented 37% of its total order book at December 2015.
• Skanska increased its revenue in the Americas by 15%, from EUR 5,302 million in 2014 to EUR 6,077 million in 2015. Skanska is one of the leading building and civil construction companies in the US. It is noteworthy that its activities in the US were affected in 2015 by write-downs resulting from cost increases in certain projects (due to clients’ design changes). With regard to its operations in Latin America, in 2015 the group decided to sell the operation and maintenance part of the business and to wind up the construction activity.
Asia/OceaniaFollowing the global financial crisis in 2008-2009, the Asia-Pacific region has experienced a significant increase in infrastructure investment. Economic activity in Asia is divided into two differentiated areas: Advanced Asia and Emerging and Developing Asia. Growth in the Emerging Asia region (Southeast Asia, China and India) is moderate but will remain robust at an average rate of a 6.2% GDP increase per year over the 2016-2020 period, according to the most recent OECD economic outlook, which is lower than the figure attained in previous years, mainly due to China’s slowing growth. The economic slowdown in China will also place downward pressure on economic expansion in the rest of the region.
(7.0%) (5.0%) (3.0%) (1.0%) 1.0% 3.0% 5.0% 7.0% 9.0% 23.0%0%
10%
20%
30%
40%
50%
60%
70%
80%
90%
100%
BALFOUR
OHL
STRABAG SALINI IMPREGILOACS
ACCIONA
FCC
SKANSKA FERROVIALBAM
NCC
VINCI
BOUYGUES
CARILLION
EIFFAGEINTERSERVE
PEAB
TAYLOR WIMPEYBARRATTKIER
Inte
rnat
iona
l sal
es /
Tota
l sal
es %
Construction EBIT / Construction sales %

EPoC 2015 | European Powers of Construction
42
(10) 0 5.0 10.0 15.0 20.0 25.0
0%
10%
20%
30%
40%
50%
60%
70%
80%
90%
100%
BALFOUR
OHL
STRABAGSALINI IMPREGILO
ACS
ACCIONAFCC
SKANSKA
FERROVIAL
BAM
NCC
VINCIBOUYGUES
CARILLIONEIFFAGE
INTERSERVE
PEAB
TAYLOR WIMPEY
BARRATT
KIER
Inte
rnat
iona
l sal
es /
Tota
l sal
es %
EBITDA Multiples
R2 = 0.0237
The ten ASEAN (Association of Southeast Asian Regions) countries are expected to grow at 4.6% in 2015, with an annual average rate of 5.2% over 2016-2020. In general, the Southeast Asia region will maintain a favourable performance in the medium term.
The outlook for Japan seems to be generally positive, but uncertainties remain over the forecasted period. Domestic consumption and investment recovered gradually in 2015, while external demand, particularly from the euro area, strengthened in the second half of 2015. Housing investment and private consumption of durable goods are expected to pick up somewhat in 2016. GDP growth in Japan is projected at 0.8% in 2016 and in 0.4% in 2017.
The Australian economy remains resilient, sustained by sound macroeconomic policies, strong institutions and healthy trade ties with Asia. Australia is the only major developed economy to have recorded no annual recessions from 1992 to 2015 and is now in its 25th year of consecutive economic expansion.
According to IMF forecasts, Australia is expected to achieve average annual real GDP growth of 2.9% between 2016 and 2020 -the highest among major advanced economies and up from an average growth rate of 2.7% between 2011 and 2015-.
The opportunities across the Asia-Pacific region are substantial when considering the need for infrastructure. Much work needs to be done to increase the power and utility capabilities of the emerging market economies and to improve the transportation networks that connect economic activities within a country and those that allow for effective trade between nations.
As in the Americas, ACS continues to be the leading EPoC in Asia/Oceania, with aggregate sales exceeding EUR 9,500 million (2014: EUR11,960 million). The decline in sales is partially explained by the sale in 2014 of its subsidiary the John Holland Group to the Chinese enterprise called China Communications Construction Company.
Far behind ACS, but also recording significant sales in the Asia-Pacific area, is Bouygues, which obtained revenue of EUR 2,321 million in the region, in line with the previous year. Bouygues carries on its activities in Asia through its wholly-owned subsidiary Bouygues Asia KK. The activities of Bouygues Asia cover a very wide geographical area that includes Japan, South Korea, China and Taiwan. A milestone in 2015 was Bouygues Construction’s announcement of the handover of the biggest solar farm in Southeast Asia, located at Negros Island in the Philippines.
Vinci increased its revenue in this area in 2015 to EUR 2,296 million compared to EUR 1,916 million obtained in 2014. Of note was the strong growth recorded by its subsidiary Freyssenet (with revenues up 30%) with sales increases in all its areas of operation, especially in Asia, Australia and the Middle East.

EPoC 2015 | European Powers of Construction
43
Africa and the Middle EastAfrica recorded strong real GDP growth, averaging 5% over the past decade. Today, Africa’s aggregate GDP is estimated at USD 2.4 trillion, which is exponentially higher than the USD 600 billion at the beginning of the new millennium. Africa is empowered by strong demographics with a young population of about 1.2 billion people.
However, the short-term growth outlook (4% in 2015-2016) is lower than historic growth levels (5%), primarily reflecting the adverse effects of falling commodity prices. The impact of this macro shock is heterogeneous across African economies, depending on their degree of GDP diversification and reliance on natural resources.
Economic activity growth in Sub-Saharan Africa (SSA) decelerated from 4.6% in 2014 to 3.4% in 2015, the weakest performance since 2009, due to a combination of external shocks and domestic constraints. The slowdown was most pronounced among oil exporters. In Nigeria, the region’s largest economy and oil exporter, growth slowed to 3.3%, down from 6.3% in 2014. With the Ebola crisis receding, activity recovered somewhat in Liberia, but remained weak in the other affected countries (Guinea, Sierra Leone). However, in other countries, including low-income countries and certain fragile states (Ivory Coast, Rwanda, and Tanzania) growth remained robust, reflecting lower exposure to the commodity slowdown and tailwinds from large-scale infrastructure investment.
In South Africa, the government is addressing decades of low infrastructure investment through the National Infrastructure Plan. The plan is to construct and upgrade economic infrastructure,
particularly in transport and electricity, but also in water and in social infrastructure, such as healthcare and housing. High levels of investment will be required to meet the ambitions of the National Development Plan: the Medium Term Strategic Framework for 2014-19 targets an increase in the share of investment in GDP from 20% to 25% by 2019 and foresees a more prominent role for private investment.
The United Arab Emirates’ real GDP will grow by 2.8% in 2016 (2.6% in 2017). Dubai will see growth of around 5% in 2015 as a result of several mega-projects carried out, some of them associated with preparations for the World Expo 2020. In Abu Dhabi, expansionary fiscal policies will partially offset the slowdown in oil production. Growth in the UAE’s non-oil sector will fall to 4.4% in 2015 before picking up in later years.
In the Middle East, the pipeline of projects planned amounts to USD 2.0 trillion, with Saudi Arabia and the United Arab Emirates as the market leaders. Construction and transport are the two leading sectors with shares of 52% and 19%, respectively, which are followed by power, with an 11% share. These projects involve a combination of retail, real estate, leisure, health and educational asset developments, as well as transport, communication and supporting social infrastructures systems. Additionally, Public Private Partnerships will continue to be used extensively in the power, water and wastewater sectors.
The presence of EPoC 2015 in Africa is led by French groups, particularly by Vinci. Operating in 20 countries, the Vinci Construction subsidiary Sogea-Satom is a major player in this region. In 2015, Vinci’s revenues in Africa decreased by 14%
mainly as a consequence of the decrease in activity in equatorial and central Africa, where the economy has essentially been geared towards the oil and mining industries. However, this drop was partly offset by increased activity in the Western, Southern and North Africa regions. This subsidiary engages in road construction, civil engineering, hydraulic engineering and building.
Bouygues is involved in roadbuilding projects and power transmission and distribution in several African countries in response to considerable demand. In 2015 Bouygues achieved sales of EUR 1,401 million in this region, thus maintaining its strong position in this emerging market. The presence of the French group on the continent is mainly focused on North and Southern African countries such as Algeria, Morocco, Egypt, South Africa and Botswana.
The EPoC top three is completed by the UK group Carillion, which obtained a significant level of sales in Africa and in the Middle East area (total revenues reported for Africa and the Middle East amounted to EUR 988 million in 2015). The UK company has been operating in the region for more than 40 years and engages in activities such as construction and support services.

EPoC 2015 | European Powers of Construction
44
Performance of non-European construction companies
(*) The financial information of these groups is not available.(**) Included in our Top 50 EPoC ranking.(***) HOCHTIEF was acquired by ACS in 2011. CIMIC is controlled by HOCHTIEF thus it is also part of the ACS Group.(****) Considered as an engineering group, Technip and Saipem are excluded from our analysis.
Company CountryRanking
2015 vs 2014China Railway Group Limited China � 2 China State Construction Engineering Corporation China � (1)China Railway Construction Corporation Limited China � (1)China Communications Construction Company Limited China =Vinci SA (**) France =Activ. de Constr. y Serv. SA (ACS) (**) Spain =Power Construction Corporation of China (*) China � 7 Bouygues SA (**) France =Hochtief Ag (***) Germany � (2)Metallurgical Corporation of China Limited China =Bechtel Corporation (*) Usa � (2)Shanghai Construction Group (*) China � (1)Cimic Group (***) Australia =Skanska Ab (**) Sweden � 1 Fluor Corporation Usa � (3)Strabag Se (**) Austria =Hyundai Engineering & Construction Corporation S. Korea � 3 Obayashi Corporation Japan =Eiffage (**) France � (2)Technip (****) France � 5 Samsung C&T Corporation S. Korea � 2 Construtora Norberto Odebrecht Brazil � (3)Saipem (****) Italy N/AKajima Corporation Japan � (2)Shimizu Corporation Japan � (4)
The thirteenth edition of EPoC includes a review of some of the most important non-European construction groups. Our analysis is based on the “Top Global Contractors” ranking published annually by ENR, which analyses the position of major construction and engineering contractor groups, based on total construction contract revenue, regardless of where the projects were located. Since the ranking contains 250 global contractors, we have focused our analysis on the Top 25 companies in the ENR ranking.
Based on the available financial information, and excluding our EPoC companies and other European engineering groups, we have examined the market position and performance of the Top 25 in terms of revenue, profitability, debt, market capitalisation and other financial figures.
Eight European groups are included in ENR’s Top 25 global contractors ranking: Vinci, ACS, HOCHTIEF, Bouygues, Skanska, Strabag, Eiffage and Technip. The German HOCHTIEF group is not included in our EPoC ranking as it has been part of the ACS Group since 2011. Technip, with sales of over EUR 12,000 million in 2015 and a market value of more than EUR 6,000 million, is not included in our EPoC ranking since it is considered to be an engineering group rather than a construction company.
Without taking into account the EPoC companies and European engineering groups, the world’s Top 25 is dominated by Chinese (seven) and Japanese (three) companies. It should be noted that six Chinese construction companies are in the Top 10 and just two US construction companies are in the Top 25. The Top 25 list also includes American, Australian, Brazilian and South Korean groups:
ENR Ranking

EPoC 2015 | European Powers of Construction
45
• China Railway Group, one of the largest integrated construction groups in Asia in terms of total revenue, and ranked 71 in Fortune Global 500, jumped from third position in 2014 to first place in the ENR ranking in 2015. It also ranks 11th among the Top 500 Chinese Enterprises. The Group engages mainly in infrastructure construction, survey, design and consulting services, engineering equipment and component manufacturing and property development. In 2015, total revenue increased by 19% to EUR 86,034 million. Construction sales represent 91% of total revenue, including a greater presence in its domestic market. For this reason, China Railway Group could be classified as a “Domestic Construction Group”. Operating margin, which remained in line with that of the previous year, was 8%, approximately 3 percentage points above the average margin obtained by the Chinese corporations analysed and 2 percentage points higher than that obtained by our EPoC companies. Market value amounted to EUR 15,978 million.
• China State Construction Engineering Corporation’s business operations encompass building construction, international contracting, real estate development and infrastructure construction. Established in both domestic and international markets, China State Construction Engineering Corporation operates in more than 50 countries and regions around the world. In 2015, its revenue totalled EUR 126,278
million, up 10.1% on 2014. EBIT margin and EBITDA margin were 5.3% and 6.4%, respectively, in line with the average among the most representative Chinese construction groups. It should be noted that the net debt to EBITDA ratio (0.4) is low compared to other non-European groups and the EPoC companies. It has infrastructure construction contracts exceeding EUR 40,000 million and overseas orders in excess of EUR 13,000 million. The Chinese company is listed on the Shanghai Stock Exchange and its market value at the end of 2015 was EUR 26,981 million, which figure represents 2.4 times total equity, slightly higher than the average figure obtained by our EPoC companies.
• China Railway Construction Corporation’s businesses cover project contracting (railways, high-speed railways, highways, bridges and tunnels), survey design consultation, industrial manufacturing, real estate development, logistics, trade of goods and material and capital operation. Established in 2007 in Beijing, the company is under the administration of the State-owned Assets Supervision and Administration Commission of the State Council of China (SASAC). In 2015, the Company moved up to 79th in the Fortune Global 500 and was ranked 13th among China Top 500 Enterprises. Total sales rose 19% to EUR 86,120 million. The construction business is considered to be the core and traditional area of the Group, which achieved total construction sales of EUR 74,471 million
in 2015, which represents more than 85% of total revenue. Compared to other Chinese groups, margins are lower and indebtedness is higher. The company is listed on the Hong Kong Stock Exchange and its market capitalisation amounted to EUR 15,496 million as of December 2015. Market capitalisation to book value ratio is below 1.
• China Communications Construction Company, with sales of more than EUR 57,000 million, is a leading group in road, railway, port and bridge construction in China. The company has four divisions: Construction, Design, Dredging and Heavy Machinery. As with other Chinese groups, over 85% of total revenue came from construction activities. Revenue from the infrastructure construction business was EUR 49,000 million in 2015, up 13.9% on the EUR 43,000 million achieved in 2014. Additionally, as a result of the acquisition of John Holland Group (previously owned by CIMIC), an Australian company, China Communications Construction Company entered the Australian and New Zealand markets, as well as obtaining professional expertise in respect of water work engineering and railway construction and operation. As of December 2015, market capitalisation amounted to EUR 15,212 million, a similar level to that of other Chinese groups such as China Railway Group or China Railway Construction Corporation.

EPoC 2015 | European Powers of Construction
46
• Power Construction Corporation of China, which was founded in September 2011, was ranked 7th in 2015. The company, an industry leader in engineering and construction, performed 1,565 overseas projects in 110 countries in the year. Power Construction Corporation of China is present in markets in Asia & Pacific, Eurasia, Latin America, Africa and Middle East. The Group owns international brands with a high reputation worldwide, such as Sinohydro, Hydrochina, Sepco, Sepco III, and Hypec.
• China Metallurgical Group is a large conglomerate operating in various specialized fields, across different industries and countries, with engineering and construction contracting, property development, equipment manufacturing and resources development as its principal businesses. The company is one of the largest comprehensive engineering and construction companies in China and throughout the world. In 2015, total sales amounted to EUR 31,165 million, while EBIT margin was 2.7%, approximately 3 percentage points below the average profitability figures recorded by the Top 20 EPoC companies. Construction and engineering projects represent more than 85% of total revenue. In this context, and taking into consideration the other Chinese groups analysed above, it seems that diversification is not a major concern at these companies. The relative weight of non-construction revenues is higher among EPoC companies (approximately 24%). Market value amounted to EUR 5,310 million, significantly lower than other groups such as ACS or Bouygues whose sales are similar to China Metallurgical Group’s.
• Bechtel Corporation is the largest construction and civil engineering company, and the 5th-largest privately owned company, in the United States. Since its foundation in 1898, four generations of Bechtels have steered the company through 25,000 projects in 160 nations and seven continents. Bechtel works on global megaprojects through its four main divisions: Infrastructure, Nuclear, Security & Environmental, Mining
& Metals and Oil, Gas & Chemicals. Among its most remarkable current projects, a Bechtel-led consortium is carrying out the design and construction of two lines of the Riyadh Metro network in Saudi Arabia. Total sales for 2015 amounted to EUR 29,100 million, 13% lower than in 2014. The total backlog at December 2015 amounted to EUR 63,300 million. Significant contracts awarded in 2015 include the Toronto-York subway extension, the Amrun bauxite mine project in Australia and the US Air Force Arnold Engineering Development Complex in Tennessee, among others.
• With over 50 years of history, Shanghai Construction Group possesses core technologies in the construction of high-rise buildings, large bridges, light railways, public culture and sporting facilities, large industrial plants and major environmental protection projects. Shanghai Construction Group has carried out some of the most important construction projects carried out in China, and at the same time, it has also completed about 100 landmark projects in more than 30 overseas countries and regions.
• CIMIC Group, previously known as Leighton Holdings, is one of the world’s leading construction companies and the world’s largest contract miner. The company was founded in 1949, listed on the Australian Securities Exchange in 1962 and has been part of the ACS Group since 2011. It operates in 20 countries, mainly in the Asian, Middle East and African regions. Total sales amounted to EUR 9,049 million in 2015. Non-construction sales represent 32% of total income, 8 percentage points higher than the average diversification of EPoC companies 2015. Both the EBIT and EBITDA margins grew in 2015, to 7.1% and 11.2%, significantly above the average profitability obtained by our EPoC companies. Recently, the company has made significant divestments such as John Holland and 50% of the services business (Ventia).
• Fluor Corporation is one of the largest professional services firms, providing

EPoC 2015 | European Powers of Construction
47
engineering, procurement, construction, fabrication and modularization, commissioning and maintenance and project management services on a global basis. With a workforce of almost 38,000 people, it operates in 60 countries in six continents. Total sales amounted to EUR 16.326 million in 2015, which is similar to some EPoC companies such as Skanska. While recording similar profitability levels to those of the average EPoC, the net cash position was a positive amount of EUR 75 million. Listed on the New York Stock Exchange, its market capitalisation in 2015 was EUR 6,041 million, representing 2.1 times total equity in 2015.
• Hyundai Engineering & Construction is recognised as one of the leaders of the Korean construction industry. Founded as Hyundai Civil Works Company in 1947, in April 2011 the Group started a new chapter in its history by becoming a member of the Hyundai Motor Group. Its activities are mainly focused on building, civil works and power plant construction. In 2015, Hyundai E&C posted sales of EUR 15,218 million, a rise of 22% from the previous year. EBIT and EBITDA margin reached 5.2% and 5.6% respectively, significantly higher than those achieved by other Korean companies such as Samsung C&T. Listed on the Korea Exchange, total market capitalisation fell by 30% in the year to EUR 2,488 million.
• Established around 120 years ago, Obayashi Corporation is one of the world’s leading construction contractors and among Japan’s leading listed companies. Its business encompasses domestic and overseas construction and engineering work and other construction-related businesses including real estate. In 2015, although orders from the public sector declined, orders from the private sector remained strong and the domestic construction market was generally good. Under these circumstances, the Company posted consolidated net sales of EUR 13,409 million for the year, a 1.5% increase on 2014. Almost 95% of total sales come from construction and engineering activities. Total market
capitalisation increased by 11% to EUR 4,353 million as of December 2015. Obayashi’s revenue and market value figures are similar to those recorded by the French Eiffage group.
• Samsung C&T Corporation was established in 1963 and is primarily engaged in engineering, procurement, technology and construction activities, among others. The company is structured into two core segments: Engineering & Construction and Trading & Investment. In 2015, with the aim of diversifying the business portfolio and enhancing its core competitiveness, the Company merged with Cheil Industries. In the field of skyscraper construction, Samsung C&T has erected two of the world’s most famous skyscrapers: Petronas Twin Towers in Malaysia and Burj Khalifa in Dubai. The company is currently present in some important infrastructure projects around the world, such as the Riyadh Metro in Saudi Arabia and the UK Mersey Gateway bridge project. Total sales for 2015 amounted to EUR 10,620 million, with an operating margin that is lower than the profitability obtained by other European and non-European companies. Listed on the Korea Exchange, total market capitalisation amounted to EUR 18,207 million as of December 2015, 166% higher than in 2014. Market value to equity ratio is significantly higher than the figure achieved by Hyundai Engineering & Construction.
• Norberto Odebrecht is a Brazilian conglomerate of diversified businesses in the fields of engineering, construction, chemicals and petrochemicals. Total sales exceeded EUR 34,000 million and were mainly obtained in Brazil and other Latin American and Caribbean countries. Thus, 49% of total sales were made by Braskem, a subsidiary listed on the Sao Paulo Stock Exchange and considered to be the largest producer of thermoplastics in the Americas. In 2015 the group posted EBITDA of EUR 4,760 million, 13.8% of total sales. It should be highlighted that approximately 21% of total EBITDA and 34% of total income was
generated within the engineering and construction business segment. In this context, diversification levels are similar to those of Acciona, FCC and Interserve. As a result of the diversification strategy adopted, profitability is significantly higher than the figures achieved by other European and non-European construction companies.
• Kajima is one of the leading companies in the construction industry in Japan. The Group has a workforce of over 7,500 employees, and more than 150 years’ experience in the business, including international projects in Asia, North America and Europe. Total sales in 2015 amounted to EUR 13,144 million, of which approximately 90% related to construction activities. Approximately 21% of the company’s revenues came from international contracts, especially from North America, a higher ratio of international to domestic sales than the 2014 figure. At year end, the company had a total backlog of EUR 9,671 million. The net debt to equity ratio was 0.3, similar to that of Peab, a company which is also classified as a “Domestic construction group”.
• Shimizu Corporation, a company with over 210 years of history, is a leading architectural, civil engineering and general contracting firm that offers integrated, comprehensive planning, design and building solutions for a wide range of international construction and engineering projects. In 2015, total sales amounted to EUR 12,558 million, with an EBIT margin of 5.7%, a higher percentage than the average recorded by both our EPoC and Chinese groups analysed. The construction business, which encompasses civil engineering and architectural construction activities, accounts for more than 91% of total sales. Total backlog amounted to EUR 10,815 million. Shimizu’s positive performance resulted in market capitalisation growth of 18% to EUR 5,846 million. The net debt to EBITDA ratio was 1.4, whereas other Japanese companies like Obayashi recorded 3.0.

EPoC 2015 | European Powers of Construction
48
Com
pany
Coun
try
Sale
s 20
15EB
IT
(€ M
)
EBIT
/Sa
les
(€ M
)
EBIT
DA
(€
M)
EBIT
DA
/Sa
les
(€ M
)
Mar
ket
Cap.
201
5 M
arke
t Ca
p. 2
014
Var
Net
Deb
t (€
M)
Equi
ty
(€ M
)
Net
D
ebt +
Eq
uity
Net
D
ebt
/ (N
et
Deb
t +
Equi
ty)
Net
D
ebt /
Ebit
da
Chin
a Ra
ilway
Gro
up L
td.
Chin
a86
,034
6,
982
8.1%
7,47
9 8.
7%15
,978
14
,436
11
%
33,3
62
19,7
20
53.0
81
63%
4.
5
Chin
a St
ate
Cons
truc
tion
Eng'
g Co
rp. L
td.
Chin
a12
6,27
8 6,
752
5.3%
8,06
2 6.
4%26
,981
29
,007
(7
%)
3,15
3 12
,020
15
,172
21
%
0.4
Chin
a Ra
ilway
Con
stru
ctio
n Co
rpor
atio
n Li
mite
d Ch
ina
86,1
20
2,38
2 2.
8%3,
051
3.5%
15,4
96
12,9
49
20%
49
,268
18
,244
67
,512
73
%
16.1
Chin
a Co
mm
unic
atio
ns C
onst
ruct
ion
Grp
. Ltd
.Ch
ina
57,8
80
3,70
0 6.
4%5,
519
9.5%
15,2
12
16,0
32
(5%
)22
,692
23
,936
46
,628
49
%
4.1
Chin
a M
etal
lurg
ical
Gro
up C
orp.
Chin
a31
,165
85
2 2.
7%1,
600
5.1%
5,31
0 5,
238
1%
9,46
2 10
,077
19
,539
48
%
5.9
Subt
otal
Chi
nese
Gro
ups
387,
477
20,
667
5.3%
25,
712
6.6%
78,9
77
77,6
62
2%
117,
936
83,
997
201,
933
58%
4.
6
Cim
ic G
roup
Ltd
., St
. Leo
nard
sAu
stra
lia9,
049
639
7.1%
1,01
4 11
.2%
5,51
9 5,
139
7%
2,34
7 2,
762
5,11
0 46
%
2.3
Fluo
r Cor
p., I
rvin
gU
sa16
,326
83
6 5.
1%1,
007
6.2%
6,04
1 7,
423
(19%
)(7
5)2,
859
2,78
4 (3
%)
(0.1
)
Hyu
ndai
Eng
inee
ring
& C
onst
ruct
ion
Kore
a15
,218
78
5 5.
2%84
9 5.
6%2,
488
3,54
4 (3
0%)
2,60
9 5,
849
8,45
8 31
%
3.1
Oba
yash
i Cor
pora
tion
Japa
n13
,409
80
2 6.
0%91
2 6.
8%4,
353
3,93
2 11
%
2,70
8 2,
762
5,47
0 49
%
3
Sam
sung
C&
T Co
rpKo
rea
10,6
20
30
0.3%
247
2.3%
18,2
07
6,84
5 16
6%
4,94
2 14
,299
19
,241
26
%
20
Cons
trut
ora
Nor
bert
o O
debr
echt
Sa*
Braz
il34
,448
N
/AN
/A4,
760
13.8
%N
/AN
/AN
/AN
/A4,
660
N/A
N/A
NA
Kajim
a Co
rpor
atio
nJa
pan
13,1
44
838
6.4%
886
6.7%
5,72
5 4,
493
27%
1,
068
3,70
6 4,
775
22%
1.
2
Shim
izu
Corp
orat
ion
Japa
n12
,558
71
4 5.
7%80
1 6.
4%5,
846
4,94
7 18
%
1,15
9 2,
623
3,78
1 31
%
1.4
Subt
otal
Oth
er G
roup
s12
4,77
2 4
,643
5.
1% 1
0,47
6 8.
4% 4
8,17
9 36
,323
33
%
14,
757
39,
521
49,
619
30%
2.
6
* Si
nce
finan
cial
info
rmat
ion
for t
he y
ear 2
015
is n
ot a
vaila
ble,
the
figur
es d
etai
led
abov
e re
fer t
o ye
ar 2
014

EPoC 2015 | European Powers of Construction
49
Comparison with EPoC 2015Based on the available financial information, the following conclusions could be drawn:
• Average EBIT margin for our EPoC companies is 0.5 percentage points higher than it is for non-European Groups. The EBIT to sales ratio stood at 5.8% for EPoC companies, 5.3% for the Chinese groups and 3.7% for other non-European groups. China Railway Group and Cimic had the highest ratios (8.1% and 7.1%, respectively), however there is a significant gap to Taylor Wimpey and Barratt Developments, which recorded the highest EBIT to sales figures among the European companies (20.1% and 15.4%, respectively).
• Despite the fact that the gap narrowed in 2015, non-European groups’ average net debt to EBITDA ratio is still 1.9 percentage points higher than the EPoC 2015 average. In this context, it is remarkable that China Metallurgical Group has significantly reduced its debt from EUR 10,373 million in 2014 to EUR 9,462 million in 2015. On the other hand, China Railway Construction Corporation Limited and Samsung C&T recorded net debt to EBITDA ratios above 16. Among our EPoC, FCC and Eiffage recorded the highest ratios (6.7 and 5.4, respectively).
• Non-European companies recorded an average market capitalisation / book value ratio of 1.06, compared to the 1.97 of EPoC 2015. Some groups, such as China’s China Railway Construction Corporation Limited, China Railway Group, China Communications Construction Company Limited, China Metallurgical Group Limited and the Korean Hyundai group, recorded ratios of below 1. On the other hand, there was a significant gap between the highest ratios registered by non-European companies analysed and the EPoC companies, since China State Construction achieved a ratio of 2.2, whereas FCC recorded 6.5.
EBIT/SALES 2015
0% 2% 4% 6% 8% 10%
Samsung C&T Corp
China Metallurgical Group Corp.
China Railway Construction Corporation Limited
Fluor Corp., Irving
Hyundai Engineering & Construction
China State Construction Eng'g Corp. Ltd.
Shimizu Corporation
Obayashi Corporation
Kajima Corporation
China Communications Construction Grp. Ltd.
Cimic Group Ltd., St. Leonards
China Railway Group Ltd. 8.1%
7.1%
6.4%
6.4%
6.0%
5.7%
5.3%
5.2%
5.1%
2.8%
2.7%
0.3%
2015 Non-European group average= 5.3 %2015 EPoC average= 5.8 %
Net debt /EBITDA
(5) 0 5 10 15 20 25
Fluor
China State Construction Eng
Kajima
Shimizu
Cimic Group
Obayashi
Hyundai Engineering & Construction
China Communications Construction
China Railway Group
Metallurgical Corporation Of China
China Railway Construction Corporation
Samsung C&T 20.0
16.1
5.9
4.5
4.1
3.13.0
2.4
1.4
1.2
0.4
(0.1)
2015 Non-European group average = 4.22015 EPoC average = 2.3
MC/Book Value
0,0 0,5 1,0 1,5 2,0 2,5
Hyundai Engineering & Construction
China Metallurgical Group
China Communications Construction
China Railway Group
China Railway Construction
Samsung C&T
Kajima
Obayashi
Cimic Group
Fluor
Shimizu
China State Construction Eng 2.242.23
2.11
2.00
1.58
1.541.27
0.85
0.81
0.64
0.53
0.43
2015 Non-European group average = 1.062015 EPoC average= 1.97

EPoC 2015 | European Powers of Construction
50
• Regarding the diversification and internationalisation strategies of the non-European groups, only seven companies provide enough information to enable them to be classified as domestic conglomerates, domestic construction groups, international conglomerates or international construction groups. In this context, it is notable that all the Chinese companies analysed are classified as domestic construction groups. China Communications Construction Company Limited, China
Railway Construction Corporation Limited and China Metallurgical Group provide mainly construction services in China. None of them had internationalisation and diversification levels over 20%. On the other hand, Fluor Corporation and Hyundai Engineering & Construction are considered to be international conglomerates because they obtained more than 40% of total revenue from non-construction activities in international markets. Additionally, it is noteworthy that only Samsung C&T
Corporation is considered to be an “International Construction Group” since construction sales, which are mainly obtained abroad, represent more than 70% of total revenues. The average internationalisation and diversification levels of the non-European companies analysed reached 18% and 24%, respectively, while EPoC companies’ international and non-construction sales represented 52% and 24%, respectively, of total income.
0% 10% 20% 30% 40% 50% 60% 70% 80% 90% 100%0%
10%
20%
30%
40%
50%
60%
70%
80%
90%
100%
Non
-con
stru
ctio
n re
venu
es /
tota
l rev
enue
s
International revenues / Total revenues %
METALLURGICAL CORPORATION OF
CHINA RAILWAYCONSTRUCTION
CHINACOMMUNICATIONS
CIMIC GROUP
SAMSUNG C&T CORP
HYUNDAI ENGINEERING &CONSTRUCTION
FLUOR"Domestic" Conglomerates
"Domestic" Construction Groups
International Conglomerates
International Construction Groups

EPoC 2015 | European powers of construction
51
Top 20 EPoC – Company profiles

EPoC 2015 | European Powers of Construction
52
Vinci SA
Vinci, S.A. is a global player in concessions and construction, employing more than 185,000 people in some 100 countries. Incorporated in 1899 by French engineers Alexandre Giros and Louis Loucheur, it remains the largest listed European construction group in terms of sales and market capitalisation.
Its main shareholders are institutional investors, both in France (16.2%) and outside France (56.2%). The remaining shares are controlled by individual shareholders (8.4%), employees (9.4%) and Qatar Holding LLC.
Company (4%). Treasury shares represent 5.8% of total shares.
Vinci, S.A. divides its business portfolio into two main segments: Concessions and Contracting.
ConcessionsThe Group’s Concessions business generated revenue of EUR 5,804 million in 2015, up 3.9% from the previous year. This increase was due to the upturn in motorway traffic in France and the growth of airport passenger traffic in Portugal, Cambodia and France. Vinci Concessions generates 15.1% of the total revenue but two thirds of the Group’s operating income.
Vinci Concessions develops and operates a solid portfolio of transport infrastructure and public facility concessions in some 22 countries. It is primarily active in airports, motorways and road infrastructure, rail infrastructure, stadiums and parking sectors. Vinci Concessions continues to broaden its scope, both in terms of activities and international reach. In this context, the recent developments at VINCI Concessions consist of the materialisation of the company’s goal to expand internationally.
In the airport sector, the new contracts won in Chile, Japan and the Dominican Republic will make VINCI Airports the world’s fifth-largest operator in terms of passenger traffic.
Additionally, there were several important milestones achieved in 2015 within the motorway sector: new contracts were won for the western Strasbourg bypass in France, the Regina Bypass in Canada and sections 7 and 8 of the M11 motorway between Moscow and St. Petersburg. Also, in July 2015 VINCI Highways finalised the acquisition of 50% of UTS (United Toll Systems), the Russian leader in motorway operation and toll management. UTS operates on 525 km of motorways.
2015 was also marked by the international expansion of VINCI Stadium, which at the beginning of the year was awarded a 25-year service concession contract for the operation of the Queen Elizabeth Olympic Park stadium in London.
ContractingVinci Energies, Eurovia and Vinci Construction represent a strong network of companies and expertise globally. In 2015 this division’s total sales, which were obtained mainly in Europe, decreased by 1% to EUR 32,570 million. In this connection, the EBITDA margin fell from 4.9% in 2014 to 4.8% in 2015. This is attributable to VINCI Construction, due to lower earnings in France and a decline in business levels in the oil and gas sector.
Vinci Energies serves public authorities and business customers, helping them to deploy, equip, operate and optimise their energy, transport and communication infrastructure, industrial facilities and buildings. In 2015, VINCI Energies exceeded the EUR 10 billion revenue mark for the first time, recording a 9.4% increase on the previous year. In 2015 VINCI Energies increased its presence outside Europe with the acquisition of the Brazilian company
Orteng Engenharia e Sistemas. This company specialises in designing, building and maintaining electrical equipment and PLCs for the energy, manufacturing and infrastructure sectors. It generated revenue of around EUR 93 million in 2015.
Eurovia is a world leader in transport and urban development infrastructure. While continuing to nurture its strong roots in France, it now generates 40% of its revenue through international operations, primarily in Europe and North America. Eurovia’s business activity was not uniform in 2015, with a significant contraction of the roadworks market in France partially offset by an upturn in other European and American markets. As a result, revenue fell by 3.5% to EUR 7.9 billion. Its EBIT margin was 3% in 2015.
Vinci Construction, France’s leading construction company and a major global player, brings together 777 consolidated companies with 68,000 employees in some 100 countries and delivers a comprehensive array of capabilities in building, civil engineering, hydraulic engineering and contracting-related specialties. The division’s sales amounted to EUR 14,491 million and represented 38% of total Group revenue.
In 2015 the division increased its presence outside France with the acquisition of HEB Construction (New Zealand) and Rodio Kronsa (Latin America, Spain, Portugal, Morocco).
Vinci Construction’s business comprises three complementary components:
• A network of French subsidiaries, through Vinci Construction France, and internationally through Vinci Construction UK, Warbud, Prumstav, SMP, SMS in Central Europe, Sogea-Satom in Africa and HEB Construction in New Zealand.
• Specialist activities serving global markets: Soletanche Freyssinet (foundation and

EPoC 2015 | European Powers of Construction
53
ground technologies, structures, nuclear activities) and Entrepose Contracting (infrastructure for the oil and gas sector).
• A division engaging in the execution and management of complex projects, with Vinci Construction Grands Projets, Vinci Construction Terrassement and Dodin Campenon Bernard, which work on major civil engineering and building projects around the world.
2015 performanceVINCI’s revenue in 2015 remained in line with 2014 while EBITDA grew by almost 2%. The change in revenue was driven by a 6.4% decrease in domestic sales and a 9.1% increase in international sales, which currently represents 42% of total sales. Consolidated net income amounted to EUR 2,079 million, down EUR 437 million on 2014. The 2014 figure included a net contribution of EUR 581 million, mainly due to a gain on disposal resulting from the sale of a stake in VINCI Park.
The order book stood at EUR 27,700 million at the end of 2015, similar to 2014, and represents approximately ten months of business activity.
Sales by geographical area
France
Central and Eastern Europe
United Kingdom
Germany
America
Africa
Asia, Middle East, rest of the world
Rest of Europe
5,000
10,000
15,000
20,000
25,000
30,000
35,000
40,000
45,000
2012201320142015
Sales by segment
Contracting Holding companies and misc.Concessions
0
5,000
10,000
15,000
20,000
25,000
30,000
35,000
40,000
45,000
2012201320142015
Key Data (EUR Million) 2015 2014 2013Variation 2015-2014
%Assets Non-current assets 39,267 39,254 40,385 0.0% Current assets 22,880 23,776 22,691 (3.8%)Total assets 62,147 63,030 63,076 (1.4%)Liabilities and equity Equity 15,256 14,868 14,260 2.6% Non-current liabilities 19,474 21,414 21,618 (9.1%)Current liabilities 27,417 26,748 27,198 2.5% Total liabilities and equity 62,147 63,030 63,076 (1.4%)Statement of profit or loss Sales 38,518 38,703 40,338 (0.5%) National sales 22,414 23,936 25,111 (6.4%) International sales 16,104 14,767 15,227 9.1% Construction sales 32,570 32,916 34,636 (1.1%) Non-construction sales 5,948 5,787 5,702 2.8% EBITDA 5,664 5,561 5,596 1.9% EBIT 3,758 3,642 3,670 3.2% Net income 2,079 2,516 2,046 (17.4%)Net income attributable to the Group 2,046 2,486 1,962 (17.7%)Other key data Net debt 12,436 13,281 14,104 (6.4%)Order book 27,700 27,900 29,400 (0.7%)Market capitalisation 34,801 26,851 28,704 29.6%

EPoC 2015 | European Powers of Construction
54
ACS Group
Since its incorporation in 1983, the ACS Group has become a worldwide benchmark in the construction and services market, with a workforce of around 197,000 employees. ACS remains the second-largest European construction group in terms of revenue and the largest international contractor.
The Group’s main shareholders are Spanish investors, Inversiones Vesan, a company owned by ACS´ Chairman and CEO with 12.5% and Corporación Financiera Alba owned 11.7% at December 2015
The Group’s portfolio is divided into the following segments:
ConstructionThe ACS Group’s Construction segment is aimed at executing all kinds of civil engineering work projects, building works, concession projects and mining and property projects through an extensive group of companies.
This business was traditionally headed by Dragados until 2011, when the Group completed certain acquisitions. The integration of HOCHTIEF in 2011 matched the strategic objectives for the area, based on maintaining a leadership position in Spain through Dragados and Iridium, while consolidating and internationally expanding the Group through the German listed group. HOCHTIEF has a strong position in America through its subsidiaries Turner, Flatiron, Clark Builders and E.E. Cruz and in the Asia-Pacific area through the Cimic Group (formerly known as the Leighton Group).
In 2015 total construction sales decreased by almost 1.9% to EUR 25,319 million.
However, although sales fell, the total order book increased by 1.3% due to the positive performance of the infrastructure areas in the United States. .
On a smaller scale, Iridium manages concessions and public-private partnership contracts for transport infrastructures and public facilities. In 2015 total sales amounted to EUR 71 million.
Industrial ServicesThe ACS Group’s Industrial Services area is focused on the development, construction, maintenance and operation of energy, industrial and mobility infrastructures through a large group of companies.
Due to the accelerated and successful process of evolution and internationalization of the Industrial Services area, the firm is becoming a world leader in applying industrial engineering and is already present on the five continents, especially in America, where the division obtained 47% of its total revenue in 2015.
In 2015 sales of the Industrial Services area amounted to EUR 6,501 million, representing a 3.7% decrease with respect to the previous year, mainly due to the sale of renewable assets in Spain in the first quarter of 2015. On the other hand, the Industrial Services order book increased by 5% in 2015, reaching EUR 8,421 million, driven by the increase in the national order book and the major contracts awarded in the international sphere, especially those related to the field of energy and the development of turnkey industrial plants in Latin America and countries like Saudi Arabia, India and Japan.
EnvironmentThe Environment area is focused on urban services and waste treatment, facility management and logistics services. The Environment Services activity is mainly carried out by Urbaser, which is considered a leader in the management of urban solid
waste treatment plants in the Spanish market and is consolidating its position in the European market.
Total division sales increased by 34.2% to EUR 3,139 million. This is explained by the purchase of Clece in the second semester of 2014. EBITDA of the Environment area also grew to EUR 342 million, representing a 17.6% increase on 2014.
At the end of 2015, the order book of the ACS Group’s Environment area stood at EUR 9,776 million, equivalent to 37 months of production.
2015 Performance2015 revenue remained basically steady, driven by the performance of the Construction and Industrial Services divisions.
Net profit of the ACS Group amounted to EUR 725 million, representing a 1.1% increase compared to the previous year. This includes the different impacts of the restructuring processes being carried out by the Group in its various areas of activity, mainly in construction, as well as the lower contribution from Industrial Services due to the sale of renewable assets.
The Group’s order book totalled EUR 67,072 million, which was slightly higher than in 2014. The Construction, Environment and Industrial Services divisions accounted for 73%, 12% and 15% of the total backlog at December 2015.

EPoC 2015 | European Powers of Construction
55
Key Data (EUR Million) 2015 2014 2013Variation 2015-2014
%Assets Non-current assets 13,779 14,001 14,390 (1.6%)Current assets 21,501 25,320 25,381 (15.1%)Total assets 35,280 39,321 39,771 (10.3%)Liabilities and equity Equity 5,197 4,898 5,489 6.1% Non-current liabilities 10,690 9,535 11,323 12.1% Current liabilities 19,393 24,888 22,959 (22.1%)Total liabilities and equity 35,280 39,321 39,771 (10.3%)Statement of profit or loss Sales 34,925 34,881 38,373 0.1% National sales 5,887 5,581 5,245 5.5% International sales 29,038 29,300 33,128 (0.9%) Construction sales 25,319 25,820 29,558 (1.9%) Non-construction sales 9,606 9,061 8,815 6.0% EBITDA 2,306 2,466 3,002 (6.5%)EBIT 1,439 1,598 1,645 (9.9%)Net income 1,054 928 1,247 13.6% Net income attributable to the Group 725 717 702 1.1% Other key data Net debt 2,624 3,722 4,235 (29.5%)Order book 67,072 63,320 63,419 5.9% Market capitalisation 8,501 9,116 7,873 (6.7%)
Sales by geographical area
Spain
Rest of Europe
America
Asia - Pacific
Africa
0
5,000
10,000
15,000
20,000
25,000
30,000
35,000
40,000
45,000
2012201320142015
Sales by segment
Construction & concessions
Environment
Industrial Services
Eliminations (other activities)
0
5,000
10,000
15,000
20,000
25,000
30,000
35,000
40,000
45,000
2012201320142015

EPoC 2015 | European Powers of Construction
56
Bouygues SA
Bouygues is a diversified industrial group whose corporate culture, shared by all of its subsidiaries, is distinguished by project management expertise and human resources management. The Group operates in over 100 countries and has a workforce of 120,254 employees.
Its main shareholders are foreign (37.3%). French shareholders control 20.9% of the Group, employees 21.4% and SCDM (a company controlled by Martin and Oliver Bouygues) represents 20.4% of total shares.
The Bouygues group operates in three sectors of activity: Construction, Media and Telecoms.
ConstructionBouygues Construction, Bouygues Immobilier and the listed subsidiary Colas represent the Bouygues Group’s construction businesses.
Bouygues Construction designs, builds and operates structures including public and private buildings, transport infrastructure and energy and communication networks. Total sales grew by 3% to EUR 11,776 million, representing 36% of total Group sales. In line with 2014, the EBIT margin was 2.9% in 2015. In 2015 the order book stood at EUR 19.3 billion, 7% higher than in 2014, with international markets accounting for 58%.
As France’s leading property developer, Bouygues Immobilier develops residential,
commercial and retail park projects from thirty-five branches in France and three international subsidiaries. In 2015, total revenue fell by 17% to EUR 2,291 million.
Colas is a listed transport infrastructure company in which Bouygues holds an ownership interest of 96.6%. It operates in all areas of transport infrastructure construction and maintenance. It has two main operating divisions: Roads (its core business, which accounted for 81% of sales) and complementary Specialised Activities. In 2015, total revenue fell by 3% compared to 2014 and amounted to EUR 11,896 million, representing 37% of total Group sales. The main factor was the sharp contraction in the roads market in France. At December 2015, Colas’ market value amounted to EUR 4,597million.
The order book at December 2015 stood at EUR 7 billion, 2% lower than in 2014. The order book reflects the trends observed over the last two years: growth in international activity together with contraction in the domestic market, since orders in international and French overseas markets were 4% higher at EUR 4.3 million, while orders in mainland France were 11% lower at EUR 2.7 million.
MediaTF1 is the leading private media group in freeview television in France, whose mission is to inform and entertain via four freeview channels, several pay-TV special-interest channels and a number of digital offshoots. The Group confirmed its leadership with an average 27.7% total audience share of the TF1 Group’s freeview channels in 2015. Sales in 2015 amounted to EUR 1,964 million, 10.5% lower than in 2014 due mainly to the deconsolidation of Eurosport International on 30 May 2014 and of Eurosport France on 31 March 2015,
the divestment of OneCast in the fourth quarter of 2014 and the discontinuation of the Stylía channel in late 2014.
TelecomsA major player in the French electronic communications market for over 18 years, Bouygues Telecom constantly innovates in order to make digital life easier for its 14 million customers. Total sales increased to EUR 4,484 million in 2015, 1.6% higher than in 2014, as a result of robust commercial performance and the repricing of the mobile subscriber base. Bouygues Telecom’s sales and EBITDA increased for the first time since 2010.
In 2015 Bouygues acquired the entire share capital of BTI Développement, an innovation and shareholding management consultancy firm, subsequently renamed as Bouygues Développement.
Other
Bouygues is the leading shareholder in Alstom (with a 29.2% interest). It was a global leader in power generation, power transmission and rail transport infrastructure. However, since the sale of its energy business it is now focused entirely on rail transport activities.
2015 PerformanceIn 2015 the Group’s total revenue fell 2% to EUR 32,428 million, while EBITDA remained stable compared to 2014. The Group’s order book grew by 4.6% to EUR 28,961 million. Bouygues Construction represents 67% of the total backlog, while Bouygues Inmobilier and Colas represent 9% and 24%, respectively.

EPoC 2015 | European Powers of Construction
57
Key Data (EUR Million) 2015 2014 2013Variation 2015-2014
%Assets Non-current assets 18,210 18,504 17,684 (1.6%)Current assets 15,590 16,364 15,469 (4.7%)Held-for-sale assets and operations 35 - 1,151 100.0% Total assets 33,835 34,868 34,304 (3.0%)Liabilities and equity Equity 9,293 9,455 8,684 (1.7%)Non-current liabilities 7,562 8,308 8,959 (9.0%)Current liabilities 16,980 17,105 16,495 (0.7%)Liabilities related to held-for-sale operations - - 166 100.0%
Total liabilities and equity 33,835 34,868 34,304 (3.0%)Statement of profit or loss Sales 32,428 33,138 33,345 (2.1%) National sales 20,058 21,271 22,118 (5.7%) International sales 12,370 11,867 11,227 4.2% Construction sales 25,963 26,515 26,275 (2.1%) Non-construction sales 6,465 6,623 7,070 (2.4%)EBITDA 2,411 2,418 2,835 (0.3%)EBIT 941 888 1,344 6.0% Net income 480 1,064 (648) (54.9%)Net income attributable to the Group 403 807 (757) (50.1%)Other key data Net debt 2,561 3,216 4,427 (20.4%)Order book 28,961 27,700 27,510 4.6% Market capitalisation 12,613 10,070 8,727 25.2%
Sales by geographical area
France
Rest of Europe
North America
Central/South America
Asia-Pacific
Africa and Middle East
0
5,000
10,000
15,000
20,000
25,000
30,000
35,000
40,000
2012201320142015
Sales by segment
Construction Telecoms/Media and eliminations
0
5,000
10,000
15,000
20,000
25,000
30,000
35,000
40,000
2012201320142015

EPoC 2015 | European Powers of Construction
58
Skanska
Skanska is one of the world’s leading project development and construction groups, with experience in construction, development of commercial properties and residential projects as well as public-private partnerships. The Group operates in 11 countries in the Nordic region, Europe and North America. With a workforce of approximately 43,000 employees, Skanska is the most important Swedish construction group in terms of revenue.
Skanska’s main shareholders are Swedish financial and institutional companies and private Swedish individuals.
Skanska reported sales of EUR 16,363 million in 2015, 4% higher than in 2014, obtained mainly in Nordic countries and the USA.
Construction is Skanska’s largest business segment in terms of revenue, representing 87% of the Group’s total sales in 2015. The other businesses can basically be subdivided into residential development, commercial property development and infrastructure development.
ConstructionSkanska’s Construction business executes building, civil and residential construction works. Skanska is active in selected home markets in the Nordic region, Europe and North America, both in the private and public sector. It also performs service-related commissions, such as construction management services and facility operation and maintenance.
In 2015, the division’s total sales rose by 9%. This segment represents 50% of the Group s total operating income. Performance was particularly strong in Sweden, Finland and Poland, while the US was negatively affected by cost increases in certain projects. In Latin America, all construction projects were concluded and most of the operations and maintenance units were divested in 2015.
The order book decreased by 7% to SEK 158.2 billion. Nevertheless, the overall construction market outlook is positive due to the strong Swedish market and the positive outlook in other European countries, with the exception of certain regions that are dependent on the energy sector.
Residential DevelopmentSkanska develops modern homes in attractive and sustainable areas. Fiscal year 2015 saw strong residential development thanks to improved profitability and capital efficiency. In this year the number of homes sold and started totalled 4,093 and 4,000, respectively.
The main reasons behind these strong results were the favorable market and efficient project execution in Sweden and the Central European operations.
On the other hand, Boklok, which is a residential concept developed by Skanska and IKEA, had very good profitability and contributed to the improvement of this segment.
Commercial Property DevelopmentSkanska’s Commercial Property Development business segment focuses on healthy, green and efficient offices and properties. Skanska initiates, develops, leases and divests properties that
contribute to well-being and profitability, both for customers and their employees. This segment operates mainly in the Nordic Region.
Although 2015 sales were lower than in 2014, operating income from property divestments reached its highest ever level.
Infrastructure DevelopmentSkanska Infrastructure Development focuses on three segments: roads, including bridges and tunnels; social infrastructure, such as hospitals and schools; and industrial facilities, such as power stations.
This business line is responsible for Skanska’s project development within public private partnerships (PPP). This program continues to improve in the US and is also showing signs of improvement in Norway.
Operating income from Infrastructure Development amounted to SEK 863 million (2014: SEK 463 million). The operating income includes a capital gain of SEK 420 million on the sale of two hospitals in London, UK. Moreover, in the previous year, impairment losses of SEK 193 million were recorded on wind power projects in Sweden.
It must be highlighted that in 2015 Skanska was named the preferred bidder for the expansion of LaGuardia Airport in New York. In this context, in 2016 Skanska closed the financing and entered into a lease agreement with the Port Authority of New York and New Jersey. The Public-Private Partnership (PPP) includes the financing, design, construction, operation and maintenance of LaGuardia Airport Central Terminal B with a lease term running until 2050.

EPoC 2015 | European Powers of Construction
59
Key Data (SEK Million) 2015 2014 2013Variation 2015-2014
%Assets Non-current assets 18,107 18,007 18,702 0.6%Current assets 79,560 74,767 68,830 6.4%Total assets 97,667 92,774 87,532 5.3%Liabilities and equity Equity 24,206 21,405 21,339 13.1%Non-current liabilities 9,129 12,733 10,920 (28.3%)Current liabilities 64,332 58,636 55,273 9.7%Total liabilities and equity 97,667 92,774 87,532 5.3%Statement of profit or loss Sales 153,049 143,325 136,488 6.8% National sales 34,124 34,311 33,567 (0.5%) International sales 118,925 109,014 102,921 9.1% Construction sales 140,648 128,890 127,501 9.1% Non-construction sales 12,401 14,435 8,987 (14.1%)EBITDA 7,971 7,282 7,443 9.5% EBIT 6,290 5,409 5,555 16.3%Net income 4,791 3,850 3,769 24.4%Net income attributable to the Group 4,780 3,843 3,765 24.4%Other key data Net debt (1,411) 2,091 3,262 (167.5%)Order book 122,104 147,424 119,968 (17.2%)Market capitalisation 67,739 68,972 54,042 (1.8%)
Sales by geographical area
Sweden
United States
Other Countries
0
20,000
40,000
60,000
80,000
100,000
120,000
140,000
160,000
180,000
2012201320142015
Sales by segment
Construction Other activities
0
20,000
40,000
60,000
80,000
100,000
120,000
140,000
160,000
180,000
2012201320142015
The total order book decreased by 17% to SEK 122,104 million in 2015, mainly due to an order cancellation combined with a significant number of postponed orders in the USA Building area.
2015 PerformanceTotal revenue increased by 6.8% to SEK 153,049 million, due to the positive performance of the Construction and Residential Development divisions. As a result, net income attributable to the Group rose by 24.4% to SEK 4,791 million in 2015.

EPoC 2015 | European Powers of Construction
60
Eiffage
Since its incorporation in 1844, Eiffage has become a leading figure in the European concessions and public works sector. The culture of constant innovation, commitment and expertise among the Group’s 64,000 employees helped Eiffage to generate revenue of EUR 14,060 million, of which 18% relates to international projects in around seventy countries.
Eiffage employees in France are also Group shareholders, representing 23.7% of total shares. The shares of the remaining shareholders mainly continue to be free float.
Eiffage operates through four business lines:
Concessions and public-private partnerships (PPPs)In 2015 Eiffage Concessions continued to consolidate its status as a major player in the area of public-private partnerships (PPP). Through such partnerships, the Eiffage Group is able to finance, design, build and maintain complex facilities.
The division’s total sales grew by 4% to EUR 2,731 million, representing 19% of total Group revenue. In 2015 Eiffage strengthened its position in the PPP area, mainly due to the signing of new contracts
(Metz University, Var Colleges and the biology and health campus of University of Nancy). Through its Eiffage Rail Express (ERE) division, the Group is constructing the high-speed “Bretagne-Pays de Loire” line.
Construction Eiffage Construction is a major player in the sector, with a comprehensive range of businesses related to urban development, property development, construction and maintenance and services works. Eiffage’s Construction division operates through its many regional divisions in France, Benelux, Poland and other locations in Europe.
In 2015 Construction division sales were slightly lower than in 2014. Nevertheless, since it was awarded several contracts throughout the year, the order book remained strong (EUR 4,762 million) and represents sixteen months of activity.
InfrastructuresInfrastructures’ activities has expertise across the full spectrum of businesses relating to road and rail construction, civil engineering, earthworks, drainage and environmental works.
The division s sales went down to EUR 4,583 million due to new lower public sector orders at the roads business and to the drop of orders in the oil and gas sector. At the same time, note should be made of the growth in the international marketplace, with contracts in countries such as Angola and Madagascar.
EnergyThrough its subsidiaries Clemessy and Eiffage Energie, the division provides comprehensive turnkey solutions including the design, construction, operation and maintenance of special purpose and multi-technical facilities for all sectors of activity.
Sales generated by the energy division reached EUR 3,298 billion in 2015, 17% higher than in 2014. Certain important projects were carried out in 2015, such as the Cestaas solar PV plant, the largest in Europe. It is also noteworthy that the Group has entered into significant contracts in Paris.
2015 PerformanceGroup revenue remained basically steady in 2015, with a slight decrease in domestic sales offset by a 6% increase in international sales.
The Group recognised another increase in earnings in 2015. The favourable operational performance enjoyed by the Concessions division and the debt refinancing arranged in 2015 contributed to the improvement in the Group’s results. As a result, EBIT grew by 6.2%, while net attributable income rose by 13%, reaching EUR 312 million.
The Group’s order book reached EUR 11,400 million in 2015, in line with the previous year, and it is equal to ten months of activity.

EPoC 2015 | European Powers of Construction
61
Key Data (EUR Million) 2015 2014 2013Variation 2015-2014
%Assets Non-current assets 18,634 18,668 18,973 (0.2%)Current assets 9,480 10,200 8,403 (7.1%)Total assets 28,114 28,868 27,376 (2.6%)Liabilities and equity Equity 3,472 2,989 2,708 16.2% Non-current liabilities 14,633 15,881 14,905 (7.9%)Current liabilities 10,009 9,998 9,763 0.1% Total liabilities and equity 28,114 28,868 27,376 (2.6%)Statement of profit or loss Sales 14,060 13,948 14,264 0.8% National sales 11,565 11,595 12,034 (0.3%) International sales 2,495 2,353 2,230 6.0% Construction sales 8,020 7,638 7,930 5.0% Non-construction sales 6,040 6,310 6,334 (4.3%)EBITDA 2,170 2,138 2,107 1.5% EBIT 1,431 1,347 1,318 6.2% Net income 458 354 322 29.4% Net income attributable to the Group 312 275 257 13.5% Other key data Net debt 11,665 12,014 12,579 (2.9%)Order book 11,400 11,765 11,740 (3.1%)Market capitalisation 5,493 3,886 3,743 41.3%
Sales by geographical area
France
Rest of Europe
Other Countries
0
2,000
4,000
6,000
8,000
10,000
12,000
14,000
16,000
2012201320142015
Sales by segment
Construction
Concessions
Infrastructures
Energy
Holding
0
2,000
4,000
6,000
8,000
10,000
12,000
14,000
16,000
2012*2013*2014*2015
* Public works and Metal are included as Infrastructures

EPoC 2015 | European Powers of Construction
62
Strabag SE
Strabag SE, incorporated in 1835, has become one of the Top 10 listed European construction groups, with more than 73,000 employees worldwide. Strabag SE is an Austrian-based technology group for construction services capable of offering services along the entire construction value chain.
Strabag SE’s main shareholders with a direct or indirect interest of at least 10% of the share capital are the Haselsteiner family (25.5%), Rasperia Trading (25%) and Raiffeisen (12.7%) & Uniqa (13.8%). Additionally, Strabag SE held 11,400,000 treasury shares at 31 December 2015 (approximately 10%).
Its portfolio is divided into North + West, South + East and International + Special Divisions operating segments.
North + WestThe North + West segment executes construction services of almost all kinds and scales with a focus on Germany, Poland, the Benelux countries and Scandinavia. Ground and hydraulic engineering, as well as offshore wind operations, also belong to this segment.
The division’s total sales increased by 3% and amounted to EUR 5,895 million. Along the same lines, EBIT grew strongly from EUR 28 million in 2014 to EUR 105 million in 2015. In this context, it should be noted that profits in 2014 were negatively impacted by projects in Sweden, the Netherlands and Germany.
The order backlog, at EUR 5,397.45 million, was well below the level of the previous year (-5%). Despite the acquisition of several new road construction projects in the German market (e.g. section 4 of the A 100 Berlin motorway with a contract value of about EUR 44 million, or the extension of two sections of the A3 in southern Germany for EUR 90 million), the order backlog in the country decreased overall.
South + EastThe geographical focus of the segment is on countries like Austria, Switzerland, Hungary, the Czech Republic, Slovakia, Russia and other countries in South-Eastern Europe. Environmental engineering activities are also handled within this segment.
The division’s total sales increased by 10% and amounted to EUR 4,412 million in 2015. Also, the EBIT margin rose by 0.3 percentage points to 4.5%. This can be traced back, among other things, to a number of agreements on large construction projects following completion as well as improvements in several markets in this segment.
The order backlog, on the other hand, fell by 16% to EUR 3,477 million. Declines were registered in nearly all markets, with a particularly significant drop in Russia. Some of the flagship projects under construction are the Tula Steel works in Russia and the Nitra Industrial Park in Slovakia.
International + Special DivisionsThe International + Special Divisions segment includes international construction activities, tunnelling, services, real estate development, infrastructure development and the construction materials business. The concessions business, on the other hand, represents
a further important area of business, with global project development activities in transportation infrastructures in particular.
In 2015, total sales of the International and Special Divisions were 2% higher than in 2014 and amounted to EUR 2,790 million, while the EBIT margin decreased by 1.7 percentage points to 1.7%. The positive results from project development and facility services were unable to compensate for the negative effects of impairment within the international project business, in particular on a tunnelling project in Chile.
The order backlog decreased by 7% to EUR 4,253 million, explained by declines in Italy and the Americas.
2015 Performance In 2015 total group sales increased by 5% to EUR 13,123 million. Moreover, EBIT improved significantly compared to the last three years. The EBIT margin jumped from 2.1% in 2013 to 2.6% in 2015.
The Group’s order book settled at EUR 13,134 million, 9% lower than in the previous year. The German market represents 37% of the total figure, followed by Austria and Italy, which represent 13% and 8%, respectively. The decrease is mainly due to the completion of major projects in Hungary, Italy and Slovakia and because of the adverse economic environment in Russia and neighbouring countries.

EPoC 2015 | European Powers of Construction
63
Key Data (EUR Million) 2015 2014 2013Variation 2015-2014
%Assets Non-current assets 4,284 4,506 4,416 (4.9%)Current assets 6,445 5,770 6,145 11.7%Total assets 10,729 10,276 10,561 4.4%Liabilities and equity Equity 3,321 3,144 3,239 5.6%Non-current liabilities 2,519 2,409 2,466 4.6%Current liabilities 4,889 4,723 4,856 3.5%Total liabilities and equity 10,729 10,276 10,561 4.4%Statement of profit or loss Sales 13,123 12,476 12,476 5.2% National sales 1,996 2,030 2,151 (1.7%) International sales 11,127 10,445 10,325 6.5% Construction sales 13,098 12,455 12,449 5.2% Non-construction sales 25 21 27 18.2%EBITDA 816 720 695 13.4%EBIT 341 282 262 20.9%Net income 182 148 156 23.7%Net income attributable to the Group 156 128 114 22.1%Other key data Net debt (1,094) (249) (74) 339.2%Order book 13,135 14,403 13,470 (8.8%)Market capitalisation 2,419 2,072 2,430 16.7%
Sales by geographical area
Germany
Austria
Rest of Europe
Rest of World
0
2,000
4,000
6,000
8,000
10,000
12,000
14,000
2012201320142015
Sales by segment
North + West
South + East
International + Special Divisions
Other activities
0
2,000
4,000
6,000
8,000
10,000
12,000
14,000
2012201320142015
EPoC 2015 | European Powers of Construction
64
Balfour Beatty
Balfour Beatty plc is a multinational infrastructure group with capabilities in construction services, support services and infrastructure investments. It performs work for customers principally in the UK and the US, but also in Australia, Canada, the Middle East and Southeast Asia. The Group obtains more than 50% of its total revenue from international markets, operating in around 80 different countries, in various economies and markets.
Balfour Beatty’s main shareholders are UK institutional investors each holding more than 4% of the Company’s shares: Causeway Capital Management LLC. (8.08%), Prudential Plc. (5.81%), Newton Investment Management Limited (4.54%) and Invesco Limited (4.21%).
Balfour Beatty’s activity is divided into three business lines: Construction Services, Support Services and Infrastructure Investments.
Construction ServicesThe Construction business in the UK and the US and joint ventures in the Middle East and South East Asia operate across the infrastructure and building sectors. Construction Services include civil and ground engineering, rail engineering, building, refurbishment and fit-out and mechanical and electrical services. The Construction business continues to be very
selective as the Group seeks to increase bid margin thresholds, improve risk frameworks and achieve better contract governance.
In 2015 the division’s total sales remained in line with the previous year, reaching GBP 6,388 million. Revenue in the UK fell by 14% due to lower levels of order intake in the previous year and the fact that improved bidding disciplines resulted in lower levels of contracts awarded in previous problem areas. This was partially offset by a revenue increase of 3% in the US and a 16% increase in Hong Kong.
The Construction Services order book was stable and remained at the same level as in 2014. The strong growth in the US and the Middle East was offset by the decline in the UK.
Support ServicesThe Support Services division manages, upgrades and maintains critical national infrastructure, and its capabilities complement both Group Construction Services and Infrastructure Investments divisions. The Group’s Support Services include facility management and business services outsourcing, the upgrade and maintenance of water, gas and electricity networks, highway network management, operation and maintenance and rail renewals.
Support Services revenue amounted to GBP 1,259 million, close to the 2014 level, as growth in utilities was offset by a decline in transport. On the other hand, the order book value decreased by 11% mainly because of the long term contracts that the business is currently executing and also due
to the decision to exit a poorly-performing local public contract.
Infrastructure InvestmentsThis segment operates a portfolio of long-term PPP concessions, primarily education, health and roads/street lighting activities. The Group has also established a presence in data centres in Canada. In the last few years Balfour Beatty Investments has extended to new markets and geographies. The portfolio is composed of 70% PPP projects and 30% non-PPP projects, which demonstrates the degree of success of the business in recent years.
The Investments business delivered another successful year of growth in profits and continued to see significant opportunities for future investment in the sector, as well as third-party management opportunities.
2015 PerformanceTotal Group sales decreased by 3% compared to 2014, amounting to GBP 8,444 million. The main business segment is construction, representing 78% of total sales.
Total net losses attributable to the Group amounted to GBP 206 million mainly explained by the performance of the construction services division in the UK, US and Middle East.
The Group’s order book declined by 4% in 2015, amounting to GBP 11,000 million. However, the increase in the bid margin thresholds and the business focus on jobs to which the Group can deliver value has improved the quality of this order book.

EPoC 2015 | European Powers of Construction
65
Key Data (GBP Million) 2015 2014 2013Variation 2015-2014
%Assets Non-current assets 2,522 2,745 2,911 (5.7%)Current assets 2,079 2,439 2,570 (5.1%)Assets held for sale - 60 231 100% Total assets 4,601 5,244 5,712 (8.2%)Liabilities and equity Equity 830 1,230 1,035 18.8%Non-current liabilities 1,407 1,501 1,721 (12.8%)Current liabilities 2,364 2,466 2,737 (9.9%)Liabilities held for sale - 47 219 100% Total liabilities and equity 4,601 5,244 5,712 (8.2%)Statement of profit or loss Sales 8,444 8,793 10,118 (13.1%) National sales 3,843 4,209 4,607 (8.6%) International sales 4,601 4,584 5,511 (16.8%) Construction sales 6,388 6,597 6,573 0.4% Non-construction sales 2,056 2,196 3,545 (38.1%)EBITDA (192) (270) 92 (393.5%)EBIT (182) (281) 48 (685.4%)Net income (206) (59) (35) 68.6% Net income attributable to the Group (206) (60) (41) 45.6%Other key data Net debt 202 226 420 (46.2%)Order book 11,000 11,400 13,355 (14.6%)Market capitalisation 1,864 1,463 1,977 (26%)
Sales by geographical area
United Kingdom
America
Other Countries
0
2,000
4,000
6,000
8,000
10,000
12,000
2012201320142015
Sales by segment
Construction services
Support servicesProfessional services
Infrastructure Investments
Other
0
2,000
4,000
6,000
8,000
10,000
12,000
2012201320142015

EPoC 2015 | European Powers of Construction
66
Ferrovial
Ferrovial is one of the leading global providers of infrastructure and services, with a workforce of approximately 74,000 employees and operations in more than 25 countries. It is included in the prestigious Dow Jones Sustainability Index, FTSE4Good Index and the Carbon Disclosure Project.
The most significant current shareholder in Ferrovial, S.A. is Rijn Capital BV, owned by Ferrovial s Chairman, which holds a 20.3% interest. It is followed by Menosmares, S.L.U., Siemprelara, S.L.U. and Soziancor, S.L.U., which hold 8.2%, 4.2% and 2.5% of total shares, respectively, among other minority shareholders. All the aforementioned companies are controlled by the Del Pino family.
Two of the Group’s main assets are Canada’s 407 ETR highway and London’s Heathrow Airport (both accounted for using the equity method).
Ferrovial also provides municipal services to more than 800 cities within Spain, and to the millions of users of the Madrid metro system. It also performs work on the hundreds of kilometres of streets and highways where Amey performs maintenance services and utilities services in the United Kingdom.
Ferrovial’s activities are divided into four business lines:
ServicesFerrovial Services is an international leader in providing solutions in a range of services that include utilities, highways, waste management, rail, mining, justice solutions,
social housing, facility management and infrastructure maintenance.
The division is basically structured into three geographical areas: the UK (represented by Amey), Spain and other international activities (both headed by Ferrovial Services).
The division’s total revenue grew by 11% to EUR 4,897 million, basically earned in the UK and Spain, which represent 63% and 34% of total Services sales, respectively. In both countries the Group ranks among the top three service providers.
The acquisition of two companies in Poland (Amest Kamiensk and Pro EKO Natura) and TPT UK, in the United Kingdom, allowed Ferrovial Services to increase its capabilities in different fields while able to expand its presence in Europe.
ConstructionFerrovial Agroman is the division of the Ferrovial Group that carries out civil engineering, construction, water-related and industrial projects. It has a consolidated presence in different markets such as the United States, Spain, Canada, the United Kingdom, Australia and Poland. Construction is the main activity of the Group due to its solid historical trend of growth and high profitability, but also because it is an excellent source for obtaining the required cash flows in the diversification and international expansion process.
Ferrovial has been a pioneer in the expansion of Spanish construction companies into stable international markets such as Poland and the United States, where they have established a solid presence through its subsidiaries Budimex, Ferrovial Agroman US and Webber.
In 2015 the segment experienced significant revenue growth, obtaining EUR 4,287 million due mainly to an increase in international sales, which represented almost 81% of total sales.
The construction order book amounted to EUR 8,731 million, with notable projects such as the Thames Tideway Tunnel (UK), the reconstruction of the I-285 (Georgia, US), a section of the S3 and S7 (Poland), Extension II of the 407ETR (Canada), and connectivity improvements at Northern Beaches Hospital (Australia).
AirportsFerrovial is one of the leading private operators in the world, with four operative airports in the United Kingdom. The Group is the largest shareholder in Heathrow Airport Holdings (HAH) over which it maintains a 25% stake. The company is also the industrial partner at the airports of Aberdeen, Glasgow and Southampton (AGS), with a 50% stake.
In 2015 Ferrovial Airports handled 89 million passengers, a 2.6% increase on the 2014 figure.
HighwaysThrough its subsidiary Cintra, Ferrovial is one of the leading private developers of transport infrastructure in the world in terms of number of projects (27 in total) and highway kilometers managed (1,877 kilometers). The Group is currently present in Canada, the United States, Spain, the United Kingdom, Portugal, Ireland, Greece, Colombia and Australia.
Total revenue grew by 18.9% to EUR 513 million due to the contribution from the USA Toll-Road and due to the overall traffic increase in the concession portfolio. The economic recovery and lower oil prices also contributed to this outcome.

EPoC 2015 | European Powers of Construction
67
Key Data (EUR Million) 2015 2014 2013Variation 2015-2014
%Assets Non-current assets 16,821 19,426 17,142 (13.4%)Current assets 8,563 6,047 5,678 41.6% Total assets 25,384 25,473 22,820 (0.3%)Liabilities and equity Equity 6,541 6,021 6,074 8.6%Non-current liabilities 10,401 14,017 11,733 (25.8%)Current liabilities 8,442 5,435 5,013 55.3% Total liabilities and equity 25,384 25,473 22,820 (0.3%)Statement of profit or loss Sales 9,701 8,802 8,166 10.2% National sales 2,694 2,709 2,590 (0.6%) International sales 7,007 6,093 5,576 15.0% Construction sales 4,287 3,942 4,064 8.8% Non-construction sales 5,414 4,860 4,102 11.4% EBITDA 1,027 983 934 4.5% EBIT 901 743 827 21.3% Net income 631 352 701 79.3% Net income attributable to the Group 720 402 727 79.1% Other key data Net debt 4,524 6,230 5,352 (27.4%)Order book 31,531 30,460 25,616 3.5% Market capitalisation 15,270 12,029 10,317 26.9%
Sales by geographical area
Spain
United Kingdom
The United States
Poland
Other countries
0
2,000
4,000
6,000
8,000
10,000
12,000
2012201320142015
Sales by segment
Services Airports
OthersConstruction
Highways
0
2,000
4,000
6,000
8,000
10,000
12,000
2012201320142015
2015 PerformanceGroup sales increased by 10% to EUR 9,701 million in 2015, principally explained by the growth recorded by its construction, services and highways divisions, positive operating performance and the strength of the pound sterling and the US dollar against the euro.
In 2015 net attributable income was EUR 720 million, up 79% compared to the previous year. This increase was caused by some non-recurring results related principally to divestments and taxes.
The Group’s order book grew by 3.5% to EUR 31,531 million. In 2015 Ferrovial was awarded several significant contracts in key markets (the US and Canada), as well as in new emerging markets such as Australia and Colombia.

EPoC 2015 | European Powers of Construction
68
BAM Group
Royal BAM Group N.V. is a European construction group that unites operating companies in five home markets (the Netherlands, Belgium, the United Kingdom, Ireland and Germany) with the corporate centre in the Netherlands and is listed on Euronext Amsterdam. With approximately 21,500 employees, BAM is active in the construction, mechanical and electrical services, civil engineering, property and Public-Private Partnerships (PPP) sectors. The Group is also involved in specialised construction and civil engineering projects in niche markets worldwide.
The main shareholder is A. Van Herk, which controls 9.5%, followed by NN Group N.V. and I.M. Fares, which control 5.5% and 5% of the Company, respectively.
The BAM Group is composed of the following divisions:
ConstructionBAM is active in the construction, mechanical and electrical services sector in all BAM’s home markets, as well as in Switzerland and Denmark. In addition to carrying out non-residential construction work in all its local markets, the Group is also involved in residential construction contracts mainly in the Netherlands and Belgium. Likewise, BAM International carries out non-residential construction projects in the Middle East. BAM International operates from its headquarters in the Netherlands and from regional offices in Tanzania, Dubai, Perth, Panama, Indonesia and other locations.
The division’s total revenue amounted to EUR 3,266 million, 8.3% higher than in 2014. The positive results were mostly attributable to the UK, including the benefit of the stronger pound sterling. Nevertheless, losses before tax amounted to EUR 9.2 million due to negative results in the Netherlands on some older non-residential projects.
The total order book grew by 4% in 2015. The order book increased in the UK (due mainly to foreign exchange rates) and Germany, but fell in Belgium and the Netherlands.
Property InvestmentsBAM is active in residential and non-residential property development in the Netherlands, the United Kingdom, Ireland and Belgium. BAM’s Property sector employs approximately 200 people.
Sales remained at the same level as in 2014 and amounted to EUR 474 million. The result before tax amounted to EUR 15.5 million, supported by non-residential sales in Belgium, the Netherlands and the UK. On the other hand, residential property margins remained low due to market opportunities focused on affordable homes and developments on impaired land.
In 2015 non-cash impairment of EUR 34.3 million was recognised in relation to value adjustments for retail commercial property and other real estate assets (EUR 20.8 million) and retail commercial property (EUR 13.5 million).
Civil EngineeringBAM operates in the civil engineering sector in all its home markets. BAM International also carries out specialised civil engineering works worldwide.
Sales generated within this business segment amounted to EUR 3,926 million, in line with those of 2014. The contraction observed in the Netherlands (lower activity in larger projects) and Belgium (project delays and lower government spending) was offset by the growth achieved in other markets, such as the United Kingdom.
The order book grew by 22% compared to 2014. This increase was driven by the intake of some large multi-year projects in the Netherlands, Ireland and Germany.
Public-Private PartnershipsBAM PPP is responsible for the Royal BAM Group’s involvement in the European Public-Private Partnerships (PPP) market and operates in the roads, rail, education, health care, judicial and general accommodation sectors.
In 2015 BAM PPP won four projects which represent approximately EUR 620 million in construction revenue for the operational sectors in the coming years. At the end of 2015 the number of PPP projects in the portfolio was 45, of which BAM retained interest in 41; for the remaining 4 projects only asset management services are provided.
2015 PerformanceIn 2015 revenue increased by 1.5% and total net profit jumped to EUR 11 million, from the losses recorded in 2014 due to impairments recorder on Dutch Property land bank and two Irish PPP toll roads in 2014.
The order book increased by 12% to EUR 11,480 million. At the end of 2015 Construction and Civil Engineering represented approximately 40% and 55%, respectively, of total backlog. The order book represents approximately 1.5 years of activity.

EPoC 2015 | European Powers of Construction
69
Key Data (EUR Million) 2015 2014 2013Variation 2015-2014
%Assets Non-current assets 1,507 1,469 1,632 2.6% Current assets 3,345 3,487 3,685 (4.1%)Total assets 4,852 4,956 5,316 (2.1%)Liabilities and equity Equity 906 831 933 9.0%Non-current liabilities 813 914 1,024 (11%)Current liabilities 3,133 3,211 3,360 (2.4%)Total liabilities and equity 4,852 4,956 5,316 (2.1%)Statement of profit or loss Sales 7,423 7,314 7,042 1.5% National sales 2,475 2,652 2,722 (6.7%) International sales 4,948 4,662 4,320 6.1% Construction sales 7,192 6,965 6,857 3.3% Non-construction sales 231 349 185 (33.8%)EBITDA 60 (22) 104 (372.9%)EBIT (11) (105) 16 (89.8%)Net income 11 (107) 47 (110.3%)Net income attributable to the Group 10 (108) 46 (109.4%)Other key data Net debt (40) 40 383 (200%)Order book 11,480 10,268 10,000 11.8%Market capitalisation 1,387 698 1,019 98.7%
Sales by geographical area
Netherlands
United Kingdom
Belgium
Germany
Ireland
Other countries
0
1,000
2,000
3,000
4,000
5,000
6,000
7,000
8,000
2012201320142015
Sales by segment
Construction Civil Engineering
Property Investments Other activities
0
1,000
2,000
3,000
4,000
5,000
6,000
7,000
8,000
2012201320142015

EPoC 2015 | European Powers of Construction
70
NCC
The NCC Group was legally incorporated in 1989. However, JCC and ABV have been under a single roof and sharing a logo since 1988. Nowadays, NCC is one of the leading construction and property development companies in Northern Europe, with 17,872 employees and overall sales of SEK 62,465 million. Operations are mainly conducted in the Nordic region; approximately 51% of the year’s sales correspond to operations carried out in Sweden.
The Group’s main shareholder is Nordstjernan AB, with 20.1% of the share capital and 64.2% of the voting rights. The shares are traded on Nasdaq Stockholm/Large Cap.
The Group is structured as follows:
Construction and Civil EngineeringConstruction and Civil Engineering operations are divided into four business areas: NCC Construction Sweden, NCC Construction Denmark, NCC Construction Finland and NCC Construction Norway.
This segment is specialised in the building of residential and office properties, industrial facilities, roads and civil engineering structures. It is the largest segment in the Group, accounting for 56% of total sales.
In 2015 the division’s sales grew by 9% and amounted to SEK 35,305 million. The main increases were achieved in Sweden and Denmark.
Profits improved in Sweden, Denmark and Finland, but declined in Norway due to lower sales levels and several project adjustments. Operating margin
deteriorated slightly because of the weak earnings achieved in Norway.
Order backlog decreased by 5% to SEK 36,258 million; however, it must be noted that the 2014 backlog was exceptionally high due to several major civil engineering projects obtained by NCC Construction Norway.
Road Business / IndustrialNCC Roads’ main activities consist of the production of stone materials and asphalt, as well as asphalt paving and road services in the Nordic region and St. Petersburg. It delivers aggregates and asphalts for numerous applications, ranging from major infrastructure projects to small roads.
Sales within industrial operations decreased slightly to SEK 11,001 million, due to lower bitumen prices and fewer road services contracts.
Revenue recorded by NCC Roads improved as a result of increased orders received by road service and asphalt operations. Nevertheless, NCC Roads’ EBITDA was lower than in the previous year due to the costs incurred for the restructuring process and the closure of unprofitable units in western Denmark.
HousingNCC Housing develops and sells housing in selected markets in the Nordic region, Germany, Estonia, Latvia and St. Petersburg.
In 2015 the division’s total sales increased by 29% to SEK 13,069 million due to higher revenue obtained from both housing and land sales to investors. In 2015 a total of 4,542 housing units were sold to private customers and 1,773 to the investor market, a figure which doubles the amount achieved in 2012. Housing sales to private customers increased in Germany, Sweden, Norway and Finland.
The sales improvement also resulted in a higher operating profit than in 2014.
Property DevelopmentNCC Property Development develops and sells commercial properties in metropolitan regions of Sweden, Norway, Denmark and Finland. The business focuses on office, retail and logistics properties in attractive locations.
NCC Property Development sales amounted to SEK 3,264 million, 10% higher than in the previous year.
The Group’s order book increased by 3.3% and totalled SEK 56,588 million, representing approximately eleven months of activity. The Construction division accounted for 64% of the total order book at year end.
Unlike NCC Construction Norway and NCC Roads, all business areas reported higher earnings than in 2014. As a result, EBITDA rose by 17% compared to the previous year.
2015 PerformanceIn 2015 total sales amounted to SEK 62,495 million, 9.9% higher than in 2014. This was mainly a result of the increase in revenue from the Housing, Swedish and Danish Construction, and Property Development segments.
Operating profit increased by 16.7% in 2015, amounting to SEK 3,039 million. All operating units reported higher earnings than in 2014, except for NCC Roads and NCC Construction Norway. The most significant improvements in earnings were achieved by NCC Housing and NCC Property Development, mainly as a result of the increase in sales volume and higher operating margins.

EPoC 2015 | European Powers of Construction
71
Key Data (SEK Million) 2015 2014 2013Variation 2015-2014
%Assets Non-current assets 6,435 6,395 5,910 0.6%Current assets 32,967 32,592 32,883 1.2%Total assets 39,402 38,987 38,793 1.1%Liabilities and equity Equity 9,714 8,867 8,675 9.6% Non-current liabilities 9,126 10,376 9,937 (12%)Current liabilities 20,562 19,745 20,181 4.1% Total liabilities and equity 39,402 38,988 38,793 1.1% Statement of profit or loss Sales 62,495 56,867 57,823 9.9% National sales 32,104 26,831 30,547 19.7% International sales 30,391 30,036 27,276 1.2% Construction sales 62,400 56,771 57,724 9.9% Non-construction sales 95 96 99 (1%)EBITDA 3,039 2,604 2,672 16.7% EBIT 3,039 2,604 2,679 16.7% Net income 2,120 1,838 1,989 15.3% Net income attributable to the Group 2,113 1,835 1,986 15.1% Other key data Net debt 4,552 6,836 5,656 (33.4%)Order book 56,588 54,777 47,638 3.3%Market capitalisation 28,369 26,443 22,593 7.3%
Sales by geographical area
Sweden
Denmark
Finland
Norway
Other Countries
0
10,000
20,000
30,000
40,000
50,000
60,000
70,000
2012201320142015
Sales by segment
Construction and Civil Engineering
Industrial Operations
Housing
Property Development
Other activities
0
10,000
20,000
30,000
40,000
50,000
60,000
70,000
2012201320142015

EPoC 2015 | European Powers of Construction
72
Acciona
Acciona is one of Spain’s leading corporations. The Company was set up over a century ago, and currently employs more than 32,000 employees and has a presence in more than 30 countries on five continents.
At December 2015, two shareholders held significant ownership interests in the Company: Tussen de Grachten, B.V. (27.7%) and Wit Europesse Investering, B.V. (formerly, Entreazca, B.V.) (28%). Both companies belong to the Entrecanales family (founders of the Group).
The Group is currently structured as follows:
InfrastructureAcciona Infrastructure is capable of taking on all kinds of construction projects, from engineering to works execution and maintenance, as well as public works, concession management and building. This segment represented 33% of the Group’s total sales but only 8.6% of total EBITDA obtained in 2015.
Construction revenue fell by 17.4% to EUR 2,170 million in 2015, mainly due to a decrease in construction activity in Spain, but also internationally. As a result of the decrease in revenue, operating profit within this segment decreased by 13.8% to EUR 102 million. Nevertheless, the EBITDA margin is slightly higher than in the previous year and reached 4.7%. Expectations in the short term are promising, since the backlog grew by 18.1% to EUR 6,722 million. 73% of division’s total order book relate to international projects.
EnergyAcciona Energy is an energy operator on a global scale. It focuses exclusively on
renewables and is a major player in five types of clean energy: wind, solar thermal (CSP), PV solar, hydraulic and biomass.
The energy business represents 42% of the Group’s total sales. In 2015 total revenue amounted to EUR 2,719 million, representing a 23.6% increase compared to 2014 mainly due to the positive performance of Acciona Wind Power. It should be noted that this division accounts for 76% of Acciona’s EBITDA.
In October 2015 Acciona reached an agreement to sell Acciona Wind Power to German wind turbine manufacturer Nordex for a combination of cash and stock. Additionally, Acciona will use the cash proceeds to purchase additional shares in Nordex, subsequently becoming a core shareholder with a 29.9% ownership interest. This will be effective for accounting purposes as of 1 January 2016.
WaterAcciona Water is involved in the water treatment industry, offering the design, construction and operation of drinking water treatment plants, desalination facilities, wastewater treatment plants and tertiary treatment plants for water reuse. Acciona Agua also offers end-to-end service management covering each step of the water treatment process. The company currently meets the water needs of over 90 million people.
The Water division increased revenue by 10% to EUR 451 million, mainly due to the improvement of design and construction activities and operation and maintenance at international level. The Water division recorded EBITDA of EUR 35 million, in line with 2014.
Aggregate new works awarded in 2015 amounted to EUR 814 million and the division’s total backlog reached EUR 9,630 million at December 2015.
ServiceAcciona Service encompasses a range of services provided by the Group: airport handling services, facility services, logistic services, waste management and others.
The division reported an increase in revenue of 3.5%, obtaining EUR 716 million. EBITDA amounted to EUR 31 million, 49.9% higher than in 2014, as a result of a significant improvement in the facility services activity margin.
It is worth noting that Acciona Airport Services was granted a seven-year handling license at Düsseldorf Airport as of 1 April 2016.
Other activitiesThis division includes activities such as real estate, wineries, Bestinver, Transmediterránea and others.
Total revenue recorded within these activities amounted to EUR 613 million, down 11.4% on last year as a result of the contraction observed at Bestinver, a financial services company focusing on asset management. Along the same lines, EBITDA decreased to EUR 113 million, 10.2% lower than in 2014. Nevertheless, Bestinver still represents 59% of the operating profit obtained within this segment. Bestinver’s assets under management stood at EUR 5,106 million at 31 December 2015.
Trasmediterránea improved its EBITDA by EUR 11 million, mainly due to improved operational efficiency and lower fuel and staff costs.
With regard to real estate activities, EBITDA increased to EUR 6 million. Such improvement derives from the change of strategy towards rental activity, which generates lower revenue with a higher margin than the development of homes for sale.

EPoC 2015 | European Powers of Construction
73
Key Data (EUR Million) 2015 2014 2013Variation 2015-2014
%Assets Non-current assets 10,885 10,771 11,526 1.1% Current assets 4,893 5,372 5,258 (8.9%)Total assets 15,778 16,143 16,784 (2.3%)Liabilities and equity Equity 3,754 3,613 3,399 3.9%Non-current liabilities 7,903 7,919 8,123 (0.2%)Current liabilities 4,120 4,611 5,261 (10.6%)Total liabilities and equity 15,778 16,143 16,784 (2.3%)Statement of profit or loss Sales 6,544 6,499 6,607 0.7% National sales 3,213 3,524 3,894 (8.8%) International sales 3,331 2,975 2,713 12% Construction sales 2,170 2,626 2,733 (17.4%) Non-construction sales 4,374 3,873 3,874 12.9% EBITDA 1,174 1,087 1,228 8% EBIT 627 572 -1,771 9.6% Net income 236 207 -2,028 13.9% Net income attributable to the Group 207 185 -1,972 12.1% Other key data Net debt 5,159 5,294 6,715 (2.6%)Order book 16,352 15,051 16,453 8.6% Market capitalisation 4,528 3,218 2,391 40.7%
Sales by geographical area
Spain Rest of OECD countries
Rest of European Union Other countries
0
1,000
2,000
3,000
4,000
5,000
6,000
7,000
8,000
2012201320142015
Sales by segment
Infrastructure
Energy
Water, Service and Other Activities
0
1,000
2,000
3,000
4,000
5,000
6,000
7,000
8,000
2012201320142015
2015 PerformanceTotal sales in 2015 increased by 0.7%, to EUR 6,544 million, mainly as a consequence of the growth achieved by the Group’s energy business, but also because of the positive performance of Acciona Service and Acciona Water.
Net attributable income for 2015 amounted to EUR 207 million, a 12.1% increase on the result achieved in 2014. Note should be made of the net debt reduction of 2.5% to EUR 5,159. This reduction was due mainly to cash generated in the year.
In 2015 the Group’s order book increased by 8.6% to EUR 16,325 million. By segment, the construction order book amounted to EUR 6,722 million (41% of the total) while the Water division’s order book amounted to EUR 9,630 million (59%). They both increased by 18.1% and 2.9% with respect to last year. The biggest contracts entered into in 2015 within the water division were the desalination plants in Qatar and the St. John’s waste water treatment plant. With respect to construction activities, the largest projects Acciona was awarded in 2015 were the construction of a large-scale hydroelectric dam in Canada, the Metro Quito project in Ecuador, the construction of rail line tunnels in Norway and a road concession in Australia.

EPoC 2015 | European Powers of Construction
74
FCC
FCC was incorporated in 1992 following the merger of two companies: Construcciones y Contratas (1944) and Fomento de Obras y Construcciones (1900). With a workforce of approximately 57,000 employees, the Group obtains 47% of its total sales outside Spain.
At 31 December 2015, the main shareholders of the FCC Group were Inmobiliaria Carso (owned by Carlos Slim), with 27.43%, and Samede Inversiones (owned by Esther Koplowitz), with 22.45%. It should be mentioned that in February 2016 the Group completed a capital increase of approximately EUR 709.5 million, which strengthened the Group’s financial position.
The Group’s activities include environmental services and water management, construction of large infrastructure and cement production. In addition, the FCC Group operates in the real estate sector through its 36.9% interest in Realia Business, whose main activities are focused on the office rental market and the development of residential housing. In 2015 the Group agreed to sell one of its concession businesses, Globalvia Infraestructuras, S.A., for a total consideration of EUR 220 million.
Environmental ServicesServices provided by this division include, among others, urban sanitation and industrial waste treatment, recovery and
disposal. It represents 44% of total sales and is the Group’s main line of business in terms of revenue.
In 2015 total sales increased slightly by 2% to EUR 2,856 million, mainly driven by the increase recorded in the international market place. The Environmental Services area accounts for 51.7% of the Group’s EBITDA.
It should be mentioned that in 2015 the Group was awarded an important contract that involves the building and operation of a waste recycling plant in Dallas. This project is expected to generate estimated revenue of EUR 270 million.
Integrated Water Management This division, through its subsidiary Aqualia, provides integral water cycle-related services: collection, treatment and distribution of water for human consumption; wastewater collection, filtering and treatment; and design, construction, operation and maintenance of water infrastructure for municipal, industrial, agricultural and other services.
The Water division accounts for 27.9% of FCC’s EBITDA, with total revenue growing slightly to EUR 1,034 million in 2015 (8.3% higher than in 2014).
In 2015 FCC Aqualia focused on international expansion and was awarded a significant number of contracts, mainly for network construction and water treatment plant maintenance in Latin America and Saudi Arabia (e.g. the Abu Rawash wastewater treatment plant in Cairo).
ConstructionThe Construction sector specialises in infrastructure works, construction and related sectors such as highways, roads and airports.
In 2015 total division sales fell by 4%, amounting to EUR 1,993 million, mainly as a result of the reduction in revenue in the local market (a 13.4% decline compared to 2014). On the other hand, this reduction in sales was partly offset by a 5.4% growth in international sales due to significant projects that are under construction, such as the Doha metro and the Riyadh metro, the longest subway system under development in the world. Sales in Latin America decreased by 34.5% as a result of the completion of major projects. However, due to the commencement of certain important projects, such as the construction of the subway in Lima, growth is expected to be achieved in 2016.
CementThis area engages in the operation of quarries and mineral deposits as well as the manufacture of cement. These activities are carried out through its 77.9% stake in Cementos Portland Valderrivas.
Despite the unfavourable factors affecting the Spanish cement market, total revenue in 2015 grew by 6.9%, amounting to EUR 580 million. It is noteworthy that domestic sales increased by 0.6% after six years of steady decline. Revenue in the US and Canada grew by 18.2% thanks to the dollar’s appreciation against the euro and the positive performance of the cement market, which was partly offset by the decrease in concrete sales.
2015 PerformanceThe Group’s consolidated revenue increased by 2.2% in 2015 to EUR 6,476 million, driven by a notable 9.8% increase in international revenue, with growth in all areas, particularly in Water, Cement and Environmental Services. Nevertheless, revenue in Spain declined by 3.7% to EUR 3,408 million, due mainly to the 13.4% decline in the Construction business as a result of the steady decline in public

EPoC 2015 | European Powers of Construction
75
Key Data (EUR Million) 2015 2014 2013Variation 2015-2014
%Assets Non-current assets 8,184 7,854 8,442 4.2%Current assets 4,678 6,169 7,160 (24.2%)Total assets 12,862 14,023 15,602 (8.3%)Liabilities and equity Equity 487 495 243 (1.7%)Non-current liabilities 7,718 7,834 3,472 (1.5%)Current liabilities 4,657 5,693 11,887 (18.2%)Total liabilities and equity 12,862 14,023 15,602 (8.3%)Statement of profit or loss Sales 6,476 6,334 6,727 2.2% National sales 3,408 3,541 3,910 (3.7%) International sales 3,068 2,794 2,817 9.8% Construction sales 1,993 2,076 2,589 (4%) Non-construction sales 4,484 4,258 4,138 5.3% EBITDA 815 804 720 1.3% EBIT 324 (346) (303) (193.7%)Net income (54) (733) (1,530) (92.6%)Net income attributable to the Group (46) (724) (1,506) (93.6%)Other key data Net debt 5,474 5,016 5,976 9.1% Order book 32,500 32,997 32,865 (1.5%)Market capitalisation 1,824 3,062 2,059 (40.4%)
Sales by geographical area
Spain
Europe
America and other countries
0
2,000
4,000
6,000
8,000
10,000
12,000
2012201320142015
Sales by segment
Environmental Services
Versia
Construction
Cement
Eliminations
Water
0
2,000
4,000
6,000
8,000
10,000
12,000
20122013*20142015
* Since 2013, Versia does not constitute a segment and Integral Water Management is reported as a business unit.
investment in infrastructure in recent years.
Although the Group was not able to obtain profit in 2015, total net losses attributable to the Group were significantly lower than in 2014. The losses incurred in 2015 are explained by the EUR 89.3 million impairment loss recognised on Cemusa, until its sale in November. Excluding this effect, the Group obtained profit from continuing operations of EUR 35.1 million.
The Group’s total order book amounted to EUR 32,500 million, 1.5% lower than in 2014. 44.4% of this backlog belongs to Water division projects, while the Environmental and the Construction area account for the 36.4% and 19.2% of the total, respectively.

EPoC 2015 | European Powers of Construction
76
Interserve
Interserve is one of the world’s foremost support services and construction companies. It offers advisory services, design, construction, equipment, facilities management and frontline public services. Interserve, with a workforce of 90,000 people worldwide, is headquartered in the UK and listed in the FTSE 250 index.
The Group’s main shareholders are Standard Life Investments Ltd., Henderson Group Plc, Old Mutual Plc. and Mondrian Investment Partners, Ltd., which at December 2015 had an ownership interest of 11.7%, 5.3%, 5.0% and 5.0%, respectively.
The Group’s portfolio is divided into three main areas: Construction, Support Services and Equipment Services, all of which are supported by central Group Services.
ConstructionInterserve offers design, development, consultancy and construction services to create whole-life, sustainable solutions for building and infrastructure projects. The division performs activities both in the local market and internationally. In the UK, market demand continued to strengthen in the period, particularly in fit-out and regional building. International Construction continued to gain momentum, stimulated by development plans such as Qatar’s “Vision 2030”, the UAE’s plans for Expo 2020 and the ongoing need for infrastructure development to keep pace with rapid population growth in the region. As a result, the division’s total sales in 2015 rose by 12% to GBP 1,320
million. Both domestic and international construction revenue increased in 2015 by 7% and 34%, respectively. It should be highlighted that 79% of total construction sales are obtained within the UK. Regional business in 2015 was particularly successful, thanks to a high number of new contracts, such as a GBP 200 million Defence and National Rehabilitation Centre (DNRC) at Stanford Hall, near Loughborough.
Support ServicesSupport Services focuses on the management and delivery of operational services to both public and private-sector clients in the UK and internationally.
In 2015 total Support Services sales increased by 8% to GBP 2,106 million. Interserve delivered strong organic growth in the UK, achieving revenue of GBP 1,881 million (9% higher than in 2014) and a further 5% improvement in the operating margin (4.8% in 2014). The Company strengthened its presence in the UK transport sector by securing contract extensions with Govia, London Underground and Network Rail. With regard to international activity, a mix of contract awards and increasing volumes with existing customers resulted in strong revenue growth and an 11% rise in operating profit to GBP 8.2 million. Highlights of the period were winning construction and installation contracts with BP Khazzan, Gulf Petrochemicals Services Company and RasGas, and a contract to provide technical support to Qatar Shell GTL.
Equipment ServicesEquipment Services operates globally, designing, hiring and selling formwork and falsework solutions for use in infrastructure and building projects.
Performance in the period was very positive, with revenue increasing by 8% and operating profit increasing by 58%, to GBP 41.9 million. Operating margin jumped from 13.6% in 2014 to 19.9% in 2015.
In 2015 the division extended its reach by opening new branches in India and the United States but, at the same time, it reduced its presence in other markets such as Australia.
Group ServicesThis segment includes all central costs, including those related to the Group’s financing and central bidding activities. Nowadays, this segment also comprises Investments, which used to be reported separately. Within the investment line, the Group focuses on project-investment activities and manages equity investments both in Public Private Partnership (PPP) and private-sector projects.
Revenue of the Group Services division for 2015 amounted to GBP 53.9 million, 15.4% higher than in 2014. Additionally, Group Services costs fell to GBP 23.6 million. This net reduction accommodated increased investment in back-office capabilities, IT infrastructure, people development and communications.
2015 PerformanceTotal Interserve Group revenue increased by 9.8% to GBP 3,629 million, explained principally by the positive performance of the Construction and Support Service sectors. As a result, net income attributable to the Group rose by 73.6% to GBP 79 million in 2015.

EPoC 2015 | European Powers of Construction
77
Key Data (GBP Million) 2015 2014 2013Variation 2015-2014
%Assets Non-current assets 889 840 558 5.8% Current assets 926 810 597 14.3% Total assets 1,815 1,650 1,155 10% Liabilities and equity Equity 513 480 370 6.9%Non-current liabilities 465 386 141 20.6%Current liabilities 837 784 643 6.7%Total liabilities and equity 1,815 1,650 1,155 10% Statement of profit or loss Sales 3,629 3,305 2,582 9.8% National sales 3,126 2,940 2,266 6.3% International sales 503 365 316 38.0% Construction sales 1,320 1,179 1,018 12% Non-construction sales 2,309 2,126 1,564 8.6% EBITDA 163 120 99 35.6% EBIT 73 56 57 30.1% Net income 80 50 55 60.3% Net income attributable to the Group 79 45 50 73.6% Other key data Net debt 309 269 39 14.8% Order book 7,700 8,100 6,400 (4.9%)Market capitalisation 756 802 804 (5.8%)
Sales by geographical area
UK
Other Countries
0
1,000
2,000
3,000
4,000
5,000
2012201320142015
Sales by segment
ConstructionOther
0
1,000
2,000
3,000
4,000
5,000
2012201320142015

EPoC 2015 | European Powers of Construction
78
Carillion
Carillion is one of the UK’s leading integrated support service companies, with extensive construction capabilities, a substantial portfolio of Public-Private Partnership projects and a sector-leading ability to deliver sustainable solutions. It was created as a result of the stock split of Tarmac Plc in 1999. The Tarmac Group demerged into a building materials company (“Tarmac”) and a company focused on support and construction services (“Carillion”). Nowadays, Carillion Plc. employs more than 46,000 people worldwide, across established businesses in the UK, the Middle East, North Africa and Canada.
At March 2016, Standard Life Investment and BackRock Inc were the only investors with an ownership interest of over 7% (9.87% and 7.2%, respectively). There are four additional institutional shareholders with ownerships interests ranging from 4% to 6%.
In 2015 total Group revenue rose by 12.7% to GBP 4,587 million (2014: GBP 4,072 million). This growth was achieved across all business segments. Geographically, 73% of total sales, or GBP 3,335 million, were made within the United Kingdom. Local and Middle East and North African revenues increased by 13% and 25%, respectively, compared to 2014.
Carillion’s portfolio includes Construction works (which is subdivided into Middle East and the rest of the world), Support Services and Public Private Partnership projects.
Support ServicesCarillion offers a fully-integrated range of skills and capabilities that include property and facilities services, infrastructure services and energy services in the UK, Canada and the Middle East, particularly for large property estates and transport and utility networks. The Group includes various activities in this segment, most notably facilities management, facilities services, rail services, road maintenance, utility services and consultancy businesses. These services represent 55% of the total sales achieved by the Company in 2015.
In 2015 the division’s sales rose by 9% to a record level of GBP 2,534 million. Other than the organic growth of this segment of activity, the positive performance was also a result of the acquisition of two projects in Canada: the Outland Group, a leading provider of remote site accommodation and services, and the Rokstad Corporation, an important provider of services in the overhead power transmission and distribution sector. Underlying operating profits of the Support division increased by 8% in comparison with 2014, amounting to GBP 146.6 million.
In 2015 Carillion was awarded two contracts by the UK National Offender Management Service, to provide facilities management services within public sector prisons. These two projects are worth approximately GBP 2,000.
Middle East Construction ServicesIn this segment the Group reports the results of its building and civil engineering activities in the Middle East and North Africa. Carillion has around 50 years’ experience in the Middle East and has delivered some of the region’s most prestigious buildings and infrastructure projects. These works bring together skills
and resources that very few construction companies can match. The most iconic projects for the Group are Dubai Festival City, the Grand Mosque in Oman, the Yas Hotel (the centrepiece of Abu Dhabi’s Formula 1 Grand Prix Circuit) and the Royal Opera House in Oman.
In 2015 the division’s total sales amounted to GBP 601.6 million (2014: GBP 500.7 million), representing a revenue increase of 20.2%. Underlying operating profit amounted to GBP 25.3 million, a 1% increase on 2014. In 2015 the Group won a number of substantial new contracts: in Dubai, it won a contract to build Phases 1A5 and 1 of the Dubai Trade Centre District; in Oman, it won a major contract from BP to build accommodation and other facilities at BP’s Khazzan Gas Project.
Construction Services (excluding Middle East)This segment reports the results of UK building, civil engineering and development businesses, together with those of the construction activities performed in Canada. These activities comprise 27% of the Company’s total revenue.
Total sales increased to GBP 1,258.3 million as a result of the strong performance in winning works contracts, particularly in 2014, when the company won a significant number of high-quality contracts. Despite the positive results of revenue achieved, operating profit decreased to GBP 37.8 million (2014: GBP 41.5 million), as a result of the reduction in the operating margin to 3.0 basis points.
Public Private Partnership projectsThe Group is a benchmark in Public Private Partnership (PPP) projects, both in the UK and Canada. This business uses private sector finance to deliver a wide range of

EPoC 2015 | European Powers of Construction
79
Key Data (GBP Million) 2015 2014 2013Variation 2015-2014
%Assets Non-current assets 2,057 2,040 1,957 0.8% Current assets 1,813 1,850 1,683 (2%)Total assets 3,870 3,890 3,640 (0.5%)Liabilities and equity Equity 1,017 895 984 13.7% Non-current liabilities 1,082 1,194 995 (9.4%)Current liabilities 1,771 1,802 1,662 (1.7%)Total liabilities and equity 3,870 3,890 3,640 (0.5%)Statement of profit or loss Sales 4,587 4,072 4,081 12.7% National sales 3,335 2,941 2,845 13.4% International sales 1,252 1,131 1,236 10.7% Construction sales 1,860 1,586 1,545 17.3% Non construction sales 2,727 2,486 2,536 9.7% EBITDA 208 220 169 (5.2%)EBIT 209 200 151 4.4% Net income 139 128 106 9.3% Net income attributable to the Group 133 121 100 10.0% Other key data Net debt 170 177 215 (4.2%)Order book 17,400 18,600 18,000 (6.5%)Market capitalisation 1,303 1,445 1,422 (9.8%)
Sales by geographical area
United Kingdom Canada
Middle East and North Africa Other countries
0
500
1,000
1,500
2,000
2,500
3,000
3,500
4,000
4,500
5,000
2012201320142015
Sales by segment
Support Services Other Construction Services
Middle East Construction Services
Private Finance
0
500
1,000
1,500
2,000
2,500
3,000
3,500
4,000
4,500
5,000
2012201320142015
asset-based services for central and local government for hospitals, schools, prisons, military accommodation, roads and railways.
Revenue in 2015 amounted to GBP 192.8 million, largely reflecting the construction progress on new projects won in 2014 and 2015.
Net attributable income grew to GBP 133 million in 2015 (an increase of 10% with respect to 2014), thanks to the overall growth of underlying profit from operations, which was 8% higher than in 2014.
2015 PerformanceIn 2015 total Group revenue rose by 12.7% to GBP 4,587 million (2014: GBP 4,072 million). This growth was achieved across all business segments. Geographically, 73% of total sales, or GBP 3,335 million, were made within the United Kingdom. Local and Middle East and North African revenues increased by 13% and 25%, respectively, compared to 2014.

EPoC 2015 | European Powers of Construction
80
Barratt
Barratt Developments PLC, incorporated over 50 years ago as Greensitt Bros, is one of the UK’s largest housebuilders, with over 5,971 employees and 27 divisions delivering 16,447 homes in 2015. Focused in the UK, the Group builds developments nationwide, from Aberdeen to Plymouth. The Group has been listed on the London Stock Exchange since 1968.
At June 2015, three major shareholders held significant ownership interests in the Group: Capital Research and Management Company, FMR LLC and Standard Life Investments Ltd controlled 11.0%, 8.2% and 4.9% of Barratt Developments, respectively.
Barratt divides its business portfolio into two main segments: Housebuilding and Commercial Developments.
HousebuildingBarratt is a national housebuilder engaging mainly in operations throughout the UK, where it obtains 100% of its total revenue. Operations in the UK are carried out under three main brands: Barratt Homes, David Wilson Homes and Barratt London. The division operates across a broad spectrum of the market, from flats to family homes and urban regeneration schemes. The
segment’s strategy is based on improving the status of the homes in terms of location, design and construction quality.
Total division sales increased by almost 18% in 2015 to GBP 3,702 million. Along the same lines, residential completions in 2015 reached 15,599 (16,447 including joint venture completions in which the Group has an interest) compared to 14,191 in 2014. The positive performance achieved within this business segment allowed the Company to increase its operating profit to GBP 570.7 million (38.9% higher than in 2014), achieving an operating margin of 15.4%. The UK housing market remains strong across all regions, with demand continuing to exceed supply. Mortgage lending has improved and the Government’s Help to Buy programme (equity loans) has had a positive effect, increasing the construction and sales of new housing.
Commercial DevelopmentsCommercial Developments are delivered through Wilson Bowden Developments, which is in a unique position, since it is one of the very few developers with both commercial and residential expertise. The business also has a national footprint, with particular focus on the Midlands and the North of England. Wilson Bowden Developments is also now focusing on mixed-use residential and leisure schemes, such as the scheme in Hounslow where, together with Barratt London, it has entered into a contract to deliver 120,000 square feet of commercial leisure facilities and 530 flats. Other significant projects in operation in 2015 were the Hinckley scheme, which includes 200,000 square feet of retail and leisure space, and the
Derby Development, which comprises a hotel and 46 flats. The portfolio includes a wide range of commercial property, including offices, retail (both in town and out of town), leisure, industrial and distribution centres.
The commercial occupier market is showing signs of increasing confidence. Since the downturn, demand has been mainly satisfied by the availability of second-hand space and, with this accommodation now largely filled, occupiers have turned their attention to new commercial builds. As a result, the division’s total revenue jumped from GBP 14.4 million in 2014 to GBP 57.2 million in 2015, while operating margin reached 10.7%.
Barrat Devlopments’ profit before tax for the year was GBP 566 million (2014: GBP 391 million), the highest profit the Group has ever achieved. Also of note is the significant increase (66%) in the market value of the Group, which amounted to GBP 6,117 million at 30 June 2015.
2015 PerformanceIn 2015 total Group sales rose by 19.1%, amounting to GBP 3,760 million, which also resulted in a 2.3 percentage points growth in operating margin, which reached 15.3% on average (15.4% for housebuilding and 10.7% for commercial developments). The positive performance helped to increase the year-end net cash position by 155%, amounting to EUR 187 million.

EPoC 2015 | European Powers of Construction
81
Key Data (GBP Million) 2015 2014 2013Variation 2015-2014
%Assets Non current assets 1,208 1,248 1,248 (3.2%)Current assets 4,703 3,896 3,606 20.7% Total Assets 5,911 5,144 4,854 14.9%Liabilities and equity Equity 3,711 3,354 3,073 10.7%Non-Current liabilities 787 630 585 24.9%Current liabilities 1,412 1,160 1,196 21.7%Total liabilities and equity 5,911 5,144 4,854 14.9%Income statement Sales 3,760 3,157 2,606 19.1% National Sales 3,760 3,157 2,606 19.1% International Sales - - - - Construction Sales 3,703 3,143 2,593 17.8% Non construction Sales 57 14 14 297.2% EBITDA 580 412 254 40.8% EBIT 577 410 253 40.8% Net income 450 305 75 47.4% Net income attributable to the Group 449 305 75 47.2% Other Key Data Net Debt (187) (73) 26 155.1%Order Book N,A N,A N,A N.AMarket Capitalisation 6,117 3,681 3,033 66.2%
Sales by geographical area
United Kingdom
0
500
1,000
1,500
2,000
2,500
3,000
3,500
4,000
2012201320142015
Sales by segment
HouseBuilding
Commercial developments
0
500
1,000
1,500
2,000
2,500
3,000
3,500
4,000
2012201320142015

EPoC 2015 | European Powers of Construction
82
Peab
Peab is one of the Nordic region’s leading construction and civil engineering companies, listed on NASDAQ OMX Stockholm. It was incorporated over fifty years ago by the Paulsson brothers and now has over 13,000 employees. The Group primarily conducts business in Sweden, where its headquarters are located, but also operates in Norway and Finland, where it focuses on the capital city areas, and has 150 regional offices.
The main Group shareholders have not changed since 2014. They are certain members of the Paulsson family, who control 25.6% of the Company’s share capital and 57.6% of its voting rights.
The Group is structured around the construction and civil engineering sector, as well as other sectors of less significance.
ConstructionThe Group’s Construction division mainly performs contract work for both external and internal customers in the Nordic region, which includes Sweden, Norway and Finland. Three of the Swedish regions are focused on housing production. Projects include everything from new construction to renovation and construction maintenance. Construction activities represent 54% of this segment’s total revenue; however, the Company also performs Civil Engineering activities (26% of the Construction segment) and Industry-related operations (20%).
Sales generated within the Construction segment in 2015 amounted to SEK 36,627 million, representing an increase of 3.0% compared to the previous year. The most significant increase relates to Civil Engineering activities.
As noted, the Construction segment has been negatively affected by the significant write-down of its largest project, the Mall of Scandinavia. This contract has been a challenge due to its large scale and the many changes that have been made over the course of the project, and it resulted in being more expensive than originally expected. As a consequence of the drawbacks, the Group recognised a write-down of SEK 800 million in 2015.
A strong housing market had a very positive effect on the construction investments made in Sweden, Norway and Finland in 2015. However, not all of these countries have grown at the same rate. Sweden and Norway achieved lower growth since they had already experienced positive development in building construction back in 2014. Growth was stronger in Finland, with similar figures to those of 2013. Housing construction was the primary catalyst in construction revenue increase in Sweden, but construction of public premises also developed positively.
The Industry division is also included within the Construction segment activities. The core functions performed are the delivery of materials, equipment and services to external customers and those delivered internally to Peab’s construction and civil engineering projects. The Industry business area is run in seven product segments: asphalt, concrete, gravel and rock, transportation and machines, foundation works, rentals and industrial construction. In 2015 the division’s total sales increased by 3.2% and amounted to SEK 7,565 million. The increase in sales was more significant in the asphalt, gravel and rock product segments.
Total operating profit of the Construction segment, including own construction but also civil engineering and industry activities and not taking into account the impairment recognised on the Mall of Scandinavia
project, amounted to SEK 1,604 million (3.2% higher than in 2014).
Civil EngineeringCivil Engineering activities account for 26% of total construction sector sales. Revenue related to this activity increased by SEK 683 million (8% higher than in 2014) to SEK 9,394 million.
The Civil Engineering business area is a leading player in Sweden, and has operations in Norway and Finland. The division mainly builds and maintains highways, railways and bridges. Peab’s civil engineering is primarily aimed at the local market, obtaining around 90% of its total revenue in Sweden. The division performs operations and maintenance projects in many municipalities in Sweden and is responsible for road maintenance for the Swedish Transport Administration in many areas. As of January 2016, Peab will begin upgrading the E16 road through Kongs-vinger in Norway.
The division’s operating profit for the year amounted to SEK 381 million (2014: SEK 331) and the operating margin improved to 3.6%.
Other activitiesOn a smaller scale, other activities include the Project Development segment and some central Group activities.
Project Development is responsible for the Group’s acquisitions and the development and sale of housing, commercial property and city districts. This business area is divided in two segments: Housing Development and Property Development. In 2015, total sales from Project Development and Group Functions activities reached SEK 7,749 million, 4.1% lower than the revenue obtained in 2014.

EPoC 2015 | European Powers of Construction
83
Key Data (SEK Million) 2015 2014 2013Variation 2015-2014
%Assets Non-current assets 9,323 9,284 9,873 0.4% Current assets 18,718 19,101 21,978 (2%)Total assets 28,041 28,385 31,851 (1.2%)Liabilities and equity Equity 8,076 7,997 7,668 1% Non-current liabilities 4,505 4,719 6,086 (4.5%)Current liabilities 15,460 15,669 18,097 (1.3%)Total liabilities and equity 28,041 28,385 31,851 (1.2%)Statement of profit or loss Sales 44,376 43,630 43,095 1.7% National sales 36,780 35,941 35,066 2.3% International sales 7,596 7,689 8,029 (1.2%) Construction sales 36,627 35,548 36,650 3% Non-construction sales 7,749 8,082 6,445 (4.1%)EBITDA 2,651 2,596 1,496 2.1% EBIT 1,009 1,752 614 (42.4%)Net income 798 1,027 298 (22.3%)Net income attributable to the Group 798 1,027 298 (22.3%)Other key data Net debt 3,118 3,886 5,944 (19.8%)Order book 26,991 24,922 28,164 8.3% Market capitalisation 19,128 16,208 11,650 18%
Sales by geographical area
Sweden Finland
Norway Other countries
0
5000
10,000
15,000
20,000
25,000
30,000
35,000
40,000
45,000
50,000
2012201320142015
Sales by segment
Construction
Civil Engineering
Industry
Other activities
0
5000
10,000
15,000
20,000
25,000
30,000
35,000
40,000
45,000
50,000
2012201320142015
2015 PerformanceIn 2015 total Group operative net sales increased by 1.7% compared to the previous year, amounting to SEK 44,376 million. It should be pointed out that the write-down of the Mall of Scandinavia project, reduced net sales and operating profit by SEK 800 million, as will be explained subsequently in further detail. As a result of the write-down, the Company’s operating income decreased by 28.7% to SEK 1,851 million. Orders received increased by 19% in 2015, amounting to SEK 37,812 million (2014: 31,690).
The Group’s total order backlog at December 2015 increased by 8.3%, amounting to SEK 26,991 million (2014: SEK 24,922). Despite the fact that last year most of the orders were concentrated in the Stockholm region, the backlog for 2015 is well spread in terms of product and geography. Overall, the selected projects for future years are characterised by being smaller- and mid-sized, with shorter production times and lower risk profiles.

EPoC 2015 | European Powers of Construction
84
Salini Impregilo
Salini Impregilo is a dynamic Italian industrial group specialised in the construction of major, complex infrastructure projects able to compete with leading global players at an international level. It operates in over 50 countries both in developed and underdeveloped markets, with 35,000 employees. Salini Impregilo is a global player in the construction sector and a leading company in the water segment. The Group focuses its activities on a strong passion for construction, which is reflected in its portfolio of international projects. Dams and hydroelectric plants, hydraulic works, railways and metro systems, airports and motorways and civil and industrial buildings are the projects in which the Group has been operating for over a century.
The Group’s main shareholder is Salini Costruttori, with a 65.46% ownership interest, followed by Free Float, which holds 33.91% of the share capital. The remaining share capital is owned by minority shareholders. The Company’s shares are listed on the Mercato Telematico Azionario (electronic stock exchange) managed by Borsa Italiana, S.p.A.
Salini has taken a further step in its internationalisation process by acquiring the US company Lane Industries Inc, which will be consolidated in the Group’s balance sheet as of January 2016. Lane is the top highway contractor and top private asphalt producer in the United States, specialised in heavy civil construction
and in the transportation infrastructure sector. Following the acquisition, the US construction sector will become a core market for the Company, since it is expected to contribute up to 21% of its total revenue in the coming years.
Salini Impregilo operates in all sectors requiring complex large-scale infrastructures, offering the following services:
Dams, hydroelectric plants and hydraulic worksThe Group is a world leader in the construction of dams, hydroelectric plants and hydraulic engineering works. Salini Impregilo has constructed approximately 257 dams and hydroelectric plants internationally, with an installed capacity of more than 37,500 MW of low-cost, clean energy.
Currently, the Group is involved in significant engineering projects which include: the completion of the new Panama Canal, one of the world’s most complex feats of engineering set to contribute substantially to global trade; the Grand Ethiopian Renaissance Dam in Ethiopia, which will be the largest dam in Africa; and the tunnel under Lake Mead near Las Vegas, among other projects.
Motorways, roads and bridgesSalini Impregilo also focuses on transport projects, in which road infrastructure plays a decisive role in the economic growth and social development of an area. Salini Impregilo has constructed over 51,660 km of roads and motorways and approximately 350 km of bridges and viaducts across the globe. The Group currently participates in numerous projects overseas, such as the A1 motorway in Poland and the Gerald Desmond Bridge in California.
As previously mentioned, the acquisition of Lane Industries Incorporated will stimulate the expansion of Salini’s operations in the US market. The American company operates in three segments, which are asphalt manufacturing, road and other infrastructure projects, both locally and internationally. The company is currently involved in some large and complex projects in the United States, such as the construction of the I-4 Ultimate freeway in Florida.
Railways and undergroundsSalini has taken advantage of its innovative technologies to become a significant player within the Rail Transport segment, which represents the most sustainable terrestrial mobility method currently available. The Group has contributed to its development by building over 6,830 km of railway lines, about 400 km of metro lines and more than 1,450 km of underground works.
Salini Impregilo is involved in the building of high-speed railways, such as the AV Ankara-Istanbul line in Turkey and the Milan-Genoa line in Italy, as well as the “rebirth” of urban metro transport throughout the world. Outside Europe, the Group participates in the Red Line in Doha, Qatar, one of the largest infrastructure developments in the Middle East, as well as in the longest line of the new metro of Riyadh in Saudi Arabia.
Civil and industrial buildingsSalini Impregilo plays an important role in the building of innovative and iconic civil structures worldwide. Some examples are the Kingdom Centre in Riyadh, the European Parliament in Strasbourg and the Great Mosque in Abu Dhabi. Significant contracts such as hospital complexes, university campuses, government buildings and other structures not only satisfy practical needs, but also play an

EPoC 2015 | European Powers of Construction
85
Key Data (EUR Million) 2015 2014 2013Variation 2015-2014
%Assets Non-current assets 1,051 1,060 531 (0.8%)Current assets 6,251 5,610 3,446 11.4% Total assets 7,302 6,670 3,976 9.5% Liabilities and equity Equity 1,217 1,186 1,399 2.6% Non-current liabilities 1,413 1,159 443 21.9% Current liabilities 4,672 4,324 2,134 8% Total liabilities and equity 7,302 6,670 3,976 9.5% Statement of profit or loss Sales 4,739 4,194 2,323 13% National sales 711 736 681 (3.4%) International sales 4,028 3,458 1,642 16.5% Construction sales 4,596 4,097 2,155 12.2% Non construction sales 143 97 168 47.4% EBITDA 487 436 261 11.6% EBIT 273 258 158 5.5% Net income 82 103 188 (20.3%)Net income attributable to the Group 61 94 188 (35.0%)Other key data Net debt 27 89 421 (70%)Order book 33,300 32,374 28,800 2.9% Market capitalisation 1,980 1,501 1,987 31.9%
Sales by geographical area
Italy
Other countries
0
1,000
2,000
3,000
4,000
5,000
2012201320142015
Sales by segment
ConstructionOther
0
1,000
2,000
3,000
4,000
5,000
2012201320142015
important cultural role, such as the world famous recently-awarded Stavros Niarchos Cultural Centre in Athens, currently under construction.
2015 Performance2015 was a positive year for the Group, which generated revenue of EUR 4,739 million, 13% higher than in 2014, thanks mainly to several large foreign contracts that the Company entered into. Several examples are: the Red Line North project in Qatar; the Riyadh Metro in Saudi Arabia; the Gibe III and GERD hydroelectric plants in Ethiopia; and the high-capacity/high-speed Milan-Genoa railway section. In fact, total international revenue increased by 16.5% in 2015 to EUR 4,028 million. As a result, the Group’s operating profit (EBITDA) amounted to EUR 487 million (11.6% higher than in 2014) and net debt was reduced by 70% to EUR 26.8 million, an achievement that has been recognised by the markets.

EPoC 2015 | European Powers of Construction
86
Kier Group
The Kier Group, which was incorporated in the United Kingdom in 1992, is a leading property, residential, construction and services Group that operates mainly in the local UK market, although it has recently expanded into areas in other continents, including the Middle East, Hong Kong, Australia and the Caribbean. Kier currently employs over 24,000 people and delivers services that vary throughout a wide range of sectors, including defense, education, health, housing, the industrial sector, power, property, transport and utilities.
Kier’s activities are currently structured as follows:
ConstructionThe Construction segment represents 51% of the Group’s total revenue and is mainly focused on UK building and civil engineering projects, although it also includes international operations carried out by the Group, mostly in the Middle East. This division has a well-established, leading position in strategic frameworks, supported by its strong regional building position in the public and private sector together with its solid local supply chain partners. The infrastructure division is benefiting from greater local government investment.
Revenue generated within the Construction segment amounted to GBP 1,720.8 million at June 2015, 7.8% higher than in the previous year. Underlying operating profit also increased by 12%, from GBP 33.6 million in 2014 to GBP 37.7 million in 2015.
Within the UK building sector, Kier has developed its profile in the biotech sector by carrying out several construction
projects at the University of Cambridge. It was also awarded the GBP 170 million first phase of The Ram Quarter, an important flagship regeneration scheme. Additional infrastructure projects include the Crossrail Farringdon station, which is expected to be completed in 2018, and the Deephams waste water treatment project for Thames Water.
ServicesThe Services division encompasses capabilities in highway maintenance (both local authority and strategic highways), housing maintenance, utilities, facilities management and environmental services. The recently-acquired activities of Mouchel’s consulting and local authority business processing operations, recently renamed Kier Business Services, are also included within this segment.
The Services division represents around 37% of the Group’s total revenue, which amounted to GBP 1,247 million in 2015 (a 12.9% increase on 2014). The high level of sales obtained in this segment is due mainly to the award of a GBP 200 million, four-year highway services contract by Northamptonshire County Council and the maintenance works obtained as part of the AMP6 water cycle.
PropertyThis division focuses on property development and structured finance. Kier operates across various sectors but focuses particularly on the industrial, commercial, retail and leisure sectors, as well as the public sector, in which demand has increased over recent years. The Group works with joint venture partners in order to develop property businesses, and participates in projects such as the retail and leisure development in Catterick and the Logistics City industrial space.
ResidentialThe Group has restructured its business by creating the Residential division, which
comprises elements that were previously included within the Property and Construction divisions. At June 2015, this segment accounted for 8% of total Group sales. Activities performed include private housebuilding as well as affordable mixed-tenure housing partnerships. The client’s portfolio involves local authorities, housing associations and the private rental sector.
2015 PerformanceThe Group had achieved total revenue of GBP 3,351 million at June 2015, which represents a 12.3% increase on the previous year. Approximately 96% of total sales were made within the United Kingdom. As a result, profit from current operations improved by 17.8%, from GBP 88 million recorded in 2014 to GBP 104 million at June 2015. Overall, underlying operating margins remained strong; however, the best results were obtained within the property and residential divisions.
In June 2015 the Group performed a significant transaction by completing the acquisition of the international infrastructure and business services group Mouchel Consulting for a total of GBP 265 million. The acquisition benefited both companies by combining Mouchel’s outstanding position in the strategic highways services market and Kier’s presence in the local authority roads market. As a result, Kier will position itself as a sector leader in the growing UK market of highway management and maintenance, and this will allow the construction Group to expand its operations across its local border.
As a result of both the positive financial results achieved and the announcement of the transaction between Kier and Mouchel, Kier’s market capitalisation index increased by 38%, amounting to GBP 1,354 million at June 2015.

EPoC 2015 | European Powers of Construction
87
Key Data (GBP Million) 2015 2014 2013Variation 2015-2014
%Assets Non-current assets 1,020 582 222 75.1% Current assets 1,721 1,250 911 37.7% Total assets 2,741 1,832 1,133 49.6% Liabilities and equity Equity 585 310 158 89% Non-current liabilities 801 444 200 80.3% Current liabilities 1,355 1,078 775 25.7% Total liabilities and equity 2,741 1,832 1,133 49.6% Statement of profit or loss Sales 3,351 2,985 1,983 12.3% National sales 3,213 2,825 1,918 13.7% International sales 138 160 65 (13.8%) Construction sales 1,721 1,597 1,307 7.8% Non-construction sales 1,630 1,388 676 17.4% EBITDA 104 88 70 17.8% EBIT 61 35 49 74% Net income 6 11 39 (48.6%)Net income attributable to the Group 4 10 38 (56%)Other key data Net debt 141 123 (60) 14.6%Order book 9,300 6,200 4,300 50%Market capitalisation 1,354 981 456 38%
Sales by geographical area
United Kingdom
Other Countries
0
500
1,000
1,500
2,000
2,500
3,000
3,500
4,000
2012201320142015
Sales by segment
ConstructionServices
ResidentialProperty
0
500
1,000
1,500
2,000
2,500
3,000
3,500
4,000
2012201320142015

EPoC 2015 | European Powers of Construction
88
OHL
OHL is the result of the merger between Obrascon, Huarte and Lain in 1999 and is one of the largest international concession and construction groups in the world. Having been in business for over one hundred years, the Group performs significant operations in 30 countries across all 5 continents. OHL has a workforce of around 24,000 employees.
In 2015 there was an increase in the activity of all the Group’s divisions. Total sales grew by 17% to EUR 4,369 million.
The main shareholder is Inmobiliaria Espacio, S.A., which controls more than 50% of the Group.
OHL is composed of the following divisions: Concessions, Engineering and Construction and Development.
ConcessionsThe activities carried out by this division consist of the development, management and maintenance of transportation infrastructures such as motorways, ports, airports and railways.
OHL’s broad experience in the promotion, development and operation of transportation infrastructures in a full range of modalities allows the Spanish Group to be considered one of the leading companies in the international market for Public-Private Partnerships.
OHL Concessions manages a direct portfolio of 19 concessions. The Company participates in 14 toll roads with a total of
962 km. In addition, it manages an airport in Mexico (Toluca International Airport), three ports in Spain and Chile and one railway concession in Madrid. Mexico provides the main source of revenue, with total sales exceeding EUR 267 million, representing 60% of concession sales.
Concessions sales rose by 20.5% to EUR 445 million, due mainly to an increase in traffic and tolls in Mexico. On the other hand, EBITDA fell slightly due to the sharp fall in the inflation rate in Mexico in the year, which affects the guaranteed return of some of its Mexican concessions.
Engineering and ConstructionThis segment includes three different businesses: Construction, Industrial and Services. Construction is the group’s leading business, with sales representing 74.3% of total revenue. The segment focuses on civil engineering works and selective building construction all over the world. OHL operates through several international subsidiaries, mainly established in Europe and North America.
In 2015 sales increased by 16.5% to EUR 3,248 million. This growth is partly due to the positive performance of the US subsidiaries and new projects in Texas and California, and the higher level of activity in Mexico and the Middle East. However, the division’s margin decreased slightly to 4.6% in 2015. This downturn can be traced back to: the increasing number of contracts in developed economies, which have lower margins but higher cash conversion cycles; the delay in execution of certain concession projects because of difficulties in obtaining certain permits; and more conservative estimates of project cost forecasts.
The Industrial business is focused on the engineering and construction of industrial plants.
The segment generated sales of EUR 352 million, demonstrating solid growth compared to 2014. However, EBITDA reflects negative values because of the absorption of structural costs in new projects and the award of new contracts with tighter margins.
Services activity specialises in the provision of services to buildings, related to their infrastructure and activity/services. It achieved sales of EUR 199 million, 37% higher than in the previous year. The EBITDA margin was slightly lower, due mainly to increased competition in the sector.
DevelopmentDevelopment covers a broad range of services associated with a project’s life cycle, from its initial stage to divestment. It represents 3% of total Group sales, and reached EUR 125 million. This segment experienced an increase of 27% in revenue due to the performance of the Mayakoba hotels.
2015 PerformanceIn 2015 there was an increase in the activity of all the Group’s divisions. Total sales grew by 17% to EUR 4,369 million while net income rose by 39.7% to EUR 259 million.
Net debt decreased by 28.8% to EUR 4,007 million, due in part to the significant capital increase of EUR 971.6 million.
At December 2015 the Group’s backlog amounted to EUR 64,970 million. The concession business represents 89% of the total order book, which includes many long-term projects. On the other hand, the international backlog represents 89.5% of the total.

EPoC 2015 | European Powers of Construction
89
Key Data (EUR Million) 2015 2014 2013Variation 2015-2014
%Assets Non-current assets 10,234 10,510 10,104 (2.6%)Current assets 5,055 3,720 3,576 35.9% Total assets 15,289 14,230 13,680 7.4% Liabilities and equity Equity 4,812 3,492 3,282 37.8% Non-current liabilities 6,583 7,049 7,310 (6.6%)Current liabilities 3,894 3,688 3,087 5.6% Total liabilities and equity 15,289 14,230 13,680 7.4% Statement of profit or loss Sales 4,369 3,731 3,684 17.1% National sales 760 846 932 (10.2%) International sales 3,609 2,885 2,752 25.1% Construction sales 3,248 2,794 2,670 16.2% Non-construction sales 1,121 937 1,014 19.6% EBITDA 967 1,078 1,215 (10.3%)EBIT 685 614 1,031 11.5% Net income 259 185 405 39.7% Net income attributable to the Group 56 23 270 141.2% Other key data Net debt 4,007 5,625 5,542 (28.8%)Order book 64,970 66,766 59,515 (2.7%)Market capitalisation 1,575 1,850 2,937 (14.9%)
Sales by geographical area
Spain
Mexico
Eastern Europe
The United States
Peru
Other countries
0
500
1,000
1,500
2,000
2,500
3,000
3,500
4,000
4,500
5,000
2012201320142015
Sales by segment
Engineering and Construction
Development
Concession
0
500
1,000
1,500
2,000
2,500
3,000
3,500
4,000
4,500
5,000
2012201320142015

EPoC 2015 | European Powers of Construction
90
Taylor Wimpey
Taylor Wimpey is one of the largest UK-focused residential companies, the core business of which involves land acquisition, home and community design, urban regeneration and the development of supporting infrastructure. The Company mainly builds a wide range of homes in the UK market; however, it has also expanded its operations to Spain. The Group was formed through the merger of George Wimpey and Taylor Woodrow in 2007.
At December 2015 four major shareholders held ownership interests of 4.7% or more in the Group: Blackrock Inc., JP Morgan Asset Management Holdings Inc, FMR LLC and Schroder plc & Schroder Investment Management Limited controlled 5.55%, 4.99%, 4.84% and 4.71% of the Group, respectively.
Some significant projects in which Taylor Wimpey is currently involved include the new Great Western Park community in the Didcot area, which includes the building of approximately 3,000 homes. Taylor Wimpey was also selected by the UK Ministry of Defence to develop the Prince Phillip Barracks project in Hampshire.
The Company spreads its business across the following areas:
North DivisionThe North Division includes East and West Scotland, Yorkshire and Manchester among other regions. Sales increased by 17.4% within this area in 2015, amounting to GBP 1,094 million, thanks both to a higher level of demand and a 7.1% rise in prices. Within this context, the private sales rate increased by 12.1%. The North Division contributed up to 34.8% of total revenue.
Central & South West DivisionThis division covers areas such as Oxfordshire, South Wales, Bristol, Exeter and East and South Midlands. Revenue obtained within this segment amounted to GBP 1,075 million, which represents an increase of 20.8% with respect to 2014 and 34.2% of total Group sales. The average selling price increased by 8.5%.
London and South East DivisionBusiness within London and nearby areas are the most representative of this division. The strongest market growth within this segment took place outside Central London. Sales within this segment increased by 10.4% to GBP 911.6 million.
SpainThe international business of Taylor Wimpey comprises the building of high-quality homes near the Mediterranean coast in Spain. The Company experienced significant improvement within this market, obtaining revenue of GBP 58 million, 72.4% higher than in the previous year. The Company, which completed 251 homes in this area in 2015, aims to increase its presence in the country in the near future.
2015 Performance2015 was a positive year for Taylor Wimpey, as it achieved revenue of GBP 3,140 million, up to 16.9% compared to 2014. It completed 13,219 new homes (excluding those completed through joint ventures) throughout the year, 7.5% more than in the previous year. Expectations for 2016 are also optimistic thanks to the figures of the year-end order book, which amounts to GBP 1,779 million and represents 7,484 homes.
As a consequence of the aforementioned factors, EBITDA increased by 32.2% to GBP 632 million in 2015 and net income attributable to the Group amounted to GBP 490 million, 38.4% higher than in 2014. The value of the Company’s shares also benefited from the positive results, achieving market capitalisation of GBP 6,618 million at December 2015.

EPoC 2015 | European Powers of Construction
91
Key Data (GBP Million) 2015 2014 2013Variation 2015-2014
%Assets Non-current assets 201 327 405 (38.5%)Current assets 4,330 3,813 3,160 13.6% Total assets 4,531 4,140 3,565 9.4% Liabilities and equity Equity 2,723 2,536 2,252 7.4% Non-current liabilities 683 646 483 5.7% Current liabilities 1,125 958 830 17.4% Total liabilities and equity 4,531 4,140 3,565 9.4% Statement of profit or loss Sales 3,140 2,686 2,296 16.9% National sales 3,081 2,652 2,272 16.2% International sales 59 34 24 73.5% Construction sales 3,104 2,667 2,267 16.4% Non construction sales 36 19 29 89.5% EBITDA 632 478 310 32.2% EBIT 632 497 355 27.1% Net income 490 354 271 38.4% Net income attributable to the Group 490 354 271 38.4% Other key data Net debt (223) (113) (5) 98% Order book 1,779 1,397 1,246 27.3% Market capitalisation 6,618 4,483 3,600 47.6%
Sales by geographical area
United Kingdom
Spain
0
500
1,000
1,500
2,000
2,500
3,000
3,500
2012201320142015
Sales by segment
Housing sales
Land sales
0
500
1,000
1,500
2,000
2,500
3,000
3,500
2012201320142015

EPoC 2015 | European Powers of Construction
92
European construction and infrastructure group contacts
Region Name Telephone Email
Austria Marieluise Krimmel +43(1)537002412 [email protected]
Bruno Moritz +43(1)537004300 [email protected]
Nikolaus Mueller +43(1)537007575 [email protected]
Alexander Hohendanner +43(1)537002700 [email protected]
Belgium Jean-Paul Loozen +32(2)6394940 [email protected]
Pierre-Hugues Bonnefoy +32(2)8002035 [email protected]
Rick Neckebroeck +32(2)8002022 [email protected]
Luc Van Coppenolle +32(3)8008905 [email protected]
Central Europe Diana Radl Rogerova 4,20246E+11 [email protected]
Maciej Krason +48(22)5110360 [email protected]
Denmark Thomas Frommelt +45(45)945027 [email protected]
France Marc de Villartay +33(1)55612716 [email protected]
Laure Silvestre-Siaz +33(1)55612171 [email protected]
Germany Franz Klinger +49(89)290368362 [email protected]
Michael Mueller +49(89)290368428 [email protected]
André Bedenbecker +49(0)2118772 3503 [email protected]
Greece Alexis Damalas +302106781310 [email protected]
Dimitris Nektarios +302106781317 [email protected]
Ireland Michael Flynn +353(1)4172515 [email protected]
Kevin Sheehan +353(1)4172218 [email protected]
Padraic Whelan +353(1)4172848 [email protected]
Italy Elena Vistarini +39(02)83325122 [email protected]
Andrea Restelli +39(02)83322062 [email protected]
Luxembourg Benjamin Lam +(352)451452429 [email protected]
The Netherlands Paul Meulenberg +31(88)2883281 [email protected]
Jurriën Veldhuizen +31(88)2881636 [email protected]
Norway Aase-Aamdal Lundgaard +47(23)279282 [email protected]
Thorvald Nyquist +47(23)279663 [email protected]
Portugal Joao Costa da Silva +351(21)0427511 [email protected]
Miguel Eiras Antunes +351(21)0423825 [email protected]
Jose Gabriel Chimeno +351(21)0422512 [email protected]
Spain Javier Parada +34(91)5145000 [email protected]
Miguel Laserna +34(91)5145000 [email protected]
Turkey Erdem Selcuk +90(212)3666026 [email protected]
UK Makhan Chahan +44(0)2070070626 [email protected]
Jack Kelly +44(0)2070070826 [email protected]
Nigel Shilton +44(0)2070077934 [email protected]


For further information, please visit www.deloitte.es
Deloitte refers to one or more of Deloitte Touche Tohmatsu Limited, a UK private company limited by guarantee (“DTTL”), its network of member firms, and their related entities. DTTL and each of its member firms are legally separate and independent entities. DTTL (also referred to as “Deloitte Global”) does not provide services to clients. Please see www.deloitte.com/about for a more detailed description of DTTL and its member firms.
Deloitte provides audit, consulting, financial advisory, risk management, tax, and related services to public and private clients spanning multiple industries. With a globally connected network of member firms in more than 150 countries and territories, Deloitte brings world-class capabilities and high-quality service to clients, delivering the insights they need to address their most complex business challenges. Deloitte’s more than 225,000 professionals are committed to making an impact that matters.
This communication contains general information only, and none of Deloitte Touche Tohmatsu Limited, its member firms, or their related entities (collectively, the “Deloitte Network”) is, by means of this communication, rendering professional advice or services. Before making any decision or taking any action that may affect your finances or your business, you should consult a qualified professional adviser. No entity in the Deloitte Network shall beresponsible for any loss whatsoever sustained by any person who relies on this communication.
© 2016. For information, contact Deloitte, S.L.
Designed and produced by the Communications, Brand and Business Development department, Madrid.