global powers of consumer products 2015 connecting · pdf fileglobal powers of consumer...
TRANSCRIPT
Global Powers of Consumer Products 2015Connecting with the connected consumer
2Global Powers of Consumer Products 2015
Contents
Welcome 1
Global economic outlook 2
Connecting with the connected consumer 6
Global Powers of Consumer Products Top 250 10
Top 250 highlights 23
Top 10 25
Geographic analysis 27
Product sector analysis 35
Top 250 newcomers 46
Fastest 50 47
M&A activity 50
Q ratio analysis 59
Study methodology and data sources 66
Contacts 67
1Global Powers of Consumer Products 2015
Deloitte Touche Tohmatsu Limited (DTTL) is pleased to present the eighth annual Global Powers of Consumer Products. This report identifies the 250 largest consumer products companies around the world based on publicly available data for the fiscal year 2013 (encompassing companies’ fiscal years ended through June 2014).
The report also provides an outlook on the global economy; an analysis of market capitalization in the industry; a look at merger & acquisition activity in the consumer products industry; and a discussion on the importance of connecting with the connected consumer.
2Global Powers of Consumer Products 2015
Big global issues
Falling oil price
As of this writing, the global price of oil has declined more than 50 percent from where it was in the first half of 2014. Oil has fallen due to weak global demand combined with a considerable increase in oil production in the U.S., Canada, Iraq, and Libya. Yet the U.S. is the main story, with oil production through fracking in North Dakota and Texas having transformed the global industry (hydraulic fracturing, called “fracking,” injects pressurized liquid into rock to extract oil or gas). The other big part of the story is the decision by Saudi Arabia not to cut production in order to boost prices. Rather, the Saudis are content to allow the price to sink in the hope that they will gain market share at the expense of frackers.
The drop in the price of oil is having a considerable impact on the global economy. It is creating disinflationary pressures, especially in developed markets such as the U.S., Europe, and Japan; it is boost-ing consumer purchasing power in oil-consuming nations such as Japan, India, the U.S., and much of Europe, and contributing to faster economic growth than would otherwise be the case; and it is wreaking havoc for oil exporters such as Russia, Iran, Venezuela, and Nigeria. Most importantly it has contributed to the stunning rise in the value of the U.S. dollar. Oil exporters are paid in dollars and then recycle those dollars by purchasing goods or assets from the rest of the world. With a lower oil price, the supply of dollars available for such purchases has declined. This paucity of dollars has caused the price of dollars to rise.
Global economic outlook
What can we expect going forward? In the short term, it is likely that the price of oil will fall further. There is a considerable amount of new oil production already in the pipeline in the U.S. that is expected to come on line in 2015, and crude inventories continue to pile up. Longer term, however, a low price is likely to retard investment in fracking. Indeed we’re already seeing a cutback in drilling permits and a drop in oil company capital expenditures. A reduction in U.S. production could, therefore, happen right when global demand starts to pick up speed. If this happens, the price will surely rebound, perhaps in the next one to two years. A rising price will be inflationary for consuming nations, will put pressure on external debt service for consuming nations, and will probably force tighter monetary policy at least in the U.S. For oil exporters, it would be beneficial – especially for such countries as Russia, Iran, Venezuela, and Mexico.
Rising U.S. dollar
One of the big stories in 2014 and early 2015 has been the sharp rise in the value of the U.S. dollar against most other major cur-rencies. There were several reasons for this. Among them were the decline in the price of oil; faster economic growth in the U.S.; expectations of higher U.S. interest rates; and weak growth com-bined with more aggressive monetary policy in Europe, China, and Japan. The rising dollar has many effects. First, it is disinflationary in the U.S. by reducing import prices. This will provide the Federal Reserve with more time before it must raise short term interest rates. Second, a rising dollar is inflationary for everyone else. That will be good for Europe and Japan, where inflation is way too low. It will be a problem in many emerging markets. Indeed several have raised short term interest rates in order to stabilize their cur-rencies and fight inflation, leading to slower growth. Third, a rising
dollar could be problematic for companies in emerging countries that have dollar-denominated debts. The volume of such debt has quadrupled in the last seven years. Going forward, while it is nearly impossible to accurately predict exchange rates, it does seem likely that the dollar will continue to face upward pressures, at least in early 2015.
Major markets
China
China’s economy has slowed down and continues to show signs of weakness despite government efforts to reverse the slowdown. The Chinese economy grew 7.4 percent in 2014, the slowest rate since 1990. The government expects growth of only 7.0 percent this year. Low growth could mean an inability to absorb workers migrating from rural to urban areas. The result would be high un-employment and social unrest. And, if the workers didn’t migrate, China wouldn’t grow since there would be zero productivity gains that come from switching workers from farms to factories. Thus, China can ill afford to grow much more slowly.
Why is China decelerating? First, export markets such as Europe have been dormant. Even the U.S. market isn’t what it used to be for China. Plus, China’s wages and currency have increased in recent years, thereby reducing the competitiveness of Chinese exports. The result has been that some manufacturing capacity has moved outside of China. Companies are looking elsewhere to produce goods for export. Basic assembly is moving from China to Vietnam, Indonesia, and elsewhere.
3Global Powers of Consumer Products 2015
Second, the government has attempted to limit the growth of the shadow banking system. Lending outside traditional banking chan-nels has resulted in excess investment in property, infrastructure, and heavy industry. The result is a growing volume of non-per-forming assets which threatens the stability of the financial system. Indeed the government has recently estimated that, in the past five years, $6.8 trillion in investment has been wasted. Yet efforts to limit this activity have contributed to the slowdown in growth. The government is torn between a desire to limit financial risk and a desire to avoid a sharp slowdown. It has taken measures to limit the growth of shadow banking while, at the same time, attempted to stimulate more traditional forms of credit through easing of monetary policy. Indeed interest rates have been cut and the required reserve ratio of banks has been reduced. The problem is that, with considerable excess capacity in property and industry, it is not clear that easier monetary policy will necessarily lead to more credit market activity. Moreover, it is not clear if such an increase would be beneficial. It could exacerbate the problem of excess capacity, exacerbate wholesale price deflation, and ultimately lead to financial losses.
USA
The U.S. economy has accelerated and will likely grow faster in 2015 than at any time since 2005. While there are signs of strength, there have also been signs of weakness in the first quarter of 2015. In part this may reflect bad weather in much of the country. But it may also reflect the impact of a weak overseas economy as well as the negative effect of a high-valued dollar. The most important positive sign, however, is a very strong job market. Also, there are indications that a pickup in business investment is imminent. The major weak component of the U.S. economy is
housing. Data have bounced around in the past year due to higher mortgage interest rates, higher house prices, and the fact that first-time buyers are often plagued by student debt. However, the medium-term outlook for housing is good given that prices appear to be stabilizing, mortgage rates are down, job growth is strong, and there is considerable pent up demand. A disproportionate share of the activity is now in multi-unit housing rather than single family housing.
Moreover, in part due to the dramatic decline in oil prices, inflation remains well below the Federal Reserve’s target of 2.0 percent. As such, it is likely that the Fed will wait at least until the end of 2015 before raising short term interest rates for the first time in eight years. Plus, low inflation and lower energy prices are helping to boost consumer purchasing power. In addition, unlike in the recent past, there is no fiscal consolidation taking place. Due to a strong economy, the budget deficit has fallen dramatically, thereby nearly eliminating the political pressure to do something about the deficit. The absence of spending cuts and tax increases removes a factor that held back growth in 2012-13.
In the longer term, the U.S. faces troubles emanating from de-mographics. As labor force growth lags behind the growth of the retired population, there will be negative consequences. These include slower economic growth, rising budget deficits starting in the middle of the next decade, and challenges for the private sector and state/local governments in funding pensions. Among the possible solutions to the demographic problem are to boost immigration, raise the average retirement age, increase taxes to fund government programs that support the elderly, and create incentives for people to save more for their retirement.
Europe
The Eurozone economy has been in very poor shape and prices are declining as of this writing. And although growth has been disap-pointing, there are some early signs of improvement. These include stronger job growth, rising retail sales, improved manufacturing performance, and some improvement in credit market conditions. Still, more is needed. The principal problem has been weakness in credit markets resulting in a paucity of business investment. The end result is weak hiring and high unemployment. Credit market weakness stems from several factors. These include weak banks that are struggling to recapitalize by selling risky assets and avoid-ing new ones, high risk spreads in Europe’s periphery due to fears about sovereign risk, and the fear of deflation. Despite a moder-ately aggressive monetary policy, which has led to growth of the broad money supply, bank credit to the private sector continues to decline.
To counter the problems in credit markets, the European Central Bank (ECB) has lately engaged in a far more aggressive monetary policy. This entails very low interest rates, direct low-interest loans to banks on the condition that the money is then loaned to the private sector, and most importantly, purchases of government bonds – better known as quantitative easing. The early signs are good. Yet quantitative easing alone may not be sufficient to restore strong growth. Europe still needs an easier fiscal policy, more economic restructuring within key countries, and more financial integration within the Eurozone.
4Global Powers of Consumer Products 2015
Here are some comments on specific countries in Europe:
France
The French economy is teetering on the edge of recession. The economy has stalled, unemployment remains high, business con-fidence is low, and there is a risk of deflation. The main problem is declining business investment. The big issue in France is the failure of the current government to address structural problems in the economy. France has lost competitiveness due to stagnant productivity, high labor costs, restrictive labor market rules, and high taxes. These factors have contributed to business unwilling-ness to boost investment. Recently, President Hollande, under pressure from Germany and the International Monetary Fund (IMF), appointed a reform-minded Prime Minister, Manuel Valls, who has a background in financial services, and is expected to implement more market-oriented policies. Yet he faces considerable resistance from Hollande’s own Socialist Party. If a credible reform agenda is implemented it could have a very positive impact on investment.
Germany
The German economy is improving. Business confidence has rebounded, in part due to continued strength of consumer de-mand which appears to be driving growth. Indeed Germany has an unusually low unemployment rate. This is good as Germany’s export engine has faced obstacles from weak overseas growth. With respect to the Eurozone, Germany continues to put pressure on France and Italy to enact structural reforms, and resists pressure to boost monetary and fiscal stimulus – although the government does concede that more infrastructure investment is needed.
Italy
Italy was the worst-performing European economy in the past fifteen years. Its economy barely grew. Combined with fiscal profli-gacy, this resulted in a huge debt/GDP ratio. Yet Italy never had any difficulty in servicing this debt as it had a high savings rate. This changed when the contagion effects of the Greek debt drama led to a huge increase in Italian bond yields. However, when the ECB promised to “do whatever it takes” to save the euro, bond yields declined. Fiscal austerity also convinced bond investors that Italy was on a path to recovery. Still, austerity hurt growth. The failure of Italy’s governments to implement serious reforms also hurt business confidence. The result is that Italy is not growing, largely due to a sharp decline in investment. Italy suffers from poor con-fidence, deflation, and high risk spreads which make the cost of capital relatively high. Prime Minister Matteo Renzi excited voters with the promise of reform. Yet he has faced obstacles, including massive labor protests.
Spain
Spain has been the surprise star performer among large Eurozone economies. A few other smaller Eurozone economies have done very well, especially Ireland but also Portugal. In the case of Spain, what sets it apart is that in the last few years its labor cost of doing business has declined relative to the other major European economies. In other words, it has gained competitiveness through a combination of wage restraint, labor market liberalization, and productivity gains. The result is that Spain’s exports have per-formed very well. In addition, unlike the other Eurozone econo-mies, Spain’s business investment has been expanding, reflecting increased business confidence. Plus, unemployment has come down considerably – although it still remains quite high at 23 per-cent. This, combined with lower energy prices, has contributed to moderate growth of consumer spending. On the other hand, Spain suffers from deflation. Unless this is reversed, it could undermine the progress that Spain has made.
UK
Of the major industrial nations, Britain now has the fastest growing economy. This follows an extended period of weak economic per-formance, exacerbated by deep fiscal austerity on the part of the government. But now, a combination of positive factors appears to be boosting the British economy. These include a very aggressive program of quantitative easing, government support for housing, an improvement in the international competitiveness of British industry (following wage restraint and productivity gains), declining unemployment, and considerable pent-up demand. On the other hand, the weakness of the neighboring Eurozone economy is a drag on Britain. Still, the medium-term outlook is good for several reasons. These include much lower inflation (which gives the Bank of England reason to avoid tight monetary policy), a rising pound (which is disinflationary and boosts consumer purchasing power), and lower energy prices.
Japan
Japan went into recession in 2014 following a big tax increase, with declining consumer spending and business investment. This was not meant to be. When Shinzo Abe took office roughly two years ago, he offered a radical departure in policy characterized by the three “arrows” of “Abenomics.” These were fiscal stimu-lus, aggressive monetary policy, and structural reform (basically deregulation and free trade). Of the three arrows, only one was implemented. This was monetary policy in which the Bank of Japan (BOJ) engaged in unlimited quantitative easing with the goal of ultimately achieving 2.0 percent inflation. The effect of this policy was to suppress the yen, boost equity prices, boost inflation, and suppress real interest rates. Initially it had a positive impact on growth. Then, things changed. Wages failed to respond and real consumer purchasing power declined, having a negative impact on consumer spending. The rest of the world failed to cooperate and weak external demand hurt exports. But the worst problem was implementation of a massive tax increase in April 2014, a policy
5Global Powers of Consumer Products 2015
that had already been in the pipeline when Abe took office. This had a devastating impact and led to the current recession.
In November 2014, Abe announced that the second round of the tax increase, scheduled for October 2015, would be postponed by 18 months. Now the question remains as to what Abe will do regarding the third arrow of Abenomics. Will he finally implement the politically difficult reforms that he initially promised? These include labor market liberalization, product market deregulation, freer trade, changes in corporate governance, and incentives for greater female participation in the labor force. He has already taken some action on the latter two issues. Supporters of Abenom-ics now hope that he will address all of these issues. If he does, it could have a positive impact on business productivity. It would also likely boost business confidence and, therefore, investment.
As for the Bank of Japan’s monetary policy, it is now extremely aggressive compared to what happened in the U.S. (see chart). Moreover, based on the current trajectory, it is expected to result in a massive increase in BOJ assets relative to GDP. Will this ultimately result in boosting inflation to the required level? It is hard to say. The deflationary psychology is very strong in Japan and will be hard to break. So far, the policy has had more of an impact on Japanese asset prices than on inflation, and this could continue.
Brazil
As of early 2015, Brazil’s economy is in recession. This is due to a sharp drop in commodity prices (due to China’s slowdown); a central bank policy of high interest rates to fight inflation and to stabilize the currency; and business lack of confidence due to a government policy of high regulation and protectionism. In addi-tion, Brazil has suffered from the rise in the U.S. dollar, which is one of the reasons that the central bank has been compelled to tighten monetary policy. The election in late 2014 resulted in a second term for President Dilma Rousseff. Although she has since appointed a very market-oriented Finance Minister, there remains
uncertainty as to whether she will be able to implement the fiscal austerity and economic reforms she promises. Among the policies that investors want are a reduction in government social spending and subsidies (in order to cut the deficit and free up resources for investment in infrastructure); deregulation of labor and product markets; and freer trade. As for trade, Brazil remains a relatively protectionist economy. Trade is a much smaller share of GDP than is the case in China or India. The range of reform ideas is meant to boost productivity and improve Brazil’s competitiveness. This is important as domestic demand is not likely to be a major source of growth in the near future. Consumer debt is already quite high, so consumer spending will necessarily be constrained. Until now, Rousseff’s major platform has been an effort to boost the spending power of the poor through government transfers.
India
India had a highly significant election in 2014, resulting in the election of Narendra Modi as Prime Minister. For the first time in more than 30 years, a prime minister’s party has a majority in the Parliament, thus boosting prospects for enacting reform legislation. Yet in his first six months in office not much reform legislation was proposed, thus disappointing supporters who were euphoric fol-lowing Modi’s victory. They are hoping he will deregulate industry and labor markets, reduce costly subsidies, boost infrastructure investment, negotiate freer trade, and ease restrictions on foreign investment. If he does these things, India’s growth outlook will likely improve dramatically. Meanwhile, growth is recovering from its doldrums but remains below potential. The central bank has managed to reduce inflationary expectations, which should have a positive impact on growth. Plus, lower oil prices are having a posi-tive impact both on inflation and growth.
Russia
Russia’s economy is in bad shape. Following the crisis in Ukraine and the implementation of sanctions, there was massive capital
flight from Russia resulting in a sharp drop in the currency. This, in turn, led the central bank to severely raise interest rates several times. The result was that investment dried up, including for-eign investment. Moreover, the declining global price of oil also contributed to downward pressure on the currency and concerns about the ability of Russian debtors to service their external debts. The sanctions that have been imposed mean that some big Russian companies will have trouble rolling over foreign debts due to lim-ited access to foreign financial markets. Already risk spreads have increased dramatically. Some energy companies will lack access to technologies that are needed to tap into Arctic reserves. This means that oil production is likely to decline absent an end to sanc-tions. By early 2015, the central bank had stopped intervening in currency markets and had started to cut interest rates. With oil col-lapsing, the ruble continues to fall, contributing to rising inflation and deeper problems for Russian debtors. Indeed the government is already providing financial support to some Russian companies hurt by sanctions.
South Africa
Economic growth has decelerated steadily over the last few years and is now only slightly above 1 percent per year. Inflation has been high, but has come down due to lower energy prices. The country has been hurt by labor unrest, declining commodity prices, shortages of electricity, and under-investment. On the other hand, the decline in the price of oil should boost consumer spending power in 2015. Still, the currency (rand) has been under pressure, thus contributing to inflation and limiting the flexibility of the central bank. While growth is expected to pick up in 2015 and beyond, most analysts see South Africa as having limited poten-tial. Growth is expected to recover to a level of 3 to 4 percent, far below that of many other African economies. However, due to South Africa’s sophisticated business environment, it is expected to remain a major center of business and finance for the continent.
6Global Powers of Consumer Products 2015
Connecting with the connected consumer
Engaging in the consumer conversation
More than ever, consumer products companies must directly engage with consumers
Consumers are talking – all the time, everywhere – and it is they, not companies, who increasingly own the conversation about products and services. The supply-driven world has become a demand-driven world where the consumer is in charge. Today’s consumers are not only critics and curators, but, increasingly, creators. Yesterday’s consumer purchased from a limited set of offerings, and the communication was one-way, under complete control of marketing and advertising agencies. Today, individual consumers can start with an idea, a need, or an inspiration and browse online to find what they want, and, if they can’t find it, create it themselves by working with companies that provide this capability. Today, the consumer is in charge.
Consumer product companies could view this defensively as a loss of control. However, to view this challenge solely as a negative, a risk so to speak, is to miss the broader opportunity. More than ever, it is important that consumer products companies be an active part of the conversation. Direct conversations with consumers can drive growth and innovation. Indeed, such dialogue can lead companies into areas of consumer need that they might otherwise overlook or ignore. To seize this sizeable opportunity, the critical challenge for consumer product companies is to create the right experience, the right engagement, for consumers and to do it at scale.
Companies such as Shapeways are working directly with consumers in just this way. What will your company do to engage consumers?
• Deciding on the appropriate engagement approach – wheth-er it is being actively engaged in the conversation, monitoring it or simply ignoring it, a well thought out strategy, based on brand positioning, will pay dividends. Typically, consumers tend to be highly engaged with more expensive items and will limit interac-tion with providers of commodities.
• Developing content creation and content management capabilities – focus on informing and educating consumers rather than just selling to them. Arming consumers with the right information helps them move independently through the shop-ping journey, creates trust, and increases their loyalty.
• Investing in technology and developing analytics capabilities – integrate and track, across all channels and touchpoints, every individual journey to offer targeted responses in real time
• Ensuring staff at each level of the organization understand the role they play – empower staff to make appropriate deci-sions, whether this means directing consumers toward alternative products or providing compensation to dissatisfied consumers
• Managing the reputational risks associated with social platforms – establish social command centers to listen to conversations, engage with consumers, and proactively share positive stories
Consumer engagement – much more than marketing
One function or one department cannot engage consumers, nor can it be viewed as a one-off campaign. Consumer engagement requires long-term commitment and collaboration across the entire company to manage multiple consumer touchpoints and to sustain the relationship as consumer expectations evolve. If not, the busi-ness will constantly be playing “catch-up”.
Businesses that commit to making engagement as easy as possible for consumers are positioning themselves in the center of the conversation and are better positioned to succeed. Such position-ing will likely involve:
Case study—Shapeways
Shapeways is a 3D printing company where consumers can design the products they seek. Customers upload their designs to the Shapeway website for price quotes based on the materials involved. Users can also refine their designs with help from “experts” on the Shapeway forum, or opt for preexisting designs and make minor changes to them before ordering.
Source: A billion to one: The crowd gets personal, Deloitte University Press, January 26, 2015
7Global Powers of Consumer Products 2015
Leveraging the crowd
Empowered consumers are a significant driver of growth, as their behavior intensifies competition and drives innovation
The ability of like-minded people to compare experiences and promote their collective voice has become a force in the consumer market, moving beyond reviews and recommendations into co-creation.
Companies are learning to incorporate the contributions of indi-vidual consumers, as well as communities, into their value chain. Many are using sensors, digital data, and smartphone interactions to innovate with their products and services.
Some companies, such as Lego and Quirky, are using the power of the crowd to help them develop their products, and others such as Coca-Cola are drawing on customer input to develop marketing campaigns.
Businesses can take specific consumer characteristics and behavior and contextualize them with data on thousands or millions of other individuals. This enables designers to deliver products and services that are unique or closely tailored to consumer needs.
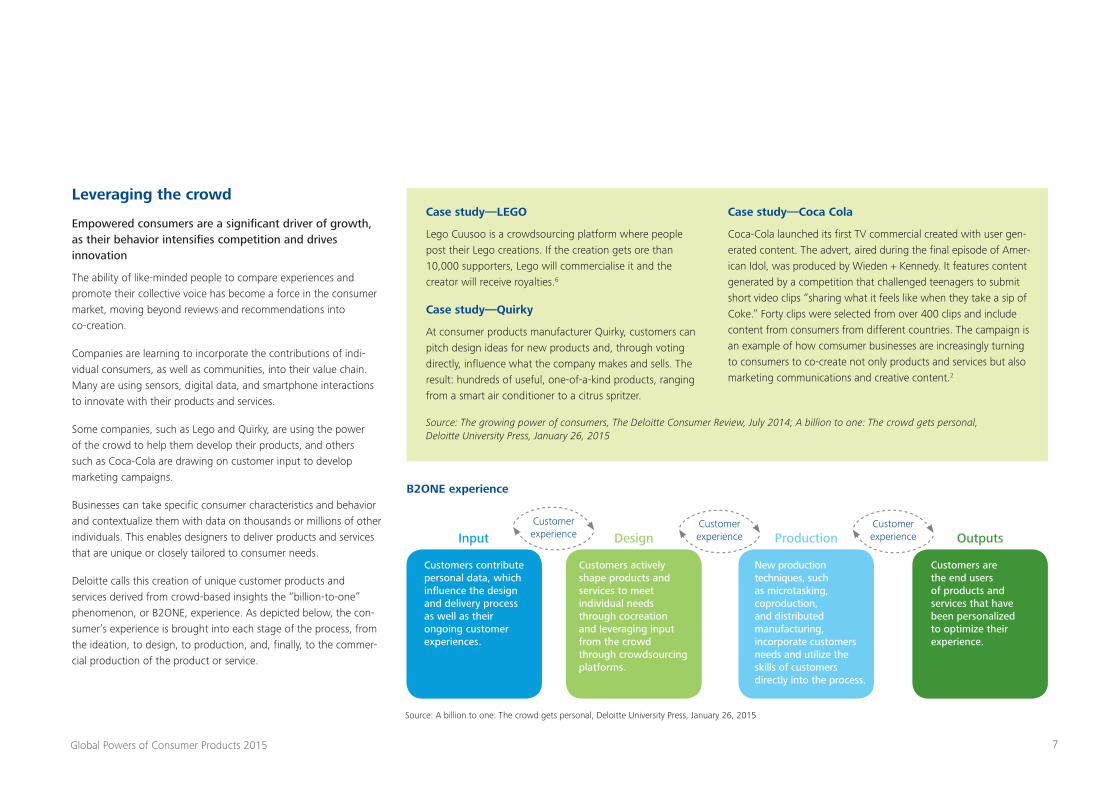
Deloitte calls this creation of unique customer products and services derived from crowd-based insights the “billion-to-one” phenomenon, or B2ONE, experience. As depicted below, the con-sumer’s experience is brought into each stage of the process, from the ideation, to design, to production, and, finally, to the commer-cial production of the product or service.
Case study—LEGO
Lego Cuusoo is a crowdsourcing platform where people post their Lego creations. If the creation gets ore than 10,000 supporters, Lego will commercialise it and the creator will receive royalties.6
Case study—Quirky
At consumer products manufacturer Quirky, customers can pitch design ideas for new products and, through voting directly, influence what the company makes and sells. The result: hundreds of useful, one-of-a-kind products, ranging from a smart air conditioner to a citrus spritzer.
Case study—Coca Cola
Coca-Cola launched its first TV commercial created with user gen-erated content. The advert, aired during the final episode of Amer-ican Idol, was produced by Wieden + Kennedy. It features content generated by a competition that challenged teenagers to submit short video clips “sharing what it feels like when they take a sip of Coke.” Forty clips were selected from over 400 clips and include content from consumers from different countries. The campaign is an example of how comsumer businesses are increasingly turning to consumers to co-create not only products and services but also marketing communications and creative content.2
Source: A billion to one: The crowd gets personal, Deloitte University Press, January 26, 2015
Input
Customers contribute personal data, which influence the design and delivery process as well as their ongoing customer experiences.
Customers actively shape products and services to meet individual needs through cocreation and leveraging input from the crowd through crowdsourcing platforms.
Customers are the end users of products and services that have been personalized to optimize their experience.
New production techniques, such as microtasking, coproduction, and distributed manufacturing, incorporate customers needs and utilize the skills of customers directly into the process.
Design ProductionCustomer experience
Customer experience
Customer experience Outputs
B2ONE experience
Source: The growing power of consumers, The Deloitte Consumer Review, July 2014; A billion to one: The crowd gets personal, Deloitte University Press, January 26, 2015
8Global Powers of Consumer Products 2015
What will it require?
Harnessing crowd-based insights will require companies to change their approach and processes in a number of ways:
• Shifting organizational focus from simply providing products and services to solving a problem and creating an experi-ence for the customer – indeed, a business that solves a daily problem for consumers better than anyone else gives consumers a compelling reason to become engaged with the company
• Treating consumers as potential designers – use consumer satisfaction data in which consumers critique and assess the goods and services they receive
• Moving away from broad-scale product testing – follow the model of entrepreneurs and small companies that are very close to the ultimate consumer, possibly including marketing teams in the new product development process.
• Creating better and faster feedback loops – continuously collect and analyze the steady stream of consumer feedback at a fairly granular level. Apply the resulting insights from this to improve and redesign offerings and to personalize products for different kinds of consumers. This could include faster prototyp-ing to get something tangible in front of the consumer.
Finally, all of these processes must have a solid foundation of consumer trust, without which none of these conversations and collaborations can occur.
Fostering and sustaining trust
Trust as a competitive advantage
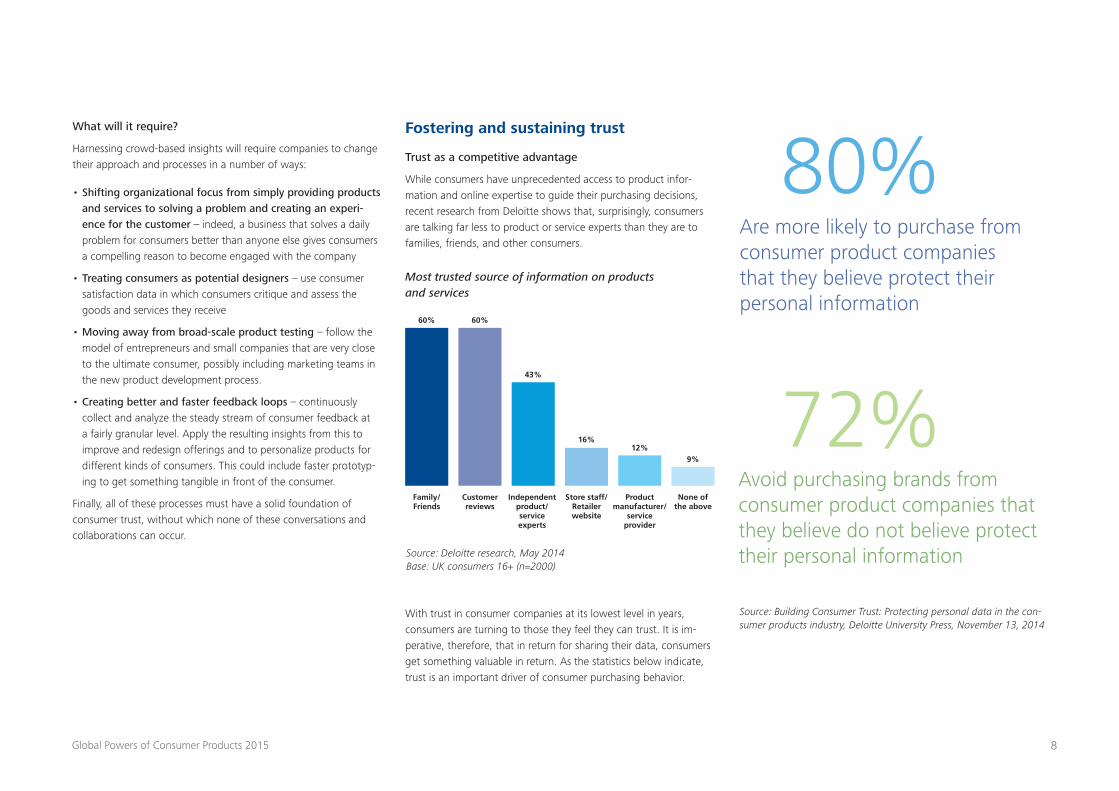
While consumers have unprecedented access to product infor-mation and online expertise to guide their purchasing decisions, recent research from Deloitte shows that, surprisingly, consumers are talking far less to product or service experts than they are to families, friends, and other consumers.
Most trusted source of information on products and services
With trust in consumer companies at its lowest level in years, consumers are turning to those they feel they can trust. It is im-perative, therefore, that in return for sharing their data, consumers get something valuable in return. As the statistics below indicate, trust is an important driver of consumer purchasing behavior.
80%
72%
Are more likely to purchase from consumer product companies that they believe protect their personal information
Avoid purchasing brands from consumer product companies that they believe do not believe protect their personal information
Source: Building Consumer Trust: Protecting personal data in the con-sumer products industry, Deloitte University Press, November 13, 2014
Source: Deloitte research, May 2014 Base: UK consumers 16+ (n=2000)
Family/Friends
60% 60%
43%
16%12%
9%
Customer reviews
None of the above
Independent product/ service experts
Store staff/ Retailer website
Product manufacturer/
service provider
9Global Powers of Consumer Products 2015
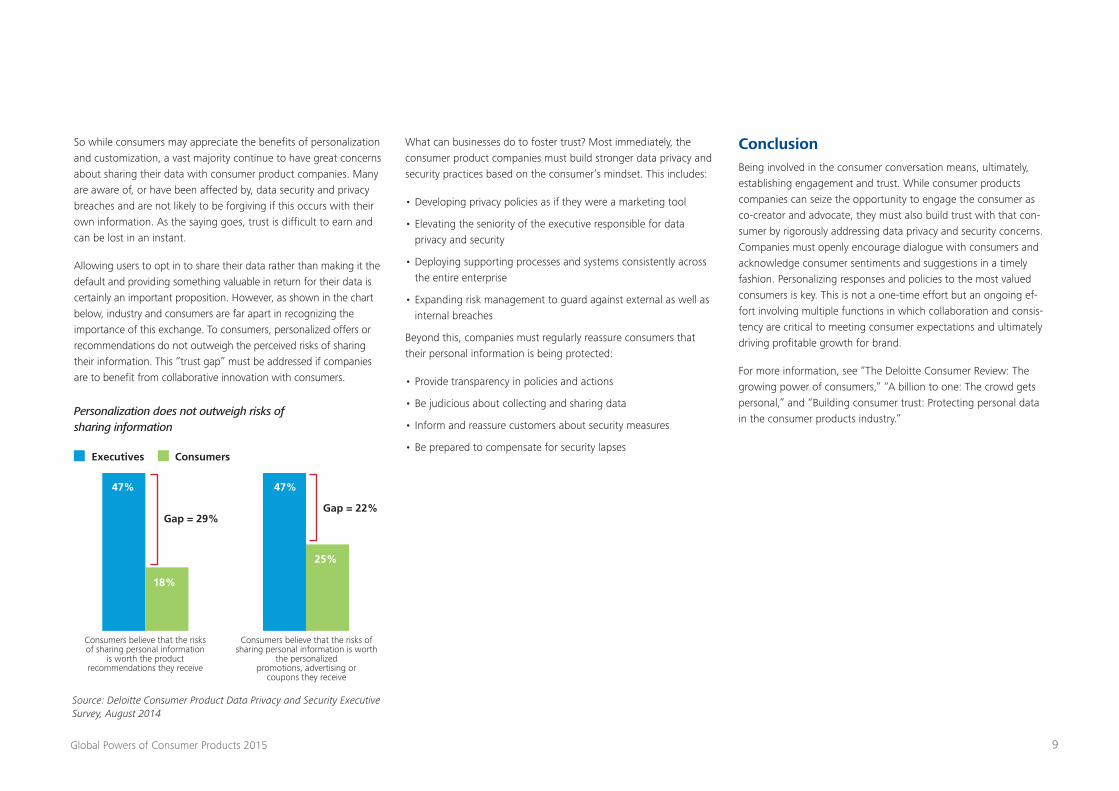
Consumers believe that the risks of sharing personal information
is worth the product recommendations they receive
Executives
47%
18%
25%
47%
Gap = 29%Gap = 22%
Consumers
Consumers believe that the risks of sharing personal information is worth
the personalized promotions, advertising or
coupons they receive
So while consumers may appreciate the benefits of personalization and customization, a vast majority continue to have great concerns about sharing their data with consumer product companies. Many are aware of, or have been affected by, data security and privacy breaches and are not likely to be forgiving if this occurs with their own information. As the saying goes, trust is difficult to earn and can be lost in an instant.
Allowing users to opt in to share their data rather than making it the default and providing something valuable in return for their data is certainly an important proposition. However, as shown in the chart below, industry and consumers are far apart in recognizing the importance of this exchange. To consumers, personalized offers or recommendations do not outweigh the perceived risks of sharing their information. This “trust gap” must be addressed if companies are to benefit from collaborative innovation with consumers.
Personalization does not outweigh risks of sharing information
What can businesses do to foster trust? Most immediately, the consumer product companies must build stronger data privacy and security practices based on the consumer’s mindset. This includes:
• Developing privacy policies as if they were a marketing tool
• Elevating the seniority of the executive responsible for data privacy and security
• Deploying supporting processes and systems consistently across the entire enterprise
• Expanding risk management to guard against external as well as internal breaches
Beyond this, companies must regularly reassure consumers that their personal information is being protected:
• Provide transparency in policies and actions
• Be judicious about collecting and sharing data
• Inform and reassure customers about security measures
• Be prepared to compensate for security lapses
ConclusionBeing involved in the consumer conversation means, ultimately, establishing engagement and trust. While consumer products companies can seize the opportunity to engage the consumer as co-creator and advocate, they must also build trust with that con-sumer by rigorously addressing data privacy and security concerns. Companies must openly encourage dialogue with consumers and acknowledge consumer sentiments and suggestions in a timely fashion. Personalizing responses and policies to the most valued consumers is key. This is not a one-time effort but an ongoing ef-fort involving multiple functions in which collaboration and consis-tency are critical to meeting consumer expectations and ultimately driving profitable growth for brand.
For more information, see “The Deloitte Consumer Review: The growing power of consumers,” “A billion to one: The crowd gets personal,” and “Building consumer trust: Protecting personal data in the consumer products industry.”
Source: Deloitte Consumer Product Data Privacy and Security Executive Survey, August 2014
10Global Powers of Consumer Products 2015
Sales Rank FY13 Company Name
Country of Origin Region Primary Product Sector
FY13 Net Sales (US$mil)
FY13 Net Sales
Growth
FY13 Net Profit
Margin
2008-2013 Net Sales
CAGR1
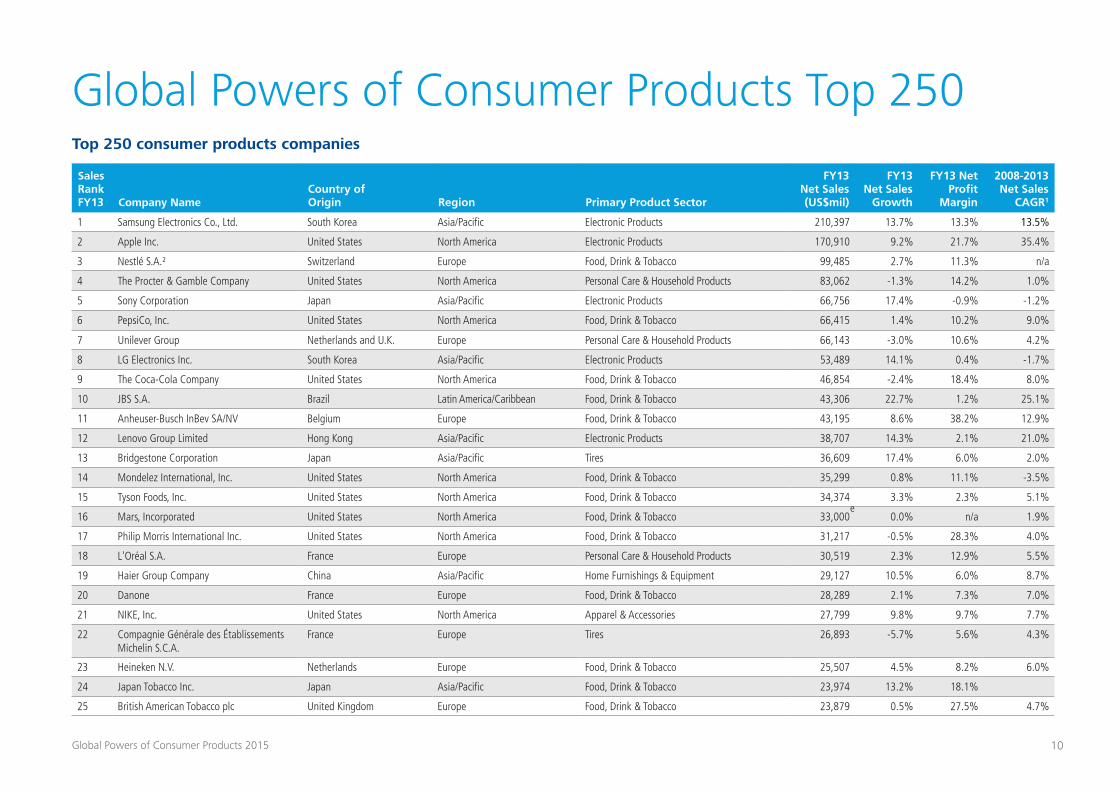
1 Samsung Electronics Co., Ltd. South Korea Asia/Pacific Electronic Products 210,397 13.7% 13.3% 13.5%
2 Apple Inc. United States North America Electronic Products 170,910 9.2% 21.7% 35.4%
3 Nestlé S.A.² Switzerland Europe Food, Drink & Tobacco 99,485 2.7% 11.3% n/a
4 The Procter & Gamble Company United States North America Personal Care & Household Products 83,062 -1.3% 14.2% 1.0%
5 Sony Corporation Japan Asia/Pacific Electronic Products 66,756 17.4% -0.9% -1.2%
6 PepsiCo, Inc. United States North America Food, Drink & Tobacco 66,415 1.4% 10.2% 9.0%
7 Unilever Group Netherlands and U.K. Europe Personal Care & Household Products 66,143 -3.0% 10.6% 4.2%
8 LG Electronics Inc. South Korea Asia/Pacific Electronic Products 53,489 14.1% 0.4% -1.7%
9 The Coca-Cola Company United States North America Food, Drink & Tobacco 46,854 -2.4% 18.4% 8.0%
10 JBS S.A. Brazil Latin America/Caribbean Food, Drink & Tobacco 43,306 22.7% 1.2% 25.1%
11 Anheuser-Busch InBev SA/NV Belgium Europe Food, Drink & Tobacco 43,195 8.6% 38.2% 12.9%
12 Lenovo Group Limited Hong Kong Asia/Pacific Electronic Products 38,707 14.3% 2.1% 21.0%
13 Bridgestone Corporation Japan Asia/Pacific Tires 36,609 17.4% 6.0% 2.0%
14 Mondelez International, Inc. United States North America Food, Drink & Tobacco 35,299 0.8% 11.1% -3.5%
15 Tyson Foods, Inc. United States North America Food, Drink & Tobacco 34,374 3.3% 2.3% 5.1%
16 Mars, Incorporated United States North America Food, Drink & Tobacco 33,000 0.0% n/a 1.9%
17 Philip Morris International Inc. United States North America Food, Drink & Tobacco 31,217 -0.5% 28.3% 4.0%
18 L'Oréal S.A. France Europe Personal Care & Household Products 30,519 2.3% 12.9% 5.5%
19 Haier Group Company China Asia/Pacific Home Furnishings & Equipment 29,127 10.5% 6.0% 8.7%
20 Danone France Europe Food, Drink & Tobacco 28,289 2.1% 7.3% 7.0%
21 NIKE, Inc. United States North America Apparel & Accessories 27,799 9.8% 9.7% 7.7%
22 Compagnie Générale des Établissements Michelin S.C.A.
France Europe Tires 26,893 -5.7% 5.6% 4.3%
23 Heineken N.V. Netherlands Europe Food, Drink & Tobacco 25,507 4.5% 8.2% 6.0%
24 Japan Tobacco Inc. Japan Asia/Pacific Food, Drink & Tobacco 23,974 13.2% 18.1%
25 British American Tobacco plc United Kingdom Europe Food, Drink & Tobacco 23,879 0.5% 27.5% 4.7%
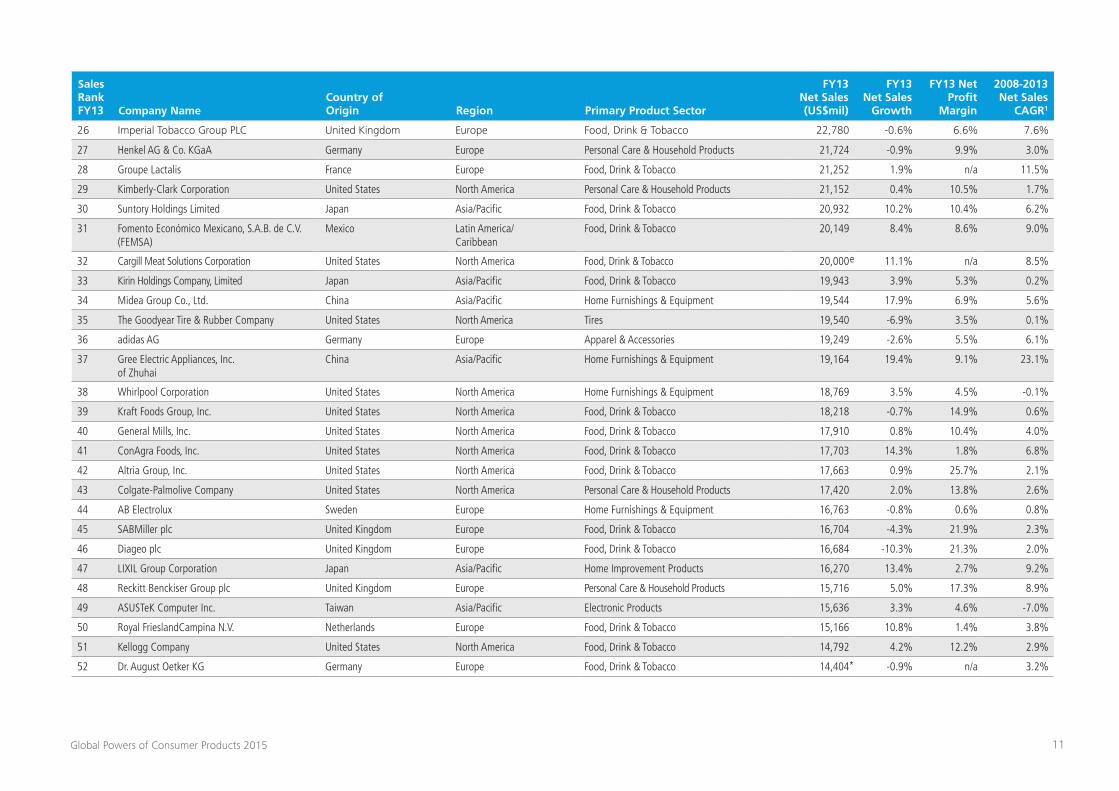
Global Powers of Consumer Products Top 250Top 250 consumer products companies
e
11Global Powers of Consumer Products 2015
Sales Rank FY13 Company Name
Country of Origin Region Primary Product Sector
FY13 Net Sales (US$mil)
FY13 Net Sales
Growth
FY13 Net Profit
Margin
2008-2013 Net Sales
CAGR1
26 Imperial Tobacco Group PLC United Kingdom Europe Food, Drink & Tobacco 22,780 -0.6% 6.6% 7.6%
27 Henkel AG & Co. KGaA Germany Europe Personal Care & Household Products 21,724 -0.9% 9.9% 3.0%
28 Groupe Lactalis France Europe Food, Drink & Tobacco 21,252 1.9% n/a 11.5%
29 Kimberly-Clark Corporation United States North America Personal Care & Household Products 21,152 0.4% 10.5% 1.7%
30 Suntory Holdings Limited Japan Asia/Pacific Food, Drink & Tobacco 20,932 10.2% 10.4% 6.2%
31 Fomento Económico Mexicano, S.A.B. de C.V. (FEMSA)
Mexico Latin America/ Caribbean
Food, Drink & Tobacco 20,149 8.4% 8.6% 9.0%
32 Cargill Meat Solutions Corporation United States North America Food, Drink & Tobacco 20,000 11.1% n/a 8.5%
33 Kirin Holdings Company, Limited Japan Asia/Pacific Food, Drink & Tobacco 19,943 3.9% 5.3% 0.2%
34 Midea Group Co., Ltd. China Asia/Pacific Home Furnishings & Equipment 19,544 17.9% 6.9% 5.6%
35 The Goodyear Tire & Rubber Company United States North America Tires 19,540 -6.9% 3.5% 0.1%
36 adidas AG Germany Europe Apparel & Accessories 19,249 -2.6% 5.5% 6.1%
37 Gree Electric Appliances, Inc. of Zhuhai
China Asia/Pacific Home Furnishings & Equipment 19,164 19.4% 9.1% 23.1%
38 Whirlpool Corporation United States North America Home Furnishings & Equipment 18,769 3.5% 4.5% -0.1%
39 Kraft Foods Group, Inc. United States North America Food, Drink & Tobacco 18,218 -0.7% 14.9% 0.6%
40 General Mills, Inc. United States North America Food, Drink & Tobacco 17,910 0.8% 10.4% 4.0%
41 ConAgra Foods, Inc. United States North America Food, Drink & Tobacco 17,703 14.3% 1.8% 6.8%
42 Altria Group, Inc. United States North America Food, Drink & Tobacco 17,663 0.9% 25.7% 2.1%
43 Colgate-Palmolive Company United States North America Personal Care & Household Products 17,420 2.0% 13.8% 2.6%
44 AB Electrolux Sweden Europe Home Furnishings & Equipment 16,763 -0.8% 0.6% 0.8%
45 SABMiller plc United Kingdom Europe Food, Drink & Tobacco 16,704 -4.3% 21.9% 2.3%
46 Diageo plc United Kingdom Europe Food, Drink & Tobacco 16,684 -10.3% 21.3% 2.0%
47 LIXIL Group Corporation Japan Asia/Pacific Home Improvement Products 16,270 13.4% 2.7% 9.2%
48 Reckitt Benckiser Group plc United Kingdom Europe Personal Care & Household Products 15,716 5.0% 17.3% 8.9%
49 ASUSTeK Computer Inc. Taiwan Asia/Pacific Electronic Products 15,636 3.3% 4.6% -7.0%
50 Royal FrieslandCampina N.V. Netherlands Europe Food, Drink & Tobacco 15,166 10.8% 1.4% 3.8%
51 Kellogg Company United States North America Food, Drink & Tobacco 14,792 4.2% 12.2% 2.9%
52 Dr. August Oetker KG Germany Europe Food, Drink & Tobacco 14,404 -0.9% n/a 3.2%
e
*
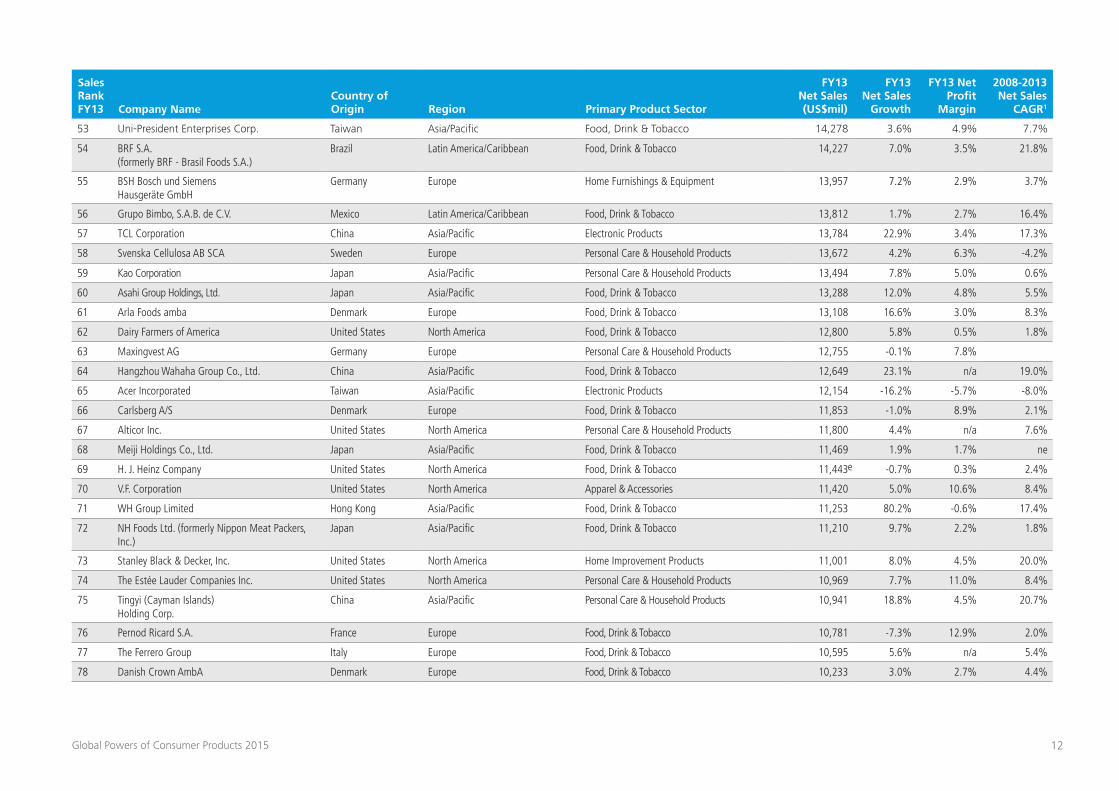
12Global Powers of Consumer Products 2015
Sales Rank FY13 Company Name
Country of Origin Region Primary Product Sector
FY13 Net Sales (US$mil)
FY13 Net Sales
Growth
FY13 Net Profit
Margin
2008-2013 Net Sales
CAGR1
53 Uni-President Enterprises Corp. Taiwan Asia/Pacific Food, Drink & Tobacco 14,278 3.6% 4.9% 7.7%
54 BRF S.A. (formerly BRF - Brasil Foods S.A.)
Brazil Latin America/Caribbean Food, Drink & Tobacco 14,227 7.0% 3.5% 21.8%
55 BSH Bosch und Siemens Hausgeräte GmbH
Germany Europe Home Furnishings & Equipment 13,957 7.2% 2.9% 3.7%
56 Grupo Bimbo, S.A.B. de C.V. Mexico Latin America/Caribbean Food, Drink & Tobacco 13,812 1.7% 2.7% 16.4%
57 TCL Corporation China Asia/Pacific Electronic Products 13,784 22.9% 3.4% 17.3%
58 Svenska Cellulosa AB SCA Sweden Europe Personal Care & Household Products 13,672 4.2% 6.3% -4.2%
59 Kao Corporation Japan Asia/Pacific Personal Care & Household Products 13,494 7.8% 5.0% 0.6%
60 Asahi Group Holdings, Ltd. Japan Asia/Pacific Food, Drink & Tobacco 13,288 12.0% 4.8% 5.5%
61 Arla Foods amba Denmark Europe Food, Drink & Tobacco 13,108 16.6% 3.0% 8.3%
62 Dairy Farmers of America United States North America Food, Drink & Tobacco 12,800 5.8% 0.5% 1.8%
63 Maxingvest AG Germany Europe Personal Care & Household Products 12,755 -0.1% 7.8%
64 Hangzhou Wahaha Group Co., Ltd. China Asia/Pacific Food, Drink & Tobacco 12,649 23.1% n/a 19.0%
65 Acer Incorporated Taiwan Asia/Pacific Electronic Products 12,154 -16.2% -5.7% -8.0%
66 Carlsberg A/S Denmark Europe Food, Drink & Tobacco 11,853 -1.0% 8.9% 2.1%
67 Alticor Inc. United States North America Personal Care & Household Products 11,800 4.4% n/a 7.6%
68 Meiji Holdings Co., Ltd. Japan Asia/Pacific Food, Drink & Tobacco 11,469 1.9% 1.7% ne
69 H. J. Heinz Company United States North America Food, Drink & Tobacco 11,443 -0.7% 0.3% 2.4%
70 V.F. Corporation United States North America Apparel & Accessories 11,420 5.0% 10.6% 8.4%
71 WH Group Limited Hong Kong Asia/Pacific Food, Drink & Tobacco 11,253 80.2% -0.6% 17.4%
72 NH Foods Ltd. (formerly Nippon Meat Packers, Inc.)
Japan Asia/Pacific Food, Drink & Tobacco 11,210 9.7% 2.2% 1.8%
73 Stanley Black & Decker, Inc. United States North America Home Improvement Products 11,001 8.0% 4.5% 20.0%
74 The Estée Lauder Companies Inc. United States North America Personal Care & Household Products 10,969 7.7% 11.0% 8.4%
75 Tingyi (Cayman Islands) Holding Corp.
China Asia/Pacific Personal Care & Household Products 10,941 18.8% 4.5% 20.7%
76 Pernod Ricard S.A. France Europe Food, Drink & Tobacco 10,781 -7.3% 12.9% 2.0%
77 The Ferrero Group Italy Europe Food, Drink & Tobacco 10,595 5.6% n/a 5.4%
78 Danish Crown AmbA Denmark Europe Food, Drink & Tobacco 10,233 3.0% 2.7% 4.4%
e
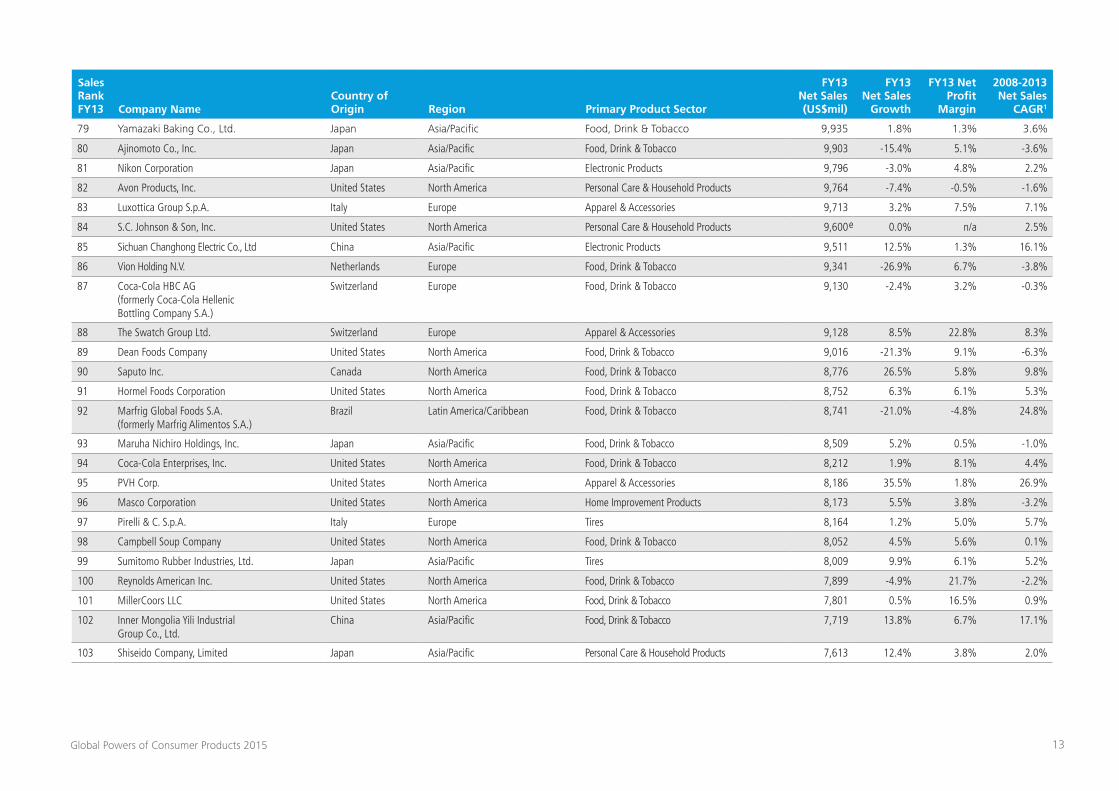
13Global Powers of Consumer Products 2015
Sales Rank FY13 Company Name
Country of Origin Region Primary Product Sector
FY13 Net Sales (US$mil)
FY13 Net Sales
Growth
FY13 Net Profit
Margin
2008-2013 Net Sales
CAGR1
79 Yamazaki Baking Co., Ltd. Japan Asia/Pacific Food, Drink & Tobacco 9,935 1.8% 1.3% 3.6%
80 Ajinomoto Co., Inc. Japan Asia/Pacific Food, Drink & Tobacco 9,903 -15.4% 5.1% -3.6%
81 Nikon Corporation Japan Asia/Pacific Electronic Products 9,796 -3.0% 4.8% 2.2%
82 Avon Products, Inc. United States North America Personal Care & Household Products 9,764 -7.4% -0.5% -1.6%
83 Luxottica Group S.p.A. Italy Europe Apparel & Accessories 9,713 3.2% 7.5% 7.1%
84 S.C. Johnson & Son, Inc. United States North America Personal Care & Household Products 9,600 0.0% n/a 2.5%
85 Sichuan Changhong Electric Co., Ltd China Asia/Pacific Electronic Products 9,511 12.5% 1.3% 16.1%
86 Vion Holding N.V. Netherlands Europe Food, Drink & Tobacco 9,341 -26.9% 6.7% -3.8%
87 Coca-Cola HBC AG (formerly Coca-Cola Hellenic Bottling Company S.A.)
Switzerland Europe Food, Drink & Tobacco 9,130 -2.4% 3.2% -0.3%
88 The Swatch Group Ltd. Switzerland Europe Apparel & Accessories 9,128 8.5% 22.8% 8.3%
89 Dean Foods Company United States North America Food, Drink & Tobacco 9,016 -21.3% 9.1% -6.3%
90 Saputo Inc. Canada North America Food, Drink & Tobacco 8,776 26.5% 5.8% 9.8%
91 Hormel Foods Corporation United States North America Food, Drink & Tobacco 8,752 6.3% 6.1% 5.3%
92 Marfrig Global Foods S.A. (formerly Marfrig Alimentos S.A.)
Brazil Latin America/Caribbean Food, Drink & Tobacco 8,741 -21.0% -4.8% 24.8%
93 Maruha Nichiro Holdings, Inc. Japan Asia/Pacific Food, Drink & Tobacco 8,509 5.2% 0.5% -1.0%
94 Coca-Cola Enterprises, Inc. United States North America Food, Drink & Tobacco 8,212 1.9% 8.1% 4.4%
95 PVH Corp. United States North America Apparel & Accessories 8,186 35.5% 1.8% 26.9%
96 Masco Corporation United States North America Home Improvement Products 8,173 5.5% 3.8% -3.2%
97 Pirelli & C. S.p.A. Italy Europe Tires 8,164 1.2% 5.0% 5.7%
98 Campbell Soup Company United States North America Food, Drink & Tobacco 8,052 4.5% 5.6% 0.1%
99 Sumitomo Rubber Industries, Ltd. Japan Asia/Pacific Tires 8,009 9.9% 6.1% 5.2%
100 Reynolds American Inc. United States North America Food, Drink & Tobacco 7,899 -4.9% 21.7% -2.2%
101 MillerCoors LLC United States North America Food, Drink & Tobacco 7,801 0.5% 16.5% 0.9%
102 Inner Mongolia Yili Industrial Group Co., Ltd.
China Asia/Pacific Food, Drink & Tobacco 7,719 13.8% 6.7% 17.1%
103 Shiseido Company, Limited Japan Asia/Pacific Personal Care & Household Products 7,613 12.4% 3.8% 2.0%
e
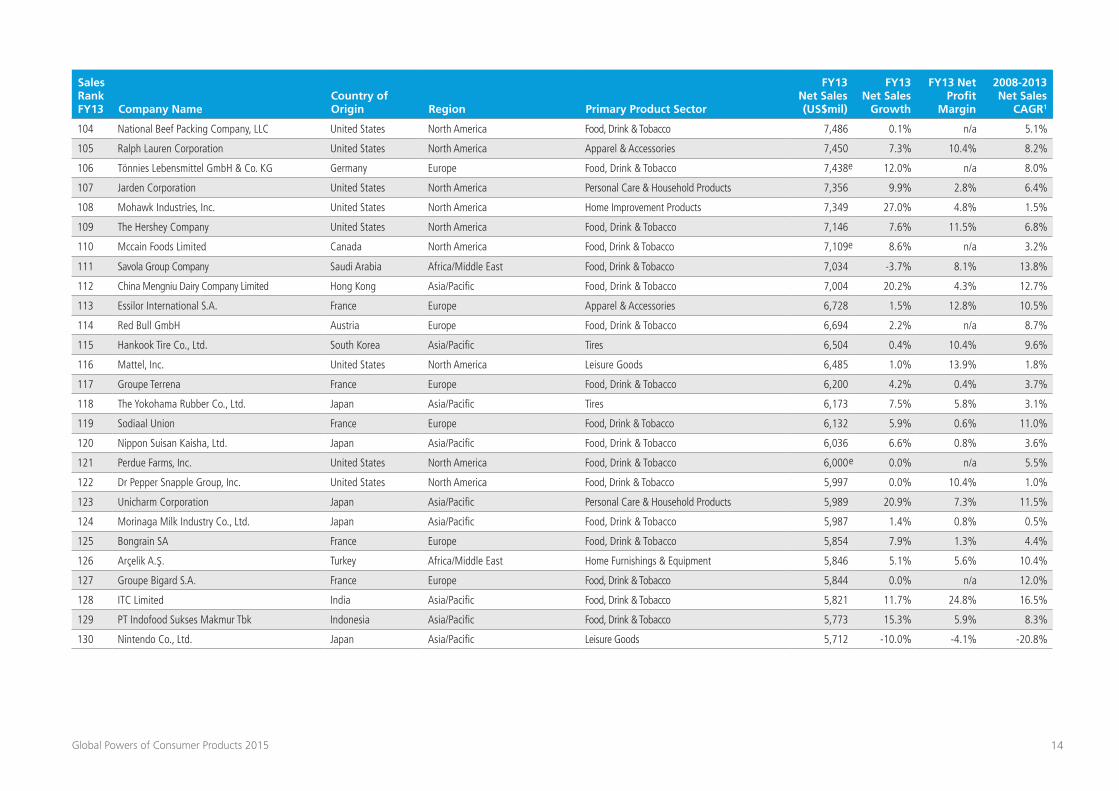
14Global Powers of Consumer Products 2015
Sales Rank FY13 Company Name
Country of Origin Region Primary Product Sector
FY13 Net Sales (US$mil)
FY13 Net Sales
Growth
FY13 Net Profit
Margin
2008-2013 Net Sales
CAGR1
104 National Beef Packing Company, LLC United States North America Food, Drink & Tobacco 7,486 0.1% n/a 5.1%
105 Ralph Lauren Corporation United States North America Apparel & Accessories 7,450 7.3% 10.4% 8.2%
106 Tönnies Lebensmittel GmbH & Co. KG Germany Europe Food, Drink & Tobacco 7,438 12.0% n/a 8.0%
107 Jarden Corporation United States North America Personal Care & Household Products 7,356 9.9% 2.8% 6.4%
108 Mohawk Industries, Inc. United States North America Home Improvement Products 7,349 27.0% 4.8% 1.5%
109 The Hershey Company United States North America Food, Drink & Tobacco 7,146 7.6% 11.5% 6.8%
110 Mccain Foods Limited Canada North America Food, Drink & Tobacco 7,109 8.6% n/a 3.2%
111 Savola Group Company Saudi Arabia Africa/Middle East Food, Drink & Tobacco 7,034 -3.7% 8.1% 13.8%
112 China Mengniu Dairy Company Limited Hong Kong Asia/Pacific Food, Drink & Tobacco 7,004 20.2% 4.3% 12.7%
113 Essilor International S.A. France Europe Apparel & Accessories 6,728 1.5% 12.8% 10.5%
114 Red Bull GmbH Austria Europe Food, Drink & Tobacco 6,694 2.2% n/a 8.7%
115 Hankook Tire Co., Ltd. South Korea Asia/Pacific Tires 6,504 0.4% 10.4% 9.6%
116 Mattel, Inc. United States North America Leisure Goods 6,485 1.0% 13.9% 1.8%
117 Groupe Terrena France Europe Food, Drink & Tobacco 6,200 4.2% 0.4% 3.7%
118 The Yokohama Rubber Co., Ltd. Japan Asia/Pacific Tires 6,173 7.5% 5.8% 3.1%
119 Sodiaal Union France Europe Food, Drink & Tobacco 6,132 5.9% 0.6% 11.0%
120 Nippon Suisan Kaisha, Ltd. Japan Asia/Pacific Food, Drink & Tobacco 6,036 6.6% 0.8% 3.6%
121 Perdue Farms, Inc. United States North America Food, Drink & Tobacco 6,000 0.0% n/a 5.5%
122 Dr Pepper Snapple Group, Inc. United States North America Food, Drink & Tobacco 5,997 0.0% 10.4% 1.0%
123 Unicharm Corporation Japan Asia/Pacific Personal Care & Household Products 5,989 20.9% 7.3% 11.5%
124 Morinaga Milk Industry Co., Ltd. Japan Asia/Pacific Food, Drink & Tobacco 5,987 1.4% 0.8% 0.5%
125 Bongrain SA France Europe Food, Drink & Tobacco 5,854 7.9% 1.3% 4.4%
126 Arçelik A.Ş. Turkey Africa/Middle East Home Furnishings & Equipment 5,846 5.1% 5.6% 10.4%
127 Groupe Bigard S.A. France Europe Food, Drink & Tobacco 5,844 0.0% n/a 12.0%
128 ITC Limited India Asia/Pacific Food, Drink & Tobacco 5,821 11.7% 24.8% 16.5%
129 PT Indofood Sukses Makmur Tbk Indonesia Asia/Pacific Food, Drink & Tobacco 5,773 15.3% 5.9% 8.3%
130 Nintendo Co., Ltd. Japan Asia/Pacific Leisure Goods 5,712 -10.0% -4.1% -20.8%
e
e
e
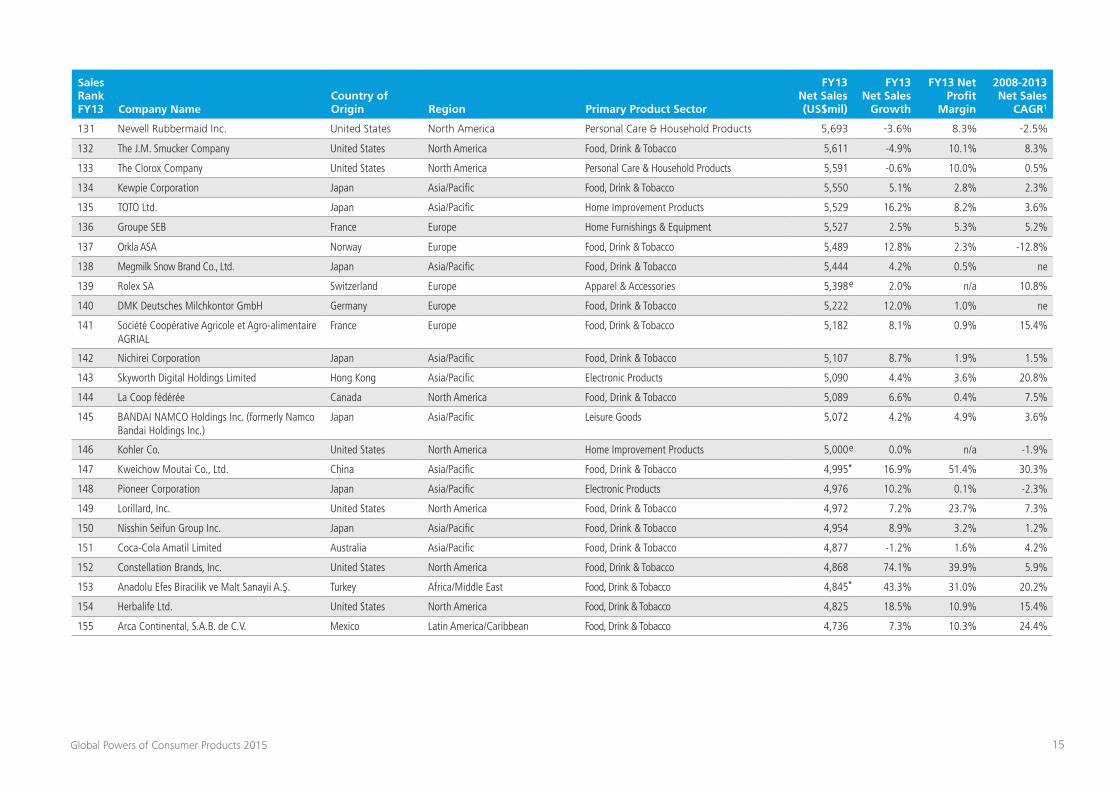
15Global Powers of Consumer Products 2015
Sales Rank FY13 Company Name
Country of Origin Region Primary Product Sector
FY13 Net Sales (US$mil)
FY13 Net Sales
Growth
FY13 Net Profit
Margin
2008-2013 Net Sales
CAGR1
131 Newell Rubbermaid Inc. United States North America Personal Care & Household Products 5,693 -3.6% 8.3% -2.5%
132 The J.M. Smucker Company United States North America Food, Drink & Tobacco 5,611 -4.9% 10.1% 8.3%
133 The Clorox Company United States North America Personal Care & Household Products 5,591 -0.6% 10.0% 0.5%
134 Kewpie Corporation Japan Asia/Pacific Food, Drink & Tobacco 5,550 5.1% 2.8% 2.3%
135 TOTO Ltd. Japan Asia/Pacific Home Improvement Products 5,529 16.2% 8.2% 3.6%
136 Groupe SEB France Europe Home Furnishings & Equipment 5,527 2.5% 5.3% 5.2%
137 Orkla ASA Norway Europe Food, Drink & Tobacco 5,489 12.8% 2.3% -12.8%
138 Megmilk Snow Brand Co., Ltd. Japan Asia/Pacific Food, Drink & Tobacco 5,444 4.2% 0.5% ne
139 Rolex SA Switzerland Europe Apparel & Accessories 5,398 2.0% n/a 10.8%
140 DMK Deutsches Milchkontor GmbH Germany Europe Food, Drink & Tobacco 5,222 12.0% 1.0% ne
141 Société Coopérative Agricole et Agro-alimentaire AGRIAL
France Europe Food, Drink & Tobacco 5,182 8.1% 0.9% 15.4%
142 Nichirei Corporation Japan Asia/Pacific Food, Drink & Tobacco 5,107 8.7% 1.9% 1.5%
143 Skyworth Digital Holdings Limited Hong Kong Asia/Pacific Electronic Products 5,090 4.4% 3.6% 20.8%
144 La Coop fédérée Canada North America Food, Drink & Tobacco 5,089 6.6% 0.4% 7.5%
145 BANDAI NAMCO Holdings Inc. (formerly Namco Bandai Holdings Inc.)
Japan Asia/Pacific Leisure Goods 5,072 4.2% 4.9% 3.6%
146 Kohler Co. United States North America Home Improvement Products 5,000 0.0% n/a -1.9%
147 Kweichow Moutai Co., Ltd. China Asia/Pacific Food, Drink & Tobacco 4,995 16.9% 51.4% 30.3%
148 Pioneer Corporation Japan Asia/Pacific Electronic Products 4,976 10.2% 0.1% -2.3%
149 Lorillard, Inc. United States North America Food, Drink & Tobacco 4,972 7.2% 23.7% 7.3%
150 Nisshin Seifun Group Inc. Japan Asia/Pacific Food, Drink & Tobacco 4,954 8.9% 3.2% 1.2%
151 Coca-Cola Amatil Limited Australia Asia/Pacific Food, Drink & Tobacco 4,877 -1.2% 1.6% 4.2%
152 Constellation Brands, Inc. United States North America Food, Drink & Tobacco 4,868 74.1% 39.9% 5.9%
153 Anadolu Efes Biracilik ve Malt Sanayii A.Ş. Turkey Africa/Middle East Food, Drink & Tobacco 4,845 43.3% 31.0% 20.2%
154 Herbalife Ltd. United States North America Food, Drink & Tobacco 4,825 18.5% 10.9% 15.4%
155 Arca Continental, S.A.B. de C.V. Mexico Latin America/Caribbean Food, Drink & Tobacco 4,736 7.3% 10.3% 24.4%
*
e
*
e
16Global Powers of Consumer Products 2015
Sales Rank FY13 Company Name
Country of Origin Region Primary Product Sector
FY13 Net Sales (US$mil)
FY13 Net Sales
Growth
FY13 Net Profit
Margin
2008-2013 Net Sales
CAGR1
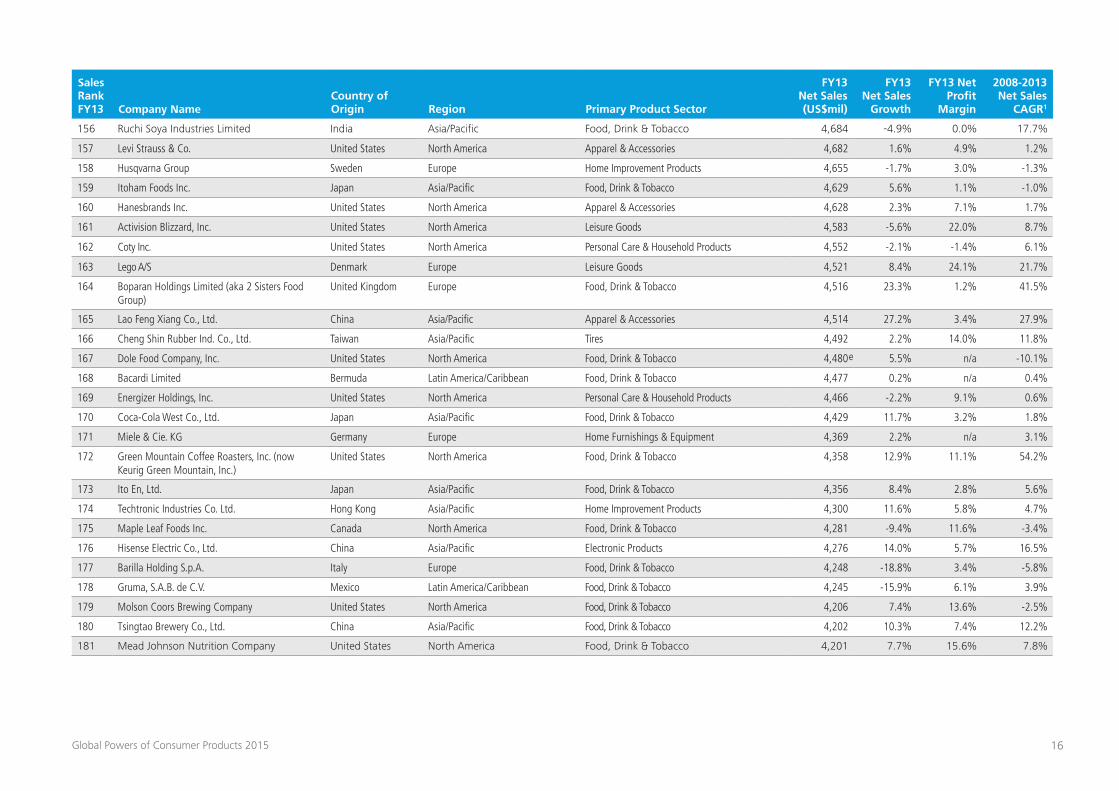
156 Ruchi Soya Industries Limited India Asia/Pacific Food, Drink & Tobacco 4,684 -4.9% 0.0% 17.7%
157 Levi Strauss & Co. United States North America Apparel & Accessories 4,682 1.6% 4.9% 1.2%
158 Husqvarna Group Sweden Europe Home Improvement Products 4,655 -1.7% 3.0% -1.3%
159 Itoham Foods Inc. Japan Asia/Pacific Food, Drink & Tobacco 4,629 5.6% 1.1% -1.0%
160 Hanesbrands Inc. United States North America Apparel & Accessories 4,628 2.3% 7.1% 1.7%
161 Activision Blizzard, Inc. United States North America Leisure Goods 4,583 -5.6% 22.0% 8.7%
162 Coty Inc. United States North America Personal Care & Household Products 4,552 -2.1% -1.4% 6.1%
163 Lego A/S Denmark Europe Leisure Goods 4,521 8.4% 24.1% 21.7%
164 Boparan Holdings Limited (aka 2 Sisters Food Group)
United Kingdom Europe Food, Drink & Tobacco 4,516 23.3% 1.2% 41.5%
165 Lao Feng Xiang Co., Ltd. China Asia/Pacific Apparel & Accessories 4,514 27.2% 3.4% 27.9%
166 Cheng Shin Rubber Ind. Co., Ltd. Taiwan Asia/Pacific Tires 4,492 2.2% 14.0% 11.8%
167 Dole Food Company, Inc. United States North America Food, Drink & Tobacco 4,480 5.5% n/a -10.1%
168 Bacardi Limited Bermuda Latin America/Caribbean Food, Drink & Tobacco 4,477 0.2% n/a 0.4%
169 Energizer Holdings, Inc. United States North America Personal Care & Household Products 4,466 -2.2% 9.1% 0.6%
170 Coca-Cola West Co., Ltd. Japan Asia/Pacific Food, Drink & Tobacco 4,429 11.7% 3.2% 1.8%
171 Miele & Cie. KG Germany Europe Home Furnishings & Equipment 4,369 2.2% n/a 3.1%
172 Green Mountain Coffee Roasters, Inc. (now Keurig Green Mountain, Inc.)
United States North America Food, Drink & Tobacco 4,358 12.9% 11.1% 54.2%
173 Ito En, Ltd. Japan Asia/Pacific Food, Drink & Tobacco 4,356 8.4% 2.8% 5.6%
174 Techtronic Industries Co. Ltd. Hong Kong Asia/Pacific Home Improvement Products 4,300 11.6% 5.8% 4.7%
175 Maple Leaf Foods Inc. Canada North America Food, Drink & Tobacco 4,281 -9.4% 11.6% -3.4%
176 Hisense Electric Co., Ltd. China Asia/Pacific Electronic Products 4,276 14.0% 5.7% 16.5%
177 Barilla Holding S.p.A. Italy Europe Food, Drink & Tobacco 4,248 -18.8% 3.4% -5.8%
178 Gruma, S.A.B. de C.V. Mexico Latin America/Caribbean Food, Drink & Tobacco 4,245 -15.9% 6.1% 3.9%
179 Molson Coors Brewing Company United States North America Food, Drink & Tobacco 4,206 7.4% 13.6% -2.5%
180 Tsingtao Brewery Co., Ltd. China Asia/Pacific Food, Drink & Tobacco 4,202 10.3% 7.4% 12.2%
181 Mead Johnson Nutrition Company United States North America Food, Drink & Tobacco 4,201 7.7% 15.6% 7.8%
e
17Global Powers of Consumer Products 2015
Sales Rank FY13 Company Name
Country of Origin Region Primary Product Sector
FY13 Net Sales (US$mil)
FY13 Net Sales
Growth
FY13 Net Profit
Margin
2008-2013 Net Sales
CAGR1
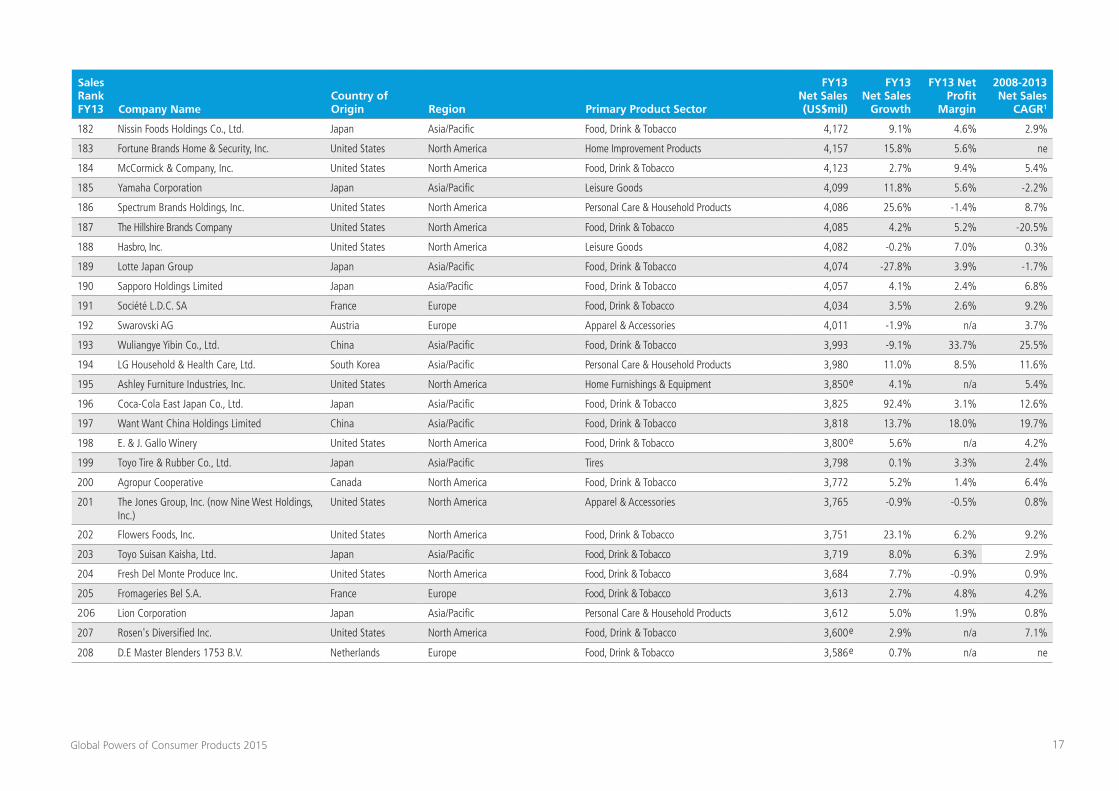
182 Nissin Foods Holdings Co., Ltd. Japan Asia/Pacific Food, Drink & Tobacco 4,172 9.1% 4.6% 2.9%
183 Fortune Brands Home & Security, Inc. United States North America Home Improvement Products 4,157 15.8% 5.6% ne
184 McCormick & Company, Inc. United States North America Food, Drink & Tobacco 4,123 2.7% 9.4% 5.4%
185 Yamaha Corporation Japan Asia/Pacific Leisure Goods 4,099 11.8% 5.6% -2.2%
186 Spectrum Brands Holdings, Inc. United States North America Personal Care & Household Products 4,086 25.6% -1.4% 8.7%
187 The Hillshire Brands Company United States North America Food, Drink & Tobacco 4,085 4.2% 5.2% -20.5%
188 Hasbro, Inc. United States North America Leisure Goods 4,082 -0.2% 7.0% 0.3%
189 Lotte Japan Group Japan Asia/Pacific Food, Drink & Tobacco 4,074 -27.8% 3.9% -1.7%
190 Sapporo Holdings Limited Japan Asia/Pacific Food, Drink & Tobacco 4,057 4.1% 2.4% 6.8%
191 Société L.D.C. SA France Europe Food, Drink & Tobacco 4,034 3.5% 2.6% 9.2%
192 Swarovski AG Austria Europe Apparel & Accessories 4,011 -1.9% n/a 3.7%
193 Wuliangye Yibin Co., Ltd. China Asia/Pacific Food, Drink & Tobacco 3,993 -9.1% 33.7% 25.5%
194 LG Household & Health Care, Ltd. South Korea Asia/Pacific Personal Care & Household Products 3,980 11.0% 8.5% 11.6%
195 Ashley Furniture Industries, Inc. United States North America Home Furnishings & Equipment 3,850 4.1% n/a 5.4%
196 Coca-Cola East Japan Co., Ltd. Japan Asia/Pacific Food, Drink & Tobacco 3,825 92.4% 3.1% 12.6%
197 Want Want China Holdings Limited China Asia/Pacific Food, Drink & Tobacco 3,818 13.7% 18.0% 19.7%
198 E. & J. Gallo Winery United States North America Food, Drink & Tobacco 3,800 5.6% n/a 4.2%
199 Toyo Tire & Rubber Co., Ltd. Japan Asia/Pacific Tires 3,798 0.1% 3.3% 2.4%
200 Agropur Cooperative Canada North America Food, Drink & Tobacco 3,772 5.2% 1.4% 6.4%
201 The Jones Group, Inc. (now Nine West Holdings, Inc.)
United States North America Apparel & Accessories 3,765 -0.9% -0.5% 0.8%
202 Flowers Foods, Inc. United States North America Food, Drink & Tobacco 3,751 23.1% 6.2% 9.2%
203 Toyo Suisan Kaisha, Ltd. Japan Asia/Pacific Food, Drink & Tobacco 3,719 8.0% 6.3% 2.9%
204 Fresh Del Monte Produce Inc. United States North America Food, Drink & Tobacco 3,684 7.7% -0.9% 0.9%
205 Fromageries Bel S.A. France Europe Food, Drink & Tobacco 3,613 2.7% 4.8% 4.2%
206 Lion Corporation Japan Asia/Pacific Personal Care & Household Products 3,612 5.0% 1.9% 0.8%
207 Rosen's Diversified Inc. United States North America Food, Drink & Tobacco 3,600 2.9% n/a 7.1%
208 D.E Master Blenders 1753 B.V. Netherlands Europe Food, Drink & Tobacco 3,586 0.7% n/a ne
e
e
e
e
18Global Powers of Consumer Products 2015
Sales Rank FY13 Company Name
Country of Origin Region Primary Product Sector
FY13 Net Sales (US$mil)
FY13 Net Sales
Growth
FY13 Net Profit
Margin
2008-2013 Net Sales
CAGR1
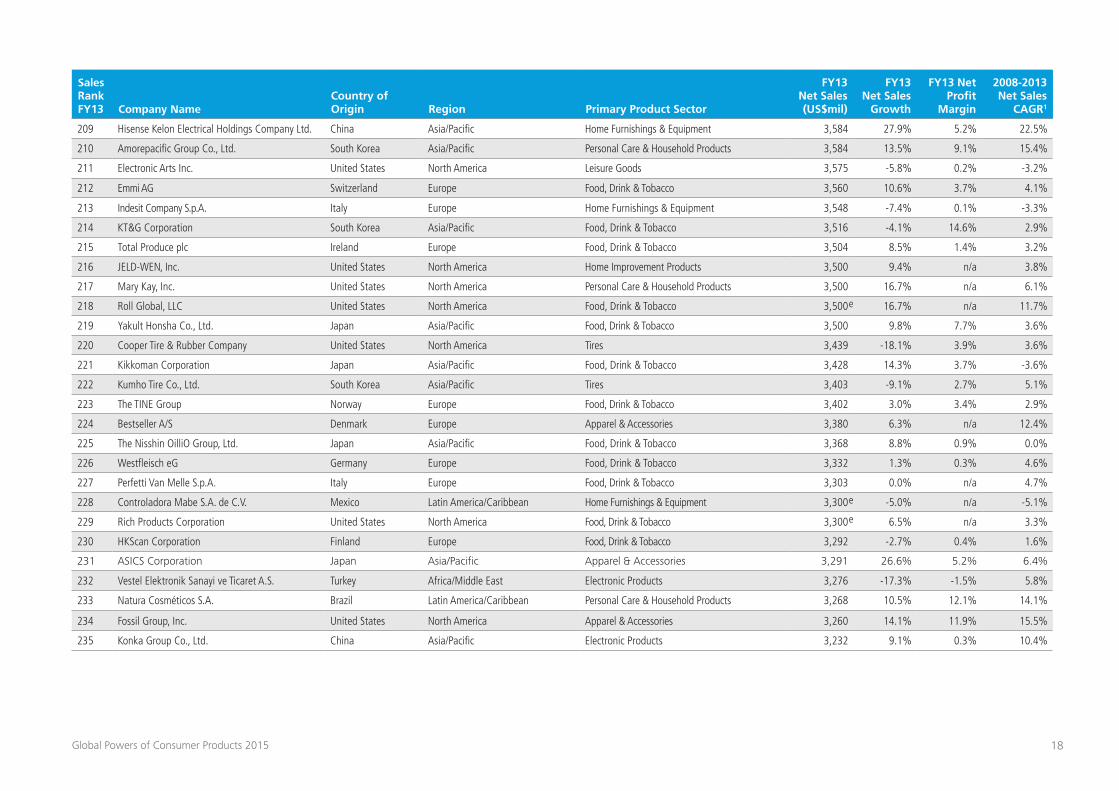
209 Hisense Kelon Electrical Holdings Company Ltd. China Asia/Pacific Home Furnishings & Equipment 3,584 27.9% 5.2% 22.5%
210 Amorepacific Group Co., Ltd. South Korea Asia/Pacific Personal Care & Household Products 3,584 13.5% 9.1% 15.4%
211 Electronic Arts Inc. United States North America Leisure Goods 3,575 -5.8% 0.2% -3.2%
212 Emmi AG Switzerland Europe Food, Drink & Tobacco 3,560 10.6% 3.7% 4.1%
213 Indesit Company S.p.A. Italy Europe Home Furnishings & Equipment 3,548 -7.4% 0.1% -3.3%
214 KT&G Corporation South Korea Asia/Pacific Food, Drink & Tobacco 3,516 -4.1% 14.6% 2.9%
215 Total Produce plc Ireland Europe Food, Drink & Tobacco 3,504 8.5% 1.4% 3.2%
216 JELD-WEN, Inc. United States North America Home Improvement Products 3,500 9.4% n/a 3.8%
217 Mary Kay, Inc. United States North America Personal Care & Household Products 3,500 16.7% n/a 6.1%
218 Roll Global, LLC United States North America Food, Drink & Tobacco 3,500 16.7% n/a 11.7%
219 Yakult Honsha Co., Ltd. Japan Asia/Pacific Food, Drink & Tobacco 3,500 9.8% 7.7% 3.6%
220 Cooper Tire & Rubber Company United States North America Tires 3,439 -18.1% 3.9% 3.6%
221 Kikkoman Corporation Japan Asia/Pacific Food, Drink & Tobacco 3,428 14.3% 3.7% -3.6%
222 Kumho Tire Co., Ltd. South Korea Asia/Pacific Tires 3,403 -9.1% 2.7% 5.1%
223 The TINE Group Norway Europe Food, Drink & Tobacco 3,402 3.0% 3.4% 2.9%
224 Bestseller A/S Denmark Europe Apparel & Accessories 3,380 6.3% n/a 12.4%
225 The Nisshin OilliO Group, Ltd. Japan Asia/Pacific Food, Drink & Tobacco 3,368 8.8% 0.9% 0.0%
226 Westfleisch eG Germany Europe Food, Drink & Tobacco 3,332 1.3% 0.3% 4.6%
227 Perfetti Van Melle S.p.A. Italy Europe Food, Drink & Tobacco 3,303 0.0% n/a 4.7%
228 Controladora Mabe S.A. de C.V. Mexico Latin America/Caribbean Home Furnishings & Equipment 3,300 -5.0% n/a -5.1%
229 Rich Products Corporation United States North America Food, Drink & Tobacco 3,300 6.5% n/a 3.3%
230 HKScan Corporation Finland Europe Food, Drink & Tobacco 3,292 -2.7% 0.4% 1.6%
231 ASICS Corporation Japan Asia/Pacific Apparel & Accessories 3,291 26.6% 5.2% 6.4%
232 Vestel Elektronik Sanayi ve Ticaret A.S. Turkey Africa/Middle East Electronic Products 3,276 -17.3% -1.5% 5.8%
233 Natura Cosméticos S.A. Brazil Latin America/Caribbean Personal Care & Household Products 3,268 10.5% 12.1% 14.1%
234 Fossil Group, Inc. United States North America Apparel & Accessories 3,260 14.1% 11.9% 15.5%
235 Konka Group Co., Ltd. China Asia/Pacific Electronic Products 3,232 9.1% 0.3% 10.4%
e
e
e
19Global Powers of Consumer Products 2015
Sales Rank FY13 Company Name
Country of Origin Region Primary Product Sector
FY13 Net Sales (US$mil)
FY13 Net Sales
Growth
FY13 Net Profit
Margin
2008-2013 Net Sales
CAGR1
236 Casio Computer Co., Ltd. Japan Asia/Pacific Electronic Products 3,214 8.1% 5.0% -9.1%
237 The Schwan Food Company United States North America Food, Drink & Tobacco 3,200 1.6% n/a -1.9%
238 Church & Dwight Co., Inc. United States North America Personal Care & Household Products 3,194 9.3% 12.3% 5.7%
239 World Co., Ltd. Japan Asia/Pacific Apparel & Accessories 3,170 -5.7% -0.5% -1.5%
240 NBTY, Inc. United States North America Food, Drink & Tobacco 3,163 5.4% 4.1% 7.7%
241 JVCKENWOOD Corporation Japan Asia/Pacific Electronic Products 3,160 3.2% -1.9% 0.4%
242 Ezaki Glico Co., Ltd. Japan Asia/Pacific Food, Drink & Tobacco 3,151 7.6% 3.8% 1.8%
243 Industrias Bachoco, S.A.B. de C.V. Mexico Latin America/Caribbean Food, Drink & Tobacco 3,116 0.9% 5.1% 14.6%
244 Chocoladefabriken Lindt & Sprüngli AG Switzerland Europe Food, Drink & Tobacco 3,112 8.0% 10.5% -0.4%
245 Vizio, Inc. United States North America Electronic Products 3,100 0.0% n/a 9.1%
246 Citizen Holdings Co., Ltd. Japan Asia/Pacific Apparel & Accessories 3,097 13.9% 5.7% 0.9%
247 Seiko Holdings Corporation Japan Asia/Pacific Apparel & Accessories 3,080 8.6% 2.5% 12.1%
248 Chiquita Brands International, Inc. United States North America Food, Drink & Tobacco 3,057 -0.7% -0.5% -3.3%
249 Prima Meat Packers, Ltd. Japan Asia/Pacific Food, Drink & Tobacco 3,033 10.1% 1.7% 1.9%
250 Nortura SA Norway Europe Food, Drink & Tobacco 3,001 7.5% 0.6% 3.5%
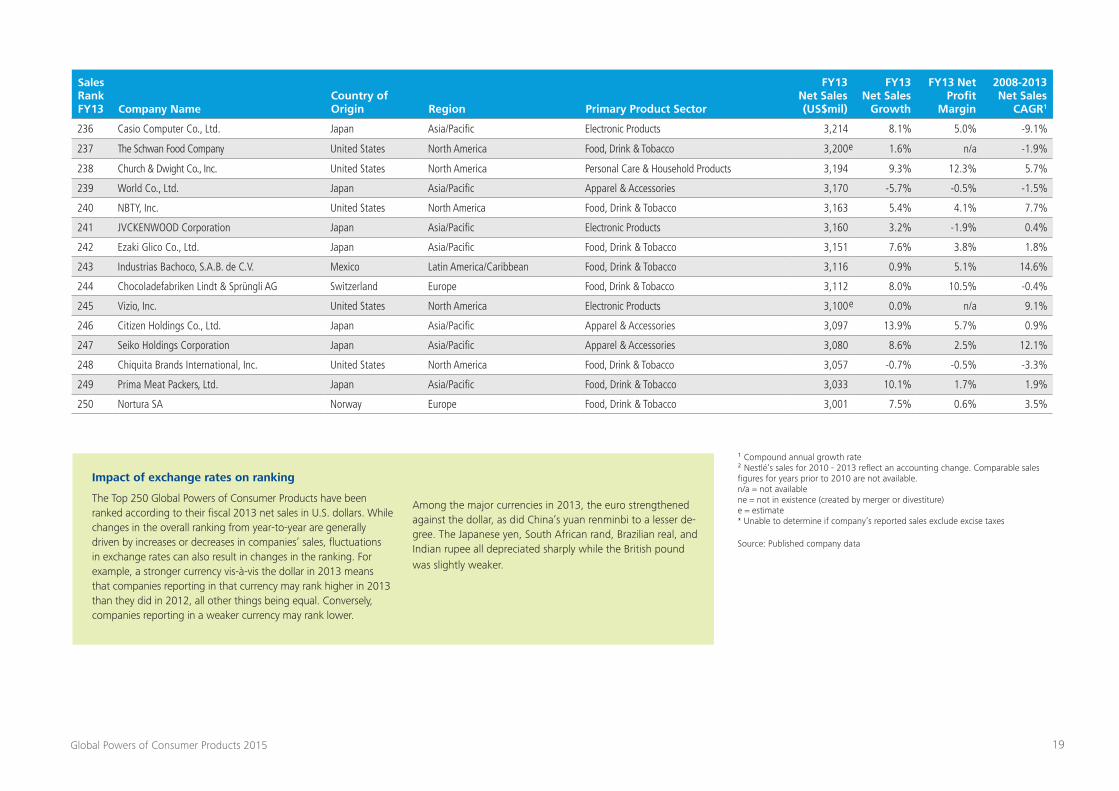
¹ Compound annual growth rate ² Nestlé’s sales for 2010 - 2013 reflect an accounting change. Comparable sales figures for years prior to 2010 are not available. n/a = not available ne = not in existence (created by merger or divestiture) e = estimate * Unable to determine if company’s reported sales exclude excise taxes
Source: Published company data
Impact of exchange rates on ranking
The Top 250 Global Powers of Consumer Products have been ranked according to their fiscal 2013 net sales in U.S. dollars. While changes in the overall ranking from year-to-year are generally driven by increases or decreases in companies’ sales, fluctuations in exchange rates can also result in changes in the ranking. For example, a stronger currency vis-à-vis the dollar in 2013 means that companies reporting in that currency may rank higher in 2013 than they did in 2012, all other things being equal. Conversely, companies reporting in a weaker currency may rank lower.
Among the major currencies in 2013, the euro strengthened against the dollar, as did China’s yuan renminbi to a lesser de-gree. The Japanese yen, South African rand, Brazilian real, and Indian rupee all depreciated sharply while the British pound was slightly weaker.
e
e
20Global Powers of Consumer Products 2015
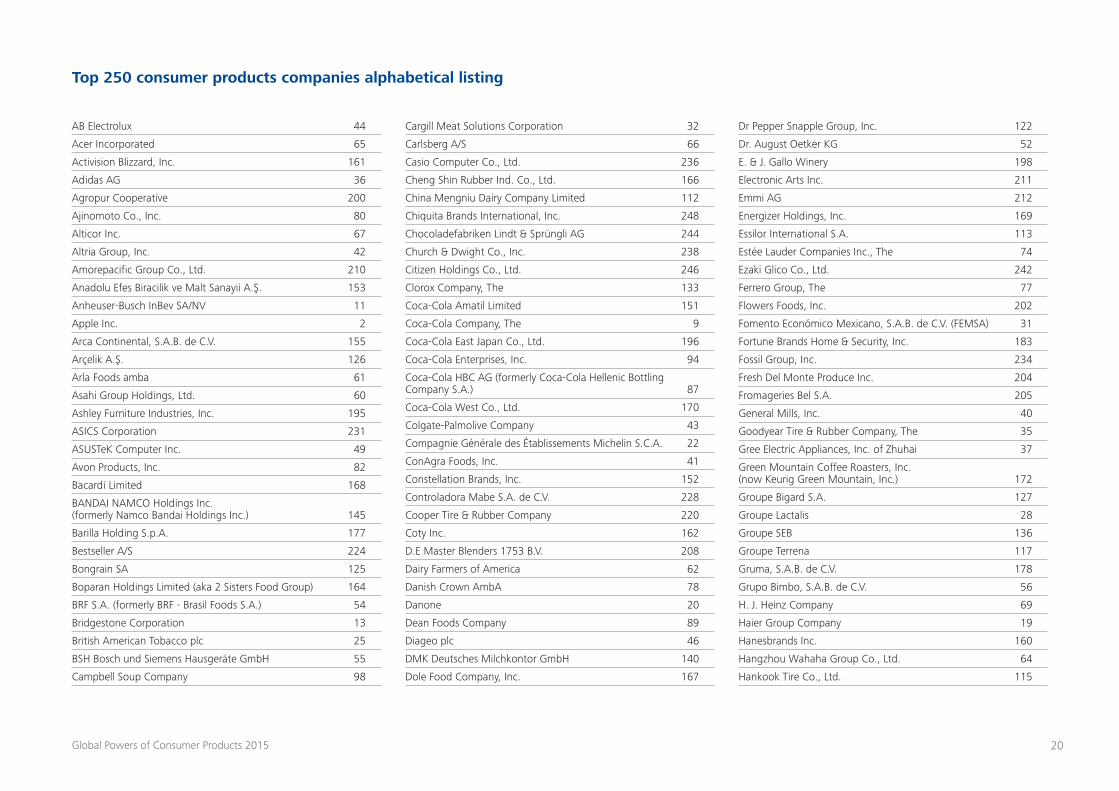
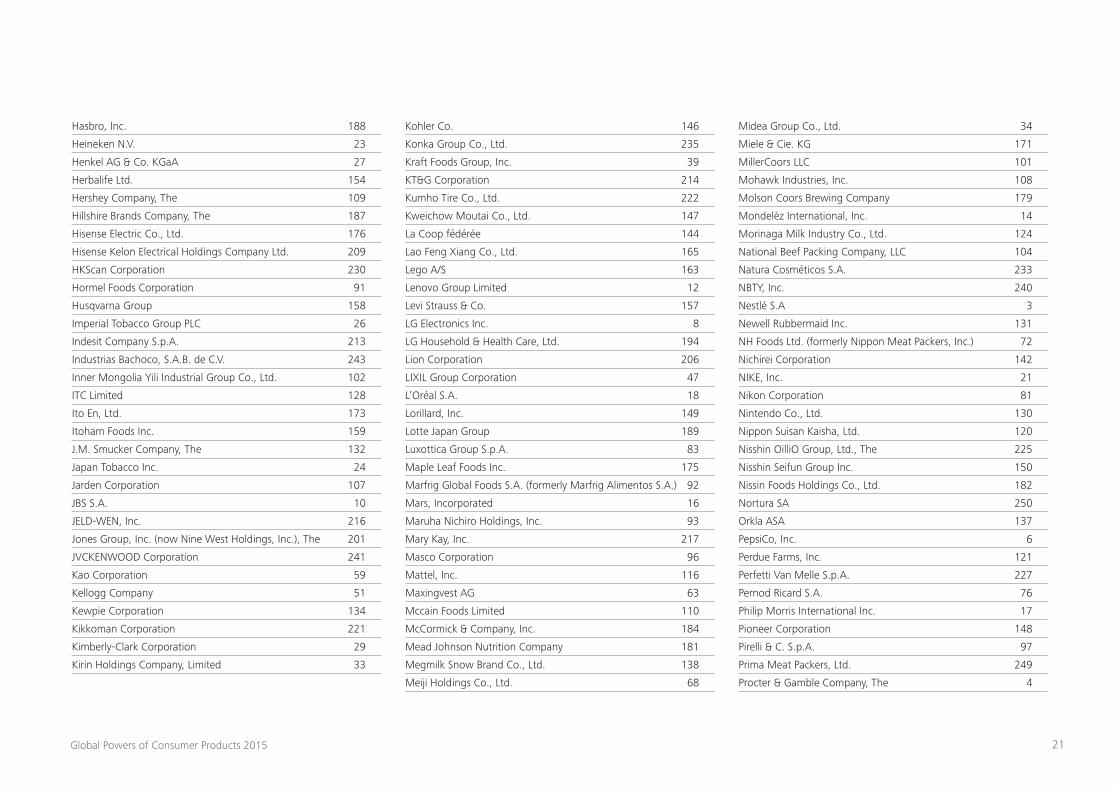
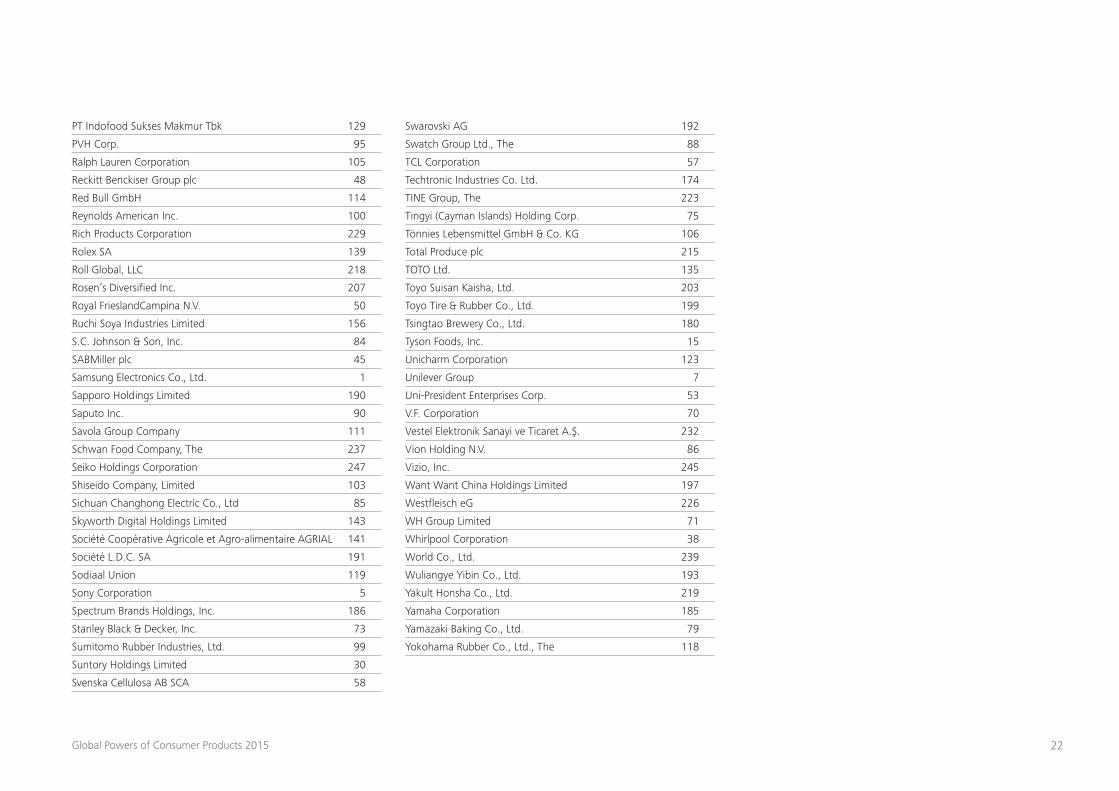
Top 250 consumer products companies alphabetical listing
AB Electrolux 44
Acer Incorporated 65
Activision Blizzard, Inc. 161
Adidas AG 36
Agropur Cooperative 200
Ajinomoto Co., Inc. 80
Alticor Inc. 67
Altria Group, Inc. 42
Amorepacific Group Co., Ltd. 210
Anadolu Efes Biracilik ve Malt Sanayii A.Ş. 153
Anheuser-Busch InBev SA/NV 11
Apple Inc. 2
Arca Continental, S.A.B. de C.V. 155
Arçelik A.Ş. 126
Arla Foods amba 61
Asahi Group Holdings, Ltd. 60
Ashley Furniture Industries, Inc. 195
ASICS Corporation 231
ASUSTeK Computer Inc. 49
Avon Products, Inc. 82
Bacardi Limited 168
BANDAI NAMCO Holdings Inc. (formerly Namco Bandai Holdings Inc.) 145
Barilla Holding S.p.A. 177
Bestseller A/S 224
Bongrain SA 125
Boparan Holdings Limited (aka 2 Sisters Food Group) 164
BRF S.A. (formerly BRF - Brasil Foods S.A.) 54
Bridgestone Corporation 13
British American Tobacco plc 25
BSH Bosch und Siemens Hausgeräte GmbH 55
Campbell Soup Company 98
Cargill Meat Solutions Corporation 32
Carlsberg A/S 66
Casio Computer Co., Ltd. 236
Cheng Shin Rubber Ind. Co., Ltd. 166
China Mengniu Dairy Company Limited 112
Chiquita Brands International, Inc. 248
Chocoladefabriken Lindt & Sprüngli AG 244
Church & Dwight Co., Inc. 238
Citizen Holdings Co., Ltd. 246
Clorox Company, The 133
Coca-Cola Amatil Limited 151
Coca-Cola Company, The 9
Coca-Cola East Japan Co., Ltd. 196
Coca-Cola Enterprises, Inc. 94
Coca-Cola HBC AG (formerly Coca-Cola Hellenic Bottling Company S.A.) 87
Coca-Cola West Co., Ltd. 170
Colgate-Palmolive Company 43
Compagnie Générale des Établissements Michelin S.C.A. 22
ConAgra Foods, Inc. 41
Constellation Brands, Inc. 152
Controladora Mabe S.A. de C.V. 228
Cooper Tire & Rubber Company 220
Coty Inc. 162
D.E Master Blenders 1753 B.V. 208
Dairy Farmers of America 62
Danish Crown AmbA 78
Danone 20
Dean Foods Company 89
Diageo plc 46
DMK Deutsches Milchkontor GmbH 140
Dole Food Company, Inc. 167
Dr Pepper Snapple Group, Inc. 122
Dr. August Oetker KG 52
E. & J. Gallo Winery 198
Electronic Arts Inc. 211
Emmi AG 212
Energizer Holdings, Inc. 169
Essilor International S.A. 113
Estée Lauder Companies Inc., The 74
Ezaki Glico Co., Ltd. 242
Ferrero Group, The 77
Flowers Foods, Inc. 202
Fomento Económico Mexicano, S.A.B. de C.V. (FEMSA) 31
Fortune Brands Home & Security, Inc. 183
Fossil Group, Inc. 234
Fresh Del Monte Produce Inc. 204
Fromageries Bel S.A. 205
General Mills, Inc. 40
Goodyear Tire & Rubber Company, The 35
Gree Electric Appliances, Inc. of Zhuhai 37
Green Mountain Coffee Roasters, Inc. (now Keurig Green Mountain, Inc.) 172
Groupe Bigard S.A. 127
Groupe Lactalis 28
Groupe SEB 136
Groupe Terrena 117
Gruma, S.A.B. de C.V. 178
Grupo Bimbo, S.A.B. de C.V. 56
H. J. Heinz Company 69
Haier Group Company 19
Hanesbrands Inc. 160
Hangzhou Wahaha Group Co., Ltd. 64
Hankook Tire Co., Ltd. 115
21Global Powers of Consumer Products 2015
Hasbro, Inc. 188
Heineken N.V. 23
Henkel AG & Co. KGaA 27
Herbalife Ltd. 154
Hershey Company, The 109
Hillshire Brands Company, The 187
Hisense Electric Co., Ltd. 176
Hisense Kelon Electrical Holdings Company Ltd. 209
HKScan Corporation 230
Hormel Foods Corporation 91
Husqvarna Group 158
Imperial Tobacco Group PLC 26
Indesit Company S.p.A. 213
Industrias Bachoco, S.A.B. de C.V. 243
Inner Mongolia Yili Industrial Group Co., Ltd. 102
ITC Limited 128
Ito En, Ltd. 173
Itoham Foods Inc. 159
J.M. Smucker Company, The 132
Japan Tobacco Inc. 24
Jarden Corporation 107
JBS S.A. 10
JELD-WEN, Inc. 216
Jones Group, Inc. (now Nine West Holdings, Inc.), The 201
JVCKENWOOD Corporation 241
Kao Corporation 59
Kellogg Company 51
Kewpie Corporation 134
Kikkoman Corporation 221
Kimberly-Clark Corporation 29
Kirin Holdings Company, Limited 33
Kohler Co. 146
Konka Group Co., Ltd. 235
Kraft Foods Group, Inc. 39
KT&G Corporation 214
Kumho Tire Co., Ltd. 222
Kweichow Moutai Co., Ltd. 147
La Coop fédérée 144
Lao Feng Xiang Co., Ltd. 165
Lego A/S 163
Lenovo Group Limited 12
Levi Strauss & Co. 157
LG Electronics Inc. 8
LG Household & Health Care, Ltd. 194
Lion Corporation 206
LIXIL Group Corporation 47
L’Oréal S.A. 18
Lorillard, Inc. 149
Lotte Japan Group 189
Luxottica Group S.p.A. 83
Maple Leaf Foods Inc. 175
Marfrig Global Foods S.A. (formerly Marfrig Alimentos S.A.) 92
Mars, Incorporated 16
Maruha Nichiro Holdings, Inc. 93
Mary Kay, Inc. 217
Masco Corporation 96
Mattel, Inc. 116
Maxingvest AG 63
Mccain Foods Limited 110
McCormick & Company, Inc. 184
Mead Johnson Nutrition Company 181
Megmilk Snow Brand Co., Ltd. 138
Meiji Holdings Co., Ltd. 68
Midea Group Co., Ltd. 34
Miele & Cie. KG 171
MillerCoors LLC 101
Mohawk Industries, Inc. 108
Molson Coors Brewing Company 179
Mondelēz International, Inc. 14
Morinaga Milk Industry Co., Ltd. 124
National Beef Packing Company, LLC 104
Natura Cosméticos S.A. 233
NBTY, Inc. 240
Nestlé S.A 3
Newell Rubbermaid Inc. 131
NH Foods Ltd. (formerly Nippon Meat Packers, Inc.) 72
Nichirei Corporation 142
NIKE, Inc. 21
Nikon Corporation 81
Nintendo Co., Ltd. 130
Nippon Suisan Kaisha, Ltd. 120
Nisshin OilliO Group, Ltd., The 225
Nisshin Seifun Group Inc. 150
Nissin Foods Holdings Co., Ltd. 182
Nortura SA 250
Orkla ASA 137
PepsiCo, Inc. 6
Perdue Farms, Inc. 121
Perfetti Van Melle S.p.A. 227
Pernod Ricard S.A. 76
Philip Morris International Inc. 17
Pioneer Corporation 148
Pirelli & C. S.p.A. 97
Prima Meat Packers, Ltd. 249
Procter & Gamble Company, The 4
22Global Powers of Consumer Products 2015
PT Indofood Sukses Makmur Tbk 129
PVH Corp. 95
Ralph Lauren Corporation 105
Reckitt Benckiser Group plc 48
Red Bull GmbH 114
Reynolds American Inc. 100
Rich Products Corporation 229
Rolex SA 139
Roll Global, LLC 218
Rosen’s Diversified Inc. 207
Royal FrieslandCampina N.V. 50
Ruchi Soya Industries Limited 156
S.C. Johnson & Son, Inc. 84
SABMiller plc 45
Samsung Electronics Co., Ltd. 1
Sapporo Holdings Limited 190
Saputo Inc. 90
Savola Group Company 111
Schwan Food Company, The 237
Seiko Holdings Corporation 247
Shiseido Company, Limited 103
Sichuan Changhong Electric Co., Ltd 85
Skyworth Digital Holdings Limited 143
Société Coopérative Agricole et Agro-alimentaire AGRIAL 141
Société L.D.C. SA 191
Sodiaal Union 119
Sony Corporation 5
Spectrum Brands Holdings, Inc. 186
Stanley Black & Decker, Inc. 73
Sumitomo Rubber Industries, Ltd. 99
Suntory Holdings Limited 30
Svenska Cellulosa AB SCA 58
Swarovski AG 192
Swatch Group Ltd., The 88
TCL Corporation 57
Techtronic Industries Co. Ltd. 174
TINE Group, The 223
Tingyi (Cayman Islands) Holding Corp. 75
Tönnies Lebensmittel GmbH & Co. KG 106
Total Produce plc 215
TOTO Ltd. 135
Toyo Suisan Kaisha, Ltd. 203
Toyo Tire & Rubber Co., Ltd. 199
Tsingtao Brewery Co., Ltd. 180
Tyson Foods, Inc. 15
Unicharm Corporation 123
Unilever Group 7
Uni-President Enterprises Corp. 53
V.F. Corporation 70
Vestel Elektronik Sanayi ve Ticaret A.Ş. 232
Vion Holding N.V. 86
Vizio, Inc. 245
Want Want China Holdings Limited 197
Westfleisch eG 226
WH Group Limited 71
Whirlpool Corporation 38
World Co., Ltd. 239
Wuliangye Yibin Co., Ltd. 193
Yakult Honsha Co., Ltd. 219
Yamaha Corporation 185
Yamazaki Baking Co., Ltd. 79
Yokohama Rubber Co., Ltd., The 118
23Global Powers of Consumer Products 2015
Top 250 highlights
Consumer products industry rides out another year of global economic recalibration in 2013
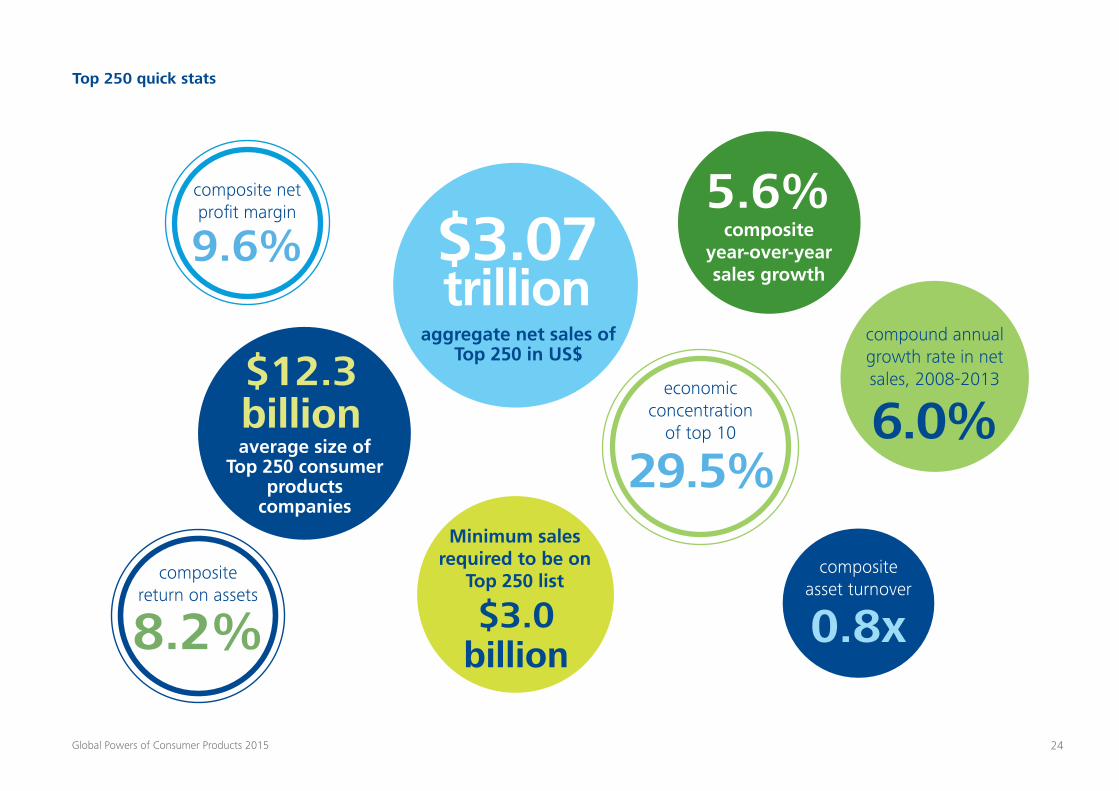
On the bottom line, profitability strengthened in 2013 for the second year in a row. The composite net profit margin rose to 9.6 percent (based on 217 companies that reported their net profits), exceeding for the first time the 8.5 percent result achieved in 2010 when the industry began its post-recession rebound. The vast majority of reporting companies operated profitably in 2013 (202 companies); only 15 of the 217 reporting companies generated a net loss. In addition, net profit margins improved for the major-ity of reporting companies. Although asset turnover fell slightly in 2013, the improvement in profitability generated a higher 8.2 percent return on assets.
With an average size of US$12.3 billion, the Top 250 consumer products companies generated sales of nearly US$3.1 trillion in 2013. This is down slightly from 2012’s Top 250 sales total due to changes in the composition of the group. In 2013, Panasonic, Nokia, and Blackberry (formerly Research In Motion) were excluded from the Top 250 because consumer products no longer make up the majority of their sales.
Net sales of at least US$3 billion were necessary to rank in the Top 250 in 2013. Nearly 70 percent of the companies generated sales of less than US$10 billion: 104 companies had sales between US$3 billion and US$5 billion, while 68 companies achieved sales be-tween US$5 billion and US$10 billion. Less than 10 percent of the Top 250 reported sales of more than US$25 billion (23 companies).
As a whole, 2013 was another challenging year for the global economy as it tried to gain a surer footing. Europe remained in recession during most of 2013, although it began to recover mod-estly by the end of the year and heading into 2014—but growth remained poor. The U.S. economy grew slowly in 2013 largely due to a tightening of fiscal policy. While the economy strengthened in Japan, supported by improved exports and the government’s massive economic stimulus measures, the Chinese economy decelerated in 2013, and similar slow growth continued into 2014. Economic growth also cooled in several Latin American countries as they faced the end of China’s commodity boom, weaker domes-tic demand, social unrest, and other downward pressures. Overall, recovery by many economies around the globe continued to be jagged and weak.
Although the global economy once again grew at a slower rate than had been expected, composite, currency-adjusted net sales rose 5.6 percent in 2013 for the Global Powers of Consumer Products—the world’s 250 largest consumer products companies. Three-quarters of the Top 250 reported a sales increase in 2013, and half (125 companies) reported faster growth in 2013 com-pared with 2012. Accelerating growth, however, was not a trend seen across all geographic regions or product sectors.
24Global Powers of Consumer Products 2015
8.2% 0.8x
$12.3 billion
9.6%
compound annual growth rate in net sales, 2008-2013
composite return on assets
composite asset turnover
average size of Top 250 consumer
products companies
composite year-over-year sales growth
Minimum sales required to be on
Top 250 list
aggregate net sales of Top 250 in US$
economic concentration
of top 10
composite net profit margin
6.0%
$3.07 trillion
29.5%
5.6%
Top 250 quick stats
$3.0 billion
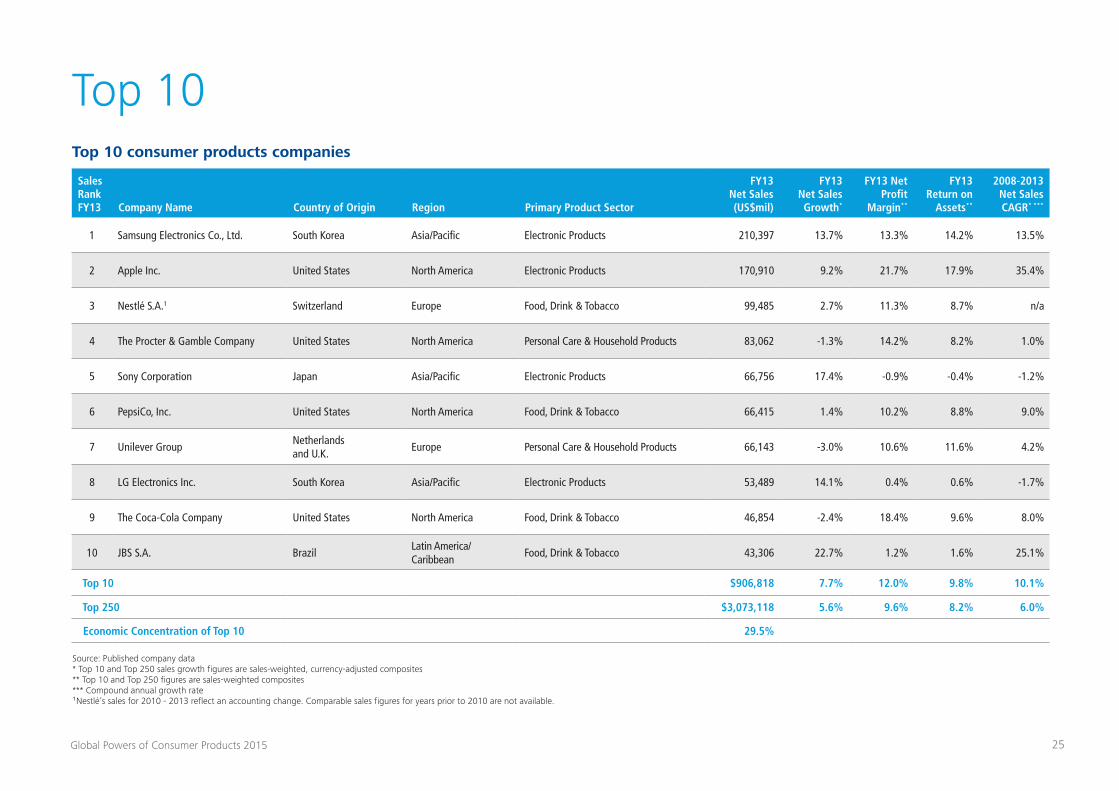
25Global Powers of Consumer Products 2015
Top 10Top 10 consumer products companies
Sales Rank FY13 Company Name Country of Origin Region Primary Product Sector
FY13 Net Sales (US$mil)
FY13 Net Sales Growth*
FY13 Net Profit
Margin**
FY13 Return on
Assets**
2008-2013 Net Sales CAGR* ***
1 Samsung Electronics Co., Ltd. South Korea Asia/Pacific Electronic Products 210,397 13.7% 13.3% 14.2% 13.5%
2 Apple Inc. United States North America Electronic Products 170,910 9.2% 21.7% 17.9% 35.4%
3 Nestlé S.A.1 Switzerland Europe Food, Drink & Tobacco 99,485 2.7% 11.3% 8.7% n/a
4 The Procter & Gamble Company United States North America Personal Care & Household Products 83,062 -1.3% 14.2% 8.2% 1.0%
5 Sony Corporation Japan Asia/Pacific Electronic Products 66,756 17.4% -0.9% -0.4% -1.2%
6 PepsiCo, Inc. United States North America Food, Drink & Tobacco 66,415 1.4% 10.2% 8.8% 9.0%
7 Unilever GroupNetherlands and U.K.
Europe Personal Care & Household Products 66,143 -3.0% 10.6% 11.6% 4.2%
8 LG Electronics Inc. South Korea Asia/Pacific Electronic Products 53,489 14.1% 0.4% 0.6% -1.7%
9 The Coca-Cola Company United States North America Food, Drink & Tobacco 46,854 -2.4% 18.4% 9.6% 8.0%
10 JBS S.A. BrazilLatin America/ Caribbean
Food, Drink & Tobacco 43,306 22.7% 1.2% 1.6% 25.1%
Top 10 $906,818 7.7% 12.0% 9.8% 10.1%
Top 250 $3,073,118 5.6% 9.6% 8.2% 6.0%
Economic Concentration of Top 10 29.5%
Source: Published company data * Top 10 and Top 250 sales growth figures are sales-weighted, currency-adjusted composites ** Top 10 and Top 250 figures are sales-weighted composites *** Compound annual growth rate ¹Nestlé’s sales for 2010 - 2013 reflect an accounting change. Comparable sales figures for years prior to 2010 are not available.
26Global Powers of Consumer Products 2015
In 2013, JBS, the world’s biggest meat processor, moved into the Global Powers of Consumer Products top 10 for the first time. The company’s acquisition-driven growth has propelled it rapidly up the ranking since it first joined the Top 250 in 2007 at #103 after acquiring Swift & Company. This was followed by the purchase of the Smithfield Beef Group from Smithfield Foods in 2008, a major-ity stake in Pilgrim’s Pride in 2009, a merger with Grupo Bertin in 2009, as well as numerous smaller deals. In September 2013, the company completed the acquisition of Grupo Zenda and Seara Ali-mentos from Marfrig Alimentos for a total consideration of R$5.85 billion (US$2.76 billion).
Despite the acquisition spree, the company’s entry into the top 10 was made possible only because Panasonic Corporation (#4 in 2012) was excluded from consideration in 2013, making room for JBS to join the leader board. More than 70 percent of Panasonic’s total sales were derived from areas outside consumer electronics during the fiscal year ended 31 March 2014, and less than half came from the sale of consumer products as the scope of the com-pany’s activities has expanded into wide-ranging B2B sectors.
The other top 10 consumer products companies remained the same as in the prior year. However PepsiCo moved ahead of Unilever into sixth place and LG surpassed Coca-Cola to take eighth place.
The top 10 accounted for nearly 30 percent of total Top 250 net sales in 2013 as the leaders’ composite growth rate continued
to outpace the group as a whole, reaching the highest level of economic concentration since Deloitte began tracking the indus-try’s Global Powers in 2006. On a composite basis, the world’s 10 largest consumer products companies grew 7.7 percent compared with 5.6 percent for the Top 250 companies as a whole.
Still, three top 10 companies saw their sales decline in 2013. While sales from continuing operations grew modestly for P&G and Uni-lever—the two personal care and household products companies in the top 10—their total sales fell as the companies continued to divest non-core brands and businesses. In July 2013, P&G com-pleted the divestiture of its Pet Care operations to Mars, Inc. for US$2.9 billion. During 2013, Unilever sold its global Skippy peanut butter business to Hormel Foods and its Wish-Bone and Western salad dressing brands to Pinnacle Foods, among other disposals. Coca-Cola’s sales decline can be attributed to a mature soft-drinks industry in North America and Europe as well as the deconsolida-tion of the company’s Brazilian and Philippine bottling operations in 2013.
On the bottom line, the top 10 also outperformed the Top 250 with a composite net profit margin of 12.0 percent versus 9.6 percent for the entire group. Seven top 10 companies posted a double-digit net profit margin while only Sony operated at a loss.
World’s largest meat processor JBS joins top 10
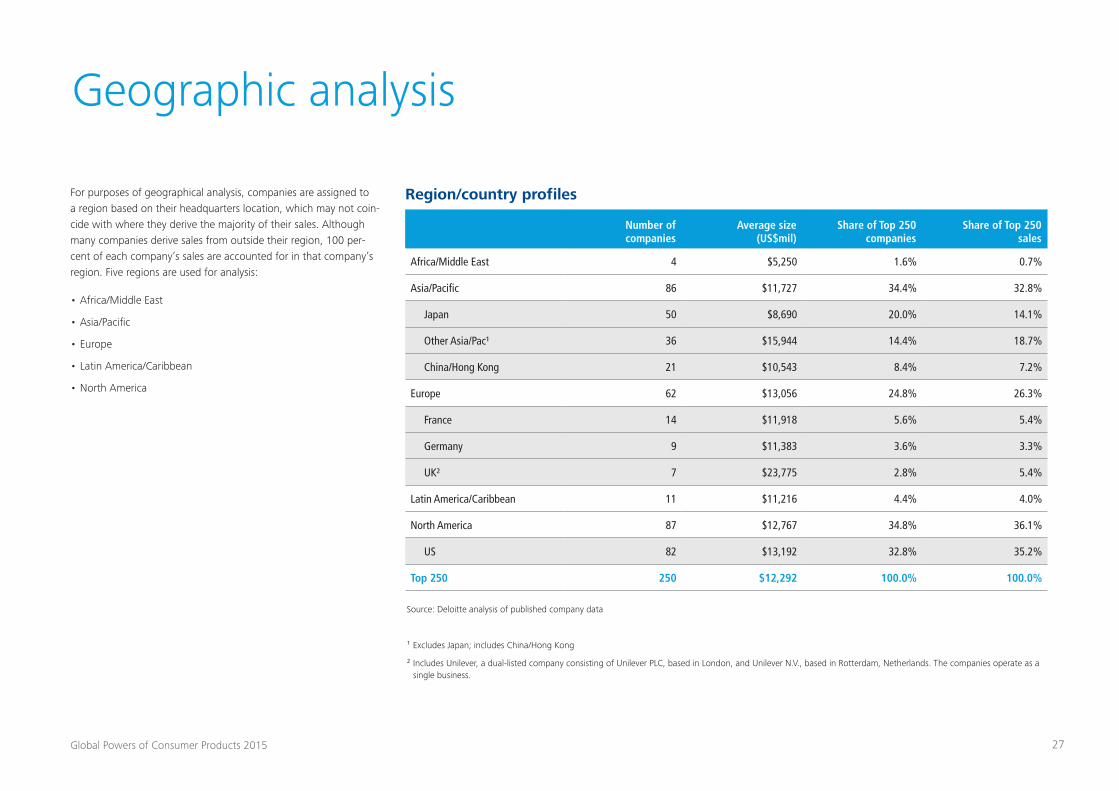
27Global Powers of Consumer Products 2015
Geographic analysis
For purposes of geographical analysis, companies are assigned to a region based on their headquarters location, which may not coin-cide with where they derive the majority of their sales. Although many companies derive sales from outside their region, 100 per-cent of each company’s sales are accounted for in that company’s region. Five regions are used for analysis:
• Africa/Middle East
• Asia/Pacific
• Europe
• Latin America/Caribbean
• North America
Region/country profiles
Source: Deloitte analysis of published company data
¹ Excludes Japan; includes China/Hong Kong
² Includes Unilever, a dual-listed company consisting of Unilever PLC, based in London, and Unilever N.V., based in Rotterdam, Netherlands. The companies operate as a single business.
Number of companies
Average size (US$mil)
Share of Top 250 companies
Share of Top 250 sales
Africa/Middle East 4 $5,250 1.6% 0.7%
Asia/Pacific 86 $11,727 34.4% 32.8%
Japan 50 $8,690 20.0% 14.1%
Other Asia/Pac¹ 36 $15,944 14.4% 18.7%
China/Hong Kong 21 $10,543 8.4% 7.2%
Europe 62 $13,056 24.8% 26.3%
France 14 $11,918 5.6% 5.4%
Germany 9 $11,383 3.6% 3.3%
UK² 7 $23,775 2.8% 5.4%
Latin America/Caribbean 11 $11,216 4.4% 4.0%
North America 87 $12,767 34.8% 36.1%
US 82 $13,192 32.8% 35.2%
Top 250 250 $12,292 100.0% 100.0%
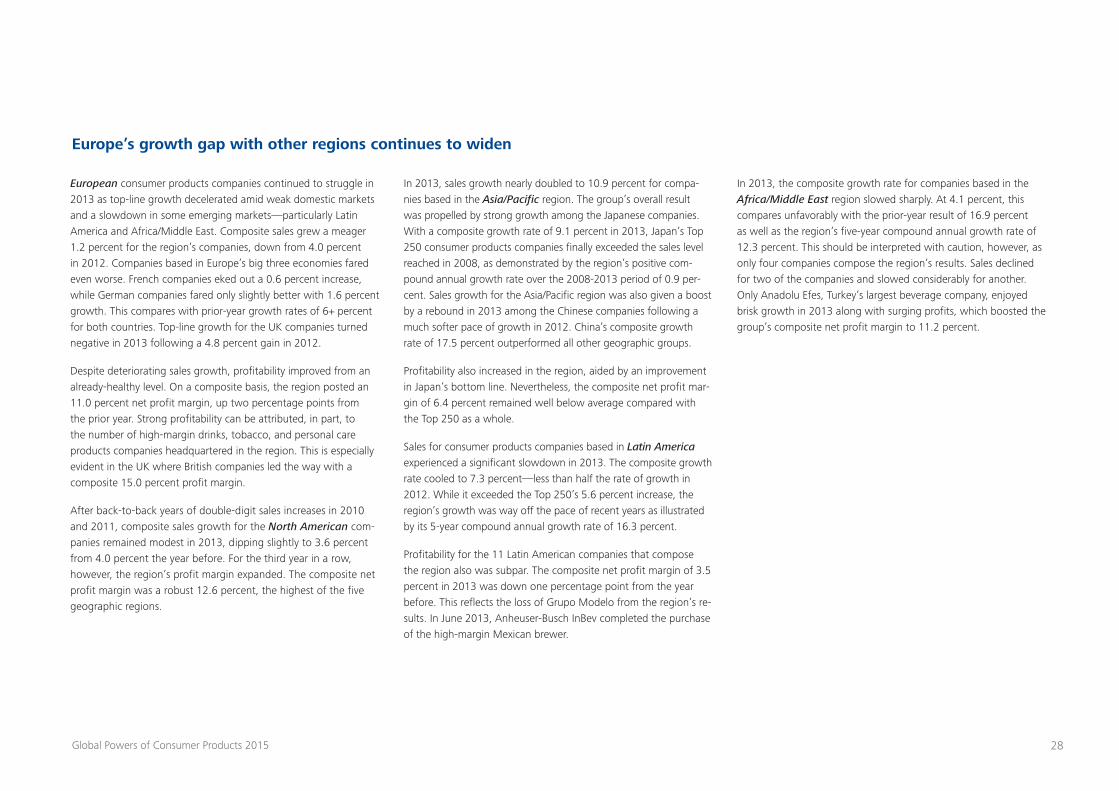
28Global Powers of Consumer Products 2015
Europe’s growth gap with other regions continues to widen
European consumer products companies continued to struggle in 2013 as top-line growth decelerated amid weak domestic markets and a slowdown in some emerging markets—particularly Latin America and Africa/Middle East. Composite sales grew a meager 1.2 percent for the region’s companies, down from 4.0 percent in 2012. Companies based in Europe’s big three economies fared even worse. French companies eked out a 0.6 percent increase, while German companies fared only slightly better with 1.6 percent growth. This compares with prior-year growth rates of 6+ percent for both countries. Top-line growth for the UK companies turned negative in 2013 following a 4.8 percent gain in 2012.
Despite deteriorating sales growth, profitability improved from an already-healthy level. On a composite basis, the region posted an 11.0 percent net profit margin, up two percentage points from the prior year. Strong profitability can be attributed, in part, to the number of high-margin drinks, tobacco, and personal care products companies headquartered in the region. This is especially evident in the UK where British companies led the way with a composite 15.0 percent profit margin.
After back-to-back years of double-digit sales increases in 2010 and 2011, composite sales growth for the North American com-panies remained modest in 2013, dipping slightly to 3.6 percent from 4.0 percent the year before. For the third year in a row, however, the region’s profit margin expanded. The composite net profit margin was a robust 12.6 percent, the highest of the five geographic regions.
In 2013, sales growth nearly doubled to 10.9 percent for compa-nies based in the Asia/Pacific region. The group’s overall result was propelled by strong growth among the Japanese companies. With a composite growth rate of 9.1 percent in 2013, Japan’s Top 250 consumer products companies finally exceeded the sales level reached in 2008, as demonstrated by the region’s positive com-pound annual growth rate over the 2008-2013 period of 0.9 per-cent. Sales growth for the Asia/Pacific region was also given a boost by a rebound in 2013 among the Chinese companies following a much softer pace of growth in 2012. China’s composite growth rate of 17.5 percent outperformed all other geographic groups.
Profitability also increased in the region, aided by an improvement in Japan’s bottom line. Nevertheless, the composite net profit mar-gin of 6.4 percent remained well below average compared with the Top 250 as a whole.
Sales for consumer products companies based in Latin America experienced a significant slowdown in 2013. The composite growth rate cooled to 7.3 percent—less than half the rate of growth in 2012. While it exceeded the Top 250’s 5.6 percent increase, the region’s growth was way off the pace of recent years as illustrated by its 5-year compound annual growth rate of 16.3 percent.
Profitability for the 11 Latin American companies that compose the region also was subpar. The composite net profit margin of 3.5 percent in 2013 was down one percentage point from the year before. This reflects the loss of Grupo Modelo from the region’s re-sults. In June 2013, Anheuser-Busch InBev completed the purchase of the high-margin Mexican brewer.
In 2013, the composite growth rate for companies based in the Africa/Middle East region slowed sharply. At 4.1 percent, this compares unfavorably with the prior-year result of 16.9 percent as well as the region’s five-year compound annual growth rate of 12.3 percent. This should be interpreted with caution, however, as only four companies compose the region’s results. Sales declined for two of the companies and slowed considerably for another. Only Anadolu Efes, Turkey’s largest beverage company, enjoyed brisk growth in 2013 along with surging profits, which boosted the group’s composite net profit margin to 11.2 percent.
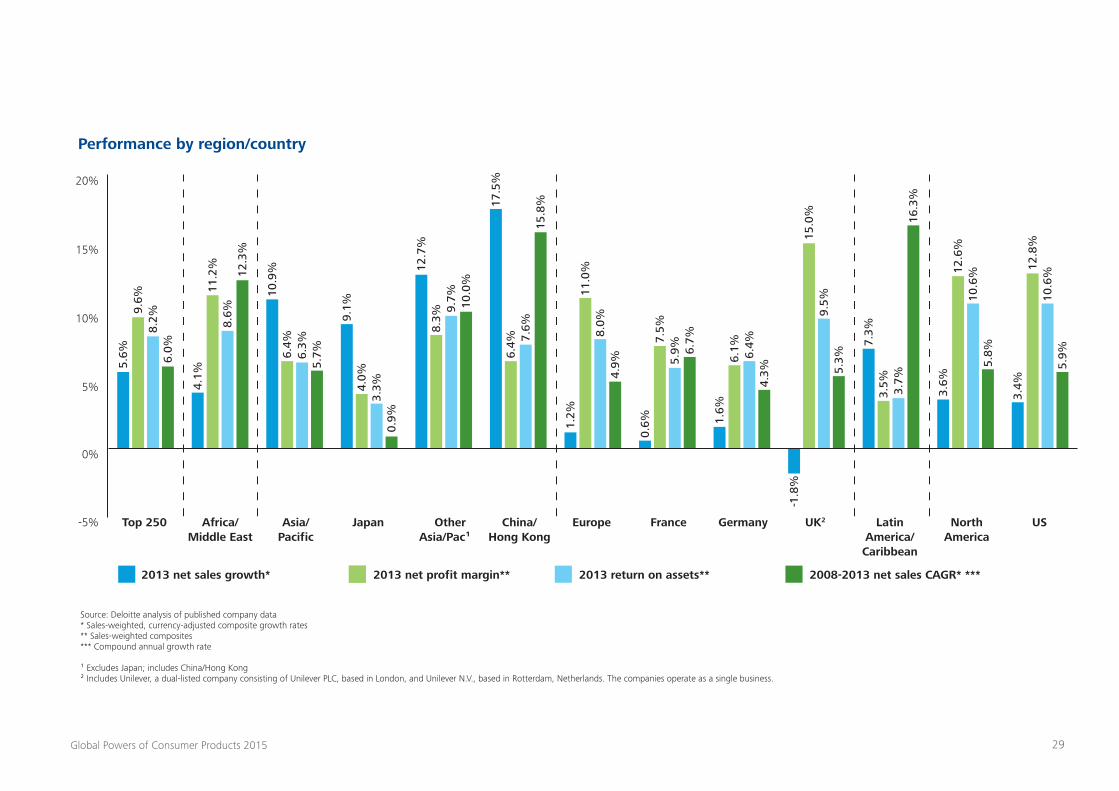
29Global Powers of Consumer Products 2015
Performance by region/country
20%
5.6%
9.6%
8.2%
6.0%
4.1%
11.2
%8.
6%12
.3%
10.9
%6.
4%6.
3%5.
7%
9.1%
12.7
%
17.5
%
8.3%
9.7% 10
.0%
6.4% 7.
6%15
.8%
11.0
%1.
2%
8.0%
4.9%
0.6%
7.5%
5.9% 6.
7%
1.6%
6.1% 6.4%
4.3%
15.0
% 16.3
%
12.6
%10
.6%
5.8%
3.4%
12.8
%10
.6%
5.9%
9.5%
5.3%
7.3%
3.5% 3.7%
3.6%
-1.8
%
4.0%
3.3%
0.9%
2013 net sales growth*
Source: Deloitte analysis of published company data * Sales-weighted, currency-adjusted composite growth rates ** Sales-weighted composites *** Compound annual growth rate ¹ Excludes Japan; includes China/Hong Kong ² Includes Unilever, a dual-listed company consisting of Unilever PLC, based in London, and Unilever N.V., based in Rotterdam, Netherlands. The companies operate as a single business.
2013 net profit margin** 2013 return on assets** 2008-2013 net sales CAGR* ***
15%
10%
5%
-5%
0%
Top 250 Africa/ Middle East
Asia/ Pacific
Japan Other Asia/Pac¹
China/ Hong Kong
Europe France Germany Latin America/ Caribbean
North America
USUK2
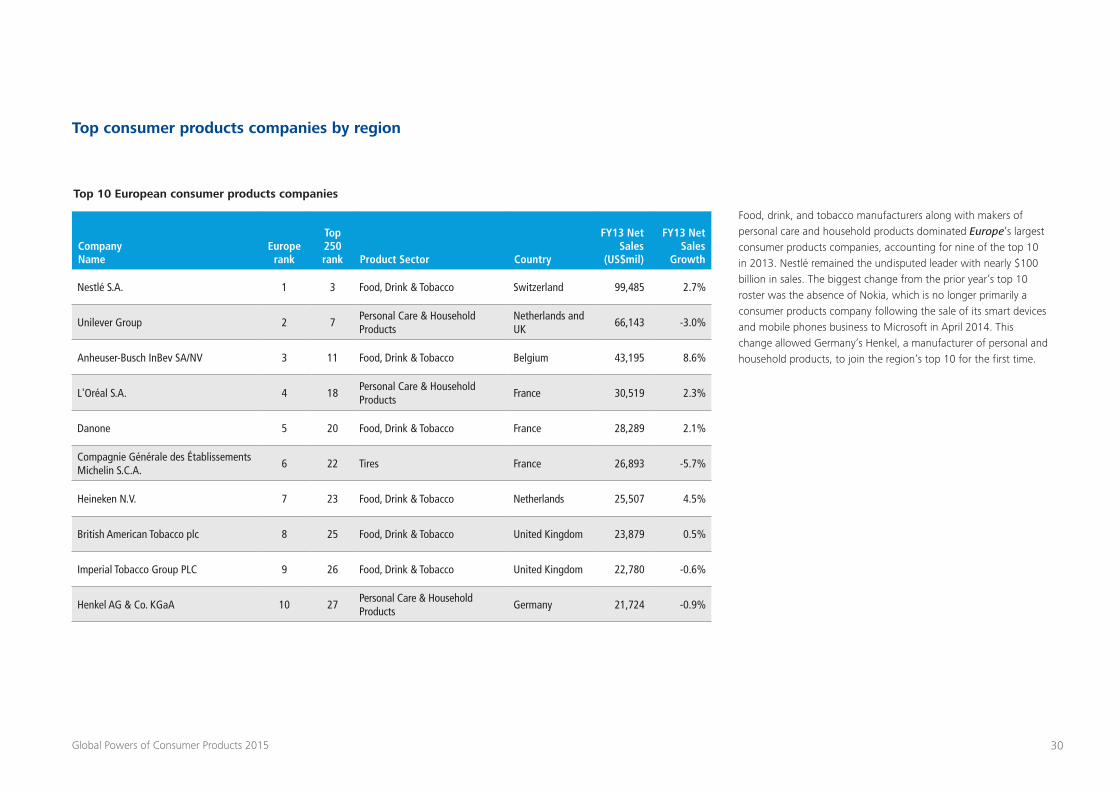
30Global Powers of Consumer Products 2015
Top consumer products companies by region
Company Name
Europe rank
Top 250 rank Product Sector Country
FY13 Net Sales
(US$mil)
FY13 Net Sales
Growth
Nestlé S.A. 1 3 Food, Drink & Tobacco Switzerland 99,485 2.7%
Unilever Group 2 7Personal Care & Household Products
Netherlands and UK
66,143 -3.0%
Anheuser-Busch InBev SA/NV 3 11 Food, Drink & Tobacco Belgium 43,195 8.6%
L'Oréal S.A. 4 18Personal Care & Household Products
France 30,519 2.3%
Danone 5 20 Food, Drink & Tobacco France 28,289 2.1%
Compagnie Générale des Établissements Michelin S.C.A.
6 22 Tires France 26,893 -5.7%
Heineken N.V. 7 23 Food, Drink & Tobacco Netherlands 25,507 4.5%
British American Tobacco plc 8 25 Food, Drink & Tobacco United Kingdom 23,879 0.5%
Imperial Tobacco Group PLC 9 26 Food, Drink & Tobacco United Kingdom 22,780 -0.6%
Henkel AG & Co. KGaA 10 27Personal Care & Household Products
Germany 21,724 -0.9%
Top 10 European consumer products companies
Food, drink, and tobacco manufacturers along with makers of personal care and household products dominated Europe’s largest consumer products companies, accounting for nine of the top 10 in 2013. Nestlé remained the undisputed leader with nearly $100 billion in sales. The biggest change from the prior year’s top 10 roster was the absence of Nokia, which is no longer primarily a consumer products company following the sale of its smart devices and mobile phones business to Microsoft in April 2014. This change allowed Germany’s Henkel, a manufacturer of personal and household products, to join the region’s top 10 for the first time.
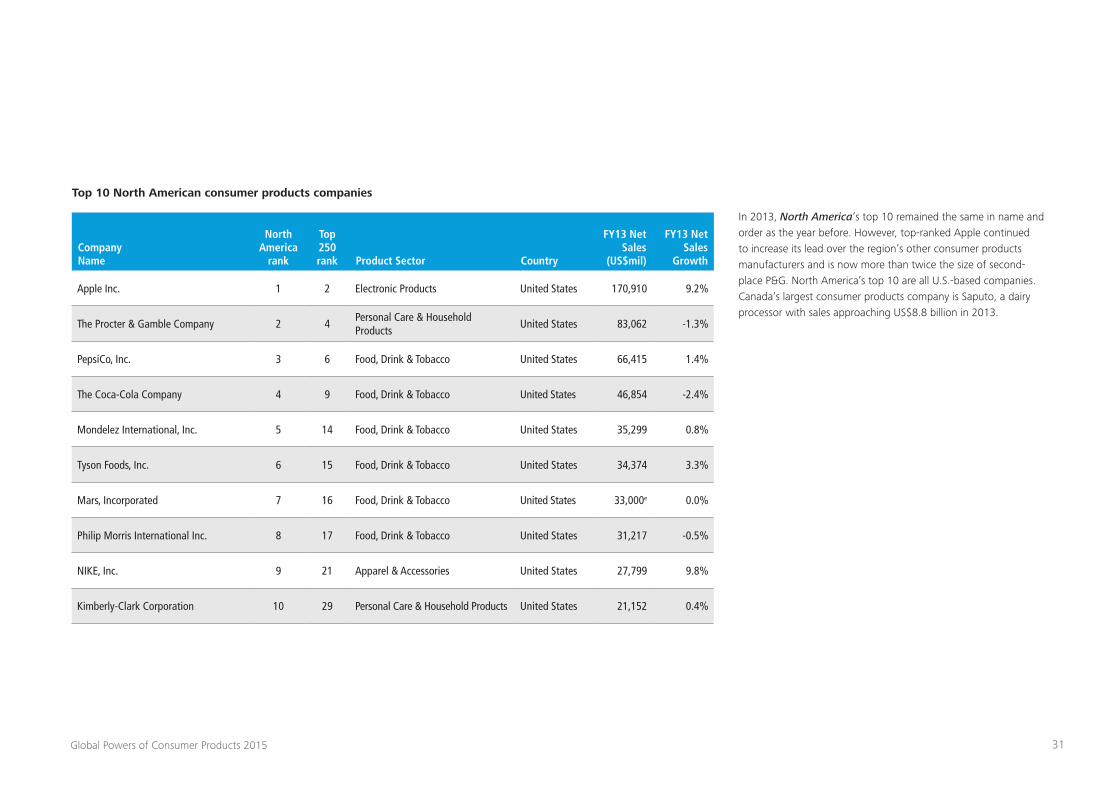
31Global Powers of Consumer Products 2015
Company Name
North America
rank
Top 250 rank Product Sector Country
FY13 Net Sales
(US$mil)
FY13 Net Sales
Growth
Apple Inc. 1 2 Electronic Products United States 170,910 9.2%
The Procter & Gamble Company 2 4Personal Care & Household Products
United States 83,062 -1.3%
PepsiCo, Inc. 3 6 Food, Drink & Tobacco United States 66,415 1.4%
The Coca-Cola Company 4 9 Food, Drink & Tobacco United States 46,854 -2.4%
Mondelez International, Inc. 5 14 Food, Drink & Tobacco United States 35,299 0.8%
Tyson Foods, Inc. 6 15 Food, Drink & Tobacco United States 34,374 3.3%
Mars, Incorporated 7 16 Food, Drink & Tobacco United States 33,000e 0.0%
Philip Morris International Inc. 8 17 Food, Drink & Tobacco United States 31,217 -0.5%
NIKE, Inc. 9 21 Apparel & Accessories United States 27,799 9.8%
Kimberly-Clark Corporation 10 29 Personal Care & Household Products United States 21,152 0.4%
Top 10 North American consumer products companies
In 2013, North America’s top 10 remained the same in name and order as the year before. However, top-ranked Apple continued to increase its lead over the region’s other consumer products manufacturers and is now more than twice the size of second-place P&G. North America’s top 10 are all U.S.-based companies. Canada’s largest consumer products company is Saputo, a dairy processor with sales approaching US$8.8 billion in 2013.
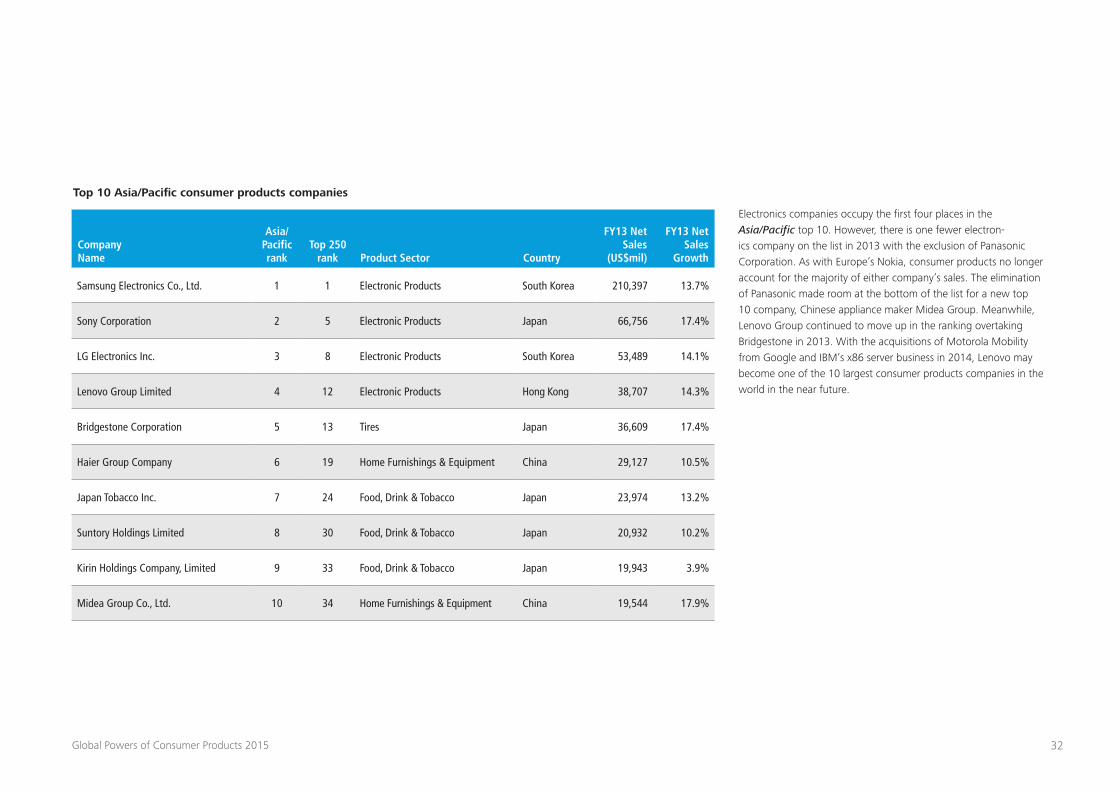
32Global Powers of Consumer Products 2015
Company Name
Asia/Pacific rank
Top 250 rank Product Sector Country
FY13 Net Sales
(US$mil)
FY13 Net Sales
Growth
Samsung Electronics Co., Ltd. 1 1 Electronic Products South Korea 210,397 13.7%
Sony Corporation 2 5 Electronic Products Japan 66,756 17.4%
LG Electronics Inc. 3 8 Electronic Products South Korea 53,489 14.1%
Lenovo Group Limited 4 12 Electronic Products Hong Kong 38,707 14.3%
Bridgestone Corporation 5 13 Tires Japan 36,609 17.4%
Haier Group Company 6 19 Home Furnishings & Equipment China 29,127 10.5%
Japan Tobacco Inc. 7 24 Food, Drink & Tobacco Japan 23,974 13.2%
Suntory Holdings Limited 8 30 Food, Drink & Tobacco Japan 20,932 10.2%
Kirin Holdings Company, Limited 9 33 Food, Drink & Tobacco Japan 19,943 3.9%
Midea Group Co., Ltd. 10 34 Home Furnishings & Equipment China 19,544 17.9%
Top 10 Asia/Pacific consumer products companies
Electronics companies occupy the first four places in the Asia/Pacific top 10. However, there is one fewer electron-ics company on the list in 2013 with the exclusion of Panasonic Corporation. As with Europe’s Nokia, consumer products no longer account for the majority of either company’s sales. The elimination of Panasonic made room at the bottom of the list for a new top 10 company, Chinese appliance maker Midea Group. Meanwhile, Lenovo Group continued to move up in the ranking overtaking Bridgestone in 2013. With the acquisitions of Motorola Mobility from Google and IBM’s x86 server business in 2014, Lenovo may become one of the 10 largest consumer products companies in the world in the near future.
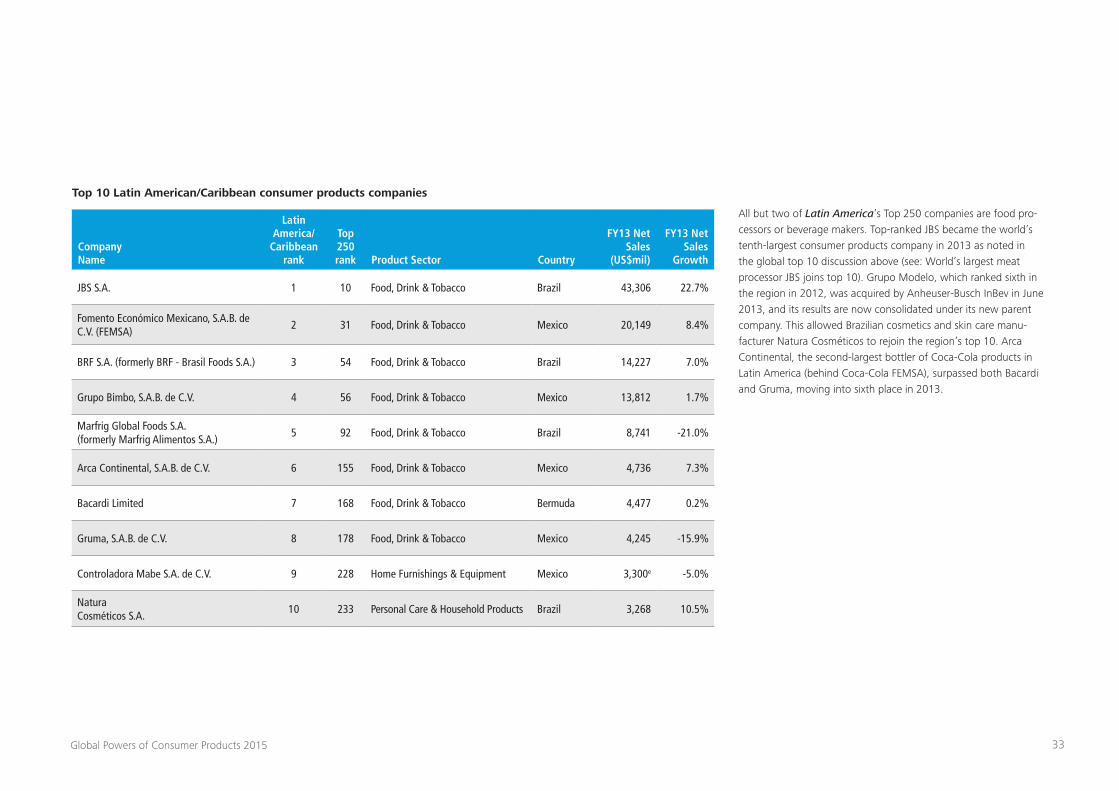
33Global Powers of Consumer Products 2015
Company Name
Latin America/
Caribbean rank
Top 250 rank Product Sector Country
FY13 Net Sales
(US$mil)
FY13 Net Sales
Growth
JBS S.A. 1 10 Food, Drink & Tobacco Brazil 43,306 22.7%
Fomento Económico Mexicano, S.A.B. de C.V. (FEMSA)
2 31 Food, Drink & Tobacco Mexico 20,149 8.4%
BRF S.A. (formerly BRF - Brasil Foods S.A.) 3 54 Food, Drink & Tobacco Brazil 14,227 7.0%
Grupo Bimbo, S.A.B. de C.V. 4 56 Food, Drink & Tobacco Mexico 13,812 1.7%
Marfrig Global Foods S.A. (formerly Marfrig Alimentos S.A.)
5 92 Food, Drink & Tobacco Brazil 8,741 -21.0%
Arca Continental, S.A.B. de C.V. 6 155 Food, Drink & Tobacco Mexico 4,736 7.3%
Bacardi Limited 7 168 Food, Drink & Tobacco Bermuda 4,477 0.2%
Gruma, S.A.B. de C.V. 8 178 Food, Drink & Tobacco Mexico 4,245 -15.9%
Controladora Mabe S.A. de C.V. 9 228 Home Furnishings & Equipment Mexico 3,300e -5.0%
Natura Cosméticos S.A.
10 233 Personal Care & Household Products Brazil 3,268 10.5%
Top 10 Latin American/Caribbean consumer products companies
All but two of Latin America’s Top 250 companies are food pro-cessors or beverage makers. Top-ranked JBS became the world’s tenth-largest consumer products company in 2013 as noted in the global top 10 discussion above (see: World’s largest meat processor JBS joins top 10). Grupo Modelo, which ranked sixth in the region in 2012, was acquired by Anheuser-Busch InBev in June 2013, and its results are now consolidated under its new parent company. This allowed Brazilian cosmetics and skin care manu-facturer Natura Cosméticos to rejoin the region’s top 10. Arca Continental, the second-largest bottler of Coca-Cola products in Latin America (behind Coca-Cola FEMSA), surpassed both Bacardi and Gruma, moving into sixth place in 2013.
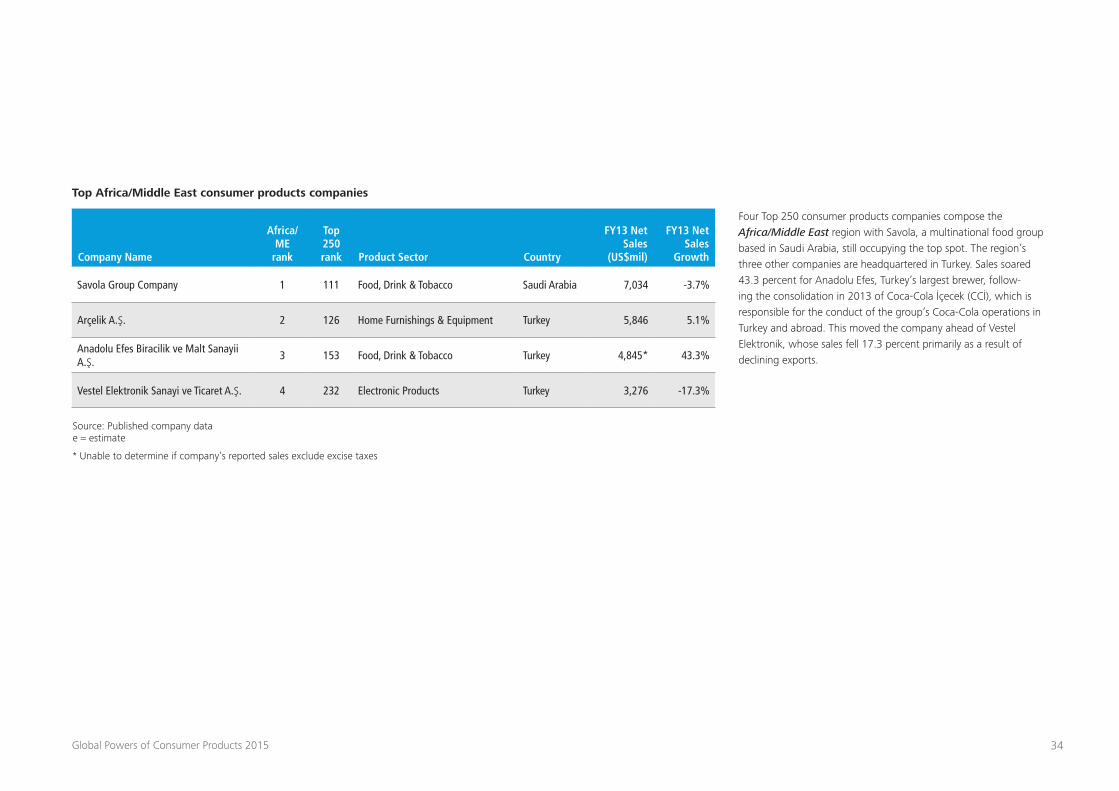
34Global Powers of Consumer Products 2015
Company Name
Africa/ME
rank
Top 250 rank Product Sector Country
FY13 Net Sales
(US$mil)
FY13 Net Sales
Growth
Savola Group Company 1 111 Food, Drink & Tobacco Saudi Arabia 7,034 -3.7%
Arçelik A.Ş. 2 126 Home Furnishings & Equipment Turkey 5,846 5.1%
Anadolu Efes Biracilik ve Malt Sanayii A.Ş.
3 153 Food, Drink & Tobacco Turkey 4,845* 43.3%
Vestel Elektronik Sanayi ve Ticaret A.Ş. 4 232 Electronic Products Turkey 3,276 -17.3%
Top Africa/Middle East consumer products companies
Source: Published company data e = estimate
* Unable to determine if company’s reported sales exclude excise taxes
Four Top 250 consumer products companies compose the Africa/Middle East region with Savola, a multinational food group based in Saudi Arabia, still occupying the top spot. The region’s three other companies are headquartered in Turkey. Sales soared 43.3 percent for Anadolu Efes, Turkey’s largest brewer, follow-ing the consolidation in 2013 of Coca-Cola İçecek (CCİ), which is responsible for the conduct of the group’s Coca-Cola operations in Turkey and abroad. This moved the company ahead of Vestel Elektronik, whose sales fell 17.3 percent primarily as a result of declining exports.
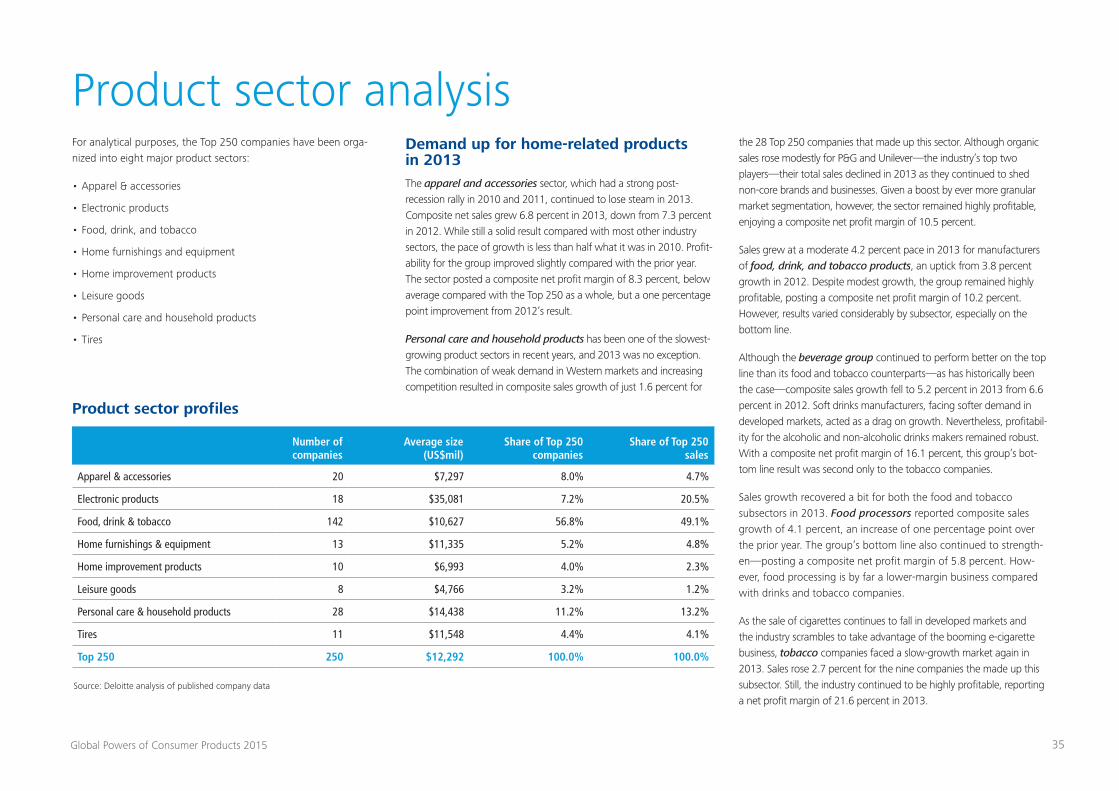
35Global Powers of Consumer Products 2015
Product sector analysisFor analytical purposes, the Top 250 companies have been orga-nized into eight major product sectors:
• Apparel & accessories
• Electronic products
• Food, drink, and tobacco
• Home furnishings and equipment
• Home improvement products
• Leisure goods
• Personal care and household products
• Tires
Product sector profiles
Source: Deloitte analysis of published company data
Number of companies
Average size (US$mil)
Share of Top 250 companies
Share of Top 250 sales
Apparel & accessories 20 $7,297 8.0% 4.7%
Electronic products 18 $35,081 7.2% 20.5%
Food, drink & tobacco 142 $10,627 56.8% 49.1%
Home furnishings & equipment 13 $11,335 5.2% 4.8%
Home improvement products 10 $6,993 4.0% 2.3%
Leisure goods 8 $4,766 3.2% 1.2%
Personal care & household products 28 $14,438 11.2% 13.2%
Tires 11 $11,548 4.4% 4.1%
Top 250 250 $12,292 100.0% 100.0%
Demand up for home-related products in 2013The apparel and accessories sector, which had a strong post-recession rally in 2010 and 2011, continued to lose steam in 2013. Composite net sales grew 6.8 percent in 2013, down from 7.3 percent in 2012. While still a solid result compared with most other industry sectors, the pace of growth is less than half what it was in 2010. Profit-ability for the group improved slightly compared with the prior year. The sector posted a composite net profit margin of 8.3 percent, below average compared with the Top 250 as a whole, but a one percentage point improvement from 2012’s result.
Personal care and household products has been one of the slowest-growing product sectors in recent years, and 2013 was no exception. The combination of weak demand in Western markets and increasing competition resulted in composite sales growth of just 1.6 percent for
the 28 Top 250 companies that made up this sector. Although organic sales rose modestly for P&G and Unilever—the industry’s top two players—their total sales declined in 2013 as they continued to shed non-core brands and businesses. Given a boost by ever more granular market segmentation, however, the sector remained highly profitable, enjoying a composite net profit margin of 10.5 percent.
Sales grew at a moderate 4.2 percent pace in 2013 for manufacturers of food, drink, and tobacco products, an uptick from 3.8 percent growth in 2012. Despite modest growth, the group remained highly profitable, posting a composite net profit margin of 10.2 percent. However, results varied considerably by subsector, especially on the bottom line.
Although the beverage group continued to perform better on the top line than its food and tobacco counterparts—as has historically been the case—composite sales growth fell to 5.2 percent in 2013 from 6.6 percent in 2012. Soft drinks manufacturers, facing softer demand in developed markets, acted as a drag on growth. Nevertheless, profitabil-ity for the alcoholic and non-alcoholic drinks makers remained robust. With a composite net profit margin of 16.1 percent, this group’s bot-tom line result was second only to the tobacco companies.
Sales growth recovered a bit for both the food and tobacco subsectors in 2013. Food processors reported composite sales growth of 4.1 percent, an increase of one percentage point over the prior year. The group’s bottom line also continued to strength-en—posting a composite net profit margin of 5.8 percent. How-ever, food processing is by far a lower-margin business compared with drinks and tobacco companies.
As the sale of cigarettes continues to fall in developed markets and the industry scrambles to take advantage of the booming e-cigarette business, tobacco companies faced a slow-growth market again in 2013. Sales rose 2.7 percent for the nine companies the made up this subsector. Still, the industry continued to be highly profitable, reporting a net profit margin of 21.6 percent in 2013.
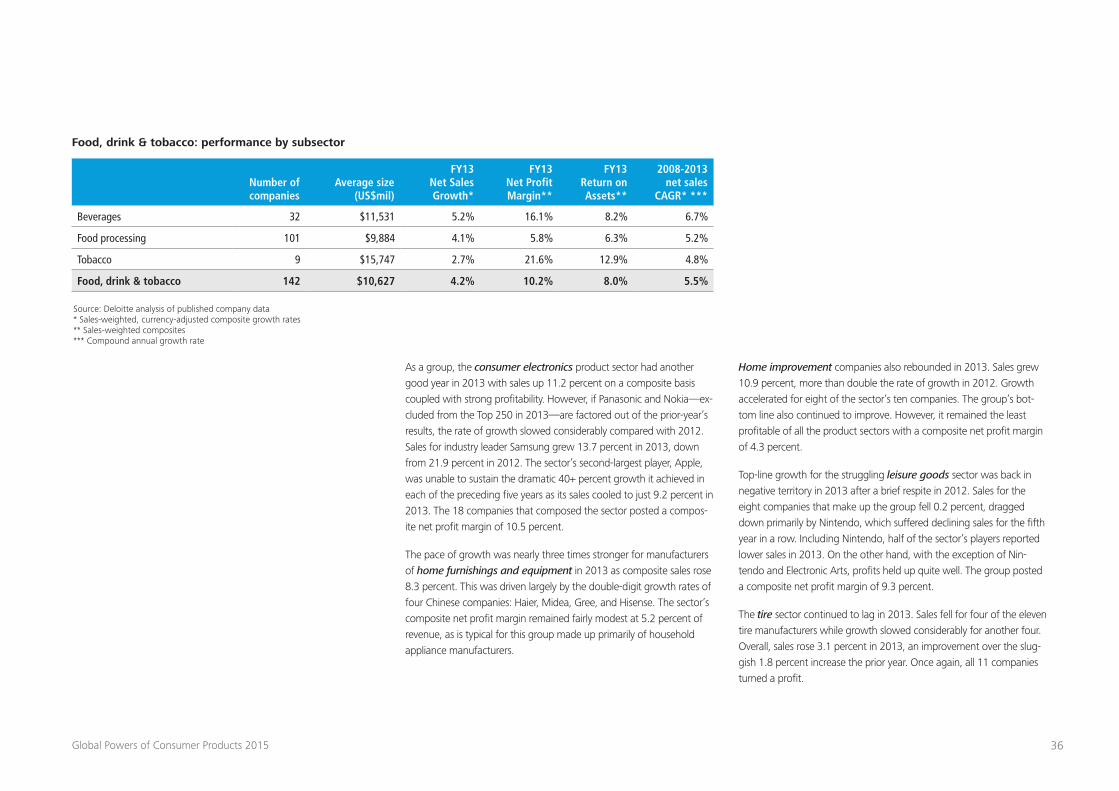
36Global Powers of Consumer Products 2015
Food, drink & tobacco: performance by subsector
Source: Deloitte analysis of published company data* Sales-weighted, currency-adjusted composite growth rates** Sales-weighted composites*** Compound annual growth rate
Number of companies
Average size (US$mil)
FY13 Net Sales Growth*
FY13 Net Profit Margin**
FY13 Return on Assets**
2008-2013 net sales
CAGR* ***
Beverages 32 $11,531 5.2% 16.1% 8.2% 6.7%
Food processing 101 $9,884 4.1% 5.8% 6.3% 5.2%
Tobacco 9 $15,747 2.7% 21.6% 12.9% 4.8%
Food, drink & tobacco 142 $10,627 4.2% 10.2% 8.0% 5.5%
As a group, the consumer electronics product sector had another good year in 2013 with sales up 11.2 percent on a composite basis coupled with strong profitability. However, if Panasonic and Nokia—ex-cluded from the Top 250 in 2013—are factored out of the prior-year’s results, the rate of growth slowed considerably compared with 2012. Sales for industry leader Samsung grew 13.7 percent in 2013, down from 21.9 percent in 2012. The sector’s second-largest player, Apple, was unable to sustain the dramatic 40+ percent growth it achieved in each of the preceding five years as its sales cooled to just 9.2 percent in 2013. The 18 companies that composed the sector posted a compos-ite net profit margin of 10.5 percent.
The pace of growth was nearly three times stronger for manufacturers of home furnishings and equipment in 2013 as composite sales rose 8.3 percent. This was driven largely by the double-digit growth rates of four Chinese companies: Haier, Midea, Gree, and Hisense. The sector’s composite net profit margin remained fairly modest at 5.2 percent of revenue, as is typical for this group made up primarily of household appliance manufacturers.
Home improvement companies also rebounded in 2013. Sales grew 10.9 percent, more than double the rate of growth in 2012. Growth accelerated for eight of the sector’s ten companies. The group’s bot-tom line also continued to improve. However, it remained the least profitable of all the product sectors with a composite net profit margin of 4.3 percent.
Top-line growth for the struggling leisure goods sector was back in negative territory in 2013 after a brief respite in 2012. Sales for the eight companies that make up the group fell 0.2 percent, dragged down primarily by Nintendo, which suffered declining sales for the fifth year in a row. Including Nintendo, half of the sector’s players reported lower sales in 2013. On the other hand, with the exception of Nin-tendo and Electronic Arts, profits held up quite well. The group posted a composite net profit margin of 9.3 percent.
The tire sector continued to lag in 2013. Sales fell for four of the eleven tire manufacturers while growth slowed considerably for another four. Overall, sales rose 3.1 percent in 2013, an improvement over the slug-gish 1.8 percent increase the prior year. Once again, all 11 companies turned a profit.
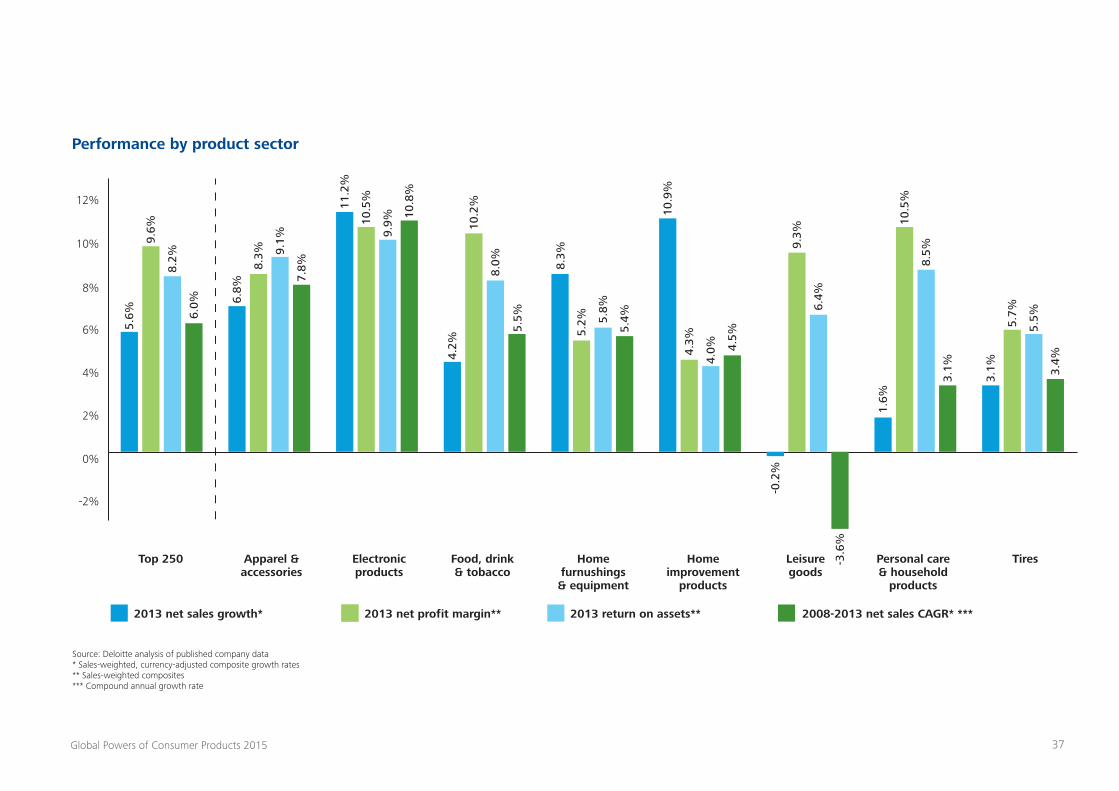
37Global Powers of Consumer Products 2015
Performance by product sector
Source: Deloitte analysis of published company data* Sales-weighted, currency-adjusted composite growth rates** Sales-weighted composites*** Compound annual growth rate
12%
5.6%
9.6%
8.2%
6.0% 6.
8%
8.3% 9.
1%
7.8%
11.2
%
10.5
%
9.9%
10.8
%
4.2%
10.2
%
8.0%
5.5%
8.3%
5.2% 5.
8%
5.4%
10.9
%
4.3%
4.0% 4.
5%
9.3%
6.4%
10.5
%
8.5%
1.6%
3.1%
3.1%
5.7%
5.5%
3.4%
-0.2
%
-3.6
%
2013 net sales growth* 2013 net profit margin** 2013 return on assets** 2008-2013 net sales CAGR* ***
10%
6%
8%
4%
2%
-2%
0%
Top 250 Apparel & accessories
Electronic products
Food, drink & tobacco
Home furnushings & equipment
Home improvement
products
Personal care & household
products
TiresLeisure goods
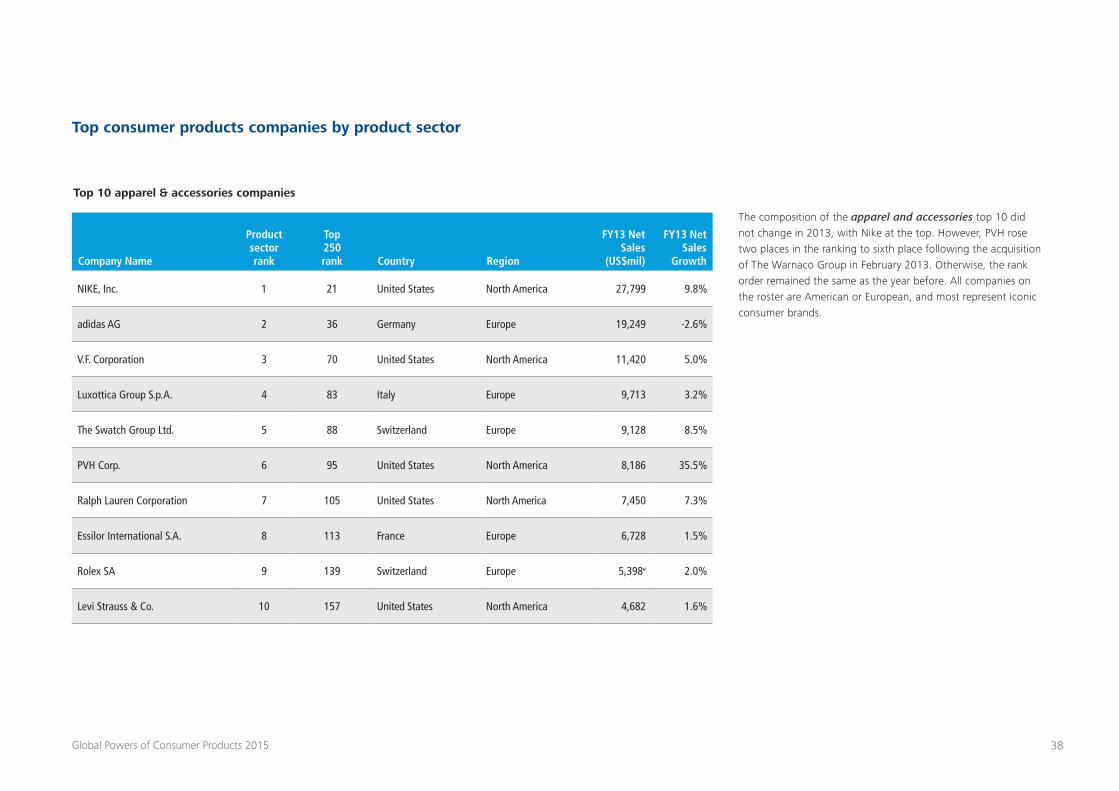
38Global Powers of Consumer Products 2015
Top consumer products companies by product sector
Company Name
Product sector rank
Top 250 rank Country Region
FY13 Net Sales
(US$mil)
FY13 Net Sales
Growth
NIKE, Inc. 1 21 United States North America 27,799 9.8%
adidas AG 2 36 Germany Europe 19,249 -2.6%
V.F. Corporation 3 70 United States North America 11,420 5.0%
Luxottica Group S.p.A. 4 83 Italy Europe 9,713 3.2%
The Swatch Group Ltd. 5 88 Switzerland Europe 9,128 8.5%
PVH Corp. 6 95 United States North America 8,186 35.5%
Ralph Lauren Corporation 7 105 United States North America 7,450 7.3%
Essilor International S.A. 8 113 France Europe 6,728 1.5%
Rolex SA 9 139 Switzerland Europe 5,398e 2.0%
Levi Strauss & Co. 10 157 United States North America 4,682 1.6%
Top 10 apparel & accessories companies
The composition of the apparel and accessories top 10 did not change in 2013, with Nike at the top. However, PVH rose two places in the ranking to sixth place following the acquisition of The Warnaco Group in February 2013. Otherwise, the rank order remained the same as the year before. All companies on the roster are American or European, and most represent iconic consumer brands.
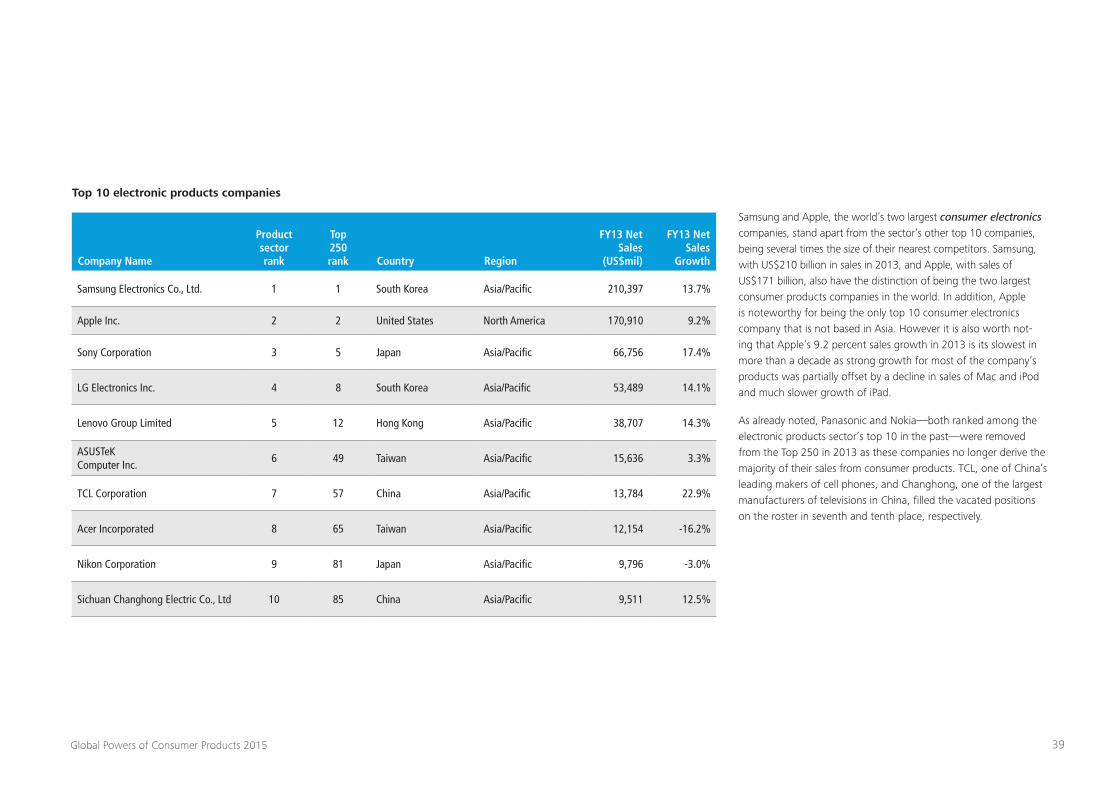
39Global Powers of Consumer Products 2015
Company Name
Product sector rank
Top 250 rank Country Region
FY13 Net Sales
(US$mil)
FY13 Net Sales
Growth
Samsung Electronics Co., Ltd. 1 1 South Korea Asia/Pacific 210,397 13.7%
Apple Inc. 2 2 United States North America 170,910 9.2%
Sony Corporation 3 5 Japan Asia/Pacific 66,756 17.4%
LG Electronics Inc. 4 8 South Korea Asia/Pacific 53,489 14.1%
Lenovo Group Limited 5 12 Hong Kong Asia/Pacific 38,707 14.3%
ASUSTeK Computer Inc.
6 49 Taiwan Asia/Pacific 15,636 3.3%
TCL Corporation 7 57 China Asia/Pacific 13,784 22.9%
Acer Incorporated 8 65 Taiwan Asia/Pacific 12,154 -16.2%
Nikon Corporation 9 81 Japan Asia/Pacific 9,796 -3.0%
Sichuan Changhong Electric Co., Ltd 10 85 China Asia/Pacific 9,511 12.5%
Top 10 electronic products companies
Samsung and Apple, the world’s two largest consumer electronics companies, stand apart from the sector’s other top 10 companies, being several times the size of their nearest competitors. Samsung, with US$210 billion in sales in 2013, and Apple, with sales of US$171 billion, also have the distinction of being the two largest consumer products companies in the world. In addition, Apple is noteworthy for being the only top 10 consumer electronics company that is not based in Asia. However it is also worth not-ing that Apple’s 9.2 percent sales growth in 2013 is its slowest in more than a decade as strong growth for most of the company’s products was partially offset by a decline in sales of Mac and iPod and much slower growth of iPad.
As already noted, Panasonic and Nokia—both ranked among the electronic products sector’s top 10 in the past—were removed from the Top 250 in 2013 as these companies no longer derive the majority of their sales from consumer products. TCL, one of China’s leading makers of cell phones, and Changhong, one of the largest manufacturers of televisions in China, filled the vacated positions on the roster in seventh and tenth place, respectively.
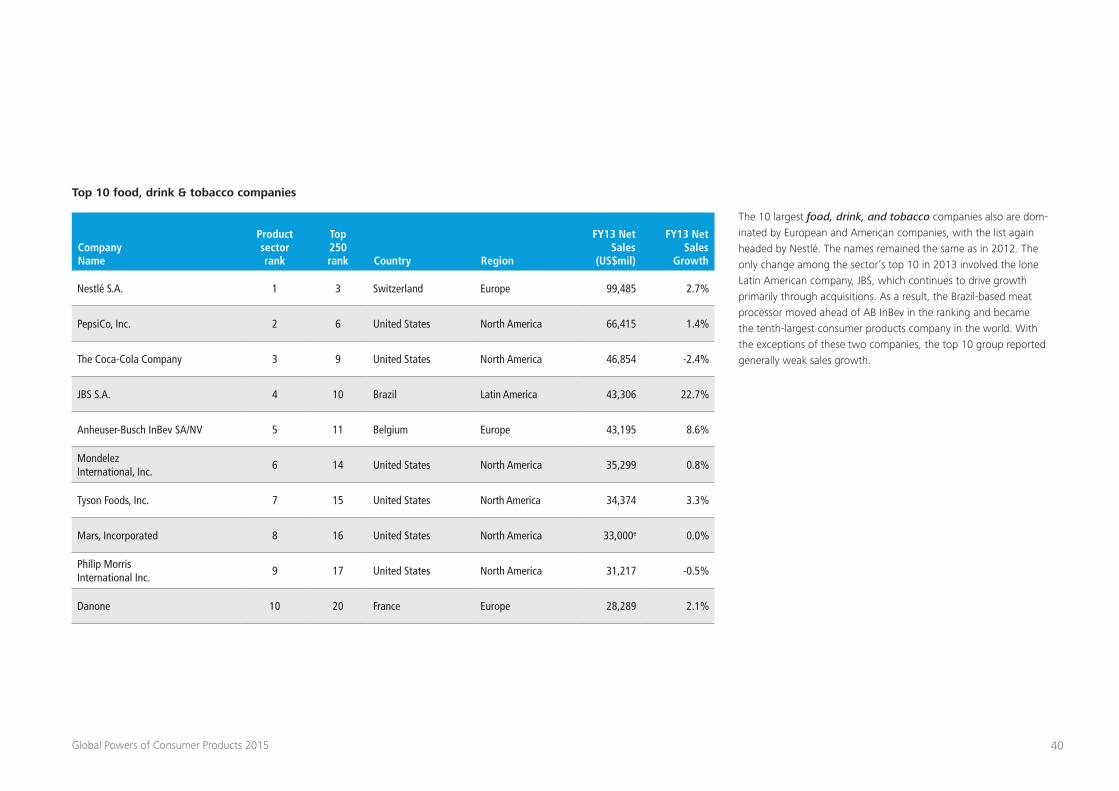
40Global Powers of Consumer Products 2015
Company Name
Product sector rank
Top 250 rank Country Region
FY13 Net Sales
(US$mil)
FY13 Net Sales
Growth
Nestlé S.A. 1 3 Switzerland Europe 99,485 2.7%
PepsiCo, Inc. 2 6 United States North America 66,415 1.4%
The Coca-Cola Company 3 9 United States North America 46,854 -2.4%
JBS S.A. 4 10 Brazil Latin America 43,306 22.7%
Anheuser-Busch InBev SA/NV 5 11 Belgium Europe 43,195 8.6%
Mondelez International, Inc.
6 14 United States North America 35,299 0.8%
Tyson Foods, Inc. 7 15 United States North America 34,374 3.3%
Mars, Incorporated 8 16 United States North America 33,000e 0.0%
Philip Morris International Inc.
9 17 United States North America 31,217 -0.5%
Danone 10 20 France Europe 28,289 2.1%
Top 10 food, drink & tobacco companies
The 10 largest food, drink, and tobacco companies also are dom-inated by European and American companies, with the list again headed by Nestlé. The names remained the same as in 2012. The only change among the sector’s top 10 in 2013 involved the lone Latin American company, JBS, which continues to drive growth primarily through acquisitions. As a result, the Brazil-based meat processor moved ahead of AB InBev in the ranking and became the tenth-largest consumer products company in the world. With the exceptions of these two companies, the top 10 group reported generally weak sales growth.
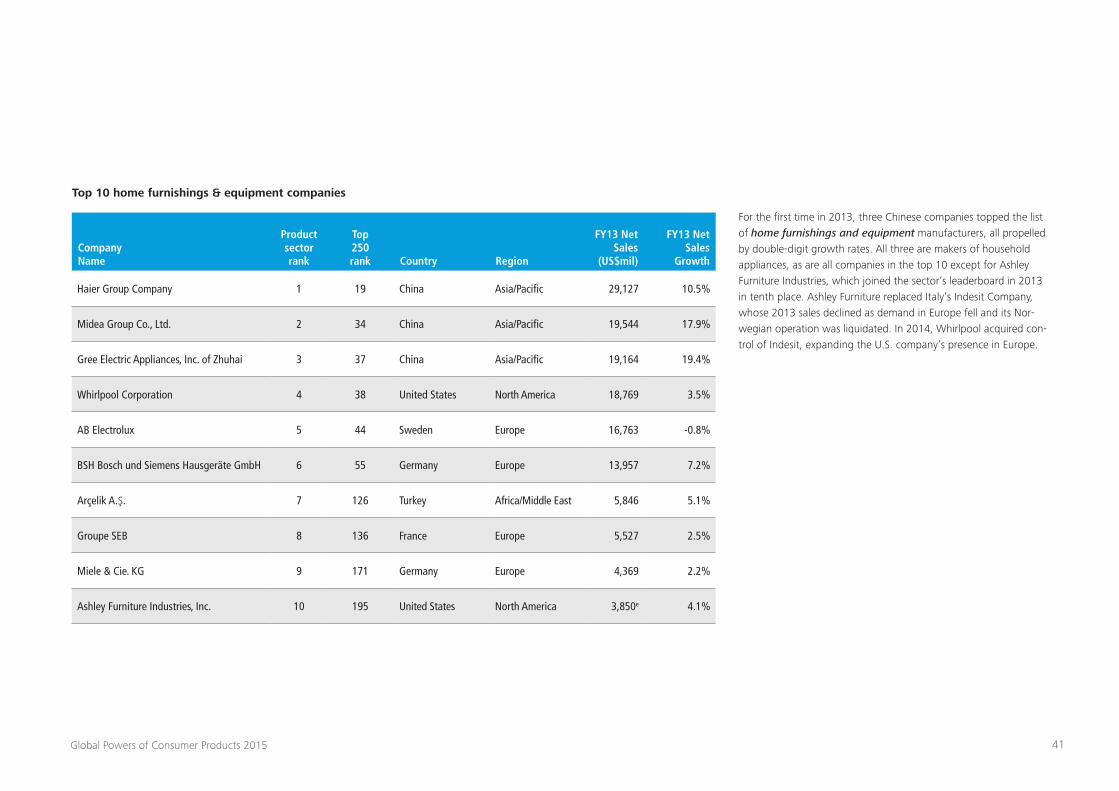
41Global Powers of Consumer Products 2015
Company Name
Product sector rank
Top 250 rank Country Region
FY13 Net Sales
(US$mil)
FY13 Net Sales
Growth
Haier Group Company 1 19 China Asia/Pacific 29,127 10.5%
Midea Group Co., Ltd. 2 34 China Asia/Pacific 19,544 17.9%
Gree Electric Appliances, Inc. of Zhuhai 3 37 China Asia/Pacific 19,164 19.4%
Whirlpool Corporation 4 38 United States North America 18,769 3.5%
AB Electrolux 5 44 Sweden Europe 16,763 -0.8%
BSH Bosch und Siemens Hausgeräte GmbH 6 55 Germany Europe 13,957 7.2%
Arçelik A.Ş. 7 126 Turkey Africa/Middle East 5,846 5.1%
Groupe SEB 8 136 France Europe 5,527 2.5%
Miele & Cie. KG 9 171 Germany Europe 4,369 2.2%
Ashley Furniture Industries, Inc. 10 195 United States North America 3,850e 4.1%
Top 10 home furnishings & equipment companies
For the first time in 2013, three Chinese companies topped the list of home furnishings and equipment manufacturers, all propelled by double-digit growth rates. All three are makers of household appliances, as are all companies in the top 10 except for Ashley Furniture Industries, which joined the sector’s leaderboard in 2013 in tenth place. Ashley Furniture replaced Italy’s Indesit Company, whose 2013 sales declined as demand in Europe fell and its Nor-wegian operation was liquidated. In 2014, Whirlpool acquired con-trol of Indesit, expanding the U.S. company’s presence in Europe.
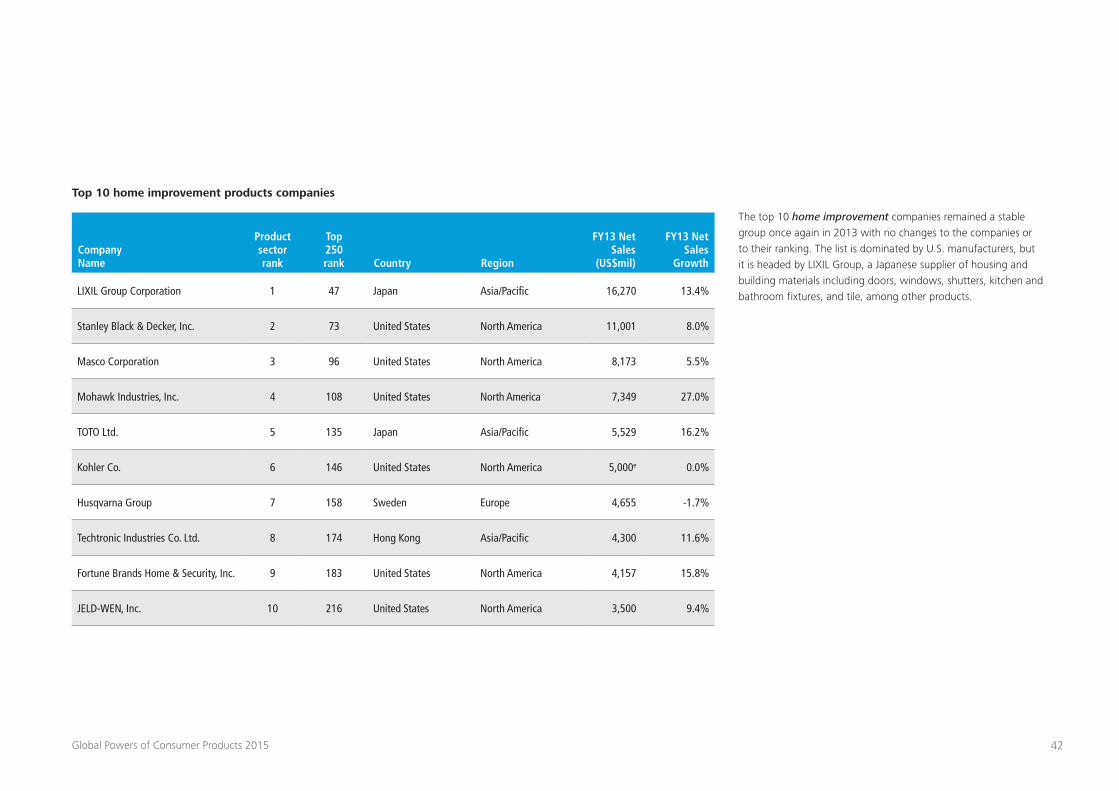
42Global Powers of Consumer Products 2015
Company Name
Product sector rank
Top 250 rank Country Region
FY13 Net Sales
(US$mil)
FY13 Net Sales
Growth
LIXIL Group Corporation 1 47 Japan Asia/Pacific 16,270 13.4%
Stanley Black & Decker, Inc. 2 73 United States North America 11,001 8.0%
Masco Corporation 3 96 United States North America 8,173 5.5%
Mohawk Industries, Inc. 4 108 United States North America 7,349 27.0%
TOTO Ltd. 5 135 Japan Asia/Pacific 5,529 16.2%
Kohler Co. 6 146 United States North America 5,000e 0.0%
Husqvarna Group 7 158 Sweden Europe 4,655 -1.7%
Techtronic Industries Co. Ltd. 8 174 Hong Kong Asia/Pacific 4,300 11.6%
Fortune Brands Home & Security, Inc. 9 183 United States North America 4,157 15.8%
JELD-WEN, Inc. 10 216 United States North America 3,500 9.4%
Top 10 home improvement products companies
The top 10 home improvement companies remained a stable group once again in 2013 with no changes to the companies or to their ranking. The list is dominated by U.S. manufacturers, but it is headed by LIXIL Group, a Japanese supplier of housing and building materials including doors, windows, shutters, kitchen and bathroom fixtures, and tile, among other products.
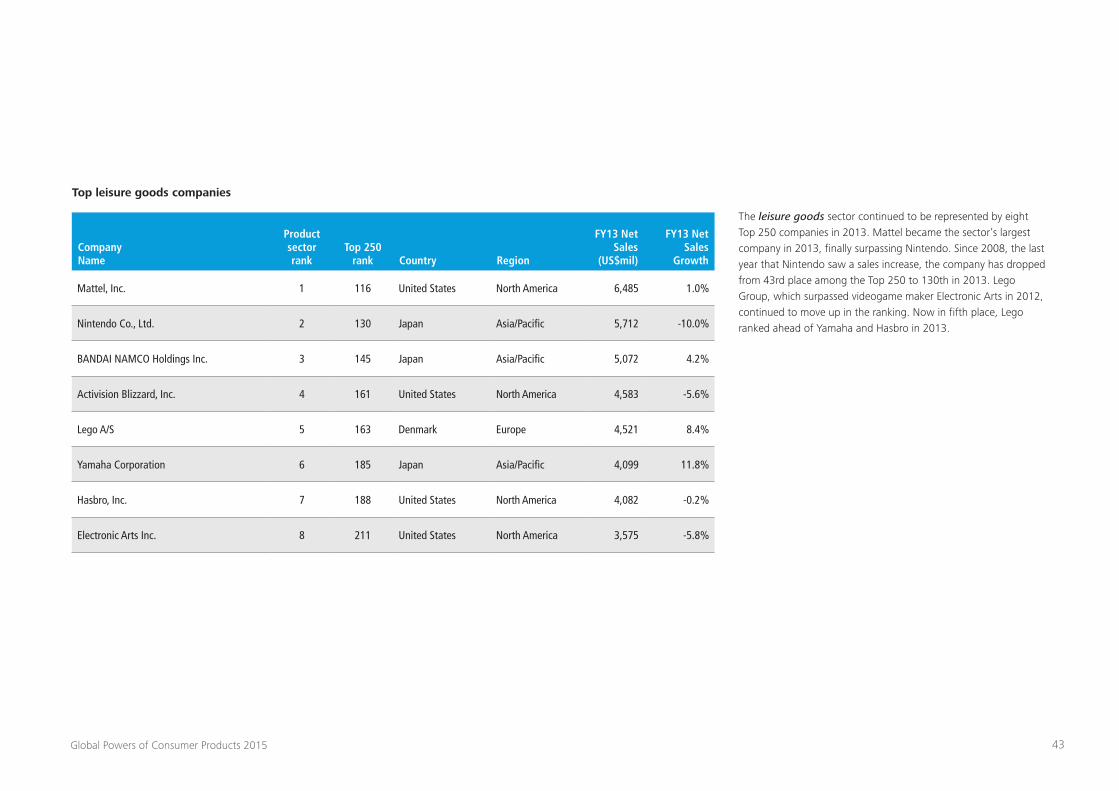
43Global Powers of Consumer Products 2015
Company Name
Product sector rank
Top 250 rank Country Region
FY13 Net Sales
(US$mil)
FY13 Net Sales
Growth
Mattel, Inc. 1 116 United States North America 6,485 1.0%
Nintendo Co., Ltd. 2 130 Japan Asia/Pacific 5,712 -10.0%
BANDAI NAMCO Holdings Inc. 3 145 Japan Asia/Pacific 5,072 4.2%
Activision Blizzard, Inc. 4 161 United States North America 4,583 -5.6%
Lego A/S 5 163 Denmark Europe 4,521 8.4%
Yamaha Corporation 6 185 Japan Asia/Pacific 4,099 11.8%
Hasbro, Inc. 7 188 United States North America 4,082 -0.2%
Electronic Arts Inc. 8 211 United States North America 3,575 -5.8%
Top leisure goods companies
The leisure goods sector continued to be represented by eight Top 250 companies in 2013. Mattel became the sector’s largest company in 2013, finally surpassing Nintendo. Since 2008, the last year that Nintendo saw a sales increase, the company has dropped from 43rd place among the Top 250 to 130th in 2013. Lego Group, which surpassed videogame maker Electronic Arts in 2012, continued to move up in the ranking. Now in fifth place, Lego ranked ahead of Yamaha and Hasbro in 2013.
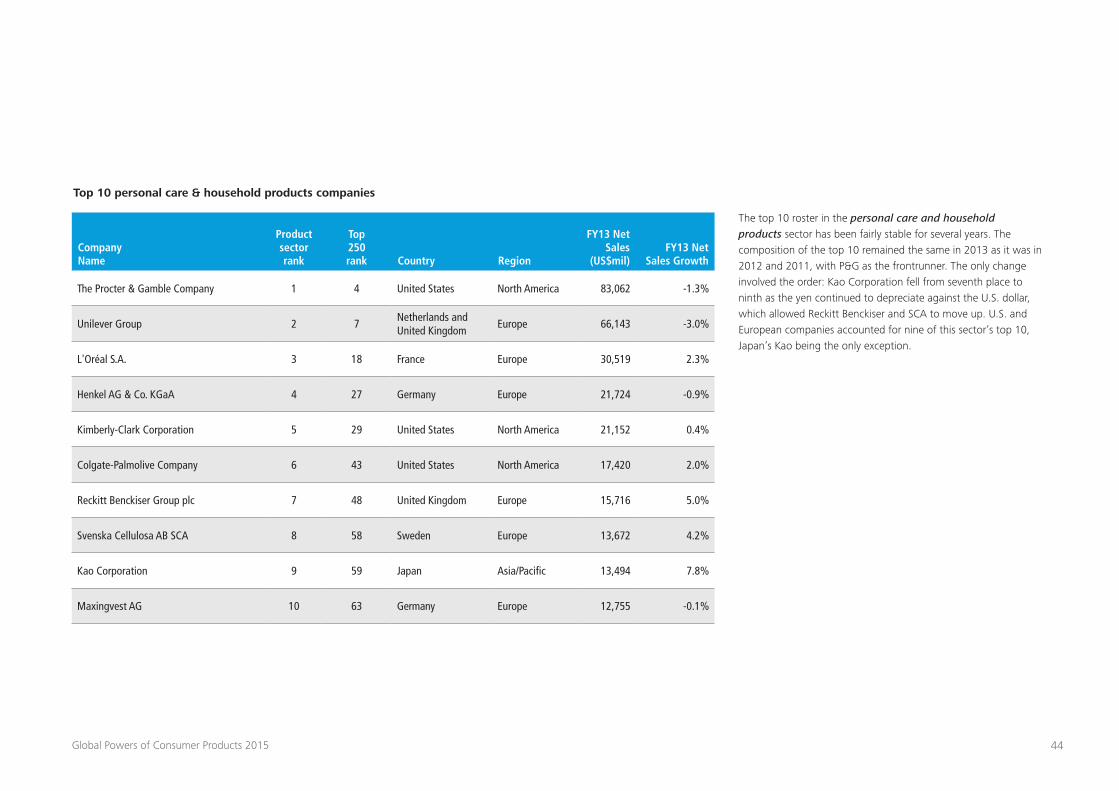
44Global Powers of Consumer Products 2015
Company Name
Product sector rank
Top 250 rank Country Region
FY13 Net Sales
(US$mil)FY13 Net
Sales Growth
The Procter & Gamble Company 1 4 United States North America 83,062 -1.3%
Unilever Group 2 7Netherlands and United Kingdom
Europe 66,143 -3.0%
L'Oréal S.A. 3 18 France Europe 30,519 2.3%
Henkel AG & Co. KGaA 4 27 Germany Europe 21,724 -0.9%
Kimberly-Clark Corporation 5 29 United States North America 21,152 0.4%
Colgate-Palmolive Company 6 43 United States North America 17,420 2.0%
Reckitt Benckiser Group plc 7 48 United Kingdom Europe 15,716 5.0%
Svenska Cellulosa AB SCA 8 58 Sweden Europe 13,672 4.2%
Kao Corporation 9 59 Japan Asia/Pacific 13,494 7.8%
Maxingvest AG 10 63 Germany Europe 12,755 -0.1%
Top 10 personal care & household products companies
The top 10 roster in the personal care and household products sector has been fairly stable for several years. The composition of the top 10 remained the same in 2013 as it was in 2012 and 2011, with P&G as the frontrunner. The only change involved the order: Kao Corporation fell from seventh place to ninth as the yen continued to depreciate against the U.S. dollar, which allowed Reckitt Benckiser and SCA to move up. U.S. and European companies accounted for nine of this sector’s top 10, Japan’s Kao being the only exception.
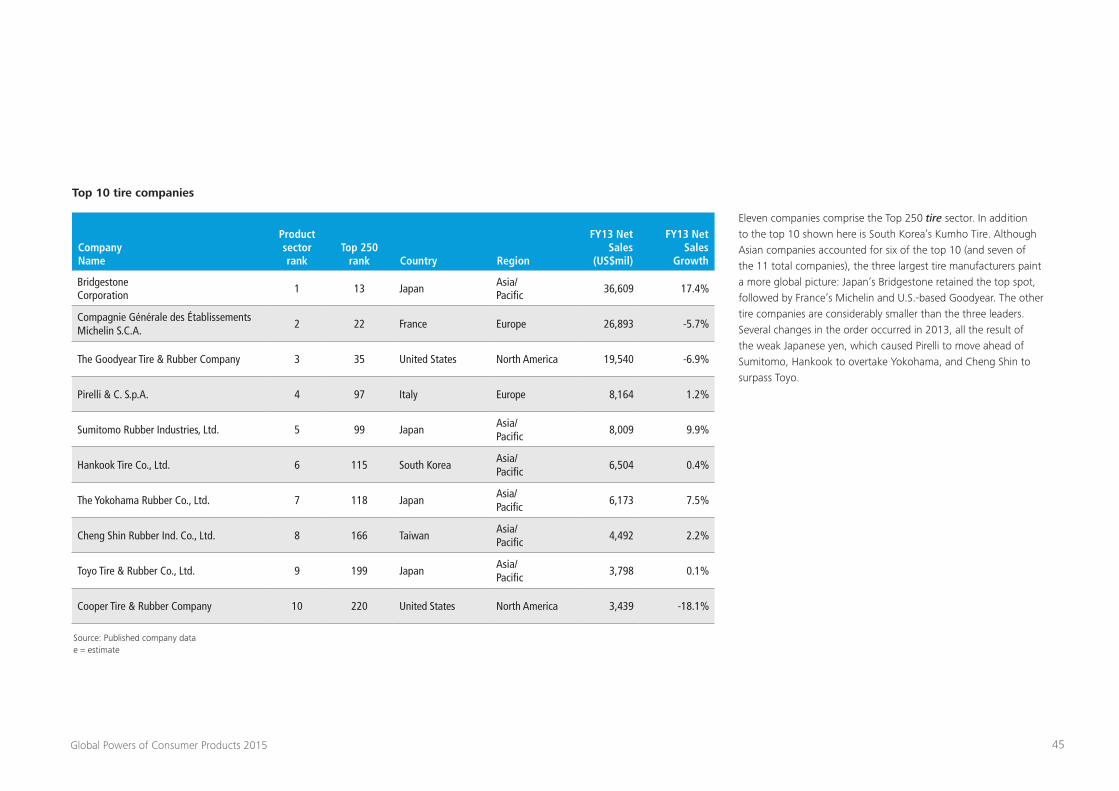
45Global Powers of Consumer Products 2015
Company Name
Product sector rank
Top 250 rank Country Region
FY13 Net Sales
(US$mil)
FY13 Net Sales
Growth
Bridgestone Corporation 1 13 Japan Asia/
Pacific 36,609 17.4%
Compagnie Générale des Établissements Michelin S.C.A.
2 22 France Europe 26,893 -5.7%
The Goodyear Tire & Rubber Company 3 35 United States North America 19,540 -6.9%
Pirelli & C. S.p.A. 4 97 Italy Europe 8,164 1.2%
Sumitomo Rubber Industries, Ltd. 5 99 JapanAsia/ Pacific
8,009 9.9%
Hankook Tire Co., Ltd. 6 115 South KoreaAsia/ Pacific
6,504 0.4%
The Yokohama Rubber Co., Ltd. 7 118 JapanAsia/ Pacific
6,173 7.5%
Cheng Shin Rubber Ind. Co., Ltd. 8 166 TaiwanAsia/ Pacific
4,492 2.2%
Toyo Tire & Rubber Co., Ltd. 9 199 JapanAsia/ Pacific
3,798 0.1%
Cooper Tire & Rubber Company 10 220 United States North America 3,439 -18.1%
Top 10 tire companies
Source: Published company data e = estimate
Eleven companies comprise the Top 250 tire sector. In addition to the top 10 shown here is South Korea’s Kumho Tire. Although Asian companies accounted for six of the top 10 (and seven of the 11 total companies), the three largest tire manufacturers paint a more global picture: Japan’s Bridgestone retained the top spot, followed by France’s Michelin and U.S.-based Goodyear. The other tire companies are considerably smaller than the three leaders. Several changes in the order occurred in 2013, all the result of the weak Japanese yen, which caused Pirelli to move ahead of Sumitomo, Hankook to overtake Yokohama, and Cheng Shin to surpass Toyo.
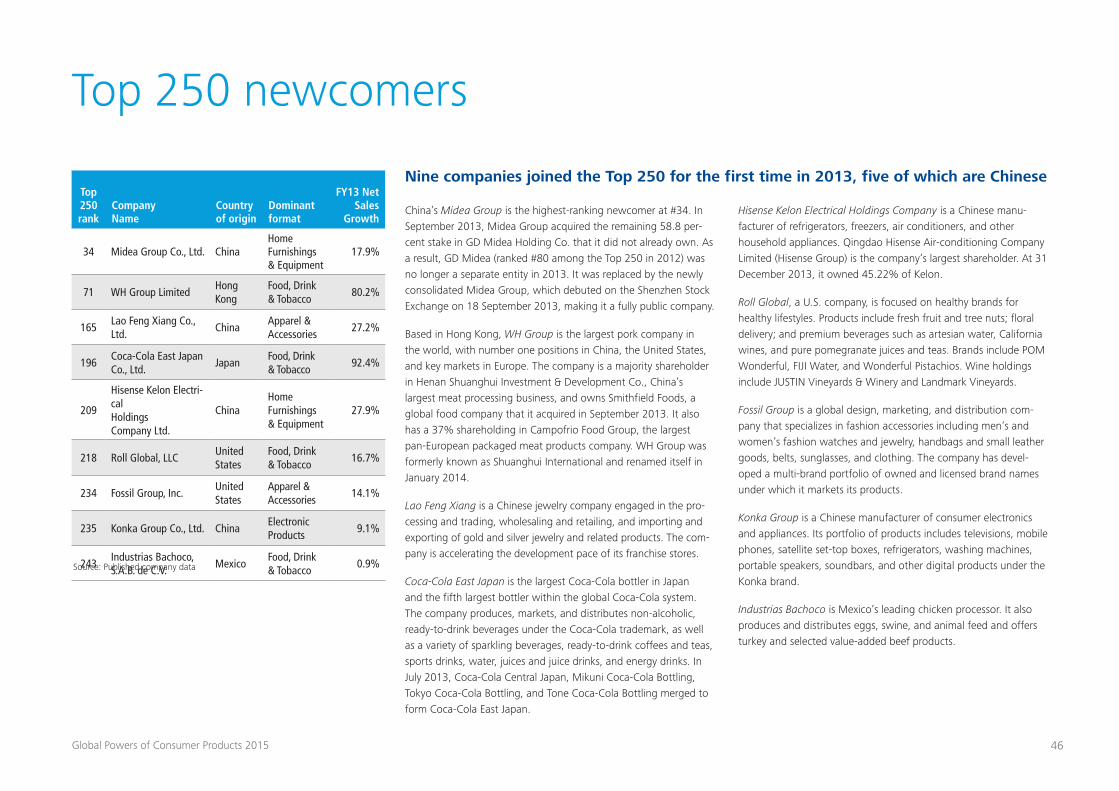
46Global Powers of Consumer Products 2015
Top 250 newcomers
Top 250 rank
Company Name
Country of origin
Dominant format
FY13 Net Sales
Growth
34 Midea Group Co., Ltd. ChinaHome Furnishings & Equipment
17.9%
71 WH Group LimitedHong Kong
Food, Drink & Tobacco
80.2%
165Lao Feng Xiang Co., Ltd.
ChinaApparel & Accessories
27.2%
196Coca-Cola East Japan Co., Ltd.
JapanFood, Drink & Tobacco
92.4%
209
Hisense Kelon Electri-cal Holdings Company Ltd.
ChinaHome Furnishings & Equipment
27.9%
218 Roll Global, LLCUnited States
Food, Drink & Tobacco
16.7%
234 Fossil Group, Inc.United States
Apparel & Accessories
14.1%
235 Konka Group Co., Ltd. ChinaElectronic Products
9.1%
243Industrias Bachoco, S.A.B. de C.V.
MexicoFood, Drink & Tobacco
0.9%Source: Published company data
Nine companies joined the Top 250 for the first time in 2013, five of which are Chinese
China’s Midea Group is the highest-ranking newcomer at #34. In September 2013, Midea Group acquired the remaining 58.8 per-cent stake in GD Midea Holding Co. that it did not already own. As a result, GD Midea (ranked #80 among the Top 250 in 2012) was no longer a separate entity in 2013. It was replaced by the newly consolidated Midea Group, which debuted on the Shenzhen Stock Exchange on 18 September 2013, making it a fully public company.
Based in Hong Kong, WH Group is the largest pork company in the world, with number one positions in China, the United States, and key markets in Europe. The company is a majority shareholder in Henan Shuanghui Investment & Development Co., China’s largest meat processing business, and owns Smithfield Foods, a global food company that it acquired in September 2013. It also has a 37% shareholding in Campofrio Food Group, the largest pan-European packaged meat products company. WH Group was formerly known as Shuanghui International and renamed itself in January 2014.
Lao Feng Xiang is a Chinese jewelry company engaged in the pro-cessing and trading, wholesaling and retailing, and importing and exporting of gold and silver jewelry and related products. The com-pany is accelerating the development pace of its franchise stores.
Coca-Cola East Japan is the largest Coca-Cola bottler in Japan and the fifth largest bottler within the global Coca-Cola system. The company produces, markets, and distributes non-alcoholic, ready-to-drink beverages under the Coca-Cola trademark, as well as a variety of sparkling beverages, ready-to-drink coffees and teas, sports drinks, water, juices and juice drinks, and energy drinks. In July 2013, Coca-Cola Central Japan, Mikuni Coca-Cola Bottling, Tokyo Coca-Cola Bottling, and Tone Coca-Cola Bottling merged to form Coca-Cola East Japan.
Hisense Kelon Electrical Holdings Company is a Chinese manu-facturer of refrigerators, freezers, air conditioners, and other household appliances. Qingdao Hisense Air-conditioning Company Limited (Hisense Group) is the company’s largest shareholder. At 31 December 2013, it owned 45.22% of Kelon.
Roll Global, a U.S. company, is focused on healthy brands for healthy lifestyles. Products include fresh fruit and tree nuts; floral delivery; and premium beverages such as artesian water, California wines, and pure pomegranate juices and teas. Brands include POM Wonderful, FIJI Water, and Wonderful Pistachios. Wine holdings include JUSTIN Vineyards & Winery and Landmark Vineyards.
Fossil Group is a global design, marketing, and distribution com-pany that specializes in fashion accessories including men’s and women’s fashion watches and jewelry, handbags and small leather goods, belts, sunglasses, and clothing. The company has devel-oped a multi-brand portfolio of owned and licensed brand names under which it markets its products.
Konka Group is a Chinese manufacturer of consumer electronics and appliances. Its portfolio of products includes televisions, mobile phones, satellite set-top boxes, refrigerators, washing machines, portable speakers, soundbars, and other digital products under the Konka brand.
Industrias Bachoco is Mexico’s leading chicken processor. It also produces and distributes eggs, swine, and animal feed and offers turkey and selected value-added beef products.
47Global Powers of Consumer Products 2015
Fastest 50
The Fastest 50 is based on compound annual sales growth over a five-year period. Between 2008 and 2013, sales grew at a compound rate of 19.3 percent for the world’s 50 fastest-growing consumer products manufacturers—more than three times faster than for the Top 250 group as a whole. Just over half (26 compa-nies) were also among the 50 fastest-growing companies in 2013, which required year-over-year growth of at least 12.0 percent.
Green Mountain Coffee Roasters retained its position at the top of the list in 2013, posting a five-year compound annual growth rate of 54.2 percent. In 2006, Green Mountain acquired Keurig, a business specializing in single-cup brewing systems that revolu-tionized beverage preparation at home and in the workplace and is responsible for much of the company’s stellar growth. The ac-quisition of several coffee roasting companies over the years also contributed to its position as the leader of the Fastest 50 for two years running. In March 2014, the company changed its name to Keurig Green Mountain, creating a single corporate identity for its two strongest brands.
Acquisitions also served as the primary growth driver for Boparan Holdings Limited (aka 2 Sisters Food Group), which ranked second among the Fastest 50. Most notably, the UK food processor bought Northern Foods, a UK convenience foods manufacturer, in 2011. More recently, in April 2013, the company acquired Vion’s poultry and red-meat business in the UK.
Not surprisingly, the majority of the Fastest 50 (31 companies) are based in emerging markets, including 17 of the 21 Top 250 com-panies from mainland China and Hong Kong. Seven of the Top 250 newcomers rank among the Fastest 50.
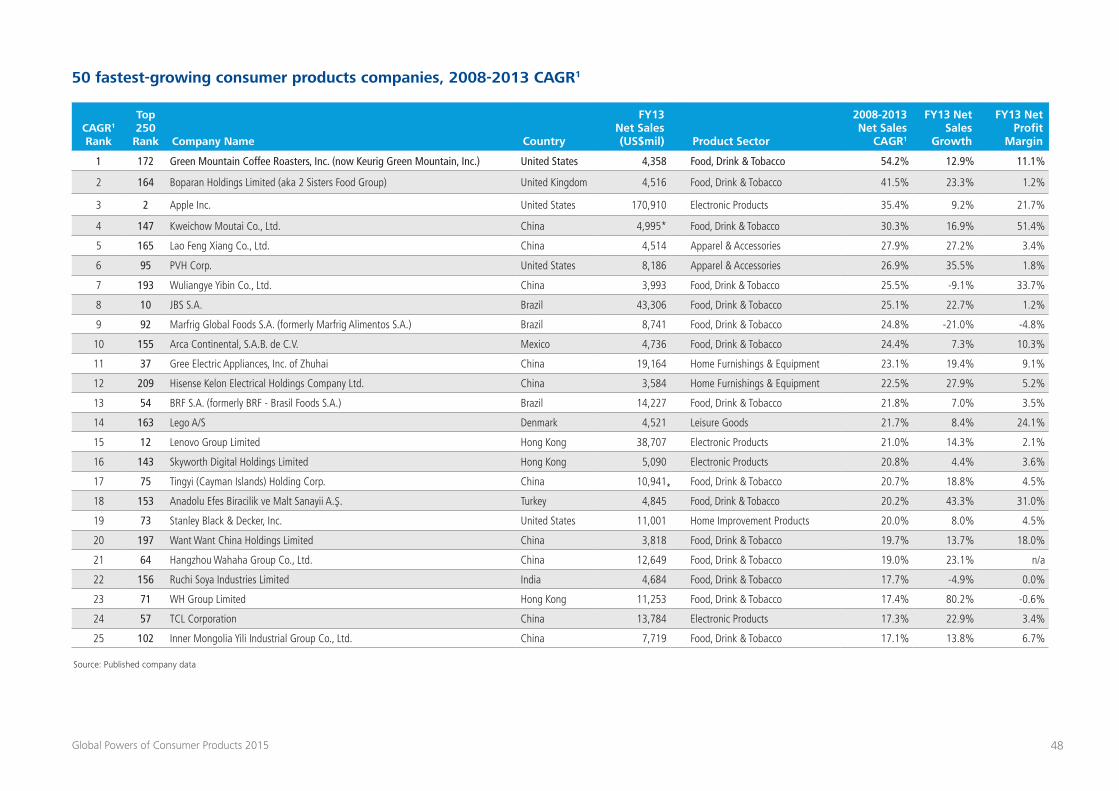
48Global Powers of Consumer Products 2015
Source: Published company data
CAGR1 Rank
Top 250 Rank Company Name Country
FY13 Net Sales (US$mil) Product Sector
2008-2013 Net Sales
CAGR1
FY13 Net Sales
Growth
FY13 Net Profit
Margin
1 172 Green Mountain Coffee Roasters, Inc. (now Keurig Green Mountain, Inc.) United States 4,358 Food, Drink & Tobacco 54.2% 12.9% 11.1%
2 164 Boparan Holdings Limited (aka 2 Sisters Food Group) United Kingdom 4,516 Food, Drink & Tobacco 41.5% 23.3% 1.2%
3 2 Apple Inc. United States 170,910 Electronic Products 35.4% 9.2% 21.7%
4 147 Kweichow Moutai Co., Ltd. China 4,995* Food, Drink & Tobacco 30.3% 16.9% 51.4%
5 165 Lao Feng Xiang Co., Ltd. China 4,514 Apparel & Accessories 27.9% 27.2% 3.4%
6 95 PVH Corp. United States 8,186 Apparel & Accessories 26.9% 35.5% 1.8%
7 193 Wuliangye Yibin Co., Ltd. China 3,993 Food, Drink & Tobacco 25.5% -9.1% 33.7%
8 10 JBS S.A. Brazil 43,306 Food, Drink & Tobacco 25.1% 22.7% 1.2%
9 92 Marfrig Global Foods S.A. (formerly Marfrig Alimentos S.A.) Brazil 8,741 Food, Drink & Tobacco 24.8% -21.0% -4.8%
10 155 Arca Continental, S.A.B. de C.V. Mexico 4,736 Food, Drink & Tobacco 24.4% 7.3% 10.3%
11 37 Gree Electric Appliances, Inc. of Zhuhai China 19,164 Home Furnishings & Equipment 23.1% 19.4% 9.1%
12 209 Hisense Kelon Electrical Holdings Company Ltd. China 3,584 Home Furnishings & Equipment 22.5% 27.9% 5.2%
13 54 BRF S.A. (formerly BRF - Brasil Foods S.A.) Brazil 14,227 Food, Drink & Tobacco 21.8% 7.0% 3.5%
14 163 Lego A/S Denmark 4,521 Leisure Goods 21.7% 8.4% 24.1%
15 12 Lenovo Group Limited Hong Kong 38,707 Electronic Products 21.0% 14.3% 2.1%
16 143 Skyworth Digital Holdings Limited Hong Kong 5,090 Electronic Products 20.8% 4.4% 3.6%
17 75 Tingyi (Cayman Islands) Holding Corp. China 10,941 Food, Drink & Tobacco 20.7% 18.8% 4.5%
18 153 Anadolu Efes Biracilik ve Malt Sanayii A.Ş. Turkey 4,845 Food, Drink & Tobacco 20.2% 43.3% 31.0%
19 73 Stanley Black & Decker, Inc. United States 11,001 Home Improvement Products 20.0% 8.0% 4.5%
20 197 Want Want China Holdings Limited China 3,818 Food, Drink & Tobacco 19.7% 13.7% 18.0%
21 64 Hangzhou Wahaha Group Co., Ltd. China 12,649 Food, Drink & Tobacco 19.0% 23.1% n/a
22 156 Ruchi Soya Industries Limited India 4,684 Food, Drink & Tobacco 17.7% -4.9% 0.0%
23 71 WH Group Limited Hong Kong 11,253 Food, Drink & Tobacco 17.4% 80.2% -0.6%
24 57 TCL Corporation China 13,784 Electronic Products 17.3% 22.9% 3.4%
25 102 Inner Mongolia Yili Industrial Group Co., Ltd. China 7,719 Food, Drink & Tobacco 17.1% 13.8% 6.7%
50 fastest-growing consumer products companies, 2008-2013 CAGR1
*
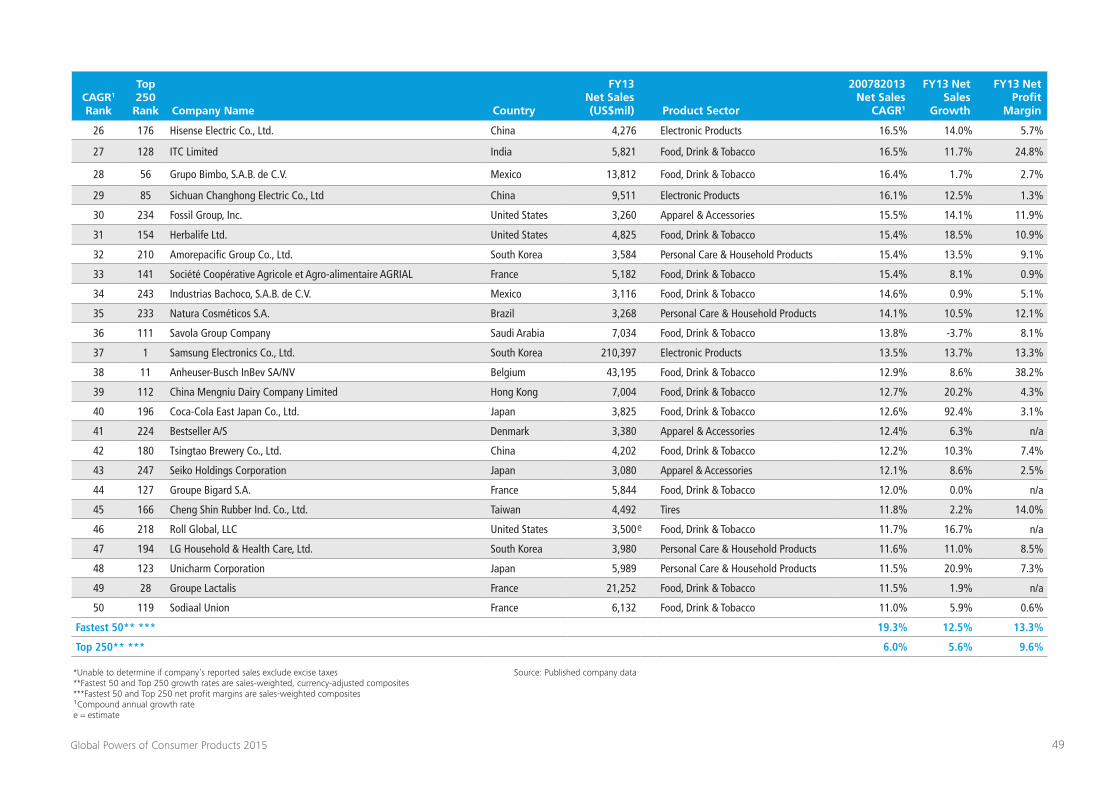
49Global Powers of Consumer Products 2015
CAGR1 Rank
Top 250 Rank Company Name Country
FY13 Net Sales (US$mil) Product Sector
200782013 Net Sales
CAGR1
FY13 Net Sales
Growth
FY13 Net Profit
Margin
26 176 Hisense Electric Co., Ltd. China 4,276 Electronic Products 16.5% 14.0% 5.7%
27 128 ITC Limited India 5,821 Food, Drink & Tobacco 16.5% 11.7% 24.8%
28 56 Grupo Bimbo, S.A.B. de C.V. Mexico 13,812 Food, Drink & Tobacco 16.4% 1.7% 2.7%
29 85 Sichuan Changhong Electric Co., Ltd China 9,511 Electronic Products 16.1% 12.5% 1.3%
30 234 Fossil Group, Inc. United States 3,260 Apparel & Accessories 15.5% 14.1% 11.9%
31 154 Herbalife Ltd. United States 4,825 Food, Drink & Tobacco 15.4% 18.5% 10.9%
32 210 Amorepacific Group Co., Ltd. South Korea 3,584 Personal Care & Household Products 15.4% 13.5% 9.1%
33 141 Société Coopérative Agricole et Agro-alimentaire AGRIAL France 5,182 Food, Drink & Tobacco 15.4% 8.1% 0.9%
34 243 Industrias Bachoco, S.A.B. de C.V. Mexico 3,116 Food, Drink & Tobacco 14.6% 0.9% 5.1%
35 233 Natura Cosméticos S.A. Brazil 3,268 Personal Care & Household Products 14.1% 10.5% 12.1%
36 111 Savola Group Company Saudi Arabia 7,034 Food, Drink & Tobacco 13.8% -3.7% 8.1%
37 1 Samsung Electronics Co., Ltd. South Korea 210,397 Electronic Products 13.5% 13.7% 13.3%
38 11 Anheuser-Busch InBev SA/NV Belgium 43,195 Food, Drink & Tobacco 12.9% 8.6% 38.2%
39 112 China Mengniu Dairy Company Limited Hong Kong 7,004 Food, Drink & Tobacco 12.7% 20.2% 4.3%
40 196 Coca-Cola East Japan Co., Ltd. Japan 3,825 Food, Drink & Tobacco 12.6% 92.4% 3.1%
41 224 Bestseller A/S Denmark 3,380 Apparel & Accessories 12.4% 6.3% n/a
42 180 Tsingtao Brewery Co., Ltd. China 4,202 Food, Drink & Tobacco 12.2% 10.3% 7.4%
43 247 Seiko Holdings Corporation Japan 3,080 Apparel & Accessories 12.1% 8.6% 2.5%
44 127 Groupe Bigard S.A. France 5,844 Food, Drink & Tobacco 12.0% 0.0% n/a
45 166 Cheng Shin Rubber Ind. Co., Ltd. Taiwan 4,492 Tires 11.8% 2.2% 14.0%
46 218 Roll Global, LLC United States 3,500 Food, Drink & Tobacco 11.7% 16.7% n/a
47 194 LG Household & Health Care, Ltd. South Korea 3,980 Personal Care & Household Products 11.6% 11.0% 8.5%
48 123 Unicharm Corporation Japan 5,989 Personal Care & Household Products 11.5% 20.9% 7.3%
49 28 Groupe Lactalis France 21,252 Food, Drink & Tobacco 11.5% 1.9% n/a
50 119 Sodiaal Union France 6,132 Food, Drink & Tobacco 11.0% 5.9% 0.6%
Fastest 50** *** 19.3% 12.5% 13.3%
Top 250** *** 6.0% 5.6% 9.6%
*Unable to determine if company’s reported sales exclude excise taxes**Fastest 50 and Top 250 growth rates are sales-weighted, currency-adjusted composites***Fastest 50 and Top 250 net profit margins are sales-weighted composites¹Compound annual growth ratee = estimate
Source: Published company data
e
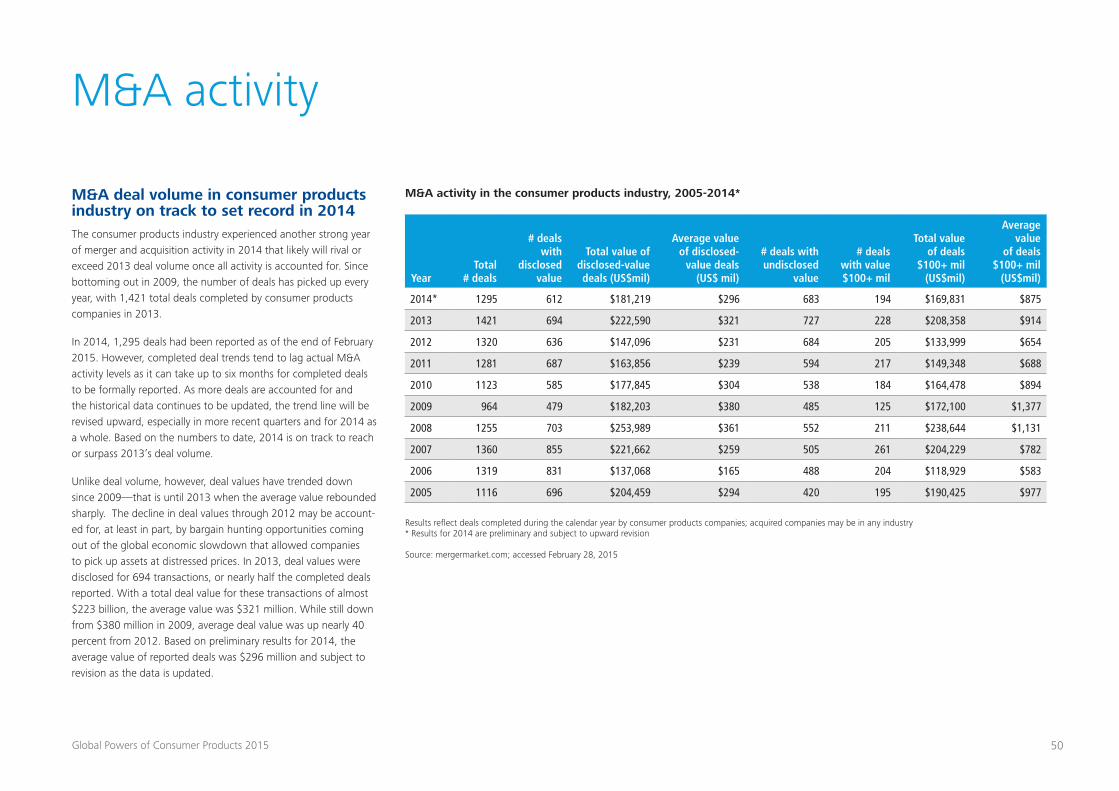
50Global Powers of Consumer Products 2015
M&A activity
M&A deal volume in consumer products industry on track to set record in 2014The consumer products industry experienced another strong year of merger and acquisition activity in 2014 that likely will rival or exceed 2013 deal volume once all activity is accounted for. Since bottoming out in 2009, the number of deals has picked up every year, with 1,421 total deals completed by consumer products companies in 2013.
In 2014, 1,295 deals had been reported as of the end of February 2015. However, completed deal trends tend to lag actual M&A activity levels as it can take up to six months for completed deals to be formally reported. As more deals are accounted for and the historical data continues to be updated, the trend line will be revised upward, especially in more recent quarters and for 2014 as a whole. Based on the numbers to date, 2014 is on track to reach or surpass 2013’s deal volume.
Unlike deal volume, however, deal values have trended down since 2009—that is until 2013 when the average value rebounded sharply. The decline in deal values through 2012 may be account-ed for, at least in part, by bargain hunting opportunities coming out of the global economic slowdown that allowed companies to pick up assets at distressed prices. In 2013, deal values were disclosed for 694 transactions, or nearly half the completed deals reported. With a total deal value for these transactions of almost $223 billion, the average value was $321 million. While still down from $380 million in 2009, average deal value was up nearly 40 percent from 2012. Based on preliminary results for 2014, the average value of reported deals was $296 million and subject to revision as the data is updated.
Results reflect deals completed during the calendar year by consumer products companies; acquired companies may be in any industry* Results for 2014 are preliminary and subject to upward revision
Source: mergermarket.com; accessed February 28, 2015
YearTotal
# deals
# deals with
disclosed value
Total value of disclosed-value deals (US$mil)
Average value of disclosed-
value deals (US$ mil)
# deals with undisclosed
value
# deals with value $100+ mil
Total value of deals
$100+ mil (US$mil)
Average value
of deals $100+ mil
(US$mil)
2014* 1295 612 $181,219 $296 683 194 $169,831 $875
2013 1421 694 $222,590 $321 727 228 $208,358 $914
2012 1320 636 $147,096 $231 684 205 $133,999 $654
2011 1281 687 $163,856 $239 594 217 $149,348 $688
2010 1123 585 $177,845 $304 538 184 $164,478 $894
2009 964 479 $182,203 $380 485 125 $172,100 $1,377
2008 1255 703 $253,989 $361 552 211 $238,644 $1,131
2007 1360 855 $221,662 $259 505 261 $204,229 $782
2006 1319 831 $137,068 $165 488 204 $118,929 $583
2005 1116 696 $204,459 $294 420 195 $190,425 $977
M&A activity in the consumer products industry, 2005-2014*
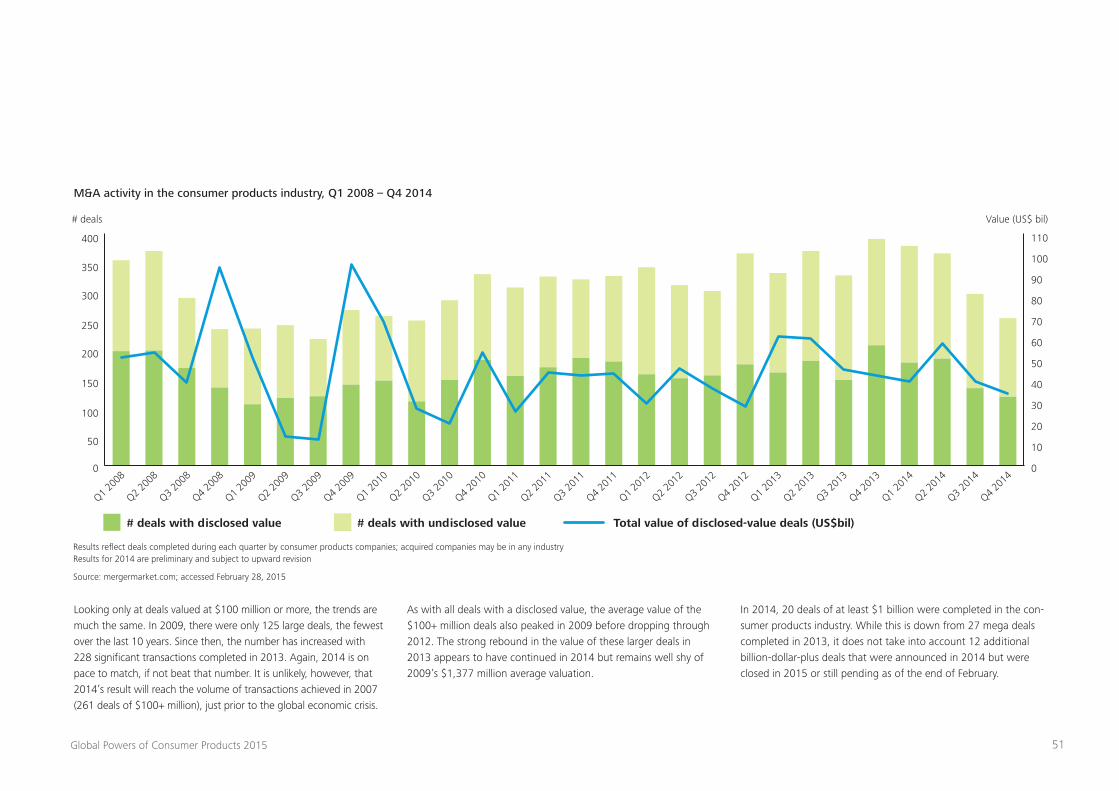
51Global Powers of Consumer Products 2015
350
70
400
80
90
110
Value (US$ bil)# deals
100
Q1 200
8
Q1 201
0
Q1 201
2
Q1 200
9
Q1 201
1
Q1 201
3
Q1 201
4
Q2 200
8
Q2 201
0
Q2 201
2
Q2 200
9
Q2 201
1
Q2 201
3
Q2 201
4
Q3 200
8
Q3 201
0
Q3 201
2
Q3 200
9
Q3 201
1
Q3 201
3
Q3 201
4
Q4 200
8
Q4 201
0
Q4 201
2
Q4 200
9
Q4 201
1
Q4 201
3
Q4 201
4
250
50
300
60200
40150
30
50 10
0 0
10020
M&A activity in the consumer products industry, Q1 2008 – Q4 2014
# deals with disclosed value # deals with undisclosed value Total value of disclosed-value deals (US$bil)
Results reflect deals completed during each quarter by consumer products companies; acquired companies may be in any industry Results for 2014 are preliminary and subject to upward revision
Source: mergermarket.com; accessed February 28, 2015
Looking only at deals valued at $100 million or more, the trends are much the same. In 2009, there were only 125 large deals, the fewest over the last 10 years. Since then, the number has increased with 228 significant transactions completed in 2013. Again, 2014 is on pace to match, if not beat that number. It is unlikely, however, that 2014’s result will reach the volume of transactions achieved in 2007 (261 deals of $100+ million), just prior to the global economic crisis.
As with all deals with a disclosed value, the average value of the $100+ million deals also peaked in 2009 before dropping through 2012. The strong rebound in the value of these larger deals in 2013 appears to have continued in 2014 but remains well shy of 2009’s $1,377 million average valuation.
In 2014, 20 deals of at least $1 billion were completed in the con-sumer products industry. While this is down from 27 mega deals completed in 2013, it does not take into account 12 additional billion-dollar-plus deals that were announced in 2014 but were closed in 2015 or still pending as of the end of February.
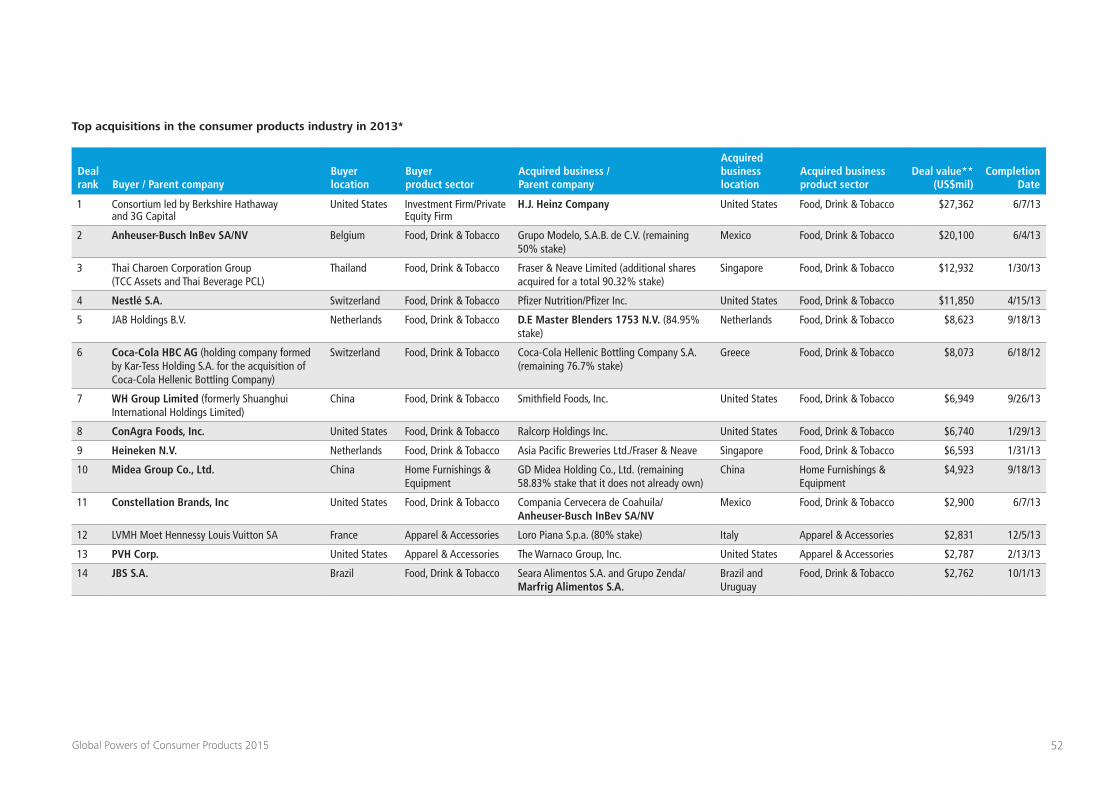
52Global Powers of Consumer Products 2015
Top acquisitions in the consumer products industry in 2013*
Deal rank Buyer / Parent company
Buyer location
Buyer product sector
Acquired business / Parent company
Acquired business location
Acquired business product sector
Deal value** (US$mil)
Completion Date
1 Consortium led by Berkshire Hathaway and 3G Capital
United States Investment Firm/Private Equity Firm
H.J. Heinz Company United States Food, Drink & Tobacco $27,362 6/7/13
2 Anheuser-Busch InBev SA/NV Belgium Food, Drink & Tobacco Grupo Modelo, S.A.B. de C.V. (remaining 50% stake)
Mexico Food, Drink & Tobacco $20,100 6/4/13
3 Thai Charoen Corporation Group (TCC Assets and Thai Beverage PCL)
Thailand Food, Drink & Tobacco Fraser & Neave Limited (additional shares acquired for a total 90.32% stake)
Singapore Food, Drink & Tobacco $12,932 1/30/13
4 Nestlé S.A. Switzerland Food, Drink & Tobacco Pfizer Nutrition/Pfizer Inc. United States Food, Drink & Tobacco $11,850 4/15/13
5 JAB Holdings B.V. Netherlands Food, Drink & Tobacco D.E Master Blenders 1753 N.V. (84.95% stake)
Netherlands Food, Drink & Tobacco $8,623 9/18/13
6 Coca-Cola HBC AG (holding company formed by Kar-Tess Holding S.A. for the acquisition of Coca-Cola Hellenic Bottling Company)
Switzerland Food, Drink & Tobacco Coca-Cola Hellenic Bottling Company S.A. (remaining 76.7% stake)
Greece Food, Drink & Tobacco $8,073 6/18/12
7 WH Group Limited (formerly Shuanghui International Holdings Limited)
China Food, Drink & Tobacco Smithfield Foods, Inc. United States Food, Drink & Tobacco $6,949 9/26/13
8 ConAgra Foods, Inc. United States Food, Drink & Tobacco Ralcorp Holdings Inc. United States Food, Drink & Tobacco $6,740 1/29/13
9 Heineken N.V. Netherlands Food, Drink & Tobacco Asia Pacific Breweries Ltd./Fraser & Neave Singapore Food, Drink & Tobacco $6,593 1/31/13
10 Midea Group Co., Ltd. China Home Furnishings & Equipment
GD Midea Holding Co., Ltd. (remaining 58.83% stake that it does not already own)
China Home Furnishings & Equipment
$4,923 9/18/13
11 Constellation Brands, Inc United States Food, Drink & Tobacco Compania Cervecera de Coahuila/ Anheuser-Busch InBev SA/NV
Mexico Food, Drink & Tobacco $2,900 6/7/13
12 LVMH Moet Hennessy Louis Vuitton SA France Apparel & Accessories Loro Piana S.p.a. (80% stake) Italy Apparel & Accessories $2,831 12/5/13
13 PVH Corp. United States Apparel & Accessories The Warnaco Group, Inc. United States Apparel & Accessories $2,787 2/13/13
14 JBS S.A. Brazil Food, Drink & Tobacco Seara Alimentos S.A. and Grupo Zenda/ Marfrig Alimentos S.A.
Brazil and Uruguay
Food, Drink & Tobacco $2,762 10/1/13
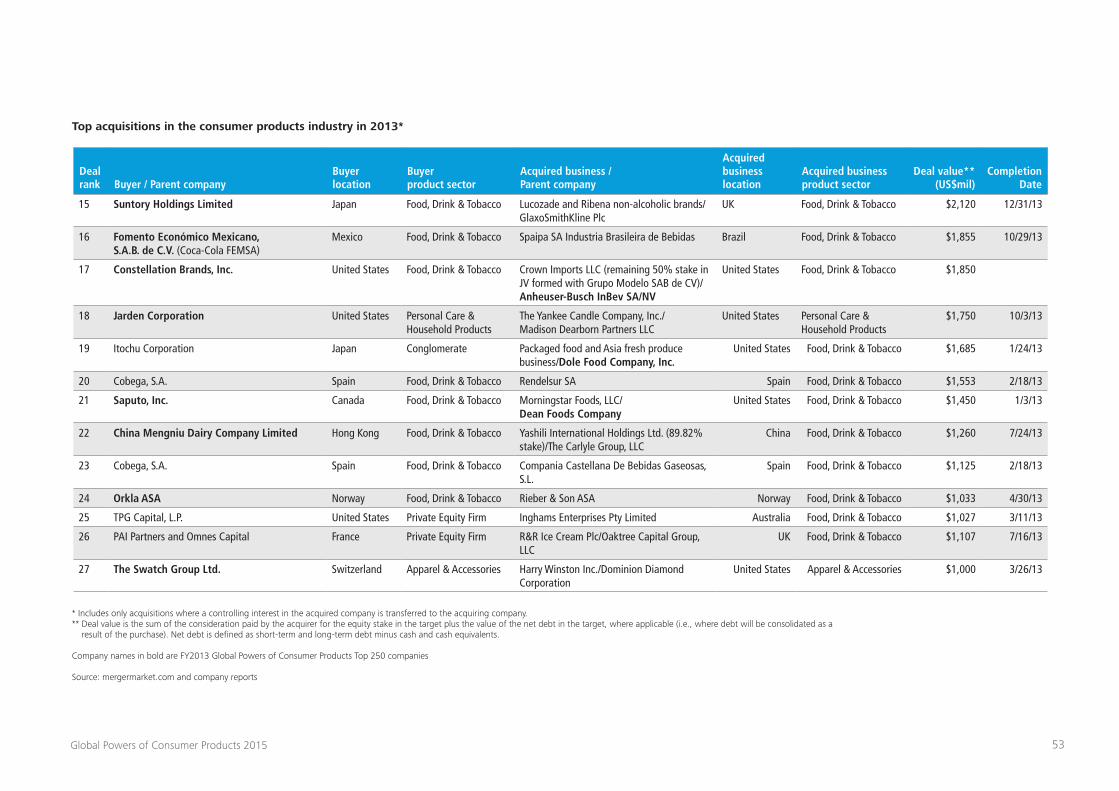
53Global Powers of Consumer Products 2015
Deal rank Buyer / Parent company
Buyer location
Buyer product sector
Acquired business / Parent company
Acquired business location
Acquired business product sector
Deal value** (US$mil)
Completion Date
15 Suntory Holdings Limited Japan Food, Drink & Tobacco Lucozade and Ribena non-alcoholic brands/GlaxoSmithKline Plc
UK Food, Drink & Tobacco $2,120 12/31/13
16 Fomento Económico Mexicano, S.A.B. de C.V. (Coca-Cola FEMSA)
Mexico Food, Drink & Tobacco Spaipa SA Industria Brasileira de Bebidas Brazil Food, Drink & Tobacco $1,855 10/29/13
17 Constellation Brands, Inc. United States Food, Drink & Tobacco Crown Imports LLC (remaining 50% stake in JV formed with Grupo Modelo SAB de CV)/Anheuser-Busch InBev SA/NV
United States Food, Drink & Tobacco $1,850
18 Jarden Corporation United States Personal Care & Household Products
The Yankee Candle Company, Inc./ Madison Dearborn Partners LLC
United States Personal Care & Household Products
$1,750 10/3/13
19 Itochu Corporation Japan Conglomerate Packaged food and Asia fresh produce business/Dole Food Company, Inc.
United States Food, Drink & Tobacco $1,685 1/24/13
20 Cobega, S.A. Spain Food, Drink & Tobacco Rendelsur SA Spain Food, Drink & Tobacco $1,553 2/18/13
21 Saputo, Inc. Canada Food, Drink & Tobacco Morningstar Foods, LLC/ Dean Foods Company
United States Food, Drink & Tobacco $1,450 1/3/13
22 China Mengniu Dairy Company Limited Hong Kong Food, Drink & Tobacco Yashili International Holdings Ltd. (89.82% stake)/The Carlyle Group, LLC
China Food, Drink & Tobacco $1,260 7/24/13
23 Cobega, S.A. Spain Food, Drink & Tobacco Compania Castellana De Bebidas Gaseosas, S.L.
Spain Food, Drink & Tobacco $1,125 2/18/13
24 Orkla ASA Norway Food, Drink & Tobacco Rieber & Son ASA Norway Food, Drink & Tobacco $1,033 4/30/13
25 TPG Capital, L.P. United States Private Equity Firm Inghams Enterprises Pty Limited Australia Food, Drink & Tobacco $1,027 3/11/13
26 PAI Partners and Omnes Capital France Private Equity Firm R&R Ice Cream Plc/Oaktree Capital Group, LLC
UK Food, Drink & Tobacco $1,107 7/16/13
27 The Swatch Group Ltd. Switzerland Apparel & Accessories Harry Winston Inc./Dominion Diamond Corporation
United States Apparel & Accessories $1,000 3/26/13
Top acquisitions in the consumer products industry in 2013*
* Includes only acquisitions where a controlling interest in the acquired company is transferred to the acquiring company.** Deal value is the sum of the consideration paid by the acquirer for the equity stake in the target plus the value of the net debt in the target, where applicable (i.e., where debt will be consolidated as a
result of the purchase). Net debt is defined as short-term and long-term debt minus cash and cash equivalents.
Company names in bold are FY2013 Global Powers of Consumer Products Top 250 companies
Source: mergermarket.com and company reports
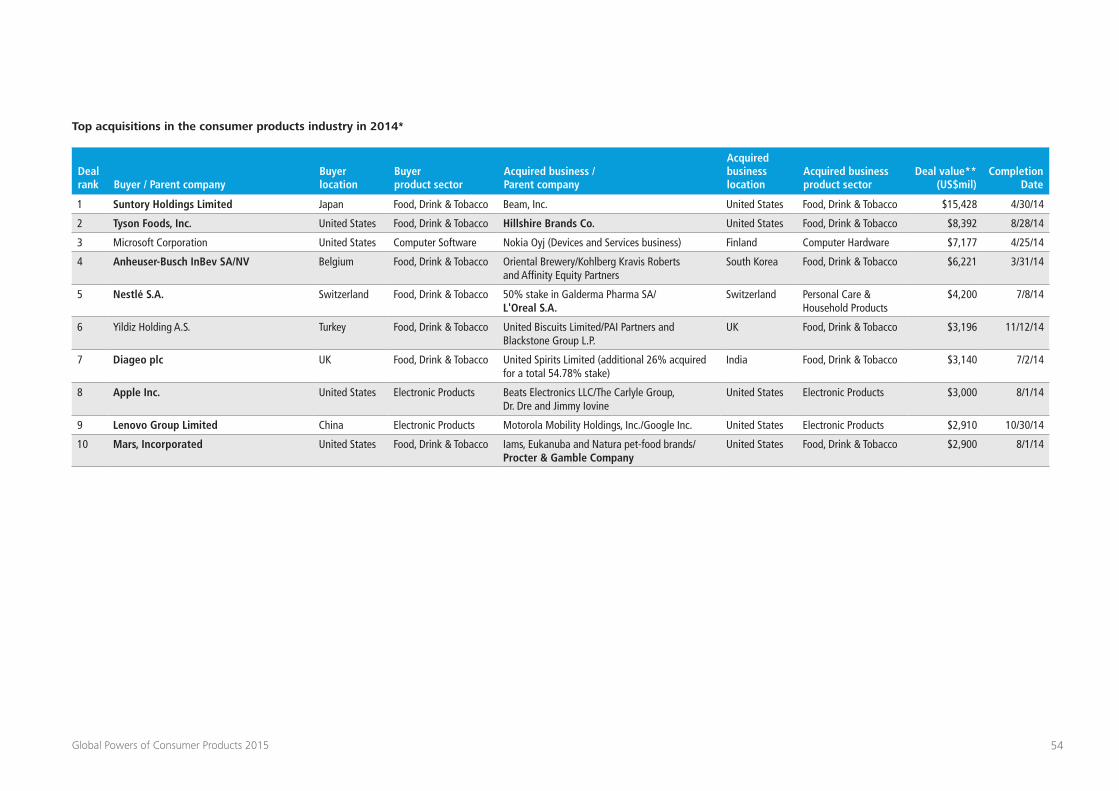
54Global Powers of Consumer Products 2015
Top acquisitions in the consumer products industry in 2014*
Deal rank Buyer / Parent company
Buyer location
Buyer product sector
Acquired business / Parent company
Acquired business location
Acquired business product sector
Deal value** (US$mil)
Completion Date
1 Suntory Holdings Limited Japan Food, Drink & Tobacco Beam, Inc. United States Food, Drink & Tobacco $15,428 4/30/14
2 Tyson Foods, Inc. United States Food, Drink & Tobacco Hillshire Brands Co. United States Food, Drink & Tobacco $8,392 8/28/14
3 Microsoft Corporation United States Computer Software Nokia Oyj (Devices and Services business) Finland Computer Hardware $7,177 4/25/14
4 Anheuser-Busch InBev SA/NV Belgium Food, Drink & Tobacco Oriental Brewery/Kohlberg Kravis Roberts and Affinity Equity Partners
South Korea Food, Drink & Tobacco $6,221 3/31/14
5 Nestlé S.A. Switzerland Food, Drink & Tobacco 50% stake in Galderma Pharma SA/ L'Oreal S.A.
Switzerland Personal Care & Household Products
$4,200 7/8/14
6 Yildiz Holding A.S. Turkey Food, Drink & Tobacco United Biscuits Limited/PAI Partners and Blackstone Group L.P.
UK Food, Drink & Tobacco $3,196 11/12/14
7 Diageo plc UK Food, Drink & Tobacco United Spirits Limited (additional 26% acquired for a total 54.78% stake)
India Food, Drink & Tobacco $3,140 7/2/14
8 Apple Inc. United States Electronic Products Beats Electronics LLC/The Carlyle Group, Dr. Dre and Jimmy Iovine
United States Electronic Products $3,000 8/1/14
9 Lenovo Group Limited China Electronic Products Motorola Mobility Holdings, Inc./Google Inc. United States Electronic Products $2,910 10/30/14
10 Mars, Incorporated United States Food, Drink & Tobacco Iams, Eukanuba and Natura pet-food brands/Procter & Gamble Company
United States Food, Drink & Tobacco $2,900 8/1/14
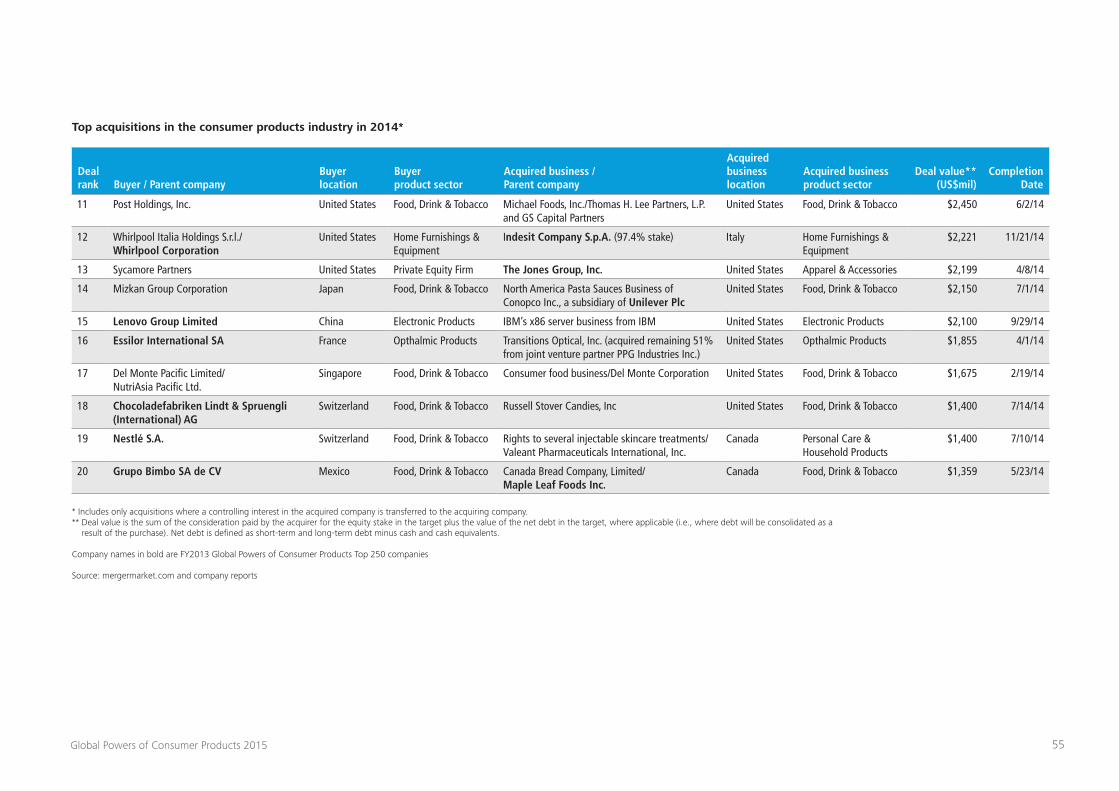
55Global Powers of Consumer Products 2015
Deal rank Buyer / Parent company
Buyer location
Buyer product sector
Acquired business / Parent company
Acquired business location
Acquired business product sector
Deal value** (US$mil)
Completion Date
11 Post Holdings, Inc. United States Food, Drink & Tobacco Michael Foods, Inc./Thomas H. Lee Partners, L.P. and GS Capital Partners
United States Food, Drink & Tobacco $2,450 6/2/14
12 Whirlpool Italia Holdings S.r.l./ Whirlpool Corporation
United States Home Furnishings & Equipment
Indesit Company S.p.A. (97.4% stake) Italy Home Furnishings & Equipment
$2,221 11/21/14
13 Sycamore Partners United States Private Equity Firm The Jones Group, Inc. United States Apparel & Accessories $2,199 4/8/14
14 Mizkan Group Corporation Japan Food, Drink & Tobacco North America Pasta Sauces Business of Conopco Inc., a subsidiary of Unilever Plc
United States Food, Drink & Tobacco $2,150 7/1/14
15 Lenovo Group Limited China Electronic Products IBM’s x86 server business from IBM United States Electronic Products $2,100 9/29/14
16 Essilor International SA France Opthalmic Products Transitions Optical, Inc. (acquired remaining 51% from joint venture partner PPG Industries Inc.)
United States Opthalmic Products $1,855 4/1/14
17 Del Monte Pacific Limited/ NutriAsia Pacific Ltd.
Singapore Food, Drink & Tobacco Consumer food business/Del Monte Corporation United States Food, Drink & Tobacco $1,675 2/19/14
18 Chocoladefabriken Lindt & Spruengli (International) AG
Switzerland Food, Drink & Tobacco Russell Stover Candies, Inc United States Food, Drink & Tobacco $1,400 7/14/14
19 Nestlé S.A. Switzerland Food, Drink & Tobacco Rights to several injectable skincare treatments/Valeant Pharmaceuticals International, Inc.
Canada Personal Care & Household Products
$1,400 7/10/14
20 Grupo Bimbo SA de CV Mexico Food, Drink & Tobacco Canada Bread Company, Limited/ Maple Leaf Foods Inc.
Canada Food, Drink & Tobacco $1,359 5/23/14
Top acquisitions in the consumer products industry in 2014*
* Includes only acquisitions where a controlling interest in the acquired company is transferred to the acquiring company.** Deal value is the sum of the consideration paid by the acquirer for the equity stake in the target plus the value of the net debt in the target, where applicable (i.e., where debt will be consolidated as a
result of the purchase). Net debt is defined as short-term and long-term debt minus cash and cash equivalents.
Company names in bold are FY2013 Global Powers of Consumer Products Top 250 companies
Source: mergermarket.com and company reports
56Global Powers of Consumer Products 2015
The largest deal in 2014 was the acquisition of spirits-maker Beam by Japan’s Suntory Holdings for a total consideration of $15.4 billion. The year’s second biggest transaction was Tyson Foods’ purchase of Hillshire Brands for $8.4 billion. Two other deals were valued at over $5 billion: Microsoft acquired the devices and services business (mobile phones) from Nokia for $7.2 billion, and Anheuser-Busch InBev bought Oriental Brewery from KKR and Af-finity Equity Partners for $6.2 billion.
Restructuring of consumer products industry giants driving M&A activityDespite the flurry of mega deals over the past two years, the con-sumer products industry has learned that a clearly defined growth strategy is critical and that bigger is not necessarily better. The impact of the global recession resulted in a number of companies reevaluating their strategic positioning in order to generate sustain-able earnings and ongoing growth. Many companies started to review their business portfolios to identify underperforming assets or brands that did not leverage core capabilities or support core business growth, with a view to divesting them into a recovering deal market where asset prices are high. As a result, corporate re-structuring is putting a number of assets in play, including flagship and other strong brands, that no longer fit a particular company’s strategic vision where sales proceeds can be better invested into higher-margin , higher-growth categories that ultimately result in EPS accretion in the mid to long term.
A review of recent M&A activity shows that, increasingly, consumer products companies are seeking to dominate leading market posi-tions rather than diversify; to rightsize, not necessarily upsize. In mature industry sectors like tobacco, beverages, appliances, and pet food, among others, companies are regrouping into more focused, streamlined players.
In August 2014, Procter & Gamble, the world’s largest personal care and household products maker, announced it would sell about half its brands in the next two years in a bold attempt to refocus the business on 70 to 80 brands. CEO A.G. Lafley stressed size of sales won’t be the only criteria for shedding brands, declaring even large brands would be sold if they don’t fit strategically into the company’s core businesses. “Less will be much more,” Lafley told analysts. “The objective is growth and much more reliable genera-tion of cash and profit. We’re going to be much more agile and adaptable.” In line with P&G’s strategy to concentrate on its core businesses, the company has already exited or announced plans to exit its pet care and battery businesses.
• In July 2014, P&G completed the divestiture of its pet food business in North America, Latin America and other selected countries to Mars, the privately-held American confectionery and pet food manufacturer, for $2.9 billion. Mars then exercised its option to purchase P&G’s pet businesses in certain markets in Asia Pacific, Middle East, Eastern Europe and Africa. In December, P&G sold its European pet food business to Spectrum Brands for an undisclosed amount.
• P&G is also in the process of exiting the alkaline battery business. The first step was the sale of its majority interest in a China-based battery joint venture, Fujian Nanping Nanfu Battery Co., to a Chinese private equity firm. This was accomplished in Decem-ber 2014. The second step is the exit of the Duracell business. In November 2014, P&G announced an agreement with Berkshire Hathaway in which P&G would exchange a recapitalized Duracell Company for Berkshire Hathaway’s shares of P&G stock. In its November 2014 press release, P&G said that Berkshire’s stock ownership was valued at approximately $4.7 billion, and that it expects to contribute approximately $1.8 billion in cash to the Duracell Company in the pre-transaction recapitalization. The deal is expected to close in the second half of calendar 2015.
Unilever, P&G’s European rival, also continues to benefit from an ongoing plan to streamline its product portfolio, using disposals and acquisitions to focus on key strategic categories. For sev-eral years, the Anglo-Dutch company has been pruning its food portfolio while targeting growth opportunities in its other core categories: personal care, home care, and refreshments. Like P&G, Unilever believes that a more focused company, targeted at growth-oriented categories where it leads the market, should be able to grow faster, create more value, and reduce complexity.
• In the past two years, the company has sold its Skippy pea-nut butter business to Hormel Foods (2013); its Wish-Bone and Western salad dressing brands to Pinnacle Foods (2013); its North American pasta sauce business under the Ragu and Bertolli brands to Mizkan Group (2014); and its Slim-Fast line of diet foods to Kainos Capital (2014)—in addition to numerous smaller deals.
• In December 2014, Unilever announced plans to separate its lower-growth North American and European spreads business into a standalone company to be renamed Unilever Baking, Cooking & Spreading. The unit, which is expected to be fully operational by July 2015, will continue to be owned by Unilever but will have its own dedicated management team.
• The company is targeting acquisitions in the personal care seg-ment in order to build scale and create or sustain leadership positions in faster-growing categories. Unilever announced in January 2015 that it would acquire the Camay soap brand glob-ally, the Zest brand outside of North America and the Caribbean, and a bar soap manufacturing facility in Mexico from P&G for an undisclosed amount. The transaction, which is expected to close during the first half of 2015 subject to necessary regulatory approvals, will help cement Unilever’s global leadership in the skin cleansing category. The company will instantly become the market leader in soaps in Mexico, a priority market for Unilever.
• Unilever also acquired Talenti Gelato & Sorbetto to build scale in the premium ice cream category in the United States.
57Global Powers of Consumer Products 2015
In addition to P&G and Unilever, an analysis of the M&A activity over the past two years and into 2015 shows many other examples of consumer products companies seeking to simplify and focus their businesses around core categories and capabilities, consoli-dating their positions in key product markets.
Thirst for growth in the beverage sector
The prospect of high growth in the alcohol and soft drinks sector is limited in developed markets for all but a few categories, result-ing in companies searching for growth further afield. As emerging economies have become a significant growth driver for beverage companies, a thirst for acquisitions continues to drive brewers and spirits companies in the global drinks market.
• Suntory has been aggressively pursuing foreign acquisitions in an effort to expand outside its mature domestic market. After buying France’s Orangina Schweppes for more than $3 billion in 2009, the company spent $2.1 billion on GlaxoSmithKline’s soft drinks unit, which included the Lucozade and Ribena brands. Suntory’s April 2014 acquisition of U.S. bourbon maker Beam, with its strong global distribution network, was the largest consumer products transaction to be completed in 2014. The deal has amassed a product portfolio of leading global brands that now makes Suntory one of the world’s biggest premium spirits companies.
• Diageo, the world’s biggest distiller, gained control of United Spirits Limited, the largest distiller in India, in July 2014. A con-trolling stake in United Spirits gives the U.K. company the leading position in the world’s largest whiskey market and access to a market-leading distribution platform for its international brands.
Consolidation is still on tap for the brewing industry as a decline in beer consumption in mature markets forces beer makers to look elsewhere for growth.
• In March 2014, Anheuser-Busch InBev repurchased Oriental Brewery, the South Korean brewer, in a transaction valued at more than $6 billion. The deal expands AB InBev’s international footprint and signals its return to the fast-growing Asia-Pacific re-gion, a market it largely abandoned after it sold Oriental Brewery to private equity firm Kohlberg Kravis Roberts in July 2009.
• A year earlier, in June 2013, AB InBev acquired the remaining 50 percent of Mexican brewer Grupo Modelo that it did not already own in a transaction valued at more than $20 billion. In order to go forward with their merger, the companies were required to divest Modelo’s entire U.S. business.
• As a result, U.S.-based Constellation Brands, a leading interna-tional wine, beer, and spirits company, acquired full ownership of Modelo’s U.S. beer business for approximately $4.75 billion. The transaction, completed in June 2013, included Modelo’s 50 percent interest in Crown Imports, a joint venture Constellation formed Modelo in 2006. Also included is Compania Cervecera de Coahuila, Modelo’s state-of-the-art brewery in Mexico, as well as rights in perpetuity to Corona and other Modelo brands distrib-uted by Crown in the United States. The acquisition has nearly doubled Constellation’s sales and established Crown Imports as the third-largest producer of beer for the U.S. market.
Appliance makers vacuum up competitors
After a spate of mergers in the 1980s, appliance makers are once again looking to increase their market share and global footprint through acquisitions. Larger size also allows for higher levels of research and development investment that are crucial in this intensely competitive product sector.
• U.S.-based Whirlpool bought Italian appliance maker Indesit in November 2014. The acquisition will further expand Whirl-pool’s presence beyond its core North American market, which accounted for 53 percent of the company’s 2014 sales.
Meanwhile, Indesit generates more than half its revenue from Western Europe. This acquisition followed Whirlpool’s purchase of a majority stake in Chinese household appliance maker Hefei Rongshida Sanyo Electric Company from SANYO Electric, a sub-sidiary of Panasonic Corporation, in 2013. That deal significantly enhances Whirlpool’s presence in the Asian market, which ac-counted for just 4 percent of its sales in 2014.
• In its largest acquisition ever, Sweden’s AB Electrolux agreed in September 2014 to buy the household appliances business of General Electric for $3.3 billion, a deal that will double its sales in the U.S. market and strengthen its hand as it battles larger rival Whirlpool. The deal includes a 48.4 percent stake in Mexico’s Mabe, one of the largest producers of appliances in Latin America.
• In January 2015, the Bosch Group completed its acquisition of Siemen’s 50 percent share in BSH Bosch und Siemens Hausgeräte for a total consideration of EUR 3 billion ($3.85 billion). The former joint venture will now be run as a wholly owned Bosch subsidiary. Bosch will be allowed to continue to use the Siemens brand in its household appliance offerings in the long term.
• On a smaller scale, Spain’s CNA Group, which began life as Cata Electrodomésticos in 1947 and acquired appliance brands Apelson (2000) and Nodor (2004), picked up all the Spain-based industrial and brand assets of bankrupt appliance maker Fagor Electrodomésticos in September 2014.
58Global Powers of Consumer Products 2015
Big food companies gobble up pet food brands
The relatively recession-resistant pet food market is one of the fastest-growing segments in the food industry. Interest in the health and nutrition of pets is increasing demand for premium products, contributing to market growth—and big food companies have taken notice.
• Big Heart Pet Brands, previously known as Del Monte Foods Pet Products, became the United States’ largest standalone pet food and pet treats company—albeit briefly. The creation of the new brand followed Del Monte Corporation’s $1.67 billion sale of its Consumer Food division to Del Monte Pacific Limited in February 2014. However, Big Heart Pet Brand’s status as an independent company was short-lived. In February 2015, J.M. Smucker, known for its namesake jam, along with Folgers coffee, Jif peanut butter, and other iconic food brands—announced that it would pay about $5.8 billion to buy Big Heart Pet Brands, maker of Meow Mix, Milk-Bone, and a host of other well-known brands.
• That deal follows Mars’ $2.9 billion acquisition of pet-food brands Iams, Eukanuba, and Natura in North America, Latin America, and certain other countries from P&G in August 2014. The deal strengthens Mars’ already large and growing pet care business, which includes billion-dollar pet food brands Pedigree, Whiskas, and Royal Canin, as well as veterinary care provider Banfield Pet Hospital. In November, Mars exercised its option to buy P&G’s pet food businesses in Australia, New Zealand, Taiwan, Singapore, Malaysia, and Brunei.
• In December 2014, Spectrum Brands bought P&G’s European Iams and Eukanuba pet food business for an undisclosed amount. The acquisition will help the company’s United Pet Group expand its existing aquatics and companion animal supplies business into an adjacent category—the dog and cat food market.
Deal activity reignites in tobacco sector
Despite the growth of the electronic cigarette market, which has triggered a flurry of M&A activity in the tobacco industry over the past three years, the shrinking market for traditional cigarettes is forcing big tobacco companies to look elsewhere to counter sagging growth. To offset dwindling sales in developed markets, companies have been acquiring smaller, regional cigarette producers and dis-tributors around the globe. The last blockbuster deal in the tobacco industry was Japan Tobacco’s acquisition of Britain’s Gallaher Group for $15 billion in 2007. All that is about to change, however, as the industry is set to experience a major upheaval in 2015.
• In July 2014, Reynolds American agreed to acquire Lorillard in a complex transaction that will result in the biggest industry shake-up since R.J. Reynolds merged with British American Tobacco subsidiary Brown & Williamson more than a decade ago to form Reynolds American. That deal gave BAT a 42 percent stake in its American rival. The new mega deal, valued at more than $27 billion, is anticipated to be completed in the first half of 2015.
• Concurrently, as a result of competition concerns over the tie-up between the number two and three players in the U.S. market (behind Altria), the UK’s Imperial Tobacco Group was given the opportunity to pick up brands and assets. The company agreed to acquire the Winston, Maverick, Kool, Salem, and blu cigarette brands of Reynolds American for $7.1 billion, plus the national sales force, offices, and production facilities owned by Lorillard. The deal, which will greatly enhance Imperial’s footprint in the U.S. market, is conditional upon completion of the acquisition of Lorillard by Reynolds.
• Additionally, BAT has agreed to invest $4.7 billion as part of Reynolds’ proposed acquisition of Lorillard, enabling the company to maintain its 42 percent equity position in the enlarged business.
M&A OutlookAs 2015 unfolds, organic growth remains a challenge for many consumer products companies. As a result, companies will con-tinue to view strategic acquisitions as a fast-track method to:
• establish or reinforce a leadership position in core product cat-egories, particularly with premium brands;
• move into adjacent product categories;
• expand into faster-growing geographic markets;
• secure well-established brands in developed markets;
• capitalize quickly on high-growth emerging market trends; and
• drive out costs by achieving economies of scale through consolidation.
Bolstered by a favorable financing environment, the pace of M&A activity has accelerated over the past two years as companies reposition their businesses to support sustainable growth, both in sales and earnings, and create long-term value. Over the next few years, we expect consumer products companies to continue to use acquisitions and disposals to streamline and focus their product portfolios, making their organizations more agile and responsive in an effort to drive underlying growth. The industry has learned that success requires purposeful, profitable growth. Economies of scale and operational efficiencies are worthy goals of a successful acquisition, but only if coupled with a company’s specific, strategic growth objectives.
For more information on M&A activity and trends in the consumer products industry, see the “Deloitte Consumer Products M&A Insights: Summer 2014.”
59Global Powers of Consumer Products 2015
Q ratio analysis
In this report, we rank the world’s largest consumer products com-panies by revenue. While the size of a company is interesting, it does not necessarily tell us anything about the prospects for future perfor-mance. Large size simply demonstrates that a company performed well in the past and has, consequently, achieved scale. Moreover, the market capitalization of a publicly traded consumer products company, examined alone, says something about past performance – even if only recently – but not necessarily about the future.
However, we can examine financial information in order to learn something about possible future performance. With that goal in mind, we have analyzed the Q ratio of consumer products com-panies over the last seven years. Our goal has been to learn how financial markets are evaluating the future prospects of the world’s largest publicly traded consumer products companies. The Q ratio enables us to infer whether companies are strong in such areas as brand, differentiation, and innovation.
What is the Q ratio?The Q ratio is the ratio of a publicly traded company’s market capi-talization to the value of its tangible assets. If this ratio is greater than one, it means that financial market participants believe that a company’s non-tangible assets have value. These include such things as brand equity, differentiation, innovation, customer experi-ence, market dominance, customer loyalty, and skillful execution. The higher the Q ratio, the greater share of a company’s value that stems from such intangibles. A Q ratio of less than one, on the other hand, indicates failure to generate value on the basis of even tangible assets. It indicates that the financial markets view
a consumer products company’s strategy as unable to generate a sufficient return on physical assets. Indeed, it suggests an arbitrage opportunity. That is, if a company’s Q ratio is less than one, a com-pany could, theoretically, be purchased through equity markets and the tangible assets could then be sold at a profit.
Why do we care about the Q ratio?In recent years, one of the biggest challenges facing consumer products companies has been the squeezing of margins due to commoditization. That is, consumers often view the brands pro-duced by these companies as undifferentiated from one another except on the basis of price. This trend has been exacerbated by the ability of consumers to use the Internet, and especially mobile devices, to compare prices and products. In addition, the rise of popular private labels at major retailers has provided consumer product companies with serious competition and has exacerbated the trend toward commoditization. This has driven down prices and, therefore, margins. Only the lowest cost leaders in any prod-uct segment can compete primarily on the basis of price. All others must do something else. The antidote to commoditization, of course, is to differentiate through better customer experience and innovation, and to communicate this differentiation to consumers through good brand management. Consequently, a high Q ratio suggests that the financial markets believe a company is doing the right things to succeed in a business environment characterized by commoditization. A Q ratio less than one may indicate that the financial markets believe a company is failing to use its physical assets in a profitable manner.
What do the numbers show?This year we calculated the Q ratio for 186 publicly traded consum-er products companies. The composite Q ratio (calculated by taking the sum of all companies’ market capitalization and dividing by the sum of all companies’ asset values) is 1.467 versus a composite Q ratio of 1.302 last year. Given the recovery in the global economy and the rise in equity prices in many markets, it is not surprising that the composite Q ratio has risen. The average Q ratio is 1.656.
Here are some of the highlights of our analysis:
• The companies on the list with the highest Q ratios come from a mix of industries, but come mostly from the United States. Of the 20 top companies on the list, 15 are from the United States, up from 10 last year. Four of the remaining five come from Asia. First on the list once again is ITC Limited from India. It is one of India’s large conglomerates producing a wide range of fast mov-ing consumer goods. Among the top 20 companies by Q ratio are such iconic brand names as Apple, Nike, Hershey, and Estee Lauder. The relatively high Q ratios that characterize these com-panies reflect financial market confidence in their future ability to generate profits based on strong brands. Yet no company should ever rest on its laurels. The bottom of our list (which we do not publish) includes many names that once dominated their indus-tries, only to be eclipsed by innovative upstarts. Hence, a high Q ratio is no guarantee of future success. But it does suggest financial market confidence that the brand has legs on which to stand. Also notable is that of the 20 companies at the bottom of our Q ratio list, 10 come from Japan.
60Global Powers of Consumer Products 2015
• Composite Q ratios were calculated by country and region. We calculated a country composite Q ratio only if a country has three or more publicly traded companies on our top 250 list. The country with the highest composite Q ratio is the United States followed by the UK, Switzerland, and China. While in the last few years Japan had the lowest Q ratio, in this year Turkey has the lowest composite Q ratio. Low Q ratios are also found in Japan, Brazil, Taiwan, and Sweden.
• We also looked at the composite Q ratio by region. Not surprising-ly, the region with the highest Q ratio is North America followed by Europe. The lowest Q ratios are found in the Africa/Middle East region and in the Asia Pacific region. However, when Japan is excluded from the latter, the composite Q ratio is much higher.
• Composite Q ratios were also calculated based on a company’s primary product sector. Not surprisingly, the industry with the highest composite Q ratio is apparel and accessories. Success in fashion usually requires strong brand identity, so this is to be expected. The other industries with relatively high composite Q ratios were personal and household products; electronic prod-ucts; and food, drink, and tobacco. However, it should be noted that the electronic products category is dominated by Apple. When this very large company is excluded, the composite Q ratio for the electronic products sector is the lowest among industries. The other industries with low composite Q ratios are tires, home furnishing, and home improvement.
• This year, for the second time, we ask the question whether the size of a company, either in terms of revenue or market capital-ization, influences the Q ratio. We found that the top 20 com-panies ranked by revenue had a considerably higher composite Q ratio than the bottom 20. However, market capitalization appears to be of even greater importance. The top 20 companies ranked by market capitalization had a far higher composite Q ratio than the bottom 20. Evidently, the value that the financial markets assign to a company is closely correlated with whether the company makes good use of its value.
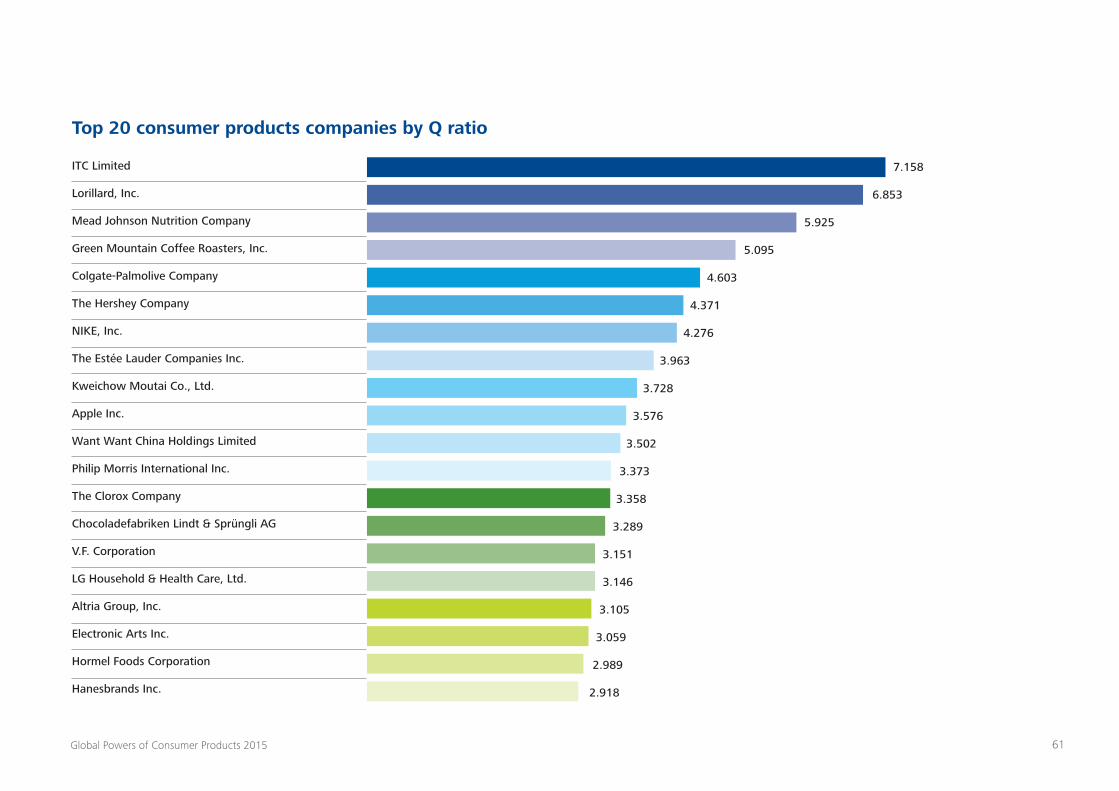
61Global Powers of Consumer Products 2015
Top 20 consumer products companies by Q ratio
ITC Limited
Lorillard, Inc.
Mead Johnson Nutrition Company
Green Mountain Coffee Roasters, Inc.
Colgate-Palmolive Company
The Hershey Company
NIKE, Inc.
The Estée Lauder Companies Inc.
Kweichow Moutai Co., Ltd.
Apple Inc.
Want Want China Holdings Limited
Philip Morris International Inc.
The Clorox Company
Chocoladefabriken Lindt & Sprüngli AG
V.F. Corporation
LG Household & Health Care, Ltd.
Altria Group, Inc.
Electronic Arts Inc.
Hormel Foods Corporation
Hanesbrands Inc.
7.158
6.853
5.925
5.095
4.603
4.371
4.276
3.963
3.728
3.576
3.502
3.373
3.358
3.289
3.151
3.146
3.105
3.059
2.989
2.918
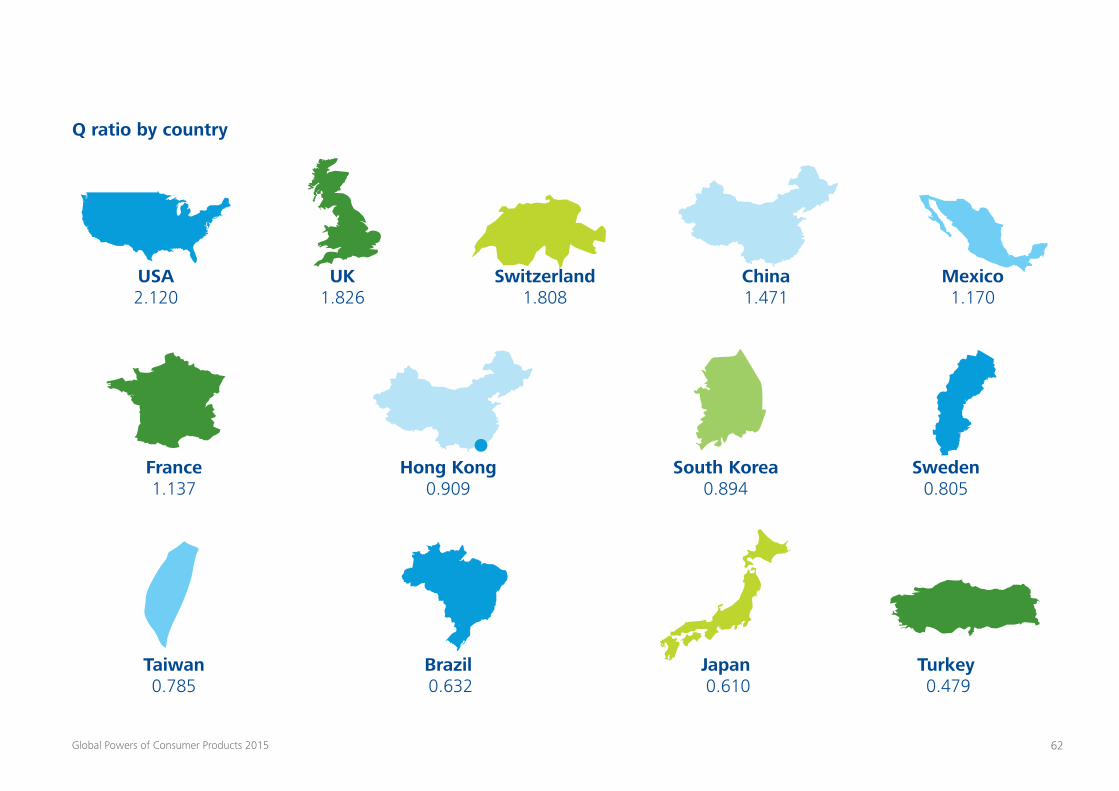
62Global Powers of Consumer Products 2015
Q ratio by country
USA 2.120
France 1.137
Taiwan 0.785
UK 1.826
Hong Kong 0.909
Brazil 0.632
Switzerland 1.808
South Korea 0.894
Japan 0.610
China 1.471
Sweden 0.805
Turkey 0.479
Mexico 1.170
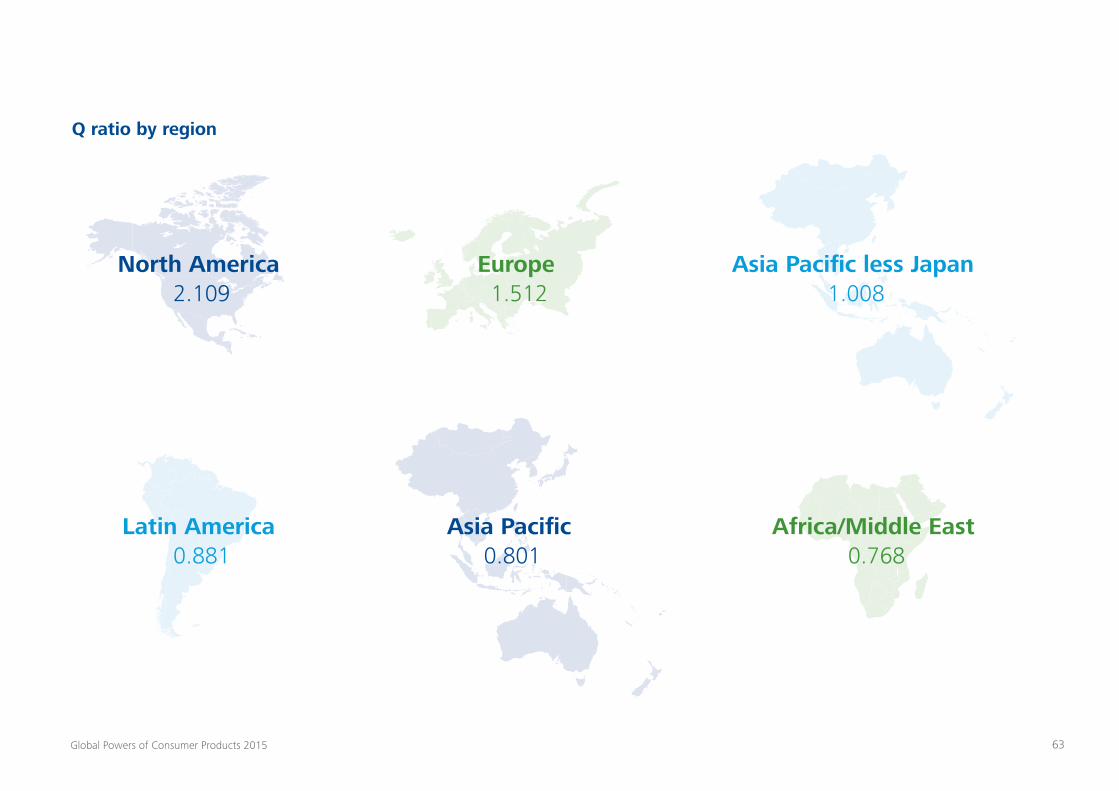
63Global Powers of Consumer Products 2015
Q ratio by region
North America 2.109
Latin America 0.881
Asia Pacific 0.801
Africa/Middle East 0.768
Europe 1.512
Asia Pacific less Japan 1.008
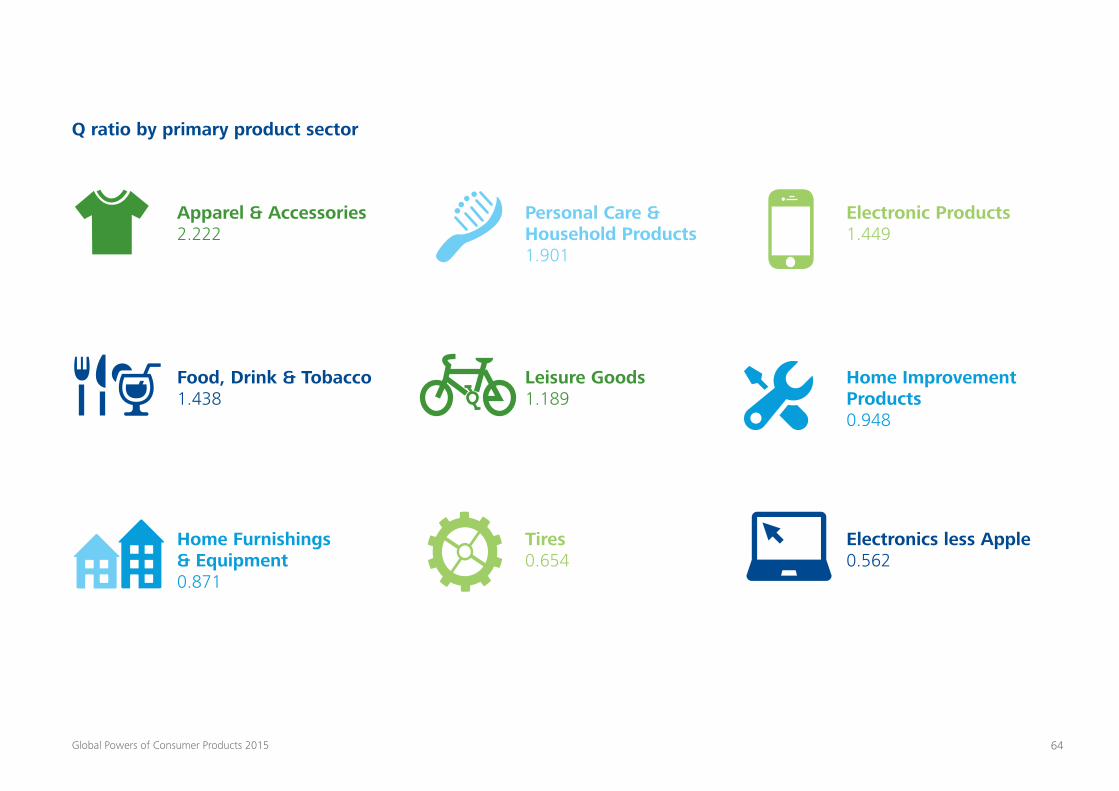
64Global Powers of Consumer Products 2015
Q ratio by primary product sector
Apparel & Accessories 2.222
Personal Care & Household Products 1.901
Electronic Products 1.449
Food, Drink & Tobacco 1.438
Leisure Goods 1.189
Home Improvement Products 0.948
Home Furnishings & Equipment 0.871
Tires 0.654
Electronics less Apple 0.562
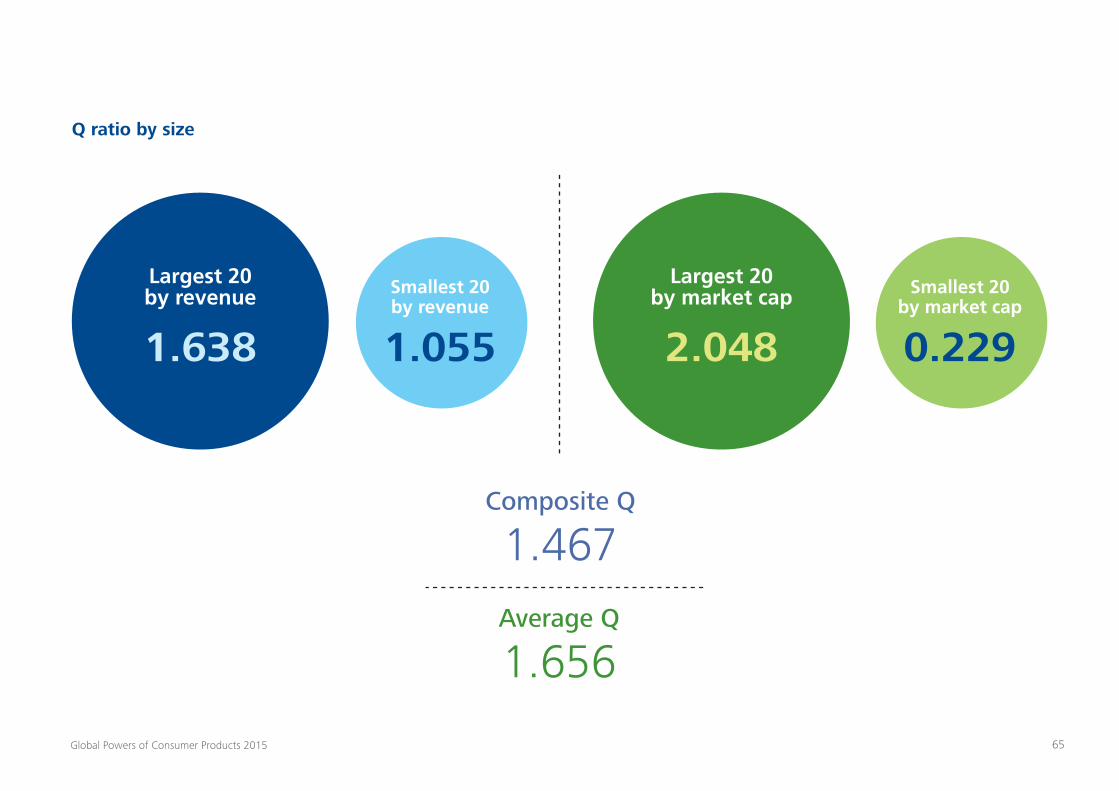
65Global Powers of Consumer Products 2015
Q ratio by size
1.638 2.0481.055 0.229
Largest 20 by revenue
Largest 20 by market capSmallest 20
by revenueSmallest 20
by market cap
Composite Q
1.467Average Q
1.656
66Global Powers of Consumer Products 2015
Study methodology and data sources
To be considered for the Top 250 Global Powers of Consumer Products, a company must first be designated as a manufacturer (primary SIC code 20-39). Each company is then analyzed in an attempt to determine if the majority of its sales are derived from consumer products versus commercial or industrial products. Broadly defined, these are products produced for and purchased by the ultimate consumer. Generally, these products are marketed under well-known consumer brands. We have excluded contract manufacturers—organizations that make products primarily under contract for other companies—and included only companies whose brands are on the final products. Motor vehicle manufac-turers and pharmaceutical companies are also excluded, as these industries are not relevant to the vast majority of the target audience for this analysis.
Companies whose primary business was the sale of consumer products were included among the Top 250 based on their total fiscal 2013 net sales, which may include sales of commercial and industrial products as well as consumer products. Net sales also include licensing revenue and royalty income where applicable. Excise taxes were excluded from the sales of tobacco and drinks companies where possible. Our fiscal 2013 definition encompasses companies’ fiscal years ended through June 2014.
A number of sources were consulted to develop the Top 250 list. The principal data sources for financial information were annual reports, SEC filings, and information found in companies’ press re-leases, fact sheets, or websites. If company-issued information was not available, other public-domain sources were used, including industry analyst reports, various business information databases, and trade journal estimates.
In order to provide a common base from which to rank the com-panies, net sales for non-U.S. companies were converted to U.S. dollars. Exchange rates, therefore, have an impact on the results. OANDA.com was the source used for the exchange rates. The average daily exchange rate corresponding to each company’s fis-cal year was used to convert that company’s results to U.S. dollars. However, the growth rates and profit margin reported for indi-vidual companies are calculated in each company’s local currency.
Group financial resultsSales-weighted, currency-adjusted composites are used to report the financial results of groups of companies. This means the results of larger companies contribute more to the composite than do results of smaller companies. To calculate results for groups of companies that may report in a variety of currencies, and to facili-tate comparison among groups, it also means that data must first be converted to U.S. dollars. In order to eliminate the impact of fluctuations in exchange rates over time, composite growth rates also are adjusted to correct for currency movement.
Composites and averages for each group were based only on companies with data. Not all data elements were available for all companies.
It should also be noted that the financial information used for each company in a given year is as originally reported. Although a company may have restated prior-year results to reflect a change in its operations (e.g., the divestiture of a business unit), such restatements are not reflected in this data. This study is intended to provide a snapshot of the consumer products industry at a point in time. It is also intended to reflect market dynamics and their impact on the structure of the industry over a period of time. As a result of these factors, the growth rates reported for individual companies may not correspond to other published results.
67Global Powers of Consumer Products 2015
Contacts
Global (DTTL)
Global Industry Leader, Consumer Business Antoine de Riedmatten [email protected]
Global Sector Leader, Consumer Products Jack Ringquist [email protected]
Chief Global Economist Ira Kalish [email protected]
Consumer Business Marketing Kathryn Cordes [email protected]
North America
Canada Ryan Brain [email protected]
United States Pat Conroy Deloitte LLP [email protected]
Europe, Middle East and Africa (EMEA)
Belgium Eric Desomer [email protected]
Consumer products contacts for Deloitte Touche Tohmatsu Limited (DTTL) and its member firms
Central Europe Aaron Martin [email protected]
Czech Republic Martin Tesař [email protected]
Denmark Jesper Povlsen [email protected]
East Africa John Kiarie [email protected]
Finland Jussi Sairanen [email protected]
France Stéphane Rimbeuf [email protected]
Germany Karsten Hollasch [email protected]
Greece Dimitris Koutsopoulos [email protected]
Ireland Kevin Sheehan [email protected]
Israel Israel Nakel [email protected]
Italy Dario Righetti [email protected]
Middle East Herve Ballantyne [email protected]
Netherlands Erik Nanninga [email protected]
Norway Jonathan Farnell [email protected]
Poland Dariusz Kraszewski [email protected]
Portugal Luís Belo [email protected]
Russia/CIS Egor Metelkin [email protected]
South Africa Andre Dennis [email protected]
68Global Powers of Consumer Products 2015
Spain Fernando Pasamon [email protected]
Sweden Joakim Torbjorn [email protected]
Switzerland Howard da Silva [email protected]
Turkey Ozgur Yalta [email protected]
United Kingdom Nigel Wixcey [email protected]
West Africa Alain Penanguer [email protected]
Latin America
Latin America Consumer Business Leader Reynaldo Saad [email protected]
Argentina Daniel Varde [email protected]
Brazil Reynaldo Saad [email protected]
Chile Cristian Alvarez [email protected]
Colombia Juan Sanchez [email protected]
Mexico Luis Castañeda [email protected]
Omar Camacho [email protected]
Peru Francisco Revelo [email protected]
Venezuela Ignacio Rodriguez [email protected]
Asia Pacific
Asia Pacific Consumer Business Leader Yoshio Matsushita [email protected]
Australia Katie McNamara [email protected]
China David Lung [email protected]
India Shyamak Tata [email protected]
Indonesia Jose Sabater [email protected]
Japan Yoshio Matsushita [email protected]
Korea Jae Hoon Lee [email protected]
Malaysia Jeffrey Soo [email protected]
Philippines Bonifacio Lumacang [email protected]
SEA & Singapore Eugene Ho [email protected]
Taiwan Jason Ke [email protected]
Thailand Manoon Manusook [email protected]
Vietnam Nguyen Vu Duc [email protected]

69Global Powers of Consumer Products 2015
About DeloitteDeloitte refers to one or more of Deloitte Touche Tohmatsu Limited, a UK private company limited by guarantee (“DTTL”), its network of member firms, and their related entities. DTTL and each of its member firms are legally separate and independent entities. DTTL (also referred to as “Deloitte Global”) does not provide services to clients. Please see www.deloitte.com/about for a more detailed description of DTTL and its member firms.
Deloitte provides audit, consulting, financial advisory, risk management, tax and related services to public and private clients spanning multiple industries. With a globally connected network of member firms in more than 150 countries, Deloitte brings world-class capabilities and high-quality service to clients, delivering the insights they need to address their most complex business challenges. Deloitte’s more than 210,000 professionals are committed to becoming the standard of excellence.
This publication contains general information only, and none of Deloitte Touche Tohmatsu Limited, its member firms, or their related entities (collectively, the “Deloitte Network”) is, by means of this publication, rendering professional advice or services. Before making any decision or taking any action that may affect your finances or your business, you should consult a qualified professional adviser. No entity in the Deloitte Network shall be responsible for any loss whatsoever sustained by any person who relies on this publication.
© 2015. For information, contact Deloitte Touche Tohmatsu Limited.