epidemiology of covid-19 in manitoba: march 12 to may 1, 2020
TRANSCRIPT

Government of Manitoba
Epidemiology of COVID-19 in Manitoba: March 12 to May 1, 2020
Provincial Information Management and Analytics Epidemiology and Surveillance Unit July 8, 2020

1
Contents Acknowledgements ..................................................................................................................................................3
Acronyms ..................................................................................................................................................................4
Background ..............................................................................................................................................................5
Public Health Surveillance ....................................................................................................................................5
COVID-19 in Manitoba .........................................................................................................................................5
Epidemiology and Surveillance Unit .....................................................................................................................8
Public Health Information Management System (PHIMS) ...................................................................................8
Purpose of the Report ..........................................................................................................................................8
Summary of Findings ................................................................................................................................................9
Section 1: Descriptive Epidemiology of COVID-19 Cases .................................................................................... 10
Objective ............................................................................................................................................................ 10
Epidemic Curve ................................................................................................................................................. 10
Demographics ................................................................................................................................................... 10
Sex................................................................................................................................................................. 10
Age ................................................................................................................................................................ 11
Regional Health Authority / Responsible Organization ................................................................................. 11
Symptoms ...................................................................................................................................................... 12
Pediatric Cases ............................................................................................................................................. 12
Severity of Illness .............................................................................................................................................. 12
Hospitalizations and Underlying Health Conditions ...................................................................................... 12
Fatalities ........................................................................................................................................................ 13
Case Acquisition Types ..................................................................................................................................... 14
Health Care Workers ......................................................................................................................................... 15
Outbreaks .......................................................................................................................................................... 16
Section 2: Testing Data ......................................................................................................................................... 18
Objective ............................................................................................................................................................ 18
Background ....................................................................................................................................................... 18
Test Positivity ................................................................................................................................................ 19
Distribution of Samples by Sex, Age Group, and Region ................................................................................. 19
COVID-19 Testing in People Experiencing Homelessness .............................................................................. 21
Section 3: COVID-19 Contacts .............................................................................................................................. 23
Objective ............................................................................................................................................................ 23
Number of Contact Investigations ..................................................................................................................... 23
Contacts Types .................................................................................................................................................. 23
Conclusion ............................................................................................................................................................. 25
Appendix 1: Surveillance Definitions ..................................................................................................................... 26
Figure 1. Public health actions in Manitoba, January – April 2020 ............................................................................6
Figure 2. Overview of COVID-19 public health approach (emphasis on surveillance) ..............................................7
Figure 3. Epidemic curve of COVID-19 cases in Manitoba, by case type ............................................................... 10
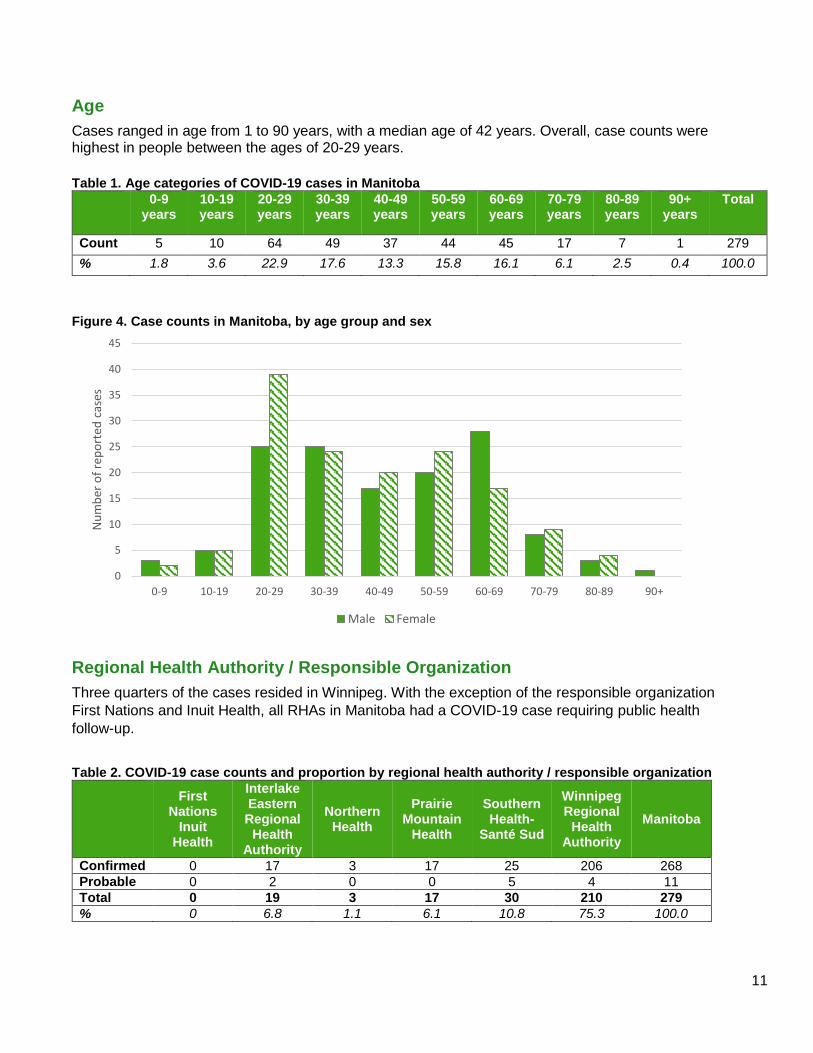
Figure 4. Case counts in Manitoba, by age group and sex ..................................................................................... 11

2
Figure 5. Distribution of demographic characteristics among hospitalized COVID-19 cases in Manitoba, March 12 – May 1, 2020 (n=30) .............................................................................................................................. 13
Figure 6. Number of COVID-19 cases by reported date and acquisition type in Manitoba, March 13 – May 1, 2020 (N=279) ................................................................................................................................................... 14
Figure 7. Proportion of COVID-19 cases by acquisition type in Manitoba, March 13 – May 1, 2020 (N=279) ....... 14
Figure 8. Distribution of COVID-19 cases among health care workers by age group and sex in Manitoba (n=36) 15
Figure 9. Epidemic curve of COVID-19 cases among health care workers by acquisition type (n=36) .................. 16
Figure 10. Evolving COVID-19 testing criteria in Manitoba ..................................................................................... 18
Figure 11. Average daily testing volume and positivity (%) for COVID-19 by week of specimen received date in Manitoba, 2020........................................................................................................................................ 19
Figure 12. COVID-19 test percent positivity by sex in Manitoba, March 12 - May 1, 2020 ..................................... 20
Figure 13. COVID-19 test percent positivity by age group in Manitoba, March 12 - May 1, 2020 .......................... 20
Figure 14. COVID-19 test percent positivity by RHA in Manitoba, March 12 - May 1, 2020 ................................... 20
Figure 15. Types of shelter for people experiencing homelessness who received a COVID-19 test ..................... 21
Figure 16. Number of tests performed on people in Manitoba experiencing homelessness .................................. 22
Figure 17. Sex breakdown for people tested for COVID-19 .................................................................................... 22
Figure 18. Number of contacts identified by Manitoba cases.................................................................................. 24
Table 1. Age categories of COVID-19 cases in Manitoba ....................................................................................... 11
Table 2. COVID-19 case counts and proportion by regional health authority / responsible organization ............... 11
Table 3. Reported symptoms in pediatric cases ..................................................................................................... 12
Table 4. Distribution of chronic conditions among COVID-19 cases in Manitoba by hospitalization outcome, March 12 – May 1, 2020 (N=279) ................................................................... 13
Table 5. Demographics of cases with COVID-19 who died .................................................................................... 13
Table 6. Description of COVID-19 outbreaks occurring between March 12 and May 1 in Manitoba ...................... 17
Table 7. Number of COVID-19 contact investigations per individual contact (n=994 contacts) ............................. 23
Table 8. Number of contact investigations by exposure setting .............................................................................. 24

3
Acknowledgements In the spirit of reconciliation, and in honour and respect for our First Nations, Métis, and Inuit
neighbours, Manitoba Health, Seniors and Active Living (MHSAL) would like to acknowledge our
privilege and the gift it is to live and work in these provincial lands. We acknowledge that Manitoba
exists within Treaty Territories One through Five—the homelands of the Anishinaabeg Oji-Cree and
Ojibwe, Cree, Dakota, and Dené peoples, and on the original homeland of the Métis Nation.
MHSAL would also like to acknowledge the important efforts of public health professionals and health
care providers across the province involved in the follow-up with people living with COVID-19 and
reporting surveillance information to the provincial surveillance system. Your continued efforts to
provide timely and accurate information are foundational to this work and the health of all Manitobans.
A special acknowledgement also to the Health Information Management Program at Red River College,
the Chronic Disease Institute at the University of Manitoba, and Shared Health for providing dedicated
staff to the MHSAL Surveillance Unit as part of the provincial COVID-19 response. This team came
together and ensured that data were updated accurately in PHIMS, providing timely information for
decision makers.
Finally, we wish to acknowledge the people in Manitoba who are impacted directly and indirectly by
COVID-19. This pandemic has demonstrated how quickly public health measures can impact our lives.
We thank you for your efforts toward keeping Manitobans healthy and recognize how difficult this has
been for so many.

4
Acronyms CPL Cadham Provincial Laboratory
IERHA Interlake-Eastern Regional Health Authority
HCW Healthcare worker
MHSAL Manitoba Health, Seniors and Active Living
MHSU Manitoba Health Surveillance Unit
NHR Northern Health Region
PHAC Public Health Agency of Canada
PHIMS Public Health Information Management System
PCR Polymerase Chain Reaction
PMH Prairie Mountain Health
RHA Regional Health Authority
SH-SS Southern Health – Santé Sud
WHO World Health Organization
WRHA Winnipeg Regional Health Authority

5
Background Public Health Surveillance
In Section 82(1), Manitoba’s Public Health Act establishes guidelines around health surveillance:
The minister has the authority to establish and maintain, or cause to be established and maintained, a provincial system of health surveillance for the ongoing, systematic collection, analysis, interpretation, publication and distribution of information necessary to
(a) gain an overall understanding of the health status of Manitobans; (b) anticipate, assess, monitor and plan for health needs and threats to public health; (c) monitor and evaluate developments respecting public health and threats to public health; (d) guide decisions and actions respecting public health; (e) monitor and evaluate public health services; (f) facilitate public health research and planning; (g) produce public health advisories, reports and other notices; or (h) permit timely access to and distribution of information.
Therefore, in the case of the COVID-19 pandemic, the Epidemiology and Surveillance Unit has a responsibility to track, analyze and report on cases and contacts. Gathering the required information relies on a network of actions from a range of provincial public health stakeholders, each with the goal to prevent further spread of disease.
This report breaks down data from several data sources, to better inform public health planning and response.
COVID-19 in Manitoba
The first case of COVID-19 in Manitoba was reported on March 12, 2020. Prior to this first case, planning had already been underway at the provincial and regional levels. In the days, weeks and months since, various public health measures were implemented to reduce transmission (see Figure 1).

6
Figure 1. Public health actions in Manitoba, January – April 2020
CPPHO = Chief Provincial Public Health Officer FNHSSM = First Nations Health and Social Secretariat of Manitoba
To understand how surveillance data are collected and collated in Manitoba, a simplified overview of the public health approach is seen in Figure 2. This would be a typical surveillance path that an individual diagnosed with COVID-19 would enter, but there are always exceptions. For example, for probable cases, there might not be a laboratory component to the process.

7
Figure 2. Overview of COVID-19 public health approach (emphasis on surveillance)
Sample Collection
• An individual is swabbed by a health care worker using a nasopharyngeal swab
• Samples are collected at COVID-19 testing sites, or in other health care settings, such as hospitals
Testing
• PCR (polymerase chain reaction) testing is conducted to detect SARS-CoV-2 (the virus that causes COVID-19)
• Most testing is performed centrally at Cadham Provincial Laboratory, with additional testing at Dynacare Laboratories
Test Results
• All test results go back to the ordering practioner
• Positive test results are also sent to the MHSAL Surveillance Unit (MHSU)
Open investi-gation
• MHSU clerks enter the positive laboratory result in the Public Health Information Management System (PHIMS) and open a COVID-19 investigation for the individual
• Results are sent to the appropriate Regional Health Authority (RHA) for follow-up of the individual
Investi-gation
• Public Health Nurses interview the individual to find out more about their illness, determine how they may have acquired the virus, provide education, and connect them with appropriate resources during their isolation period
• Staff also conduct contact tracing to find out about others who the case may have been in contact with while they were infectious. Contacts are informed they've been exposed to a COVID-19 case (without revealing identities) and are monitored for symptoms in order to reduce further potential spread of the virus
• This information is sent back to the MHSU for entry, or entered directly into PHIMS by RHAs
Case and contact
follow-up
• RHAs actively follow cases until they have recovered, and contacts until their 14-day monitoring period is over
• When an investigation is over, this information is sent back to the MHSU for entry, or entered directly into PHIMS by RHAs
Data analysis
• Epidemiologists analyze the data, providing provinical and regional trends to internal and external stakeholders
• In some instances, data are linked with administrative datasets to gain further understanding of cases
Action
• Data insights are used by public health leadership to generate provincial guidance, and control strategies

8
Epidemiology and Surveillance Unit
During the first one-and-a-half months of COVID-19 reaching and infecting people in Manitoba, there
were approximately 25 people dedicated to COVID-19 within the Epidemiology and Surveillance Unit.
Roughly two-thirds of the team were involved with surveillance and one-third with the
epidemiology/reporting.
Although this first grouping of cases has concluded, the ongoing work of the Epidemiology and
Surveillance Unit remains quite constant. In terms of reporting, this includes but is not limited to:
providing daily data extracts for various stakeholders, preparing the daily situational report for the
Public Health Operations Table, conducting analyses on populations of interest, preparing the weekly
regional and health care worker (HCW) reports, modelling the trajectory of COVID-19 in Manitoba,
maintaining an online weekly report for public distribution, and responding to regional and media
requests. The team works closely with colleagues in Information Management and Analytics to produce
complimentary data products and to share expertise.
Public Health Information Management System (PHIMS)
The Public Health Information Management System (PHIMS) is the central clinical and surveillance
platform used for COVID-19. Laboratory and investigation data are entered in PHIMS based on data
received from the supporting laboratories and regional public health offices. Epidemiologists then
review laboratory reports and case investigation form data for each case, cross-reference against other
data sources (e.g. hospitalization data, occupational health and safety data), and liaise with regional
coordinators to ensure accuracy.
Operationally, the epidemiology team works closely with other provincial/territorial and national partners
to ensure provincial data are accurately used. For example, the Public Health Agency of Canada
(PHAC) is provided with case details on a daily basis, and a data cut is prepared daily for use by the
Provincial Contact Call Centre.
Purpose of the Report
Approximately seven weeks after its first reported case, Manitoba appears to have concluded the first
major grouping of COVID-19 cases, as daily case counts appear to have peaked and have trended
downward to very low levels of case reporting (0-5 cases per day). Manitoba’s experience appears to
be unique nationally: compared to many jurisdictions, Manitoba has had fewer cases, a tighter rise and
fall in infection counts, and fewer critical outbreaks in places like long-term care facilities. This may be
in direct relation to the public health measures imposed. As time goes on, more research will be done
to better understand the Manitoba experience. For now, it is important to reflect on the dynamics of
these seven weeks, to better prepare Manitoba for the likelihood of a resurgence of COVID-19 cases.
The purpose of this report is to provide the reader with a descriptive epidemiological summary of COVID-19 infections in Manitoba between March 12 and May 1. The report is set up in three sections to provide quick access to specific information relating to three key parts of the COVID-19 “story” in Manitoba: cases, testing, and contacts.

9
Summary of Findings We are describing this first group of infections in Manitoba as being from March 12 to May 1, 2020; the first case was announced March 12th and after May 1st, the case numbers diminished considerably. Thus, the analysis presented in this report will reflect that unique time period.
By 7:00 am May 1st, data on 279 COVID-19 cases and 1,325 contact investigations were available in PHIMS. There have been 144 (51.6%) cases reported in females and 135 (48.4%) in males. Among female cases, four reported being pregnant. Cases ranged in age from 1 to 90 years, with a median age of 42 years. Overall, case counts were highest in people between the ages of 20-29 years. All Regional Health Authorities (RHAs) in Manitoba reported a COVID-19 case requiring Public Health follow-up. Three quarters of the cases reside within the Winnipeg Regional Health Authority (WRHA). Manitobans with confirmed or probable COVID-19 typically report symptoms like cough (includes dry, productive and unspecified), headache, fever, chills, and muscle pain.
There were 30 hospitalizations reported during this period. Cases who were treated in hospital had a much higher prevalence of chronic conditions (e.g. hypertension) than non-hospitalized cases. Six Manitobans who tested positive for COVID-19 subsequently died; most had a history of underlying chronic conditions.
The type of acquisition has changed over time: when cases were first reported in mid-March, the majority of cases were travel acquired and primarily noted international destinations. Gradually, both cases reporting domestic travel and cases reporting close contact to a known case began to increase. Unknown acquisition, an indication of community spread, appeared to have begun in Manitoba around March 27. Since the beginning of April, only sporadic cases related to travel have been reported. From this point, the majority of cases were either classified as close contact of a known case or unknown acquisition.
Thirty-six HCWs tested positive for COVID-19, which represents 13% of all COVID-19 cases. The most commonly reported occupation was nursing (36%), and the majority of HCW cases were female (81%). The initial HCW cases were primarily acquired through travel, and shifted over the following weeks to close contact of a known case and unknown acquisition. Cases predominantly worked in WRHA health care facilities (86%).
There were 1325 contact investigations captured in PHIMS, representing 994 individuals. Contacts may have been named multiple times by different cases; therefore, some contacts will have multiple contact investigations. The majority of contacts were named once or twice by cases (80% and 16%, respectively). The most commonly reported exposure setting among contact investigations was household exposure (43%), followed by community contact (36%), public facilities (29%), and travel (6%).

10
Section 1: Descriptive Epidemiology of COVID-19 Cases
Objective
The objective of this section is to describe the 279 COVID-19 cases according to individual and population characteristics, timing of case were reporting to the Manitoba Health Surveillance Unit, and location.
Epidemic Curve
The epidemic curve below shows the probable and confirmed cases based on the date Public Health
received the lab report. The case definitions can be found here. From time to time, cases will be removed
(for example, a false positive) or their category might be changed (for example, from a probable to a
confirmed case); this is a standard part of the surveillance process.
Effective 7:00 am May 1, 2020, there were 279 COVID-19 cases reported to the Manitoba Health
Surveillance Unit (MHSU).
Figure 3. Epidemic curve of COVID-19 cases in Manitoba, by case type
Demographics Sex
In total, there were 144 (51.6%) cases reported in females and 135 (48.4%) in males. Among female cases, four reported being pregnant. The age range of the pregnant women was 28 to 33 years. All pregnant women were from the WRHA and noted acquisition as being travel related (n=2), close contact (n=1), or unknown (n=1). Two were also HCWs.
0
5
10
15
20
25
30
35
13
-Mar
15
-Mar
17
-Mar
19
-Mar
21
-Mar
23
-Mar
25
-Mar
27
-Mar
29
-Mar
31
-Mar
02
-Ap
r
04
-Ap
r
06
-Ap
r
08
-Ap
r
10
-Ap
r
12
-Ap
r
14
-Ap
r
16
-Ap
r
18
-Ap
r
20
-Ap
r
22
-Ap
r
24
-Ap
r
26
-Ap
r
28
-Ap
r
30
-Ap
r
Nu
mb
er o
f re
po
rted
cas
es
Reported Date
Confirmed Probable
11
Age
Cases ranged in age from 1 to 90 years, with a median age of 42 years. Overall, case counts were highest in people between the ages of 20-29 years.
Table 1. Age categories of COVID-19 cases in Manitoba
0-9 years
10-19 years
20-29 years
30-39 years
40-49 years
50-59 years
60-69 years
70-79 years
80-89 years
90+ years
Total
Count 5 10 64 49 37 44 45 17 7 1 279
% 1.8 3.6 22.9 17.6 13.3 15.8 16.1 6.1 2.5 0.4 100.0
Figure 4. Case counts in Manitoba, by age group and sex
Regional Health Authority / Responsible Organization
Three quarters of the cases resided in Winnipeg. With the exception of the responsible organization
First Nations and Inuit Health, all RHAs in Manitoba had a COVID-19 case requiring public health
follow-up.
Table 2. COVID-19 case counts and proportion by regional health authority / responsible organization
First
Nations Inuit
Health
Interlake Eastern Regional
Health Authority
Northern Health
Prairie Mountain
Health
Southern Health-
Santé Sud
Winnipeg Regional
Health Authority
Manitoba
Confirmed 0 17 3 17 25 206 268
Probable 0 2 0 0 5 4 11
Total 0 19 3 17 30 210 279
% 0 6.8 1.1 6.1 10.8 75.3 100.0
0
5
10
15
20
25
30
35
40
45
0-9 10-19 20-29 30-39 40-49 50-59 60-69 70-79 80-89 90+
Nu
mb
er o
f re
po
rted
cas
es
Male Female

12
Symptoms
The vast majority of the case investigations contain data on symptoms. Very few investigations
(approximately 3%) indicate no symptoms at the time of the investigation. It is not entirely clear if this
means that the individuals are truly asymptomatic or if this is simply a snapshot of the case at one point
in time and that symptoms develop after or were not recalled at the time of the interview.
The top five symptoms reported by confirmed or probable COVID-19 cases were: 1. Cough (includes dry, productive and unspecified) (73%)
2. Headache (48%)
3. Fever (44%)
4. Chills (42%)
5. Muscle pain (myalgia) (42%)
Pediatric Cases
In these first 7 weeks, there were 11 pediatric cases (less than 18 years of age) of which three (27.3%)
were female and eight (72.7%) male. Within this cohort, eight cases reported symptoms and three did
not. Seven of the 11 (64%) cases reported close contact of a known case and four (36%) indicated
case acquisition was travel acquired (all international). Two cases (18.2%) were younger than two
years; two cases (18.2%) were between the ages of two and five years; two (18.2%) were between the
ages of six and ten years; and five (45.5%) were between the ages of 11 and 17 years.
The most frequently reported symptoms in pediatric cases were similar to those reported in the adult
population.
Table 3. Reported symptoms in pediatric cases
Symptom Cases Reporting
Dry Cough 4
Aching / muscle pain 3
Malaise 3
Fever 2
Sore throat 1 Note: Categories not mutually exclusive
Severity of Illness Hospitalizations and Underlying Health Conditions
As of May 1, 2020, there were 30 hospitalizations (10.7% of all cases). Of these hospitalized cases, seven were admitted to an intensive care unit (ICU). Overall, the proportion of hospitalizations was higher in older adults (65+) and in males. The majority (77%) of hospitalized cases noted the WRHA as their region of residence. Roughly 93% of hospitalized cases had at least one chronic condition. Further, the proportion of cases having at least one chronic condition was higher among hospitalized than non-hospitalized cases (93% vs. 45%). The most common chronic condition among hospitalized cases was hypertension (70%).

13
Figure 5. Distribution of demographic characteristics among hospitalized COVID-19 cases in Manitoba, March 12 – May 1, 2020 (n=30)
Note: There were no hospitalizations reported among cases residing in the Northern Health Region. IERHA: Interlake-Eastern Regional Health Authority; PMH: Prairie Mountain Health; SH-SS: Southern Health – Santé Sud; WRHA: Winnipeg Regional Health Authority
Table 4. Distribution of chronic conditions among COVID-19 cases in Manitoba by hospitalization outcome, March 12 – May 1, 2020 (N=279)
Not hospitalized Hospitalized Total
n % n % N %
Total 249 30 279
Diabetes 20 8.0 13 43.3 33 11.8
Hypertension 55 22.1 21 70.0 76 27.2
Other CVDs a 13 5.2 9 30.0 22 7.9
COPD/Asthma 61 24.5 11 36.7 72 25.8
Musculoskeletal b 30 12.0 13 43.3 43 15.4
Other chronic conditions c 3 1.2 3 10.0 6 2.2
Having at least one chronic condition listed above 112 45.0 28 93.3 140 50.2
a Including: ischemic heart disease, heart failure, acute myocardial infarction, stroke b Including: gout and crystal arthropathies, osteoarthritis, osteoporosis c Including: cancer, chronic live disease, obesity, chronic kidney disease CVD: cardiovascular disease; COPD: chronic obstructive pulmonary disease
Fatalities
An important metric in any outbreak is fatalities because it provides a better understanding of the
characteristics of those most at risk. During this time, six Manitobans who tested positive for COVID-19
subsequently died. Their demographics are shown in Table 5. Three males and three females have
passed away. The majority of the deaths (n=5) have been in cases from the WRHA. Most of the cases
who died had a history of underlying chronic conditions.
Table 5. Demographics of cases with COVID-19 who died
Date of death Age range Sex Region
March 26, 2020 60-69 Female WRHA
April 2, 2020 50-59 Male WRHA
April 6, 2020 60-69 Male WRHA
April 9, 2020 70-79 Male WRHA
April 13, 2020 60-69 Female PMH
April 20, 2020 80-89 Female WRHA
<=18 years, n=1, 3%
19-64 years, n=13, 44%
65+ years, n=16, 53%
Age Group
Female, n=10, 33%
Male, n=20, 67%
Sex
IERHA, n=5, 17% PMH,
n=1, 3%
SH-SS, n=1, 3%
WRHA, n=23, 77%
Regional Health
Authority

14
Case Acquisition Types
Acquisition of COVID-19 is an important metric to understand progression within a population. The
objective of this section is to describe acquisition type over time.
Cases were staged into the most likely acquisition type according to the public health
investigation. Categories of the most probable way that the infection was acquired include:
o Travel acquired,
o Close contact of known case (can also be described as an epi-link), or
o Unknown acquisition (no clear acquisition event can be associated to case).
For the purposes of this report, travel acquired cases have been further classified into domestic
(within Canada) or international (outside Canada). If cases reported both domestic and
international travel, the most likely source of acquisition was selected based on length of travel
and symptom onset date.
Information is extracted from the database according to the travel history reported by the case.
Figure 6. Number of COVID-19 cases by reported date and acquisition type in Manitoba, March 13 – May 1, 2020 (N=279)
Figure 7. Proportion of COVID-19 cases by acquisition type in Manitoba, March 13 – May 1, 2020 (N=279)
0
5
10
15
20
25
30
35
13
-Mar
15
-Mar
17
-Mar
19
-Mar
21
-Mar
23
-Mar
25
-Mar
27
-Mar
29
-Mar
31
-Mar
02
-Ap
r
04
-Ap
r
06
-Ap
r
08
-Ap
r
10
-Ap
r
12
-Ap
r
14
-Ap
r
16
-Ap
r
18
-Ap
r
20
-Ap
r
22
-Ap
r
24
-Ap
r
26
-Ap
r
28
-Ap
r
30
-Ap
r
Nu
mb
er o
f re
po
rted
cas
es
Reported Date
Close contact of known case Travel acquired, domestic Travel acquired, international Unknown acquisition
Close contact of
known case,
n=112, 40%
Travel acquired, domestic, n=15, 6%
Travel acquired,
international, n=121, 43%
Unknown acquisition, n=31, 11%

15
Key Highlights:
When cases first started being reported in mid-March, it is unsurprising that the majority of
cases were travel acquired, mainly from international destinations.
Gradually, cases reporting domestic travel became more prevalent in late March and early April,
while at the same time cases reporting close contact to a known case first appeared and began
to increase. This observation closely aligns with the date that person-to-person transmission
was first observed in Manitoba (around March 24).
Unknown acquisition type is an indication of community spread, which appears to have begun in
Manitoba around March 27.
Since around April 7, only sporadic cases related to travel have been reported, which is
expected given the global travel advisory was issued roughly three weeks prior on March 14.
Since then, the majority of cases were either staged as close contact of a known case or
unknown acquisition, indicating ongoing community transmission.
Health Care Workers
There were 36 HCWs reported between March 12 and May 1, which represents 13% of all cases in
Manitoba. The vast majority of HCWs were female (81%) and cases were evenly spread out across the
20-29, 30-39, 40-49, and the 50-59 year age groups (see Figure 8). The most commonly reported
occupation was nursing (36.1%). The remaining cases in this cohort belonged to various allied health
and support roles (38.9%) or were medical staff (25.0%). Cases mainly worked in WRHA health care
facilities (86.1%). Cases were also employed in facilities in IERHA (5.6%), SH-SS (5.6%), and PMH
(2.8%).
Figure 8. Distribution of COVID-19 cases among health care workers by age group and sex in Manitoba (n=36)
As illustrated in Figure 9, the likely source of acquisition shifted over the course of COVID-19 spread in Manitoba. The initial HCW cases were primarily acquired through travel, and shifted over the ensuring weeks to close contact to a known case and unknown exposure. In total, 30.6% of HCW cases were travel acquired, 50.0% were acquired by close contact to a known case, and 19.4% had an unknown exposure.
0
1
2
3
4
5
6
7
8
9
0-4 5-9 10-19 20-29 30-39 40-49 50-59 60-69 70-79 80-89 90+
Nu
mb
er o
f re
po
rted
cas
es
Male Female

16
Figure 9. Epidemic curve of COVID-19 cases among health care workers by acquisition type (n=36)
Outbreaks
Different criteria are used to declare an outbreak based on the specific setting. Manitoba’s outbreak definitions can be found here. A total of six distinct outbreaks occurred in Manitoba, which are
described in Table 66.
Long-term care facilities have been disproportionately affected by COVID-19 across Canada, resulting in elevated case and fatality rates among residents and staff. In Manitoba, only one outbreak has been reported at a long-term care facility in WRHA. There were two cases among residents linked to this outbreak, one of whom died. No staff members were affected. There was an outbreak reported in a health care facility in WRHA, which was the largest outbreak reported in Manitoba during this time. It began on March 30th and was declared over on May 8th. There were 25 associated cases that tested positive for the virus: 16 staff members, 5 patients, and 4 linked cases among household and close contacts of cases. There were 2 fatalities linked to this outbreak. There were two workplace-related outbreaks, one of which was reported in WRHA and the other in PMH. The first outbreak resulted in 24 associated cases: 13 employees and 11 linked cases among household and close contacts of cases. This workplace outbreak resulted in one fatality. The second workplace outbreak began just as our data collection for this report ended, on May 1st. In order to accurately describe this outbreak, an additional seven cases that were reported between May 2nd and May 9th and are described only in this section. A total 10 cases were associated with this second workplace: 6 employees and 4 linked cases among household and close contacts. Finally, two outbreaks categorized as ‘other’ were reported in WRHA. The first outbreak affected 4 individuals, while the second affected 7 individuals. The second outbreak also resulted in one fatality.
0
1
2
3
4
5
61
3-M
ar
15
-Mar
17
-Mar
19
-Mar
21
-Mar
23
-Mar
25
-Mar
27
-Mar
29
-Mar
31
-Mar
02
-Ap
r
04
-Ap
r
06
-Ap
r
08
-Ap
r
10
-Ap
r
12
-Ap
r
14
-Ap
r
16
-Ap
r
18
-Ap
r
20
-Ap
r
22
-Ap
r
24
-Ap
r
26
-Ap
r
28
-Ap
r
30
-Ap
r
Nu
mb
er o
f re
po
rted
cas
es
Reported Date
Close contact of known case Travel Unknown

17
Table 6. Description of COVID-19 outbreaks occurring between March 12 and May 1 in Manitoba
Type Number of outbreaks
Number of associated cases Number of associated fatalities
Long-term care facility 1 2 1
Health care facility 1 25 2
Workplace 2 24 10
1 0
Other 2 4 7
0 1

18
Section 2: Testing Data
Objective The objective of this section is to describe COVID-19 laboratory testing.
Background Diagnostic laboratory testing is an essential component in the management of the COVID-19 pandemic. Positive test results inform practitioners and Public Health in case management and in efforts to interrupt disease spread through isolation of infected individuals and their contacts. Laboratory diagnostic tests allow epidemiologists to track the spread of disease in communities and to identify clusters of cases. As a result, it is critical that Manitoba’s COVID-19 response incorporates timely and accurate testing at a rate that will not exhaust lab capacity. COVID-19 testing is mostly undertaken at the province’s public health laboratory, Cadham Provincial Laboratory (CPL). In order to increase the province’s testing capacity, DynaCare (a private laboratory), was contracted to also test for COVID-19 in Manitoban samples. If a health practitioner suspects COVID-19 infection, a nasopharyngeal swab is collected. The sample is then tested to measure the presence of the virus that causes COVID-19, a coronavirus called SARS-CoV-2. A COVID-19 infection is confirmed when SARS-CoV-2 genes are detected through a polymerase chain reaction (PCR)-based test. Provincial testing guidance for COVID-19 has evolved over time. The changes in testing criteria are illustrated in Figure 10. In the beginning, COVID-19 testing was primarily focused on symptomatic individuals returning from travel and symptomatic HCWs. The criteria have greatly expanded, and all symptomatic Manitobans can benefit from COVID-19 testing as of April 28th. Up to May 1st, 25,402 COVID-19 tests were performed on Manitoban samples. Figure 10. Evolving COVID-19 testing criteria in Manitoba
HCW = Health Care Worker EMS = Emergency Medical Services NML = National Microbiology Laboratory ED = Emergency Department

19
Test Positivity Test positivity is an important indicator that health officials rely on to make informed decisions. It refers to the number of positive COVID-19 cases identified among all tests conducted. If the positivity rate is high, this suggests that testing is primarily focused on the sickest patients and the testing criteria are not wide enough to determine the extent of community viral spread. When the test positivity is low, this suggests that enough of the population is being tested and that an area has sufficient testing capacity for the size of their outbreak. Increasing the testing capacity, while reducing positivity rate, can also catch people earlier on in disease and may save more lives. The World Health Organization (WHO) advises that the test positivity rate should be lower than 10% for best control.1 Manitoba’s overall positivity rate as of May 1 was 1.1%, which is well below WHO’s recommendations. Figure 11 illustrates the fluctuation of percent positivity throughout the seven weeks. Manitoba’s first COVID-19 confirmed cases were identified in Week 11 (March 8-14), with a corresponding positivity rate of 0.9%. The highest percent positivity was reported during Week 13 (March 22-28) at 3.3%. The rate has been below 1% since Week 15 (April 5-11). Figure 11. Average daily testing volume and positivity (%) for COVID-19 by week of specimen received date in Manitoba, 2020
Distribution of Samples by Sex, Age Group, and Region
The following figures depict further breakdowns of percent positivity by sex, age group, and RHA. A higher proportion of COVID-19 samples were collected from females (60.7%). Females also account for a slightly higher proportion of Manitoba’s confirmed COVID-19 cases (51.6%). However, the test positivity is higher among males (1.4%) compared to females (0.9%) due to the fewer COVID-19 samples collected among this group. ______________________________ 1 World Health Organization. COVID-19 virtual press conference, 30 March 2020.
https://www.who.int/docs/default-source/coronaviruse/transcripts/who-audio-emergencies-coronavirus-press-conference-full-30mar2020.pdf?sfvrsn=6b68bc4a_2
0
1
2
3
4
5
6
7
8
9
10
0
100
200
300
400
500
600
700
800
900
1000
1 2 3 4 5 6 7 8 9 10 11 12 13 14 15 16 17 18
Po
sitivity Rate (%
)
Spec
imen
s
Epidemiological Week
Average Daily Volume Positivity Rate (%)

20
The highest proportion of COVID-19 tests were completed among the 40-59 year age group (34.1%), resulting in a test positivity of 0.9%. This is followed by the 25-29 year age group, which comprised 28.4% of all COVID-19 testing and a 1.2% test positivity. The test positivity was highest for the 15-24 year age group (1.7%), which accounted for 8.5% of COVID-19 testing in Manitoba. Over half of all COVID-19 tests in Manitoba were collected from residents of the WRHA (55.5%). With three-quarters of the province’s COVID-19 cases, this region also has the highest overall percent positivity at 1.5%. This is in contrast to NHR, whose percent positivity is 0.2% with 3 positive cases among 7.4% of COVID-19 tests. Figure 12. COVID-19 test percent positivity by sex in Manitoba, March 12 - May 1, 2020
Figure 13. COVID-19 test percent positivity by age group in Manitoba, March 12 - May 1, 2020
Figure 14. COVID-19 test percent positivity by RHA in Manitoba, March 12 - May 1, 2020
0
0.4
0.8
1.2
1.6
Female Male
Po
siti
vity
Rat
e (%
)
0
0.5
1
1.5
2
<5 5-14 15-24 25-39 40-59 60+
Po
siti
vity
Rat
e (%
)
Age group
0
0.4
0.8
1.2
1.6
WRHA SH-SS IERHA PMH NHR
Po
siti
vity
Rat
e (%
)

21
COVID-19 Testing in People Experiencing Homelessness1 Because people experiencing homelessness, staying in a shelter, or living in a hotel experience marginalization and can face barriers to access to health care, data were analyzed to determine how the province is faring with regard to COVID-19 testing in this underserved population. These data can be compared to the Winnipeg Street Census (http://streetcensuswpg.ca/wp-content/uploads/2018/10/2018_FinalReport_Web.pdf), which was conducted in 2018. Briefly, volunteers went to regions and organizations in Winnipeg that are frequented by people experiencing homelessness and asked a series of questions to 1,519 people regarding their living situation. While this survey was limited in scope to Winnipeg only and to people who were found and consented to the interview, the results in this report are a useful comparison. The COVID-19 laboratory requisition form was used to define homelessness in this group of cases. A person was considered to experience homelessness if their form indicated “no fixed address” or “homeless”. In addition, our sample included individuals who provided the address of a shelter or a temporary dwelling at the time of sample collection. There were 148 individuals experiencing homelessness who were tested for COVID-19 in the period of this report. Ninety-three percent were tested resided in an urban environment, and 95% of these people list Winnipeg as their home city. More than half of the people experiencing homelessness who received COVID-19 tests report a shelter as their address. Nearly 1 in 3 people self-report “no fixed address” or “homeless”. The remaining 16% of people gave an address of a temporary dwelling such as an apartment, house, or hotel. The higher rates of testing in shelters could be explained by the higher number of people staying in one place with a potentially high daily turnover rate. Figure 15. Types of shelter for people experiencing homelessness who received a COVID-19 test
There were 174 tests collected from the population experiencing homelessness, which represented 0.6% of all tests performed in Manitoba during this time. An average of 1.16 tests were performed per person among this group, whereas the corresponding value for all of Manitoba is 1.1 tests per person. Reasons for multiple tests can include test confirmation, indeterminate test results, re-exposure to an infected person, and recurrence of COVID-like illness. The increased value for individuals experiencing homelessness may be indicative of enhanced screening for disease in this underserved population.
1 Please note that, after the dates studied in this report, on May 19th a new COVID test site was opened at Thunderbird House and testing numbers have more than doubled for people experiencing homelessness.
55%
29%
10%6%
Shelter None House/Apartment Hotel

22
Figure 16. Number of tests performed on people in Manitoba experiencing homelessness
On average, people experiencing homelessness were 2 years younger and there were no tests in people over the age of 80 years. In populations experiencing homelessness, the sex ratios are reversed, whereby 2 in 3 people tested are male, but for all of Manitoba, 2 in 3 people tested are female. These data are in keeping with the Winnipeg Street Census, where 65.5% of respondents were also male. Figure 17. Sex breakdown for people tested for COVID-19
174
148
Test counts for peopleexperiencing homelessness
Number of people experiencinghomelessness who were tested
male39%
female61%
Manitoba
male64%
female36%
People in Manitoba experiencing homelessness

23
Section 3: COVID-19 Contacts In a public health investigation, the case is asked for details on all contacts, or people they have been in close contact with, during the case’s infectious period. Understanding the characteristics of contacts is helpful to inform guidelines relating to things like self-isolation.
Objective
To describe all COVID-19 contact investigations from March 12 – May 1, 2020. Note that around half of cases have also been identified as contacts either prior to becoming a COVID-19 case, or after they have already been classified as a case. It is challenging to determine transmission patterns when contact and case investigations were opened very close together.
Number of Contact Investigations
Between March 12 and May 1, there were 1325 contact investigations captured in PHIMS. Of these
investigations, 95% (n=1260) were known contacts, meaning that contacts were previously identified in
PHIMS. At the start of the epidemic, contacts were occasionally recorded as unknown contacts
provincially if there was not enough information to locate them within PHIMS (follow-up at the local level
was not affected).
These 1260 contact investigations represent 994 individuals. One individual can be identified as a
contact to multiple cases, hence the higher number of investigations. Of these 994 individual contacts,
the majority were named once or twice (96%) by cases. Contacts named by multiple cases represent
individuals who are part of case clusters (e.g., households).
Table 7. Number of COVID-19 contact investigations per individual contact (n=994 contacts)
Contact investigations per individual
Individuals %
1 793 80.0%
2 160 16.0%
3 27 3.0%
4 7 1.0%
5 4 0.4%
6 3 0.3%
Contacts Types
Contacts can either be linked to Manitoba cases or exist without direct provincial case links. For example, people returning from travel where they were exposed to COVID-19 would be entered as “contacts not linked to Manitoba cases”. During this time period, there were 257 contact investigations representing 246 individuals who were not linked with Manitoba cases. Of these 246 contacts, 10 individuals were also identified as cases. Contacts that are identified by Manitoba cases are considered as “contacts linked to Manitoba cases”. For contacts linked to Manitoba cases, there were 1003 investigations, representing 779 individuals (individuals can be named as both not linked contacts and linked contacts). Manitoba cases who identified contacts, on average identified 4 contacts each, with a range of 1 to 30 contacts. Thirty-two

24
cases did not identify any known contacts (they may have unknown contacts or did not re-identify contacts who were existing cases). Of these 779 contacts, 147 individuals were also identified as cases.
Figure 18. Number of contacts identified by Manitoba cases
Of the 1,003 contact investigations linked to Manitoba cases, over two out of every five investigations were associated with a household exposure (43%). A remaining 36% were associated with a type of community contact (non-household), with 7% being linked directly to public facilities.
Table 8. Number of contact investigations by exposure setting
Exposure setting Number of contact
investigations %
Household exposure 427 43%
Type of community contact 363 36%
Public facilities 67 7%
Travel 59 6%
Missing 46 5%
Other 41 4%
Total 1003 100%
Note: RHAs not inputting data into PHIMS directly were limited to choices of “travel”, “household
exposure” and “type of community contact” without further distinction, thus other categories are
underestimated.
0
10
20
30
40
50
60
70
1 2 3 4 5 6 7 8 9 10 11 12 13 15 16 18 19 30
Nu
mb
er o
f ca
ses
Number of contacts identified per case

25
Conclusion This report provided an epidemiological summary of the first group of COVID-19 cases in Manitoba. The daily number of reported cases peaked in Manitoba on April 1 and has continued to decline since then, marking the end of this unique infection period. Sporadic cases continue to be reported, primarily associated with travel outside of Manitoba and close contact of cases who have travelled outside the province. The highest proportion of cases was among people aged 20-29 years, comprising nearly 25% of cases. This is an important observation that merits further investigation moving forward, as this group could be a significant contributor to increased spread of COVID-19. It is also interesting to note that nearly two thirds of those cases aged 20-29 years were female, which may be a reflection of the high proportion of female HCW cases (81% of all HCW cases were female). It is unsurprising that acquisition type shifted from primarily travel-related to close contact of a known case and unknown acquisition over the course of time, due to returning travellers and the subsequently imposed travel restrictions. As restrictions continue to lessen with the gradual reopening of services, it is important to continue to closely monitor case acquisition types moving forward. This report also outlines the importance of acknowledging sub-populations that may be more vulnerable to adverse outcomes associated with COVID-19 infection, such as the elderly, people with pre-existing health conditions, and people experiencing homelessness or other marginalized groups. It will be important to maintain vigilant surveillance of these groups moving forward in order to protect and support these more vulnerable sub-populations. The continual analysis of these data, from the detection of the first case and beyond this report, helps to inform public health planning and response, and ensures we are better prepared in the event of subsequent infections and infection clusters or outbreaks.

26
Appendix 1: Surveillance Definitions Manitoba COVID-19 case definitions, as well as other surveillance definitions, can be found here: https://www.gov.mb.ca/health/publichealth/surveillance/docs/es_definitions.pdf