global epidemiology of covid-19 knowledge, attitude and
TRANSCRIPT

1
Supplementary material
Global epidemiology of COVID-19 knowledge, attitude and practice - a systematic review
and meta-analysis
Bodrun Naher Siddiquea1*, Aishwarya Shetty1, Oashe Bhattacharya1, Afsana Afroz1, 2, Baki Billah1
Appendix
List of tables
Supplementary Table 1: PRISMA Checklist ………………………………………………………………………2
Supplementary Table 2: MOOSE Checklist ……………………………………………………………………… 3
Supplementary Table 3: Search strategy in MEDLINE ……………………………………………………………4
Supplementary Table 4: Tool used for quality assessment ………………………………………………………..4
Supplementary Table 5: Studies included in the systematic review and meta-analysis …………………………..5
Supplementary Table 6: Subgroup analysis by country income level, continent, age group, gender, education and
employment status ……………………………………………………………………………………………….14
Supplementary Table 7: Analysis by some important questions regarding knowledge, attitude and practice on
COVID-19 ……………………………………………………………………………………………………….15
List of figures
Supplementary Figure 1: Correlation between components of KAP …………………………………………….16
Supplementary Figure 2: China vs Other countries ………………………………………………………………17
Supplementary Figure 3: Analysis by quality of the studies ……………………………………………………..20
BMJ Publishing Group Limited (BMJ) disclaims all liability and responsibility arising from any relianceSupplemental material placed on this supplemental material which has been supplied by the author(s) BMJ Open
doi: 10.1136/bmjopen-2021-051447:e051447. 11 2021;BMJ Open, et al. Siddiquea BN

2
Table 1: PRISMA Checklist15
Section/topic # Checklist item Reported
on page #
TITLE
Title 1 Identify the report as a systematic review, meta-analysis, or both. Page 1
ABSTRACT
Structured summary 2 Provide a structured summary including, as applicable: background; objectives; data sources; study eligibility
criteria, participants, and interventions; study appraisal and synthesis methods; results; limitations; conclusions and
implications of key findings; systematic review registration number.
Page 2
INTRODUCTION
Rationale 3 Describe the rationale for the review in the context of what is already known. Page 4
Objectives 4 Provide an explicit statement of questions being addressed with reference to participants, interventions,
comparisons, outcomes, and study design (PICOS).
Page 4
METHODS
Protocol and registration 5 Indicate if a review protocol exists, if and where it can be accessed (e.g., Web address), and, if available, provide
registration information including registration number.
Page 4
Eligibility criteria 6 Specify study characteristics (e.g., PICOS, length of follow-up) and report characteristics (e.g., years considered,
language, publication status) used as criteria for eligibility, giving rationale.
Page 4
Information sources 7 Describe all information sources (e.g., databases with dates of coverage, contact with study authors to identify
additional studies) in the search and date last searched.
Page 4
Search 8 Present full electronic search strategy for at least one database, including any limits used, such that it could be
repeated.
Supplementary
Table 3
Study selection 9 State the process for selecting studies (i.e., screening, eligibility, included in systematic review, and, if applicable,
included in the meta-analysis).
Page 4-5
Data collection process 10 Describe method of data extraction from reports (e.g., piloted forms, independently, in duplicate) and any
processes for obtaining and confirming data from investigators.
Page 5
Data items 11 List and define all variables for which data were sought (e.g., PICOS, funding sources) and any assumptions and
simplifications made.
Page 5
Risk of bias in individual
studies
12 Describe methods used for assessing risk of bias of individual studies (including specification of whether this was
done at the study or outcome level), and how this information is to be used in any data synthesis.
Page 5
Summary measures 13 State the principal summary measures (e.g., risk ratio, difference in means). Page 6
Synthesis of results 14 Describe the methods of handling data and combining results of studies, if done, including measures of consistency
(e.g., I2) for each meta-analysis.
Page 6
Risk of bias across studies 15 Specify any assessment of risk of bias that may affect the cumulative evidence (e.g., publication bias, selective
reporting within studies).
Page 6
Additional analyses 16 Describe methods of additional analyses (e.g., sensitivity or subgroup analyses, meta-regression), if done,
indicating which were pre-specified.
Page 6
RESULTS
Study selection 17 Give numbers of studies screened, assessed for eligibility, and included in the review, with reasons for exclusions
at each stage, ideally with a flow diagram.
Page 6
Study characteristics 18 For each study, present characteristics for which data were extracted (e.g., study size, PICOS, follow-up period)
and provide the citations.
Supplementary
Table 5
Risk of bias within studies 19 Present data on risk of bias of each study and, if available, any outcome level assessment (see item 12). Page 6
Results of individual
studies
20 For all outcomes considered (benefits or harms), present, for each study: (a) simple summary data for each
intervention group (b) effect estimates and confidence intervals, ideally with a forest plot.
Page 7
Synthesis of results 21 Present results of each meta-analysis done, including confidence intervals and measures of consistency. Page 7-8
Risk of bias across studies 22 Present results of any assessment of risk of bias across studies (see Item 15). Page 7-8
Additional analysis 23 Give results of additional analyses, if done (e.g., sensitivity or subgroup analyses, meta-regression [see Item 16]). Page 7-8
DISCUSSION
Summary of evidence 24 Summarize the main findings including the strength of evidence for each main outcome; consider their relevance
to key groups (e.g., healthcare providers, users, and policy makers).
Page 8
Limitations 25 Discuss limitations at study and outcome level (e.g., risk of bias), and at review-level (e.g., incomplete retrieval of
identified research, reporting bias).
Page 10
Conclusions 26 Provide a general interpretation of the results in the context of other evidence, and implications for future research. Page 11
FUNDING
Funding 27 Describe sources of funding for the systematic review and other support (e.g., supply of data); role of funders for
the systematic review.
Page 11
BMJ Publishing Group Limited (BMJ) disclaims all liability and responsibility arising from any relianceSupplemental material placed on this supplemental material which has been supplied by the author(s) BMJ Open
doi: 10.1136/bmjopen-2021-051447:e051447. 11 2021;BMJ Open, et al. Siddiquea BN

3
Table 2: MOOSE Checklist16
Item No Recommendation Reported on
Page No
Reporting of background should include
1 Problem definition 3
2 Hypothesis statement -
3 Description of study outcome(s) 5
4 Type of exposure or intervention used -
5 Type of study designs used 4
6 Study population 4-5
Reporting of search strategy should include
7 Qualifications of searchers (eg, librarians and investigators) Title page
8 Search strategy, including time period included in the synthesis and key words 4
9 Effort to include all available studies, including contact with authors 4-5
10 Databases and registries searched 4
11 Search software used, name and version, including special features used (eg, explosion) -
12 Use of hand searching (eg, reference lists of obtained articles) 5
13 List of citations located and those excluded, including justification 6, 13-17, Fig 1
14 Method of addressing articles published in languages other than English -
15 Method of handling abstracts and unpublished studies -
16 Description of any contact with authors 5
Reporting of methods should include
17 Description of relevance or appropriateness of studies assembled for assessing the hypothesis to be
tested -
18 Rationale for the selection and coding of data (eg, sound clinical principles or convenience) -
19 Documentation of how data were classified and coded (eg, multiple raters, blinding and interrater
reliability) 5
20 Assessment of confounding (eg, comparability of cases and controls in studies where appropriate) -
21 Assessment of study quality, including blinding of quality assessors, stratification or regression on
possible predictors of study results 5
22 Assessment of heterogeneity 6
23
Description of statistical methods (eg, complete description of fixed or random effects models,
justification of whether the chosen models account for predictors of study results, dose-response
models, or cumulative meta-analysis) in sufficient detail to be replicated
6-7
24 Provision of appropriate tables and graphics Tables 1-4,
Figs 1
Reporting of results should include
25 Graphic summarizing individual study estimates and overall estimate Figs 2, 3
26 Table giving descriptive information for each study included Supplementary
Table 5
27 Results of sensitivity testing (eg, subgroup analysis) Suppl. Table 6
28 Indication of statistical uncertainty of findings 7-8
Reporting of discussion should include
29 Quantitative assessment of bias (eg, publication bias) 10
30 Justification for exclusion (eg, exclusion of non-English language citations) 10
31 Assessment of quality of included studies -
Reporting of conclusions should include
32 Consideration of alternative explanations for observed results 9-10
33 Generalization of the conclusions (ie, appropriate for the data presented and within the domain of the
literature review) -
34 Guidelines for future research 12
35 Disclosure of funding source 12
BMJ Publishing Group Limited (BMJ) disclaims all liability and responsibility arising from any relianceSupplemental material placed on this supplemental material which has been supplied by the author(s) BMJ Open
doi: 10.1136/bmjopen-2021-051447:e051447. 11 2021;BMJ Open, et al. Siddiquea BN

4
Table 3: Search strategy in MEDLINE
Search terms #1 (wuhan and (coronavirus or corona virus)).tw,kf,hw.
#2 (coronavirus* and (“19” or “2019”)).tw,kf,hw. #3 (2019 nCov or nCov 2019 or ncov19 or ncov 19 or novel coronavirus* or novel corona virus* or Severe Acute Respiratory
Syndrome Coronavirus 2 or coronavirus disease 2019 or corona-virus disease 2019 or new coronavirus* or new corona-
virus* or SARS-Coronavirus-2 or SARS-Coronavirus2 or SARS-Corona-Virus-2 or SARS-corona-virus2 or SARS-like
coronavirus*).tw,kf,hw.
#4 (2019-novel CoV or SARS-COV-2 or SARS-COV2 or sarscov2 or sarscov-2 or coronavirus-19 or covid19 or covid-
19).tw,kf,hw.
#5 ((novel or new or nouveau or pandemic*) adj2 (CoV or covid or ncov or coronavirus or corona-virus)).tw,kf,hw.
#6 #1 OR #2 OR #3 OR #4 OR #5
#7 Knowledge/
#8 Attitude/
#9 Practice/
#10 Health Knowledge, Attitudes, Practice/
#11 #7 OR #8 OR #9 OR #10
#12 #6 AND #11
#13 limit 12 to english language
Table 4: Tool used for quality assessment17
Criteria Yes No Others (CD,
CR, NA)*
1 Was the research question or objective in this paper clearly stated? 2 Was the study population clearly specified and defined? 3 Was the participation rate of eligible persons at least 50%? 4 Were all the subjects selected or recruited from the same or similar populations (including
the same time period)? Were inclusion and exclusion criteria for being in the study pre-
specified and applied uniformly to all participants?
5 Was a sample size justification, power description, or variance and effect estimates
provided?
6 For the analyses in this paper, were the exposure(s) of interest measured prior to the
outcome(s) being measured?
7 Was the time frame sufficient so that one could reasonably expect to see an association
between exposure and outcome if it existed?
8 For exposures that can vary in amount or level, did the study examine different levels of the
exposure as related to the outcome (e.g., categories of exposure or exposure measured as
continuous variable)?
9 Were the exposure measures (independent variables) clearly defined, valid, reliable, and
implemented consistently across all study participants?
10 Was the exposure(s) assessed more than once over time? 11 Were the outcome measures (dependent variables) clearly defined, valid, reliable, and
implemented consistently across all study participants?
12 Were the outcome assessors blinded to the exposure status of participants? 13 Was loss to follow-up after baseline 20% or less? 14 Were key potential confounding variables measured and adjusted statistically for their
impact on the relationship between exposure(s) and outcome(s)?
Quality rating (good, fair, or poor) (see guidance)
Rater no. 1 initials:
Rater no. 2 initials:
Additional comments (if poor, please state why):
∗CD: cannot determine; NA: not applicable; NR: not reported.
BMJ Publishing Group Limited (BMJ) disclaims all liability and responsibility arising from any relianceSupplemental material placed on this supplemental material which has been supplied by the author(s) BMJ Open
doi: 10.1136/bmjopen-2021-051447:e051447. 11 2021;BMJ Open, et al. Siddiquea BN

5
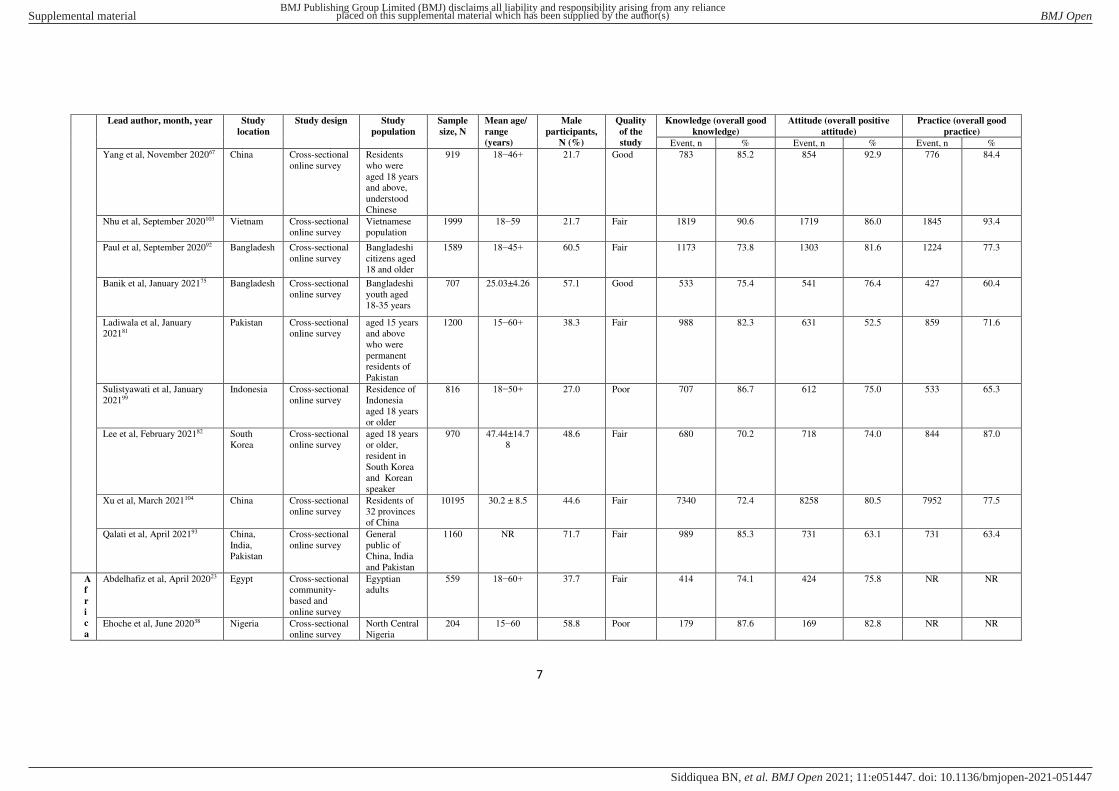
Table 5: Studies included in the systematic review and meta-analysis
Lead author, month, year Study
location
Study design Study
population
Sample
size, N
Mean age/
range
(years)
Male
participants,
N (%)
Quality
of the
study
Knowledge (overall good
knowledge)
Attitude (overall positive
attitude)
Practice (overall good
practice)
Event, n % Event, n % Event, n %
A
s
i
a
Azlan et al, May 202033 Malaysia Cross-sectional
online survey
Malaysian
above 18
years
4850 34.0 42.1 Good 3904 80.0 4346 90.4 3564 74.1
Afzal et al, July 202025 Pakistan Cross-sectional
online survey
Pakistani
nationals
aged 16 years
or more
1004 NR* 37.0 Fair 665 66.2 756 75.3 654 65.2
Hayat et al, May 202045 Pakistan Cross-sectional
online survey
Pakistani
residents age
>15yrs
1257 16−30+ 44.3 Fair 996 79.2 949 75.5 1073 85.3
Leehang Lau et al, June
202056
Philippines Community-
based Cross-
sectional survey
participants
of ICM’s poverty
alleviation
program
2224 41.3 7.3 Fair 1719 82.2 1404 67.2 1328 63.5
Rahman & Sathi, April
202061
Bangladesh Cross-sectional
online survey
Bangladeshi
internet users
≥18 years
441 18−30+ 68.7 Poor 400 90.7 184 41.7 408 92.6
Sari et al, June 202063 Indonesia Cross-sectional
online survey
aged
18−60 years
201 35.6 46.3 Fair 192 95.5 174 86.6 NR NR
Yue et al, August 202068 Henan,
China
Cross-sectional
online survey
People aged
15 years or
older
517 15−60 46.2 Fair 294 56.9 482 93.3 350 67.7
Zhong et al, March 202070 China Cross-sectional
online survey
Chinese
nationality
aged 16 years
or more
6910 33.0 34.3 Fair 6201 89.7 6492 93.9 6717 97.2
Alabed et al, October 202026 Malaysia Cross-sectional
online survey
People living
in Malaysia
aged 18 years
or above
520 36.9 38.5 Poor 451 86.7 386 74.3 178 34.2
Amalakanti et al, August
202030
Andhra
Pradesh,
India
Cross-sectional
online survey
South Indian
aged above
15 years
1837 16−50+ 56.5 Poor 1214 66.1 1286 70.0 1414 77.0
Aqeel et al, August 202031 Delhi, India Cross-sectional
online survey
Residents of
Delhi
823 38.2 56.9 Poor 631 76.6 695 84.4 769 93.4
Ashiq et al, August 202032 Lahore,
Pakistan
Cross-sectional
online survey
People
residing in
Lahore
316 16−40+ 46.5 Poor 260 82.3 221 69.9 181 57.2
Ferdous et al, October 202040 Bangladesh Cross-sectional
online survey
Bangladeshi
residents aged
12-64 years
2017 24.4 59.8 Poor 1230 60.9 1818 90.1 1534 76.1
BMJ Publishing Group Limited (BMJ) disclaims all liability and responsibility arising from any relianceSupplemental material placed on this supplemental material which has been supplied by the author(s) BMJ Open
doi: 10.1136/bmjopen-2021-051447:e051447. 11 2021;BMJ Open, et al. Siddiquea BN

6
Lead author, month, year Study
location
Study design Study
population
Sample
size, N
Mean age/
range
(years)
Male
participants,
N (%)
Quality
of the
study
Knowledge (overall good
knowledge)
Attitude (overall positive
attitude)
Practice (overall good
practice)
Event, n % Event, n % Event, n %
Gao et al, November 202071 China Cross-sectional
online survey
Chinese
residents 18
years and
above
2136 33.1 21.9 Poor 1948 91.2 2093 98.0 2068 96.8
Haq et al, August 202044 Punjab,
Pakistan
Cross-sectional
online survey
People living
in Pakistan
>15 years
401 NR 52.3 Poor 351 87.6 NR NR 236 58.7
Hossain et al, September
202048
Bangladesh Cross-sectional
online survey
Bangladeshi
residents 13-
90 years
2157 33.5 54.1 Fair 1566 72.6 1109 51.4 1716 79.5
Hossain MJ et al, November
202049
Bangladesh Cross-sectional
community-
based and
online study
Bangladeshi
residents
1861 15−50+ 64.5 Poor 1373 73.8 936 50.3 1154 62.0
Islam et al, October 202050 Bangladesh Cross-sectional
community-
based study
Aged ≥18 years slum
dwellers
406 44.9 53.2 Fair 146 35.9 357 87.9 332 81.7
Narayana et al, July 202058 India Cross-sectional
online survey
Indian
residents aged
above 15
years
2459 24.5 57.9 Good 1839 74.7 NR NR 2167 88.1
Rahman et al, August 202061 Dhaka,
Rangpur
and
Bogura,
Bangladesh
Cross-sectional
online and
offline study
Adult
population
living in
Bangladesh
1549 18−61 57.9 Poor 864 55.8 1207 77.9 1140 73.5
Susilkumar &
Vengadassalapathy, August
202065
India Cross-sectional
online survey
Participants
with access to
a primary
internet
connection
and who can
read and write
the English
language
1015 20−60 49.3 Poor 822 81.0 926 91.1 892 87.8
Wong et al, October 202066 Hong Kong Cross-sectional
study
Age of 18
years or older
South Asian
in Hong Kong
352 38.9 40.3 Fair 190 53.8 238 67.4 234 66.5
BMJ Publishing Group Limited (BMJ) disclaims all liability and responsibility arising from any relianceSupplemental material placed on this supplemental material which has been supplied by the author(s) BMJ Open
doi: 10.1136/bmjopen-2021-051447:e051447. 11 2021;BMJ Open, et al. Siddiquea BN
7
Lead author, month, year Study
location
Study design Study
population
Sample
size, N
Mean age/
range
(years)
Male
participants,
N (%)
Quality
of the
study
Knowledge (overall good
knowledge)
Attitude (overall positive
attitude)
Practice (overall good
practice)
Event, n % Event, n % Event, n %
Yang et al, November 202067 China Cross-sectional
online survey
Residents
who were
aged 18 years
and above,
understood
Chinese
919 18−46+ 21.7 Good 783 85.2 854 92.9 776 84.4
Nhu et al, September 2020103 Vietnam Cross-sectional
online survey
Vietnamese
population
1999 18−59 21.7 Fair 1819 90.6 1719 86.0 1845 93.4
Paul et al, September 202092 Bangladesh Cross-sectional
online survey
Bangladeshi
citizens aged
18 and older
1589 18−45+ 60.5 Fair 1173 73.8 1303 81.6 1224 77.3
Banik et al, January 202175 Bangladesh Cross-sectional
online survey
Bangladeshi
youth aged
18-35 years
707 25.03±4.26 57.1 Good 533 75.4 541 76.4 427 60.4
Ladiwala et al, January
202181
Pakistan Cross-sectional
online survey
aged 15 years
and above
who were
permanent
residents of
Pakistan
1200 15−60+ 38.3 Fair 988 82.3 631 52.5 859 71.6
Sulistyawati et al, January
202199
Indonesia Cross-sectional
online survey
Residence of
Indonesia
aged 18 years
or older
816 18−50+ 27.0 Poor 707 86.7 612 75.0 533 65.3
Lee et al, February 202182 South
Korea
Cross-sectional
online survey
aged 18 years
or older,
resident in
South Korea
and Korean
speaker
970 47.44±14.7
8
48.6 Fair 680 70.2 718 74.0 844 87.0
Xu et al, March 2021104 China Cross-sectional
online survey
Residents of
32 provinces
of China
10195 30.2 ± 8.5 44.6 Fair 7340 72.4 8258 80.5 7952 77.5
Qalati et al, April 202193 China,
India,
Pakistan
Cross-sectional
online survey
General
public of
China, India
and Pakistan
1160 NR 71.7 Fair 989 85.3 731 63.1 731 63.4
A
f
r
i
c
a
Abdelhafiz et al, April 202023 Egypt Cross-sectional
community-
based and
online survey
Egyptian
adults
559 18−60+ 37.7 Fair 414 74.1 424 75.8 NR NR
Ehoche et al, June 202038 Nigeria Cross-sectional
online survey
North Central
Nigeria
204 15−60 58.8 Poor 179 87.6 169 82.8 NR NR
BMJ Publishing Group Limited (BMJ) disclaims all liability and responsibility arising from any relianceSupplemental material placed on this supplemental material which has been supplied by the author(s) BMJ Open
doi: 10.1136/bmjopen-2021-051447:e051447. 11 2021;BMJ Open, et al. Siddiquea BN

8
Lead author, month, year Study
location
Study design Study
population
Sample
size, N
Mean age/
range
(years)
Male
participants,
N (%)
Quality
of the
study
Knowledge (overall good
knowledge)
Attitude (overall positive
attitude)
Practice (overall good
practice)
Event, n % Event, n % Event, n %
Hezima et al, May 202046 Khartoum,
Sudan
Cross-sectional
community-
based and
online survey
Sudanese
residents
812 18−55+ 54.2 Good 635 78.2 725 89.3 494 60.8
Hager et al, July 202043 Egypt and
Nigeria
Cross-sectional
online survey
adults >17
years of all
educational
levels
1437 18−59+ 52.5 Good 1244 86.6 863 60.0 NR NR
Kebede et al, May 202052 Jimma
town,
South-west
Ethiopia,
Hospital-based
Cross-sectional
study
Visitors of
medical
centre
247 30.5 76.5 Fair 174 70.4 NR NR 66 26.9
Adesegun et al, September
202024
Nigeria Cross-sectional
online survey
Literate
nigerian who
understand
english
1015 26.6 45.9 Poor 792 78.0 670 66.0 613 60.4
Kasemy et al, December
202051
Egypt Cross-sectional
online survey
Egyptians 3712 23.3 47.8 Fair 2504 67.4 2856 76.9 1950 52.5
Kuhangana et al, October
202054
Democratic
Republic of
the Congo
Cross-sectional
study
adult people
(>18 years)
frequenting
ten public
markets
347 37.4 17.0 Poor 146 42.2 147 42.5 NR NR
Ngwewondo et al, September
202060
Cameroon Cross-sectional
online survey
Cameroonian
residents,
aged 18 years
or more
1006 33.0 46.9 Fair 797 79.2 663 65.8 812 80.7
Reuben et al, July 202194 North-
Central
Nigeria
Cross-sectional
online survey
Residents of
north-central
Nigeria who
understood
the English
language and
were 18 years
old and above
589 18−59 59.6 Fair 488 82.8 545 92.5 435 73.9
Sengeh et al, September
202097
Sierra
Leone
Community-
based cross-
sectional study
Resident aged
18 years or
older
1253 18−60+ 52.0 Fair 652 51.6 NR NR 865 68.7
Okello et al, December
202091
Uganda Cross-sectional
online survey
Ugandans
aged ≥ 18 years
362 33.5 ± 10.4 58.6 Poor 340 93.9 186 51.3 175 48.3
Bekele et al, January 202178 Ethiopia Cross-sectional
online survey
Ethiopian 18
years or
above
341 18−46 80.3 Fair 269 78.9 NR NR 177 51.5
BMJ Publishing Group Limited (BMJ) disclaims all liability and responsibility arising from any relianceSupplemental material placed on this supplemental material which has been supplied by the author(s) BMJ Open
doi: 10.1136/bmjopen-2021-051447:e051447. 11 2021;BMJ Open, et al. Siddiquea BN

9
Lead author, month, year Study
location
Study design Study
population
Sample
size, N
Mean age/
range
(years)
Male
participants,
N (%)
Quality
of the
study
Knowledge (overall good
knowledge)
Attitude (overall positive
attitude)
Practice (overall good
practice)
Event, n % Event, n % Event, n %
Desalegn et al, January
202179
Addis
Ababa,
Ethiopia
Community-
based cross-
sectional study
Adult aged
>18 years
839 30.30±9.25 58.0 Fair 604 72.3 604 71.6 520 62.3
Habib et al, January 202180 Kano,
Nigeria
Cross-sectional
community-
based and
online survey
general
population
including
Health Care
Workers
(HCW) in
Kano, Nigeria
886 28.58±10.2
5
55.4 Fair 576 65.3 629 71.4 576 65.0
Takoudjou Dzomo et al,
January 2021101
N’Djamena, Chad
Cross-sectional
study
individuals
from
N’Djamena
who
understood
French and
aged 18 years
or older
2269 31.04±10.9
6
61.5 Poor 794 34.9 1384 61.4 688 30.3
Yoseph et al, January 2021105 Sidama,
Ethiopia
Community-
based cross-
sectional study
Adult
population
who resided
in the Sidama
regional state
for 6 months
1214 34±10 58.5 Fair 1093 90.0 1002 82.5 789 65.0
Mohamed et al, February
202185
Sudan Cross-sectional
online survey
All Sudanese,
aged 18 years
and more
987 30.13±9.84 55.6 Good 839 85.1 819 83.0 849 86.0
Li et al, April 202183 Lilongwe,
Malawi
Cross-sectional
community-
based survey
Malawi
residents at
the age of 18
years or more
living in
Lilongwe
580 18−55+ 35.0 Fair 278 48.0 371 64.0 232 40.0
Molla and Abegaz, April
202186
Woldia
town,
Northeast
Ethiopia
Community-
based cross-
sectional study
All the
households
that live in
Woldia town
who were
aged 18 and
above
404 18−39+ 50.7 Fair 317 78.5 213 52.7 156 38.6
Taddese et al, April 2021100 Gondar,
Ethiopia
Community-
based cross-
sectional study
People of age
18 years and
above
residing in
Gondar city
623 33 ± 13.24 35.5 Poor 323 51.8 NR NR 331 53.1
BMJ Publishing Group Limited (BMJ) disclaims all liability and responsibility arising from any relianceSupplemental material placed on this supplemental material which has been supplied by the author(s) BMJ Open
doi: 10.1136/bmjopen-2021-051447:e051447. 11 2021;BMJ Open, et al. Siddiquea BN

10
Lead author, month, year Study
location
Study design Study
population
Sample
size, N
Mean age/
range
(years)
Male
participants,
N (%)
Quality
of the
study
Knowledge (overall good
knowledge)
Attitude (overall positive
attitude)
Practice (overall good
practice)
Event, n % Event, n % Event, n %
M
i
d
d
l
e
E
a
s
t
Al-Hanawi et al, May 202012 Saudi
Arabia
Cross-sectional
online survey
aged 18 years
or older living
in KSA
3388 18−60+ 41.9 Fair 2766 81.6 3252 95.9 2942 86.8
Alahdal et al, June 202027 Riyadh,
Saudi
Arabia
Cross-sectional
online survey
18-65 years
old
1767 18−65 25.0 Good 1100 62.3 1682 95.2 1406 79.6
Honarvar et al, June 202047 Shiraz, Iran Cross-sectional
and population-
based study
people aged
at least 15
years
1331 36.0 47.3 Good 679 50.9 818 61.5 481 36.2
Naser et al, April 202059 Jordan,
Saudi
Arabia and
Kuwait
Cross-sectional
online survey
aged 18 years
who was
living either
in Jordan,
Saudi Arabia
or Kuwait
1208 18−50+ 32.8 Fair 808 66.9 NR NR 808 67.6
Alhazmi et al, August 202028 Saudi
Arabia
Cross-sectional
online survey
All citizens
and residents
over 18 years
1513 NR 45.0 Good 1230 81.3 1310 86.6 1239 81.9
Domiati et al, August 202037 Lebanon Cross-sectional
online survey
Residents of
Lebanon
410 NR 41.9 Good 308 75.0 276 67.2 NR NR
Elayeh et al, October 202039 Jordan Cross-sectional
online survey
Adult
residents of
Jordan
2104 18−55+ 24.6 Good 1673 79.5 1236 58.7 1385 65.8
Ghazi et al, September
202042
Iraq Cross-sectional
online survey
Adults living
in Iraq
272 36∙4 58.1 Good 235 86.2 220 80.7 227 83.5
Khaled et al, September
202053
Aseer
region,
Saudi
Arabia
Cross-sectional
online survey
Residents of
the Aseer
Region, Saudi
Arabia
740 18−70 11.5 Fair 594 80.3 533 71.9 575 77.6
Zaid et al, July-August
202069
Jordan Cross-sectional
online survey
Jordanian
aged 18 years
3791 18−60 26.8 Poor 2114 55.7 NR NR NR NR
Nakhostin-Ansari et al,
December 202088
Iran Cross-sectional
online survey
Iranian at
least 15 years
old
1015 35.32±11.9
5
42.6 Fair 897 88.3 930 91.5 952 93.8
Shahabi et al, January 202198 Hormozgan
, Iran
Cross-sectional
online survey
Residents of
Hormozgan
Province aged
above 15
years
2024 33.94 ±
9.37
35.6 Good 1607 79.4 1619 80.1 1864 92.1
BMJ Publishing Group Limited (BMJ) disclaims all liability and responsibility arising from any relianceSupplemental material placed on this supplemental material which has been supplied by the author(s) BMJ Open
doi: 10.1136/bmjopen-2021-051447:e051447. 11 2021;BMJ Open, et al. Siddiquea BN

11
Lead author, month, year Study
location
Study design Study
population
Sample
size, N
Mean age/
range
(years)
Male
participants,
N (%)
Quality
of the
study
Knowledge (overall good
knowledge)
Attitude (overall positive
attitude)
Practice (overall good
practice)
Event, n % Event, n % Event, n %
Tawalbeh et al, January
2021102
Jordan Cross-sectional
online survey
persons who
aged 18 years
or above, can
read and write
Arabic or
English
language
2470 18−40+ 31.7 Poor 1976 80.3 2247 91.0 1929 78.1
Abbasi-Kangevari et al,
February 202172
Iran Cross-sectional
online survey
Iranian >18
years old
12232 32.2±9.9 38.1 Poor 9496 77.0 11481 93.1 10630 86.2
Al Ahdab et al, February
202173
Syria Cross-sectional
online survey
Persons who
were aged 16
years or more
706 16−50+ 37.1 Good 417 59.0 433 61.3 521 73.8
Al-Hussami et al, February
202174
Jordan Cross-sectional
online survey
Jordanian
nationality
aged 18 years
or older
1076 34.83±10.5
0
40.2 Fair 904 84.4 926 86.0 849 78.8
Naqid et al, February 202189 Kurdistan,
Iraq
Community-
based cross-
sectional study
Kurdish
population in
Iraq aged >15
years
885 15−75 60.0 Poor 675 76.3 558 63.2 451 51.1
Saeed et al, February 202195 Mosul, Iraq Cross-sectional
online survey
Mosul-Iraqi
individuals
above the age
of 18 and
currently
residing in
Mosul
909 18−50+ 38.6 Fair 782 86.1 NR NR 754 82.9
Omar and Amer, April
202190
Egypt Cross-sectional
online survey
residents of
Egypt using
internet
excluding the
Illiterate,
COVID-19
cases, and
health-care
provider
999 16−40+ 33.3 Poor 808 80.9 794 79.5 529 52.7
Sakr et al, April 202196 Lebanon Cross-sectional
online survey
Lebanese
aged 18 years
or above
1882 18−71 73.7 Fair 1263 67.1 1336 71.3 1412 75.0
BMJ Publishing Group Limited (BMJ) disclaims all liability and responsibility arising from any relianceSupplemental material placed on this supplemental material which has been supplied by the author(s) BMJ Open
doi: 10.1136/bmjopen-2021-051447:e051447. 11 2021;BMJ Open, et al. Siddiquea BN

12
Lead author, month, year Study
location
Study design Study
population
Sample
size, N
Mean age/
range
(years)
Male
participants,
N (%)
Quality
of the
study
Knowledge (overall good
knowledge)
Attitude (overall positive
attitude)
Practice (overall good
practice)
Event, n % Event, n % Event, n %
N
o
r
t
h
A
m
e
r
i
c
a
Alobuia et al, June 202029 USA Telephone
survey
aged 18 year
and older
2906 18−65+ 48.0 Fair 2288 78.7 1502 51.7 1073 36.9
Clements JM, May 202035 USA Cross-sectional
online survey
US residents
aged 18 years
or older
1070 37.1 58.2 Good 838 78.3 NR NR 536 50.1
Czeisler et al, June 202036 New York
(NYC) and
Los
Angeles
(LA), USA
Cross-sectional
online survey
adults aged
≥18 years
1676 18−65+ 43.9 Fair NR NR USA (1286)
NYC (242)
LA (207)
USA (76.7)
NYC (84.5)
LA (80.0)
USA (920)
NYC (178)
LA (158)
USA (54.9)
NYC (62.2)
LA (61.0)
Geldsetzer P, April 202041 US and UK Cross-sectional
online survey
Adults
registered
with Prolific
Academic Pty
US
(2986)
UK
(2988)
US (49.1)
UK (48.8)
Fair US (2424)
UK (2483)
US (81.2)
UK (83.1)
NR NR NR NR
Leigh et al, October 202057 Canada Cross-sectional
online survey
Adult
Canadian
1996 18−65 45.2 Fair 1361 68.1 NR NR 1143 57.2
S
o
u
t
h
A
m
e
r
i
c
a
Bates et al, September 202034 Ecuador Cross-sectional
online survey
Ecuadorians
aged 18 or
greater
2399 18−50+ 37.0 Fair 1929 80.4 1331 55.5 2219 92.5
Bates et al, November 202077 Colombia Cross-sectional
online survey
People who
identified as
Colombians
and who were
aged 18 or
greater
459 18−50+ 28.1 Fair 353 76.8 289 63.0 424 92.3
Bates et al, April 202176 Venezuela Cross-sectional
online survey
Venezuelans
and who were
aged 18 or
greater
3122 18−50+ 24.6 Fair 2685 85.7 1592 50.6 2747 87.9
E
u
r
o
p
e
La Torre et al, June 202055
Italy Cross-sectional
online survey
11-30 years 5234 11−30 36.7 Fair 3364 64.3 3707 70.8 NR NR
Mouchtouri et al, November
202087
Greece Telephone
survey
Adult
population of
Greece
1858 49.2±17.4 41.2 Fair 1486 80.0 1319 71.0 1059 56.7
BMJ Publishing Group Limited (BMJ) disclaims all liability and responsibility arising from any relianceSupplemental material placed on this supplemental material which has been supplied by the author(s) BMJ Open
doi: 10.1136/bmjopen-2021-051447:e051447. 11 2021;BMJ Open, et al. Siddiquea BN

13
Lead author, month, year Study
location
Study design Study
population
Sample
size, N
Mean age/
range
(years)
Male
participants,
N (%)
Quality
of the
study
Knowledge (overall good
knowledge)
Attitude (overall positive
attitude)
Practice (overall good
practice)
Event, n % Event, n % Event, n %
O
c
e
a
n
i
a
Seal et al, June 202064 Australia Cross-sectional
online survey
Australian
adults (18
years and
older)
1420 18−50+ 48.0 Fair 816 57.4 NR NR 803 56.5
M
u
l
t
i
p
l
e
c
o
n
t
i
n
e
n
t
s
Masoud et al, February
202184
Algeria,
Brazil,
Egypt,
Ghana,
India,
Indonesia,
Iraq,
Ireland,
Jordan,
Lebanon,
Libya,
Morocco,
Nigeria,
Nepal,
Palestine,
Pakistan,
Saudi
Arabia,
South
Africa, Sri
Lanka,
Sudan,
Syria, UK,
USA
Cross-sectional
online survey
Any citizen of
the included
22 countries
above the age
of 18
71890 27.64±9.78 40.0 Good 49388 68.7 33429 46.5 62235 86.6
*NR-Not reported
BMJ Publishing Group Limited (BMJ) disclaims all liability and responsibility arising from any relianceSupplemental material placed on this supplemental material which has been supplied by the author(s) BMJ Open
doi: 10.1136/bmjopen-2021-051447:e051447. 11 2021;BMJ Open, et al. Siddiquea BN

14
Table 6: Subgroup analysis by country income level, continent, study period, age group, gender,
education and employment status
Outcome Study characteristics No of studies Estimates score (%)
(95% CI*), p-value
I2 Egger test
(p-value) Knowledge Income level of the country
Low income countries 16 72 (63−80), <0.001 99.36%
Lower-middle income countries 26 73 (68−78), <0.001 99.20%
Upper-middle income countries 25 79 (75−83), <0.001 99.49%
High income countries 15 72 (68−77), <0.001 99.03%
Continent
Asia 30 76 (71−81), <0.001 99.50%
Africa 21 71 (64−78), <0.001 99.33%
Middle East 20 75 (70−80), <0.001 99.19%
Americas 8 79 (75−83), <0.001 97.47%
Europe/Oceania 3 67 (54−80), <0.001 99.38%
Study period
January-March, 2020 28 73 (69−77), <0.001 99.52%
April-June, 2020 46 77 (74−80), <0.001 99.25%
July-October, 2020 8 67 (51-82), <0.001 99.72%
Age group 17
Below 30 years 78 (74−83), <0.001 97.86% 0.044
30 years and above 80 (75−85), <0.001 98.93% 0.022
Gender 46
Male 75 (71−79), <0.001 99.10% 0.051
Female 74 (70−78), <0.001 99.39% 0.014
Education level 39
Up to 12 years 71 (66−75), <0.001 98.41% 0.674
Above 12 years 78 (74−82), <0.001 99.58% 0.081
Employment status 20
Unemployed 74 (68−79), <0.001 97.30% 0.009
Employed 77 (72−82), <0.001 99∙48% <0.001
Retired/students 74 (68−81), <0.001 97.59% 0.632
Attitude Income level of the country
Low income countries 12 69 (62−76), <0.001 98.73%
Lower-middle income countries 24 72 (66−78), <0.001 99.45%
Upper-middle income countries 23 78 (72−84), <0.001 99.68%
High income countries 12 77 (70−84), <0.001 99.51%
Continent
Asia 28 77 (72−82), <0.001 99.58%
Africa 17 70 (63−77), <0.001 99.15%
Middle East 17 79 (72−85), <0.001 99.58%
Americas 7 66 (56−77), <0.001 99.35%
Europe/Oceania 2 71 (70−72), 1.00 0.29%
Study period
January-March, 2020 20 80 (74−86), <0.001 99.71%
April-June, 2020 42 73 (68−77), <0.001 99.50%
July-October, 2020 8 65 (57-73), <0.001 98.70%
Age group 14
Below 30 years 68 (59−78), <0.001 99.45% <0.001
30 years and above 73 (65−81), <0.001 99.50% 0.010
Gender 32
Male 73 (68−79), <0.001 99.55% 0.087
Female 73 (68−78), <0.001 99.69% 0.004
Education level 27
Up to 12 years 71 (66−76), <0.001 98.80% 0.451
Above 12 years 71 (65−77), <0.001 99.71% 0.027
Employment status 15
Unemployed 74 (66−81), <0.001 98.34% 0.029
Employed 75 (69−82), <0.001 99.49% 0.006
Retired/students 74 (66−82), <0.001 98.93% 0.004
Practice Income level of the country
Low income countries 14 55 (46−64), <0.001 99.07%
Lower-middle income countries 24 74 (69−79), <0.001 99.36%
Upper-middle income countries 22 77 (70−84), <0.001 99.81%
High income countries 15 66 (58−73), <0.001 99.44%
Continent
Asia 29 76 (71−81), <0.001 99.62%
Africa 17 57 (49−65), <0.001 99.21%
Middle East 18 75 (68−82), <0.001 99.64%
Americas 9 66 (53−79), <0.001 99.72%
BMJ Publishing Group Limited (BMJ) disclaims all liability and responsibility arising from any relianceSupplemental material placed on this supplemental material which has been supplied by the author(s) BMJ Open
doi: 10.1136/bmjopen-2021-051447:e051447. 11 2021;BMJ Open, et al. Siddiquea BN

15
Outcome Study characteristics No of studies Estimates score (%)
(95% CI*), p-value
I2 Egger test
(p-value) Europe/Oceania 2 57 (55−59), 1.00 0.28%
Study period
January-March, 2020 23 67 (60−75), <0.001 99.79%
April-June, 2020 42 74 (70−79), <0.001 99.58%
July-October, 2020 8 57 (43−72), <0.001 99.65%
Age group 14
Below 30 years 80 (72−88), <0.001 99.34% 0.025
30 years and above 82 (74−90), <0.001 99.70% 0.006
Gender 39
Male 75 (69−80), <0.001 99.63% <0.001
Female 77 (72−82), <0.001 99.79% <0.001
Education level 31
Up to 12 years 74 (68−79), <0.001 99.24% 0.005
Above 12 years 77 (71−83), <0.001 99.86% <0.001
Employment status 18
Unemployed 78 (72−85), <0.001 98.79% <0.001
Employed 76 (68−83), <0.001 99.70% <0.001
Retired/students 76 (68−84), <0.001 98.95% 0.174 *CI: Confidence Interval
Table 7: Analysis by some important questions regarding knowledge, attitude and practice on COVID-19
Outcome Study characteristics No of
studies
Estimates score (%)
(95% CI*), p-value
I2 Egger test
(p-value) Knowledge Q1.Main symptoms 61 85 (81−89), <0.001 99.76% 0.0001
Q2.Population at risk 46 81 (77−86), <0.001 99.77% <0.001
Q3.Route of transmission 58 83 (79−87), <0.001 99.78% <0.001
Q4.Spread of infection by asymptomatic patients 39 75 (69−81), <0.001 99.80% <0.001
Q5.Face mask as a preventive measure 35 70 (63−78), <0.001 99.85% 0.699
Q6.Avoidance of crowded places as a preventive
measure
27 95 (93−97), <0.001 99.20% 0.030
Q7.Isolation and treatment of patients to prevent
infection
32 91 (87−95), <0.001 99.67% 0.012
Q8.Quarantine/Incubation period 44 87 (82−91), <0.001 99.80% 0.041
Attitude Q1.COVID-19 will be successfully controlled 22 71 (64−78), <0.001 99.78% 0.0003
Q2.It is important to maintain social distance 11 88 (81−94), <0.001 99.25% 0.623
Practice Q1.Hand hygiene 49 80 (75−86), <0.001 99.82% 0.016
Q2.Wearing face mask 56 65 (58−73), <0.001 99.90% 0.003
Q3.Social distancing 32 70 (63−77), <0.001 99.79% 0.0001
Q4.Avoiding crowded places 45 75 (70−81), <0.001 99.77% 0.0001
*CI: Confidence Interval
BMJ Publishing Group Limited (BMJ) disclaims all liability and responsibility arising from any relianceSupplemental material placed on this supplemental material which has been supplied by the author(s) BMJ Open
doi: 10.1136/bmjopen-2021-051447:e051447. 11 2021;BMJ Open, et al. Siddiquea BN

16
Figure 1: Correlation between components of KAP
Figure 1a: Correlation between knowledge and attitude
Figure 1b: Correlation between knowledge and practice
Figure 1c: Correlation between attitude and practice
R² = 0.0246Knowledge = 0.1752*Attitude + 0.6043
p = 0.186
0.00
0.20
0.40
0.60
0.80
1.00
0.00 0.20 0.40 0.60 0.80 1.00
Kn
ow
led
ge
Attitude
R² = 0.0998Knowledge = 0.4323*Practice + 0.3783
p = 0.006
0.00
0.20
0.40
0.60
0.80
1.00
0.00 0.20 0.40 0.60 0.80 1.00
Kn
ow
led
ge
Practice
Attitude = 0.4082*Practice + 0.4086
p = 0.004
0.00
0.20
0.40
0.60
0.80
1.00
0.00 0.20 0.40 0.60 0.80 1.00
Att
itu
de
Practice
BMJ Publishing Group Limited (BMJ) disclaims all liability and responsibility arising from any relianceSupplemental material placed on this supplemental material which has been supplied by the author(s) BMJ Open
doi: 10.1136/bmjopen-2021-051447:e051447. 11 2021;BMJ Open, et al. Siddiquea BN

17
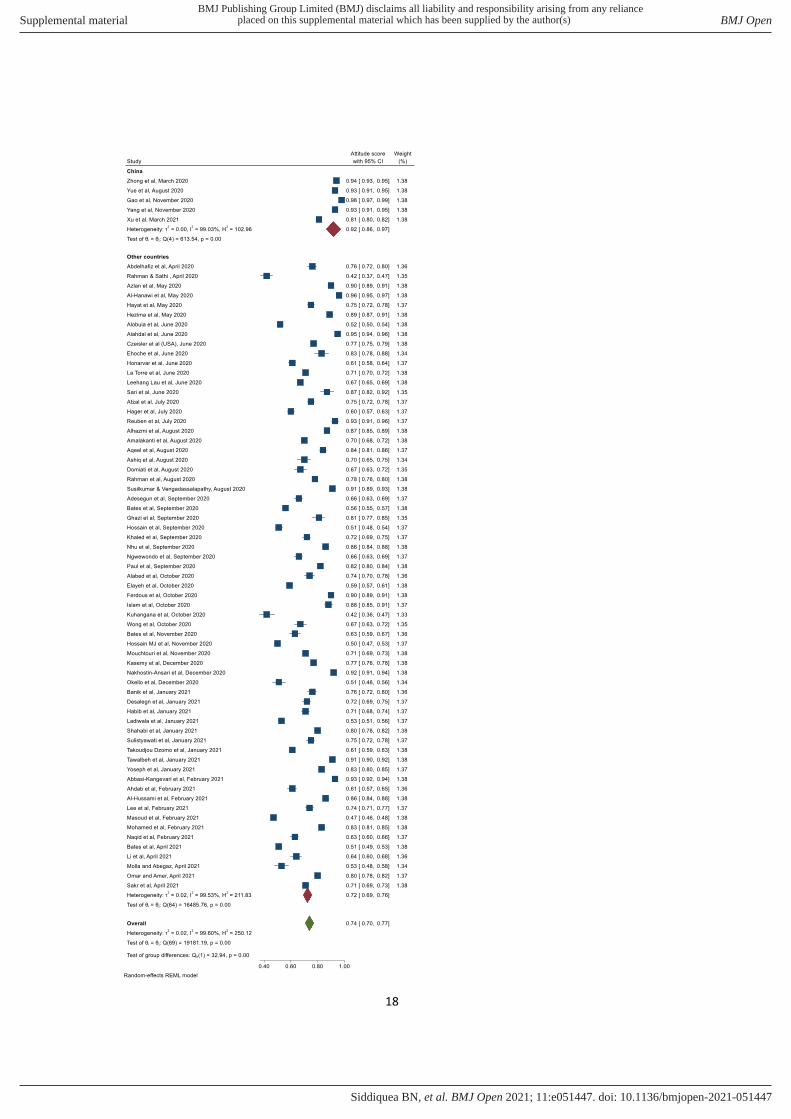
Figure 2: China vs Other countries
BMJ Publishing Group Limited (BMJ) disclaims all liability and responsibility arising from any relianceSupplemental material placed on this supplemental material which has been supplied by the author(s) BMJ Open
doi: 10.1136/bmjopen-2021-051447:e051447. 11 2021;BMJ Open, et al. Siddiquea BN
18
BMJ Publishing Group Limited (BMJ) disclaims all liability and responsibility arising from any relianceSupplemental material placed on this supplemental material which has been supplied by the author(s) BMJ Open
doi: 10.1136/bmjopen-2021-051447:e051447. 11 2021;BMJ Open, et al. Siddiquea BN

19
BMJ Publishing Group Limited (BMJ) disclaims all liability and responsibility arising from any relianceSupplemental material placed on this supplemental material which has been supplied by the author(s) BMJ Open
doi: 10.1136/bmjopen-2021-051447:e051447. 11 2021;BMJ Open, et al. Siddiquea BN

20
Figure 3: Analysis by quality of the studies
BMJ Publishing Group Limited (BMJ) disclaims all liability and responsibility arising from any relianceSupplemental material placed on this supplemental material which has been supplied by the author(s) BMJ Open
doi: 10.1136/bmjopen-2021-051447:e051447. 11 2021;BMJ Open, et al. Siddiquea BN

21
BMJ Publishing Group Limited (BMJ) disclaims all liability and responsibility arising from any relianceSupplemental material placed on this supplemental material which has been supplied by the author(s) BMJ Open
doi: 10.1136/bmjopen-2021-051447:e051447. 11 2021;BMJ Open, et al. Siddiquea BN

22
BMJ Publishing Group Limited (BMJ) disclaims all liability and responsibility arising from any relianceSupplemental material placed on this supplemental material which has been supplied by the author(s) BMJ Open
doi: 10.1136/bmjopen-2021-051447:e051447. 11 2021;BMJ Open, et al. Siddiquea BN