epid-based 3d dosimetry for pre-treatment imrt/vmat ... · epid-based 3d dosimetry for...
TRANSCRIPT

EPID-based 3D dosimetry forpre-treatment IMRT/VMAT Quality
Assurance
Abdulaziz Alhazmi
Munchen, 2018


EPID-based 3D dosimetry forpre-treatment IMRT/VMAT Quality
Assurance
Abdulaziz Alhazmi
Dissertationder Fakultat fur Physik
der Ludwig-Maximilians-UniversitatMunchen
vorgelegt vonAbdulaziz Alhazmi
geboren in Makkah
Munchen, den 19.11.2018

Erstgutachter: Prof. Dr. Katia ParodiZweitgutachter: Prof. Dr. Marco RiboldiTag der mundlichen Prufung: 17.12.2018


Zusammenfassung
Die Behandlung von Krebs mit Photonenstrahlung hat sich in den letzten Jahrzehntenrasant entwickelt mit dem Ziel, das therapeutische Verhaltnis zu verbessern, indem demTumor eine letale Dosis verabreicht wird bei gleichzeitiger Schonung des benachbarten,normalen Gewebes. Da der Erfolg der Krebstherapie von der Qualitat der Dosisabgabeabhangt, wurde ein Qualitatssicherungsprogramm (QA, Quality Assurance) etabliert, umeine systematische Uberwachung der Qualitat und Angemessenheit der Patientenbehand-lung durch die sogenannte Bestrahlungskette der Strahlentherapie sicherzustellen. Solchein Programm sammelt Informationen aus verschiedenen Bereichen der MedizinischenPhysik. Die Hauptaufgabe von Medizinphysikern besteht insbesondere darin, die Abgabeder geplanten Dosis an den Patienten sicherzustellen, wobei die Unsicherheit unter deninternational anerkannten Grenzwerten liegen soll. Die Bestrahlung ist jedoch mit der En-twicklung der Technologie komplizierter geworden. Daher ist die Entwicklung fortschrit-tlicher QA-Werkzeuge und -Methoden fur neue Ausrustungen und Techniken erforder-lich. In der Praxis werden verschiedene QA-Protokolle verwendet, die auf kommerziellenoder selbstentwickelten Tools und Methoden basieren, um internationalen Empfehlun-gen Rechnung zu tragen. Die gegenwartige Praxis hat jedoch Beschrankungen, entwederaufgrund der Abhangigkeit von Dosisberechnung oder Dosierungssystemen, was ein ar-beitsintensives Verfahren oder mangelnde Genauigkeit impliziert. Das Ziel dieser Ar-beit ist die Entwicklung eines QA-Tools fur die patientenindividuelle Qualitatssicherungvor der Behandlung. Dieses Werkzeug ist ein dosimetrischer Ansatz, der schnell, genauund dreidimensional (3D) ist, unabhangig vom Behandlungsplanungssystem (TPS, treat-ment planning system) und der Abgabemaschine, dabei sensitiv fur inharente Fehler. DasElectronic Portal Imaging Device (EPID) ist ein planarer Detektor, der starr an mod-ernen Linacs befestigt ist, die fur Bildgebungszwecke verwendet werden. Da dieseDetektortypen uber dosimetrische Merkmale verfugen, wurden diese Merkmale desEPID, das an der Abteilung fur Radiologie Onkologie der Universitatsklinik Munchen(Klinikum der Universitat Munchen, Ludwig-Maximilians-Universitat) installiert wurde,explizit untersucht. Ausgehend von den Erkenntnissen aus der EPID-Charakterisierungwurde ein Verfahren zur Kalibrierung des als Dosimeter in Wasser zu verwendendenEPID vorgestellt, wodurch das aus dem EPID gewonnene zweidimensionale (2D) Bildin eine 2D-Dosisverteilung umgewandelt werden kann. Die Genauigkeit der Kalib-rierungsmethode wurde anhand der weit verbreiteten Gamma-Bewertung gegenuber Ref-erenzdosimetern validiert. Das vorgeschlagene Verfahren liefert die 2D-Dosisverteilungmit einer Genauigkeit, die mit der Referenz von Dosimetern in einem Wassermediumvergleichbar ist, jedoch mit einer besseren raumlichen Auflosung und kurzeren Auf-bauzeiten. In Anbetracht der Einfuhrung neuer Behandlungstechniken wie der inten-sitatsmodulierten Strahlentherapie (IMRT, intensity modulated radiation therapy) und dervolumetrisch modulierten Arc-Therapie (VMAT) ist eine Validierung unter dynamischenGantry-Bedingungen von entscheidender Bedeutung, um festzustellen, ob die richtigeDosis unter dem richtigen Gantry-Winkel abgegeben wird. Zu diesem Zweck ist ein drei-dimensionaler Dosimetrieansatz erforderlich. Daher wurde in dieser Arbeit ein neuartigerAnsatz zur Rekonstruktion einer 3D-Dosisverteilung aus 2D-Dosisverteilungen entwick-elt. Eine Reihe mathematischer Operationen wurde implementiert, um eine 3D-Verteilungzu erzeugen, die mit der gewunschten raumlichen Auflosung ubereinstimmt und eine mitder TPS-Dosisberechnung vergleichbare Genauigkeit aufweist. Die Operationen wurden
v

in einen Algorithmus eingebettet, der die 2D-Dosisverteilungen auf verschiedenen Stufenruckprojiziert und so eine 3D-Dosisverteilung in einem virtuellen zylindrischen Phan-tom bildet (rekonstruiert). Die rekonstruierten 3D-Dosisverteilungen wurden unter Ver-wendung der Gamma-Bewertung mit allgemein empfohlenen Kriterien (3%, 3 mm) furherkommliche und komplexe klinische Behandlungsplane gegenuber Referenzmessungenvalidiert. Die Auswertung der verschiedenen IMRT- und VMAT-Plane hat gezeigt, dassdie Ubereinstimmung den allgemeinen Toleranzwert (d. h. 95%) eingehalten hat. Da dasQA-Instrument in der Lage sein sollte, dosimetrische und geometrische Ungenauigkeitenzu erkennen, wurde die Sensitivitat der entwickelten Rekonstruktionsmethode bei beab-sichtigten Abweichungen der Dosisabgabe in Bezug auf den Referenzplan bewertet. Eswird gezeigt, dass die Rekonstruktionsmethode in der Lage ist, geometrische Fehler desMultilamellenkollimator (MLC, multileaf colimator) in der Großenordnung von 2 mm,eine Winkelverschiebung des Portalwinkels von 1 Grad und einen dosimetrischen Fehlervon± 4% zu erkennen. Die entwickelte Arbeit stellt eine bevorzugte Methode gegenuberanderen in der Literatur vorgeschlagenen und auch gegenuber kommerziellen Geratenvor. Der Ansatz ist pradiktionsfrei, schnell und einfach in der klinischen Routine zuimplementieren. Ausgehend von einer Aufnahme an Luft wird eine wasseraquivalente3D-Dosisverteilung mit relativ hoher Auflosung ohne externes Phantom oder Dosime-triegerat erstellt. Der vorgeschlagene Ansatz erhoht somit die Effizienz und Genauigkeitder QA-Protokolle in der Strahlentherapie. Es ist moglich, die vorgeschlagenen Arbeitenin ein umfassendes patientenspezifisches QA-Programm zu integrieren, welches auch eineauf MC basierende Dosisberechnung und die vollstandige Automatisierung des gesamtenQA-Verfahrens umfasst.
vi

Abstract
Treatment of cancer using photon radiation has rapidly developed in the last few decades.The development has aimed at improving the therapeutic ratio by delivering a lethal ra-diation dose to the tumor with sparing adjacent normal tissue. As the success of cancerradiation therapy depends on the quality of dose delivery, a Quality Assurance (QA) pro-gram has been established to assure the objective of systematic monitoring of the qualityand appropriateness of patient care through the radiotherapy treatment chain. While sucha program requires inputs from different disciplines, the primary task of medical physi-cists, in particular, is to ensure the delivery of the planned dose to the patient with anuncertainty below internationally accepted limits. However, the dose delivery has be-come more complicated with the development of technology. Hence, the developmentof advanced QA tools and methods to accommodate new equipments and techniques isrequired. In practice, different QA protocols relying on commercial or -in-house- devel-oped tools and methods are used to accommodate international recommendations. How-ever, the current practice has limitations due to either dependency on dose calculation ordose delivery systems, implying labor intensive procedure or lack of accuracy. The aimof the thesis is to develop a QA tool for patient-specific pre-treatment QA. The tool isto be identified as a dosimetric approach which is fast, accurate, three-dimensional (3D),independent of the treatment planning system (TPS) and delivery machine and sensitiveto error. Electronic Portal Imaging Device (EPID) is a planar detector rigidly attached tomodern linacs used for imaging purposes. As these types of detectors offer dosimetricfeatures, the dosimetric characteristics of the EPID installed at the Department of Radi-ation Oncology of the University Clinic of Munich (Klinikum der Universitat Munchen,Ludwig-Maximilians-Universitat) have been explicitly investigated. Making use of theknowledge gained from EPID characterization, a method to calibrate the EPID to be usedas a dosimeter in water has been presented, thus converting the two-dimensional (2D) im-age, as acquired from EPID, into a 2D dose distribution. The accuracy of the calibrationmethod has been validated against reference dosimeters by using the widely used gammaevaluation. The proposed method provides the 2D dose distribution with accuracy com-parable to reference dosimeters in a water medium but better spatial resolution and set-uptime efficiency. However, considering the introduction of new treatment techniques suchas Intensity Modulated Radiation Therapy (IMRT) and Volumetric Modulated Arc Ther-apy (VMAT), a validation under dynamic gantry condition becomes crucial to determinethat the correct dose is delivered at the correct gantry angle. For this purpose, a 3D dosi-metric approach is required. Hence, a novel approach to reconstruct a 3D dose distributionfrom 2D dose distributions has been developed in this thesis. A series of mathematicaloperations have been implemented to generate a 3D distribution matching the desiredspatial resolution and having comparable accuracy with the TPS dose calculation. Theoperations have been embedded in an algorithm that back-project the 2D dose distribu-tions at different levels thus forming (reconstructing) a 3D dose distribution in a virtualcylindrical phantom. The reconstructed 3D dose distributions have been validated usinggamma evaluation with commonly recommended (3%, 3 mm) criteria for conventionaland complex clinical treatment plans against reference measurements. The evaluation forthe different IMRT and VMAT plans has resulted in passing rate exceeding the common

tolerance level (i.e. 95%). As the rationale of the QA tool is to be capable of detect-ing dosimetric and geometric inaccuracy, the sensitivity of the developed reconstructionmethodology has been evaluated in the presence of intentional dose delivery deviationswith respect to the reference plan. The reconstruction methodology has demonstrated tobe sensitive to geometric errors of the multi-leaf collimator (MLC) in the order of 2 mm,gantry angle shift of 1 degree and dosimetric error of ±4%. The developed work presentsa preferable methodology over others proposed in the literature and also over commercialdevices. The approach is prediction-free, fast and easy to implement in clinical routine.Starting from an in-air acquisition, a water equivalent 3D dose distribution with relativelyhigh resolution is obtained without an external phantom or dosimetric device. Thus, theproposed approach adds efficiency and accuracy to QA protocols in radiation therapy.The proposed work is foreseen to be integrated into a comprehensive patient-specific QAprogram including an MC based dose calculation and full automation of the whole QAprocedure.
viii

Contents
1 Introduction and Motivation 1
1.1 Modern radiation therapy . . . . . . . . . . . . . . . . . . . . . . . . . . 2
1.1.1 External radiation therapy . . . . . . . . . . . . . . . . . . . . . 2
1.1.2 Internal radiation therapy . . . . . . . . . . . . . . . . . . . . . . 3
1.2 Linac-based radiation therapy techniques . . . . . . . . . . . . . . . . . 4
1.2.1 Three-dimensional Conformal Radiation Therapy (3D-CRT) . . . 4
1.2.2 Intensity Modulated Radiation Therapy (IMRT) . . . . . . . . . . 4
1.2.3 Volumetric Modulated Arc Therapy (VMAT) . . . . . . . . . . . 5
1.2.4 Stereotactic Body Radiation Therapy (SBRT) . . . . . . . . . . . 6
1.3 Quality assurance for radiation therapy . . . . . . . . . . . . . . . . . . . 6
1.4 Rationale for EPID based dosimetry . . . . . . . . . . . . . . . . . . . . 7
1.5 Thesis context and objective . . . . . . . . . . . . . . . . . . . . . . . . 9
2 Fundamentals of radiation therapy and dosimetry 11
2.1 Interaction of radiation with matter . . . . . . . . . . . . . . . . . . . . . 11
2.1.1 Interaction of photons with matter . . . . . . . . . . . . . . . . . 11
2.1.2 Interactions of charged particle radiation with matter . . . . . . . 15
2.2 Radiation detector properties . . . . . . . . . . . . . . . . . . . . . . . . 17
2.2.1 Ionization Chambers . . . . . . . . . . . . . . . . . . . . . . . . 17
ix

CONTENTS
2.2.2 Diode Detectors . . . . . . . . . . . . . . . . . . . . . . . . . . 18
2.2.3 Diamond Detectors . . . . . . . . . . . . . . . . . . . . . . . . . 19
2.2.4 Films . . . . . . . . . . . . . . . . . . . . . . . . . . . . . . . . 20
2.2.5 Thermoluminescent detectors . . . . . . . . . . . . . . . . . . . 21
2.2.6 Polymer Gels . . . . . . . . . . . . . . . . . . . . . . . . . . . . 22
2.3 Clinical linac . . . . . . . . . . . . . . . . . . . . . . . . . . . . . . . . 22
2.4 Quantification and Measurement of Dose . . . . . . . . . . . . . . . . . 24
2.4.1 Photon fluence and energy fluence . . . . . . . . . . . . . . . . 26
2.4.2 Exposure . . . . . . . . . . . . . . . . . . . . . . . . . . . . . . 26
2.4.3 Kerma . . . . . . . . . . . . . . . . . . . . . . . . . . . . . . . . 26
2.4.4 Dose . . . . . . . . . . . . . . . . . . . . . . . . . . . . . . . . 27
2.4.5 Charged Particle Equilibrium . . . . . . . . . . . . . . . . . . . . 27
2.5 Dosimetry of Photon Beams . . . . . . . . . . . . . . . . . . . . . . . . 29
2.5.1 Characteristics of Photon Beams . . . . . . . . . . . . . . . . . . 29
2.5.2 Dosimetric measurements used to characterize the photon beam . 30
2.5.3 Dosimetry of photon beams in a patient . . . . . . . . . . . . . . 31
2.6 Treatment planning systems and dose calculation . . . . . . . . . . . . . 32
2.6.1 Approaches to dose calculation . . . . . . . . . . . . . . . . . . 33
2.7 Quantitative assessment of dose distributions . . . . . . . . . . . . . . . 35
2.7.1 Qualitative comparison methods . . . . . . . . . . . . . . . . . . 36
2.7.2 Quantitative comparison methods . . . . . . . . . . . . . . . . . 36
2.8 Rationale for patient specific pre-treatment QA . . . . . . . . . . . . . . 39
3 Electronic Portal Imaging Device design and clinical usage 41
3.1 Background . . . . . . . . . . . . . . . . . . . . . . . . . . . . . . . . . 41
3.1.1 EPID structure and response to ionizing radiation . . . . . . . . . 42
x

CONTENTS
3.1.2 Imager readout and acquisition system . . . . . . . . . . . . . . . 44
3.1.3 EPID for dosimetric purposes . . . . . . . . . . . . . . . . . . . 45
3.1.4 Dosimetry for pre-treatment QA . . . . . . . . . . . . . . . . . . 49
3.1.5 In vivo dosimetry . . . . . . . . . . . . . . . . . . . . . . . . . . 50
4 Dosimetric characterization of the EPID 53
4.1 Introduction and motivation . . . . . . . . . . . . . . . . . . . . . . . . . 53
4.2 Materials . . . . . . . . . . . . . . . . . . . . . . . . . . . . . . . . . . 53
4.2.1 Linear accelerator and EPID . . . . . . . . . . . . . . . . . . . . 53
4.2.2 Image acquisition and software . . . . . . . . . . . . . . . . . . 54
4.3 Method . . . . . . . . . . . . . . . . . . . . . . . . . . . . . . . . . . . 55
4.4 Results . . . . . . . . . . . . . . . . . . . . . . . . . . . . . . . . . . . . 57
4.5 Outlook . . . . . . . . . . . . . . . . . . . . . . . . . . . . . . . . . . . 61
5 EPID calibration to dose in water 67
5.1 Material and Method . . . . . . . . . . . . . . . . . . . . . . . . . . . . 67
5.1.1 Offset correction . . . . . . . . . . . . . . . . . . . . . . . . . . 67
5.1.2 Dead pixel correction . . . . . . . . . . . . . . . . . . . . . . . . 68
5.1.3 Pixel sensitivity correction . . . . . . . . . . . . . . . . . . . . . 68
5.1.4 Relative off-axis ratio (ROAR) . . . . . . . . . . . . . . . . . . . 69
5.1.5 Field size and penumbra correction . . . . . . . . . . . . . . . . 69
5.1.6 Pixel value to dose conversion . . . . . . . . . . . . . . . . . . . 71
5.1.7 Validation . . . . . . . . . . . . . . . . . . . . . . . . . . . . . . 71
5.2 Results . . . . . . . . . . . . . . . . . . . . . . . . . . . . . . . . . . . . 72
5.2.1 Dead pixel correction . . . . . . . . . . . . . . . . . . . . . . . . 72
5.2.2 Pixel sensitivity correction . . . . . . . . . . . . . . . . . . . . . 72
xi

CONTENTS
5.2.3 Relative off-axis ratio (ROAR) . . . . . . . . . . . . . . . . . . . 75
5.2.4 Field size and penumbra correction . . . . . . . . . . . . . . . . 75
5.2.5 Pixel value to dose conversion . . . . . . . . . . . . . . . . . . . 75
5.2.6 Validation . . . . . . . . . . . . . . . . . . . . . . . . . . . . . . 75
5.3 Discussion and conclusion . . . . . . . . . . . . . . . . . . . . . . . . . 80
6 3D dose reconstruction algorithm 83
6.1 Introduction . . . . . . . . . . . . . . . . . . . . . . . . . . . . . . . . . 83
6.2 Material and methods . . . . . . . . . . . . . . . . . . . . . . . . . . . . 84
6.2.1 Geometrical magnification . . . . . . . . . . . . . . . . . . . . . 84
6.2.2 Percentage depth dose (PDD) curve . . . . . . . . . . . . . . . . 85
6.2.3 Depth specific off-axis ratio . . . . . . . . . . . . . . . . . . . . 86
6.2.4 Depth specific lateral scatter kernel . . . . . . . . . . . . . . . . 86
6.2.5 Rotation . . . . . . . . . . . . . . . . . . . . . . . . . . . . . . . 86
6.2.6 Validation and data analysis . . . . . . . . . . . . . . . . . . . . 89
6.3 Results . . . . . . . . . . . . . . . . . . . . . . . . . . . . . . . . . . . . 90
6.3.1 Validation of PDD curves . . . . . . . . . . . . . . . . . . . . . 90
6.3.2 Validation of depth specific lateral scatter kernel . . . . . . . . . 90
6.3.3 Time labeling of EPID image frames and gantry angles combinedwith correction for gravitational displacement of the EPID . . . . 94
6.3.4 Validation and verification of clinical treatment plans . . . . . . . 94
6.4 Discussion and conclusion . . . . . . . . . . . . . . . . . . . . . . . . . 97
6.4.1 Geometric magnification . . . . . . . . . . . . . . . . . . . . . . 100
6.4.2 PDD curves and lateral dose profile . . . . . . . . . . . . . . . . 100
6.4.3 Time labeling efficiency and the correction for gravitational dis-placement . . . . . . . . . . . . . . . . . . . . . . . . . . . . . . 100
6.4.4 Validation . . . . . . . . . . . . . . . . . . . . . . . . . . . . . . 101
xii

CONTENTS
7 Sensitivity analysis of EPID-based 3D dose reconstruction 103
7.1 Introduction . . . . . . . . . . . . . . . . . . . . . . . . . . . . . . . . . 103
7.2 Material and methods . . . . . . . . . . . . . . . . . . . . . . . . . . . . 103
7.3 Results . . . . . . . . . . . . . . . . . . . . . . . . . . . . . . . . . . . . 104
7.4 Discussion and conclusion . . . . . . . . . . . . . . . . . . . . . . . . . 105
8 Discussion and outlook 109
8.1 Plan evaluation . . . . . . . . . . . . . . . . . . . . . . . . . . . . . . . 110
8.2 Toward a comprehensive patient-specific pre-treatment QA . . . . . . . . 111
8.3 In-vivo dosimetry . . . . . . . . . . . . . . . . . . . . . . . . . . . . . . 113
9 Conclusion 115
A Mathematical optimization and code implementation 117
A.1 Overview . . . . . . . . . . . . . . . . . . . . . . . . . . . . . . . . . . 117
A.2 Code implementation . . . . . . . . . . . . . . . . . . . . . . . . . . . . 118
B List of publications and conference contributions 125
xiii

Chapter 1
Introduction and Motivation
Cancer is a group of diseases defined by an abnormal cell growth in any body organspreading to another organ in a process called metastasizing. Metastases are the primarycause of death from cancer. Globally, cancer is the second leading cause of death [1][2]. In 2013, there were 14.9 million incident cancer cases and 8.2 cancer-related deathsrecorded worldwide [3]. Scientists predict that 23.6 million cases will be diagnosed withcancer worldwide each year by 2030 [4]. In order to fight this major societal challenge,three major types of treatment are typically adopted, individually or more often in com-bination. Namely: surgery, chemotherapy, and radiotherapy. Less common proceduresand techniques for cancer treatment include immunotherapy, targeted therapy, stem celltransplant and hormone therapy. Choosing the adequate type of treatment depends on thecancer type and location. The treatment plan can include one or a combination of typesmentioned above. However, radiotherapy is involved in about 50% of cancer treatmentcourse in Europe and the US [5] [6]. Radiotherapy is based on the use of ionizing radia-tion (photons, electrons, ions and -in a few cases- neutrons) to deliver conformal dose (i.e.energy per mass) to the cancer target. Radiotherapy aims to improve the therapeutic ratioby delivering a lethal radiation dose to the tumor with sparing adjacent normal tissue.Using photon for cancer treatment has begun in 1896 shortly after the discovery of X-raysby Rontgen. Since then, a substantial improvement in modalities and techniques has beenimplemented up to our current day.An overview of the state of the art of radiation therapy modalities and techniques will bepresented in this chapter. Then, a brief description about quality assurance programs inclinics will be addressed. Finally, the aim of this thesis will be presented.
1

CHAPTER 1. INTRODUCTION AND MOTIVATION
1.1 Modern radiation therapy
Radiation therapy can be delivered using different modalities. Modalities are categorizedbased on the location of the radiation source relative to the patient (i.e. external or internal)and the type of radiation. Independently of the delivery modalities, the process starts,in general, with the treatment planning based on a patient image obtained using X-rayComputed Tomography (CT). Recently, functional and/or anatomical imaging modalitiessuch as Positron Imaging Tomography (PET) and Magnetic Resonance Imaging (MRI)have been introduced to complement the anatomical information of the CT images(s) [7].The tumor and the normal tissue are delineated and contoured on the patient image. Theradiation delivery technique is chosen based on clinical consideration, including shape,size and location of the tumor. A brief description of radiation delivery modalities isgiven in the following:
1.1.1 External radiation therapy
1.1.1.1 Photon external radiation therapy
Photons with high energy (∼MeV) either emerge from a nucleus (gamma irradiation) ororiginated from its orbits (X-ray) are used to deliver a conformal dose to patients. Specif-ically, gamma rays originate from radioactive nuclei, while X-rays originate in a targetbombarded with energetic electrons. The technologies used for dose delivery purposeinclude Linear accelerator (linac), Gamma knife, Tomotherapy and cyberknife [8]. Themost common and versatile technology in use in clinics worldwide is the linac whereasthe other modalities are designed to treat specific cancer types and locations. Since thelinac is also the technology of interest in this work, a more detailed description will followin section 2.3.
1.1.1.2 Particle external radiation therapy
The external radiation treatment in particle therapy uses accelerated beams (up to fewhundreds MeV/u) of protons or heavier ions. By definition, electron and neutron therapymay also be categorized as particle therapy. But due to its different source and type ofinteractions, particle therapy is usually referred to ion beam therapy to exclude the elec-trons and neutrons. Ions have different dosimetric characteristics than the more widelyused photons when traversing media. In water, the typical energy deposition of the photonbeam is exponentially decreasing with depth after the build-up region. Differently, ionsshow a steady energy deposition for a certain depth and then a steep rise to the peak (the“Bragg peak”) near the end of their range (figure 1.1) [8]. These characteristics of ionsgive the advantage in treatment by depositing the maximum energy within the target (thetumor) and sparing the healthy tissue from unwanted energy deposition. Although this
2

1.1. MODERN RADIATION THERAPY
advantage represents a game changer in radiation therapy, it has not yet been consideredfor (entirely) replacing conventional photon therapy. It is argued that though the physicsof particles and their interaction with matter are well understood, delivering them accu-rately and safely to the desired target area in a patient still has considerable uncertainties.Besides, the biological effectiveness of ion beams to tumor is not fully understood [9]. Inaddition, the technology of particle therapy is too expensive at present. For example, thecost of linear accelerator technology with proton therapy is higher in the order of 10-20times more than photon therapy unit with the same technology. On the other hand, carbonion therapy unit is about 100 times more expensive than proton therapy unit. [9].
Figure 1.1: Typical depth dose characteristics of protons and photons in water [9].
1.1.2 Internal radiation therapy
1.1.2.1 Sealed source radiation therapy
Sealed source radiation therapy or so-called (brachytherapy) is a form of therapy per-formed by positioning a sealed source emitting high dose or low dose rates of beta and/orgamma radiation next to the desired tumor for a certain irradiation period. According tothe type and location of the tumor, the treatment uses either interstitial, intracavitary, orsurface application. The usage of brachytherapy gives the advantage of treating the tumorwith typically a lower integral dose to normal tissue than external radiation therapy. Thewide range of sources which can be used for this treatment (e.g. Cs137, Ir192, Au198, I125,and Pd103) offers flexibility in choosing the appropriate radiation energy and half-time ofthe radionuclide. Additionally, technical developments are in the direction of artificialmanipulation of sources sizes, shape and activity to fulfill the clinical requirement [8].
3

CHAPTER 1. INTRODUCTION AND MOTIVATION
1.1.2.2 Unsealed source radiation therapy
In contrast to sealed source radiation therapy, unsealed source radiation therapy is amethod where radioactive substances are injected (or ingested) to a patient in order totarget a specific organ using the chemical properties of the a tracer to which the radioac-tive isotope is bound, and the behavior of the digestive and circular systems of the humanbody. The method uses a similar concept as functional diagnostic imaging in nuclearmedicine but different types and quantities of radiopharmaceuticals. However, unsealedsource radiation therapy is confined to a few clinical usages or applications. (I131) used totreat thyroid cancers and (Ra223, Sr89 or Sm153) used to treat bone metastases [8].
1.2 Linac-based radiation therapy techniques
Modern linacs in combination with auxiliary dose delivery systems provide different tech-niques of external radiation therapy based on 3D anatomical information provided by CTand/or PET and MRI. A description of the most common techniques, with focus on thoserelated to the thesis scope, is pointed out in the following.
1.2.1 Three-dimensional Conformal Radiation Therapy (3D-CRT)
3D-CRT is a treatment technique making use of several treatment projection angles andcomplex fields defined by Multileaf collimator (MLC) to geometrically conform the ther-apeutic dose as close as possible to the target volume based on ”forward treatment plan-ning” method. Most treatments are delivered with a flattened beam (made uniform by theuse of flattening filters) and with uniform intensity across the field (within the flatnessspecification limits). Physical and non-physical wedges or compensators are occasionallyused to modify the intensity profile to correct for contour irregularities of the human bodyin order to produce more uniform dose distribution [8]. Figure 1.2 illustrates a typicalsix-field technique to treat a prostate tumor case using 3D-CRT.
1.2.2 Intensity Modulated Radiation Therapy (IMRT)
IMRT is based on the delivery of several treatment fields that adapt the therapeutic doseaccording to a modulation of the photon fluence. In addition to the use of different projec-tion angles and different MLC fields than used in 3D-CRT, the dose can be more optimizedto the target volume utilizing a nonuniform intensity beam. Intensity modulation is per-formed by MLC modulation in step-and-shoot (segmental) or sliding-window (dynamic)fashions per projection angle. The planned fluence is electronically transmitted to thesynchronized MLC and linac for treatment delivery. A linac control system guarantees
4

1.2. LINAC-BASED RADIATION THERAPY TECHNIQUES
Figure 1.2: The upper left panel displays a six-field 3D beam arrangement for a prostate caseviewed along the superior-inferior axis. The upper right panel shows the uniform conformal dosezones (red line) covering the tumor volume and prostate in the isocenter axial plane. Lower paneldisplays a beam shaping relative to the contour of the tumor volume (solid light blue) and shieldingof of the rectum (brown wire cage) and bladder (yellow wire cage) [10].
the integration of treatment planning and delivery to ensure accurate and efficient datatransfer [11].
1.2.3 Volumetric Modulated Arc Therapy (VMAT)
VMAT is based on the delivery of a rotational cone beam with variable shape and beamintensity. As an advanced form of IMRT, VMAT delivers the dose continuously as thegantry rotates, leaves shift and dose rates change. The planner optimizes field shapeand beam intensities for a large number of projection angles, according to one or twofull gantry rotations. Unlike IMRT, the projection angles are not fixed, and the angularresolution and rotational speed are dependent on the linac. However, the MLC movementsand the gantry rotation have to be synchronized to deliver the exact field shape at the exactprojection angle as planned. The large number of projection angles gives the advantageof more conformal dose to the tumor and better sparing for organs at risk than the fewerfixed projections used in IMRT. Moreover, VMAT is usually preferred to IMRT because ofsuperior delivery efficiency. The amount of saved time in comparison to other techniquesis dependent on the adopted system and the planning protocol of the specific clinic [12].
Typical dose distributions for the treatment of prostate tumor using the described threetechniques are illustrated in figure (1.3).
5

CHAPTER 1. INTRODUCTION AND MOTIVATION
1.2.4 Stereotactic Body Radiation Therapy (SBRT)
SBRT refers to a technique that uses ultrahigh doses and precise treatment fields to bedelivered in a lower number of fractions than conventional techniques. The higher doserate brings more fatality to the fast recovering tumor cells but requires additional measuresfor dose conformation. For instance, the penumbra (fall-off) region around the radiationfield has to be well-defined to minimize the dose to normal tissue or more importantlyorgans at risk. Accordingly, the dose delivery accuracy is of critical importance whenusing this technique. Thus, the recommended tolerance level for SBRT is more restrictivein comparison to other radiation therapy techniques [13].
(a)
c(b)
(c)
Figure 1.3: Dose distributions for the treatment of prostate tumor using different techniques (a)3D-CRT (b) IMRT and (c) VMAT (adopted from [12]).
1.3 Quality assurance for radiation therapy
”The purpose of a quality assurance program is the objective, systematic monitoring ofthe quality and appropriateness of patient care. Such a program is essential for all activi-ties in radiation oncology. The quality assurance program should be related to structure,process and outcome, all of which can be measured. Structure includes the staff, equip-ment, and facility. Process covers the pre- and post-treatment evaluations and the actualtreatment application. Outcome is documented by the frequency of accomplishing statedobjectives, usually tumor control, and by the frequency and seriousness of treatment-induced sequelae” [14]. Thus, the quality assurance (QA) program in radiation therapy
6

1.4. RATIONALE FOR EPID BASED DOSIMETRY
includes efforts from different disciplines. With reference to figure 1.4, each step requiresinputs either from the radiation oncologists, physicists, engineers or therapists. Althoughmedical physicists are more involved in the technical than medical aspects of QA, theirefforts substantially interplay with those of the other groups. In particular, the primarytask of medical physicists is to ensure the delivery of the planned dose to the patient withan uncertainty inferior to 5% [15].
Uncertainties in treatment can be systematic and random. While the random errors cannotbe controlled, the systematic errors can be controllable if a comprehensive QA programis conducted. In the framework of linac based radiation therapy, the program should beable to catch errors of different origins including: (a) linac output, (b) patient image usedfor treatment planning, (c) dose calculation in the patient image, (d) data transfer betweenthe TPS and the linac control system and (e) daily variations in patient positioning (e.g.using inaccurate positioning lasers within treatment room). The rapid evolution of moreconformal dose delivery combined with the advancement in imaging techniques is addingpotential for improving the therapeutic ratio between tumor and normal tissue response.However, the new advances have resulted in a recognized need for greater accuracy testsin the radiation treatment process [16]. Thus, national and international organizationsprovide local clinics with QA regulations and recommendations for these specific tech-niques. Unfortunately, the regulations are general and usually cannot keep pace withdevelopment in technology [10]. The lack of specific QA guidelines makes the clinicsdevelop their own protocols depending on in-house or commercial methods and detectors[17]. Especially for delivery QA, the developed programs are focused on detecting IM-RT/VMAT related errors which cannot be detected by conventional QA procedures usedfor the conventional treatment techniques. Relevant aspects to tests for correct beam de-livery include: accuracy and reproducibility of the MLC leaf positioning, measurementsof the inter- and intra-leaf leakage, leaf speed control, dose and dose rate linearity and-specifically for VMAT- gantry rotational speed.After having established these procedures, several clinics start to implement a pre-treatment patient-specific QA for IMRT/VMAT plans in their practice. Implementationof patient-specific pre-treatment QA proved to be crucial for treatment chain but needsmore investment in human resources and machine time [18]. Research communities areworking on optimization of QA tools to perform comprehensive tests more efficiently.
1.4 Rationale for EPID based dosimetry
Delivering the intended radiation dose to the patient is a complex process. The assuranceof the correct dose delivery needs equipment that accurately measures the dose with highspatial and temporal resolutions. Additionally, in IMRT/VMAT techniques, a 3D dosime-ter is desirable. The required features are not available in a single commercial device.Thus, physicists use different dosimeters to satisfy these requirements. In practice, theQA time efficiency is becoming an essential aspect of QA procedure. Optimizing theset-up and processing time of current dosimetric methods without sacrificing the testing
7

CHAPTER 1. INTRODUCTION AND MOTIVATION
Figure 1.4: Steps in radiation therapy process and major uncertainties associated with each step(adapted from [18]).
8

1.5. THESIS CONTEXT AND OBJECTIVE
quality is a goal. Hence, it is desirable to identify a dosimeter which is fast, accurate, 3D,independent of TPS or delivery machine and sensitive to error dosimeter.
Electronic Portal Imaging Device (EPID) is a planar detector rigidly attached to modernlinacs with a primary function of 2D anatomical imaging of the patient prior to treatment.It has been used for more than a decade for positioning verification. Prior to dose deliv-ery, the oncologist checks the alignment of bony structures or other landmarks betweenEPID images acquired on-site and reference images. The reference image is a digitallyreconstructed radiograph (DRR), which is a virtual radiograph generated by simulatingthe X-ray transport into the patient CT and incident onto the detector plane [19].Despite being used for imaging, EPID has been found as a candidate tool for QA. Itprovides a relatively large detection area with a high spatial resolution. It requires no set-up time and generates real-time images with sub-second temporal resolution which withspecial computational approaches can be used to generate 3D dose distribution, as will bediscussed in chapter 3.
1.5 Thesis context and objective
The aim of this thesis is to develop a novel method to reconstruct a 3D dose distributionusing EPID technology for pre-treatment QA. The investigated 3D dosimetry is tailoredto IMRT/VMAT treatment plans. The dose reconstruction algorithm is implemented andtested based on the equipment installed at the Department of Radiation Oncology of theUniversity Clinic of Munich (Klinikum der Universitat Munchen, Ludwig-Maximilians-Universitat). To illustrate the roadmap towards achievement of this goal, the content of thethesis is divided into steps that span from the physics background of the EPID technologyto the performed experiments in the clinic.
In particular, chapter 2 explains the physics of photon and particle interactions with matterand presents a theoretical description of the radiation detectors typically used in clinicsand the clinical X-ray generation among those techniques that are of interest for the the-sis. Chapter 3 illustrates the technology of EPID and signal acquisition as well as imageprocessing. Chapter 4 presents the dosimetric characteristics of the EPID in comparisonto other dosimeters used in clinics followed by a complete literature review of the differ-ent approaches to EPID dosimetry. Then, chapter 5 outlines the proposed novel methodfor calibrating the EPID to produce a 2D dose distribution. The chapter then explainsthe novel dose reconstruction method in chapter 6. The explanation includes a step bystep verification and result illustration. The overall accuracy in comparison to differentdosimetry methods is illustrated at the end of the chapter, with evaluation of IMRT/V-MAT treatment plans of real clinical cases. Chapter 7 presents the tests of the sensitivityof the proposed method detecting delivery errors along a description of the experimentdesign and result. Chapter 8 is dedicated to discuss the findings and the potential usage ofthe proposed dose reconstruction method with a comparison to other methods. The thesisends with a chapter giving the summary of the work and putting forward perspectives forthe development of radiation therapy QA.
9


Chapter 2
Fundamentals of radiation therapy anddosimetry
2.1 Interaction of radiation with matter
2.1.1 Interaction of photons with matter
In contrast to charged particle, photons are not detected by either electrical or magneticfields. Their electrical and magnetic properties are relevant to interaction with matter.They can indirectly ionize the orbital electrons of the target atoms by undergoing vari-ous possible interactions. Moreover, they can also directly ionize the atom by interactingwith the electrostatic field of the nucleus. The probability for each interaction dependson the energy hν of the photon and the atomic number Z of the target. These interac-tions could be categorized into five types: coherent (Rayleigh) scattering, photoelectriceffect, Compton effect, pair production and photonuclear disintegration. Since coherentscattering and photonuclear disintegration occurs mainly in energies range ≤10 keV and≥8 MeV respectively, these interactions are out of the energy used in this thesis (i.e. upto 6 MeV). The other three interactions, as described in the following, have fundamentalroles in radiotherapy, imaging as well as radiation dosimetry.
2.1.1.1 Photoelectric effect
The photoelectric effect occurs when a photon is absorbed by an atom causing the ejectionof an orbital electron. As a condition in this effect, the photon energy is fully absorbedby the atom. The kinetic energy equals the difference between the photon energy andthe electron binding energy. The ejected atomic electron creates a vacancy in the shellcausing an electron-ion pair and atomic instability. As a consequence, an electron froman outer shell fills the vacancy with energy loss in the form of characteristic X-rays or
11

CHAPTER 2. FUNDAMENTALS OF RADIATION THERAPY AND DOSIMETRY
Auger electrons. The interaction mechanism is schematically illustrated in (figure 2.1).
Figure 2.1: Diagram illustrating the photoelectric effect [8].
The interaction probability of the photoelectric effect has a complex dependence on themedium and electron energy, In principle, The energy dependence of the cross sectionis assumed to be = 1/E3 at low photon energies and gradually changes into 1/E at highenergies. Regarding atomic number dependence, the cross section is assumed to be Zn
where n ranges from 4 to 5 [20]. Figure 2.2 displays the atomic cross section for thephotoelectric effect against incident photon energy for various absorbers ranging fromHydrogen to lead. The sharp spikes in all curves (except for H and C) indicate the absorp-tion edges which correspond to the electron binding energies of the K-, L- and M- shellsof the absorbing material, showing that an incident photon with energy identical to one ofthe absorption edge energies will experience a sudden increase in the photo absorption.Accordingly, the maximum probability of a photoelectric effect occurs when low energyphoton interacts with a high Z material. In radiotherapy, the importance of the photo-electric effect appears in transmission imaging for X-ray CT. For instance, bone (high Z)absorbs more photons than soft tissue (low Z) resulting in image contrast.
2.1.1.2 Compton effect
In Compton effect, the incident photon collides inelastically with a free or loosely boundelectron. A fraction of the photon energy is transferred to electron kinetic energy whereasthe rest is preserved in the scattering photon (see figure 2.3). Practically, in Comptoneffect, the incident photon has a much larger energy than the electron binding energy andcan assumably interact with a free electron, since it satisfies the energy and momentumconservation principle. Accordingly, The scattered photon energy Es as a function of theincident photon energy Ei and the scattering angle θ is calculated by:
Es =Ei
1 +Eimec2
(1− cos θ)(2.1)
12

2.1. INTERACTION OF RADIATION WITH MATTER
Figure 2.2: Photoelectric atomic cross section against photon energy hν for various absorbers.Energies of different absorption edges are also indicated [20].
where me is electron rest mass and c is the speed of light. For the recoil electron, thesum of its kinetic energy Ek
e can be obtained depending on the conservation principle andequation (2.1) as follows:
Eke = Ei − Es = Ei
Eimec2
(1− cos θ)
1 +Eimec2
(1− cos θ)
(2.2)
In the energy region not affected by electron binding effects, the atomic cross sectionfor Compton scattering aσc is determined from the electronic cross section eσc, whichis calculated by integrating the differential electronic cross section per unit solid angle,using the relationship:
aσc = Z eσc (2.3)
As the eσc is given for free electrons and consequently independent of Z, the atomic crosssection aσc is linearly dependent on Z. Compton mass attenuation coefficient σc/ρ iscalculated from the aσc as follows:
σc/ρ =NA
A aσc (2.4)
where NA is Avogadro’s number and A is the mass number.By using equation (2.3) in equation (2.3), σc/ρ is given by:
13

CHAPTER 2. FUNDAMENTALS OF RADIATION THERAPY AND DOSIMETRY
Table 2.1: Compton atomic cross sections aσc and mass attenuation coefficients σc/ρ at photonenergy hν of 1 MeV for various absorbers [20].
Element Symbol Z A aσc(b/atom)
σ/ρ(cm2/g)
Hydrogen H 1 1.01 0.21 0.1261Carbon C 6 12.01 1.27 0.0636
Aluminum Al 13 26.98 2.75 0.0613Copper Cu 29 63.54 6.12 0.0580Lead Pb 82 207.20 17.32 0.0500
σc/ρ =ZNA
A eσc (2.5)
Since Z/A = 0.5 for low Z elements (except hydrogen) while increasing Z graduallydecreases Z/A to ≈ 0.4 for very high Z elements, the mass attenuation coefficient isroughly independent of Z and proportional to the electron density (see table 2.1). Forinstance, the Compton attenuation for constant energy per g/cm2 for bone is nearly thesame as that for soft tissue. Yet, 1 cm of bone would attenuate equivalent to 1.53 cm ofthe soft tissue. This low difference in σc/ρ is a disadvantage in transmission imaging butan advantage in therapy as the contribution to dose delivery of Compton scattering at thesame energy results uniform within different tissues.
Figure 2.3: Illustration of Compton scattering [8].
2.1.1.3 Pair production
When a photon with energy above 1.022 MeV interacts with the electromagnetic fieldaround the nucleus, its energy may be converted into electron and positron. Interestingly,this photon to mass conversion process is an example of the famous Einstein’s theoryE = mc2. The photon energy exceeding the 1.022 MeV threshold is shared between theparticles as kinetic energy. The positron subsequently annihilates by combining with one
14

2.1. INTERACTION OF RADIATION WITH MATTER
electron of the medium close to its generation point, producing two annihilation photonseach with E = 0.511 MeV (fig 2.4). The annihilation is a reverse process of convertingmass to energy. The probability of pair production increases proportionally with Z2 andincreases as the logarithm of the incident photon energy above the threshold energy withdominance over Compton interactions at energies above 10 MeV. Hence, the impact ofthis interaction is minimal in therapy where the typical maximum energy is 6 MeV. In ad-dition to pair production, a much less probable interaction could occur when the incidentphoton has energy equal or higher than 2.044 MeV. In a process referred to as electronicpair production or triplet production, the incident photon interacts with an orbital elec-tron of the absorber resulting in the photon to disappear and three light charged particlesare released: the original orbital electron and the electron-positron pair produced in theinteraction.
Figure 2.4: Diagram illustrating the pair production in the nuclear Coulomb field [8].
2.1.1.4 Attenuation
Overall, photon attenuation when passing through matter is an exponential process as afunction of path length. Attenuation occurs either by absorption (e.g. photoelectric effect)or scattering (e.g. Compton scattering). The attenuation is defined as the probability ofoccurrence that the photon is removed from the beam per unit path length. The numberof transmitted photons I is described by Beer-Lambert’s law as follows:
I(x) = I0e−µx (2.6)
Where I0 is the initial intensity (i.e. number of photons before attenuation), and x is thepath length of the absorbing material. µ is the linear attenuation coefficient in cm−1.
2.1.2 Interactions of charged particle radiation with matter
Charged particles are surrounded by the Coulomb electric field. When traversing an ab-sorber, the particle may interact with the Coulomb electric field of the orbital electronsor the atom nucleus resulting in elastic or inelastic scattering. The charged particle may
15

CHAPTER 2. FUNDAMENTALS OF RADIATION THERAPY AND DOSIMETRY
transfer some of its kinetic energy to the medium (collision loss) or to photons (radiationloss). However, the interaction type is depending on the mass of the charged particle andthe trajectory with respect to the absorber atom. The charged particles of interest in clini-cal application can be either light (electrons and positrons) or heavy particles (protons andhelium, carbon and oxygen ions). General aspects of their interactions with the mediumare listed below.
2.1.2.1 Light charged particles
Light charged particles have a considerably smaller mass compared to the mass of atoms.As for electrons with high energy, they experience radiative losses within Coulomb fieldof nucleus and to less extent electrons. Low energetic electrons mainly experience ion-ization/excitation with other electrons besides some Coulomb scattering. In the radiativelosses, the electron may undergo a significant loss of its energy accompanied by an emis-sion of X-ray photons. This type of interaction is called bremsstrahlung and has themajor significance in X-ray generation in X-ray tubes and linacs, as discussed in section2.3. Furthermore, the electrons may collide with an orbital electron causing electron ejec-tion (atom ionization) or electron shell elevation (atom excitation). Overall, the electronsexperience multiple scattering when traversing through a media. The radiative yield, de-fined as the average fraction of its energy that a beta particle radiates as bremsstrahlungin slowing down completely, increases directly with the absorber atomic number Z andthe kinetic energy of electrons. In X-ray targets for imaging applications (energy around100 keV), the radiation yield is of the order of 1%, whereas for radiation therapy (energyin the range of 6-25 MeV) the radiation yield amounts to 10–20%.
As for positrons, they travel a small distance through the media and interact with sur-rounded electrons through positron-electron annihilation mostly producing two 511 keVphotons.
2.1.2.2 Heavy charged particles
As ions have a mass considerably larger than electrons, they can be categorized as heavyparticles. Examples include protons, helium, carbon and oxygen ions. These particlesmay undergo elastic and inelastic interactions with electron or nuclei similar to light par-ticles but different in magnitude. As for heavy particles, they mostly interact inelasticallywith electrons and do not change direction considerably when passing through a mediumdue to their large masses. The heavy particles lose energy and slow down by ionizing orexciting the orbital electrons. The slow traveling heavy particle has more probability ofinelastic interaction with Coulomb field of the nucleus. The rate of energy deposition perunit path length is proportional to the square of the particle charge and inversely propor-tional to the square of its velocity, according to the well known Bethe-Bloch formula [20].That is the physical foundation of the Bragg peak, as maximal energy deposition close tothe range of the ion beam, and its use in particle external radiation therapy.
16

2.2. RADIATION DETECTOR PROPERTIES
2.2 Radiation detector properties
The primary function of radiation detection systems is to measure, either directly or indi-rectly, the radiation quantity. Their basic principle is relying on the interaction of radia-tion with the detector material. For detectors relying on ionization measurements, radia-tion quantity is defined by the number of the charge carriers, either electron-ion pairs orelectron-hole pairs, created by the ionization process in the active region of the detectorvolume. The average energy required to generate one electron-ion or electron-hole pairis approximately constant (W ) with energy of the radiation and varies in dependence onthe detector type. For instance, W value ranges from 1 to 5 eV for semiconductor de-tectors and ∼30 eV for gas detectors [21]. Consequently, the total number of the createdelectron-ion or electron-hole pairs is proportional to the deposited radiation energy. Ac-cordingly, the signal measured by the detector may be converted to absorbed dose withspecial calibration and correction factors. As a radiation dosimeter, the detector must beprovided with adequate accuracy and precision, linearity with respect to the dosimetricquantity, dose rate independence and the desired spatial resolution. Unfortunately, thereis no single dosimeter that can satisfy all these characteristics. Therefore, the choice of theused dosimeter is highly dependent on the measurement purpose and requirements. In thissection, an overview of the different types of dosimeters used in conventional radiationtherapy is presented with particular focus on its advantages and disadvantages.
2.2.1 Ionization Chambers
The gold standard in accuracy and precision for radiotherapy dosimetry is the air filledionization chamber (IC). An ionization chamber is a gas-filled cavity having two parallelcollecting electrodes or one central electrode surrounded by a conductive outer wall. Thewall has different density but the same effective atomic number of the air to ensure similarradiation interaction mechanisms to tissue. Although in principle the charge measured byan air filled ionization chamber should be directly proportional to the adsorbed dose inwater the linearity is actually very sensitive to changes in temperature, pressure, humidityand the applied voltage. As suggested by the IAEA in their code of practice and Ameri-can Association of Physicists in Medicine (AAPM) [22] [23], a few corrections must beconsidered. For example, calibrations are applied according to the following equation:
DQw = MkQN
60CoD,w (2.7)
whereDQw is the absorbed dose in water for a certain “beam quality”Q, kQ is a conversion
factor specific for the chamber and the beam quality and N60CoD,w is the absorbed dose to
water calibration factor for the reference beam quality of 60Co while M is the correctedcharge measured by the ionization chamber through an electrometer and given by:
M = PionPTPPpolPelecMraw (2.8)
17

CHAPTER 2. FUNDAMENTALS OF RADIATION THERAPY AND DOSIMETRY
where Pion corrects incomplete ion collection efficiency, PTP is the temperature–pressurecorrection which corrects the reading to the standard environmental conditions for whichthe ion chamber’s calibration factor applies, Ppol corrects for any polarity effects, Pelectakes into account the electrometer’s calibration factor if the electrometer and ion chamberare calibrated separately and Mraw is the raw ion chamber reading in Coulombs C.
Ionization chambers come in various shapes and sizes; the most widely used design is thecylindrical “thimble” chamber due to its stability, accuracy and relative ease of use in clin-ical environment. Figure (2.5), schematically illustrates the design of a typical cylindricalchamber (i.e. Farmer chamber). However, when measurements of strong radiation fieldgradients are required, Farmer chambers do not represent the elective choice due to largeeffective volume (of about 0.60 cm3) and low spatial resolution. Thus, different chambermodels with smaller sizes are used in this case.Different from cylindrical chambers, the parallel plate ionization chamber has a flat plane(toward the radiation source) making the point of measurement at the front surface of thecavity. The parallel plate ionization chambers also have a fundamental role in radiother-apy as they represent the monitoring systems of the linear accelerators (see section 2.3).
Figure 2.5: Basic design of a cylindrical Farmer graphite/aluminum chamber. Nominal air vol-ume, 0.6 mL [8].
2.2.2 Diode Detectors
Diode detectors consist of semiconductor silicon crystal doped with different impuritieson the two sides. The N-type side is the electron rich region while the P-type side isthe hole rich region. Applying voltage upon these two sides creates a depletion regionwhich may act as the air cavity of ionization chambers. The ionizing radiation generateselectrons (free charge carriers) and holes when passing through the depletion region. Theelectrons move towards the P-type region and create an electric current that can be mea-sured with high precision. The average ionization energy needed to form an electron-holepair in silicon is around 3 eV whereas the ionization energy for ICs is about 30 eV. Thisfeature in combination with the crystal density, about 1800 times denser than air, leads to
18

2.2. RADIATION DETECTOR PROPERTIES
a relative efficiency per unit of volume four orders of magnitude larger than ICs. Thanksto the relatively small size of these detectors, the construction of high spatial resolutiondosimeter is enabled. However, these detectors exhibit angular dependence. Thus, thedetector orientation during measurements has to match the calibration orientation. Fur-thermore, the diodes are made of a non-tissue equivalent material and due to that, thesedetectors are highly energy dependent. These drawbacks make the diodes suitable forhigh resolution relative dosimetry, but not for absolute dosimetry. The calibration shouldbe as a function of the beam energy with specific correction factors for field size, physi-cal attenuators, projection angle, source to surface distance and temperature. The diodesare commercially available in forms of single diodes, 2D array, and 3D array (see 2.6).Diodes are used for routine QA programs and even dose measurement during treatment(in vivo dosimetry).
Figure 2.6: Sun Nuclear R© diodes in different forms: (a) single, (b) 2D array and (c) 3D array.
2.2.3 Diamond Detectors
The diamond detectors are classified as semiconductor detectors made of diamonds syn-thetically produced in laboratory through the process of Chemical Vapor Deposition(CVD). Due to a relatively large ionization energy of 5.54 eV compared to semicon-ductor silicon crystal, the free charge carriers are less and hence, diamond detectors offerhigher resistivity and correspondingly lower leakage currents with respect to diode detec-tors. Furthermore, the incident radiation interacts with the active region of the detectorcreating electron-hole pairs without being depleted. A current is generated and measuredusing an electrical field across the detector contacts. The signal is then linearly ampli-fied, thus making it proportional to the induced charge. Commercially, these detectorsare manufactured with a very small sensitive volume in the order of a few mm3 with highsensitivity, resistance to radiation damage and encapsulated in a waterproof isolator (see2.7).Diamond detectors are tissue equivalent, have no energy dependence, have small sensi-tive volume (and thus, high spatial resolution) and have no strong angular dependency.This gives the diamond detectors the merits to be used in radiotherapy clinics as an abso-
19

CHAPTER 2. FUNDAMENTALS OF RADIATION THERAPY AND DOSIMETRY
lute dosimeter for regular measurements and exclusively for high dose gradient and smallfields. However, diamond detectors have a relatively high cost due to the scarcity of highquality material making their use in common practice limited [24].
Figure 2.7: (a) Sketch of a diamond based detector [25]. (b) PTW R© micro-diamond detector.
2.2.4 Films
Films could serve in diagnostic radiology, radiation therapy, and radiation protection. Forfilms dosimetry, radiographic or radiochromic films can be used. The former type oncewas the cornerstone of detection systems in transmission imaging and was used also inrelative dosimetry. However, nowadays, it is replaced by digital detectors for imagingpurposes and radiochromic films for dosi3metry. Radiochromic films are colorless filmswith tissue equivalent composition. The commonly used type is the GafChromic film withactive layer of a thickness = 30 µm [26] (figure 2.8). When ionizing radiation interactswith the active layer, the dye of the film polymerizes and develops a different color. Alaser scanner is used to produce a (Red, Green, Blue) colored image out of the irradiatedfilm. The degree of coloring in the each channel is expressed in optical density (OD) anddefined as:
netOD = ODirradiated −ODunirradiated = −log10PV Rirradiated/PV Runirradiated (2.9)
where (PV R) is the raw pixel value typically from the correspondent color channel. Therelationship between the (OD) and the dose (D) is expressed by:
D = A0 × netOD + A1 × netODA2 (2.10)
where Ai (i = 0...2) are the fitting parameters. The calibrated radiochromic films per-form relative or absolute dosimetry with sub-millimeter spatial resolution and accuracy
20

2.2. RADIATION DETECTOR PROPERTIES
in dose determination ±3% with even better results when using a more complex triplechannel [26]. Although the self-developing radiochromic films are easier to use than theradiographic films (e.g. no need for dark room, film cassettes or film chemical process-ing), radiochromic films are still categorized as passive dosimeters and could not providea real-time measurement. However, these films are used in radiotherapy clinics in IM-RT/VMAT pre-treatment QA programs due to their superior spatial resolution over otherdosimeters.
Figure 2.8: (a) Picture of cutted GafChromic films irradiated with different doses. (b) Scannedimages of correspondent films. The images represent the pixel values in the red channel.
2.2.5 Thermoluminescent detectors
Thermoluminescent detectors (TLD) used in medical applications is almost composite oftissue equivalent crystalline materials (e.g. lithium fluoride doped with magnesium andtitanium, LiF: Mg, Ti). When ionizing radiation interacts with the crystal lattice, orbitalelectrons are excited to a higher state, but instead of subsequently relaxing to the groundstate, they remain trapped in the so-called “electron trap” made by the lattice impurities(usually magnesium or titanium). The electron cannot escape the trap at room temperatureand therefore, the charge is stored till the entrapment process of heating the crystal isapplied. The electrons lose the excitation energy as visible light, which is converted toelectrical current by a photomultiplier and subsequently measured. The measured signalis then calibrated to dose. TLD is meant for measuring a cumulative dose. However,the crystal reaches the saturation once all traps are occupied by electrons. Though, theheating process clears electrons traps and the TLD is then annealed and may be reusedfor dosimetry.TLDs are commercially available in various forms (e.g. powder, chips, rods and ribbons).Due to their small sizes and no need of connecting wires, they are used in radiotherapyeither in routine QA procedure, in-vivo dosimetry or implanted in phantoms. TLDs arealso used as personal dosimeters for radiation workers.
21

CHAPTER 2. FUNDAMENTALS OF RADIATION THERAPY AND DOSIMETRY
Figure 2.9: (a) A simplified energy-level diagram illustrating the thermoluminescence process[8]. (b) Different shapes of TLDs.
2.2.6 Polymer Gels
Polymer gels are composed of radiosensitive chemicals dissolved in gelatin. In brief,when irradiated, the chemicals polymerize forming free radicals that can be quantifiedby measuring the changes of nuclear magnetic resonance spin-relaxation time using anMRI scanner, or estimating the density changes using typically optical or X-ray CT orultrasound. Polymer gels can be molded to any desired shape or form, and since the gelis approximately tissue equivalent, they can be used as phantoms (figure 2.10). Conse-quently, gel dosimetry is the only 3D dosimetry system, providing a 3D dose distributionwith high spatial resolution.
Polymer gel dosimetry proved its usefulness for dose verification in IMRT/VMAT [27].However, similar to film dosimetry, polymer gels are designed for single measurements,and as passive dosimetry systems, they require long processing time and sophisticatedreadout systems.
2.3 Clinical linac
Linac is a device that accelerates charged particles (electrons) using high-frequency elec-tromagnetic waves in a linear tube. The medical linac accelerates electrons to a nominalenergy that ranges from 6 to 25 MeV. Accelerated electrons can be used to treat superfi-cial tumors or to strike a target to produce X-rays for treating deep seated tumors. Themodern linac components are illustrated in figure 2.11. The working principle of the sys-tem is described in the following. First, the electrons are generated in the electron gun bythermoionic emissions from a hot tungsten filament (cathode) and guided by the anodetowards the waveguide tube. In the waveguide tube, high pulse microwaves produced bya magnetron or a klystron accelerate the electrons to velocity comparable to the speed oflight. The strong magnetic field inside the tube focuses the electrons in a pencil beam
22

2.3. CLINICAL LINAC
Figure 2.10: (a) Polymer gel dosimeter irradiated according to 3D-CRT techniques. (b) The upperleft picture illustrates the irradiation effect (white region) on the dosimeter. The rest; differentviews of the dose distribution obtained by use of MRI scanner [18].
with a diameter of about 2 mm. The pencil beam is bent across the bending magnet toperpendicularly strike a high Z target. Bremsstrahlung X-rays are produced by the inter-action between the electron beam and the target with a spectrum of energies from 0 upto the nominal (maximal) energy of the incident electrons. Due to the high energy of theelectrons, the X-ray beam produced in the target is mainly peaked forward in the beamdirection. The process of shaping the photon beam starts in a component of the linaccalled head. Although the compositions and elements of the linac head are specific tomanufacturer, the general scheme mainly consists of a flatting filter, monitoring chambersand three collimators (i.e. primary, secondary and the multi-leaf collimator (MLC)). Thegenerated photons are collimated by the primary collimator and their intensity is madefairly uniform by the flattening filter. The beam is controlled and monitored by a monitorchamber (parallel plate ionization chamber) located immediately after the flattening filter.The secondary collimator placed after the flattening filter is movable and used to definethe rectangular field shape with two upper and two lower independent jaws. In mod-ern linacs this function is embedded in the MLC and the four jaws are replaced by twoguardian jaws (diaphragm) placed downstream the MLC. The MLC is an array of highZ leaves that can be individually controlled to create regular and irregular beam shapes.Modern linacs incorporate up to 160 leaves with 5 mm width creating fields up to 40 ×40 cm2 (figure 2.12). Dose delivery techniques based on MLC (e.g. VMAT) set techno-logical challenges requiring high precision of leaf positions with high-speed movementof the MLC. In addition, to modulate the intensity of the beam, the MLC and the rigidlyattached diaphragm can rotate around a vertical axis and the linac head is mounted ona gantry that can rotate around the patient in the longitudinal axis. Additionally, leak-age of radiation through the MLCs (known as intraleaf and interleaf transmission) addsextra dose to the patient. In order to minimize this effect, leaves are designed to havestair-step leaf-sides, and adjacent leaves interlock in a ‘tongue-and-groove’ arrangement.Even more, the leaves edges in the beam direction contribute to the dose distribution and
23

CHAPTER 2. FUNDAMENTALS OF RADIATION THERAPY AND DOSIMETRY
field penumbra. The leaf thickness along the beam direction ranges from 6 cm to 9 cm,depending on the type of accelerator [7].
Figure 2.11: Schematic diagram of a medical linear accelerator [20].
2.4 Quantification and Measurement of Dose
Quantification of radiation deposition in the human body is essential for any medical useof radiation. All radiation dosimetry systems are designed to represent the energy deposi-tion to the human body either by directly or indirectly ionizing radiations. In the medicalfield, dosimeters are used for diagnosis, treatment or protection of patients, workers, andthe public. The goal in transmission imaging is to obtain the maximal image quality withthe lowest radiation dose. In radiotherapy instead, the best compromise between the ther-apeutic dose to the tumor and the unwanted dose to normal tissue is searched. In radiationprotection, the radiation exposure is minimized according to the principle of As LowAs Reasonably Achievable (ALARA) for all the involved people. Depending on the spe-cific applications, several quantities and units have been introduced to describe dosimetricquantities. The dosimetric quantities of interest for the thesis work are described.
24

2.4. QUANTIFICATION AND MEASUREMENT OF DOSE
Figure 2.12: (a) A schematic side and front views of a single leaf of Agility R© MLC [28]. (b)Beam’s eye view of a field modulated using MLC [29]. (c) and (d) Different pictures of anAgility R© MLC illustrating 160-leaf arrangement.
25

CHAPTER 2. FUNDAMENTALS OF RADIATION THERAPY AND DOSIMETRY
2.4.1 Photon fluence and energy fluence
The particle fluence (Φ) is defined as the number of particles (dN ) incident on a sphereof cross-sectional area (dA):
Φ =dN
dA(2.11)
The International System of Units (SI) unit of particle fluence is m−2. The energy fluence(Ψ) is defined as the radiant energy (dE) incident on a sphere of cross-sectional area (dA):
Ψ =dE
dA(2.12)
The SI unit of energy fluence is J/m2. The relation between energy fluence and photonfluence for a monoenergetic beam is given by:
Ψ =dN
dAE = ΦE (2.13)
2.4.2 Exposure
The exposure (X) is the absolute value of the total charge of the ions (dQ) of one signproduced in air when all the electrons and positrons liberated by photons in air of mass(dm) are completely stopped in air.
X =dQ
dm(2.14)
The unit of the exposure is typically roentgen (R) which is equivalent to a charge of2.58× 10−4 C produced per kilogram of air in SI unit.
2.4.3 Kerma
The Kerma (K) is an acronym for kinetic energy released in the medium and it is definedas the as the expectation value of the energy transferred (dEtr) form the indirectly ionizingradiation (photons or neutrons) to charged particles per unit of mass of the absorber (dm):
K =dEtrdm
(2.15)
The SI unit of Kerma is (Gy) which equals 1 Joule of energy transferred per kilogram ofa medium.In reference to energy transfer method, Kerma can be divided into two components: thecollision kerma Kcol and the radiative kerma Krad. Kcol refers to the energy transfer re-sulted from Coulomb force interactions with atomic electrons. Thus, Kcol leads to the
26

2.4. QUANTIFICATION AND MEASUREMENT OF DOSE
production of electrons that dissipate their energy as ionization in or near the electrontracks in the medium. Krad refers to the energy transfer resulted from radiative interac-tions (bremsstrahlung and less-likely electron-positron annihilation). Thus, Krad leadsto the production of radiative photons that transfer a fraction of the energy out of themedium.
2.4.4 Dose
The Dose (D) is defined as the expectation value of the absorbed energy (dε) per unit ofmass of a medium (dm). Unlike Kerma, dose applies to the expectation value of bothindirectly and directly ionizing radiations:
D =dε
dm(2.16)
Similar to Kerma, the SI unit of the absorbed dose is (Gy).
2.4.5 Charged Particle Equilibrium
The energy transfer from the photon beam to the charged particles (Kerma) at a partic-ular location does not lead in principle to a dose deposition at the same location. Thesecondary electrons move away according to their range in any direction and can escapethe location of interest. Thus, given a certain photon fluence, the Kerma is easily esti-mated but not the dose. In a homogeneous medium, Kerma is maximal at the entranceof the medium, while the absorbed dose initially builds up as a function of depth until amaximum dose is reached (Zmax) (figure 2.13). Where the two curves meet, the chargedparticle equilibrium (CPE) is reached. Then, at depths greater than the maximum depth(Zmax), there is a transient charged particle equilibrium (TCPE) in which bothD andKcol
decreases at the same rate. Thus, the absorbed doseD to a medium can be calculated fromthe energy fluence (Ψ) following the following equation:
D = βΨ(µen/ρ) (2.17)
where (µen/ρ) is the mean mass energy absorption coefficient and β is the quotient of Dat a given point and Kcol at the same point. β is < 1 at the build-up region, = 1 at the CPEpoint and > 1 at the TCPE region.
27

CHAPTER 2. FUNDAMENTALS OF RADIATION THERAPY AND DOSIMETRY
Figure 2.13: Kerma Kcol and absorbed dose D as a function of depth in a homogeneous mediumirradiated by high energy photon beam for (a) the hypothetical case of no photon attenuation andfor (b) realistic case adapted from [15].
28

2.5. DOSIMETRY OF PHOTON BEAMS
2.5 Dosimetry of Photon Beams
2.5.1 Characteristics of Photon Beams
In radiation therapy, photon beams generated by the linac are polyenergetic and have awide distribution in energy that spans from 0 eV to the nominal energy of the acceleratedelectrons. The shape of the spectra depends on the shape of the electron beam energy,the target (photon source) thickness, the fixed collimators (used for shielding), flatteningfilter and movable collimators (jaws, MLC, diaphragm ...). Particularly, the movablecollimators (i.e. jaws, MLC and diaphragm) are those determining the field shape thatchanges the energy distribution of the machine specific reference field to variable standardfields. Different spectra for different energies generated by Monte Carlo simulation [30]are illustrated in 2.14
Figure 2.14: Comparison of MC calculated spectra for different commercial linacs [30].
The energy distribution is the most exhaustive description of the photon beam qualitybut difficult to measure. Typically, the beam quality is indirectly assessed by measuringthe percentage dose as a function of depth and lateral dose profile in a water phantom.This assessment is incomplete, but sufficient for operation of treatment routine. However,recently, some clinics uses a comprehensive characterization of beam quality in order toimprove the dose calculation accuracy.
29

CHAPTER 2. FUNDAMENTALS OF RADIATION THERAPY AND DOSIMETRY
2.5.2 Dosimetric measurements used to characterize the photonbeam
The attenuation of a photon beam traversing air is negligible and the intensity due to di-vergence can be determined using the inverse square law. When traversing media withvarying density, on the other hand, the photon beam undergoes attenuations which aremore complicated to calculate. Therefore, various dosimetric quantities and methodolo-gies have been introduced to facilitate dose calculation in radiation therapy situations.The dosimetric measurement is usually performed in a water phantom due to its similarabsorption and scattering properties of muscle and other soft tissues. For practical rea-sons, the dosimeters and also preferred to be made of water or tissue equivalent materialin terms of response to Compton effect (the most predominant interactions in photon ther-apy energy range). Hence, the given material must have the same electron density as thatof water. With reference to the dosimetry of photon beams in water, additional dosimetricquantities of interest to the thesis objectives are described below.
Depth dose distributionAs the photon beam propagates through a water medium, the dose deposition varies perdepth in dependence of the beam energy, depth, and distance from the source. Therefore,measurements of the central axis dose distribution for different field sizes provide a goodbeam characterization method. Percent Depth Dose (PDD) is a quantity used for beamcharacterization and obtained by measuring the absorbed dose at any depth Z divided bythe absorbed dose at a reference depth Zmax along the central axis of the beam, thus:
PDD =Z
Zmax× 100% (2.18)
In practice, PDD is measured for different nominal energies and different rectangular fieldsizes during linac commissioning. The commissioning data are then used as a benchmarkfor future QA measurements.
Linac outputThe linac output is defined as the variation of the absorbed dose at Zmax as a function ofthe field size in water. Multiple factors were shown to affect the output factor. Namely, theScattered photon from the linac head structure, backscattered photons, and electrons intothe monitor chamber and, at very small filed sizes, the effect of X-ray source obscuredby the collimator [31]. Accordingly, the output is considerably differed from one type oflinac to another. As a necessary procedure in linac commissioning and periodic QA, theoutput factor of each representative field size is measured for each available energy. Themeasured output is referred to a selected standard field size (commonly the 10 × 10 cm2
field) at the distance from the source to the axis of gantry rotation known as the iso-center.
Field size and shape play a significant role in determining the PDD curve. In general,as the field size increases, the contribution of scattered photons to the absorbed doseincrements (figure 2.15). On the other hand, the variation of energy distribution inside
30

2.5. DOSIMETRY OF PHOTON BEAMS
a medium influences the responses of detectors especially the highly energy-dependentones. Hence, accurate estimation of the output is required in order to accurately correctfor energy over or under response of detectors for different squared field sizes.
Figure 2.15: Scatter radiation increases with field size.
However, in clinical practice, the majority of the treatments fields are irregularly shaped(not squared). in such scenarios, accurate determination of the output factor is challeng-ing. Thus, a rule-of-thumb method of equivalent squared fields to different field dimen-sions and shapes has been developed and proved to be useful for quick calculation of theequivalent field parameters [32].
Beam lateral profiles and off-Axis ratio (OAR)The off-axis-ratio (OAR) between the dose at an off-axis point, either in the cross-line (xdirection) and in-line (y direction) directions, and the dose on the central beam axis forany given depth provides a 2D information on the dose distribution inside the phantom.This measurement is performed in QA programs to assess the beam flatness and the beamsymmetry, which are relevant also for dose calculations. Beam lateral profiles consist ofthree regions: central, penumbra and umbra. The central region represents the portion ofthe beam including doses over 80% of the maximum dose. The penumbra represents thefall-off area at the beam edges. Specifically, the penumbra region is the part of the dosethat lies within 20-80% (or sometimes 10-90%) of the maximum dose. The size of thepenumbra is geometrically determined by the focal spot of the photon beam (source shapeand size) (figure 2.16a), the field size, the MLC shape (figure 2.16b) and the lateral elec-tronic disequilibrium due to Compton scattering. The umbra is where the doses are belowthe 20% (10%) of the maximum dose. These low doses result from radiation transmittedthrough collimators and scattered radiation from the linac head shielding.
2.5.3 Dosimetry of photon beams in a patient
Unfortunately, dose calculation in water does not apply to the patient since the patienttissues are not perfectly water equivalent and the patient surface is not entirely flat. The
31

CHAPTER 2. FUNDAMENTALS OF RADIATION THERAPY AND DOSIMETRY
Figure 2.16: (a) The penumbra appears as blurring of the field edge (yellow) and it is directlyproportional to the physical size of the source. (b) The penumbra depends also on the MLC tipshape [33].
beam traverses inhomogeneities so that high density tissues (e.g. bone) increase the at-tenuation whereas low density tissues (e.g. lung) decrease the attenuation. To account forthis, complex models are needed thus making dose calculation in inhomogeneous mediaa complicated task. Therefore, water dosimetry is adequate to characterize the radiationbeam but not sufficient to calculate the deposited dose into a patient.
2.6 Treatment planning systems and dose calculation
Current radiation therapy techniques require sophisticated systems to encompass and con-trol the entire clinical work-flow of the treatment. The Treatment Planning System (TPS)represents the heart of that systems and the first key to ensure an accurate dose deliv-ery. In principle, the TPS is responsible for importing the patient CT and PET or MRIimages. The tumor and organs at risk delineation and contouring occur within the TPS.According to the tumor location, size and organ at risk constraints, the oncologists alongwith the physicists (dosimetrists in a few clinics) define the setting parameters relevantto the chosen radiation therapy techniques, for example, the projection angles for IM-RT/VMAT. The settings are given as input to the TPS by the operators. In accordanceto the setting parameters, the treatment parameters (including leaf sequencing for fluencemodulation in IMRT/VMAT) that optimize the planned therapeutic dose are calculatedby the TPS. The treatment parameters are determined by “inverse planning”. Briefly, theplanner calculates the 3D dose distribution relying on a virtual therapy simulation hav-ing as input the patient image provided with the contours of the target volume and the
32

2.6. TREATMENT PLANNING SYSTEMS AND DOSE CALCULATION
organs at risk as well as the planning aims (dose prescription, ...). After this calculation, aquantitative assessment of the dose distribution for a set of control points are evaluated tocheck if dosimetric constraints are met. If not, the TPS iteratively optimizes the treatmentparameters by changing them until a clinically acceptable dose is achieved. Figure 2.17illustrates schematically the process of radiotherapy planning cycle.
Image acquisitionDefinition of tumour,
target volume andorgans at risk
Dose calculationEvaluation of
dose distributionPatient treatmentDefinition of treatment parameters
Virtual therapy simulation
Optimization
Figure 2.17: Radiotherapy planning cycle [7].
As the dose calculation and evaluation are of concern for this thesis, more detailed infor-mation about those processes is in the following.
2.6.1 Approaches to dose calculation
The calculation of 3D dose distributions within the patient is a cornerstone procedure inradiotherapy. The calculation has to satisfy speed and accuracy requirements for clinicalimplementation. Originally, doses have been calculated using correction factors appliedto dose calculation in water to account for irregularities in surface contour and inhomo-geneities in tissue. With the increasing complexity of the treatments, this method wasreplaced by more sophisticated model-based or Monte Carlo dose calculation engines. Abrief overview of the predominant dose calculation algorithms used currently in radio-therapy clinics is outlined.
2.6.1.1 Model-based dose calculation engines
In general, most of the model-based methods use convolution kernels that have been pre-computed using Monte Carlo simulations. The algorithms differ in modeling method-ologies and the magnitude of approximations used to speed up the calculation. Differentcalculation methods are described:
Pencil beam (PB)
PB is a model-based dose calculation method based on beamlets (pencil beams) gener-ated from predefined energy fluences. The photon beam is therefore assumed as a linearcombination of beamlets. The interaction point of the beamlet is assumed to lay on itscentral axis and the dose deposition in water is defined for each beamlet which is derivedfrom the measured beam data. Here, inhomogeneities are accounted for by scaling the
33

CHAPTER 2. FUNDAMENTALS OF RADIATION THERAPY AND DOSIMETRY
path length of the dose kernel in water to any tissue according to the relative electrondensity differences along the beamlet penetration depth. The scaled path length is calledradiological length and it is used to calculate the Total Energy Release per unit MAss(TERMA) along the central axis of the PB. TERMA can be calculated using the formula:
TERMA = (µtotal/ρ)Ψpr (2.19)
where (µtotal/ρ) is the mass attenuation coefficient and Ψpr is the primary photon energyfluence. Consequently, the dose D~r is the product of TERMA T~r and the dose kernelA(~r-~r ′), which is the dose matrix generated per unit terma, integrated (i.e. equivalent toa convolution) over a volume:
D~r =
∫T~r ′A(~r − ~r ′
)d3~r′
(2.20)
Collapsed ConeSimilar to the PB method, the collapsed cone method uses a convolution between TERMAand the dose deposition kernel. However, the kernel is represented analytically and ex-pressed in polar coordinates. The collapsed cone is based on point spread convolutionkernels to be collapsed into a certain number of photon rays of different directions to saveconsiderable calculation time.
Analytical anisotropic algorithm (AAA)The analytical anisotropic algorithm is based on the pencil beam convolution technique.Different from PB, AAA uses separate models for primary photons, scattered photons,and the fundamental secondary electrons. The radiological length in this case is also usedto account for the electron densities in lateral directions. The total doses are obtained bysuperposing the doses from the photon and electron convolutions.
These models have been extensively tested and compared by several scientific groups [34][35] [36] [37] [38].
2.6.1.2 Monte Carlo (MC) dose calculation engines
MC simulation methods are based on computational algorithms that utilizes random sam-pling of physical event probabilities to numerically describe radiation transport. Theprobabilities for any kind of interaction between the particle and the media rely on fun-damental laws of physics or experimentally determined cross sections. The transport ofa primary particle is called history. Hence, the number of projected particles determinesthe accuracy of the MC simulation. It has been estimated that 109 events are requiredto achieve adequate precision of a Monte Carlo simulation for dose calculation in radio-therapy [18]. To achieve the desired accuracy, the MC simulation has to include com-prehensive modeling of the electron beam, linac head, patient anatomy and surroundingobjects. Comprehensive modeling is computationally expensive and may require access
34

2.7. QUANTITATIVE ASSESSMENT OF DOSE DISTRIBUTIONS
to unavailable confidential information from the manufacturer, as a consequence, it doesnot match requirements for clinical routine. The MC dose calculation is the most accuratemethod to determine the dose distribution in inhomogeneous media. Separately, generalpurpose codes such as EGS4/EGSnrc [39], Penelope [40], MCNP [41], and GEANT4[42] have been developed for simulating the transport of electron and photons. As thesecodes have incorporated specialized features, they have been optimized for radiation ther-apy proposes. The optimizations include avoiding the full simulation of the treatmenthead by replacing primary histories with pre-defined phase space or virtual source mod-els [43] [44] [45]. Additionally, these codes are optimized for calculating the dose withinthe patient, relying on tissue compositions mapped from the CT image and using energycut-offs satisfying clinical significance. As a result, the optimization reduces the calcu-lation time down to minutes (instead of hours). Examples of these MC dose calculationengines are Voxel Monte Carlo [46] and Dose Planning Methods (DPM) [47]. Commer-cially, optimized MC dose calculation engines have been recently provided by ELEKTA(Monaco R©), Varian (Eclipse R©), Brain Lab (iPlan R©). A comprehensive comparison be-tween the full Monte Carlo simulation and the optimized one has been published in [48][49].
2.7 Quantitative assessment of dose distributions
Since the advent of IMRT techniques, it has become standard practice to verify the de-livery of IMRT plans using either direct measurement of radiation dose distribution in aphantom [50] [51], or indirect methods that compare the TPS calculation with an indepen-dent computer calculation [52] [53]. Both verification methods require a comparison toolto quantify the difference between the two dose distributions. Such comparison is subjectto several challenges that make the extraction of clinically significant results difficult. Thecomplexity of comparison increases with the dimensionality of distributions being evalu-ated. For instance, simple single points (0D) comparison is conducted by calculating themathematical difference of the reference and the measurement in terms of absolute or rel-ative doses, depending on the situation. The interpretation is straightforward (assumingthe data are well coregistered) and a certain threshold can be used to make the clinicaldecision on accepting or rejecting the result. On the other hand, although the differencebetween corresponding points of one dimensional (1D) dose profiles can be easily cal-culated, the 1D comparison results in problematic interpretation of the differences. Forexample, dose differences could be small in the regions of uniform dose and large in highgradient regions where the alignment of profiles is not perfect. The large difference mayor may not be of clinical significance depending on the location in the patient anatomy.This dilemma prevents the use of a single threshold value to accept of reject the result.Additionally, as the dimensionality of dose distribution increases (2D, 3D, 4D), the in-terpretation of results in the presence of local dose gradients becomes more complex. Tohandle these complications, different approaches have been introduced to qualitativelyand quantitatively compare the dose distributions.
35

CHAPTER 2. FUNDAMENTALS OF RADIATION THERAPY AND DOSIMETRY
2.7.1 Qualitative comparison methods
Visual inspection of the dose distribution is commonly used in clinics [18]. The mainadvantage of this qualitative inspection is the fast identification of the major differencesbetween the dose distributions. In practice, several evaluation software packages viewthe two dose distributions, within the same patient CT, side by side with highlighteddose differences. Other software packages display the dose level contours of the twodistributions within the patient CT on one figure. For both display formats, in additionof failing to catch differences in the order of 3-5%, this comparison method leads tointerpersonal variability in the interpretation [54]. Thus, a quantitative method is requiredto support the safety net for the radiotherapy chain.
2.7.2 Quantitative comparison methods
The quantitative comparison is based on calculating the difference of the dose distributionwith respect to a reference one. Assuming that the two distributions are coregistered,the comparison can include the relationship between dose level and geometry. In thefollowing, a description of the most used methods in modern clinics is presented.
2.7.2.1 Dose Volume Histogram (DVH)
DVH is a representation of dose distribution within a particular volume of interest (VOI)by means of the frequency distribution of variable dose within the volume. DVH canbe defined as differential and cumulative. The differential DVH indicates the volumeof a certain structure that receives the dose corresponding to the bin, ranging from theminimum to the maximum dose. Differential DVH provides information about changesin dose within the considered structure and easily visualizes minimum and maximumdose. A cumulative DVH represents the volume of a certain structure that at least receivesthe dose corresponding to the bin. In other words, cumulative DVH is a plot of dose binsreceiving a dose equal to or greater than the indicated dose as a function of volume (orpercentage volume). The construction of both types of histograms is outlined in figure(2.18)
Generating a DVH for each dose distribution for which underlying structures exist mayhelp the user to evaluate the quality of the plan and when comparing to a measurement,the user may appraise the contribution of the dose differences to the tumor and organsat risk. However, the accuracy of the DVH curves relies on the accuracy of the dosecalculation algorithm, choice of grid spacing, volume delineation limited by the observerbias and imaging resolution [55] [56]. Accordingly, DVHs should always be inspectedin conjunction with graphical representations of the dose distributions [57]. A practicalcomparison of DVH distributions with the aid of 3D viewing of the dose distribution isshown in figure (2.19).
36

2.7. QUANTITATIVE ASSESSMENT OF DOSE DISTRIBUTIONS
Figure 2.18: Illustration of (a) differential DVH and (b) cumulative DVH. Source: Tony Lomax,PSI, CH.
Figure 2.19: Dose distribution of a plan of prostate case showing (a) axial view (b) DVH ofdoses to the prescribed planning dose volume (PTV), bladder, rectum, left (LFH) and right (RFH)femoral head (c) coronal view (d) sagittal view [58].
37

CHAPTER 2. FUNDAMENTALS OF RADIATION THERAPY AND DOSIMETRY
2.7.2.2 Gamma analysis
The gamma evaluation is a tool utilizing the criteria of geometric distance to agreement(DTA) and a percentage dose difference (DD) to calculate a gamma index with respect tothe reference for each pixel/voxel in an image/volume. Gamma evaluation aims at find-ing the shortest Euclidean distance between a given point in the reference dataset and thecompared dataset in terms of DD and DTA. DTA and DD criteria permit small disagree-ments between the doses of varying geometric extent and magnitude with reference todedicated tolerance limits. To calculate the gamma index, a point is taken in the referencedose (RD) and compared to all points in the evaluated dose (ED) distribution in term ofDTA and DD. The point in the ED with the lowest gamma index is considered the bestmatch. The search for the best match is limited in a geometrical region of interest (ROI)around the given point in the RD. The gamma index (γ) for a reference point pr in the RDcan be calculated using the equation:
γ(pr) = min{
√∆d2pr,peDTA2
+∆D2
pr,pe
DD2}∀{pe ∈ υ} (2.21)
Where pe is any point within the search circle or sphere υ of a radius (ROI) in the ED (seefigure 2.20). ∆dpr,pe and Dpr,pe are the geometrical distance and dose difference betweenpoints pr and pe respectively. Pixels (in 2D evaluation) or voxels (in 3D evaluation) with|γ| > 1 fail the comparison for the given criteria [59]. Typical tolerance criteria used inIMRT are DD = 3% and DTA = 3 mm [18]. The overall evaluation of the comparison isusually estimated by the result of the percentage of passing pixels/voxels.
Figure 2.20: Illustration of (a) the circular search region for 2D evaluation and (b) the sphericalsearch region for the 3D evaluation [59].
38

2.8. RATIONALE FOR PATIENT SPECIFIC PRE-TREATMENT QA
2.8 Rationale for patient specific pre-treatment QA
As illustrated in the previous sections, dose delivery becomes more complicated withthe development of technology. Unfortunately, the complexity adds potential sourcesof errors, and hence, end-to-end patient management is prone to uncertainty. Interna-tional and national organizations legislate a series of QA programs to be enforced inradiotherapy clinics. In principle, the primary goal of the overall program is to ensurethe correct diagnosis of cancer, the optimum treatment plan, accurate dose delivery andbest achievable follow-up program. However, the regulations are falling behind the fastdevelopments in imaging and dose delivery technologies due to various reasons. Researchcommunities are working intensively to develop QA tools and methods to accommodatewith new advanced equipments and techniques. The need for more comprehensive QAprograms for the new techniques has been presented in several articles [18] [60] [61]. Inthis thesis, the interest revolves around the pre-treatment QA part of the whole radiationtherapy chain.
The International Atomic Energy Agency (IAEA) and International Commission onRadiological Protection (ICRP) conducted several studies on the mis-administration ofradiation dose and the causes of the inadequacy of the existent QA programs within theclinics of the study [62] [63] [64] [65]. In brief, the causes includes 1) Incorrect data trans-fer from the imaging system to the TPS, then to the record and verify system (or oncol-ogy information system) and finally to the linac. 2) Incorrect IMRT or VMAT treatmentplanning especially in the early days of emerging techniques where the dose calculationaccuracy was an issue of concern. Moreover, inexperienced handling of new software anddelivery techniques could lead to inaccurate optimization process. 3) Mis-calibration ofthe dose delivery unit. Traditional calibration procedures are not incorporating aspectsrelevant to advanced dose delivery techniques (finite sizes of the leaves, dynamic MLC,rotating gantry). 4) Inappropriate usage of the dosimeters. Dosimeters are calibrated tospecific radiation conditions. The calibration is affected by changes in environmentalconditions (such as temperature, pressure ...). Moreover, depending on the goal of themeasurement, the choice of the appropriate dosimeter is required. The wrong choice cancompromise the accuracy of the measurement.
For those reasons mentioned above, medical physics communities agree on the need foradditional components in QA programs [18]. For instance, independent dose calculationengine and dose delivery verification have to be implemented for each patient. The newcomponents have to be compatible with clinical time frame and not add (if not decrease)workload to the personnel. To this end, several approaches have been introduced andtranslated into certified apparatus and software packages specifically designed for thepre-treatment QA.
Most of the treatment planning systems can create a verification plan that suits theadopted dosimeter and phantom. A region of interest within the phantom that matches
39

CHAPTER 2. FUNDAMENTALS OF RADIATION THERAPY AND DOSIMETRY
the dosimeter is defined. The dose calculated in the verification plan within the region ofinterest of the phantom is compared against the measurement performed by the dosime-ter. Historically, the pre-treatment QA was performed using single point measurementsutilizing ion chambers or TLDs. As an advancement, radiochromic films and 2D arraysof ion chambers or diodes have been introduced within tissue-equivalent or anthropomor-phic phantoms. Recently, commercial devices embedding a detector configuration for 3Dvolumetric dosimetry have also been adopted. Though, these devices rely on interpola-tion and extrapolation algorithms from several 2D projections (not just measurement) toprovide a 3D dose distribution. The only dosimeters that actually measure full 3D dosedistributions are polymer gel dosimeters and radiochromic 3D detectors [18]. Though,these types of detectors are not widely used to their passive and single use nature.
40

Chapter 3
Electronic Portal Imaging Device designand clinical usage
3.1 Background
In radiation therapy, daily checks for accurate treatment setup are crucial. Despite theadvances in technology, verification of the dose delivery to the tumour as planned remainspractically difficult. The difficulties manifest in several factors which vary daily. Namely,tumor shape, size and location changes over the treatment course which could last forweeks. Moreover, patient positioning on the treatment couch adds uncertainty factors.Hence, a methodology to ensure the intended tumor (and organs at risk) position prior totreatment is required. For decades, film cassettes were used to acquire images from thelinac beam or an external X-ray source for landmark localization purposes. The imagesproduced by films are satisfying for the intended purpose but have disadvantages. Duringthe time required for film development, misalignment between the imaging phase anddelivery phase can occur. Additionally, imaging using cassette films is labor intensiveand extend the treatment time. These weaknesses motivate the development of electronicportal imaging devices (EPID).
In the 1980s, the usage of a fluoroscopic system to acquire megavoltage transmissionimages was introduced [66]. The proposed EPID was designed as a large flat screen flu-oroscopic system. A decade later, manufacturers introduced camera-based fluoroscopicEPIDs. This approach was refined and developed by several research groups leading tothe introduction of the commercialized camera-based fluoroscopic EPIDs 3.1. During the1990s, this type of EPIDs was widely used as positioning imaging device in clinics. How-ever, camera-based EPID has several drawbacks. In particular, the low light output of thefluorescence screen in combination with the poor light conversion due to the lens apertureyields a low Detective Quantum Efficiency (DQE) of below 1%, while large lens aperturewould lead to poor resolution due to spherical aberrations [19]. To enhance the DQE,ionization chamber were explored as an alternative detector but filled with a liquid of
41

CHAPTER 3. ELECTRONIC PORTAL IMAGING DEVICE DESIGN ANDCLINICAL USAGE
much higher density than air. The commercial version of the liquid based EPID consistedof a matrix of 256 ×256 ionization chambers filled with an organic liquid (isooctane)over an area of 32 × 32 cm2 [67]. In parallel, medical physicists investigate thin-filmphotodiodes and transistors for use in photoelectronic imaging devices [68]. The tech-nology subsequently developed into a flat-panel amorphous silicon (a-Si) imaging arraysystem (see 3.2). Since the beginning of of 21th century, most of the EPIDs used in clinicsare based on this technology [68]. A comprehensive review of EPID clinical practice isoutlined in [69] [70] [71] [72].
Figure 3.1: Schematic illustration of camera-based EPID [72].
Currently, imaging using EPIDs has applications including the assessment of patient setupbefore and during treatment delivery and the advanced assessment of patient motion forimage guided radiation therapy (IGRT) [73]. Depending on the X-ray beam, differentimaging is enabled by EPID. The use of the therapeutic beam enables the acquisition ofplanar or (by gantry rotation) tomographic MV images. MV images acquired by EPIDshave poor contrast in comparison to kV images due to low DQE of these detectors atthe high energies where Compton interactions are dominant. Novel structure designs andimage processing methods have been proposed to enhance the DQE and spatial resolution[74] [75]. When EPID is integrated in the linac gantry, also X-ray kV images can beacquired and a cone beam computed tomography (CBCT) can be reconstructed [76].
3.1.1 EPID structure and response to ionizing radiation
As stated before, several EPID designs have been introduced and commercially producedby different vendors. In this thesis, focus is given to the structure and specification of theEPID installed at the University Clinic. In this clinic, the ELEKTA synergy (ELEKTA
42

3.1. BACKGROUND
Figure 3.2: Conceptual drawing of a flat-panel imager proposed by [68].
Oncology Systems, Crawley, UK) linac is equipped with the PerkinElmer XRD 1640 AL5P a-Si EPID (ELEKTA iViewGT).
Modern EPIDs are based on indirect photon to signal conversion, relying on electronto photon conversion mechanism (scintillation). The EPID exploits the so called activematrix flat panel imager (AMFPI) technology [77]. The imager consists of a pixelatedphotodiode array based on hydrogen-doped amorphous silicon (a-Si: H) semiconductors.Each photodiode is connected to a thin film transistor (TFT) to switch the readout signal,and both are mounted on a glass substrate. A scintillator made of terbium doped gadolin-ium (Gd2O2S:Tb) or cesium iodide (CsI) is sandwiched between the array and a 1 mmthick copper build-up plate. The imager is encapsulated in a low-density plastic coverand laterally connected to a readout electronics. Figure 3.3 schematically illustrates thestructure of the EPID.
Figure 3.3: (a) Schematic structure of EPID and the indirect conversion of ionizing radiationthrough scintillation. (b) An example of an a-Si 3× 4 pixel array and associated electronics [19].
When the incident ionizing photon beam strikes the imager, the low energy scattered ra-
43

CHAPTER 3. ELECTRONIC PORTAL IMAGING DEVICE DESIGN ANDCLINICAL USAGE
Table 3.1: Comparison of two state-of-the-art EPIDs.
EPID model PerkinElmerXRD 1640
VARIANa-Si1200
Scintillator screen CsI Gd2O2S:TbPixel number 1024×1024 1280×1280
Active area (cm2) 41×41 40×40Pixel size (mm) 0.40 0.39
Maximum frame rate(fps) 3.5 25
diation is attenuated by the build-up plate while the high energy photons are convertedinto secondary electrons. The converted electrons (and the unconverted photons) inter-act with the scintillation layer producing a shower (glare) of optical photons which isefficiently absorbed by the photodiode array generating an electric charge. The chargeis integrated into the capacitive element of each pixel and controlled by the TFT switchwhich manages the bias between the photodiodes and the signal line 3.3(a). The un-converted incident photons may be directly detected by the photodiodes, however, theindirect detection has a gain which is one order of magnitude larger [78]. EPIDs usinga-Si technology shows a conversion efficiency superior to other technologies, consideringthat about 50% of the light emitted from the scintillator is converted into a charge signal[72]. Furthermore, solid state technology gives the advantages of almost real-time, digitaland pixelated readout with relatively large detection area. Thus, all the modern linacs arecombined with a-Si EPID to enable IGRT applications.
Commercially, a-Si EPIDs are manufactured by PerkinElmer R© to be integrated intoELEKTA and Siemens R© linacs and VARIAN R© to be mounted on VARIAN’s linacs.Both manufacturers share the same conceptual design [77], though, they vary in technicalspecifications. The state-of-the-art EPID specifications for the two vendors are given intable 3.1.
3.1.2 Imager readout and acquisition system
The a-Si EPID structure is the same for both manufacturers but electronics and signalreadout systems can vary in approach. In this work, PerkinElmer EPID is used and hence,signal readout and image acquisition is presented in depth.
The EPID panel is split electronically into two halves. Each half has eight separate read-out regions (ROG). Each ROG is read row by row from the edges to the center, thus inopposite direction for the two halves. Figure 3.4(a) illustrates the electronic separation ona schematic layout of the panel and ROGs while figure 3.4(b) depicts the readout separa-tion effect in an offset image (with no radiation applied).
Using a relatively complex reading layout introduces many advantages. For instance, the
44

3.1. BACKGROUND
Figure 3.4: (a) Schematic layout of a PerkinElmer EPID with two isolated halves, 8 ROGs perhalf [79]. (b) Offset image acquired with a PerkinElmer EPID.
reading pattern enables to minimize the bias in signal collection of a large sensitive area,leading to optimized collection time and negligible dead time. Because of the capacitivefeature of each pixel, the signal is stored till reading and, subsequently, annealing. Afterreading completion, the pixel signals are transferred as a single frame to a frame grabberequipped computer. Typically, the frame acquisition time for PerkinElmer EPID is be-tween 0.43 to 0.14 sec. In principle, the frame acquisition time includes the integrationtime (depending on acquisition setting) and the reading time (depending on electronics). Itis worth emphasizing that during signal integration, the pixels keep collecting the signalstill the end of acquisition or saturation. This feature is crucial in low dose measurements,which are relevant for this thesis. Figure 3.5 illustrates the readout scheme for each frame.
Image acquisition, in general, follows two modes. Firstly, in integrated mode all imageframes are summed to produce a single image. This imaging mode works well for lo-calization purposes but not for tumour tracking, IGRT or dosimetric purposes. Secondly,in cine “or movie” mode image frames are continuously transferred to the computer at afixed rate. Both major linac vendors (ELEKTA and VARIAN) provide the user with thetwo modes. Yet, the acquisition options (e.g. spatial resolution, frame rate, image typeand extension ...) vary with a dependence on vendor, linac type and operating software(and version).
3.1.3 EPID for dosimetric purposes
EPID has been proved to be a useful tool for landmark localization prior to and dur-ing the treatment. Yet, geometrical accuracy does not guarantee the dose delivery tobe as planned. To this purpose, several researchers have been proposing the possibil-ity to extract dosimetric information from the EPID images. The fact that EPID has anapproximatively linear response to radiation, digital and real-time readout, high spatialresolution and rigid attachment to the linac motivates the researchers to investigate and
45

CHAPTER 3. ELECTRONIC PORTAL IMAGING DEVICE DESIGN ANDCLINICAL USAGE
Figure 3.5: Readout pattern of a Perkin Elmer EPID. Regions A, B, and C are the integratedsignals from frame 1, 2, and 3, respectively [79]
develop such detector type to fulfill the dosimetric requirements. Before the a-Si EPIDintroduction, the dosimetric properties of the liquid-filled ionization chamber EPID havebeen clinically investigated [80] [81]. On the other hand, also the camera-based EPIDdosimetry has been studied and developed by several groups [82] [83] [84]. Both EPID-based dosimetry systems showed interesting characteristics and superior advantages overother dosimetric devices back then [67]. Nonetheless, a-Si EPID has paved the way fora new era of EPID-based dosimetry, and almost all modern linacs are equipped with thistype of EPID.
3.1.3.1 EPID dosimetric properties and challenges
There is a considerable variety of EPID dosimetric characterization tests in the literature.Although the typical layout of the a-Si is similar for both vendors (i.e. PerkinElmer andVARIAN), technical details like pixel size, array size, image acquisition mode implemen-tation and the physical housing of the EPID make every model somehow unique [18][85] [86]. Here, the focus will be on the major challenges of PerkinElmer EPID-baseddosimetry.
1. Pixel response linearity with dose: In principle, the pixel should respond linearlywith radiation intensity. In practice this is approximately true but some deviationsmay occur. These deviations could be due to photodiode saturation, pixel defect,incomplete signal acquisition, ghosting effect or dose rate dependency. The level of
46

3.1. BACKGROUND
deviation varies with EPID model and acquisition software version. Thus, absolutedose calibration of pixels has to be EPID specific. The literature extensively in-vestigates different EPID types, and several corrections are proposed [79] [87] [88][89] [90].
2. Energy dependent response: EPID exhibits higher response to low energy pho-tons (< 0.5 MeV) as compared to a water equivalent detector due to the increasedoccurrence of the photoelectric interaction in the copper plate and the scintillationlayer (figure 3.6) [91].
Figure 3.6: Energy sensitivity of an a-Si EPID, normalized at 10 MeV, compared to a waterequivalent detector [92].
Over-response could reach 20% difference with respect to ionization chambers, es-pecially in low dose areas (e.g. inter-leaf transmitted radiation). Scatter radiationfrom the MLC and other linac head components increases the low energy radi-ation component of the beam. In addition, the EPID component itself adds un-wanted scatter to signal. This impacts the readout in the off-axis region and thedose response of different field sizes (regular and irregular filed shapes). Severalapproaches have been proposed to model the low energy components using simula-tion or empirical methods [79] [92] [93]. However, modelling becomes harder forthe VMAT technique where continuous modulation of the beam shape is applied.
3. Pixel sensitivity variation: Each pixel in the a-Si array has a specific offset signaland a specific gain response to radiation. The signal variation is due to the intrinsicresponse difference between pixels in combination with differences in the readoutsystem [94]. In general, the difference in pixel specific offset and gain responsecan be corrected by irradiating the entire array to a uniform mono-energetic beam.However, this is not achievable in practice because the linac generates a spectrum ofenergies with non-uniform intensity distribution. Nevertheless, the non-uniformityof the beam is negligible for imaging purposes and, hence, manufacturers use a
47
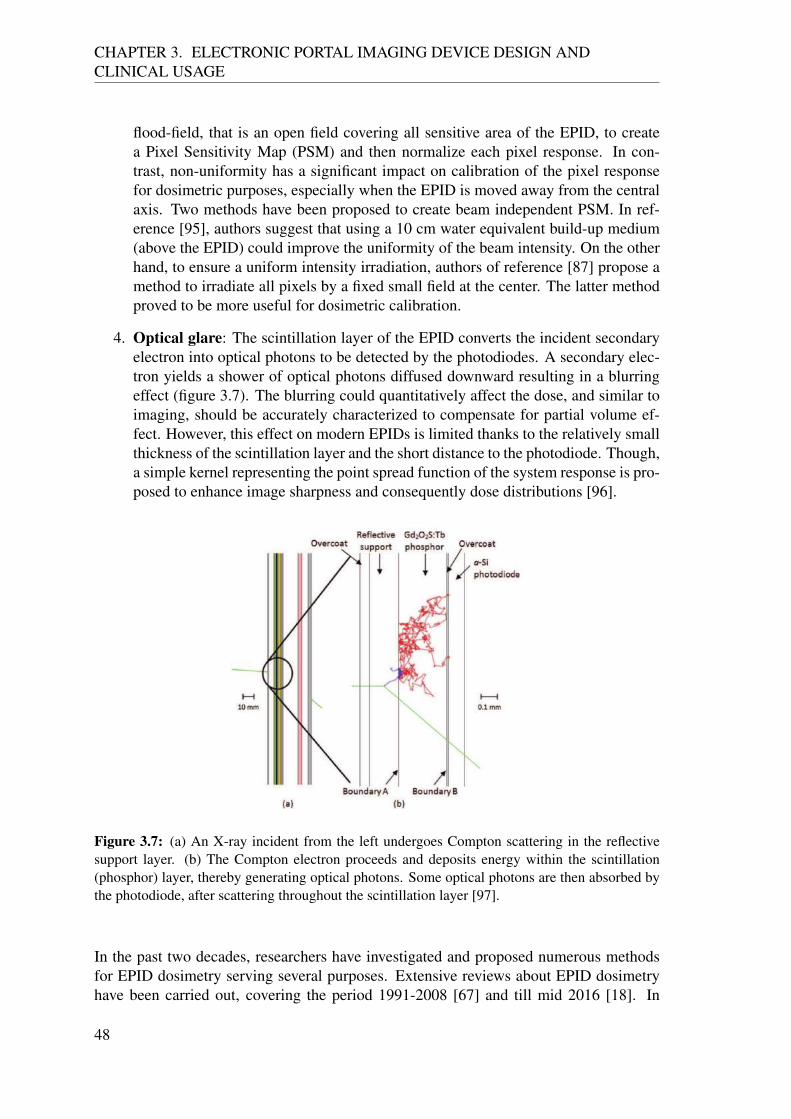
CHAPTER 3. ELECTRONIC PORTAL IMAGING DEVICE DESIGN ANDCLINICAL USAGE
flood-field, that is an open field covering all sensitive area of the EPID, to createa Pixel Sensitivity Map (PSM) and then normalize each pixel response. In con-trast, non-uniformity has a significant impact on calibration of the pixel responsefor dosimetric purposes, especially when the EPID is moved away from the centralaxis. Two methods have been proposed to create beam independent PSM. In ref-erence [95], authors suggest that using a 10 cm water equivalent build-up medium(above the EPID) could improve the uniformity of the beam intensity. On the otherhand, to ensure a uniform intensity irradiation, authors of reference [87] propose amethod to irradiate all pixels by a fixed small field at the center. The latter methodproved to be more useful for dosimetric calibration.
4. Optical glare: The scintillation layer of the EPID converts the incident secondaryelectron into optical photons to be detected by the photodiodes. A secondary elec-tron yields a shower of optical photons diffused downward resulting in a blurringeffect (figure 3.7). The blurring could quantitatively affect the dose, and similar toimaging, should be accurately characterized to compensate for partial volume ef-fect. However, this effect on modern EPIDs is limited thanks to the relatively smallthickness of the scintillation layer and the short distance to the photodiode. Though,a simple kernel representing the point spread function of the system response is pro-posed to enhance image sharpness and consequently dose distributions [96].
Figure 3.7: (a) An X-ray incident from the left undergoes Compton scattering in the reflectivesupport layer. (b) The Compton electron proceeds and deposits energy within the scintillation(phosphor) layer, thereby generating optical photons. Some optical photons are then absorbed bythe photodiode, after scattering throughout the scintillation layer [97].
In the past two decades, researchers have investigated and proposed numerous methodsfor EPID dosimetry serving several purposes. Extensive reviews about EPID dosimetryhave been carried out, covering the period 1991-2008 [67] and till mid 2016 [18]. In
48

3.1. BACKGROUND
this thesis, the historical development of currently used techniques and methods, cover-ing publications till mid 2018 is presented.There are more than 100 publications on EPID dosimetry ranging from the investiga-tion of detector properties, problem-solving and developing of new methodologies. Ingeneral, the developed methods are either to conduct transit dosimetry or non-transitdosimetry. Transit dosimetry is referred to a dosimetry of a beam passing through media(either patient or phantom) while non-transit dosimetry referred to a dosimetry of unat-tenuated beam or in–air dosimetry. Though, another categorization could be done basedon the dosimetry purposes. Namely, pre-treatment or during treatment (in-vivo) verifica-tion dosimetry. Since the thesis is developing pre-treatment verification dosimetry, EPIDdosimetry review is categorized accordingly. However, in addition to pre- and during-treatment categorization, each category is sub-categorized in dosimetric dimensionality(i.e. 1D, 2D, 3D or 4D).
3.1.4 Dosimetry for pre-treatment QA
In order to develop a pre-treatment QA dosimetric tool based on EPID technology, themain task is to develop a methodology that enables to compare the dose delivered by thelinac with the planned dose distribution. Serving this principle, two main approaches areused to conduct EPID-based dosimetry for pre-treatment QA.
3.1.4.1 2D Dosimetry
• Predicting the EPID image: Using the dose calculation engine of the TPS or inde-pendent engines, the expected 2D EPID image obtained by delivering each beam ofa treatment plan is predicted. For non-transit dosimetry, this approach has to incor-porate two models for prediction. One to account for the energy fluence from thelinac head component (including MLC positions) and the other to account for theEPID response (including detective quantum efficiency, dose to signal conversion,attenuation per layer). Predicting 2D images is widely used in clinics nowadays.VARIAN distributes a commercial software (Portal Dosimetry R©, Varian MedicalSystems, Palo Alto, CA) and numerous investigations have been conducted on dif-ferent versions of this software [98] [99] [100] [101] [102] [103] or on developedversions of the algorithm [104] [105]. Other groups have independently developedalgorithms that predict the 2D image at the EPID level using a dose calculation en-gine different from the TPS [106] [107] [108] [109] [110]. However, this approachmay be designated as 2D verification method rather than a dosimetric method sincethe EPID image is not a representative of dose in water and cannot be used as aclinical dosimeter.
• Converting the EPID image into dose in water: In order to enable the measurementverification, few groups have developed algorithms to convert 2D EPID images to2D dose distributions [79] [111] [112]. Other groups have proposed changing the
49

CHAPTER 3. ELECTRONIC PORTAL IMAGING DEVICE DESIGN ANDCLINICAL USAGE
EPID structure. For example, increasing the build-up plate thicknesses, removingthe scintillation layer or adding backscatter shielding. Based on the 2D dose dis-tribution at EPID level, some researchers have proposed methods to reconstruct(back-project) the 2D dose distribution as imparted into a virtual water cubic phan-tom at patient level [111] [113] [114].
3.1.4.2 3D dosimetry
Two approaches have been proposed to reconstruct a 3D dose distribution in a phantom orpatient. In the first method, the EPID image is converted to energy fluence and then back-projected upstream to the linac head level. The back-projected fluence is then insertedto a dose calculation engine to generate the dose within the phantom/patient [115] [116][117]. The second method has been recently proposed and is based on directly convertingthe EPID image to 2D dose distribution and then back-project it to a virtual water phantom[118] [119].
3.1.5 In vivo dosimetry
Proposed methods for in-vivo dosimetry are essentially utilized for patient transit dosime-try.
3.1.5.1 1D dosimetry or point dosimetry
As a first step, researchers have worked on finding a correlation between the signal mea-sured by the EPID and the dose along the central beam axis using back-projection algo-rithms [120] [121]. The approach has gained success due to its simplicity and has beenvalidated for different treatment plans [122] [123]. Several groups have investigated anddeveloped point dose verification even for complex radiation delivery techniques [124][125]. This approach is also commercially available as SOFTDISO (Best Medical, Italy)and EPIgray (DOSIsoft, Cachan, France).
3.1.5.2 2D dosimetry
As an extension of the point dose verification, authors of reference [126] developed amethod to reconstruct a 2D dose distribution at the iso-center level using semi-empiricalconversion factors extracted from a measured 2D dose distribution in a water equivalentphantom. A similar approach but using patient radiological thickness (acquired from pa-tient CT) to account for attenuation has been initially proposed in [127] and developedin [128] [129]. Authors of reference [130] have also quantitatively investigated this ap-proach. Another method for 2D verification has been implemented by predicting the dose,
50

3.1. BACKGROUND
energy fluence or even the image at the EPID level with the presence of the patient. Inprinciple, this approach requires EPID calibration to convert the 2D image into 2D dosedistribution or 2D energy fluence or, in case the image at the EPID level is predicted, anexhaustive prediction modeling of the dose delivery and imaging systems. For all cases,the prediction can either use a MC or analytical dose calculation engine [131] [132] [133].
3.1.5.3 3D dosimetry
Instead of predicting the 2D dose distribution at the EPID or iso-center levels, the EPIDimage is converted to dose or energy fluence, back-projected upstream above the patiententrance point and then inserted into a dose calculation engine to generate the 3D dosedistribution relying on patient CT. With minor technical differences, this approach hasbeen proposed by groups [115] [134] and the works are mostly focused on developingthe dose calculation to incorporate the variables relevant to VMAT treatment plans [135][136] [137] [138] [139] [140]. ELEKTA adopted this approach and distributes the systemas Iview-Dose software to be exclusively implemented in ELEKTA linacs.
3.1.5.4 4D dosimetry
Recently, the inclusion of the time variable in in-vivo dosimetry has been proposed. Theeffective clinical need of such approach is argued in [141] [142]. Authors of reference [79]proposed a time-dependent method for EPID dosimetry. This method has been initiallyproposed for pre-treatment QA and is now under development for 2D time resolved in-vivo dosimetry. A simulation has been recently published proving the feasibility of time-resolved dosimetry [143].
51

Chapter 4
Dosimetric characterization of theEPID
4.1 Introduction and motivation
The advantages of EPID performing dosimetry were widely presented in the previouschapter. Though, prior to being clinically useful, EPID requires a calibration processsupported by several measurements. Literature has proposed numerous methods for cali-bration. Each method has advantages and disadvantages depending on its specific perfor-mance and applicability. The results of these methods vary considerably within differentEPID technologies and generally are not even consistent for the same EPID model [90].When comparing different EPID models, the dosimetric characteristics are influenced alsoby the acquisition systems [144]. Consequently, there is no a method that can be gener-ally applied to all EPID models. For this reason, a comprehensive characterization of theEPID, including the readout system and the image acquisition modes are required beforethe establishment of a calibration method. In this chapter, the EPID used throughout thiswork is characterized in terms of the signal profile, offset signal, image lag, linearity withdose and dose rate, response to different energy spectrum and variation of pixel sensitivity.
4.2 Materials
4.2.1 Linear accelerator and EPID
All measurements were performed on ELEKTA synergy (ELEKTA Oncology Systems,Crawley, UK) linac using 6 MV photon beams. The linac is equipped with ElektaAgility collimator, consisting of 80 leaf pairs and two perpendicular diaphragms and twoPerkinElmer XRD 1640 a-Si EPIDs (ELEKTA iViewGTTM and XVI). The two EPIDs
53

CHAPTER 4. EPID 2D CALIBRATION AND 3D DOSE RECONSTRUCTIONALGORITHM
share the same physical structure and electronics except for the additional build-up layeron top of the MV EPID. The XVI EPID is used for kV imaging and is mounted perpen-dicularly to the X-ray source for the treatment. The iViewGT EPID is the most widelyused detector for MV imaging and, unless stated otherwise, it will be addressed as theEPID from now on. The EPID is mounted at a source-surface distance (SSD) of 160 cm(z direction) having the freedom to move in cross-line (x) and in-line (y) directions. TheEPID has a sensitive area of 41 × 41 cm2 corresponding to a field size of 26 × 26 cm2
at the iso-center plane. Detailed technical specifications of the used EPID is outlined intable (3.1). The structure of linac and EPID is typically designed as presented in chapter2.3. Figure 4.1 shows the outer appearance of the Linac head and the EPID.
(a) (b)
(c)
(1)
(2)
(3)
(4)(5)
Figure 4.1: (a) ELEKTA linac components: (1) beam source, (2) linac head (includes MLC andjaws), (3) EPID, (4) X-ray source, (5) kV EPID. (b) A picture of the MLC defining the field shapes.(c) The EPID, without the plastic cover.
4.2.2 Image acquisition and software
Originally, ELEKTA has separate Personal Computers (PC) and software for linac, pa-tient data, EPID and kV imaging system. The EPID is connected to the PC (labeled
54
4.3. METHOD
iViewGTTM as the EPID) via a frame grabber module through an independent digital ca-ble. The frame acquisition is managed using the X-ray imaging software (XIS) providedby Perkin Elmer. The XIS captures 16-bit raw (uncorrected) images in Heinemann imag-ing (HIS) format. The software includes the different image corrections and adjustmenttools. The software offers three acquisition modes: the single acquisition mode, the dou-ble or multiple-exposure mode and the movie-exposure mode. For each mode, a frameaveraging parameter can be set before the acquisition. However, the number of acquiredimages is limited to 256 image frames and there is no possibility to enable free raw im-age acquisition. To overcome this limitation, a stand-alone PC was used to acquire theraw images directly generated by the EPID. The PC was equipped with a frame grabberand and a c++ code (named: iCom-logger) developed at the LMU by Dr. M. Podestain the framework of the European Society for Radiotherapy and Oncology Technologytransfer grant from Maastricht University. ICom-logger is designed to capture the im-age frames in a free-running mode with a resolution of 1024×1024 pixels and pixel sizeof 0.4×0.4 mm2. These image frames were labeled with their acquisition time in timeUnix timestamp format with a temporal resolution of hundreds of millisecond. The im-age frames storage was triggered and stopped manually at the beginning and the end ofthe measurement and had a frame rate of 2.3 frame per second (fps). In parallel, ELEKTAsystem includes a package named iCom-Vx which provides an interface between the PCiViewGTTM and the linac control system. The iCom-Vx functions include the automaticselection and creation of patient data and the automated acquisition of images on the PCiViewGTTM. An in-house code was developed to mimic the generation of the linac con-trol system trajectory file (namely, the linac log file). The developed code extracts alsothe linac output files labeled with time Unix timestamp format in nanosecond resolution.The linac trajectory file registers instead four messages per second.All image processing conducted in this chapter were carried out using MATLAB (Math-works Inc., Natick, MA) on an off-line PC.
4.3 Method
The features that are adopted to characterize the EPID are structured according to thefollowing sequence:
1. EPID signal profile As described earlier, the EPID collects the signals from the16 readout regions of the sensitive area according to a specific pattern to producethe image frame. The annealing of the photodiodes after integrating the signalgenerates a dead time which influences the image frame especially at the beginningand the end of the beam delivery. The general characteristics of the EPID signalprofile are assessed during irradiation (beam-on) using the default maximum doserate (i.e. 530 MU/min).
2. Offset correction Each pixel detects a persistent signal so that the pixel value (PV)is always above zero even when no radiation is incident (beam-off). The raw im-
55

CHAPTER 4. EPID 2D CALIBRATION AND 3D DOSE RECONSTRUCTIONALGORITHM
age acquired during beam-off is called offset (also referred to as dark current ordark field) image. The pixel values of the offset image are subtracted from eachconsecutive image frame allowing response values to start from zero.
3. Image lag (ghosting effect) The image lag (also referred to as ghosting effect) char-acterizes the image frame with the presence of signal from the previous frame(s).This effect influences the absorbed dose by adding spurious signal to the imageframe(s) during irradiation (beam-on) or after (beam-off). The effect of the imagelag on the EPID signal fall off during beam-off is quantified for doses varying from2 MUs to 1000 MUs.
4. Dose response linearity Linearity of the EPID signal with respect to the absorbeddose is the essential feature required for any detector to be used as a dosimeter. Inorder to assess the linear response of the EPID, the average signal of a 9 by 9 pixelmatrix centered in the image frame is calculated for irradiations with 5, 10, 20, 50,100, 300 and 500 MUs. To assess the dose response linearity, the cumulative sum ofthese average signals is reported as a function of dose. The considered acquisitionstarts 10 frames before beam-on and ends 10 frames after beam-off.
5. Dose rate dependence In conventional treatment techniques, the dose rate is con-stant during beam delivery. In contrast, VMAT is distinguished by the continuousmodulation of the dose rate. Hence, the linac is set to deliver a dose correspondsto 50 MU by applying 100, 150, 300, 500 as maximum dose rates (MU/min). TheEPID signal is measured for the different dose rates and the deviation with respectto the integrated EPID signals is calculated to quantify the dose rate dependence.
6. Pixel sensitivity The individuality of the offset signal exhibited by each pixel on theimage frame is manifested also in gain caused by pixel specific response or differentefficiency of the readout system. To obtain an estimation of the pixel sensitivity,the EPID is irradiated with a uniform flood-field covering the entire sensitive area(i.e. 26×26 cm2). Image frames acquired during stable irradiation are averagedand subtracted to the offset image, thus resulting in the pixel sensitivity map. Theobtained map is normalized and used to correct for pixel sensitivity the image frameand produce a uniform image.
7. Field size effect (output factor) Field aperture has a significant impact on thebeam spectrum and energy distribution (figure 2.15). As stated before, the energydependent response is one of the main difference between the a-Si EPID and thewater equivalent dosimeter. To characterize the field size effect, the average of theEPID signal within a central 3 by 3 pixel matrix is determined for irradiation withdifferent field sizes of 3×3, 5×5, 10×10, 15×15 and 26×26 cm2. For comparison,corresponding reference measurements are performed using the Farmer ionizationchamber (IC) in a water equivalent phantom (RW3 slab phantom). The IC is placedat the center of the field at a distance of 160 cm from the source and 3 cm depth ina 30×30×30 cm3 phantom.
56

4.4. RESULTS
4.4 Results
1. EPID signal profileThe pixel values at the center of the raw image of the EPID irradiated with 10,50 and 100 MUs are plotted in figure 4.2. The signal profile over time for eachdose may be categorized into three regions. (a) The first region starts with non-doserelated signal (offset signal) that increases as the EPID is irradiated. This region canbe modeled depending on the linac ramp up and the EPID reading pattern. (b) Thesecond region is where the response is expected to be constant, however, it shows aslight fluctuation and gradual increase in gain. (c) The fall off region represents thesignals after the beam-off. The signal decreases according to an exponential decayindicating the ghosting effect of the detector (see 3).
0 5 10 15 20 25 30 35 40 45Frame No.
0
0.5
1
1.5
2
2.5
3
3.5
4
EP
ID s
ign
al
104
100 MU50 MU10 MU
x
15 20 25 30 35Frame No.
3.693.7
3.713.723.733.743.753.763.773.78
EP
ID s
ign
al
x 104
10 11 12 13 14 15Frame No.
0.5
1
1.5
2
2.5
3
3.5
EP
ID s
ign
al
x 104
36 37 38 39 40 41 42 43Frame No.
0.5
1
1.5
2
2.5
3
3.5
EP
ID s
ign
al
x 104
(a)
(b)
(c) (a)
(b)
(c)
Figure 4.2: The EPID central signal profiles without corrections for 10, 50, and 100 MUs at adose rate of 530 MU/min. The three regions characterizing the EPID signal profile (a)(b) and (c)are zoomed.
Figure 4.3 illustrates the image frame reading of a 10×10 cm2 field from the begin-ning of irradiation till the end. The reading pattern appears to start from the EPIDcenter propagating outward. After few image frames, the EPID shows a uniformreading. After the beam-off, the EPID detects the preserved signal from its centeroutward to the edges.
2. Offset correction Several offset images are acquired after 20 frames, minutes andhours after irradiation. Image ghosting effect (see 3) is found to affect the irradiatedregions after the beam-off for minutes, especially with high doses. Though, signalsreturn to the initial state eventually. Figure 4.4 shows an example of an offset image.
3. Image lag (ghosting effect)In figure 4.5, the pixel value at the center of the image frame recorded by the EPIDas a function of time is compared to the delivered dose rate, as obtained from the
57

CHAPTER 4. EPID 2D CALIBRATION AND 3D DOSE RECONSTRUCTIONALGORITHM
Figure 4.3: Measured image frames indicating EPID reading pattern.
(a) (b)
0
1
2
3
4
5
6
104xSignal
Figure 4.4: (a) Scatter plot of the offset signal. (b) offset (dark field) image.
58

4.4. RESULTS
linac trajectory file. The figure eases the discrimination between direct and indirecteffects of the irradiation on the EPID signal. The signal starts a few millisecondsafter irradiation and rises up as dose increases. However, the signal keeps increasingslightly even when the dose rate reaches stability. When the beam is off, the signalstill gives positive readings indicating the ghosting effect. For quantification, thefall off for different dose rates is illustrated in figure 4.6. For 500 MU, the EPIDrequires 10 frames to reach 1% difference with respect to the offset in pixel value.
Figure 4.5: EPID signal at the centre of the panel for a 50 MU delivery and the linac output interms of dose rate. Both plots are in function of time.
4. Dose response linearity
Based on the EPID signal acquisition with different dose rates, the cumulative cen-tral signals are reported against doses in figure 4.7(a). A first-degree polynomialfitting function is applied resulting in coefficient of determination R2 = 1. Theparameters of the function are expressed in the formula:
Dose(MU) = 0.16× 10⁻³(IntegratedSignal(PV )) + 0.33 (4.1)
Figure 4.7(b) is similar to figure 4.7(a) but the ordinate axis is scaled logarithmicallyto illustrate the validity of the fitting even for low MUs.
5. Dose rate dependence Since the dose rate during delivery differs from the one ofthe user settings, the real dose rate is retrieved from the linac log file as a functionof time. In figure 4.8, the central EPID signals are reported for each dose rate.Notably, since the EPID signal starts increasing milliseconds before irradiation,either the recorded time for the dose rate delivery or the EPID frame acquisitiontime are affected by a time offset. In figure 4.9, the integrated signals acquired forthe different nominal dose rates are normalized to the central value and displayed
59

CHAPTER 4. EPID 2D CALIBRATION AND 3D DOSE RECONSTRUCTIONALGORITHM
Figure 4.6: Central EPID signal after beam-off for different MUs (a) Linear ordinate axis scale.(b) Logarithmic ordinate axis scale.
0 0.5 1 1.5 2 2.5 3 3.5 4 4.5EPID signal x 106
0
100
200
300
400
500
600
MU
MU vs. PVlinear fitting
0 0.5 1 1.5 2 2.5 3 3.5 4 4.5
EPID signal x
(a) (b)
106
100
101
102
103
MU
MU vs. PVlinear fitting
Figure 4.7: Cumulative central signals for different MUs and the applied linear fitting. The ordi-nate axis is scaled (a) linearly and (b) logarithmically.
60

4.5. OUTLOOK
against the average real dose rate recorded in the linac log file. The maximumdeviation between the integrated signals obtained by the maximum and lowest doserate is found to be ≈ 3%.
6. Pixel sensitivity Figure 4.10(a) shows the energy distribution of a flood-field ascalculated by the TPS while figure 4.10(b) shows the EPID signal in response to thesame flood-field. Normalized cross-line and in-line profiles of both distributions areplotted in figure 4.11.
7. Field size effect (output factor) Central doses acquired by the ionization chamber(IC) and integrated central EPID signals are plotted as a function of different fieldsizes. In both figure, the values are normalized to the value of the 10×10 cm2 field.
4.5 Outlook
The EPID signal in response to radiation shows the desired features for dosimetry. TheEPID provides a real-time image acquisition synchronized with the linac beam delivery.For frame by frame dose representation, however, EPID suffers from ghosting effectswhich influence the linearity of the overall dose, as already presented in literature [88][89] [122]. Surprisingly, EPID showed excellent linearity for integrating dose-responsecomparison even with low doses suggesting two possible explanations. Either the signalsrecorded after irradiation are dose-related and emerged as a result of signal storing andreading mechanism of the system, and hence, elimination of these signals affect the lin-earity. Alternatively, the lag is proportional with overall dose elimination of these signalshave no direct impact on the integrated dosimetry. Either way, authors of reference [90]suggested that non-linearity can be explained by the lack of image acquisition and read-out system characterization. Nevertheless, the excellent linearity of the ELEKTA’s EPIDimplies that all signals are adequately preserved. The image acquisition software pro-vided by the manufacturer starts the frame acquisition a few milliseconds after beam-onand stops a few milliseconds after beam-off. This results in missing information whichdemonstrates to be valuable for dosimetric usage of the EPID. Hence, a software enablingthe free running image acquisition is needed to account for the offset image (directlybefore the irradiation) till the fall off. Dose rate shows to have an impact on the inte-grated EPID signal when compared to the total delivered dose. The difference can bedue to the unstable linac output especially for low dose rate. The EPID signal, how-ever, demonstrates a direct correlation with pulses generated by the linac for the differentdose rates which gives room for adequate accounting of dose rate dependence. The EPIDexhibits non-uniform pixel sensitivity to radiation. Furthermore, the flood-field showsnon-uniformity in dose distribution in comparison to the flood-field energy fluence. Thesignal increases when propagating radially away from the center. Though, the radial dis-tribution is not fully symmetric as the cross-line profile next to the EPID electronics showsover-response than the others. Comparing the fluence and EPID profiles of the flood-fielddemonstrates the effect of EPID inner scatter radiation and the over response to the off-axis radiation. This effect requires robust correction for pixel sensitivity, as a function of
61

CHAPTER 4. EPID 2D CALIBRATION AND 3D DOSE RECONSTRUCTIONALGORITHM
20:57:45 20:58:00 20:58:15 20:58:30 20:58:45
Time (hh:mm:ss)
0
10
20
30
40
50
60
70
Dose
rate
(M
U/m
in)
0
500
1000
1500
2000
2500
3000
3500
4000
4500
EP
ID s
ign
al
Nominal dose rate =100 MU/minDose ratePixel value
20:59:40 20:59:50 21:00:00
Time (hh:mm:ss)
0
20
40
60
80
100
120
140
Dose
rate
(M
U/m
in)
0
1000
2000
3000
4000
5000
6000
7000
8000
9000
EP
ID s
ign
al
Nominal dose rate =150 MU/minDose ratePixel value
21:00:36 21:00:38 21:00:40 21:00:42 21:00:44 21:00:46 21:00:48 21:00:50 21:00:52 21:00:54
Time (hh:mm:ss)
0
50
100
150
200
250
300D
ose
rate
(M
U/m
in)
0
2000
4000
6000
8000
10000
12000
14000
16000
18000
EP
ID s
ign
al
Nominal dose rate =300 MU/minDose ratePixel value
21:02:34 21:02:36 21:02:38 21:02:40 21:02:42 21:02:44 21:02:46 21:02:48 21:02:50
Time (hh:mm:ss)
0
50
100
150
200
250
300
Dose
rate
(M
U/m
in)
0
2000
4000
6000
8000
10000
12000
14000
16000
18000
EP
ID s
ign
al
Nominal dose rate =400 MU/minDose ratePixel value
21:03:20 21:03:22 21:03:24 21:03:26 21:03:28 21:03:30 21:03:32 21:03:34 21:03:36 21:03:38
Time (hh:mm:ss)
0
50
100
150
200
250
300
Dose
rate
(M
U/m
in)
0
2000
4000
6000
8000
10000
12000
14000
16000
18000
EP
ID s
ign
al
Nominal dose rate =500 MU/minDose ratePixel value
21:05:18 21:05:20 21:05:22 21:05:24 21:05:26
Time (hh:mm:ss)
0
100
200
300
400
500
600
Dose
rate
(M
U/m
in)
0
0.5
1
1.5
2
2.5
3
3.5
EP
ID s
ign
al
x 104Nominal dose rate =max MU/minDose ratePixel value
Figure 4.8: Different nominal dose rate sets and the real dose rate recorded by the linac log filesin conjunction with the central pixel values acquired by EPID for the correspondent time.
62

4.5. OUTLOOK
Figure 4.9: Normalized values to the center of the integrated central pixel values as a functionof the average recorded dose rates for different nominal dose rates (100, 150, 300, 500, 600 andmaximum dose rates (MU/min)).
-20 -15 -10 -5 0 5 10 15 20
Distance (cm)
-20
-15
-10
-5
0
5
10
15
20
Dis
tan
ce (
cm)
-20 -15 -10 -5 0 5 10 15 20
Distance (cm)
-20
-15
-10
-5
0
5
10
15
20
Dis
tan
ce (
cm
)
0.94
0.96
0.98
1
1.02
1.04
1.06
1.08
0.2
0.4
0.6
0.8
1
1.2
1.4
1.6(a) (b)
Figure 4.10: (a) Energy distribution calculated by the TPS. (b) Pixel sensitivity as detected by theEPID image.
63

CHAPTER 4. EPID 2D CALIBRATION AND 3D DOSE RECONSTRUCTIONALGORITHM
Figure 4.11: EPID profiles and fluence in cross-line and in-line directions.
Figure 4.12: Normalized central pixel values measured by the ionization chamber and integratedby the EPID for a fluence of 100 MUs and different field sizes. Both images were normalized totheir central value.
64

4.5. OUTLOOK
the energy fluence. On the other hand, the difference in response between the EPID andthe water equivalent dosimeter appears evident when comparing for different field sizes.The over-response (for large fields) and low-response (for small fields) demonstrate thewell known energy dependency of the EPID. In conclusion, the EPID has good potentialto perform as a dosimetric device. However, several image corrections and calibrationmethods have to be applied to satisfy the dosimetry requirements for clinical usage.
65


Chapter 5
EPID calibration to dose in water
In general, two approaches have been proposed in the literature to calibrate EPID for2D dosimetry. The first approach is based on the conversion of the 2D gray scale im-age as acquired by EPID to absorbed dose in water while the other relies on simulation(or prediction) of the 2D gray scale image. For both approaches, several methods havebeen described to satisfy the dosimetric purposes. In this thesis, the calibration aims atgenerating an independent, fast, accurate and simple pre-treatment QA tool for the differ-ent treatment techniques used in the clinic. Knowing that the prediction of the 2D grayimages becomes challenging for complex treatment techniques and the accuracy of mea-surement heavily relies on the prediction integrity [79] [145], the other approach relyingon the conversion of the 2D gray scale image to absorbed dose in water has been chosen.For this purpose, a set of calibration measurements is required. Thus, validation can beperformed using any clinically available reference dosimeter.In the light of the characteristics observed on the ELEKTA’s EPID in the previews chap-ter 4, several corrections needed to be applied before calibration. In this chapter, theinitial correction includes offset, dead pixels, and pixel sensitivity followed by calibrationmethods is explicitly developed to fulfill the dosimetric goal.
5.1 Material and Method
The linac, EPID and image acquisition system and software used in this section are thesame used in chapter 4. The dosimeters and phantoms used for calibration and validationare declared upon its usage in the following sections.
5.1.1 Offset correction
Prior to irradiation, 5 EPID image frames were acquired without any irradiation and av-eraged to obtain virtually noise free pixel values. The pixel values were assumed as an
67

CHAPTER 5. EPID CALIBRATION TO DOSE IN WATER
offset of the EPID and subtracted from each image frame acquired in the following.
5.1.2 Dead pixel correction
Due to irradiation or current fluctuation, some pixels may be damaged or poorly respond-ing to radiation. Different from the manufacturer correction based on a threshold, thepixel values were discriminated according to their linear or non-linear response. All thepixels were irradiated with flood-field of intensity equal to 100 MU, and 20 image frameswithin the stable beam were acquired. For each pixel, the sum of 20 image frames wasdivided by the sum of the first 10 image frames. The pixels deviating from linearity bymore than 1% were marked as dead pixels. The procedure led to a binary mask. The maskwas then used to correct each image frame in the following by replacing the dead pixelwith the average value of the 8 neighboring pixels.
5.1.3 Pixel sensitivity correction
Although the pixels respond linearly to the intensity of irradiation in general, they can becharacterized by different response rates. This difference can be accounted for in imageprocessing by using the sensitivity characterization presented by [87] and improved in[79]. All pixels of the EPID image frame were meant to be irradiated with photon beamsof the same intensity and spectrum. However, the beam intensity and spectrum are notuniform. Besides, the uniformity is additionally compromised by the scattered beam fromthe EPID. Exploiting the movability of the EPID in cross-line and in-line directions, theEPID at first, was irradiated with a static 10 × 26 cm2 rectangular field, centered to theEPID to gain maximal uniformity. The image frames were acquired while moving theEPID along the x-direction in 4 cm step size. Then, a static 26 × 10 cm2 rectangularfield at the center was used, the EPID was moved along the y-direction in 4 cm step sizeand the image frames were acquired. The in-line profiles were combined to form thein-line 1D profile. Figure 5.1 illustrates the acquisition process. The field size and stepsize were chosen according to a trade-off between accuracy and efficiency (acquisitiontime) of the calibration. With reasonable approximation (deviation less than 0.5%), thecentral 2 × 2 cm2 of each square field is relatively uniform. The 2 cm cross-line profileat the field center was extracted from the cross-line profiles and then combined to formthe 1D cross-line profile. In similar fashion, The 2 cm in-line profile at the field centerwas extracted from the in-line profiles and then combined to form the 1D in-line profile.The obtained 1D cross-line and in-line profiles were then divided by the correspondingprofiles obtained with flood field. The result produced a cross-line and in-line profilessurrogating the beam inner scattering from the EPID. Assuming that the two surrogateprofiles are radially symmetric, the mean of the two surrogate profiles was taken to reducethe noise. A 1D Gaussian function was used to fit the mean profile. The fitted functionwas then radially interpolated covering the EPID size, thus forming a 2D map of the innerscattering surrogate. The pixel sensitivity (PS) map was obtained by dividing the flood-
68

5.1. MATERIAL AND METHOD
field image frame with the 2D map of the inner scattering surrogate. Each image framein the following was corrected for sensitivity by multiplying the pixel values with theobtained PS map.
Figure 5.1: A sketch illustrating EPID image acquisition needed for PS correction during (a)movements along in-line direction and (b) movement along cross-line direction.
5.1.4 Relative off-axis ratio (ROAR)
As the beam inner scattering and the angular response in water differ from those in EPIDmedia, an Off-Axis to central-axis Ratio for the water equivalent detector (OARw) and forthe EPID (OARe) were defined. Opposite to PS correction, the EPID was fixed, and thesquare field moved along cross-line and in-line directions during image frames acquisitionwith 4 cm shift (figure 5.2). Similar to PS correction, cross-line and in-line profiles werecombined and averaged. The mean profile was fitted with a second-degree polynomialfunction. Radial interpolation of the fitted function on the EPID image frame producedthe 2D OARe. Subsequently, the corresponding reference measurement using a Farmerionization chamber (PTW, Freiburg, Germany) (Type No. 30013) was performed in awater equivalent phantom (RW3 slab phantom), fitted and radially sampled to define the2D OARw. The division of the OARw by the OARe produced the 2D relative off-axisratio (ROAR) map. Each image frame in the following was multiplied by the 2D ROARmap to correct for water and EPID media difference.
5.1.5 Field size and penumbra correction
The primary photons generated from the beam source are contaminated by the scatteringphotons from the multi-leaf collimator (MLC) and other linac components. As the adap-tation of the field size changes the spectrum of the irradiation, the energy dependence ofthe EPID response has to be corrected to match the reference dosimeter. Furthermore, thecorrection has to include the scattering from the EPID itself. Hence, the dose, as imparted
69

CHAPTER 5. EPID CALIBRATION TO DOSE IN WATER
......
(a) (b)
Figure 5.2: A sketch illustrating fields shift in (a) in-line direction and (b) cross-line directionwith fixed EPID for ROAR correction.
to a water equivalent medium, and the characterization of the EPID response as a functionof different spectra are required. The overall difference between the EPID response andthe reference dosimeter can be modeled by two convolution kernels. For both field sizeand penumbra corrections, the choice of the fitting functions was empirically justified bya negligible fitting error. The first kernel corrects for the filed size dependence and thesecond one corrects for the lateral energy deposition and the shape of the penumbra, as de-tailed in the following. For field size dependence, a radially symmetric kernel was definedby an exponential fitting function with single decay coefficient. The unknown kernel wasconvolved with the integrated EPID image frames irradiated with 100 MU and square fieldsides of 3,5,8,10,15 and 26 cm. The central value resulting from the convolution was thencompared with the reference measurement using micro-diamond detector (PTW, Freiburg,Germany) (Type No. 60019) for the corresponding field size. An iterative optimizationalgorithm was implemented to find the best coefficient of the exponential fitting equationminimizing that difference for each field size. The implementation of the mathematicaloptimization is explicitly outlined in appendix (A). The coefficients produced from theoptimization were fitted to cover all possible field sizes with a second-degree polynomialfitting function. For each EPID image frame, the field area was determined by the numberof irradiated pixels, considering that the energy spectrum depends on the field area of theMLC, but not on the shape [31]. For penumbra correction, in-line profiles of differentfield areas of MLC, as reported in figure 5.3, were measured in a water phantom using themicro-diamond detector as reference dosimeter and compared to the EPID image frame.An unknown kernel was defined by a Lorentz fitting function with 4 coefficients for eachfield area of the MLC. Unlike the field size correction, a constraint was introduced intothe iterative optimization algorithm to normalize the maximum value of the central in-lineprofile. In other words, the optimization had the freedom just to redistribute the penum-bra fall-off. All the EPID image frames in the following were convolved with the twoobtained kernels.
70

5.1. MATERIAL AND METHOD
(a) (b)
Figure 5.3: (a) and (b) EPID image frames highlighting the fields (#1 and #2) used in penumbracorrection.
5.1.6 Pixel value to dose conversion
Using the micro-diamond detector as reference dosimeter, the absolute conversion factorsfrom pixel value to dose were obtained. A measurement of the central dose for 10 × 10cm2 field size was performed for dose values corresponding to the delivery of MUs rang-ing from 2 up to 1000 MU using a fixed intensity rate of 530 MU/min. The correspondentdoses was delivered to the EPID, acquiring 10 image frames after the beam delivery. Thesum of the image frames was plotted against integrated doses measured by the referencedosimeter. A linear fitting was used to convert the pixel value to dose of each imageframe.
5.1.7 Validation
For validation, firstly, cross-line profiles of calibrated EPID image frames obtained withdifferent square field sizes and acquired in air were compared to corresponding referencemeasurements using micro-diamond detector in a water phantom. Then, a set of calibratedEPID image frames of static and step-and-shoot irradiation were validated with respectto reference measurements based on the diode array detector MapCHECK 2 (Sun nuclearcorporation, Melbourne, USA) (Model No. 1177) with maximum sensitive area of 32 ×26 cm2. MapCHECK 2 was inserted in a water equivalent phantom (RW3 slab phantom)at the EPID level (SSD = 160 cm) with 3 cm build-up and 15 cm backscatter.
71

CHAPTER 5. EPID CALIBRATION TO DOSE IN WATER
5.2 Results
5.2.1 Dead pixel correction
The number of identified defected (dead) pixels is 14 over the total 1048576 pixels of theEPID image. Figure 5.4 highlights the dead pixels on the EPID image.
100 200 300 400 500 600 700 800 900 1000
100
200
300
400
500
600
700
800
900
1000
Figure 5.4: The circled dead pixels of the EPID image.
5.2.2 Pixel sensitivity correction
The profiles obtained by moving the EPID in in-line and cross-line directions are plottedin figure 5.5 along with their correspondent profiles of the flood-field. The second-degreepolynomial function used to fit the profiles is reported in figure 5.6. The correction basedon the senstivity map is depicted in figure 5.7, where the uncorrected and corrected flood-field EPID images are compared.
72

5.2. RESULTS
Figure 5.5: Profiles acquired by moving the EPID and the corresponding flood-field profiles for(a) in-line and (b) cross-line directions.
73

CHAPTER 5. EPID CALIBRATION TO DOSE IN WATER
Figure 5.6: Combined profile for the in-line direction along with the flood-field profile. The ratiobetween the two profiles and its fitting is highlighted.
(a) (b)
Figure 5.7: Pixel sensitivity (a) uncorrected and (b) corrected flood-field image.
74

5.2. RESULTS
5.2.3 Relative off-axis ratio (ROAR)
Figure 5.8 shows the process of generating ROAR. Figure 5.8(a) illustrates profiles ac-quired by EPID when moving fields in in-line and cross-line directions, respectively.Figure 5.8(b) compares between in-line profiles acquired by EPID and micro-diamonddetector. Figure 5.8(c) shows the combined profile of the cross-line profiles. Figure 5.9shows the resulted ratio between OARw and OARe interpolated radially forming the 2DROAR.
5.2.4 Field size and penumbra correction
Figure 5.10 shows the central doses for square field sizes of 32, 52, 102, 152 and 262
cm2 normalized to the 10 × 10 cm2 field acquired by the micro-diamond detector andEPID and the corresponding field size correction. As visible in figure 5.10, the field sizecorrection brings the uncorrected EPID images to the reference measurement.
For penumbra correction, the results of the convolution between the generated kerneland the EPID image is reported in figure 5.11(a). The in-line profile is detailed in fig-ure 5.11(b) in comparison with the profiles obtained by micro-diamond detector and the(uncorrected) EPID image.
5.2.5 Pixel value to dose conversion
The relation between the integrated dose measured by micro-diamond detector and thecorrected integrated central EPID pixel values for dose values corresponding to the deliv-ery of MUs ranges from 2 up to 500 MUs is plotted in figure 5.12. The relation is definedby a liner fitting function as follows:
Dose(mGy) = (0.00046)× pixelvalue+ (0.75) (5.1)
5.2.6 Validation
The comparison shows visual good agreement between the reference measurements andthe calibrated EPID image frames (figure 5.13). For 2D comparison, the dose distributionsobtained with MapCHECK 2 detector and the calibrated EPID image frames for differentstatic and dynamic fields are illustrated in figure 5.13. The 2D global gamma evaluationusing (3%, 3 mm) criteria results in above 99% passing rates for all the considered dosedistributions.
75

CHAPTER 5. EPID CALIBRATION TO DOSE IN WATER
Figure 5.8: (a) In-line and cross-line profiles acquired by EPID for different fields. (b) Com-parison between in-line profiles acquired by micro-diamond detector and EPID. (c) Example ofcombined cross-line profile.
76
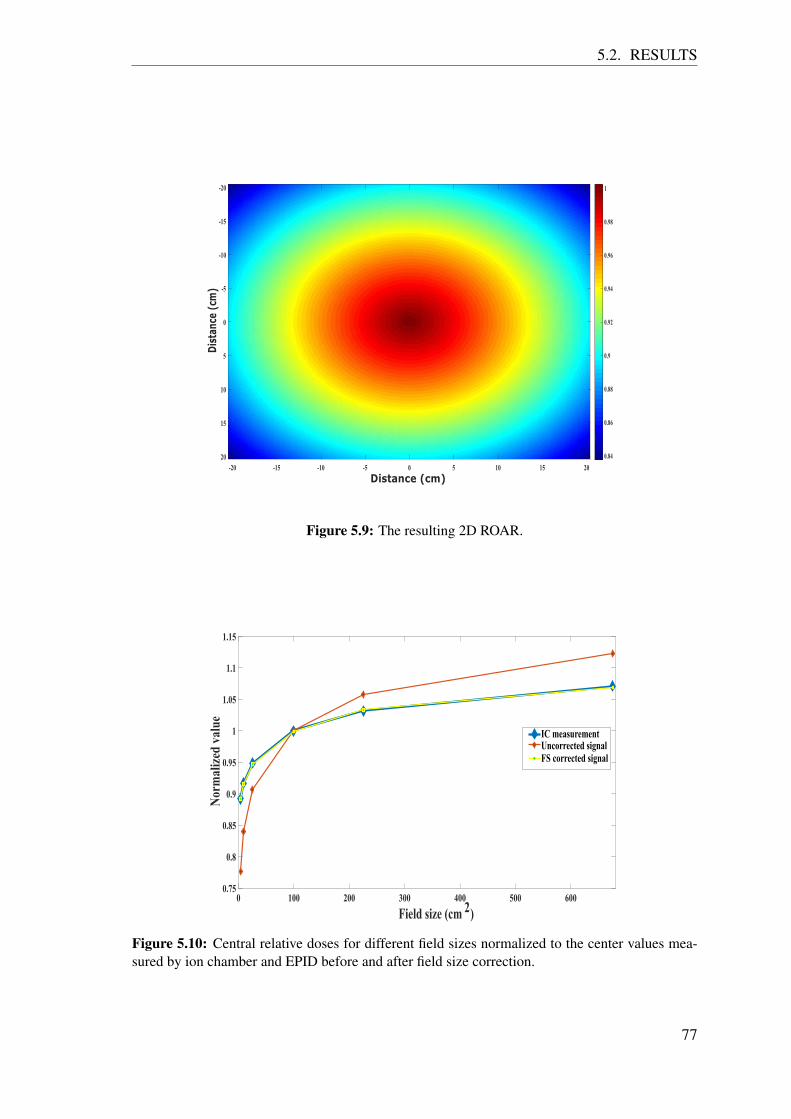
5.2. RESULTS
Figure 5.9: The resulting 2D ROAR.
0 100 200 300 400 500 600
Field size (cm 2)
0.75
0.8
0.85
0.9
0.95
1
1.05
1.1
1.15
Nor
mal
ized
val
ue
IC measurementUncorrected signalFS corrected signal
Figure 5.10: Central relative doses for different field sizes normalized to the center values mea-sured by ion chamber and EPID before and after field size correction.
77

CHAPTER 5. EPID CALIBRATION TO DOSE IN WATER
Figure 5.11: In-line profiles measured by micro-diamond and EPID before and after correction of(a) field #1 and (b) field #2.
78

5.2. RESULTS
0 0.5 1 1.5 2 2.5 3 3.5 4 4.5
EPID signal x 106
0
200
400
600
800
1000
1200
1400
1600
1800
2000
Dos
e (m
Gy)
Dose vs. EPID signalLinear fitting
Figure 5.12: Dose vs EPID signal fitting curve.
Figure 5.13: Cross-line profiles of square fields of different field sizes normalized to the 10 × 10cm2 field as measured by EPID and micro-diamond detector.
79
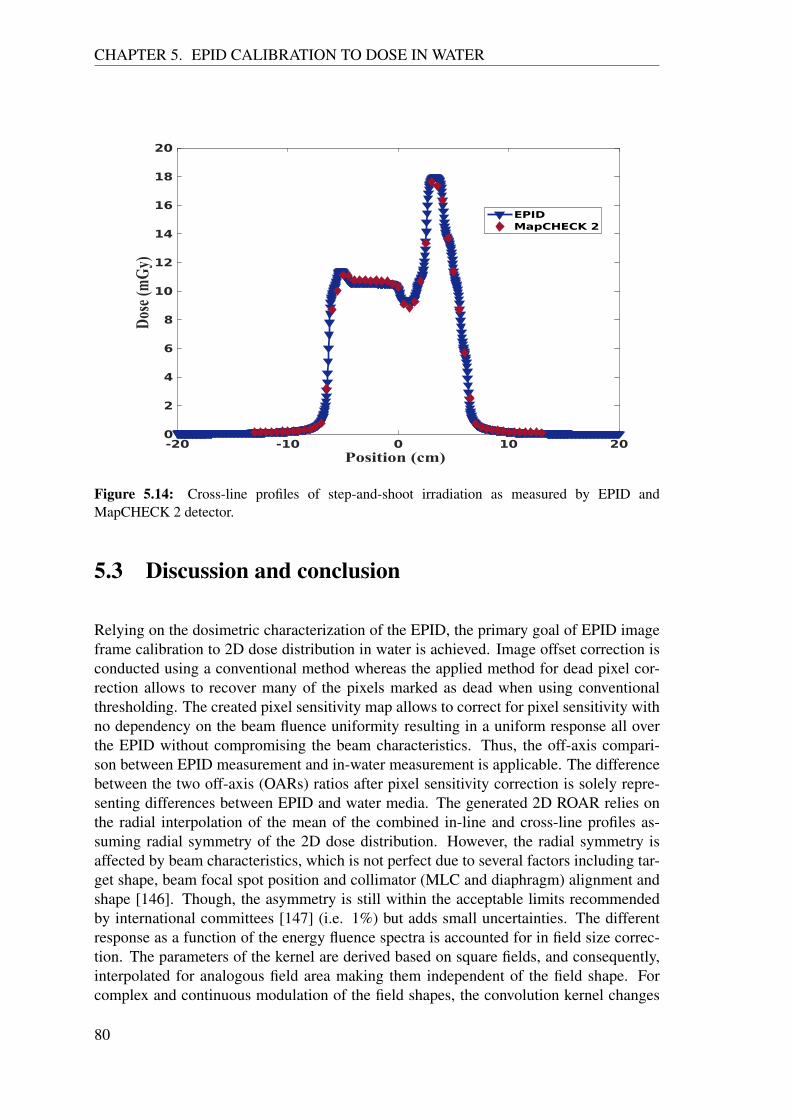
CHAPTER 5. EPID CALIBRATION TO DOSE IN WATER
Figure 5.14: Cross-line profiles of step-and-shoot irradiation as measured by EPID andMapCHECK 2 detector.
5.3 Discussion and conclusion
Relying on the dosimetric characterization of the EPID, the primary goal of EPID imageframe calibration to 2D dose distribution in water is achieved. Image offset correction isconducted using a conventional method whereas the applied method for dead pixel cor-rection allows to recover many of the pixels marked as dead when using conventionalthresholding. The created pixel sensitivity map allows to correct for pixel sensitivity withno dependency on the beam fluence uniformity resulting in a uniform response all overthe EPID without compromising the beam characteristics. Thus, the off-axis compari-son between EPID measurement and in-water measurement is applicable. The differencebetween the two off-axis (OARs) ratios after pixel sensitivity correction is solely repre-senting differences between EPID and water media. The generated 2D ROAR relies onthe radial interpolation of the mean of the combined in-line and cross-line profiles as-suming radial symmetry of the 2D dose distribution. However, the radial symmetry isaffected by beam characteristics, which is not perfect due to several factors including tar-get shape, beam focal spot position and collimator (MLC and diaphragm) alignment andshape [146]. Though, the asymmetry is still within the acceptable limits recommendedby international committees [147] (i.e. 1%) but adds small uncertainties. The differentresponse as a function of the energy fluence spectra is accounted for in field size correc-tion. The parameters of the kernel are derived based on square fields, and consequently,interpolated for analogous field area making them independent of the field shape. Forcomplex and continuous modulation of the field shapes, the convolution kernel changes
80

5.3. DISCUSSION AND CONCLUSION
-20 -10 0 10 20Distance
-20
-10
0
10
20
Distan
ce
18
14
10
6
2
Dose(mGy)
-20 -10 0 10 20Distance
-20
-10
0
10
20
Distan
ce
18
14
10
6
2
Dose(mGy)
-20 -10 0 10 20Distance
-20
-10
0
10
20
Distan
ce
18
14
10
6
2
Dose(mGy)
-15 -8 0 8 15Distance
-13
-8
0
8
13
Distan
ce
18
14
10
6
2
Dose(mGy)
-15 -8 0 8 15Distance
Distan
ce
18
14
10
6
2
Dose(mGy)
-15 -8 0 8 15Distance
Distan
ce
18
14
10
6
2
Dose(mGy)
-20 -10 0 10 20Distance
-20
-10
0
10
20
Dista
nce
3
2
1
0
-1
-2
-3
γ
-20 -10 0 10 20Distance
-20
-10
0
10
20
Dista
nce
3
2
1
0
-1
-2
-3
γ
-20 -10 0 10 20Distance
-20
-10
0
10
20
Dista
nce
3
2
1
0
-1
-2
-3
γ
EPID dose distribution Gamma EvaluationGamma EvaluationMapCHECK2 dose distribution
-20 -10 0 10 20Distance
-20
-10
0
10
20
Distan
ce
18
14
10
6
2
Dose(mGy) -15 -8 0 8 15
Distance
Distan
ce
18
14
10
6
2
Dose(mGy) -20 -10 0 10 20
Distance
-20
-10
0
10
20
Dista
nce
3
2
1
0
-1
-2
-3
γ
-13
-8
0
8
13
-13
-8
0
8
13
-13
-8
0
8
13
Figure 5.15: Comparison of different fields acquired by EPID and MapCHECK 2 detector.
81

CHAPTER 5. EPID CALIBRATION TO DOSE IN WATER
accordingly. Therefore, image frames are calibrated individually rather than integrally.
Differently, the penumbra correction is based on static kernel which is independent ofbeam modulation and thus, frame by frame correction is not vital to the calibration model.
General commentsChoosing a dosimeter for reference or validation measurement is challenging. There is nosingle dosimeter that matches the sensitive area, resolution and potential accuracy of theEPID. Ion chambers are reasonably accurate for large fields but limited for fields smallerthan 4×4 cm2 [148]. Furthermore, ion chambers cannot provide high resolution measure-ments when used to produce dose profiles due to their relatively large size. Moreover,1D dosimetry using motorized dosimeter movement requires static field irradiation dur-ing scanning. MapCHECK 2 is a 2D array detector based on diodes with a sensitive areaequal to 32 × 26 cm2 and pixel spacing of 7 mm. When comparing with EPID resolution(0.4 mm2), MapCHECK 2 detector is inferior and cannot be used as a reference espe-cially for penumbra correction. Film dosimetry is the most suitable option to match EPIDresolution, but yet, repeatability and accuracy is found to be not sufficient for referencing.Thus, choice of the dosimeter depends on the aim in each step of calibration and valida-tion. Namely, Farmer ion chamber is used for ROAR and large field measurement dueto its reliability and availability. Micro-diamond detector is found to be the best optionfor small fields and penumbra correction. For comparing complex fields, MapCHECK 2detector is used to provide a 2D dose distribution adequate for validation.On a different note, image lag of the EPID system influences the dose per frame, but notthe integrated dose. The acquisition of several frames before and after the irradiation re-leases the burden of modeling the beam-ramp up and the signal fall-off as suggested byother paper [149]. Additionally, the calibration considers low dose irradiation to accountfor single frame dosimetry.
Finally, the proposed method provides the 2D dose distribution with accuracy comparableto reference dosimeters in a water medium but better spatial resolution and set-up timeefficiency. The method is validated for complex and small fields building the basis forvalidation of clinical dose delivery such as IMRT/VMAT.
82

Chapter 6
3D dose reconstruction algorithm
6.1 Introduction
EPID-based 2D dosimetry has been described and validated in the previous chapters en-abling the comparison with in-water dosimetry. Similar results with different methodolo-gies have also been outlined in the literature by several groups (section 3.1.4.1). In prin-ciple, 2D EPID-based dosimetry satisfies the strict requirements of the IMRT QA proce-dures. Features like high spatial resolution, large sensitive area, real-time measurementsand high accuracy make EPID favorite in clinics over conventional dosimeters (e.g. 2D ICarray and 2D diode array). Nonetheless, the validation of these methods do not accountfor gantry rotation. The first generation of dosimeters for 2D verification was designed tobe irradiated with IMRT delivery sequence under static gantry condition. Considering theintroduction of VMAT, a validation under dynamic gantry condition becomes crucial todetermine that the correct dose is delivered at the correct gantry angle. Thus, doses needto be assessed during treatment delivery as a function of time or gantry angle. To thispurpose, researchers working on EPID-based dosimetry proposed assessment methodsrelying on predicting 2D dose distributions per gantry angle and comparing the predictedand measured (calibrated) dose distributions based on control points [79] [150]. Othergroups proposed an EPID-based 3D volumetric dosimetry. The EPID image is convertedto fluence, back-projected upstream and then imported to a TPS or to a forward dose cal-culation engine to calculate the dose delivered either to a phantom or directly the patientCT [67] [117] [151]. However, 2D or 3D EPID-based dosimetry approaches rely on dosecalculation or image prediction. Hence, accurate dosimetry needs careful modeling ofthe dynamics of the MLC, the intensity rate modification, gantry rotation and collimatorrotation employed by VMAT making the forward dose calculation or image prediction achallenge.
For non-EPID-based dosimetry, commercial devices embedding a 2D detector configu-ration for 3D volumetric dosimetry have been adopted, such as Octavius R© 4D (PTW,Freiburg, Germany), Delta4 R© (Scandidos AB, Uppsala, Sweden) and ArcCHECK R©
83

CHAPTER 6. 3D DOSE RECONSTRUCTION ALGORITHM
(Sun Nuclear Corp., Melbourne, FL). These devices rely on interpolation and extrapola-tion algorithms to provide a 3D dose distribution to be directly compared to the treatmentplan. They are currently widely used in clinics owing to their ability to provide clinicalsignificance to patient-specific pre-treatment dosimetric verification thanks to the DVHanalysis, although based on dose interpolation and extrapolation and therefore limited inspatial resolution. Additionally, the usage of these devices has a restriction in setup posi-tioning and timing. Therefore, a fast, simple and accurate 3D volumetric dosimetry, inde-pendent of forward dose calculation, is desirable. This chapter presents an EPID-based,prediction-free approach developed to reconstruct a 3D dose distribution as imparted toa virtual cylindrical water phantom to be used for plan-specific pre-treatment dosimetricverification for IMRT and VMAT treatment plans.
6.2 Material and methods
The 3D dose reconstruction required the definition of two virtual water phantoms. A vir-tual cylindrical water phantom with a diameter and height of 26 cm was placed at theiso-center plane. This phantom was represented by a 256 × 256 × 256 matrix in x, yand z directions with isotropic pixel spacing of 1 mm. Another virtual cylindrical waterphantom with a diameter and height of 32 cm was created as CT DICOM file and insertedas input to the treatment planning system (TPS) (Monaco R© v5.11, ELEKTA OncologySystems, Crawley, UK) to calculate the 3D dose distribution. For EPID reconstruction,the TPS dose calculation engine used for calibration utilizes the Voxel Monte Carlo algo-rithm (XVMC) [152] with 1 mm grid size and nominal uncertainty equal to 0.5%. Thedifferent dimension between the reconstruction and the calculation was meant to excludethe dosimetric complexity accompanying the build-up region. The main idea of the 3Ddose reconstruction is to back-project the planar 2D dose distribution in x and y directionsof the EPID image frame upstream at different depths in z direction, thus obtaining thereconstructed 3D dose distribution. For each z, a series of mathematical operations areapplied to the back-projected 2D dose distribution to eventually obtain the reconstructed3D dose distribution by means of summation. These operations are explained in the fol-lowing.
6.2.1 Geometrical magnification
In back-projection, the planar 2D dose distributions were geometrically demagnified.Since the photon source may be assumed as a point source and the photon beam as diver-gent [15], the area A2 at each depth D2 can be interpolated by knowing the area A1 at anarbitrary depth D1 as shown in figure 6.1(a) according to the following equation:
A2 =(A1 ×D2
2)
D21
(6.1)
84
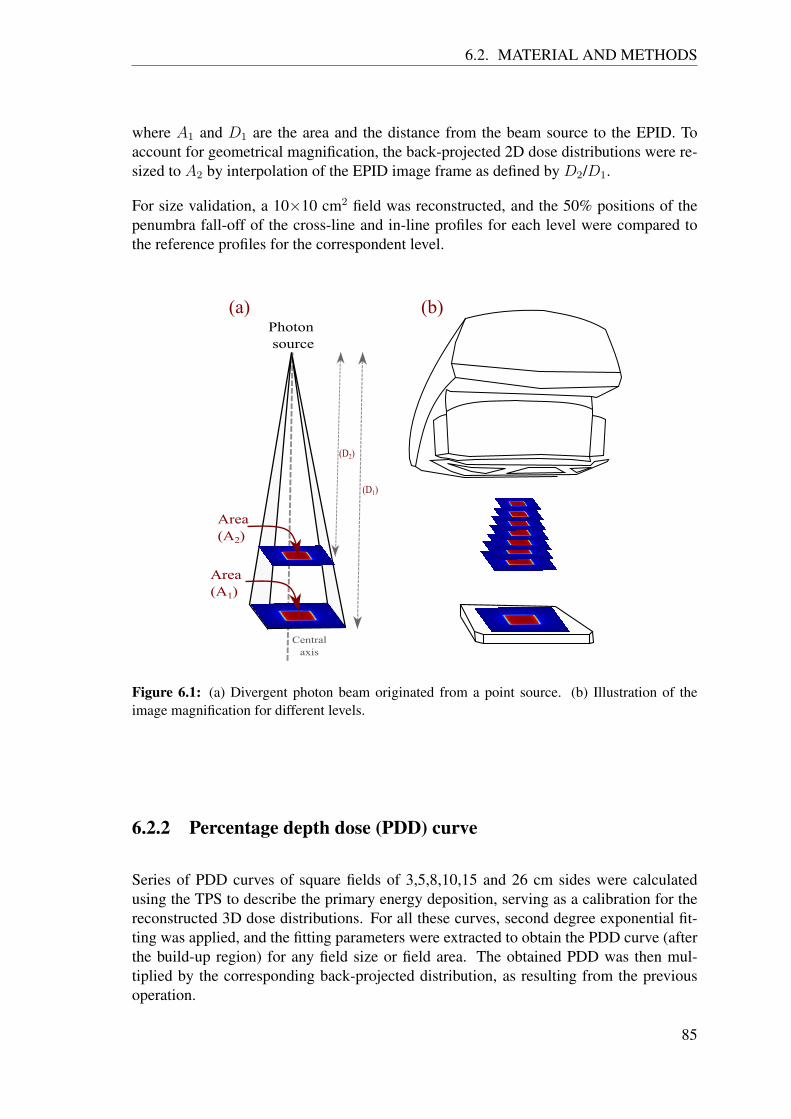
6.2. MATERIAL AND METHODS
where A1 and D1 are the area and the distance from the beam source to the EPID. Toaccount for geometrical magnification, the back-projected 2D dose distributions were re-sized to A2 by interpolation of the EPID image frame as defined by D2/D1.
For size validation, a 10×10 cm2 field was reconstructed, and the 50% positions of thepenumbra fall-off of the cross-line and in-line profiles for each level were compared tothe reference profiles for the correspondent level.
Figure 6.1: (a) Divergent photon beam originated from a point source. (b) Illustration of theimage magnification for different levels.
6.2.2 Percentage depth dose (PDD) curve
Series of PDD curves of square fields of 3,5,8,10,15 and 26 cm sides were calculatedusing the TPS to describe the primary energy deposition, serving as a calibration for thereconstructed 3D dose distributions. For all these curves, second degree exponential fit-ting was applied, and the fitting parameters were extracted to obtain the PDD curve (afterthe build-up region) for any field size or field area. The obtained PDD was then mul-tiplied by the corresponding back-projected distribution, as resulting from the previousoperation.
85

CHAPTER 6. 3D DOSE RECONSTRUCTION ALGORITHM
6.2.3 Depth specific off-axis ratio
Due to the cylindrical shape of the virtual phantom, the off-axis energy deposition relativeto the central axis is described by a depth specific off-axis ratio. A dose distribution withsquare field side of 26 cm (corresponding to 41 cm at EPID level) was calculated usingthe TPS. The same field was used to irradiate the EPID and both the simulated and thereconstructed 3D dose distributions at each depth were normalized to the central dose.The division between both matrices produced the depth specific off-axis ratio, which wasmultiplied to the result of the previous operations.
6.2.4 Depth specific lateral scatter kernel
Square fields of 3, 5, 8, 10, 15 and 26 cm sides were generated using the TPS to describethe lateral scatter kernel for each depth z and each field size to define the reference 2Ddose distributions. The in-line and the cross-line profiles were then compared to the cor-responding profiles in the back projected 2D dose distributions. The difference betweenthe two distributions represented the lateral energy deposition. This scattering effect washandled in a similar fashion as partial volume effect in imaging [153] [154]. An iterativeoptimization algorithm was developed to find size and shape of convolution kernels de-scribing this lateral energy deposition. The two 2D dose distributions were segmented intoa hot region (pixels with values above 15% of the reference maximum dose) and a coldregion (pixels with values lower than 15% of the reference maximum dose). The iterativeoptimization algorithm led to two convolution kernels expressed by a radially symmetricLorentz fitting function with 4 coefficients. The coefficients for each depth and field sizeused for comparison were saved in a look-up table. The iterative optimization procedureis schematically illustrated in figure 6.2 and the code implementation is described in ap-pendix (A). For image frame reconstruction, the field size determined in section 5.1.5 wasused to call the coefficients for each depth and nearest field size. The same segmentationin hot and cold region was applied to the 2D dose distribution. The correction was there-fore implemented as a separated convolution and a subsequent merging of the two regionsto reproduce the reference 2D dose distribution.
6.2.5 Rotation
Time labeling of EPID image frames and gantry angle The reconstructed 3D dose dis-tributions required to be rotated along the in-line direction in accordance with the gantryangle during irradiation. For IMRT technique, the gantry angle had discrete values foreach beam. On the other hand, the continuous irradiation of the VMAT was matched witha continuous variation of the gantry angle and the rotation speed as well. Therefore, anaccurate time labeling of the image frames was required. However, Elekta’s EPID doesnot embed this information in the file header. Thus, the gantry angles were extracted fromthe log file of the linac trajectory, that saves the gantry angle and the time label in the
86

6.2. MATERIAL AND METHODS
Figure 6.2: Schematic illustration of the iterative optimization procedure for a selected depth andfield size. Firstly, the two 2D distributions are segmented to hot and cold regions. Secondly, aniterative optimization is applied to find the best convolution kernel needed to generate the reference2D dose distribution out of the back-projected 2D dose distribution. The resulted kernels are savedin a look-up table.
87

CHAPTER 6. 3D DOSE RECONSTRUCTION ALGORITHM
Unix timestamp format with a time resolution up to 0.25 s. As the EPID also saves theUnix timestamp format, EPID image frames were synchronized and labeled with nearestneighbor (preceding) gantry angle.
Correction for gravitational displacement of the EPID During the gantry rotation, grav-itational force is applied to the EPID causing a mechanical displacement in the cross-line(x) direction. To assess the magnitude of that displacement, 10 × 10 cm2 square fieldswere acquired for the 360 rotational degrees in intervals of 10 degrees each [155]. Byconsidering the central cross-line profile at gantry angle 0 degree as a reference, the po-sition difference of the 50% penumbra fall-off between the reference and the comparingprofiles were recorded. The gantry shift was reported as a function of the gantry angle.The shifts were fitted as a function of gantry angle using the following formula:
displacement = a1 exp(−((theta−a2)/a3)2) (6.2)
where θ is the gantry angle and (a1, a2, a3) represents the amplitude, the position andthe width of the fitting function, respectively. After converting the distance to pixel, thenearest integer to the obtained displacement was used to shift the EPID image frame priorto 3D dose reconstruction.
The overall steps involved in calibration and reconstruction process are outlined in figure6.3.
Figure 6.3: A flowchart of calibration and reconstruction process. The procedure first convertsthe acquired raw image frames into a 2D dose distribution. Secondly, the 2D dose distributionis back-projected upstream at several depths, hence, depth specific (Ds). The back-projected 2Ddose distribution undergoes several mathematical operations to produce a 3D dose distribution ina cylindrical water phantom. The whole process is repeated for each image frame.
88

6.2. MATERIAL AND METHODS
6.2.6 Validation and data analysis
The 3D dose reconstruction was validated with respect to measurements based on Oc-tavius (see 6.4a). Square fields from 3 × 3 cm2 up to 26 × 26 cm2 and several step-and-shoot irradiations were considered. For initial validation of clinical treatment plans, oneIMRT and one VMAT were considered and the 3D dose reconstructions of the treatmentplans were validated against the 3D dose distribution measured and calculated by Oc-tavius. Due to the low spatial resolution of the dose distribution from Octavius (2.5 mm)with respect to the 3D dose reconstruction (1 mm), the 3D dose calculation performedby the TPS at the desired spatial resolution was also considered. Besides, the TPS calcu-lation is not affected by the daily setup uncertainties as the measurements. Hence, dataanalysis considered the TPS as the reference. Furthermore, five IMRT (two head & neck,two prostate and one scalp cases) and five VMAT (head & neck, cervix, brain, pelvis andabdomen plans) were validated as imparted to a virtual water phantom and the 3D dosereconstructions were compared to the 3D dose calculation performed by the TPS in waterphantom using the same calculation engine used for calibration but with grid size equalto 2.5 mm to mimic the QA routine conducted in the clinic.
(a) (b)
Figure 6.4: Picture of (a) Octavius setup (b) In-air image acquisition of EPID during a plandelivery.
89

CHAPTER 6. 3D DOSE RECONSTRUCTION ALGORITHM
Table 6.1: Optimization algorithm for the 4 coefficients of the Lorentz fitting function y(x) = a/((x- b)2 + c) +d, where x represents the radial coordinate of the kernel in pixels.
Field size (cm2)(No. of irradiated pixels)
Depth(cm) Region a b c d
Kernel size(pixels)
Sum of squareddifference (Gy)
Hot 2.76 5.00 4.99 5.00 (3,3) 0.182 2[5865]
5Cold 0.07 0.00 -2.86 2.98 (5,5) 0.08
Hot 0.07 5.00 3.75 4.50 (5,5) 0.195 5[38772]
13Cold -0.04 2.63 -5.00 -5.45 (5,5) 0.30
Hot 0.01 2.31 4.14 4.33 (11,11) 0.8215 15[359099]
25Cold 0.21 0.00 2.50 -2.22 (3,3) 0.28
6.3 Results
6.3.1 Validation of PDD curves
Figure 6.5 shows the comparison between the PDD curves obtained from the recon-structed 3D dose distributions and the reference 3D dose distributions from TPS calcu-lation for different square fields irradiated with 100 MU. The curves highlight the 6 cmdifference in diameter between the virtual phantom used for 3D dose reconstruction andthe one used for the TPS calculation. The 2D gamma evaluation between the correspond-ing 3D dose distributions using (3%, 3 mm) criteria resulted in 100% passing rate. Inhere, the gamma evaluator was allowed to search circularly (not spherically) in cross-line(x) and in-line (y) directions for each depth (z). The gamma index profiles along the zcoordinate are plotted in the lower panels of figure 6.5.
6.3.2 Validation of depth specific lateral scatter kernel
The central cross-line dose profiles comparing the reconstructed 3D dose distributions andthe reference 3D dose distribution from TPS calculation for square field sides of 2, 5, 10,15 and 26 cm are shown in figure 6.6. The gamma evaluation between the corresponding3D dose distributions using (3%, 3 mm) criteria resulted in 100% passing rate. Similar tothe 2D gamma evaluation conducted in section 6.3.1, the cross-line gamma index profilesare plotted in the lower panels of figure 6.6. The penumbra of the profiles demonstratesthe accuracy of the optimization algorithm. Table 6.1 shows the results of the optimizationalgorithm for the 4 coefficients of the Lorentz fitting function for selected field sizes anddepths, distinguished in hot and cold regions. Figure 6.7 shows an example of a recon-structed 3D dose distribution of 5×5 cm2 field, compared to 3D distribution calculatedusing TPS.
90

6.3. RESULTS
Figure 6.5: PDD curves of different square fields as obtained from the reconstructed 3D dosedistributions and the reference 3D dose distribution from TPS calculation annotated with scatterplot of the gamma index resulted from evaluation between each corresponding profiles.
91

CHAPTER 6. 3D DOSE RECONSTRUCTION ALGORITHM
Figure 6.6: Central cross-line profiles at the iso-center of square fields of different field sizes asobtained from the reconstructed 3D dose distributions and the reference 3D dose distribution fromTPS calculation annotated with scatter plot of the gamma index resulted from evaluation betweeneach corresponding profiles
92

6.3. RESULTS
Figure 6.7: Different views of 3D dose distributions of 5×5 cm2 field calculated using TPSand reconstructed from EPID image frames followed by gamma comparison between the twodistributions.
93

CHAPTER 6. 3D DOSE RECONSTRUCTION ALGORITHM
6.3.3 Time labeling of EPID image frames and gantry angles com-bined with correction for gravitational displacement of theEPID
The time labeling of EPID image frames and gantry angles enables the integration ofreconstructed 3D dose distributions as a function of time and gantry angle. Figure 6.8shows an example of recorded messages plotted against acquisition time obtained fromthe EPID header file and linac log file.
0 20 40 60 80 100 120 140 160 180 200Message number
15:56:30
15:57:00
15:57:30
15:58:00
15:58:30
15:59:00
15:59:30
16:00:00
Tim
e (
hh
:mm
:ss)
EPID headerlinac log file
20 21 22 23 24 25 26 27 28Message number
15:56:51
15:56:52
15:56:53
15:56:54
15:56:55
15:56:56
15:56:57
Tim
e (
hh
:mm
:ss)
EPID headerlinac log file
(a) (b)
Figure 6.8: (a) Linac log file and EPID header file messaging time labels recorded during a VMATdelivery. (b) Zoomed of the time labels of (a).
For gravitational displacement correction, figure 6.9 shows the recorded EPID gravita-tional displacements along the cross-line direction per angle in 10 degree steps. Thefitting parameters are: a1= 10.3, a2= 181.4 and a3= 102.6 resulting in residual R2 valueequal to 0.99.
To test the labeling correctness, two separated rectangular shaped fields is created andplanned for continuous irradiation during the 360◦ rotation of the linac gantry resulting intorus shape 3D dose distribution. The reconstructed image frames were rotated utilizingthe gantry information extracted from the linac log file. Figure 6.10 shows that the inte-grated distributions compared with Octavius measurement using gamma evaluation with(3%, 3 mm) criteria resulted in ≈ 96% passing rate.
Figure 6.11 shows an example of reconstructed 3D dose distributions integrated over time,acquired during a cervix treatment plan for QA delivery purposes.
6.3.4 Validation and verification of clinical treatment plans
6.3.4.1 Validation
Figures 6.12 and 6.13 show different views of the reconstructed 3D dose distributions incomparison to those produced by Octavius and the TPS for prostate IMRT and head and
94

6.3. RESULTS
0 50 100 150 200 250 300 360
Gantry angle (degree)
0
1
2
3
4
5
6
7
8
9
10
11
12
Th
e r
ela
tive d
isp
lacem
en
t (p
ixels
)
EPID displacement
Fitting curve
Figure 6.9: Detected and fitted cross-line shifts of the EPID as a function of the gantry angle.
-3
-1
0
1
2
3
Axial planeSagittal planeCoronal plane
Octa
viu
sm
easu
rem
en
tR
eco
nst
ructe
dd
ose
im
ag
e γ
Eva
luat
ion
Oct
vs
Rec
γ
Gy
0
0.2
0.4
0.6
0.8
1
1.2
1.4
1.6
1.8
2
0
0.2
0.4
0.6
0.8
1
1.2
1.4
1.6
1.8
2
Figure 6.10: A torus shaped field measured by Octavius and reconstructed from EPID imageframes followed by gamma comparison between the two 3D dose distributions.
95

CHAPTER 6. 3D DOSE RECONSTRUCTION ALGORITHM
Figure 6.11: Axial views of reconstructed 3D dose distributions integrated over time during QAprocedure of VMAT cervix treatment plan. The distribution sequence was resolved in 0.57 fps forillustrating purposes.
96

6.4. DISCUSSION AND CONCLUSION
Table 6.2: Passing rates of the global gamma evaluation with (3%, 3mm) criteria for differentIMRT and VMAT plans between the reconstructed 3D dose distribution and the TPS calculation
IMRT Plan passing rate VMAT Plan passing rateHead & neck
(case #1) 99% Head & neck 95%
Head & neck(case #2) 99% Cervix 95%
Prostate (case #1) 99% Brain 99%Prostate (case #2) 98% Pelvis 96%
Scalp 97% Abdomen 96%
neck VMAT plan, respectively. The global gamma evaluation with (3%, 3 mm) crite-ria, applied between the reconstructed 3D dose distribution and both Octavius measure-ment and TPS calculation, is shown in the figures for both treatment plans. The recordedpassing rates were 99% and 95% for the IMRT, and 96% and 93% for the VMAT plan,considering TPS calculation and Octavius measurement, respectively.
6.3.4.2 Verification of different IMRT and VMAT plans
Table 6.2 shows the result of the global gamma evaluation with (3%, 3 mm) criteria be-tween the reconstructed 3D dose distributions and the TPS calculations for five IMRTplans and five VMAT plans. The median passing rates recorded for the 10 plans was 97%and the lowest rate recorded was 95% for head & neck and cervix VMAT treatment plans.
6.4 Discussion and conclusion
The goal of this chapter is to reconstruct a 3D dose distribution as back-projected from the2D dose distribution in water obtained from EPID image. The method was developed asan inverse problem solving, making use of step by step optimization algorithms relying onthe physics behind each step. As inverse problem, each optimization algorithm searchespararmeters that enable a certain model to match the observation (i.e. the reference mea-surement). Hence, solving the inverse problem requires a reliable reference. In clinics,obtaining a 3D distribution of dose in a cylindrical water phantom with high accuracy andgood resolution is challenging. A trade-off between accuracy, spatial resolution and 3Ddistributions has to be considered to reach the optimum solution for QA proposes. TheOctavius was the best available option to provide a reference measurement. In additionto its relatively poor resolution, Octavius measurements failed to give 100% passing ratewhen comparing with TPS calculations for IMRT and VMAT plans using gamma evalu-ation. Thus, referencing Octavius leads to additional deviations from TPS calculations.Accordingly, the 3D dose distribution generated by the TPS was considered to be thereference for the proposed calibration. However, details on the specific discussions and
97

CHAPTER 6. 3D DOSE RECONSTRUCTION ALGORITHM
Axial planeSagittal planeCoronal plane
TP
S
Plan
-3
-1
0
1
2
3
-3
-1
0
1
2
3
TP
S
Pla
n
Octa
viu
s
measure
ment
Reconstr
ucte
d
dose i
mage
Ev
alu
atio
n T
PS
vs
Rec
Evalu
ati
on
Oct
vs R
ec
0
0.2
0.4
0.6
0.8
1
1.2
1.4
1.6
1.8
2
Gy
0
0.2
0.4
0.6
0.8
1
1.2
1.4
1.6
1.8
2
0
0.2
0.4
0.6
0.8
1
1.2
1.4
1.6
1.8
2
(a)
(b)
Figure 6.12: (a) Coronal, sagittal and axial views of 3D dose distributions of prostate (case #1)IMRT calculated by the TPS, measured by Octavius (Oct) and reconstructed (Rec) from EPID. (b)Different views of 3D gamma evaluation between the 3D dose distributions of the TPS calculationand reconstructed from EPID and between the 3D dose distributions of the Octavius measurementand reconstructed from EPID.
98

6.4. DISCUSSION AND CONCLUSION
Axial planeSagittal planeCoronal planeT
PS
Pla
n
Octa
viu
s
measure
ment
Reconstr
ucte
d
dose i
mage
Evalu
ati
on
TP
S v
s R
ec
Evalu
ati
on
Oct
vs R
ec
0
0.2
0.4
0.6
0.8
1
1.2
1.4
1.6
-3
-1
0
1
2
3
-3
-1
0
1
2
3
Gy
0
0.2
0.4
0.6
0.8
1
1.2
1.4
1.6
0
0.2
0.4
0.6
0.8
1
1.2
1.4
1.6
-3
-1
0
1
2
3
-3
-1
0
1
2
3
(a)γ
Eval
uat
ion
TP
S v
s R
ec
γE
valu
ati
on
Oct
vs R
ec
(b)
Figure 6.13: (a) Coronal, sagittal and axial views of 3D dose distributions of head and neckVMAT calculated by the TPS, measured by Octavius (Oct) and reconstructed (Rec) from EPID. (b)Different views of 3D gamma evaluation between the 3D dose distributions of the TPS calculationand reconstructed from EPID and between the 3D dose distributions of the Octavius measurementand reconstructed from EPID.
99

CHAPTER 6. 3D DOSE RECONSTRUCTION ALGORITHM
assumption that were made for each step are outlined below.
6.4.1 Geometric magnification
Geometric magnification determines the resizing factor for each depth resulting in 2D im-age pixel sizes of odd or even numbers. When back-projecting, the resized smaller imagewas aligned to the center of the previous image. The difference between the two imagesizes at the edges was filled with zeros. As the difference could be odd or even, a shift ofone pixel in either x or y directions was required. The correct shift direction was decidedupon the reference penumbra position. When comparing, the 50% positions for somelevels located between two pixels. The shift direction considered the nearest position wasyielding a sub-millimeter shift from the correct position. The shifting effect appeared inlow depth levels (away from EPID) where interpolation is highest and data were missingdue to the decrease in resolution as shown in figure 6.7. Optimizing the geometric mag-nification is feasible by increasing the spatial resolution of the reference 3D images andinterpolate the value at the desired pixel position. An attempt towards the improvementof geometric magnification was implemented. Particularly, the spatial resolution of the3D image was increased to accommodate the smallest resizing. However, the additionalcomputational resources required by that, including computation time, could not justifythe negligible improvement of the outcome.
6.4.2 PDD curves and lateral dose profile
The comparison between the reconstructed 3D distributions and reference distributionsresulted in ≈ 100% passing rate using gamma evaluation. However, a less than 0.5%deviation was noticed at the phantom edges due to the deviation in fitting functions usedfor reconstruction. Nonetheless, Despite testing different fitting functions in an effort toimprove the results, similar residual R2 values were obtained.
For the lateral dose deposition, the optimization algorithm generates kernels that producedose distributions comparable to the reference. When comparing lateral profiles, gammaindex showed ≈ 100% passing rate (figure 6.6). Though, the effect of hot- and cold-image recombination appears at the 15% dose level for each field. Smoothing the fall-offpattern can be performed but requires additional interpolation with no significant impacton the comparison.
6.4.3 Time labeling efficiency and the correction for gravitationaldisplacement
Figure 6.8 shows recorded messaging time generated by the linac control system andEPID acquisition system with millisecond resolution. The not perfect linearity noticed in
100

6.4. DISCUSSION AND CONCLUSION
messaging times of linac trajectory in addition to the offset in clock synchronization havenegligible impact on time labeling especially when rounding the temporal resolution tohundreds of millisecond required for our proposes.
With default gantry rotational speed in VMAT delivery of about 1 degree per second andaround 2.5 messages per second, the uncertainty of frame labelling is around±0.4 degreein comparison to ±1.5 degree for Octavius [156]. The difference between the labelingaccuracy was noticed in torus field test (figure 6.10). In addition to the effect on matrixrotation, labeling image frames with gantry angles enable correcting for the gravitationaldisplacement of the EPID which was found to be up to 4 mm. The correction has apositive impact on gamma evaluation when using static gantry irradiation (IMRT) andcontinuous irradiation (VMAT).
6.4.4 Validation
For validation of clinical plans, gamma evaluation with (3%, 3 mm) criteria was used dueto its ability to detect various dosimetric deviations [61]. The comparison was conductedagainst detector measurement and dose calculation. As the accuracy of the reference mea-surement affects the evaluation of the obtained results, the 3D dose reconstruction con-sidered the 3D dose distribution from TPS calculation as a reference due to its achievablespatial resolution. However, since the calibration relied on TPS calculations, the discrep-ancies noted in the gamma evaluation (figure 6.12(b) and 6.13(b)) between Octavius andthe 3D dose reconstruction were expected [157]. The evaluation for the different IMRTand VMAT plans in table 6.2 showed a passing rate exceeding the common tolerance level(i.e. 95%) [158] for the selected treatment plans.
Finally, as mentioned earlier, the 3D dose reconstruction relied on inverse problemsolving. Each step contributes to the overall accuracy as well as to the overall acquisitiontime of the proposed methodology. For instance, EPID is characterized by a dose rate de-pendency which affects the accuracy of the reconstructed 3D dose distribution of VMATtreatment plans. In this study, no dose rate dependency corrections are performed. Themaximum deviation of the cumulative dose detected by EPID with respect to ion cham-ber measurements is estimated to be ≈ 1.5%. A correction for dose rate dependency isexpected to improve results in terms of gamma evaluation, reaching passing rates com-parable to IMRT treatment plans. However, it extends the calibration time and requiresadditional information from the linac log file.
101


Chapter 7
Sensitivity analysis of EPID-based 3Ddose reconstruction
7.1 Introduction
The proposed method has been validated for dosimetric accuracy for complex clinicalplans. However, the rationale of this thesis is to establish a sensitive tool for plan-specificdose delivery QA. In general, the sensitivity of such tool quality is evaluated by its mer-its to catch errors before the dose delivery. Through the radiation therapy chain, dosedelivery is vulnerable to several types of errors especially with the introduction of com-plex treatment techniques. IMRT and VMAT, for example, exploit various mechanicaland dosimetric degrees of freedom making the precise interplay and coordination of eachparameter essential for correct dose delivery. Hence, current technology offers numerouserror sources. The goal of this chapter is to investigate the sensitivity of an EPID-based3D dose reconstruction algorithm to detect geometric and dosimetric errors in VMATplans.
7.2 Material and methods
A typical VMAT plan for head & neck case was generated using the TPS (Monaco R©v5.11, ELEKTA Oncology Systems, Crawley, UK). The plan was delivered using thelinac and the image frames were acquired during delivery using the calibrated EPID. Theacquired frame images were reconstructed to a 3D dose distribution with 1 mm isotropicresolution using the developed algorithm from chapter 6. The resulted distribution wasevaluated against the TPS dose distribution in a cylindrical water phantom. In parallel,intentional dosimetric and geometric errors were introduced in the original treatment plan.
For geometric sensitivity testing, firstly, two selected neighboring leaves were shifted
103
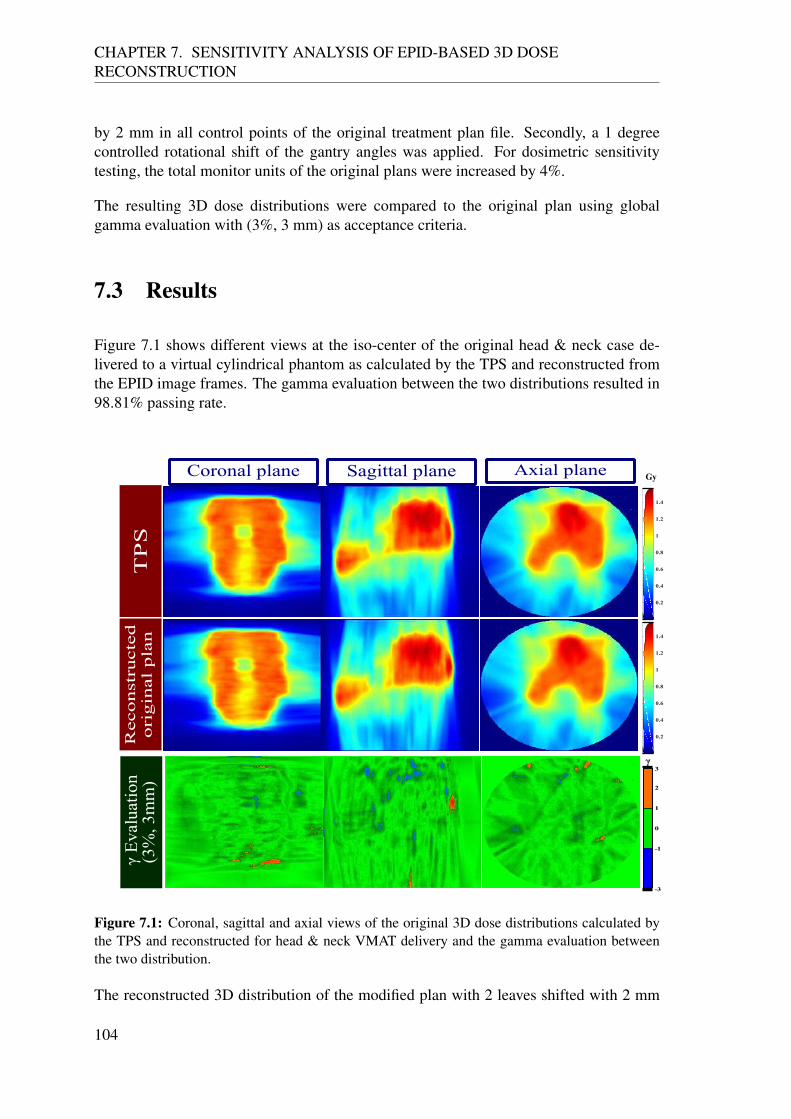
CHAPTER 7. SENSITIVITY ANALYSIS OF EPID-BASED 3D DOSERECONSTRUCTION
by 2 mm in all control points of the original treatment plan file. Secondly, a 1 degreecontrolled rotational shift of the gantry angles was applied. For dosimetric sensitivitytesting, the total monitor units of the original plans were increased by 4%.
The resulting 3D dose distributions were compared to the original plan using globalgamma evaluation with (3%, 3 mm) as acceptance criteria.
7.3 Results
Figure 7.1 shows different views at the iso-center of the original head & neck case de-livered to a virtual cylindrical phantom as calculated by the TPS and reconstructed fromthe EPID image frames. The gamma evaluation between the two distributions resulted in98.81% passing rate.
Axial planeSagittal planeCoronal plane
Reco
nst
ructe
do
rig
inal
pla
nT
PS
γ E
valu
atio
n(3
%, 3
mm
)
-3
-1
0
1
2
3γ
0.2
0.4
0.6
0.8
1
1.2
1.4
0.2
0.4
0.6
0.8
1
1.2
1.4
Gy
Figure 7.1: Coronal, sagittal and axial views of the original 3D dose distributions calculated bythe TPS and reconstructed for head & neck VMAT delivery and the gamma evaluation betweenthe two distribution.
The reconstructed 3D distribution of the modified plan with 2 leaves shifted with 2 mm
104

7.4. DISCUSSION AND CONCLUSION
and its gamma evaluation against the original plan is showed in figure 7.2. The evaluationresulted in passing rate 91.72%.
Axial planeSagittal planeCoronal plane
γ E
valu
atio
nT
PS
vs
RE
C
γ
0.2
0.4
0.6
0.8
1
1.2
1.4
Gy
3
2
1
0
-1
-2
-3
Reconst
ructe
d 2
mm
2 l
eaves
shif
ted p
lan
Figure 7.2: Different views of the reconstructed 3D distribution at the corresponding slice of themodified plan with 2 leaves shifted with 2 mm and the gamma evaluation against the original plan.
The reconstructed 3D distribution of the modified plan with 1◦ rotational shift and itsgamma evaluation against the original plan is showed in figure 7.3. The evaluation re-sulted in passing rate 96.33%.
The reconstructed 3D distribution of the modified plan with additional 4% dose is shownin figure 7.4 along with the gamma evaluation against the original dose distribution cal-culated by the TPS. The gamma evaluation resulted in 76.55%.
7.4 Discussion and conclusion
The head & neck VMAT case was considered for the sensitivity test due to the associatedcomplexity including a wide range of fields sizes, dose rates and the full rotation of thegantry. In principle, the sensitivity of the algorithm should be higher for less complicatedplans in terms of field sizes, dose rates and gantry angles (e.g. brain VMAT, head & neckIMRT etc). The design of the test conducted in this chapter regarded those parametersrequired to be verified in a patient specific QA [61]. Namely, verification of MUs, datatransfer, and dose delivery. Moreover, the sensitivity test was designed to check the feasi-bility of the proposed reconstruction methodology to detect mechanical malfunctioning.
The gamma evaluation was used for analysis due to its simultaneous criteria of geometric
105

CHAPTER 7. SENSITIVITY ANALYSIS OF EPID-BASED 3D DOSERECONSTRUCTION
Axial planeSagittal planeCoronal plane
γ E
valu
atio
nT
PS
vs
RE
C
3
2
1
0
-1
-2
-3
γ
0.2
0.4
0.6
0.8
1
1.2
1.4
Gy
Reco
nst
ructe
d1
° r
ota
ted
pla
n
Figure 7.3: Different views of the reconstructed 3D distribution at the iso-center of the modifiedplan with 1◦ rotational shift and the gamma evaluation against the original plan.
Axial planeSagittal planeCoronal plane
γ E
valu
atio
nT
PS
vs
RE
C
γ
Gy
Reco
nst
ructe
d 4
%
ov
erd
ose
pla
n
0
0.2
0.4
0.6
0.8
1
1.2
1.4
1.6
3
2
1
0
-1
-2
-3
Figure 7.4: Different views of the reconstructed 3D distribution at the iso-center of the modifiedplan with 4% over dose and the gamma evaluation against the original plan.
106

7.4. DISCUSSION AND CONCLUSION
and dosimetric differences. The values chosen for the evaluation criteria (i.e. 3% and3mm) were assessed after having explored several values, the chosen evaluation criteriaproduced the desired sensitivity matching the accuracy achieved by the methodology. Thealgorithm demonstrated to be capable of catching geometric errors of MLC in order of 2mm, gantry angle shift of 1 degree and dosimetric error of ±4%.
In particular, when shifting the two leaves 2 mm away from the original position, the pass-ing rate was reduced by 7.09%. Using a 3D visualization of the gamma index distribution,position and deviation were detected. For rotational shift, the passing rate reduction wasrelatively small (i.e. 2.48%) leaving overall passing rate above the threshold (i.e. 95%).Though, the rotational shift effect was visible in the 3D visualization.
For the dosimetric sensitivity test, the additional 4% dose caused a reduction of the pass-ing rate equal to 22.26%. The overdose was indicated in the high dose region while minoreffect was observable for the low dose region.
For both geometric and dosimetric parameters, stricter gamma criteria can in principleincrease the sensitivity to errors. However, since the development of the reconstructionalgorithm was designed to pass the gamma evaluation with (3% and 3mm) criteria, thedistinction between the deviation related to accuracy or to error in delivery (less thanintroduced in this chapter) becomes more challenging.
On the other hand, the required sensitivity depends on the clinical relevance of the devi-ation. In particular, the sensitivity of the proposed methodology meets the requirementused by our clinic.
107


Chapter 8
Discussion and outlook
The primary objective of this work was to develop a patient-specific QA tool based onEPID. The dosimetric characterization of the used EPID showed technical challengeswhen using it as a dosimeter in clinical practice. Some of the challenges were relatedto the physical properties of a-Si detectors such as their non-water equivalent energyresponse. Other challenges were related to a specific model of EPID or image acqui-sition software from a particular vendor. The difference between models was presentedby comparing dosimetric properties of different EPIDs reported in the literature. Accord-ingly, a novel method for converting 2D images to dose in water specific for the adoptedmodel was developed. The calibration method was validated for complex radiation fieldsagainst different dosimeters. Consequently, a 3D dose reconstruction method was devel-oped based on a series of mathematical operations. The method was solely dependenton the TPS during calibration. As a result, a prediction free 3D dose distribution wasobtainable with good accuracy and high spatial resolution even for complex fields. Thereconstructed 3D dose distributions of clinical IMRT and VMAT plans were validatedagainst measurements and dose calculation resulting in passing rates that exceeded therecommended limits. The overall method of calibration and reconstruction proved to besensitive to clinically relevant geometric and dosimetric errors, thus making the approacha good choice for plan-specific QA thanks to superior spatial resolution and comparableaccuracy with respect to a commercial dosimeter. Additionally, in air acquisition of im-ages paves the way towards fully automation of a pre-treatment QA procedure. During themethod development process, image acquisition and dose reconstruction were performedon two separate computers. However, in order to achieve the minimum human interven-tion, a simple interface was developed for image acquisition and dose reconstruction insingle PC dedicated to EPID dosimetry. For daily clinical pre-treatment QA routine, theQA procedure required only EPID unfolding and alignment to the center of the field.Then the in-air acquisition of the image frames is performed by one click. Currently, the3D dose reconstruction takes roughly 8 seconds for each image frame. For instance, theirradiation of the head & neck VMAT treatment plan took about 3.7 min and resultedin 510 image frames. By using a personal computer equipped with a 3.40 GHz CPU(Intel R© Core TM i7-6700) and 32.0 (GB) RAM, the 3D dose reconstruction required
109

CHAPTER 8. DISCUSSION AND OUTLOOK
about 45 min. Parallel computing on a multi-cores computer can considerably reducethe computation time of repetition cycle (i.e. ”for loop”). On the other hand, the cali-bration processes currently requires human intervention in several steps. The calibrationapproach relied on mathematical operations (namely: curve fitting, interpolation ...) andoptimization algorithms. As outlined in appendix (A), the optimization is designed togenerate convolution kernels converting an input image to the desired output. The opti-mization algorithm searches for the single global minimum in the parameter space. Theconvergence between global or local minima depends on several factors such as the op-timization algorithm and the abundance of available information on the parameter space.For each step, an optimization algorithm was implemented so that the overall calibrationapproach results as a serious of operations to be performed.
Machine learning algorithm (ML) is a group of computational methods that make use ofstatistical information about input data to achieve a desired task -without being explicitlyprogrammed- or to produce a particular outcome [159] [160]. Ideally, ML can emulatehuman decision making after conducting several learning mechanisms to reach the ulti-mate goal. ML can be applied to any desired discipline in different forms. Envisioning anML application to the proposed calibration process, three components could be identified:1) statistical modeling of the parameters, 2) evaluation of the outcome based on initial pa-rameters and 3) optimization of the initial parameters. The logic flow-chart of the processis similar to the optimization process used in the calibration. However, the current opti-mizer deals with a single parameter for each calibration step. For ML, all the steps couldbe accounted for in a set of parameters, and the learning process is supervised to reachthe ultimate goal. Using the high number of iterative cycle, the optimal combination ofconvolution kernels and fitting functions could be obtained without human intervention.
8.1 Plan evaluation
In this thesis, gamma evaluation was the adopted method to assess the quality of the dosedelivery in comparison to the planned one. The acceptance criteria were chosen in accor-dance to recommendations and general guidance reported in literature [61]. A recentlypublished report by AAPM considered different QA programs practiced in numerous clin-ics [161]. Several IMRT patient-specific QA programs and evaluation methods usingdifferent types of dosimeters have been reported. Each of these clinics determines theirtolerance limits in conjunction with other metrics to serve the final goal of the QA pro-gram taking into consideration the technical boundaries of the used QA tool. The reportrecommends that a universal tolerance limit of gamma passing rate of ≥ 95% with (3%,2 mm) should be considered. However, this tolerance limit in gamma evaluation resultedtoo strict for the accuracy of the proposed method, which would require a refinement. Onthe other hand, some researchers have criticized the gamma evaluation standalone, statingthat it cannot predict clinically relevant error [162]. In particular, the passing rate metriccould not distinguish between insignificant low dose error and significant overdose to or-gans at risk. Therefore, DVH has been introduced as an essential tool for patient-specific
110

8.2. TOWARD A COMPREHENSIVE PATIENT-SPECIFIC PRE-TREATMENT QA
QA. As deriving the DVH requires 3D dose distribution, 2D detectors were developedto reconstruct a 3D distribution. Commercial devices currently could provide such a dis-tributions but, yet, they are based on dose interpolation and extrapolation and thereforelimited in spatial resolution. A major concern when using the 3D distributions for gen-erating DVHs is that they are measured (and interpolated) in a water equivalent phantomwith iso-center and material composition different than those of the patient. This affectsthe accuracy of the DVH, considering that DVH has been introduced to evaluate the dosecalculation accuracy. Validation of the dose calculation accuracy has a fundamental rolein patient-specific QA. However, current TPS do not include an accurate modeling ofthe MLC and surrounding collimators [18] [163]. Besides, dose calculation based onanalytical algorithms proved to have uncertainty up to 4.9% in inhomogeneous phantom[164]. Consequently, the usage of an accurate, independent and machine-specific dosecalculation engine is essential for implementing an integrated patient-specific QA. Forthis reason, we put forward a new approach in QA procedures composed by two separatestages: a plan-specific dose delivery and a patient-specific dose calculation.
8.2 Toward a comprehensive patient-specific pre-treatment QA
As demonstrated in this thesis, reconstruction of 3D dose distributions using EPID pro-vided a robust tool for plan delivery verification of complex treatment plans. The methodwas proved to be sensitive to geometric and dosimetric errors prone to be generated bymis-transferring of data between planning and controlling systems or malfunctioning oflinac components. The integrity of the dose calculation within the patient anatomy wouldneed an additional tool for verification. To this purpose, an equipment-specific MC model(implemented in GEANT4) was developed in the framework of another phd project for theElekta Agility collimator (see 8.1)[55]. The model was used for simulations of the dosedistribution of IMRT and VMAT treatment plans in a patient CT. The model includesdetailed features of each component in the linac head and t is embedded in a code thatconverts the DICOM file of the patient CT to attenuation coefficients at the exact positionof the patient. Furthermore, the code reads the RTPLAN DICOM file and translates theinformation to parameters used for MLC positions, dose rates and gantry angle. Althoughthe model is still in the validation phase, the dose calculation accuracy is potentially betterthan analytical based calculation engines. Once the model is validated for homogenousand inhomogenous phantom, it could be used for patient-specific pre-treatment verifica-tion of dose calculation. Furthermore, the calculation of the DVH would gain in accuracy,being based on the accurate modeling of patient anatomy.
This dose calculation verification together with the plan-specific QA tool developed inthis thesis would make the pre-treatment QA more robust and sensitive to errors that couldoccur in the radiation therapy work-flow. A flowchart of the proposed QA procedure (andits two constitutional stages) is outlined in figure 8.2.
111

CHAPTER 8. DISCUSSION AND OUTLOOK
Figure 8.1: The GEANT4 model of the ELEKTA synergy linac and the CT of a water phantom(courtesy S. Veloza and J. Martin).
Pre-treatment QA
Patient specific QA Plan specific QA
Dose delivery
EPID based 3D dose reconstruction
Dose calculation
MC dose calculation based on GEANT4
Figure 8.2: A flowchart of the pre-treatment QA procedure and its two constitutional stages.
112

8.3. IN-VIVO DOSIMETRY
However, the drawback of the MC implementation for dose verification is the computa-tional time required to achieve statistically adequate accuracy and precision. Currently,the developed model needs a few hours to simulate a full IMRT treatment plan. The sim-ulation time is set to be reduced significantly using parallel computing. In order to notaffect clinical routine, the MC calculation could be performed overnight. Though, parallelcomputing opens opportunities for more time efficient QA procedures.
8.3 In-vivo dosimetry
EPID-based in-vivo dosimetry has proliferated in the past few years. The final aim isto provide an accurate and independent dose verification of the treatment delivery. Inaddition to sensitivity to errors in dose calculation, data transfer, and dose delivery asin pre-treatment QA, in-vivo dosimetry would enable the identification of errors gener-ated by patient setup and changes in patient anatomy. However, current applications ofEPID-based dosimetry are focused on pre-treatment dose verification and applications forin-vivo dosimetry are still limited. In brief, the proposed concept for EPID-based in-vivodosimetry relies on either predicting images at the EPID level through patient anatomyextracted from the treatment planning CT or estimating fluences from the EPID image toforward calculate the dose as imparted in the patient CT. The ability of both approachesto detect errors undetectable by a solely pre-treatment QA has been demonstrated bydifferent groups [120] [123] [135]. All these methods were very sensitive to anatomi-cal changes. Although this is one of the main advantages of in-vivo over pre-treatmentdosimetry, the interpretation of observed differences between measured and predicted 3Ddose distributions is complicated. Since the in-vivo methods rely on the treatment plan-ning patient CT, the generated dose distribution is valid for dose verification only andis not representative of the ”true” dose delivered to the patient. Consequently, when adeviation is detected, the decision making for re-planning or other adaptive strategiesis performed qualitatively by visual inspection of the CBCT acquired prior to treatment[165]. Indeed, implementing the in-vivo dosimetry provides a better safety net for thetreatment delivery in comparison to full dependence on pre-treatment QA. However, it isstill a dosimetric verification tool rather than independent dosimetry, and its accuracy isassociated with good modeling of the linac components and modulation (e.g. MLC move-ment) and patient anatomy. As an alternative approach to EPID-based in-vivo dosimetry,the proposed comprehensive patient-specific QA, including the plan-specific QA objectof this thesis work, is planned to be implemented in our clinic.
The rationale for in-vivo dosimetry is to verify patient setup and patient anatomy whichhave not been verified by the patient-specific QA. The proposal is based on using a dailyCBCT acquired prior to dose delivery with interpolated MLC positions from EPID imagesand doses measured by linac monitor chambers. All these data are imported into themachine-specific MC calculation engine to generate a 3D dose distribution. Thus, theproposed in-vivo dosimetry is independent of TPS calculation or patient planning CT. Thegenerated 3D dose distribution can be compared to the planned distribution using gamma
113

CHAPTER 8. DISCUSSION AND OUTLOOK
evaluation or DVH. Consequently, in case of detected deviation, the decision makingcan be guided by quantitative evaluation with higher confidence level. Additionally, thein-vivo 3D dose distributions of both fraction by fraction and/or dose accumulation canbe stored and used for auditing purposes. The feasibility and proof of concept of thisproposal are yet to be tested. Factors like the additional dose due to imaging to the patient,the extended computational time and the added workload on staff have to be consideredwith respect to the outcome benefit.
114

Chapter 9
Conclusion
Treating cancer tumor with photon radiation has begun nearly a century ago. As the tech-nology proliferated in the last two decades, the techniques of delivering radiation dosehave been enormously developed in terms of accuracy and precision. The improvementhas made use of complex auxiliary systems attached to the linac aiming at the best con-forming of the dose to the tumor in conjunction with the best dose sparing of healthytissues. Currently, the delivery of the radiation dose reached an unprecedented level ofaccuracy, thanks to the advancement in linac mechanics and its control system along withits authentic dose calculation engine. However, in order to fully exploit the anticipatedadvantages of the accuracy of the current technology, a robust QA program has to be con-ducted. As the introduction of supporting systems to the treatment chain increases, newmeasures for the QA program has to be introduced as well. Yet, this accompaniment isnot optimum since the development of the QA methods and apparatus has been slowerthan the treatment technology.
For complex treatment delivery techniques in radiation therapy such as IMRT/VMAT, apatient-specific QA approach has been recommended. This approach requires, in additionto independent dose calculation engine, a dosimetry system with high accuracy and res-olution and preferably able to generate a 3D dose distribution. Dosimeters with such (orapproaching these) characteristics are commercially available but with the limitation ofincreased set-up time. The EPID, a built-in imaging detector in most modern linacs posespotential dosimetric features. In this thesis, the dosimetric features of a specific EPID havebeen explicitly investigated. Making use of the knowledge gained from EPID characteri-zation, a method to calibrate EPID to be used as a dosimeter in water has been presented.Converting a the 2D image, as acquired from EPID, into a 2D dose distribution enables thecomparison with reference dosimeters. The accuracy of the calibration method has beenvalidated for regular QA tests and real clinical scenarios. As this calibration presents auseful tool for QA programs, the advantage of producing 2D dose distributions with highaccuracy and resolution with no need for human intervention in either detector positioningnor passive processing (as in films and TLDs). In fact, the trend of QA tool developmenttends to march toward 3D dosimetry. Accordingly, a novel approach to reconstruct a
115
CHAPTER 9. CONCLUSION
3D dose distribution from 2D dose distributions has also been developed in this thesis.A series of mathematical operations have been explicitly implemented to generate a 3Ddistribution matching the desired spatial resolution and having comparable accuracy withthe TPS dose calculation. The operations resulted in an algorithm that back-project the2D dose distributions at different levels thus forming (reconstructing) a 3D dose distribu-tion. Additionally, the back-projection mimics energy deposition and attenuation as in avirtual cylindrical phantom. Therefore, the reconstructed 3D dose distributions have beenvalidated for conventional and complex clinical treatment plans against reference mea-surements. The methodology has also been tested for sensitivity to small geometric anddosimetric deviations, satisfying the required criteria.
As the aim of this thesis is to develop a QA tool for patient-specific QA, the developedwork presents a preferable methodology over others proposed in literature and also overcommercial devices. The advantages of the presented work are the fast and in-air acquisi-tion of the measurements combined with a non labor intensive set-up, and the prediction-free (except in calibration process) and the water-equivalent features of the reconstructed3D dose distribution with relatively good accuracy and optimal and desired spatial res-olution. These advantages represent favorable characteristics for clinical dosimetry andspecifically for patient-specific QA program. Besides the clinical application demon-strated in this thesis, the methodology can be used for research and auditing purposes.
As final remark, the remaining limitation of the proposed methodology is the currentimplementation of the calibration process. However, technical improvements of the im-plemented codes are foreseen. The development includes a user-friendly interface, opti-mization of computational time and generalization to other EPID models.
116

Appendix A
Mathematical optimization and codeimplementation
A.1 Overview
Mathematical optimization is the process to search the best solution out of a set of possiblechoices with respect to a pre-specified criterion. Depending on the criteria, the optimiza-tion process consists of minimization or maximization (depending on the criteria) of theobjective function f (x), where x is an N-dimensional vector referred to as the parametersof variables within is the feasible set S (search space). Typically, the optimization con-sists of iterations where the vector of parameters minimizing or maximizing the objectivefunction is carried on. The search space can be limited by constraints, such that h(x) =c and g(x) ≤ d [166]. The feasible solution that minimizes or maximizes the objectivefunction is the optimal solution. The optimal solution can be either a global or local min-ima . While local minimum applies for a neighborhood, the global one applies for theentire search space S. An example of different minima of the function in equation A.1 isillustrated in figure (A.1).
h(x) = 2 + cos(x) +cos(2x− 0.5)
2(A.1)
Several algorithms have been proposed for solving optimization problems. However,many solvers suffer from distinguishing between global and local minima. Therefore,global optimization mathematics and numerical analysis tools were developed as sup-porting algorithms for problem solvers. As a result, the optimization code constitute ofa problem solver and analysis tools to verify the best solution from a set of input valuesfrom within an allowed set, computing the output of the function and recording the bestoutput values found during the process.
117

APPENDIX A. OPTIMIZATION ...
Figure A.1: Local and global minima for function A.1.
Figure A.2: The steps of the methodology presented in this thesis that required an optimizationprocess are marked with red square in the flowchart.
A.2 Code implementation
MATLAB in conjunction with Optimization ToolboxTM offers several algorithms for nu-merical optimization. The optimization processes implemented in this thesis relied onMATLAB. The steps of the methodology (EPID calibration and 3D dose reconstruction)that required an optimization process are marked in figure (A.2). The choice of the algo-rithm and the implemented objective function are outlined in the following.
• Field size correction the aim of this optimization was to obtain the single param-eter relevant to the exponential fitting function defining the field size dependent
118

A.2. CODE IMPLEMENTATION
convolution kernel. The objective function to be minimized was the square differ-ence between the reference measurement and the central values of the integratedimage frames. A non-linear, unconstrained and derivative-free algorithm as imple-mented in ”fminsearch.m” was used. Details of the optimization process are in thefollowing.
FS correction
• Penumbra correction the objective function was defined as the sum square differ-ence between the two profiles measured by the reference detector and the imageframe. As the required convolution kernel was modeled by a Lorentz fitting func-tion with 4 coefficients (vector of parameters), the initialization parameters wereguessed randomly. Details of the optimization process are in the following.
119

APPENDIX A. OPTIMIZATION ...
Penumbra correction
• Depth specific lateral scatter correction two convolution kernels and thereforetwo separated optimization processes were considered, corresponding to the seg-mented hot and cold regions of the image frame. The optimization function was thesum square difference of the mean between the in-line and cross-line profiles. Theconvolution kernel was modeled as a Lorentz fitting function with 4 coefficients. Inthis step, the algorithm implemented in ”fminsearch.m” converged to local minima.To try to approach global convergence [167], the algorithm particle swarm was usedwith certain constraints. As the ”particle swarm” algorithm is a population-basedoptimization method (inspired by the motion of a bird flock, or fish schooling),the computation speed is slower than a derivative- free method. The optimizationprocess implemented to generate the two kernels parameters is below.
120

A.2. CODE IMPLEMENTATION
Depth specific lateral scatter correction
121

APPENDIX A. OPTIMIZATION ...
122
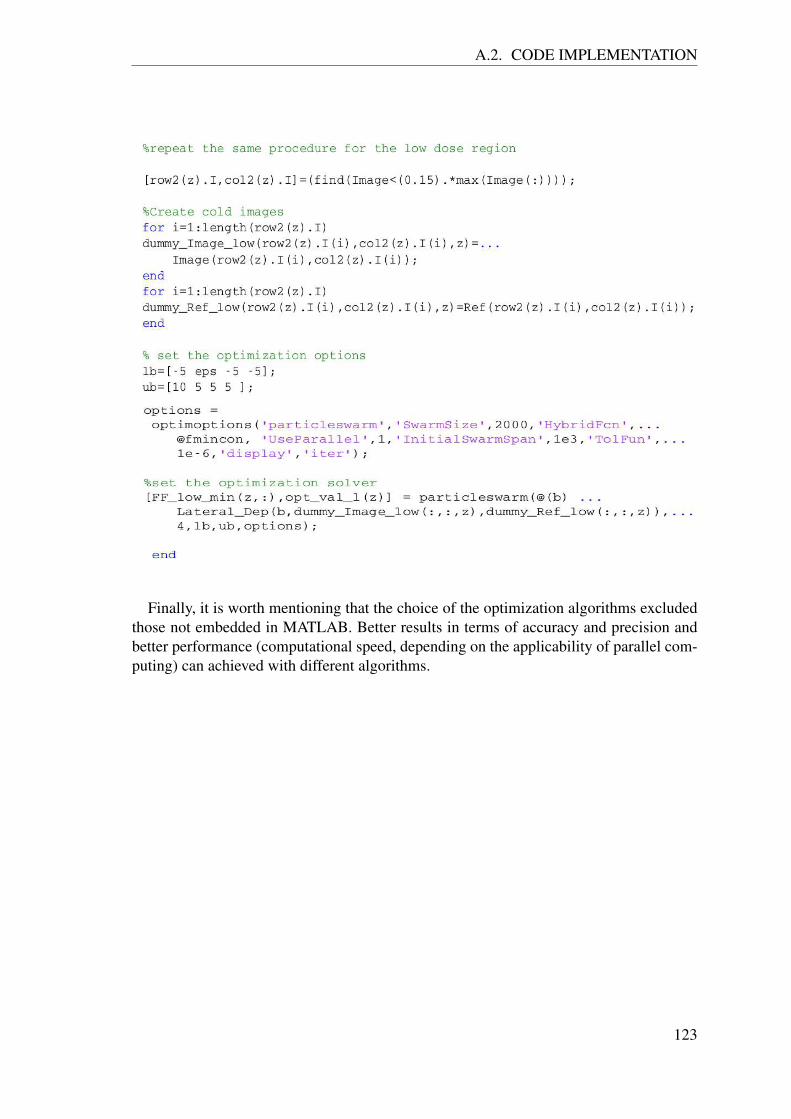
A.2. CODE IMPLEMENTATION
Finally, it is worth mentioning that the choice of the optimization algorithms excludedthose not embedded in MATLAB. Better results in terms of accuracy and precision andbetter performance (computational speed, depending on the applicability of parallel com-puting) can achieved with different algorithms.
123


Appendix B
List of publications and conferencecontributions
Peer-reviewed articles
Abdulaziz Alhazmi, Chiara Gianoli, Sebastian Neppl, Juliana Martins, Stella Veloza,Mark Podesta, Frank Verhaegen, Michael Reiner, Claus Belka, and Katia Parodi. Anovel approach to epid-based 3d volumetric dosimetry for imrt and vmat qa. Physicsin Medicine & Biology, 63(11):115002, 2018.
Conference contributions
Abdulaziz Alhazmi, Chiara Gianoli, Juliana Martins, Sebastian Neppl, Stella Veloza,Michael Reiner, Claus Belka, and Katia Parodi. A novel epid-based 3d dose reconstruc-tion for imrt qa. Medical Physics, 44(6):2887-2887, 2017. (Poster)
Juliana Cristina Martins, Abdulaziz Alhazmi, Sebastian Neppl, Claus Belka, MichaelReiner, Katia Parodi, and Stella Veloza. An equipment-specific geant4 model for theelekta agility collimator. Physica Medica, 42:30-31, 2017. (Talk)
Abdulaziz Alhazmi, Chiara Gianoli, Juliana Martins, Sebastian Neppl, Stella Veloza,Michael Reiner, Claus Belka, and Katia Parodi. Sensitivity analysis of epid-based 3ddose reconstruction for vmat qa. Radiotherapy and Oncology, 127, 2018. (e-Poster)
Abdulaziz Alhazmi, Chiara Gianoli, Juliana Martins, Sebastian Neppl, Stella Veloza,Michael Reiner, Claus Belka, and Katia Parodi. Proposal of a comprehensive pre-treatment qa procedure in imrt/vmat techniques. Physica Medica, 52:149, 2018.(e-Poster)
Rangoli Saxena, Juliana Cristina Martins, Abdulaziz Alhazmi, Sebastian Neppl, MichaelReiner, Claus Belka, Stella Veloza, and Katia Parodi. Optimization of phase space filesfrom clinical linear accelerators. Physica Medica, 52:12, 2018. (Poster)
125

APPENDIX B. LIST OF PUBLICATIONS AND CONFERENCE ...
Abdulaziz Alhazmi, Chiara Gianoli, Sebastian Neppl, Juliana Cristina Martins, StellaVeloza, Mark Podesta, Frank Verhaegen, Michael Reiner, Claus Belka, Katia Parodi.EPID-based 3D dose reconstruction for plan specific pre-treatment QA. DGMP 2018 (Inpress)
Rangoli Saxena, Juliana Cristina Martins, Abdulaziz Alhazmi, Sebastian Neppl, MichaelReiner, Claus Belka, Stella Veloza, Katia Parodi. Optimization of IAEA Phase SpaceFiles for Monte Carlo Dose Calculation. DGMP 2018 (In press)
126

Bibliography
[1] II Abubakar, T Tillmann, and A Banerjee. Global, regional, and national age-sexspecific all-cause and cause-specific mortality for 240 causes of death, 1990-2013:a systematic analysis for the global burden of disease study 2013. Lancet, 385(9963):117–171, 2015.
[2] Bernard Stewart, Christopher Wild, et al. World cancer report 2014. Health, 2017.
[3] Christina Fitzmaurice, Daniel Dicker, Amanda Pain, Hannah Hamavid, MaziarMoradi-Lakeh, Michael F MacIntyre, Christine Allen, Gillian Hansen, RachelWoodbrook, Charles Wolfe, et al. The global burden of cancer 2013. JAMA oncol-ogy, 1(4):505–527, 2015.
[4] Jacques Ferlay. Globocan 2008 v2. 0, cancer incidence and mortality worldwide:Iarc cancerbase no. 10. http://globocan. iarc. fr, 2010.
[5] Cai Grau, Josep M Borras, Julian Malicki, Ben Slotman, Peter Dunscombe,Mary Coffey, Donal Hollywood, Ferran Guedea, Chiara Gasparotto, and YolandeLievens. Radiotherapy capacity in europe. The Lancet Oncology, 14(6):e196–e198,2013.
[6] Kimberly D Miller, Rebecca L Siegel, Chun Chieh Lin, Angela B Mariotto, Joan LKramer, Julia H Rowland, Kevin D Stein, Rick Alteri, and Ahmedin Jemal. Cancertreatment and survivorship statistics, 2016. CA: a cancer journal for clinicians, 66(4):271–289, 2016.
[7] Wolfgang C. Schlegel, L.W. Brady, H.P. Heilmann, Thomas. Bortfeld, M. Molls,and Anca L. Grosu. New Technologies in Radiation Oncology. Medical Radiology.Springer Berlin Heidelberg, 2009. ISBN 9783540800057.
[8] Faiz Khan. The Physics of Radiation Therapy. Lippincott Williams & Wilkins,2010. ISBN 9780781788564.
[9] Arabinda Kumar Rath and Narayan Sahoo. Particle Radiotherapy: Emerging Tech-nology for Treatment of Cancer. Springer, 2016.
[10] Seymour H Levitt, James A Purdy, Carlos A Perez, and Srinivasan Vijayakumar.Technical basis of radiation therapy. Springer, 2012.
127

BIBLIOGRAPHY
[11] Yasumasa. Nishimura and Ritsuko Komaki. Intensity-Modulated RadiationTherapy: Clinical Evidence and Techniques. Springer Japan, 2015. ISBN9784431554868.
[12] Rajesh A Kinhikar, Amol B Pawar, Umesh Mahantshetty, Vedang Murthy,Deepak D Dheshpande, Shyam K Shrivastava, et al. Rapid arc, helical tomotherapy,sliding window intensity modulated radiotherapy and three dimensional conformalradiation for localized prostate cancer: a dosimetric comparison. Journal of cancerresearch and therapeutics, 10(3):575, 2014.
[13] Simon. Lo, Bin S. Teh, Jiade. Lu, and Tracey E. Schefter. Stereotactic Body Ra-diation Therapy. Medical Radiology. Springer Berlin Heidelberg, 2012. ISBN9783642256059.
[14] RG Parker, CR Bogardus, GE Hanks, CG Orton, and M Rotman. Radiation on-cology in integrated cancer management: Report of the inter-society council forradiation oncology. Merrifield, VA: American College of Radiology Publications,ISCRO, 1991.
[15] Ervin B Podgorsak et al. Radiation oncology physics. Vienna: InternationalAtomic Energy Agency, pages 123–271, 2005.
[16] Jeffrey F Williamson, Peter B Dunscombe, Michael B Sharpe, Bruce R Thomad-sen, James A Purdy, and James A Deye. Quality assurance needs for modernimage-based radiotherapy: recommendations from 2007 interorganizational sym-posium on “quality assurance of radiation therapy: challenges of advanced tech-nology”. International Journal of Radiation Oncology* Biology* Physics, 71(1):S2–S12, 2008.
[17] International Atomic Energy Agency. Accuracy Requirements and Uncertainties inRadiotherapy. IAEA Human Health Series. International Atomic Energy Agency,2017. ISBN 9789201008152.
[18] Ben Mijnheer. Clinical 3D Dosimetry in Modern Radiation Therapy. CRC Press,2017.
[19] Ross I Berbeco. Beam’s Eye View Imaging in Radiation Oncology. CRC Press,2017.
[20] Ervin B Podgorsak. Radiation physics for medical physicists. Springer Science &Business Media, 2010.
[21] Glenn F Knoll. Radiation detection and measurement. John Wiley & Sons, 2010.
[22] International Atomic Energy Agency. Implementation of the international code ofpractice on dosimetry in radiotherapy (TRS 398): review of testing results. Im-plementation of the International Code of Practice on Dosimetry in Radiotherapy(Trs:398): Review of Testing Results. International Atomic Energy Agency, 2005.ISBN 9789201050052.
128

BIBLIOGRAPHY
[23] Peter R Almond, Peter J Biggs, Bert M Coursey, WF Hanson, M Saiful Huq, Ravin-der Nath, and DWO Rogers. Aapm’s tg-51 protocol for clinical reference dosime-try of high-energy photon and electron beams. Medical physics, 26(9):1847–1870,1999.
[24] Jose Manuel Larraga-Gutierrez, Paola Ballesteros-Zebadua, Miguel Rodrıguez-Ponce, Olivia Amanda Garcıa-Garduno, and Olga Olinca Galvan De la Cruz. Prop-erties of a commercial ptw-60019 synthetic diamond detector for the dosimetry ofsmall radiotherapy beams. Physics in Medicine & Biology, 60(2):905, 2015.
[25] Syed Naeem Ahmed. Physics and engineering of radiation detection. AcademicPress, 2007.
[26] S Reinhardt, M Hillbrand, JJ Wilkens, and W Assmann. Comparison of gafchromicebt2 and ebt3 films for clinical photon and proton beams. Medical physics, 39(8):5257–5262, 2012.
[27] Naoki Hayashi, Ryan L Malmin, and Yoichi Watanabe. Dosimetric verificationfor intensity-modulated arc therapy plans by use of 2d diode array, radiochromicfilm and radiosensitive polymer gel. Journal of radiation research, 55(3):541–552,2014.
[28] Yuji Nakaguchi, T Oono, F Araki, and M Maruyama. Physical characterizationsfor an integrated 160-leaf multi-leaf collimator with a new concept design. NihonHoshasen Gijutsu Gakkai zasshi, 69(7):778–783, 2013.
[29] James L Bedford, Michael DR Thomas, and Gregory Smyth. Beam modeling andvmat performance with the agility 160-leaf multileaf collimator. Journal of appliedclinical medical physics, 14(2):172–185, 2013.
[30] Frank Verhaegen and Jan Seuntjens. Monte carlo modelling of external radiother-apy photon beams. Physics in medicine & biology, 48(21):R107, 2003.
[31] Timothy C Zhu, Anders Ahnesjo, Kwok Leung Lam, X Allen Li, Chang-Ming Charlie Ma, Jatinder R Palta, Michael B Sharpe, Bruce Thomadsen, andRamesh C Tailor. Report of aapm therapy physics committee task group 74: In-airoutput ratio, sc, for megavoltage photon beams. Medical physics, 36(11):5261–5291, 2009.
[32] TD Sterling. Derivation of a mathematical expression for the percent depth dose ofcobalt 60 beams and visualization of multiple fields dose distributions. Br J Radiol,37:544–550, 1964.
[33] David S Chang, Foster D Lasley, Indra J Das, Marc S Mendonca, Joseph R Dyn-lacht, et al. Basic radiotherapy physics and biology. Springer, 2014.
[34] Anders Ahnesjo and Maria Mania Aspradakis. Dose calculations for external pho-ton beams in radiotherapy. Physics in Medicine & Biology, 44(11):R99, 1999.
129

BIBLIOGRAPHY
[35] Anders Ahnesjo, Lars Weber, Anders Murman, Mikael Saxner, Ingvar Thorslund,and Erik Traneus. Beam modeling and verification of a photon beam multisourcemodel. Medical physics, 32(6Part1):1722–1737, 2005.
[36] Tommy Knoos, Elinore Wieslander, Luca Cozzi, Carsten Brink, Antonella Fogli-ata, Dirk Albers, Hakan Nystrom, and Søren Lassen. Comparison of dose calcula-tion algorithms for treatment planning in external photon beam therapy for clinicalsituations. Physics in Medicine & Biology, 51(22):5785, 2006.
[37] Christopher M Bragg and John Conway. Dosimetric verification of the anisotropicanalytical algorithm for radiotherapy treatment planning. Radiotherapy and oncol-ogy, 81(3):315–323, 2006.
[38] Wen-Zhou Chen, Ying Xiao, and Jun Li. Impact of dose calculation algorithm onradiation therapy. World journal of radiology, 6(11):874, 2014.
[39] W Ralph Nelson, David WO Rogers, and H Hirayama. The egs4 code system.Technical report, 1985.
[40] J Baro, J Sempau, JM Fernandez-Varea, and F Salvat. Penelope: an algorithm formonte carlo simulation of the penetration and energy loss of electrons and positronsin matter. Nuclear Instruments and Methods in Physics Research Section B: BeamInteractions with Materials and Atoms, 100(1):31–46, 1995.
[41] J Briesmeister. Mcnp–a general monte carlo n-particle transportation code. Tech-nical report, LA-1625-M, version, 1997.
[42] Sea Agostinelli, John Allison, K al Amako, Jo Apostolakis, H Araujo, P Arce,M Asai, D Axen, S Banerjee, G 2 Barrand, et al. Geant4—a simulation toolkit. Nu-clear instruments and methods in physics research section A: Accelerators, Spec-trometers, Detectors and Associated Equipment, 506(3):250–303, 2003.
[43] R Capote, R Jeraj, CM Ma, DWO Rogers, F Sanchez-Doblado, J Sempau, J Se-untjens, and JV Siebers. Phase-space database for external beam radiotherapy.summary report of a consultants’ meeting. Technical report, International AtomicEnergy Agency, 2006.
[44] Miguel Antonio Cortes-Giraldo, Jose Manuel Quesada, Marıa Isabel Gallardo, andRoberto Capote. An implementation to read and write iaea phase-space files ingeant4-based simulations. International journal of radiation biology, 88(1-2):200–208, 2012.
[45] Obioma Nwankwo, Gerhard Glatting, Frederik Wenz, and Jens Fleckenstein. Asingle-source photon source model of a linear accelerator for monte carlo dosecalculation. PloS one, 12(9):e0183486, 2017.
[46] Iwan Kawrakow, Matthias Fippel, and Klaus Friedrich. 3d electron dose calcu-lation using a voxel based monte carlo algorithm (vmc). Medical physics, 23(4):445–457, 1996.
130

BIBLIOGRAPHY
[47] Josep Sempau, Scott J Wilderman, and Alex F Bielajew. Dpm, a fast, accuratemonte carlo code optimized for photon and electron radiotherapy treatment plan-ning dose calculations. Physics in Medicine & Biology, 45(8):2263, 2000.
[48] Jens Fleckenstein, Lennart Jahnke, Frank Lohr, Frederik Wenz, and Jurgen Hesser.Development of a geant4 based monte carlo algorithm to evaluate the monaco vmattreatment accuracy. Zeitschrift fur Medizinische Physik, 23(1):33–45, 2013.
[49] Satish Pelagade, Kalpana Thakur, Tushar Bopche, Devang Bhavsar, Daxa Patel,Ruchita Shah, and Rakeshkumar Vyas. Commissioning and quality assurance ofa commercial intensity modulated radiotherapy (imrt) treatment planning systempreciseplan. Turkish Journal of Cancer, 37(1), 2007.
[50] Benjamin E Nelms and Jeff A Simon. A survey on planar imrt qa analysis. Journalof applied clinical medical physics, 8(3):76–90, 2007.
[51] Markus Alber, Sara Broggi, Carlos De Wagter, Ines Eichwurzel, Per Engstrom,Claudio Fiorino, Dietmar Georg, Gunther Hartmann, Tommy Knoos, Antonio Leal,et al. Guidelines for the verification of imrt. ESTRO booklet, 7, 2008.
[52] Todd Pawlicki, Sua Yoo, Sharon K McMillan, Roger K Rice, J Donald Russell,John M Pacyniak, Milton K Woo, Parminder S Basran, Jason Shoales, Arthur LBoyer, et al. Moving from imrt qa measurements toward independent computercalculations using control charts. Radiotherapy and Oncology, 89(3):330–337,2008.
[53] Baozhou Sun, Dharanipathy Rangaraj, Sunita Boddu, Murty Goddu, Deshan Yang,Geethpriya Palaniswaamy, Sridhar Yaddanapudi, Omar Wooten, and Sasa Mutic.Evaluation of the efficiency and effectiveness of independent dose calculation fol-lowed by machine log file analysis against conventional measurement based imrtqa. Journal of applied clinical medical physics, 13(5):140–154, 2012.
[54] Jia-Ming Wu, Chung-Ming Kuo, and Ching-Jiang Chen. Dose verification inintensity modulation radiation therapy: a fractal dimension characteristics study.BioMed research international, 2013, 2013.
[55] Juliana Cristina Martins, Abdulaziz Alhazmi, Sebastian Neppl, Claus Belka,Michael Reiner, Katia Parodi, and Stella Veloza. Abstract id: 144 an equipment-specific geant4 model for the elekta agility collimator. Physica Medica: EuropeanJournal of Medical Physics, 42:30–31, 2017.
[56] Benjamin Nelms, Cassandra Stambaugh, Dylan Hunt, Brian Tonner, GeoffreyZhang, and Vladimir Feygelman. Methods, software and datasets to verify dvhcalculations against analytical values: Twenty years late (r). Medical physics, 42(8):4435–4448, 2015.
[57] Michael Goitein. Radiation Oncology: A Physicist’s-Eye View. Biological andMedical Physics, Biomedical Engineering. Springer New York, 2007. ISBN9780387726458.
131

BIBLIOGRAPHY
[58] Ann Barrett, Jane Dobbs, and Tom Roques. Practical Radiotherapy PlanningFourth Edition. Taylor & Francis, 2009. ISBN 9780340927731.
[59] Mark Podesta, Lucas CGG Persoon, and Frank Verhaegen. A novel time dependentgamma evaluation function for dynamic 2d and 3d dose distributions. Physics inMedicine & Biology, 59(20):5973, 2014.
[60] Alan C Hartford, James M Galvin, David C Beyer, Thomas J Eichler, Geoffrey SIbbott, Brian Kavanagh, Christopher J Schultz, and Seth A Rosenthal. Americancollege of radiology (acr) and american society for radiation oncology (astro) prac-tice guideline for intensity-modulated radiation therapy (imrt). American journalof clinical oncology, 35(6):612–617, 2012.
[61] Gary A Ezzell, Jay W Burmeister, Nesrin Dogan, Thomas J LoSasso, James GMechalakos, Dimitris Mihailidis, Andrea Molineu, Jatinder R Palta, Chester RRamsey, Bill J Salter, et al. Imrt commissioning: multiple institution planningand dosimetry comparisons, a report from aapm task group 119. Medical physics,36(11):5359–5373, 2009.
[62] P Ortiz and M Wheatley. Lessons learned from accidental exposures in radiother-apy. IAEA Safety Reports Series, 17:59–61, 2000.
[63] P Scalliet et al. Comprehensive audits of radiotherapy practices: a tool for qualityimprovement: quality assurance team for radiation oncology (quatro). Interna-tional Atomic Energy Agency, Vienna, 2007.
[64] Jack Valentin. ICRP Publication 86: Prevention of Accidents to Patients Undergo-ing Radiation Therapy, volume 86. Elsevier Health Sciences, 2000.
[65] IC Icrp. Preventing accidental exposures from new external beam radiation therapytechnologies, icrp 112. Ann ICRP, 39, 2009.
[66] Norman A Baily, Richard A Horn, and Thomas D Kampp. Fluoroscopic visualiza-tion of megavoltage therapeutic x ray beams. International Journal of RadiationOncology* Biology* Physics, 6(7):935–939, 1980.
[67] Wouter Van Elmpt, Leah McDermott, Sebastiaan Nijsten, Markus Wendling,Philippe Lambin, and Ben Mijnheer. A literature review of electronic portal imag-ing for radiotherapy dosimetry. Radiotherapy and Oncology, 88(3):289–309, 2008.
[68] Larry E Antonuk, John Yorkston, Weidong Huang, Jeffrey H Siewerdsen, John MBoudry, Youcef El-Mohri, and Mary Victoria Marx. A real-time, flat-panel, amor-phous silicon, digital x-ray imager. Radiographics, 15(4):993–1000, 1995.
[69] Michael G Herman, James M Balter, David A Jaffray, Kiarin P McGee, PeterMunro, Shlomo Shalev, Marcel Van Herk, and John W Wong. Clinical use ofelectronic portal imaging: report of aapm radiation therapy committee task group58. Medical Physics, 28(5):712–737, 2001.
132

BIBLIOGRAPHY
[70] Coen W Hurkmans, Peter Remeijer, Joos V Lebesque, and Ben J Mijnheer. Set-upverification using portal imaging; review of current clinical practice. Radiotherapyand Oncology, 58(2):105–120, 2001.
[71] K A Langmack. Portal imaging. The British Journal of Radiology, 74(885):789–804, 2001. doi: 10.1259/bjr.74.885.740789. PMID: 11560826.
[72] Larry E Antonuk. Electronic portal imaging devices: a review and historical per-spective of contemporary technologies and research. Physics in Medicine & Biol-ogy, 47(6):R31, 2002.
[73] D Verellen, M De Ridder, K Tournel, M Duchateau, T Reynders, T Gevaert,N Linthout, and G Storme. An overview of volumetric imaging technologies andtheir quality assurance for igrt. Acta Oncologica, 47(7):1271–1278, 2008.
[74] Joerg Rottmann, Daniel Morf, Rony Fueglistaller, George Zentai, Josh Star-Lack,and Ross Berbeco. A novel epid design for enhanced contrast and detective quan-tum efficiency. Physics in Medicine & Biology, 61(17):6297, 2016.
[75] Marios Myronakis, Josh Star-Lack, Paul Baturin, Joerg Rottmann, Daniel Morf,Adam Wang, Yue-Houng Hu, Daniel Shedlock, and Ross I Berbeco. A novelmulti-layer mv imager computational model for component optimization. Medi-cal physics, 2017.
[76] David A Jaffray, Jeffrey H Siewerdsen, John W Wong, and Alvaro A Martinez.Flat-panel cone-beam computed tomography for image-guided radiation therapy.International Journal of Radiation Oncology• Biology• Physics, 53(5):1337–1349,2002.
[77] LE Antonuk, J Yorkston, J Boudry, MJ Longo, J Jimenez, and RA Street. Devel-opment of hydrogenated amorphous silicon sensors for high energy photon radio-therapy imaging. IEEE Transactions on Nuclear Science, 37(2):165–170, 1990.
[78] Youcef El-Mohri, Larry E Antonuk, John Yorkston, K-W Jee, Manat Maolinbay,Kwok Leung Lam, and JH Siewerdsen. Relative dosimetry using active matrixflat-panel imager (amfpi) technology. Medical physics, 26(8):1530–1541, 1999.
[79] Mark Podesta, Sebastiaan M J J G Nijsten, Lucas C G G Persoon, Stefan G Scheib,Christof Baltes, and Frank Verhaegen. Time dependent pre-treatment epid dosime-try for standard and fff vmat. Physics in Medicine & Biology, 59(16):4749, 2014.
[80] M Van Herk. Physical aspects of a liquid-filled ionization chamber with pulsedpolarizing voltage. Medical physics, 18(4):692–702, 1991.
[81] H Meertens, M Van Herk, J Bijhold, and H Bartelink. First clinical experiencewith a newly developed electronic portal imaging device. International Journal ofRadiation Oncology• Biology• Physics, 18(5):1173–1181, 1990.
133

BIBLIOGRAPHY
[82] VGM Althof, JCJ De Boer, H Huizenga, JC Stroom, AG Visser, and BN Swanen-burg. Physical characteristics of a commercial electronic portal imaging device.Medical physics, 23(11):1845–1855, 1996.
[83] BJM Heijmen, KL Pasma, M Kroonwijk, VGM Althof, JCJ De Boer, AG Visser,and H Huizenga. Portal dose measurement in radiotherapy using an electronicportal imaging device (epid). Physics in Medicine & Biology, 40(11):1943, 1995.
[84] KL Pasma, M Kroonwijk, JCJ De Boer, AG Visser, and BJM Heijmen. Accu-rate portal dose measurement with a fluoroscopic electronic portal imaging device(epid) for open and wedged beams and dynamic multileaf collimation. Physics inMedicine & Biology, 43(8):2047, 1998.
[85] BMC McCurdy and PB Greer. Dosimetric properties of an amorphous-silicon epidused in continuous acquisition mode for application to dynamic and arc imrt. Med-ical physics, 36(7):3028–3039, 2009.
[86] Awusi Kavuma, Martin Glegg, Garry Currie, and Alex Elliott. Assessment ofdosimetrical performance in 11 varian a-si500 electronic portal imaging devices.Physics in Medicine & Biology, 53(23):6893, 2008.
[87] Peter B Greer. Correction of pixel sensitivity variation and off-axis response foramorphous silicon epid dosimetry. Medical physics, 32(12):3558–3568, 2005.
[88] Leah N McDermott, RJW Louwe, J-J Sonke, MB Van Herk, and Ben J Mijn-heer. Dose–response and ghosting effects of an amorphous silicon electronic portalimaging device. Medical physics, 31(2):285–295, 2004.
[89] Peter Winkler, Alfred Hefner, and Dietmar Georg. Dose-response characteristicsof an amorphous silicon epid. Medical physics, 32(10):3095–3105, 2005.
[90] Mukhtar Alshanqity and Andrew Nisbet. Dosimetric performance of a-si elec-tronic portal imaging devices. International Journal of Medical Physics, ClinicalEngineering and Radiation Oncology, 5(02):162, 2016.
[91] C Kirkby and R Sloboda. Consequences of the spectral response of an a-si epid andimplications for dosimetric calibration. Medical physics, 32(8):2649–2658, 2005.
[92] Boyd MC McCurdy, Kurt Luchka, and Stephen Pistorius. Dosimetric investiga-tion and portal dose image prediction using an amorphous silicon electronic portalimaging device. Medical physics, 28(6):911–924, 2001.
[93] Brian W King, Daniel Morf, Peter Greer, et al. Development and testing of animproved dosimetry system using a backscatter shielded electronic portal imagingdevice. Medical physics, 39(5):2839–2847, 2012.
[94] DA Roberts, JM Moran, LE Antonuk, Y El-Mohri, and BA Fraass. Charge trap-ping at high doses in an active matrix flat panel dosimeter. IEEE Transactions onNuclear Science, 51(4):1427–1433, 2004.
134

BIBLIOGRAPHY
[95] Jeffrey V Siebers, Jong Oh Kim, Lung Ko, Paul J Keall, and Radhe Mohan. Montecarlo computation of dosimetric amorphous silicon electronic portal images. Med-ical physics, 31(7):2135–2146, 2004.
[96] C Kirkby and R Sloboda. Comprehensive monte carlo calculation of the pointspread function for a commercial a-si epid. Medical physics, 32(4):1115–1127,2005.
[97] Samuel J Blake, Philip Vial, Lois Holloway, Peter B Greer, Aimee L McNamara,and Zdenka Kuncic. Characterization of optical transport effects on epid dosimetryusing geant4. Medical physics, 40(4), 2013.
[98] Daniel W Bailey, Lalith Kumaraswamy, Mohammad Bakhtiari, Harish K Malhotra,and Matthew B Podgorsak. Epid dosimetry for pretreatment quality assurance withtwo commercial systems. Journal of applied clinical medical physics, 13(4):82–99,2012.
[99] Zheng Chang, Qiuwen Wu, Justus Adamson, Lei Ren, James Bowsher, Hui Yan,Andrew Thomas, and Fang-Fang Yin. Commissioning and dosimetric character-istics of truebeam system: composite data of three truebeam machines. Medicalphysics, 39(11):6981–7018, 2012.
[100] Charbel Merheb, Clement Chevillard, Wassim Ksouri, Maher Fawzi, Marc Bollet,and Alain Toledano. Comparison between two different algorithms used for pre-treatment qa via asi portal images. Journal of applied clinical medical physics, 16(3):141–153, 2015.
[101] Hosang Jin, Fredrick B Jesseph, and Salahuddin Ahmad. A comparison study ofvolumetric modulated arc therapy quality assurances using portal dosimetry andmapcheck 2. Progress in Medical Physics, 25(2):65–71, 2014.
[102] Maritza A Hobson and Stephen D Davis. Comparison between an in-house 1dprofile correction method and a 2d correction provided in varian’s pdpc packagefor improving the accuracy of portal dosimetry images. Journal of applied clinicalmedical physics, 16(2):43–50, 2015.
[103] Maria Sjolin and Jens Morgenthaler Edmund. Incorrect dosimetric leaf separationin imrt and vmat treatment planning: Clinical impact and correlation with pretreat-ment quality assurance. Physica Medica: European Journal of Medical Physics,32(7):918–925, 2016.
[104] Philip Vial, Peter B Greer, Lyn Oliver, and Clive Baldock. Initial evaluation of acommercial epid modified to a novel direct-detection configuration for radiother-apy dosimetry. Medical physics, 35(10):4362–4374, 2008.
[105] Daniel W Bailey, Lalith Kumaraswamy, Mohammad Bakhtiari, and Matthew BPodgorsak. A two-dimensional matrix correction for off-axis portal dose predictionerrors. Medical physics, 40(5), 2013.
135

BIBLIOGRAPHY
[106] K Chytyk and BMC McCurdy. Comprehensive fluence model for absolute portaldose image prediction. Medical physics, 36(4):1389–1398, 2009.
[107] Peter B Greer, Patrick Cadman, Christopher Lee, and Karl Bzdusek. An energyfluence-convolution model for amorphous silicon epid dose prediction. Medicalphysics, 36(2):547–555, 2009.
[108] Janett Liebich, Jorg Licher, Christian Scherf, Eugen Kara, Nadine Koch, ClausRodel, and Ulla Ramm. Simple proposal for dosimetry with an elekta iviewgttm electronic portal imaging device (epid) using commercial software modules.Strahlentherapie und Onkologie, 187(5):316, 2011.
[109] L Conte, C Mordacchini, L Pozzi, and C Vite. An empirical calibration method foran a-si portal imaging device: applications in pretreatment verification of imrt. Laradiologia medica, 117(6):1044–1056, 2012.
[110] ME Monville, Z Kuncic, and PB Greer. Simulation of real-time epid images duringimrt using monte-carlo. Physica Medica: European Journal of Medical Physics,30(3):326–330, 2014.
[111] Brian W King and Peter B Greer. A method for removing arm backscatter fromepid images. Medical physics, 40(7), 2013.
[112] Jeremy Camilleri, Jocelyne Mazurier, Denis Franck, Philippe Dudouet, Igor La-torzeff, and Xavier Franceries. 2d epid dose calibration for pretreatment qual-ity control of conformal and imrt fields: A simple and fast convolution approach.Physica Medica: European Journal of Medical Physics, 32(1):133–140, 2016.
[113] Giorgia Nicolini, Eugenio Vanetti, Alessandro Clivio, Antonella Fogliata, StineKorreman, Jiri Bocanek, and Luca Cozzi. The glaas algorithm for portal dosime-try and quality assurance of rapidarc, an intensity modulated rotational therapy.Radiation Oncology, 3(1):24, 2008.
[114] Benjamin E Nelms, Karl H Rasmussen, and Wolfgang A Tome. Evaluation of a fastmethod of epid-based dosimetry for intensity-modulated radiation therapy. Journalof applied clinical medical physics, 11(2):140–157, 2010.
[115] Markus Wendling, Leah N McDermott, Anton Mans, Jan-Jakob Sonke, Marcel vanHerk, and Ben J Mijnheer. A simple backprojection algorithm for 3d in vivo epiddosimetry of imrt treatments. Medical physics, 36(7):3310–3321, 2009.
[116] Markus Wendling, Leah N McDermott, Anton Mans, Igor Olaciregui-Ruiz, RaulPecharroman-Gallego, Jan-Jakob Sonke, Joep Stroom, Marcel van Herk, and BenJ Mijnheer. In aqua vivo epid dosimetry. Medical physics, 39(1):367–377, 2012.
[117] PM McCowan, G Asuni, T van Beek, E van Uytven, K Kujanpaa, and BMC Mc-Curdy. A model-based 3d patient-specific pre-treatment qa method for vmat usingthe epid. Physics in Medicine & Biology, 62(4):1600, 2017.
136

BIBLIOGRAPHY
[118] W Ansbacher. Three-dimensional portal image-based dose reconstruction in a vir-tual phantom for rapid evaluation of imrt plans. Medical physics, 33(9):3369–3382,2006.
[119] Narges Miri, Joerg Lehmann, Kimberley Legge, Philip Vial, and Peter B Greer.Virtual epid standard phantom audit (vespa) for remote imrt and vmat credential-ing. Physics in Medicine & Biology, 62(11):4293, 2017.
[120] SMJJG Nijsten, WJC Van Elmpt, M Jacobs, BJ Mijnheer, ALAJ Dekker, P Lam-bin, and AWH Minken. A global calibration model for a-si epids used for transitdosimetry. Medical physics, 34(10):3872–3884, 2007.
[121] Andrea Fidanzio, Alessandra Mameli, Elisa Placidi, Francesca Greco, GerardinaStimato, Diego Gaudino, Sara Ramella, Rolando D’Angelillo, Francesco Cellini,Lucio Trodella, et al. Epid cine acquisition mode for in vivo dosimetry in dynamicarc radiation therapy. Nuclear Instruments and Methods in Physics Research Sec-tion B: Beam Interactions with Materials and Atoms, 266(4):658–666, 2008.
[122] Andrea Fidanzio, Savino Cilla, Francesca Greco, Laura Gargiulo, Luigi Azario,Domenico Sabatino, and Angelo Piermattei. Generalized epid calibration for invivo transit dosimetry. Physica Medica: European Journal of Medical Physics, 27(1):30–38, 2011.
[123] Andrea Fidanzio, Luigi Azario, Francesca Greco, Savino Cilla, and Angelo Pier-mattei. Routine epid in-vivo dosimetry in a reference point for conformal radio-therapy treatments. Physics in Medicine & Biology, 60(8):N141, 2015.
[124] Anthony E Millin, Rebecca S Windle, and D Geraint Lewis. A comparison of elec-tronic portal dosimetry verification methods for use in stereotactic radiotherapy.Physica Medica: European Journal of Medical Physics, 32(1):188–196, 2016.
[125] K Ricketts, C Navarro, K Lane, M Moran, C Blowfield, U Kaur, G Cotten,D Tomala, C Lord, J Jones, et al. Implementation and evaluation of a transitdosimetry system for treatment verification. Physica Medica: European Journalof Medical Physics, 32(5):671–680, 2016.
[126] Stefano Peca and Derek W Brown. Two-dimensional in vivo dose verification usingportal imaging and correlation ratios. Journal of applied clinical medical physics,15(4):117–128, 2014.
[127] Markus Wendling, Robert JW Louwe, Leah N McDermott, Jan-Jakob Sonke, Mar-cel van Herk, and Ben J Mijnheer. Accurate two-dimensional imrt verificationusing a back-projection epid dosimetry method. Medical physics, 33(2):259–273,2006.
[128] T Kairn, D Cassidy, PM Sandford, and AL Fielding. Radiotherapy treatment ver-ification using radiological thickness measured with an amorphous silicon elec-tronic portal imaging device: Monte carlo simulation and experiment. Physics inMedicine & Biology, 53(14):3903, 2008.
137

BIBLIOGRAPHY
[129] Awusi Kavuma, Martin Glegg, Mohamed Metwaly, Garry Currie, and Alex Elliott.A novel method for patient exit and entrance dose prediction based on water equiv-alent path length measured with an amorphous silicon electronic portal imagingdevice. Physics in Medicine & Biology, 55(2):435, 2009.
[130] C Bojechko and EC Ford. Quantifying the performance of in vivo portal dosimetryin detecting four types of treatment parameter variations. Medical physics, 42(12):6912–6918, 2015.
[131] K Chytyk-Praznik, E VanUytven, TA Vanbeek, PB Greer, and BMC McCurdy.Model-based prediction of portal dose images during patient treatment. Medicalphysics, 40(3), 2013.
[132] Sean L Berry, Ren-Dih Sheu, Cynthia S Polvorosa, and Cheng-Shie Wuu. Imple-mentation of epid transit dosimetry based on a through-air dosimetry algorithm.Medical physics, 39(1):87–98, 2012.
[133] Tae Seong Baek, Eun Ji Chung, Jaeman Son, and Myonggeun Yoon. Feasibilitystudy on the verification of actual beam delivery in a treatment room using epidtransit dosimetry. Radiation Oncology, 9(1):273, 2014.
[134] Wouter van Elmpt, Sebastiaan Nijsten, Steven Petit, Ben Mijnheer, Philippe Lam-bin, and Andre Dekker. 3d in vivo dosimetry using megavoltage cone-beam ct andepid dosimetry. International Journal of Radiation Oncology• Biology• Physics,73(5):1580–1587, 2009.
[135] Anton Mans, Peter Remeijer, Igor Olaciregui-Ruiz, Markus Wendling, Jan-JakobSonke, Ben Mijnheer, Marcel van Herk, and Joep C Stroom. 3d dosimetric verifi-cation of volumetric-modulated arc therapy by portal dosimetry. Radiotherapy andoncology, 94(2):181–187, 2010.
[136] R Pecharroman-Gallego, Anton Mans, Jan-Jakob Sonke, Joep C Stroom, IgorOlaciregui-Ruiz, Marcel Herk, and Ben J Mijnheer. Simplifying epid dosimetryfor imrt treatment verification. Medical physics, 38(2):983–992, 2011.
[137] Ben J Mijnheer, Patrick Gonzalez, Igor Olaciregui-Ruiz, Roel A Rozendaal, Mar-cel van Herk, and Anton Mans. Overview of 3-year experience with large-scaleelectronic portal imaging device–based 3-dimensional transit dosimetry. Practicalradiation oncology, 5(6):e679–e687, 2015.
[138] Eric Van Uytven, Timothy Van Beek, Peter M McCowan, Krista Chytyk-Praznik,Peter B Greer, and Boyd McCurdy. Validation of a method for in vivo 3d dosereconstruction for imrt and vmat treatments using on-treatment epid images and amodel-based forward-calculation algorithm. Medical physics, 42(12):6945–6954,2015.
[139] Peter Michael McCowan. in vivo patient dose verification of volumetric modu-lated arc therapy including stereotactic body radiation treatment applications usingportal dose images. 2015.
138

BIBLIOGRAPHY
[140] Jihyung Yoon, Jae Won Jung, Jong Oh Kim, and Inhwan Yeo. A monte carlocalculation model of electronic portal imaging device for transit dosimetry throughheterogeneous media. Medical physics, 43(5):2242–2250, 2016.
[141] Benjamin E Nelms, Daniel Opp, Joshua Robinson, Theresa K Wolf, GeoffreyZhang, Eduardo Moros, and Vladimir Feygelman. Vmat qa: Measurement-guided4d dose reconstruction on a patient. Medical physics, 39(7Part1):4228–4238, 2012.
[142] Mu-Han Lin, Jinsheng Li, Lu Wang, Sion Koren, Jiajing Fan, Eugene Forkal, andC-M Ma. 4d patient dose reconstruction using online measured epid cine imagesfor lung sbrt treatment validation. Medical physics, 39(10):5949–5958, 2012.
[143] Cecile JA Wolfs, Mariana G Bras, Lotte EJR Schyns, Sebastiaan MJJG Nijsten,Wouter van Elmpt, Stefan G Scheib, Christof Baltes, Mark Podesta, and FrankVerhaegen. Detection of anatomical changes in lung cancer patients with 2d time-integrated, 2d time-resolved and 3d time-integrated portal dosimetry: a simulationstudy. Physics in Medicine & Biology, 62(15):6044, 2017.
[144] Mark Podesta, Sebastiaan MJJG Nijsten, Julia Snaith, Marc Orlandini, Tim Lust-berg, Davy Emans, Trent Aland, and Frank Verhaegen. Measured vs simulatedportal images for low mu fields on three accelerator types: possible consequencesfor 2d portal dosimetry. Medical physics, 39(12):7470–7479, 2012.
[145] Jose A Baeza, Cecile JA Wolfs, Sebastiaan MJJG Nijsten, and Frank Verhaegen.Validation and uncertainty analysis of a pre-treatment 2d dose prediction model.Physics in Medicine & Biology, 63(3):035033, 2018.
[146] P Francescon, S Cora, and N Satariano. Calculation of kqclin, qmsrfclin, fmsr forseveral small detectors and for two linear accelerators using monte carlo simula-tions. Medical physics, 38(12):6513–6527, 2011.
[147] Eric E Klein, Joseph Hanley, John Bayouth, Fang-Fang Yin, William Simon, SeanDresser, Christopher Serago, Francisco Aguirre, Lijun Ma, Bijan Arjomandy, et al.Task group 142 report: Quality assurance of medical accelerators a. Medicalphysics, 36(9Part1):4197–4212, 2009.
[148] Indra J Das, Chee-Wai Cheng, Ronald J Watts, Anders Ahnesjo, John Gibbons,X Allen Li, Jessica Lowenstein, Raj K Mitra, William E Simon, and Timothy CZhu. Accelerator beam data commissioning equipment and procedures: Report ofthe tg-106 of the therapy physics committee of the aapm. Medical physics, 35(9):4186–4215, 2008.
[149] Jared Starman, Josh Star-Lack, Gary Virshup, Edward Shapiro, and RebeccaFahrig. Investigation into the optimal linear time-invariant lag correction for radarartifact removal. Medical physics, 38(5):2398–2411, 2011.
[150] Henry C Woodruff, Todsaporn Fuangrod, Pejman Rowshanfarzad, Boyd McCurdy,and Peter B Greer. Gantry-angle resolved vmat pretreatment verification using epidimage prediction. Medical physics, 40(8), 2013.
139

BIBLIOGRAPHY
[151] Igor Olaciregui-Ruiz, Roel Rozendaal, Rene FM van Oers, Ben Mijnheer, and An-ton Mans. Virtual patient 3d dose reconstruction using in air epid measurementsand a back-projection algorithm for imrt and vmat treatments. Physica Medica, 37:49–57, 2017.
[152] Matthias Fippel. Fast monte carlo dose calculation for photon beams based on thevmc electron algorithm. Medical physics, 26(8):1466–1475, 1999.
[153] Marine Soret, Stephen L Bacharach, and Irene Buvat. Partial-volume effect in pettumor imaging. Journal of Nuclear Medicine, 48(6):932, 2007.
[154] Elisabetta De Bernardi, F Fiorani Gallotta, Chiara Gianoli, F Zito, P Gerundini, andGiuseppe Baselli. Ml segmentation strategies for object interference compensationin fdg-pet lesion quantification. Methods of information in medicine, 49(05):537–541, 2010.
[155] Guang-hua Jin, Jin-han Zhu, Li-xin Chen, Xiao-wu Deng, Bo-tian Huang,Ke Yuan, and Xiao-wei Liu. Gantry angle-dependent correction of dose detec-tion error due to panel position displacement in imrt dose verification using epids.Physica Medica, 30(2):209–214, 2014.
[156] Bin Yang, Hui Geng, Ying Ding, Chi Wah Kong, Chi Wai Cheung, Tin Lok Chiu,Wai Wang Lam, Kin Yin Cheung, and Siu Ki Yu. Development of a novel method-ology for qa of respiratory-gated and vmat beam delivery using octavius 4d phan-tom. Medical Dosimetry, 2018.
[157] Sankar Arumugam, Aitang Xing, Tony Young, David Thwaites, and Lois Hol-loway. Three dimensional dose verification of vmat plans using the octavius 4ddosimetric system. In Journal of Physics: Conference Series, volume 573, page012081. IOP Publishing, 2015.
[158] Anna Fredh, Jonas Bengtsson Scherman, Lotte S Fog, and Per Munck af Rosen-schold. Patient qa systems for rotational radiation therapy: a comparative experi-mental study with intentional errors. Medical physics, 40(3):031716, 2013.
[159] Miroslav Kubat. An introduction to machine learning, volume 681. Springer, 2015.
[160] Issam Naqa, Ruijiang Li, and Martin Murphy. Machine Learning in Radiation On-cology: Theory and Applications. Springer International Publishing, 2015. ISBN9783319183053.
[161] Moyed Miften, Arthur Olch, Dimitris Mihailidis, Jean Moran, Todd Pawlicki, An-drea Molineu, Harold Li, Krishni Wijesooriya, Jie Shi, Ping Xia, et al. Tolerancelimits and methodologies for imrt measurement-based verification qa: Recommen-dations of aapm task group no. 218. Medical physics, 45(4):e53–e83, 2018.
[162] Benjamin E Nelms, Heming Zhen, and Wolfgang A Tome. Per-beam, planar imrtqa passing rates do not predict clinically relevant patient dose errors. Medicalphysics, 38(2):1037–1044, 2011.
140

BIBLIOGRAPHY
[163] Shifeng Chen, Byong Yong Yi, Xiaocheng Yang, Huijun Xu, Karl L Prado, andWarren D D’souza. Optimizing the mlc model parameters for imrt in the raystationtreatment planning system. Journal of applied clinical medical physics, 16(5):322–332, 2015.
[164] Stephen F Kry, Paola Alvarez, Andrea Molineu, Carrie Amador, James Galvin,and David S Followill. Algorithms used in heterogeneous dose calculations showsystematic differences as measured with the radiological physics center’s anthro-pomorphic thorax phantom used for rtog credentialing. International Journal ofRadiation Oncology* Biology* Physics, 85(1):e95–e100, 2013.
[165] Lucas CGG Persoon, Ada GTM Egelmeer, Michel C Ollers, Sebastiaan MJJG Ni-jsten, Esther GC Troost, and Frank Verhaegen. First clinical results of adaptiveradiotherapy based on 3d portal dosimetry for lung cancer patients with atelectasistreated with volumetric-modulated arc therapy (vmat). Acta Oncologica, 52(7):1484–1489, 2013.
[166] Costas D Maranas and Ali R Zomorrodi. Optimization methods in metabolic net-works. John Wiley & Sons, 2016.
[167] Angel E Munoz Zavala, Arturo Hernandez Aguirre, Enrique R Villa Diharce, andSalvador Botello Rionda. Constrained optimization with an improved particleswarm optimization algorithm. International Journal of Intelligent Computing andCybernetics, 1(3):425–453, 2008.
141


AcknowledgementsAll praise and glory to Almighty Allah who gave me the courage and patience to carryout this work. The presented work is a result of joint forces and would not have beenpossible without the help and support of many people. No words could be enough toexpress my gratitude to them. Yet, in the following, I will try to give the credits to thosewho contributed to make this work and my whole PhD studies possible.
Firstly, for offering me the opportunity to work on this very fruitful topic and her unsur-passed support during my PhD journey, I would like to thank my main advisor Prof. Dr.Katia Parodi. Enormous gratitude for her encouragement, motivation, patience, guidance,insightful scientific comments, ideas and suggestions and the unlimited utilization of allresources to support me personally and to support this work. Working under the supervi-sion of Prof. Dr. Parodi was an honor for me and truly enhance my skills scientific andpersonal wise.
I am especially grateful to Dr. Chiara Gianoli, my mentor during my PhD journey. Shewas informative, emotionally supportive and always available when needed. Her tired-ness, non-complaining attitude during critical times was very encouraging. Her guidanceand support were remarkable even in the period when she gave birth to her beautifuldaughter Margarita. Truly, Dr. Chiara is the perfect supporter any PhD student couldwish for.
I would also like to thank Dr. Sabine Reinhardt who supervised me on daily basis for thefirst couple of years to set the basis of this work. My thanks also go to the EPID dosimetrygroup. Namely, Dr. Stella Veloza for her kindness, support and valuable discussions and,the lady who sat next to me, Juliana Martins for doing everything she could to provide themental, technical and scientific support day in and day out. A thank you note goes also toRangoli Saxena who done a great job in a short period of time.
Since the beginning of my PhD thesis, our group has been working in close collaborationwith MAASTRO clinic, Maastricht, Netherlands. I am very grateful to Dr. Mark Podestaand Prof. Dr. Frank Verhaegen for helping to initiate the EPID project at LMU, transfertheir knowledge and continuing the remote support during the entire project.
Special thanks go to my fellow and friend Dr. Saad Aldawood, who introduces me at firstto Prof. Dr. Parodi, and helped me with all logistics to ensure the perfect settlement in thecity of Munich, and continued his genurcity by being a good friend.
For the experimental part of this thesis, I am deeply grateful to the physicists at LMUKlinikum großhadern. Especially, Sebastian Neppl who spent countless night hourshelping me with measurements and was responsive and efficient whenever his help wasneeded. I would also like to thank Dr. Michael Reiner for sharing important information,enlightening discussions and ensuring the full support is presented in order to make ourwork succeed.
I am grateful to Prof. Dr. Marco Riboldi for taking the time to review this thesis as the
143

APPENDIX B.
second referee.
I would also like to thank Dr. Peter Thirolf, Dr. George Dedes, Dr. Guillaume Landryand all the other postdoc/ staff at LS. Parodi chair for their technical support and valuablediscussions during seminars and private discussions. I thank my fellow Dr. SebastianLehrack, Dr. Matthias Wurl and Franz Englbrecht for engaging me into the German(Bavarian) culture and providing the needed support to integrate into the German system.For all my collogues at LS. Parodi chair, many thanks for making the time of my PhDdelightful and joyful.
Further thanks go to my Saudi friends in Munich Dr. Sulaiman Algomiz and AymanAlismail. True friends, I leaned on in good and tough times.
Many thanks to my colleagues at Prince Sultan military medical city Dr. Abdullah Al-rushoud, Saleh Bamajboor, Marouf Adili and Ali Zailaa for facilitating the means to makemy scientific trip to their institute enlightening and scientifically helpful.
I gratefully acknowledge the funding of my PhD provided by the custodian of the twoholy mosques’ overseas scholarship program.
For their lifelong encouragements and unrestricted support, I would like to express myspecial appreciation and thanks to my parents Abdulwhab and Sarah and my brothers andsisters. Their presence fulfilled my life with blessings and happiness.
Lastly, I am indebted to my wife Nadiyah for her patience, infinite encouragements andaccepting my faults during my studies. Big thanks to my daughter Bailsan and my sonOmar for their sacrificing through the most important years of their lives. I hope I cancompensate the time I spent away doing my research.
144