epa & zero waste sa · o organic waste processors manufacturing a product other than compost....
TRANSCRIPT

EPA & Zero Waste SA
Analysis of Resource Recovery Activities
Servicing Metropolitan Adelaide
December 2011
ABN 59 127 176 569
PO Box 1159,
Glenelg South SA 5045
ph: +61 8 8294 5571
rawtec.com.au
In association with

- IMPORTANT NOTES-
This document has been prepared by Rawtec Pty Ltd (Rawtec) for a specific purpose and client (as
named in this document) and is intended to be used solely for that purpose by that client.
The information contained within this document is based upon sources, experimentation and
methodology which at the time of preparing this document were believed to be reasonably reliable
and the accuracy of this information subsequent to this date may not necessarily be valid. This
information is not to be relied upon or extrapolated beyond its intended purpose by the client or a third
party unless it is confirmed in writing by Rawtec that it is permissible and appropriate to do so.
This document, parts thereof or the information contained therein must not be used in a misleading,
deceptive, defamatory or inaccurate manner or in any way that may otherwise be prejudicial to
Rawtec, including without limitation, in order to imply that Rawtec has endorsed a particular product or
service.
Zero Waste SA permits this document to be reproduced in whole or part for the purpose of study or
training, subject to the inclusion of an acknowledgment of the source and that it is not being used for
commercial purposes or sale. Reproduction for purposes other than those given above requires the
prior written permission of Zero Waste SA.
Document Verification
Page 1 of 1
Job title EPA & Zero Waste SA - Analysis of Resource Recovery Activities
Servicing Metropolitan Adelaide
Job number
Document title File reference
Document ref
Revision Date Filename
Draft v1 26/8/11 Description Initial Draft Report
Prepared by Checked by Approved by
Name CBC/MH/MR CBC/MR CBC/MR
Signature
Revised
Draft v1
12/10/11 Filename
Description Revised Draft Report
Revised by Checked by Approved by
Name CBC/MH/MR/KH & Client CBC/MR/KH CBC/MR
Signature
Final 7/12/11 Filename
Description Final Report for Issue. Minor erratum corrected 9/12/11.
Revised by Checked by Approved by
Name CBC/KH/MR & Client KH/MR CBC/MR
Signature

1
Executive Summary
The purpose of Clauses 11 and 12 of the Environment Protection (Waste to Resources) Policy 2010
(W2REPP) is, in essence, that all suitable waste material from the Adelaide metropolitan area be
subject to resource recovery before disposal to landfill. For the effective administration of the new
requirements under these clauses, the EPA is seeking to develop:
(a) Approval criteria for resource recovery facilities
(b) Resource recovery processing criteria
(c) Guidelines on the handling of wastes banned from landfill – or prohibited wastes – within resource
recovery facilities
This report was commissioned by the EPA and Zero Waste SA to provide an analysis of resource
recovery facilities servicing Metropolitan Adelaide that could be used to support the development of
these materials.
Consultation was conducted with selected industry stakeholders regarding views on the W2REPP,
processing, recovery rates and constraints on improvements to assist the analysis required.
Information gathered highlighted differences in operations and stakeholder views. The information
gathered helped inform the analysis and guide the development of proposed policy response options.
The report presents an overview of processes, procedures and recovery rates at resource recovery
facilities servicing metropolitan Adelaide, using the following classifications nominated by the EPA
and Zero Waste SA:
o Transfer stations;
o Transfer (pre-sorting) stations;
o Skip operations;
o Material Recovery Facilities;
o Construction & Demolition waste processors manufacturing recovered products;
o Commercial & Industrial waste processors manufacturing recovered products;
o Recycling operations (i.e. where recoverable materials are processed into recyclable parts – e.g.
elements in computers, metals from goods);
o Composters; and
o Organic waste processors manufacturing a product other than compost.
South Australia already has an established and mature waste and recycling industry. This industry
has built existing infrastructure and facilities using private sector investment which has been
financially underpinned by the waste levy instituted by the South Australian State Government. With
this levy and other support from the State Government, the industry has achieved some of the highest
levels of performance in diversion of waste material from landfill in Australia. This performance in
diversion is still improving as a result of recent increases in the waste levy and ongoing Government
initiatives. The State’s diversion performance is already predicted to be on target to achieve the
proposed 2011-2015 Draft State Waste Strategy targets (Zero Waste SA, 2011) for the C&I waste
sector (65% by 2012 and 75% by 2015). Whilst achieving nation-leading performance in C&D waste
sector resource recovery, the industry is also projected to fall just short of the 2011-2015 Draft State
Waste Strategy targets for C&D waste (85% in 2012 and 90% by 2015).
Existing strong resource recovery performance in South Australia has principally been achieved by
the adoption of source separation strategies, where customers and businesses separate and prevent
contamination of waste materials before collection. This practice has allowed cost-efficient resource
2
recovery of recyclables. The majority of existing resource recovery facilities built by the industry to
date has been based around this simple and effective approach.
This South Australian approach to resource recovery is similar to that generally practised and
promoted interstate and overseas with the exception that some other jurisdictions have attempted to
pursue ‘end-of-pipe’ strategies, where waste has instead been collected in aggregated form with little
or no source separation. In these exceptions, significant investments were made in resource
recovery plants, commonly referred to as Alternative Waste Treatment/Technology (AWT) plants,
which could separate out all of the individual materials for recycling. However, a review of local and
international experiences with these AWTs suggests that they have proven to be costly solutions, and
often have achieved mixed and sometimes problematic resource recovery outcomes, due to difficulty
in effectively removing contamination from resource recovered materials. This contamination problem
in particular has acted to significantly reduce the value and suitability of AWT end products for
recycling, undermining the commercial viability of this approach. As a consequence, many of these
jurisdictions have returned the use of source separation strategies in order to minimise this problem.
Nevertheless, such AWT-type technologies may hold future promise for South Australia to increase
resource recovery from residuals left after source separation or when source separation is not
suitable or economic for resource recovery of mixed and contaminated waste materials. Of particular
note is the emergence of waste-to-energy technologies for situations when material recovery is no
longer commercially viable, which enable extraction of value from the waste material with a significant
reduction in volume to landfill.
Key constraints to further enhancing current resource recovery by facility in South Australia were
explored. The constraints vary between facility types but primarily relate to facility design and land
area, the potential additional capital and processing costs (particularly where limited tonnages of
relevant material is involved), quality of input streams and commodity values.
The analysis of facility processes, procedures and recovery rates as well as the constraints faced by
facilities has demonstrated that there is a marked degree of individuality in how businesses operate,
even within any single facility classification. This circumstance, together with the lack of information
available on the movement of materials in these facilities, means that may not be possible to
nominate specific actions that need to be undertaken uniformly across a facility classification.
In view of this, we recommend a considered and staged approach to achieving enhanced resource
recovery in South Australia. This staged framework is summarised below and includes a number of
policy response options, as summarised in Table 1 overleaf, that the EPA could pursue. Each of
these policy response actions constitutes a set of approval criteria, which are listed in the Table,
which could be applied for the purpose of approving of a resource recovery facility by the EPA under
Clause 11(4) and (5) of the W2REPP. The Table also notes the types of guideline documents that
the EPA may need to develop for each policy response option, to assist the industry with
understanding how to implement and comply with the approval criteria.
Further details about each policy response option, associated approval criteria and the content of
suggested guideline documents are presented in this report. This report also documents consultation
conducted with a select group of industry stakeholders, which was used to inform and guide the
development of these proposed policy response options.
The first level of this staged approach could be Policy Response 1: Business-as-Usual, which is,
effectively, to do nothing and provide approval to existing transfer stations or other facilities
currently transferring waste to landfill.
o This policy response would allow current improvement trends in the industry’s resource
recovery performance to continue.
o The need for additional investment in new infrastructure or higher processing costs,
above which would have otherwise normally occurred, would be avoided.

3
Table 1: Proposed Policy Response Options and suggested Guideline document requirements
for each policy response options. Refer report for further details of options, associated
approval criteria and Guideline document requirements
Policy Response Option Approval Criteria Guidelines
Stage 1: Do nothing/Low-level response
1. Business as Usual Nil Dealing with banned waste
Dealing with exempt wastes (kerbside, hard waste)
Stage 2: Maximise efficiency of existing infrastructure/Intermediate-level response
2. Data Reporting Data collection & reporting
Weighbridge(s) for facilities > threshold size
Same for 1 above +
Data collection & reporting
3. Resource Recovery Plan (RRP)
Same for 2 above +
Written resource recovery plan for facility operation
Same for 1 & 2 above +
Design & implementation of RRPs
4. Source separated & resource recovered material direct to landfill
Same for 2 & 3 above +
Assessment procedures for source separated and/or resource recovered material
Additional data collection & reporting for these materials
Same for 1, 2 & 3 above +
Assessment & reporting of source separated and/or resource recovered material
Stage 3: New resource recovery systems & infrastructure/Advanced-level response
5. Specified processes for resource recovery
Same for 2 & 3 above +
Resource recovery processes and/or procedures for facility categories or individual facilities
Same for 1, 2 & 3 above +
Design, installation and operation of designated recovery processes and/or procedures
6. Resource recovery targets
Same for 2 & 3 above +
Resource recovery targets for facility categories or individual facilities
Same for 1, 2 & 3 above +
Development of resource recovery targets by facilities
Verification & reporting of resource recovery facility performance
{Continued from previous page}
The next level of this staged approach would be Policy Response Options 2, 3 and/or 4, which
may encourage increased efficiency from existing infrastructure. These options could be
implemented rapidly, e.g. in the next 1-2 years, and should limit the need for substantial new
expenditure by industry across metro Adelaide. Nevertheless, there would need to be industry
investment to support implementation of these options, e.g. from $500k-$1million (i.e. Options 2
and 3) up to $10 million (i.e. Option 4) industry-wide at facilities across metropolitan Adelaide.
This investment cost could lead to higher processing costs at resource recovery facilities, e.g.
ranging from $1-2/tonne (i.e. Options 2 and 3) up to $30-40/tonne (i.e. Option 4) (before any
offsets achieved from increased payments or rebates arising from increased recovery of
recyclable materials and reduced waste levy payments through less waste to landfill). The
potential benefits and additional costs to industry for each of these options are summarised
below.
o Option 2 – Data Reporting: Approved resource recovery facilities would be required to
measure and report data to the EPA on their resource recovery performance.

4
This option will provide better data and information from the industry about the
current resource recovery performance of facilities. This knowledge will make it
easier for both industry and Government policy-makers to target initiatives to
areas that cost-efficiently achieve maximum resource recovery improvement.
Approved facilities, however, may need to invest in upgrading measurement
equipment and data reporting systems, and there would also be the added cost
of properly maintaining, administering and operating these systems.
o Option 3 – Resource Recovery Plans: Approved resource recovery facilities would be
required to develop EPA-approved resource recovery plans, which are designed to
achieve continuous improvements in monitoring and resource recovery performance.
The development of these plans would encourage facilities to enhance
management and operational processes and procedures that maximise resource
recovery performance.
The development and implementation of these plans would involve additional up-
front and on-going costs for these facilities.
o Option 4 – Source separated & resource recovered material direct to landfill: Approved
resource recovery facilities would be obliged to: (1) through their resource recovery plans,
support and encourage expansion of source separation by customers; and (2) monitor
and confirm resource recovery determinations (viz. Clause 11(8) of the W2REPP) where
customer source separation has occurred.
Expanding source separation outcomes by businesses and customers would not
only increase resource recovery at the collection point but also improve the
utilisation and performance of existing South Australian resource recovery
facilities, many of which have surplus or spare processing capacity.
This option would also ensure that approved facilities can only make resource
recovery determinations on source separated material where acceptable
resource recovery levels specified by the EPA have been achieved.
There would be additional costs to facilities of putting in place and operating the
administrative systems necessary to monitor and confirm material has been
properly source separated by customers.
There would also be costs to customers and/or waste contractors for installation of additional recycling bins at customer sites, to support the expanded source separation requirements.
The final stage would be Policy Response Options 5 and 6, which propose more advanced policy
responses, such as introducing mandatory process requirements and/or targets/criteria for
resource recovery facilities. These policy response actions, however, could require substantial
capital investment, e.g. up to $50+ million industry-wide at facilities across metropolitan Adelaide,
in new resource recovery systems and infrastructure, and would incur higher processing costs,
e.g. up to $60-70/tonne (before any offsets of that cost through increased payments or rebates
arising from increased recovery of recyclable materials and reduced waste levy payments through
less waste to landfill). It is the consultants’ view that these policy response options could take
between 2-5 years to properly implement.
The policy options identified are not mutually exclusive and various responses could be implemented
over time to achieve improved outcomes as knowledge of the industry and viable opportunities for
improvement increase.
We recommend that further consideration and assessment of the proposed policy response options,
including consultation with industry and other stakeholders, should be conducted before
implementation is contemplated. This assessment process could be undertaken separately and
progressively for each policy option, depending on the proposed timing for implementation.

5
Contents
Executive Summary ................................................................................................................................ 1
Contents .................................................................................................................................................. 5
1 Introduction ...................................................................................................................................... 7
1.1 Study Objective ....................................................................................................................... 7
1.2 Scope of this Study ................................................................................................................. 8
1.3 Organisation of Report ............................................................................................................ 9
2 Consultation Interviews ................................................................................................................. 11
2.1 Approach ............................................................................................................................... 11
2.2 Key Interview Outcomes & Findings ..................................................................................... 15
2.3 Previous Consultation: Industry Submissions – August 2009 .............................................. 23
2.4 Key Consultation Themes/Points .......................................................................................... 25
3 Facility Processes, Procedures & Recovery Rates....................................................................... 28
3.1 Important Qualification .......................................................................................................... 28
3.2 Overview ............................................................................................................................... 28
3.3 Facility Descriptions .............................................................................................................. 29
3.4 The Facility Role in Resource Recovery & Waste Disposal ................................................. 51
3.5 Interstate and Overseas Trends – Resource Recovery Facilities ......................................... 57
4 Key Constraints for Resource Recovery Facilities ........................................................................ 61
4.1 Overview ............................................................................................................................... 61
4.2 Key Constraints for Resource Recovery by Facility .............................................................. 62
5 Potential Costs & Benefits of Increasing Resource Recovery Using Different Policy Response
Options .................................................................................................................................................. 67
5.1 Introduction ............................................................................................................................ 67
5.2 Policy Response Options ...................................................................................................... 67
5.3 Resource Recovery Performance/Outcomes ....................................................................... 71
5.4 Industry Outcomes of Policy Options .................................................................................... 76
5.5 Identification of Other Benefits & Costs ................................................................................ 86
5.6 Policy Implementation Strategies .......................................................................................... 90
6 Dealing with Banned Wastes ........................................................................................................ 92
7 Future Achievable Recovery Rates, 2012-2017 ........................................................................... 96
7.1 Introduction ............................................................................................................................ 96
7.2 Recovery rates by facility ...................................................................................................... 96
7.3 Projections across the State ................................................................................................. 97
8 Recovery Rate Data Collection & Reporting ................................................................................. 98

6
8.1 Current Material Movement Data Recorded by Facilities ..................................................... 98
8.2 Current Systems Used to Capture Materials Movement Data .............................................. 99
8.3 Data Required from Approved Facilities ............................................................................... 99
8.4 Options for Resource Recovery Data Capture ................................................................... 100
9 Key Findings & Recommendations ............................................................................................. 103
9.1 Approval Criteria ................................................................................................................. 103
9.2 Resource Recovery Criteria ................................................................................................ 104
9.3 Guidelines for Banned Materials ......................................................................................... 105
9.4 Future achievable recovery ................................................................................................. 106
9.5 Data reporting...................................................................................................................... 107
10 References .............................................................................................................................. 108
Appendix 1: Industry Consultation Survey Questions ......................................................................... 109

7
1 Introduction
1.1 Study Objective From 1 September 2012, the Environment Protection (Waste to Resources) Policy 2010 (W2REPP)
will require viz. Clauses 11 and 12:
That all waste produced in Metropolitan Adelaide (viz. Schedule 2) is subject to resource
recovery processes.
o Council collections of kerbside and hard waste (where kerbside recycling and green
waste services are offered), public place bins and street sweepings (viz. Schedule 3)
are excluded from this requirement.
o Thus, this new requirement will apply primarily to waste from Commercial and
Industrial (C&I) and Construction & Demolition (C&D) sources or activities with the
exclusion of (viz. Schedule 3):
Hazardous, medical quarantine waste materials;
Waste that is authorised by the EPA for disposal to landfill;
Waste that licenced material recovery facilities or composting depots are not
authorised to receive.
In brief, the following will principally apply to C&I and C&D waste material under the new
requirements.
1. A landfill depot can simply receive waste from the following types of facilities (viz. Clauses 11(4)
and (5)).
(a) “An appropriate licenced material recovery facility or composting depot; or
(b) “Some other facility that has been approved by the [Environment Protection] Authority
[EPA] ...”
However, a landfill depot can receive waste from other places if it can demonstrate that the waste
has been subject to resource recovery processes carried out ‘in accordance with the waste
management hierarchy and to the extent reasonably achievable’.
2. The process for determination of whether a waste has been subject to ‘resource recovery
processes’ at a facility will effectively be set by the EPA through (viz. Clause 11(8)):
(a) Licence conditions applying to that facility or depot;
(b) Approval conditions granted to a facility per 1(b) above; or
(c) Guidelines published by the EPA.
It should be noted that this determination may include that:
“the waste need not be subject to treatment, or further treatment, so long as any such
determination is made in accordance with” the above.
3. A landfill depot will also not be able to accept ‘prohibited landfill waste’ for disposal (viz.: Clause
12(3)) unless a determination has been made (viz. Clause 12(4)) that this material also “need not
be subject to treatment, or further treatment, for the removal of” this prohibited material.
Prohibited materials (viz.: Schedule 4) include:
(a) Risk-based waste materials; such as hazardous wastes, batteries, medical waste,
oils, tyres, vehicles, etc.
o This restriction commenced from 1 September 2010 for all materials except
vehicles, which commenced on 1 September 2011 (the first anniversary of the
W2REPP coming into operation).
8
(b) Aggregated recoverable materials; such as cardboard and paper, metals, plastics,
organics, etc. – essentially material that has already been source separated or
recovered for the purpose of recycling.
o The restriction for most of these materials commenced immediately, but several
will not commence until the W2REPP’s first or second anniversary.
(c) Other materials; which includes lamps (from lighting), computing equipment,
whitegoods, other electronic waste, etc.
o Depending on the material these restrictions will be introduced gradually between
the W2REPP’s first and third anniversaries.
1.2 Scope of this Study
In view of the above, the EPA is seeking to develop, for administration of these new requirements:
(a) Approval criteria for resource recovery facilities –
o For the purposes of 1(b) above.
(b) Resource recovery processing criteria –
o Which the EPA may apply to guidelines to be developed to enable determinations
of acceptable resource recovery under 2 above.
(c) Guidelines on the handling of wastes banned from landfill – or prohibited wastes – within
resource recovery facilities –
o For the purposes of determinations as to whether a material requires resource
recovery per 3 above and that all reasonable and practicable steps have been
undertaken for the removal of banned material.
Rawtec and Mike Haywood-SRS have been engaged by the EPA and Zero Waste SA (ZWSA) to
provide the following specific information, which will be used by the EPA to support the development
of these materials.
1. A description of the main processes and procedures currently being used in the nine facility
categories specified– see Table 1.1 overleaf. This information is to be based on interviews
with willing industry participants and desktop analysis of key relevant trends interstate and
overseas.
2. Identification of recovery rates and process or procedural differences between facilities within
each facility type (using selective examples).
3. Discussion of key constraints (excluding the availability of markets for recovered resources)
for the successful recovery of recyclable materials (e.g. the causes of contamination of
recyclables, OHS limitations).
4. Identification of the likely potential costs and benefits of adopting higher performing processes
or procedures.
5. Outline of processes and constraints on the removal of banned wastes (for current and future
specified bans) from waste destined for landfill.
6. Recommendation on the achievable recovery rates for recyclable materials within specified
facility types for the next five years (2012-2017) having regard to the recycling capacity
analysis undertaken in the South Australian Recycling Industry Investment Review: Setting
the Picture (Rawtec & Wright Corporate Strategy for Zero Waste SA, 2009), South Australian
Recycling Industry Investment Review: Priority Investment Review (Rawtec & Wright
Corporate Strategy for Zero Waste SA, 2009).
7. Recommendations on an appropriate methodology and format for recovery rate data to be
efficiently provided to the EPA and Zero Waste SA (i.e. waste received at the facility, % waste
directed to resource recovery, and % directed to landfill) within specified facility types. This
should be developed using feedback in interviews with industry and identify how facilities
record movements to landfills.

9
Table 1.1: Classification of Resource Recovery Facilities provided by the EPA
RESOURCE RECOVERY FACILITY CATEGORIES
Abbreviation Category
TS Transfer Stations facilities that predominantly package waste materials for transport to
landfill
TS (PS) Transfer (pre-sorting) stations (e.g. many smaller transfer stations are designed for a high
% of sorting of cardboard/paper, metals, glass, plastic packaging, green waste, etc. -
whether by individuals or with machinery - with much smaller amounts of residual waste)
Skip Skip operations (sample of key waste flows)
MRF(+ waste
category)*
Materials Recovery Facilities (mechanised)
C&D WP* C&D waste processors manufacturing recovered products
C&I WP* C&I waste processors manufacturing recovered products
R Recycling operations (i.e. where recoverable materials are processed into recyclable
parts – e.g. elements in computers, metals from goods)
RR WP Recovered recyclable waste processors making new products from segregated recyclable
resources (e.g. recycled plastic post and landscape supply producers)
C Composters
OW WP Organic waste processors manufacturing a product other than compost
* It is understood that these operations may all typically be viewed as MRFs but they are differentiated here given potentially
different processes and motivations in these facility types.
1.3 Organisation of Report
To address the above requirements, this report is set out as follows.
Section 2 – Consultation Interviews – Summarises the consultation interviews conducted with
industry, including key findings and recommendations relevant to the above requirements.
Section 3 – Facility Processes, Procedures & Recovery Rates – Provides descriptions of the
different facilities listed in Table 1.1 above, including typical procedures used and recovery rates
achieved.
o This section provides the specific information for Items 1 and 2 requested by the EPA.
Section 4 – Key Constraints for Resource Recovery Facilities – Discusses the key constraints
for the different facilities which may be relevant to implementation of the W2REPP requirements.
Section 5 – Cost & Benefits of Increasing Resource Recovery – Identifies the potential costs
and benefits of achieving increased resource recovery through implementation of the W2REPP.
o This assessment included identification of various policy options or settings for approval
criteria that the EPA might wish to consider for resource recovery facilities.
o This information can be used by the EPA to consider what approval and resource
recovery criteria could or should be implemented.

10
Section 6 – Dealing with Banned Wastes – Discusses the approaches and potential
requirements for facilities to deal with banned wastes under the W2REPP.
o This information can be used by the EPA to inform the development of guidelines on the
handling of wastes banned from landfill.
Section 7 – Future Achievable Recovery Rates, 2012-2017 – Provides projections of
improvements in recovery rates that might be achieved by different facilities and for C&I and C&D
sectors in South Australia.
Section 8 – Recovery Rate Collection Data – Considers the potential requirements and
strategies that may be needed for reporting of recovery rate data by approved facilities.
Section 9 – Key Findings & Recommendations – Sets out the key findings and
recommendations to the EPA and Zero Waste SA relevant to the study’s objectives.

11
2 Consultation Interviews
2.1 Approach
2.1.1 Introduction
The approach to the consultation interviews was developed in consultation with the EPA and Zero
Waste SA, and also by reference to an Industry Advisory Group containing members from the South
Australian waste management and recycling industry. The following overviews key aspects of how
consultation interviews were conducted and summarises the consultation findings.
The end of this section also includes a brief summary of the EPA’s Response to submissions on the
Draft Environment Protection (Waste to Resources) Policy (August 2009).
o This document was cited by several consultation respondents as being relevant to properly
considering the views and perspectives of the industry on matters relevant to this study.
2.1.2 Qualification on the use of interview outcomes
It is important to recognise that the function of the consultation interviews was to engage selected
members from the industry and solicit and discuss their views and opinions on issues relevant to the
W2REPP and this study. This engagement enabled identification of what views and opinions existed,
and also gave a qualitative insight to how prevalent and strongly held such views and opinions were,
amongst this select group. However, not all consultation respondents necessarily offered a view or
opinion to every interview question. Furthermore, the expression of these views and opinions by
consultation respondents was subjective and diverse in terms of sentiment.
Where possible, the consultation findings in this report attempt to convey, at a high level, this
qualitative insight, i.e. how frequently, widely or strongly views or opinions were expressed or held,
gained by the consultants. This information has been included at the request of the EPA and Zero
Waste SA. It may be useful in assisting with planning future consultation with industry. However, for
the above reasons there should be care in interpreting and/or relying on this qualitative information for
this purpose, as it may not be representative of the industry position and it is limited to those
consultation respondents that expressed a view or opinion.
2.1.3 Confidentiality
It was agreed with EPA and Zero Waste SA that consultations would be conducted on the
condition of confidentiality, to encourage participation and cooperation by consultation candidates.
o All data, views and opinions obtained during consultations would be kept confidential.
This information would be presented in this report in an aggregated or rolled up
format, so that consultation candidates or their facilities were not explicitly
identified.
2.1.4 Number of Consultation Interviews
20 consultation interviews were agreed with EPA and Zero Waste SA to obtain representative
information and industry views.
2.1.5 Selection of Consultation Candidates
An initial list of potential candidates was compiled by Rawtec and Mike Haywood SRS.
o The list was designed to achieve a representative cross section of the EPA facility
categories that were handling C&I and C&D waste material (per Table 1.1 in this report).

12
o Several consultation candidates could be interviewed together, allowing for more than 20
interviews to be conducted.
This initial list was reviewed by EPA and Zero Waste SA and the Industry Advisory Group.
The final list was then agreed with the EPA.
o Table 2.1 overleaf summarises the number and types of facilities included in the
consultation list by EPA facility classification.
There were 21 facilities invited to participate.
Several of the operators of these facilities also operated multiple other
facilities but only the designated facility was targeted for the purpose of
this study.
o Note: Not all facilities agreed or were available to participate in the consultation
interviews.
Nineteen facilities agreed to participate in a consultation interview.
Two facilities declined to participate.
One organisation agreed to participate but was unavailable for an interview within
the consultation period available for the study.
As can be seen in Table 2.1, many of the facilities were found to meet the descriptions relevant to
several of the EPA’s Facility Categories.
o For example:
A C&D facility operator would operate a MRF process, to separate mixed C&D
waste material inputs, and then use a C&D WP process to transform recovered
materials into manufactured products.
It could also be said that the C&D WP definition was equivalent to the RR
WP facility description, and these facilities, could also be classified under
this category. The same can be said for the C&I WP, which also appears
to be equivalent to RR WP.
A C&I facility operator operates a MRF process, to separate mixed C&D waste
material inputs, but then uses a R process to aggregate and bale the recovered
materials.
Consequently, it was often difficult to attribute a facility to a singular EPA facility category.
o More than one facility category was often present in a facility.
o The facility categories might be better considered as categories describing distinct
processing steps in the overall resource recovery process.

13
Table 2.1: Overview of facilities included in the consultation by relevant EPA facility
classification(s).
Facility Category
TS TS (PS) Skip MRF C&D WP C&I WP R RR WP C OW WP
Facility 1 X
Facility 2 X X X X
Facility 3 X X X X
Facility 4 X X X X
Facility 5 X
Facility 6 X X
Facility 7 X X X
Facility 8 X
Facility 9 X X X X
Facility 10 X
Facility 11 X X X
Facility 12 X
Facility 13 X X X X X X
Facility 14 X
Facility 15 X X X X X
Facility 16 X X X
Facility 17 X X
Facility 18 X X
Facility 19 X X X
Facility 20 X X
Facility 21 X X
Number 3 8 3 10 6 3 11 7 2 2

14
2.1.6 Interview Questions
An initial list of interview questions was developed by Rawtec and Mike Haywood SRS.
o In addition to strictly addressing the specific information requested for the purposes of the
study (per Section 1.2 Scope of Study), it was agreed with EPA and Zero Waste SA that
the questions should allow the industry an opportunity to offer views and perspectives on:
The W2REPP and its implementation; and
What they might like to see included in relevant approval criteria, resource
recovery criteria and/or guidelines developed by the EPA.
These questions were also reviewed by the EPA and Zero Waste SA and referred to the Industry
Advisory Group for comment.
The final questions were agreed with the EPA and Zero Waste SA.
o Table 2.2 below summarises these questions.
o Appendix A includes a list of the question types used in the consultation interviews.
2.1.7 Consultation Period
The consultation interviews were conducted between 22 July and 5 August 2011.
Table 2.2: Summary of questions asked during the consultation interviews
Consultation Interview Questions
1. The consultation candidate’s views of the W2REPP and its implications for your business or facility.
2. Relevant information on the facility’s processes and procedures, including:
Recovery rates achieved;
Material(s) accepted and processed (for resource recovery);
Methods for determination of acceptability and/or rejection; etc.
3. Perceived challenges and opportunities for the facility arising from introduction of the W2REPP, including capacity and costs or benefits for expanding the facility’s capability to accept more and other types of material.
4. If the consultation candidate had any views on how they would like to see the W2REPP implemented, e.g. in respect of:
Approval criteria;
Resource recovery criteria;
Guidelines for acceptance determination of wastes containing banned materials;
EPA Licence Conditions.
5. What types of support would be valuable to helping them and/or their facility adapt to the W2REPP.
6. How they would like to see data reporting of compliance and/or performance to the EPA handled.
15
2.2 Key Interview Outcomes & Findings
2.2.1 Introduction
The following overviews the type and nature of responses received during consultation interviews in
response to the questions in Table 2.2 above.
Note:
For questions 2 and 3, analysis of information obtained regarding processes and procedures,
recovery rates, material acceptance criteria, and/or costs or benefits of expanding the facility, is
presented subsequently in Sections 3 and 5, respectively, of this report.
Consequently, this section gives general views or feedback from consultation respondents about
these questions.
2.2.2 Responses to Questions
2.2.2.1 Question 1 – Views & Implication of the W2REPP
There were mixed and diverging, on occasion contradictory, responses from consultation
respondents to this question.
In the consultants’ view, a majority of consultation respondents displayed varying degrees of
uncertainty about the implications that the W2REPP could have for their business.
o Large transfer station, MRF operators and composting facilities and Council-owned
transfer stations seemed to be better informed about the W2REPP than private-sector
operators of smaller facilities, e.g. Skip-bin operators, plastics re-processors, composters.
Several consultation respondents, mainly existing transfer station or MRF
operators, said they had or were already looking at installing new resource
recovery equipment to upgrade their facilities.
These consultation respondents stated that they had considered or taken
this action in anticipation of the W2REPP’s introduction, to take
advantage of new commercial opportunities from additional requirements
for resource recovery.
In the consultants’ view, however, this was not necessarily the only
reason why they had taken this action, and it may also have been a
response to the increased waste levy and rise in commodity prices, and
to achieve commercial market positioning.
It is the consultants’ observation that these upgraded resource recovery
facilities appear to be targeting already ‘cherry-picked’ or partially source
separated and/or aggregated waste streams, e.g.
o C&I – Mixed dry recyclables, and/or
o C&D – Mixed dry inerts, timber and/or steel.
It is the consultants’ understanding, from its own industry knowledge and
admissions by some consultant respondents, that several of the new or
upgraded facilities already built and in operation are not currently utilised
at full capacity.
o There was an expectation by the consultation respondents that
had invested in new or upgraded resource recovery
infrastructure, that the W2REPP would increase demand for use
of this infrastructure.

16
The resource recovery of these new or upgraded facilities could not be
confirmed by the consultants as consultation respondents were reluctant,
citing commercial confidentiality, to provide performance data.
o It was noted by the consultants that several other consultation
respondents had suggested that there may be uncertainty about
the resource recovery performance of some of these new or
upgraded resource recovery facilities.
It is therefore the consultants’ view that this new infrastructure may not
necessarily be suitable for general waste streams.
In the consultants’ opinion, no consultation respondent that was
considering new, or upgrading of existing, resource recovery
infrastructure appeared to be proposing an Alternative Waste Treatment
(AWT) type plant which could take whatever general waste or residual
might be presented.
A common view expressed to the consultants by the majority of consultation respondents was
that there was still considerable ambiguity or uncertainty about what the W2REPP actually meant
for the industry.
o Virtually all respondents said that they were keen to learn more about the W2REPP, so
they could prepare and adapt their business accordingly.
A couple of respondents queried why they were being consulted again, pointing out that they had
already given their views in submissions made a couple of years ago to the EPA on the Draft
Version of the W2REPP.
o They asked that these previous views also be considered in the current study.
In view of this comment, relevant aspects of the EPA’s Response to submissions
for the Draft Environment Protection (Waste to Resources) Policy (August 2009)
has been included and presented by the consultants at the end of this section.
Respondents were asked whether the W2REPP was likely to affect how they handled waste and
recyclables.
o Several consultation respondents thought the W2REPP would bring in some additional
amounts of material but not significant amounts.
In elaborating these comments to the consultants, these consultation
respondents seemed to hold a view that the industry and market drivers,
including the rise in the waste levy, were already dictating improvements in
resource recovery performance.
o Several consultation respondents (but not necessarily the same ones as above)
commented that the W2REPP does not allow them to discriminate between general
wastes from source separated sites versus those sites where there was no source
separation.
It was questioned by consultation respondents whether this encouraged source
separation, which they thought was supposed to be the priority policy paradigm
for Zero Waste SA and EPA.
o There was a view from several consultation respondents that even if some facilities
started rejecting waste and banned materials because of the W2REPP, the market would
generally always find a destination for it.
This destination could be interstate.
The additional costs of having to transport waste would be the greatest incentive
to deliver material to correct facilities in the first instance.
o Several consultation respondents (again, not necessarily the same ones as above)
opined that increasing the waste levy was a more practical approach to encouraging
investment in additional resource recovery, i.e. let the market drive change – this has
already worked successfully – instead of the regulatory approach being imposed by the
W2REPP.

17
About half of the other consultation respondents commented that they thought the W2REPP
would not significantly affect their business.
o Excluding the major transfer station operators, the majority of consultation respondents
indicated that they did not send waste material direct to a landfill but via a transfer station,
MRF, composter, and/or other resource recovery facilities.
These consultation respondents indicated that it was their intention to continue
this practice.
These consultation respondents said that they had assumed that downstream
recipients of the waste material, which would eventually send the residual
material to landfill, would become approved under the W2REPP.
Hence, these consultation respondents said they had not given it much
consideration or thought they would need to become approved.
o However, after further discussion about the W2REPP, a number (about a third) of
consultation respondents seemed to change their mind and suggested to the consultants
that they may very well seek to become an approved facility.
In the consultants’ observation, this change in position seemed largely driven by
the commercial concern that their options to manage disposal of waste material
may become too restricted if they could only send it to certain approved facilities.
They liked the idea of keeping the option open for direct disposal to
landfill, in the event this was required or became more cost efficient.
They also seemed worried that downstream approved facilities might
arbitrarily push back up to them supposed higher costs and/or more
stringent contamination requirements.
2.2.2.2 Question 2 –Information on the facility’s processes and procedures
About half of consultation respondents expressed reservations to the consultants about providing
what they considered ‘commercially confidential data’.
o The majority of these consultation respondents were generally unwilling to provide the
information and data about their facility processes and procedures that was requested by
the consultants.
o This position taken by these consultation respondents effectively prevented the
consultants from collecting all of the relevant data expected by the EPA and Zero Waste
SA for the purposes of this study.
Other consultation respondents were generally more (but not necessarily fully) forthcoming.
o These consultation respondents were generally willing to provide some information on
their resource recovery facility, what wastes they received and/or what procedures were
applied, and/or generic data on performance.
o However, the quality of this information provided to the consultants varied between
consultation respondents, ranging from detailed and specific in some instances, to sparse
and more general for others.
The information obtained from this question was used by the consultants to develop the
description of Facility Processes, Procedures and Recovery Rates in Section 3 of this report.
o However, due to the reluctance of some consultation respondents in providing the
requested information, it was necessary for the consultants to supplement this information
with other knowledge and data sources, including the consultants’ own industry
knowledge and experience.
The following was noted by the consultants about some relevant procedures being used by
consultation respondents at facilities.
o The majority weighed all material in and out using weighbridges except for several
smaller facilities (e.g. skip operators, Council-owned transfer stations).
For these smaller facilities, consultant respondents indicated that:
Not all had a weigh bridge.

18
However, the facility that they next sent their material to would usually
weigh the material, so they had this data available to them.
o As a consequence, it is the consultants’ view that all facilities should have access to data
that they could use to report their resource recovery performance.
Virtually all consultation respondents were paid or had to pay based on weight of
material they received, recovered or disposed of.
This was essential commercial data required by consultation respondents
for operating their facility and business.
The majority of consultation respondents also knew and/or recorded where input
material originated from and output material was sent.
This information, however, was not necessarily systematically collected,
stored and collated for management purposes.
o The majority of consultation respondents said that they had procedures on how incoming
material was assessed for suitability or acceptability.
However, except for the larger commercial operators, consultation respondents
commented that these procedures were not necessarily documented in a written
manual or regularly audited.
It was indicated by the consultation respondents that these procedures
were usually successfully conveyed amongst facility operating staff
verbally or by visual instruction.
The majority of consultation respondents reported that material was occasionally
rejected where it contained banned items or was too contaminated.
The majority of consultation respondents indicated that this generally
occurred by visual inspection at the gate.
o They also noted that contamination in waste material often could
not be identified until the material was tipped on the floor or
processed.
When contamination was identified, several consultant respondents
indicated that the contractor who dropped off the waste would be
required to take it back.
o These consultant respondents said that this was usually very
inconvenient or costly for the contractor, and as a result, acted as
an incentive to make sure banned or contaminated material was
not presented.
o Furthermore, it was suggested by consultant respondents that
the affected contractor would also send a signal back to their
customer about the incident, which would usually prevent it from
happening again.
Several consultation respondents said that if a contractor became a
repeat offender, they could ban them from using the facility, and the
threat of this was an additional deterrent to ensure compliance by
contractors.
Alternatively, several consultation respondents indicated that, in some
circumstances, they offer the option of a surcharge to the processing of
the material that contained banned or contaminated material.
o According to these consultation respondents, such
circumstances were subject to the facility’s capacity to safely and
profitably handle and/or process the material to remove banned
or contaminated material.
o These consultation respondents also commented that, as the
contractor and/or their customer had to pay this extra cost, it was

19
another incentive for the contractor and/or customer to prevent
the incident from happening again.
2.2.2.3 Question 3 – Perceived challenges and opportunities from the W2REPP including
capacity to accept more material
Answers to this question were also hampered by consultant respondents’ reluctance to
disclose specific information about their operations.
Most consultation respondents also remarked that they had great difficulty in responding to
this question as there was not enough information about the implementation and
administration of the W2REPP for them to understand what these challenges and
opportunities might be.
Whilst most consultant respondents believed they could expand the capacity of their facilities
– it did not seem to be a problem to double or even triple capacity except for a few
consultation respondents with site area constraints:
o However, there had to be a clear commercial driver for them to do so.
Several consultant respondents said it would be a futile exercise for them to
invest in new infrastructure and procedures:
Until there was more certainty from the EPA on what was required;
Unless it was commercially viable and profitable for them to do so.
o Most consultant respondents said that the material inputs had to be of the correct
type and not contaminated.
Except for Transfer Stations, most facilities were set up to receive source
separated and/or mixed recyclable streams.
Dealing with banned material:
o The majority of consultant respondents commented that there had to be clear and
practical guidelines and/or procedures from the EPA on this issue.
o Several consultant respondents remarked that facility operators could not 100%
control the behaviour of waste generators and it was impossible to identify every
single item in a load of waste material.
These consultant respondents said once a load was contaminated and
mixed, it was an almost impossible task to identify and pick out small items.
There was genuine concern by several consultation respondents, especially
those involved with operating transfer stations, about being caught out by
such small items during EPA audits, even where a facility had conscientiously
attempted to ensure, through processes and procedures, removal of these
banned materials.
Data reporting:
o The majority of consultation respondents expressed concerns about the commercial
confidentiality of data they might be required to report.
Several consultation respondents, including those operating transfer stations and MRFs,
raised the issue of contracted Council collection of kerb-side collection, hard waste and public
place bins: was this C&I material or Municipal solid waste material?
o It was commented by these consultation respondents that they were unhappy that
Municipal waste material was being exempted from the W2REPP.
o These consultation respondents were also uncertain, and sought advice, about how
such material could be correctly classified and verified at a facility, to ensure they did
not inadvertently contravene the W2REPP.
o It is the consultants’ view that this issue could be difficult to resolve unless there was
some type of documentation that accompanied these waste materials to a facility that
verified its proper origin.

20
2.2.3 Question 4 – Views W2REPP implementation
(a) Approval criteria
A number of potential approval criteria were discussed.
o There was no consensus from consultation respondents on this issue.
o Positions of the consultation respondents ranged from none or minimal approval criteria
to a large number of stringent approval criteria.
Some consultation respondents wanted stringent criteria in order to level the
playing field and to ensure that perceived ‘unscrupulous’ or ‘low-cost’ operators
could not circumvent the system.
Some consultation respondents objected altogether to the idea of approval
criteria, particularly resource recovery targets.
o The main areas of approval requirements or criteria that were suggested by consultation
respondents were as follows.
EPA Licenced –
All facilities seeking approval should be EPA licenced.
Documentation/Procedural requirements –
Approved facilities should have some form of auditable quality-type
system for resource recovery activities, covering how they manage:
o Source separation by customers;
o Waste collection contractors;
o Waste assessment;
o Facility operation;
o Assessment of performance;
o Data reporting; etc.
Input material restrictions –
Facilities should only be approved for certain input materials that their
resource recovery processes were suitable for.
Resource recovery targets –
Standard performance targets for resource recovery by facilities.
See additional comments below.
Resource recovery processes –
Facilities should have certain resource recovery processes in place.
(b) Resource Recovery criteria
Several consultation respondents, including operators of transfer stations, MRFs, waste
processors and recycling operations, remarked that they had heard rumours which suggested that
resource recovery targets might be specified by the EPA as part of its implementation of the
W2REPP.
o It was believed by these consultation respondents that any waste or recycling stream, in
particular, general waste was too variable for them to be able to continuously guarantee a
resource recovery outcome from their facility or operations. This view was also endorsed
by the majority of other consultation respondents when this potential issue was brought to
their attention by the consultants.
o These consultation respondents said that they had facilities where input materials were
tightly managed and required upstream source separation practices to achieve a
controlled outcome, and even then resource recovery proved to be highly variable.
These consultation respondents believed that this would be the situation for the majority
of resource recovery or recycling facilities in South Australia, because of the State’s
historical approach of adopting source separation as the best approach to improve
recycling rates.

21
(c) Guidelines for wastes containing banned materials
Most consultation respondents that expressed a view considered it would be a challenge to deal
with the growing number of banned materials specified by the W2REPP.
o Virtually all of these consultation respondents agreed it was almost impossible to
guarantee removal of such items e.g. a mobile phone in a waste load was often like
looking for a needle-in-a-stack. An emblematic view of this issue amongst consultant
respondents was: No matter how much money or time was spent, not all items could ever
be found.
o Several of these respondents remarked that they were doing their best to remove such
materials, by putting in processes and procedures; but there was a concern that an EPA
audit might find one such item and then penalise them.
(d) Data Collection
There was reluctance by the majority of consultation respondents to report data which they
considered commercially confidential. There was widespread concern amongst consultation
respondents that government agencies tend to ask for more data than they actually need which
exacerbates this problem and also unnecessarily increases administrative burdens for industry.
(e) EPA Licence Conditions
The majority of consultation respondents were unaware that their licence conditions might be
changed – even if they did not seek to become an approved facility.
Several consultation respondents suggested that unless licence conditions were not changed
others in the industry might not willingly participate in supporting implementation of the W2REPP.
o These consultation respondents said that this view would be particularly relevant to
reporting of ‘commercially confidential’ data on facility resource recovery performance or
outcomes.
2.2.4 Question 5 – Support for implementation of the W2REPP
Areas where consultant respondents perceived support might be useful to them for
implementation of the W2REPP were:
o Industry communication –
Early and regular consultation and communication by the EPA about changes
required under the W2REPP;
Industry input to further development of implementation strategy and
implementation guidelines.
o Certainty & clarity on EPA requirements –
Relevant EPA requirements to be clear and practical;
The EPA should provide flexible but unambiguous guidelines.
o Industry support for customer education –
Development of information that industry could provide to customers, helping to
explain changes caused by the W2REPP and if and how the changes might
affect them.
o Industry funding to support implementation –
Operational/Inception:
Funding to assist in operational implementation:
o Staff training;
o Development of systems/procedures for facility management or
data reporting;
o Communication with customers about proposed changes.
Infrastructure/capital:
Grants to support :
o Weighbridge and/or other equipment for improved data
collection/reporting;
o New infrastructure or equipment for resource recovery.

22
2.2.5 Format of Data reporting to EPA
If industry had to report data, views expressed by consultation respondents were generally as
follows.
o A substantial number (more than half) of consultation respondents said that they would
be reluctant to report data unless it became a licence condition.
o If required, the majority of consultation respondents would accept reporting by:
Lodging paper returns.
Electronic reporting, e.g. via internet.
o Whatever system, all consultant respondents that expressed a view said it had to be
simple, straight-forward and not too onerous or time consuming.
It was suggested by most of these consultation respondents that the EPA should
target and ask for what they need specifically for the W2REPP and not other
unrelated industry data and information.
There was a perception by several consultation respondents that too
often such reporting was used as an opportunity for broader information
gathering to satisfy curiosity or unrelated issues.
o This unnecessarily added time demands with complying.
o It also meant industry was more reluctant to disclose the
information needed.
These consultation respondents also remarked that data collection by the
EPA should not extend beyond information directly relevant to
demonstrating compliance with W2REPP requirements.
These consultation respondents indicated that the return interval should not be
too frequent.
Particularly for smaller facilities that might not have as many support or
administrative staff.
However, several respondents said that they might prefer more frequent
reporting, e.g. monthly, so it became routine and would not be forgotten.
o Several respondents strongly reiterated that it was critical that data was kept confidential.
In this regard, the system should be operated by the EPA and not another
Government agency.
Access to this data by others should be restricted.
o There were some consultation respondents who had seen or experienced ZEUS, which is
being used by Zero Waste SA to collect industry data.
For those consultation respondents who had used the system, the perception
was generally favourable.
These consultation respondents said that they would not necessarily
have reservations with this or a similar system for data reporting.
However, there were isolated unenthusiastic comments reported by one or two
consultation respondents as follows.
ZEUS was considered too detailed in the information it sought.
It did not seem to be optimally designed to suit the way the industry
operated or how material was already classified.
There were concerns about subsequent use of the data and maintaining
confidentiality.

23
2.3 Previous Consultation: Industry Submissions – August 2009
2.3.1 Introduction
During industry consultations, it was identified by several respondents that they had provided input to
the Draft W2REPP, and that the EPA’s Response to submissions for the Draft (Waste to Resources)
Policy (August 2009) should be referred to for additional insight to the industry’s views on the
W2REPP. The following are some excerpts from this report considered relevant to this study and
which also give insight to the industry’s views on issues raised in the consultation interviews above.
It is noted that this EPA Response paper is extensive and many other issues are discussed in it. The
following excerpts are not exhaustive in this regard but are designed to bring to attention several
issues considered relevant and important to this study.
2.3.2 Section 7.8 Clauses 11 and 12—Landfill disposal certificates
This section dealt with proposed use of landfill disposal certificates (LDCs) in Clauses 11 and 12 to
track material and determine if it had been deemed acceptable for disposal to landfill.
Industry views:
o “industry operators had concerns with the functionality of this proposed mechanism. A
range of submissions commented on uncertainty around the administration of the LDCs.
Also, several landfill operators verbally advised that the protection LDCs offered was
unnecessary for them.”
EPA Recommendation:
o “Amend the clauses to remove references to landfill disposal certificates while
maintaining their substantive purpose”
Consequently, landfill disposal certificates were omitted from the W2REPP.
2.3.3 Section 7.9 Clauses 11— Requirement for resource recovery prior to disposal
to landfill/Schedule 3
This Section dealt with the issue of setting resource recovery targets or criteria for facilities.
Industry views:
o “A number of ... industry submissions have commented on the uncertainty in the
broad language of the clause (i.e. ‘reasonably available resource recovery
processes’). Several queries were also received on whether particular activities would
constitute appropriate resource recovery processes.”
EPA Response:
o “Because of the diversity of activity, broad recovery percentages to be achieved by
facility or category types are not currently realistic. Each facility may receive different
waste streams from different sources, and which may also already have been
segregated to differing extents, such that the ability to recover a certain percentage of
recyclable material will vary markedly. Recovery levels may also vary within a facility
across time as waste clients change.”
o “The EPA has determined that improved certainty and the ability to adapt to
innovations over time will be best enabled by amending the clause in relation to what
constitutes appropriate resource recovery processes to relate to activities authorised
or approved by the EPA. Proposed landfill bans (clause 12), licence conditions, and
guidelines for depots (Part 6) can all be used to support recovery standards at such
facilities.”

24
o “The three major resource recovery and waste transfer stations that service the
northern metropolitan area, acting as consolidation points for residual waste prior to
its transfer to landfill, will be classed as appropriate resource recovery processes. As
waste streams are monitored over time, improved diversion may be required using
licensing provisions.”
o “The Town of Gawler’s waste and recycling transfer station provides areas for
recyclables to be separated by individuals attending at the station. It will be an
appropriate resource recovery process, provided that the station is operated so as to
monitor individuals’ behaviour.”
The above responses suggest that:
Industry sought greater certainty regarding what would constitute ‘reasonably available
recovery processes’.
The EPA responded by creating mechanisms within the W2REPP to support giving greater
levels of certainty at the appropriate levels – rather than setting broad criteria to try to cater
for all activities.
A commitment was made that the three major northern transfer stations will be approved as
resource recovery facilities under clause 11(3)(b).
2.3.4 7.9.2 Application of clause 11 to particular wastes, iv) Commercial and
industrial (C&I) and construction and demolition (C&D) waste with source
separation of wastes
This section dealt with comments from industry suggesting that waste material that had been subject
to source separation be exempt.
Industry Views:
o “Representatives at a discussion meeting with the WMAA SA queried whether this
will appropriately support ZWSA and EPA’s promotion of source separation of
wastes”
EPA Comments:
o “Source separation of wastes is the strongly preferred option of the EPA and ZWSA
and both promote and encourage this in a range of ways. However, they are not
aware of clearly identifiable standards or systems in place to ensure the consistently
appropriate use of separated systems at this time. Therefore, at least for the time
being, to ensure maximum recovery of resources, the residual waste should also still
be directed to resource recovery.”
o “The EPA does not view this as undermining the drive for source separation as there
would still be real incentives for C&I and C&D premises to undertake source
separation of wastes with the other provisions of the EPP.”
Based on the above, it would appear the EPA did not favour giving credit to schemes where the
suitability and consistency of source separation outcomes was not established.
2.3.5 7.9.3 Recognition of market variability
This section dealt with whether industry would be forced to subject waste to resource recovery even if
it were unprofitable to do so.
Industry Views:
o “Submissions by some waste industry operators and discussion with the WMAA SA
showed a concern that recovery not be required to be undertaken when materials
cannot be profitably handled.”
EPA Clause 11 Recommendation

25
o “The EPA also recommends that a defence on the basis of costs be included [in this
Clause].”
This recommendation was not explicitly adopted in the final wording of the W2REPP. It is understood
that it was found that EPA guideline content and the general defence could suitably address the
issue.
2.3.6 7.10 Clause 12—Prohibited landfill wastes/Schedule 4, 7.10.1 Practicality—
contamination risks and liability
This section addressed the issues of how the industry could deal with contaminated waste material.
Industry Views:
o “Various submissions by ... the waste industry have expressed concerns about
contamination and liability issues where banned wastes may be placed in their waste
streams by individuals. At a meeting ..., landfill and transfer station operators
expressed serious concerns about the inclusion of non-aggregated lighting and non-
aggregated electronic wastes as materials banned from landfill. They considered
there is not a practical way that these materials can be managed once they have
entered the waste stream.”
EPA Clause 11 Recommendation
o “The EPA recognises that it is possible that individuals may place some banned
wastes in their council rubbish bins (eg fluorescent lighting and electronic wastes) or
commercial rubbish bins and that management facilities or landfills are likely to be
either unaware of these materials or unable to readily remove them. It is a general
defence under the EP Act in any criminal proceedings, if it is proved that the alleged
contravention did not result from any failure on the defendant’s part to take all
reasonable and practicable measures to prevent the contravention or contraventions
of the same or similar nature.”
The above suggests recognition by the EPA that dealing with banned wastes will be problematic for
the industry as they cannot completely control how they enter the waste streams that they will need to
deal with.
2.4 Key Consultation Themes/Points
The key themes or points from the consultation are considered to be as follows.
Certainty:
o Consultant respondents were seeking certainty from the EPA about how the W2REPP
will be implemented, so they can proactively adapt their businesses accordingly.
o However, there is concern by consultation respondents about the regulatory approach
proposed in the W2REPP as opposed to encouraging a market solution, e.g. through
waste levy increases.
Opportunity:
o There was a widespread perception amongst consultation respondents that there might
be a misunderstanding by some policy makers of what the key waste management
challenges were in improving resource recovery.
There seemed to be an unnecessary regulatory focus on the management of
already source separated or resource recovered aggregated material streams,
i.e. paper/cardboard, plastics, metals.
Aggregated material streams would not be recovered by the industry if they were
not being sent for recycling.
These materials were not sent by the industry to landfill.

26
Therefore, the waste streams that represented the majority of waste being sent to
landfill that needed to be targeted to improve resource recovery were:
Non-source separated waste material;
The residual waste produced from source separation activities;
The residual waste from resource recovery facilities.
Existing W2REPP Industry Investment:
o Based on the consultants’ observations and comments by some consultation
respondents, several industry players appear to have already invested in new resource
recovery facilities in anticipation of the W2REPP.
In the consultants’ view, these new facilities are aligned to the existing industry
source separation paradigm, and are therefore designed to receive already
source separated mixed and/or aggregated waste streams with low
contamination levels.
They are not designed to deal with highly mixed or ‘wet’ general waste
streams with organic contamination or other industry residuals.
A degree of upstream source separation would therefore still be
necessary to provide these facilities with acceptable material inputs.
o Other consultation respondents report that they are still waiting for more certainty about
the W2REPP before deciding if they would invest in upgrades or new facilities.
As a consequence, it could take time for industry to respond once certainty is
provided.
This delay could prevent the W2REPP rapidly achieving its intended policy
outcomes.
Number of Facilities seeking Approval
o There was confusion and uncertainty by consultation respondents about which facilities
would need to be approved.
Several consultation respondents indicated that they had assumed that the three
northern transfer stations will be automatically approved per the EPA’s Response
to submissions for the Draft (Waste to Resources) Policy (August 2009).
o Even though some facilities do not send material direct to landfill, many (about a third)
consultation respondents indicated that they could seek to become approved for
commercial reasons.
There was concern by these consultation respondents that approved facilities
could arbitrarily increase prices and/or push obligations for resource recovery or
contaminant removal upstream to the operators that send material to them for
disposal to landfill.
These obligations could mean it is simply easier for the upstream facility to also
become approved.
Approval Criteria:
o There were strongly diverging views amongst consultation respondents about what the
criteria should be for facilities approved under the W2REPP.
Several consultation respondents proposed a minimalist approach with few
and/or relatively lenient approval criteria.
Several consultation respondents remarked that they would like to see very
stringent criteria.
In the consultants’ opinion, other consultation respondents either did not have a
view or were somewhere in the middle, but lack of information and certainty about
the W2REPP meant they had yet to develop a firm position.
o Potential approval criteria identified by consultation respondents included:
Requirement to be EPA licenced.
Maintaining a suitable management system to ensure quality control in
processes, procedures and data reporting.

27
Restrictions on input material a facility can accept.
Setting resource recovery targets or criteria for facilities.
Specifying the resource recovery processes that facilities needed.
Resource Recovery Criteria:
o The majority of consultation respondents were strongly of, or sympathetic to, the view that
inherent variability in waste streams and diversity in types of resource recovery facility
processes make it difficult to:
Set resource recovery targets across the industry or even for a category of
material input, unless it is on a facility-by-facility basis.
Guarantee that a facility will always be able to achieve such targets.
Data reporting:
o It is the consultants’ opinion, that most facilities should already be collecting much of the
data that the EPA may require to be reported.
However, the majority of facilities would need to improve their information
management systems to allow efficient collation and presentation of this data.
o The observations from this consultation suggest that the majority of consultation
respondents would be inclined to minimise the data they need to report.
Therefore, it may need to be made a condition of EPA licences if a data reporting
requirement cannot be effectively enforced as part of the approval requirement.
o The majority of consultation respondents requested that the EPA should clearly identify
what data it needs for industry reporting to confirm compliance with the W2REPP.
It is their belief that this will minimise data required from the industry, limiting
administrative requirements and facilitating cooperation.
o There were concerns from most consultation respondents about commercial
confidentiality of data.
These consultation respondents requested that there should be strict safeguards
in place to ensure appropriate management and use of the data.
o Paper or electronic reporting was deemed acceptable to most consultation respondents.
Dealing with banned materials:
o A significant number of consultation respondents raised concerns about the EPA’s
compliance approach being too onerous and impractical.
o It is the consultants’ view, that these consultation respondents are seeking clear and
unambiguous guidelines from the EPA on dealing with these materials, but which are also
flexible and practical; recognising that successfully removing all banned items cannot be
reasonably achieved.
28
3 Facility Processes, Procedures & Recovery Rates
3.1 Important Qualification
This section describes a number of existing facilities in metropolitan Adelaide when discussing EPA
facility categories, including what materials they may process and details of how they could be
operating. Some of these examples and this information is drawn independently from Rawtec and
Mike Haywood-SRS’s knowledge and understanding of the industry. This has been required as many
facilities that participated in the consultation did not provide precise details about their operations and
also due to the degree of variability across the industry. It should be noted that Rawtec and Mike
Haywood-SRS’s understanding of these facilities may not necessarily be complete and these facilities
may not necessarily agree with our descriptions and other details that we have suggested apply to
these facilities. Furthermore, to avoid individual facilities being identified and ensure the confidentiality
of information and data provided by consultant respondents, these examples are not listed by name
or location but described only from perspective of their processes and procedures and resource
recovery performance.
3.2 Overview
Table 3.1 gives an overview of the types of facilities in metropolitan Adelaide for each of the different
EPA facility categories. The overview includes for each facility category:
Estimated number of facilities (in metropolitan Adelaide) for this EPA facility classification;
The types of materials these facilities receive;
Some examples of relevant facilities in metropolitan Adelaide;
Description of process by reference to a process-flow type diagram;
The typical resource recovery performance that could be being achieved; and
The types of procedures being used for management of the facility.
Please note for Table 3.1:
This table has been prepared based on the best information available to the consultants or
provided by consultation respondents that can reasonably be disclosed publicly. The
consultants recognise that there are gaps in the data presented due to this limitation and
scope constraints on the consultants’ capacity to conduct supplementary investigations.
Some operating sites have co-located two facilities and/or more than one type of facility in the
same building or shed. As a consequence, the processing capacity estimated for these
operating sites may be reported separately amongst several of the facility categories in this
table.
It is also important to recognise that some of these operating sites and/or facilities receive and
process MSW waste in addition to C&I and C&D waste. In view of this, approval under the
W2REPP for these sites and/or facilities may only be sought for parts of these sites or
facilities.
The estimated resource recovery performance is % by weight of material.
Section 3.3 below provides more detailed information that was obtained or can be suggested for each
facility classification. This information has been developed by the consultants from their own
experience and information provided by consultation respondents, and it is again limited by public
disclosure and time constraints.
At this time, it is also important to again note:

29
That there is considerable diversity amongst facilities within an EPA Facility Category, in terms of
what materials they will accept, the process and procedures that they use, and the resource
recovery performance that is or can be achieved.
It was often difficult to decide which site or facility should fit within a particular EPA Facility
Category, or to easily generalise what facilities a particular EPA Facility Category should apply to.
Some facilities also appeared to fit within several EPA Facility Categories.
o For example, a facility undertaking C&D WP usually has a front-end MRF and is also a
back-end RR WP, and the equipment and operations in the facility may be integrated
together into a single process.
o A more malleable categorisation approach may have been to classify facilities by the
types of resource recovery process operations they contained, where a site or facility
could then be described in terms of these process operations.
3.3 Facility Descriptions
3.3.1 Transfer Station (TS)
There are currently up to 4 sites that the consultants considered would fall into this EPA Facility
Category and they are all based in Adelaide’s North and Western Suburbs. Some key or important
attributes of these sites are summarised below.
There were different ownership structures between sites.
o Some sites were operated as joint ventures solely between councils whilst other sites
were commercial ventures by private industry, some as joint ventures with councils.
The type of waste material accepted by these sites included kerbside collected waste, hard refuse
and commercially collected C&I waste.
o The proportion of each of these materials received varied between the sites.
The sites had often had distinctive but similar approaches to resource recovery and/or handling of
materials which were received.
o Most sites usually practiced a limited form of resource recovery, mainly of scrap metals,
using mobile plant (e.g. diggers, dozers), but some sites were also opportunistically
separating out other materials, including timber, mixed heavies1, inerts
2, cardboard, green
waste, e-waste, etc. (using the same technology).
The resource recovery was usually limited to the C&I waste material, where such
materials were more readily identifiable, less contaminated and easier to pick out.
Each site resource recovered different types of materials.
o Waste material was then usually bulked or baled for transport to one of the landfills north
of Adelaide.
It was common for the material to be compacted before being bulked or baled,
e.g. using a dozer on a walking floor.
It is important to note that at this stage that there are no such facilities present in the Southern
Suburbs. The two landfills that service this area are direct disposal although they operate small
separation pads for selected waste loads to remove metals and heavy inert materials. These sites
could be classified under the EPA’s TS (Pre-sort) Facility Category.
Process Description:
Refer to Figure 3.1.1 for a high-level operational flow diagram and indicative resource recovery
performance for these TS facilities.
1 Mixed heavies can include: Concrete, bricks, tiles, soil, sand, rocks, wood, metal, glass, household waste, office
waste and general constructions waste as well as green waste. 2 Inerts generally include: concrete, bricks, rubble and soil (with no organic matter).
30
There is considerable diversity in operations, equipment and resource recovery performance at
these facilities – it is difficult to generalise. However, the resource recovery process and
equipment at these facilities is usually very basic:
o Pre-sorting by visual inspection and using mobile plant (e.g. diggers and dozers) to
separate out easy to obtain and high-value recyclable material from waste material after
it is tipped on the floor.
Resource Recovery Performance:
These facilities are generally receiving non-source separated waste or residuals from source
separation activities of other resource recovery facilities.
By the time this material has arrived it is usually highly mixed and contaminated, particularly with
wet organic matter in the case of C&I material.
Resource recovery is generally opportunistic for loads that are not contaminated and only where
initial assessment shows that there are easy to recover materials which have value, e.g. concrete,
metals, timber, cardboard, etc.
Banned items will also generally be identified and pulled out wherever possible, e.g. e-waste,
asbestos, etc.
In the consultants’ experience and based on limited data provided by relevant consultation
respondents, the resource recovery generally achieved at these facilities may only be in the range
of 5-15% (by weight of total waste material).
Procedures:
In the consultants’ experience, and from discussions with relevant consultation respondents, most
operators of these facilities work cooperatively with other facilities and collection companies that
send waste material to their facility, to ensure that the waste material is appropriate and presence
of banned materials is minimised.
Furthermore, procedures for assessment and acceptance of material at the gate and in the
facility, including for resource recovery, appear to be largely verbal and passed on through staff
training from management direction, existing operator experience and visual instruction.
3.3.2 TS (Pre-sort)
In the consultants’ opinion, there are approximately 7-10 sites across Metropolitan Adelaide that we
believe fit into this EPA Facility Category. Several of these sites are owned by the same operators.
These sites predominantly encourage their customers to separate their loads into different bin types
mainly, cardboard, scrap steel, green waste and mixed heavies. Based on the consultants’ industry
knowledge, a general description of these sites is summarised below.
These sites are geographically spread around metropolitan Adelaide.
o Some sites are co-located at landfills.
Some sites are owned by private operators whilst others are owned and operated by councils.
o Some operators own multiple sites.
These sites predominantly accept waste from skips, smaller commercial loads and/or the
residential trailer market, with some sites acting as public transfer stations for the local
communities.
Waste material entering these sites are usually separated into bins for transport to resource
recovery or recycling facilities or to be transferred for landfill disposal
o Most sorting is generally required or expected to be performed by customers before they
bring their waste to the site.
Customers may also be expected to further sort their waste at the site, and side-
cast onto piles, selected recyclable materials, such as steel, organics, soil,
concrete and/or rubble.

31
Site staff may also tip residual material onto the floor and sort through it to
remove additional recyclable materials, using mobile plant and sometimes
manually.
If the site also operates a landfill:
o Customers may be able to directly drop off residual material into the landfill.
o Inert material received at the site may be collected by the landfill operator using mobile
plant and processed on-site (e.g. this may include crushing, screening and/or blending),
to be used in the landfilling operation (e.g. as daily cover).
The scale of some sites of these ranged from 8,000-10,000 tonnes /yr up to 25,000 tonnes/yr
sites of material being handled.
Process Description:
Refer to Figure 3.1.2 for a high-level operational flow diagram and indicative resource recovery
performance for these types of facilities.
The resource recovery processes at these facilities are more standard in that they involve:
o Receipt of waste already pre-sorted into recoverable material;
o Segregation of this waste into relevant bins;
o Tipping residual waste on the floor and conducting some additional level basic resource
recovery (again on opportunistic basis).
However, the number and type of bins, which usually dictate the extent of resource recovery, can
vary widely between facilities – see comments below.
Resource Recovery Performance:
The extent of resource recovery achieved at these facilities depends on the number and type of
recycling bins provided and assessment, acceptance and sorting procedures adopted by the
operator.
o The number and type of recycling bins at the facility can depend on, amongst other
things: customer profile; the amount and quality of waste materials received; the age of
the facility; its capacity; the site location; the available area; existing environmental and
planning approvals; and management and operational expertise. There are therefore
many factors and constraints which dictate what can be practically and cost effectively
achieved at a site.
As these facilities receive much material that is already pre-sorted or source separated a much
higher resource recovery performance can be achieved.
o In the consultants’ experience and based on limited data provided by relevant
consultation respondents, the aggregate recovery of such facilities for C&I and C&D
waste material could be in the order of up to 50-70%.
Resource recovery from residual waste by staff at a site, if it occurs, however,
would be a smaller proportion of this amount, which including the pulling out of
banned items, is probably in the same order as for TS facilities, i.e. 5-15% (of
total waste material).
Procedures:
As these facilities are often public transfer stations, they set and communicate clear protocols to
the public on how and what materials they are willing to receive, and these protocols are strictly
enforced at the gate.
o Price signals and the deterrent of rejection are generally used to encourage the public to
bring materials already pre-sorted and to make disposal of residual waste more
expensive.
Where the facility accepts waste from contractors, the facility will usually work cooperatively with
the contractor to ensure that the material being delivered is appropriate and presence of banned
materials is minimised.

32
o Where there is an issue, the contractor may be required to return and take the material
away.
o The contractor will usually then feed this outcome back to the customer and work with
them to ensure it does not occur again.
Like TS facilities, procedures for assessment and acceptance of material are largely verbal and
passed on through staff training and visual instruction.
3.3.3 Skip
In the consultants’ experience and based on limited data provided by relevant consultation
respondents, there could be up to 20 operators running skip-type businesses in metropolitan
Adelaide. Most (more than half, but it would be difficult to quantify accurately) of these operators
would simply drop off bins and then pick-up and deliver these bins to another facility where resource
recovery occurs. Their site or yards would therefore principally be used for storing bins and
equipment. Consequently, these sites or yards may not necessarily meet the definition of a facility
where resource recovery occurs.
However, several of these skip businesses appear to take some bins back to their yards for limited
resource recovery. This practice would only occur when the bins contain sufficient quantities of
uncontaminated and easy-to-separate material, e.g. steel, of sufficient market value to make resource
recovery worthwhile.
Process Description:
Refer to Figure 3.1.3 for a high-level operational flow diagram and indicative resource
recovery performance for these types of facilities.
o Note: This figure also illustrates the origin and fate of the materials outside of the
facility boundary, as this provides important context for understanding how these
businesses operate.
Many of these skip bin companies operate small sites where they would take select bins for
sorting. In these situations:
o When a bin is lifted from the ground the operator would take note of the weight of the
bin.
o If the bin is very light it would generally go straight to a MRF, as this is usually the
least cost option; or if not acceptable for a MRF, the waste would be sent to a TS.
o If however the weight is either very heavy or it contains significant volumes of steel
the bin would be taken back to the yard for sorting.
In these situations, the scrap is removed for on selling to recyclers.
This resource recovery is usually achieved by tipping waste on floor or
ground and sorting through it using mobile plant.
A couple of the consultation respondents with skip businesses reported
performing limited additional resource recovery at selected sites. This
resource recovery involved using basic mechanical plant such as screens
and trommels to separate out:
Concrete rubble and brick materials – Which could be transported to
a RR WP for recovery and recycling as C&D construction materials.
Combustibles3 – This was transported to a MRF for energy recovery
or sent to TS for landfill disposal.
Resource Recovery Performance:
In the consultants’ experience and based on limited data provided by relevant consultation
respondents, the extent of resource recovery operations conducted by skip businesses at
3 In this situation, combustibles principally included wood and other combustible building materials which could
be used for energy recovery.

33
their yards appears to vary between operators, and resource recovery performance depends
on collection source and content and quality of material received.
o The resource recovery performance achieved by skip operators at their own yards
appears to a relatively small percentage of the total volume of material they might
collect, e.g. 5-10%.
However, the overall contribution of skip businesses to resource recovery of the collected
material would be much higher, because these businesses direct this waste to other facilities
where resource recovery should occur.
o The eventual overall resource recovery of this collected material could be > 95%
Procedures:
In the consultants’ experience and based on limited data provided by relevant consultation
respondents, skip operators are proactive in controlling and assessing waste material for
acceptance and resource recovery when skips are provided and/or collected, even before it is
received at their yard.
This involves communicating clear protocols to the public or sites where bins are placed
about what is acceptable.
o This information is usually conveyed verbally and there are few written procedures or
instructions except for labels and colouring on the skips.
If incorrect, unacceptable or banned material is placed in skips, operators can refuse to
collect the skip or tip it out at the site, or not pick it up unless the customer pays a surcharge.
o These measures act as a strong incentive for customers to use bins properly.
3.3.4 MRF (+waste category)
In the consultants’ opinion, there are up to 6-9 facilities which could be classified as MRFs that are in
operation within the metropolitan area; most are based within the Wingfield precinct. These MRFs
are diverse and accept different material inputs and operate different processes to achieve different
types of resource recovery. This diversity is best illustrated through the following comments, which
are based on the consultants’ industry knowledge and feedback provided by consultation
respondents.
Whilst some MRFs were owned by or in joint ventures with councils, they were usually operated
by private industry.
The capacity of these MRFs generally ranged from about 20,000-30,000 tonnes/yr to over
100,000 tonnes/yr.
At some of the sites MRFs were co-located with other resource recovery facilities. It was
therefore often difficult to establish what was being processed by the MRF or by other facilities at
the site. For example, one site processed several hundred thousand tonnes/yr of material but
only about a quarter of this material was processed through the MRF.
Whilst nearly all of these MRFs were designed to handle different input streams, it was important
for the successful performance of each of the MRFs that their input stream was tightly controlled
in terms of composition and contamination levels, e.g.
o Mixed and dry C&D waste only.
o General dry comingled C&I waste only – this type of MRF is sometimes called a dirty C&I
MRF.
o Aggregated mix of cardboard, paper and plastics only – this type of MRF is commonly
referred to as a high-end C&I MRF.
The extent of the resource recovery of the MRF very much depended on the type of input stream
and the resource recovery objective, which was dictated by commercial considerations.
o One MRF had been set up to process low-value mixed C&D waste into substitute fuel for
alternative energy. Whilst the resource recovery outcomes were dictated by removal of

34
contamination, it was still important for commercial viability to achieve resource recovery
of recyclable materials.
o Another MRF set up for high quality dry comingled C&I waste stream had been built to
maximise recovery of paper, cardboard and plastics, but limiting recovery of certain of
these materials, where contaminated, e.g. with organics, or not properly identifiable, e.g.
plastic polymers, was also central to achieving commercial viability.
Despite these differences though, most these MRFs often had common processes, equipment
and procedures – they were just being operated with differing types of inputs and differing
performance or output objectives.
o Nearly all the MRFs would generally have the following type of processing steps.
Pre-sorting by mobile plant;
Sizing of material;
Screens and trommels to remove fines and recycle oversize material;
Picking line (manual) and magnets to remove residual contaminants.
o The facility operator would therefore monitor and balance the intake of materials to the
MRF and adjust the process parameters to meet the output specifications.
Process Description:
Refer to Figure 3.1.4 for a high-level operational flow diagram and indicative resource
recovery performance for these types of facilities.
In the consultants’ experience and from feedback by consultation respondents, the design
and operation of the above facilities is generally that they are designed to accept a relatively
well controlled input stream.
o These facilities are therefore not designed to deal with alternative or more complex
waste streams.
o In Adelaide, each type of MRF is distinct in terms of process, type of equipment and
resource recovery performance, depending on their process objective and the type of
waste material they are designed to accept.
Consequently, these facilities attempt to strongly control the type, quality and contamination
of waste material they are willing to accept, as the performance and commercial viability of
these facilities are limited to a specific range of input materials and contamination levels.
Resource Recovery Performance:
The resource recovery performance of MRFs is variable and can be between 10-90%
depending on how you define what resource recovery is and the process objective.
o A MRF processing material for energy recovery may only pull out 10-30% of material
if its objective is to maximise the amount of material that passes through for use as a
fuel.
o Another MRF designed for resource recovery of metals, cardboard, plastics and
paper, will achieve greater material recovery, .e.g. > 60-70%, but may let some still
potentially resource recoverable items pass through to residual if it is not economical
to recover them.
Procedures:
Most MRFs are operated by larger commercial companies, and therefore, there are more formal
and written procedures about how these facilities should be operated.
Nevertheless, they still rely considerably on verbal and visual instruction of staff.
As these facilities rely on strict control of material input quality and contamination, these
procedures revolve around managing the upstream collection and supply of the material to the
facility.
35
The commercial viability of these facilities also depends on maximising recovery of valuable
resources, hence, there would be procedures to ensure that these are correctly identified by
operators and pulled out (or allowed to pass through).
3.3.5 C&D Waste Processors (WP)
In the consultants’ opinion, there are potentially 5 manufacturing companies in Adelaide that operate
a total of 6 sites that process concrete, bricks and rubble into a wide range of quarry products. This
form of recycling is very mature in Adelaide and processing is between 900,000 to 1.2M tonnes per
annum depending on the volume of demolition within the catchments.
Process Description:
These sites only accept material that are source separated or resource recovered (by others,
e.g. skip operations, direct from building sites) and is therefore already in a form to allow
direct re-processing.
Where mixed C&D waste is received:
o Most sites have a front-end MRF type process or arrangement – refer Figure 3.1.4 –
to additionally separate and recover relevant C&D materials.
o Depending on the material inputs accepted by the site, this MRF arrangement may be
limited to mobile plant and screens and trommels but can also include a picking line
and magnets.
The material is sent into a RR WP and/or OW WP type process or arrangement – see Figure
3.1.6 –to take the recovered resources and convert them into manufactured products
(although it could be argued that these are intermediate recycled products, e.g. rubble to go
into road bases or fill, wood chips for landscaping).
It is the consultants’ view that this EPA Facility Category could alternately be considered a
combination of other facility categories: MRF, RR WP and/or OW WP.
Resource Recovery Performance:
The resource recovery performance at these sites is very high, >95%, as all material arriving
at the site is already a source separated material with little contamination, and can therefore
be transformed into manufactured products with very little residual.
Procedures:
Procedures for resource recovery at these sites would also mirror that discussed for other
facilities (i.e. MRF, RR WP and/or OW WP), in terms of controlling material input quality and
maximising resource recovery.
o Each C&D WP facility would also have specific procedures for operation of equipment
relevant to the particular product that they are manufacturing, in order to achieve the
required product specification.
Such procedures would be specific to management and operation of plant
and equipment being used and the products being manufactured. They
could relate to grinding size, screen used, blending ratio, materials picked
out, etc.
3.3.6 C&I WP
In the consultants’ opinion, there could be 5-15 C&I WP sites or facilities in Adelaide that operate from
a variety of sites, depending on how this EPA Facility Category is defined. A number of these sites or
facilities could also be considered to fit into the EPA’s RR WP, C and/or OW WP Facility Categories,
which makes it difficult to differentiate. For example:

36
One site described under the MRF Facility Classification initially produces a recovered
product, which could be considered as C&I WP, but also uses this intermediate product to
manufacture a fuel product for industry, which could be considered a RR WP step.
Composters convert C&I organic material into compost-derived products. This type of site
could be considered a C&I WP, as they produce a recovered compost product, but then this
product is blended with other materials to make other commercial products (e.g. mulch),
which could be considered a RR WP or even OW WP.
Process Description:
As a consequence, this category of facility, like C&D WP above, often integrates a front end
MRF with a back-end RR WP, C and/or OW WP.
However, there are some sites which one could say do not fit into this description and might
be considered uniquely C&I WP. Examples of these sites include:
o Facilities which accept recovered glass from MRFs and collection depots and
beneficiate it into crushed glass or cullet, for glass manufacture.
o Facilities which take post-consumer and post-industrial waste plastics from MRFs and
collection depots and process it into different types of recycled resin feedstock, which
they or others can use to manufacture products.
Thus, the processes for these types of facilities are diverse, as each facility often handles
distinct types of material inputs, and manufactures distinct types of material output.
Resource Recovery Performance:
Where resource recovery occurs at these sites, the resource recovery is generally dictated by
a front-end MRF – refer to Section 3.3.4. As a consequence, resource recovery performance
can be from 60-70% up to >95% depending on the types of material input that is being
processed.
If there is no resource recovery occurring and the site essentially undertakes re-processing of
already recovered material (received from MRFs, R and collection depots), the resource
recovery would be >95% as very little residual would be produced.
Procedures:
The procedures for a C&I WP would be the same as reported for a MRF (where resource
recovery occurs) – refer to Section 3.2.5 – and RR WP, C and/or OW WP – see below.
Like a C&D WP, this would include specific procedures for operation of equipment for
manufacturing particular products, in order to achieve the desired product specification.
3.3.7 Recycling Operations (R)
In the consultants’ opinion, there are between 7 and 9 types of sites in Adelaide that could fall into this
category.
Sites which accept recovered cardboard, plastics and scrap metals and prepare them for
distribution and export.
o These sites usually deal with one class of material, e.g. scrap metal only, paper &
cardboard only, etc. although these are some sites with also deal with more than one
at the same time, e.g.
One site receives recovered cardboard and plastic, which it bales and sends
to interstate and overseas re-processors.
Another site receives scrap metals which are already largely separated into
steel and non-ferrous metals. These scrap metals are sorted further using
mobile plant and magnets, before being shredded and baled for export to
interstate or overseas re-processors. The site also accepts whole items of e-
waste, which are sent interstate to a specialist recycler for disassembly.

37
Sites which accept electronic-type waste and disassemble them into component parts, e.g.
metal, wire, plastic, glass and hazardous waste components (e.g. electrical or circuitry
components), before preparing these parts for distribution and export.
o Some of these sites will send these plastic and scrap metal component parts to other
sites for distribution and export, instead of performing this role themselves.
Process Description:
Refer to Figure 3.1.5 for a high-level operational flow diagram and indicative resource
recovery performance for these types of facilities.
Essentially, most of these facilities take in already source separated aggregated material, and
conduct pre-sorting and/or shredding, then essentially bale or aggregate this material for
transport to a RR WP.
The exception to this is e-waste facilities where there may be additional front-end processes
for dismantling, shredding and sorting of the material into individual constituents.
o Once these constituents are separated, they are then aggregated for transport to
another R site or direct to a RR WP.
Resource Recovery Performance:
In the consultants’ experience and based on comments by relevant consultation respondents,
the resource recovery of these sites can be in the range of 70 - 95% as the input material is
usually source separated with low contamination and the maximum amount of material is
recovered.
o In the case of e-waste facilities, even the majority of hazardous materials will be sent
to specialist recyclers for further resource recovery or recycling as these materials are
already or will be banned from landfill.
o An exception to this is scrap metal recycling of car bodies and white goods which can
generate high levels (>30%) of flock residual.
Procedures:
These sites need to strongly control the type, quality and contamination of waste material they
are willing to accept, as they are limited to a specific range of input materials and
contamination levels.
Like MRFs, these facilities are generally operated by larger commercial companies, and
therefore, there are more formal and written procedures about how these facilities should be
operated.
o Nevertheless, they still rely considerably on verbal and visual instruction of staff.
As these facilities rely on strict control of material input quality and contamination, these
procedures revolve around managing the upstream collection and supply of the material to
the facility.
The commercial viability of these facilities also depend on maximising recovery of valuable
resources, hence, there are procedures to ensure that these are correctly identified by
operators and pulled out and correctly placed in relevant bins or bay.
In the case of e-waste, these facilities are subject to strict controls and regulation by the EPA,
and therefore, they usually have more formal procedures, particularly on how hazardous
waste material is handled and processed.
3.3.8 Recovered Recyclable Waste Processors (RR WP)
These facilities or sites take recovered materials and re-process them into new products. Some local
examples are given below.
Converts recovered dry combustible C&D material into a substitute fuel that can be used by
industry.

38
Processing recovered plastic materials into plastic products, including fence posts railway
sleeper, bollards, flooring, etc.
Converting waste plastics into plastics granules which can be used as a feedstock substitute
to virgin plastics by the manufacturing industry.
Processing recovered glass materials into recycled glass cullet, which is a virgin feedstock
substitute for the manufacture of glass containers and/or bottles.
Process Description:
Refer to Figure 3.1.6 for a high-level operational flow diagram and indicative resource
recovery performance for these types of facilities.
These facilities have processes that are distinctive to the type of material input and product
they are manufacturing.
Resource Recovery Performance:
In the consultants’ experience and based on comments by relevant consultation respondents,
the resource recovery at these facilities would be >98% with little or no waste residual.
Procedures:
Like C&D WP and C&I WP, procedures at these facilities also mirror that applied at these
other facilities, in terms of controlling material input quality and maximising resource recovery.
o There will also be specific procedures for the production of manufactured product, in
order to achieve the product specifications.
3.3.9 Composters (C)
There is a significant mature compost market in Adelaide with about 7 sites across metropolitan
Adelaide. This facility category is dominated by two large operators which operate 5 sites between
them.
Process Description:
Refer to Figure 3.1.7 for a high-level operational flow diagram and indicative resource
recovery performance for these types of facilities.
These facilities will generally only accept highly source separated organic material inputs with
relatively low contamination levels.
The process steps and procedures are similar and relatively standard between different C
facilities. These processing steps and procedures may involve:
o Assessment;
o Shredding;
o Pre-sorting, which may involve shredding and magnets to ensure metal contaminants
are not present;
o Composting;
o Another processing step (picking line, screening, magnets, air blowing) to again
remove contaminants;
o Blending to final product specification.
Resource Recovery:
In the consultants’ experience and based on feedback from relevant consultation
respondents, the resource recovery at these facilities would be >95% with minor amounts of
waste residual.
Procedures:
These facilities have procedures related to controlling the type, quality and contamination of
organic waste material they are willing to accept.
39
They also have procedures for the manufacturing process and for the preparation of variety of
differing commercial products (e.g. compost only, mulches) that contain the final composted
material.
3.3.10 Organic Waste Processors (OW WP)
Several of the above C sites, also receive and process clean timber materials at their sites and, one
of the facilities colour the materials to value add for resale as a landscape garden product.
In addition, there are 1-2 sites which solely receive timber and shredding for sale into the commercial
landscaping industry.
Process Description:
Refer to Figure 3.1.8 for a high-level operational flow diagram and indicative resource
recovery performance for these types of facilities.
Like composters, these facilities are limited to specific input organic materials and
contamination levels.
Resource Recovery:
In the consultants’ experience and based on feedback from relevant consultation
respondents, the resource recovery at these facilities would be >95% with minor amounts of
waste residual.
Procedures:
OW WPs would have very similar procedures to C and RR WP facilities – refer to previous
sections.
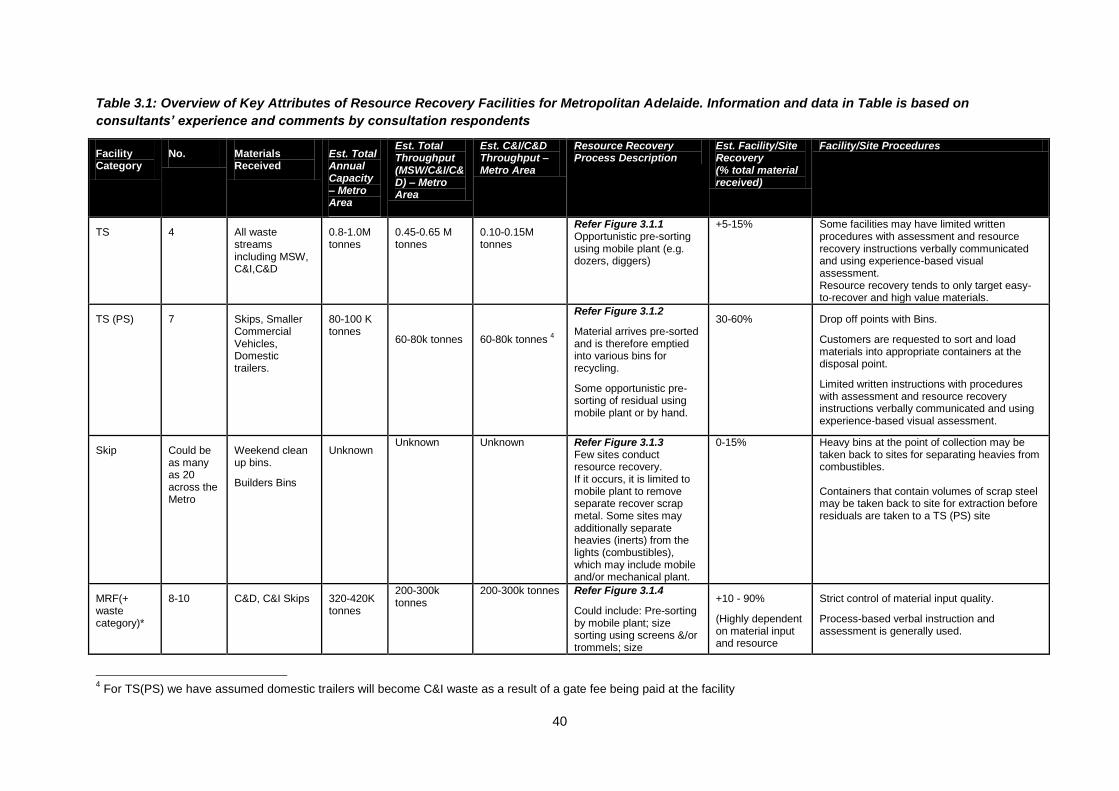
40
Table 3.1: Overview of Key Attributes of Resource Recovery Facilities for Metropolitan Adelaide. Information and data in Table is based on
consultants’ experience and comments by consultation respondents
Facility Category
No. Materials Received
Est. Total Annual Capacity – Metro Area
Est. Total Throughput (MSW/C&I/C&D) – Metro Area
Est. C&I/C&D Throughput – Metro Area
Resource Recovery Process Description
Est. Facility/Site Recovery (% total material received)
Facility/Site Procedures
TS 4 All waste streams including MSW, C&I,C&D
0.8-1.0M tonnes
0.45-0.65 M tonnes
0.10-0.15M tonnes
Refer Figure 3.1.1 Opportunistic pre-sorting using mobile plant (e.g. dozers, diggers)
+5-15%
Some facilities may have limited written procedures with assessment and resource recovery instructions verbally communicated and using experience-based visual assessment. Resource recovery tends to only target easy-to-recover and high value materials.
TS (PS) 7 Skips, Smaller Commercial Vehicles, Domestic trailers.
80-100 K tonnes
60-80k tonnes
60-80k tonnes 4
Refer Figure 3.1.2
Material arrives pre-sorted and is therefore emptied into various bins for recycling.
Some opportunistic pre-sorting of residual using mobile plant or by hand.
30-60% Drop off points with Bins.
Customers are requested to sort and load materials into appropriate containers at the disposal point.
Limited written instructions with procedures with assessment and resource recovery instructions verbally communicated and using experience-based visual assessment.
Skip Could be as many as 20 across the Metro
Weekend clean up bins.
Builders Bins
Unknown Unknown Unknown Refer Figure 3.1.3
Few sites conduct resource recovery. If it occurs, it is limited to mobile plant to remove separate recover scrap metal. Some sites may additionally separate heavies (inerts) from the lights (combustibles), which may include mobile and/or mechanical plant.
0-15% Heavy bins at the point of collection may be taken back to sites for separating heavies from combustibles. Containers that contain volumes of scrap steel may be taken back to site for extraction before residuals are taken to a TS (PS) site
MRF(+ waste category)*
8-10 C&D, C&I Skips 320-420K tonnes
200-300k tonnes
200-300k tonnes Refer Figure 3.1.4
Could include: Pre-sorting by mobile plant; size sorting using screens &/or trommels; size
+10 - 90%
(Highly dependent on material input and resource
Strict control of material input quality.
Process-based verbal instruction and assessment is generally used.
4 For TS(PS) we have assumed domestic trailers will become C&I waste as a result of a gate fee being paid at the facility

41
modification by shredding/grinding; density separation using blowers; shaking tables/baths; manual picking lines; magnets.
recovery objective)
C&D WP 5-6 1.5 -2.0 million tonnes
0.9 -1.2 million tonnes
0.9 -1.2 million tonnes
Refer MRF and/or RR WP – similar process equipment &/or combinations
MRF Component - +70-90%
RR-WP Component -
>+95%
Per MRF &/or RR WP
Additional procedures for manufacture of recycled products to desired specification.
C&I WP 5-15
(depending on how defined)
100 -200k tonnes
100-150k tonnes
100-150k tonnes Refer MRF, RR WP, C & OW WP – generally have similar process equipment &/or combinations However, some other unique examples, e.g.
Processing of source separated plastics into Granules for re use;
Processing source separated bottles for reuse in Glass manufacture.
MRF Component - +10-90%
RR WP, C &/or O WP component -
>+95%
Per MRF, RR WP, C &/or OW WP
Additional procedures for manufacture of recycled products to desired specification.
R 7-9 Cardboard, Paper, Plastics, Metal, E-waste.
250-350 K Tonnes
200-250 K Tonnes
200-250 K Tonnes
Refer Figure 3.1.5
Generally: Baling facilities for processing cardboard, paper, plastics and metal components for distribution interstate and international
For e-waste: Manual disassembly can also occur.
+95-98%
Processed to quality specification or minimum contaminant levels for export
E-waste: regulation of site by EPA and handling of hazardous waste.
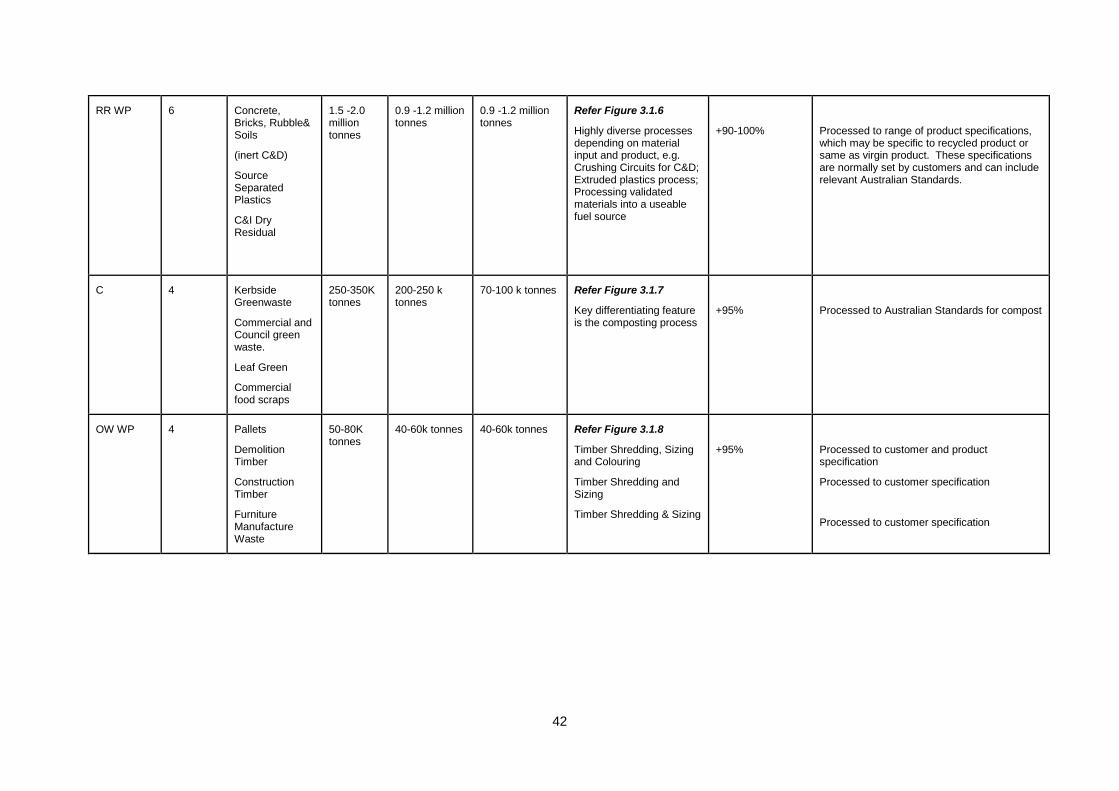
42
RR WP 6 Concrete, Bricks, Rubble& Soils
(inert C&D)
Source Separated Plastics
C&I Dry Residual
1.5 -2.0 million tonnes
0.9 -1.2 million tonnes
0.9 -1.2 million tonnes
Refer Figure 3.1.6
Highly diverse processes depending on material input and product, e.g. Crushing Circuits for C&D; Extruded plastics process; Processing validated materials into a useable fuel source
+90-100%
Processed to range of product specifications, which may be specific to recycled product or same as virgin product. These specifications are normally set by customers and can include relevant Australian Standards.
C 4 Kerbside Greenwaste
Commercial and Council green waste.
Leaf Green
Commercial food scraps
250-350K tonnes
200-250 k tonnes
70-100 k tonnes Refer Figure 3.1.7
Key differentiating feature is the composting process
+95%
Processed to Australian Standards for compost
OW WP 4 Pallets
Demolition Timber
Construction Timber
Furniture Manufacture Waste
50-80K tonnes
40-60k tonnes 40-60k tonnes Refer Figure 3.1.8
Timber Shredding, Sizing and Colouring
Timber Shredding and Sizing
Timber Shredding & Sizing
+95%
Processed to customer and product specification
Processed to customer specification
Processed to customer specification

43
Unloading & Assessment
Unloading & Assessment
Consolidation & Compaction
(e.g. mobile plant, compactor and baler)
Consolidation & Compaction
(e.g. mobile plant, compactor and baler)
Pre- sorting (i.e. mobile plant, e.g. excavator & loader)
Pre- sorting (i.e. mobile plant, e.g. excavator & loader)
80-90%
10-20%
10-15%
RECYLABLE MATERIAL (e.g. timber, steel,
cardboard)
RECYLABLE MATERIAL (e.g. timber, steel,
cardboard)
1-5%
BANNED MATERIAL(e.g. asbestos, e-waste)
BANNED MATERIAL(e.g. asbestos, e-waste)
< 0.5%
INCOMING WASTE
MATERIAL
INCOMING WASTE
MATERIAL
OUTGOING WASTE MATERIAL
OUTGOING WASTE MATERIAL
95-99%
LANDFILLLANDFILL
FACILITY BOUNDARY
100%
Recycler(R of RR WP)
Recycler(R of RR WP)
Recycler or Specialised
disposal( RR WP, landfill)
Recycler or Specialised
disposal( RR WP, landfill)
Figure 3.1.1: High-level operational flow diagram and resource recovery performance of TS
facilities in Metropolitan Adelaide. Description in Figure is based on consultants’ experience
and comments by consultation respondents

44
AssessmentAssessment
Public sorting & Unloading
Public sorting & Unloading
RECYLABLE MATERIAL
(20% organics, 30% inerts, 1-2% steel, 0-1%
cardboard
RECYLABLE MATERIAL
(20% organics, 30% inerts, 1-2% steel, 0-1%
cardboard
BANNED MATERIAL(e.g. asbestos, e-waste)
BANNED MATERIAL(e.g. asbestos, e-waste)
100%
INCOMING WASTE MATERIAL
INCOMING WASTE MATERIAL
FACILITY BOUNDARY
RESIDUAL MATERIALRESIDUAL MATERIAL
BinBin
Transfer Station
Transfer Station
Resource Recovery
Resource Recovery
OUTGOING WASTE MATERIAL
OUTGOING WASTE MATERIAL
Recycler(R of RR WP)
Recycler(R of RR WP)
Recycler or Specialised
disposal( RR WP, landfill)
Recycler or Specialised
disposal( RR WP, landfill)
Figure 3.1.2: High-level operational flow diagram and resource recovery performance of TS
(Pre-sorting) facilities in Metropolitan Adelaide. Description in Figure is based on consultants’
experience and comments by consultation respondents

45
AssessmentAssessment
LIGHT
80-90%
100%
INCOMING WASTE MATERIALINCOMING WASTE MATERIAL
FACILITY BOUNDARY
Resource Recovery
YardYard
HEAVY10-20%
C&DC&DMIXED WASTE
MIXED WASTE
10-20% 60-70%
RECYCLABLERECYCLABLE
8-10% 10-12%
RESIDUALRESIDUAL
INERTSINERTSSTEELSTEEL
LandfillEnergy
Recovery(RR WP)
15-20% 1-2% 0.5-2% 65-70%
Recycling(R)
2-10m3 general
< 2m3 C&D inert
< 2m3 C&D
mixed
< 6m3 metal
95%
5%
Recycler(RR WP)
Recycling (RR WP)
Figure 3.1.3: High-level operational flow diagram and resource recovery performance of Skip
facilities in Metropolitan Adelaide. Description in Figure is based on consultants’ experience
and comments by consultation respondents. Please note that only minor amount of resource
recovery, 5-15%, may be achieved within the facility boundary; however, >95% of all materials
collected by these businesses may eventually be resource recovered at other facilities

46
Figure 3.1.4: High-level operational flow diagram and resource recovery performance of MRF
facilities in Metropolitan Adelaide. Description in Figure is based on consultants’ experience
and comments by consultation respondents
AssessmentAssessment
Pre sorting(mobile plant)
Pre sorting(mobile plant)
RECYCLABLE MATERIAL
steel
RECYCLABLE MATERIAL
steel
100%
INCOMING WASTE MATERIAL
INCOMING WASTE MATERIAL
FACILITY BOUNDARY
Crushing/sizing machine
(e.g. Shredder)
Crushing/sizing machine
(e.g. Shredder)
Manual picking lineManual picking line
MagnetMagnet
Mixed inerts/heavies (all)
plastics (some)
cardboard (some)
metals (all)
Mixed inerts/heavies (all)
plastics (some)
cardboard (some)
metals (all)
20-80%*
Bulky plastic & carpet
Bulky plastic & carpet
Recycler(R)
Landfill
*Depends on objective of the organisation
5%
Recycler(R or RR
WP)
10-90%
Residual
Size separationE.g. screen, trommel,
Size separationE.g. screen, trommel,
LandfillLandfillEnergy
recovery(RR WP)
Energy recovery(RR WP)

47
AssessmentAssessment
Landfill Landfill
0-5%
100%
INCOMING WASTE MATERIAL
(plastics, cardboard/
paper, metals, glass)
INCOMING WASTE MATERIAL
(plastics, cardboard/
paper, metals, glass)
FACILITY BOUNDARY
Shredder*Shredder*95-100%
0-30%
Transport to Manufacturing
(RR WP)
Transport to Manufacturing
(RR WP)
70-100%
Contaminants(e.g. flock)
Contaminants(e.g. flock)
Pre- sorting/dis-assembly
(i.e. mobile plant, manual)
Pre- sorting/dis-assembly
(i.e. mobile plant, manual)
Sorting/Separation/
Contaminant Removal
Sorting/Separation/
Contaminant Removal
* Not in all facilities * Not in all facilities
0-30%
Baling/Aggregation
Baling/Aggregation
Figure 3.1.5: High-level operational flow diagram and resource recovery performance of
Recycling operation (R) facilities in Metropolitan Adelaide. Description in Figure is based on
consultants’ experience and comments by consultation respondents
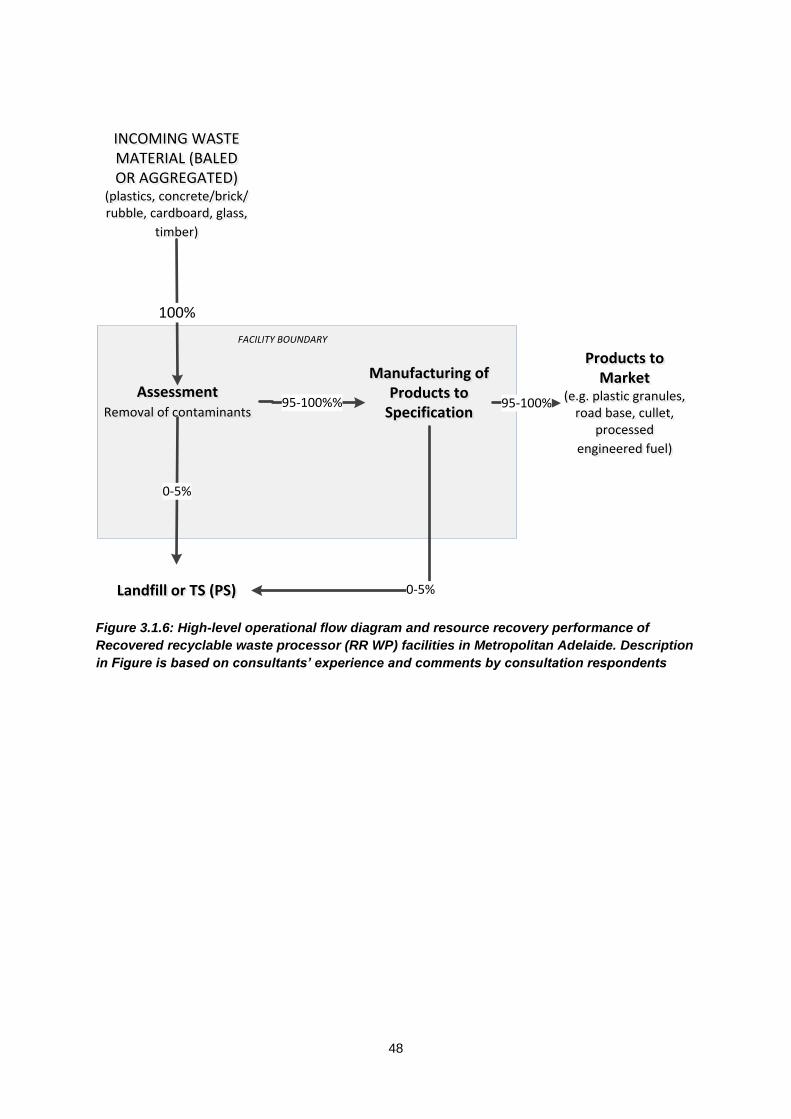
48
AssessmentRemoval of contaminants
AssessmentRemoval of contaminants
Landfill or TS (PS)Landfill or TS (PS)
0-5%
100%
INCOMING WASTE MATERIAL (BALED OR AGGREGATED)
(plastics, concrete/brick/rubble, cardboard, glass,
timber)
INCOMING WASTE MATERIAL (BALED OR AGGREGATED)
(plastics, concrete/brick/rubble, cardboard, glass,
timber)
FACILITY BOUNDARY
95-100%%
0-5%
Manufacturing of Products to
Specification
Manufacturing of Products to
Specification
Products to Market
(e.g. plastic granules, road base, cullet,
processed
engineered fuel)
Products to Market
(e.g. plastic granules, road base, cullet,
processed
engineered fuel)
95-100%
Figure 3.1.6: High-level operational flow diagram and resource recovery performance of
Recovered recyclable waste processor (RR WP) facilities in Metropolitan Adelaide. Description
in Figure is based on consultants’ experience and comments by consultation respondents
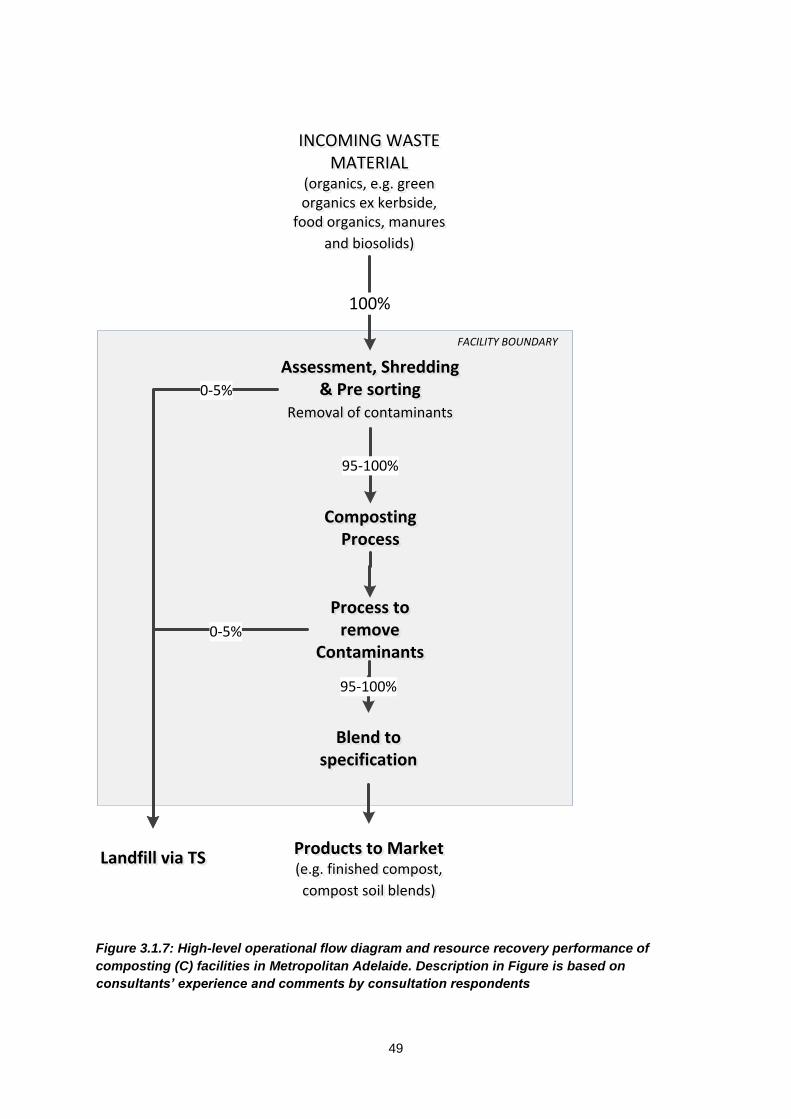
49
Assessment, Shredding & Pre sorting
Removal of contaminants
Assessment, Shredding & Pre sorting
Removal of contaminants
Landfill via TSLandfill via TS
95-100%
100%
FACILITY BOUNDARY
Composting Process
Composting Process
Blend to specification
Blend to specification
95-100%
Process to remove
Contaminants
Process to remove
Contaminants0-5%
INCOMING WASTE MATERIAL
(organics, e.g. green organics ex kerbside,
food organics, manures
and biosolids)
INCOMING WASTE MATERIAL
(organics, e.g. green organics ex kerbside,
food organics, manures
and biosolids)
0-5%
Products to Market(e.g. finished compost,
compost soil blends)
Products to Market(e.g. finished compost,
compost soil blends)
Figure 3.1.7: High-level operational flow diagram and resource recovery performance of
composting (C) facilities in Metropolitan Adelaide. Description in Figure is based on
consultants’ experience and comments by consultation respondents

50
Assessment & Pre sorting
Removal of contaminants
Assessment & Pre sorting
Removal of contaminants
Landfill or Transfer Station
Landfill or Transfer Station
0-5%
100%
FACILITY BOUNDARY
Shred to size and treat as required
Shred to size and treat as required
0-5%
95-100%
MetalsMetals
INCOMING WASTE MATERIAL
(timber, e.g. pallets, demo timber, timber via
C&I source separation)
INCOMING WASTE MATERIAL
(timber, e.g. pallets, demo timber, timber via
C&I source separation)
95-100%
Products to Market
(e.g. wood chips, mulch, coloured
landscape
products)
Products to Market
(e.g. wood chips, mulch, coloured
landscape
products)
Recycler(R)
Recycler(R)
Figure 3.1.7: High-level operational flow diagram and resource recovery performance of other
organic waste processors (OW WP) facilities in Metropolitan Adelaide. Description in Figure is
based on consultants’ experience and comments by consultation respondents

51
3.4 The Facility Role in Resource Recovery & Waste Disposal
3.4.1 Steps in Resource Recovery & Waste Disposal
The above facilities represent only one stage in the resource recovery and waste management
process. Figure 3.2 gives a high-level graphical illustration of different segments and steps in the
resource recovery and waste management sector for metropolitan Adelaide. Before material reaches
these facilities, other important steps occur.
Customer site
o The customer (waste generator) is usually responsible for deciding the type of
waste collection service engaged by its business. Where a recycling service is
used the customer is usually responsible for separating recyclable materials from
residual waste.
Recyclable materials may be source separated and/or aggregated by
the customer at their site.
This source separation and/or aggregation are usually designed
to allow the material to then be taken to a facility for resource
recovery and/or recycling.
o The facility the material is being sent to will control what
and how the source separation is performed.
Consequently, the material is purpose-prepared
for the facility where resource recovery will
occur.
The remaining material is aggregated into waste for disposal to
landfill.
o What material is in the waste stream will depend on the
extent of source separation that has been instigated and
taken place.
Collection
o The waste or recyclable material is collected and transported to relevant
facilities.
Usually this is performed by contractors.
Some of these contractors also represent or are employed by
individual facilities.
Other contractors act independently of the facilities.
In some instances, such as public transfer station, members of the
public may transport their own waste from site to facility.
The importance of these other steps in the context of this study is briefly discussed in the following
sections.

52
Waste
Generation
Source
Separation
WasteWaste
ResidualRecyclables
RecyclingWaste
TS
Resource
Recovery
Facility
Recovered
Materials
Recycling
Depot (TS)Rejected
Material
Residual
Material
Rejected
Material
Residual
Material
Landfill
Resource
Recovery?
Resource
Recovery?
Resource
Recovery?
Virgin
Material Substitute
CUSTOMER SITE
COLLECTION- WHEELS BUSINESSES
- SKIPS
- PUBLIC
FACILITIES
Waste to landfill where
source separation/
resource recovery has
been practised/occurred
Figure 3.2: High-level depiction of the different segments and steps in the resource recovery
and waste management sector for metropolitan Adelaide.

53
3.4.2 Effect of Existing Source Separation & Resource recovery on Waste Residual
Figure 3.3 two pages over summarises the reported quantities and estimated sector splits for
waste material that have been disposed to landfill since 1993/1994 in South Australia (data
derived from 2007 Waste Levy Review (Zero Waste SA, 2007a) and South Australian Recycling
Industry Investment Review (Zero Waste SA, 2009)5).
Based on this landfill data, and also considering recycling activity reported in the South Australian
Recycling Activity Report 2009-10 (Zero Waste SA 2011), Figure 3.4 overleaf gives a high-level
analysis of projected material flows for waste and recyclables in South Australia6.
o This analysis shows how South Australia’s total waste generation (ca. 3.8 Million tonnes)
is likely split between metropolitan and regional areas.
o In the metropolitan area, it also shows the projected split of waste material between
Municipal, C&I and C&D sectors.
o For each of the above sectors, it also suggests the split between material being recycled
and disposed of to landfill.
o Within the above split for each sector, it suggests the potential percentage of waste
material arriving at landfill as:
Unadulterated or non-source separated waste material; or
Waste material that has been subject to source separation and/or is the residual
from a resource recovery facility.
In the consultants’ opinion, this high-level analysis suggests the following.
o The amount of this general waste attributed to the metro area is about 80%.
o Of this metro general waste stream:
C&I could constitute about 200,000-250,000 tonnes/yr;
C&D volumes would be of a similar order.
o In the metropolitan area, a substantial portion of this general waste currently going to
landfill may have already been subject to some type of source separation at site or is the
end residual product of existing resource recovery at a facility.
It is the consultants’ opinion that for C&I and C&D this amount could be
significant and potentially up to 50% (or more) of the metro waste stream from
these sources.
(Cont. two pages over)
5
The consultants recognise that the analysis in this report may suggest a higher proportion of MSW being
landfilled than has been assumed or concluded in other reports or by other analyses, e.g. Environment Protection
and Heritage Council (2009). Please refer to the modelling conducted for the South Australian Recycling Industry
Investment Review (Zero Waste SA 2009) for a full explanation of the consultants’ analysis. 6 Readers should appreciate that this is a high-level analysis based on existing publicly available data and
modelling presented in the South Australian Recycling Industry Investment Review (Zero Waste SA 2009), which
is intended to illustrate the current situation in South Australia. The consultants’ do not warrant that this is
necessarily an accurate depiction of South Australia’s circumstances.

54
SA Waste
Generation
3.8 Mt
Metro Area
2.9 Mt
Regional Area
0.9 Mt
Resources
0.65 Mt
(70-75%)
Landfill
0.25 Mt
(25-30%)
Municipal
0.65 Mt
C&I
0.85 MtC&D
1.4 Mt
Landfill
0.34 Mt
(50-55%)
Resources
0.62 Mt
(70-75%)
Landfill
0.23 Mt
(25-30%)
Resources
1.2 Mt
(83-88%)
Landfill
0.2 Mt
(12-17%)
75-80%
20-25% 45-30%
40-60% (L/F)50-70% (L/F)
20-25%
70-75% 25-30%
27-33%
Resources
0.29 Mt
(45-50%)
Source
Separation
Resource
Recovery
40-60% (L/F)
Source
Separation
Resource
Recovery
Source
Separation
Resource
Recovery
30-50% (L/F)
Figure 3.4: High-level material flow analysis for recycling and waste disposed of to landfill in South Australia. Based on consultants’ analysis of
landfill data and sector splits developed for South Australian Recycling Industry Investment Review (Zero Waste SA, 2009) and recycling data from
the South Australian Recycling Activity Report 2009-10 (Zero Waste SA 2011)

55
Depending on the quality of source separation or resource recovery, this means
that this waste material may be resource-value stripped or lean.
Landfill audit data from 2007 (Zero Waste SA, 2007b) may support this
suggestion – see Figures 3.5 and 3.6.
For C&I waste residual, food/kitchen organic contamination was the
dominant constituent at 30%.
o There are significant amounts of other recyclable materials but
these may be mixed or contaminated with the food/organic
material and therefore not easy or suitable to resource recover at
existing facilities in SA.
o Over 20% of the C&I waste residual was also presented in
garbage bags.
For C&D waste residual, clean fill and low-level contaminated soils
constituted nearly 60% of the material.
o The clean fill could be recovered and used as daily cover by
landfills.
o There are still significant amounts of potentially recyclable
material but how recoverable these are and at what value are not
clear.
This issue could make it less commercially attractive to the industry to take this
remaining material, as the value of the recovered material is often essential for
resource recovery to be commercially feasible.
0
200,000
400,000
600,000
800,000
1,000,000
1,200,000
1,400,000
MSW C&I C&D
Figure 3.3: Landfill quantities in South Australia since 1993/94. The estimated breakdown
between sector origins is also shown. Landfill data, including sector splits, to 2005/06 from
Review of Solid Waste Levy (Zero Waste SA, 2007a); landfill data from 2006/07 onwards from
South Australian Recycling Activity Report (Zero Waste SA, 2011); sector splits from 2006/07
onwards based on landfill projections in South Australian Recycling Industry Investment
Review (Zero Waste SA, 2009).
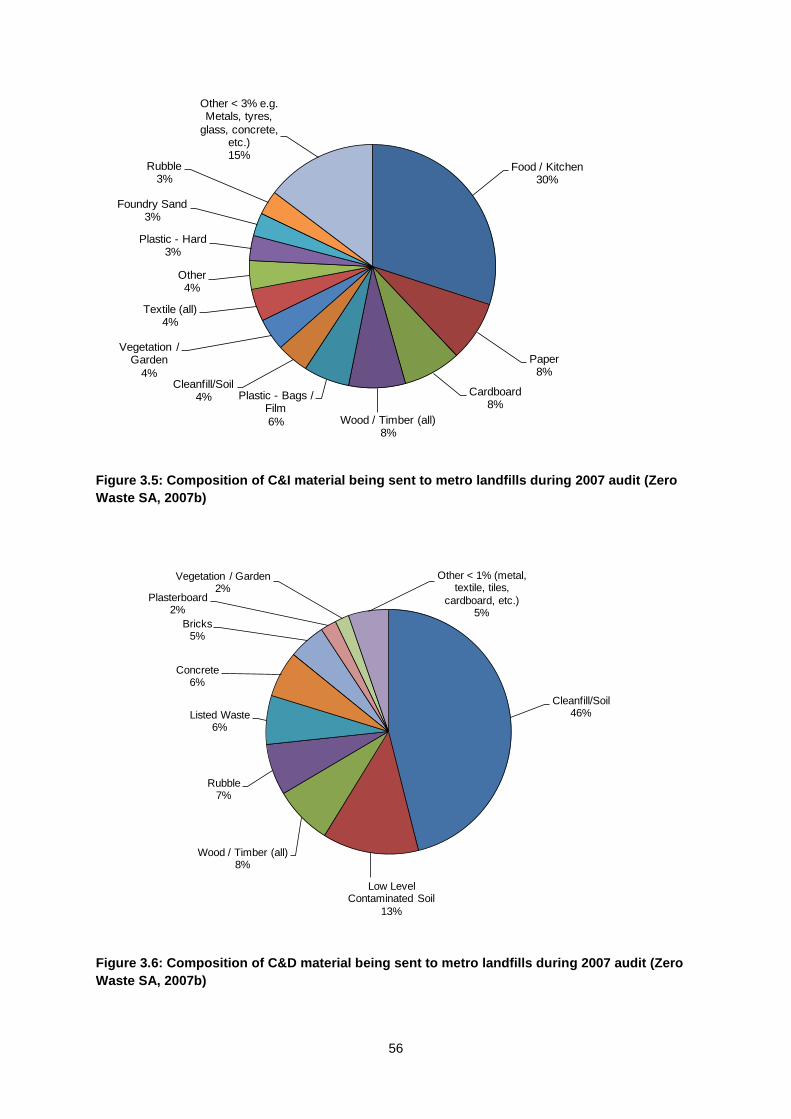
56
Food / Kitchen 30%
Paper8%
Cardboard 8%
Wood / Timber (all) 8%
Plastic - Bags / Film
6%
Cleanfill/Soil 4%
Vegetation / Garden
4%
Textile (all)4%
Other 4%
Plastic - Hard 3%
Foundry Sand 3%
Rubble 3%
Other < 3% e.g. Metals, tyres,
glass, concrete, etc.)15%
Figure 3.5: Composition of C&I material being sent to metro landfills during 2007 audit (Zero
Waste SA, 2007b)
Cleanfill/Soil46%
Low Level Contaminated Soil
13%
Wood / Timber (all) 8%
Rubble7%
Listed Waste6%
Concrete6%
Bricks5%
Plasterboard2%
Vegetation / Garden 2%
Other < 1% (metal, textile, tiles,
cardboard, etc.)5%
Figure 3.6: Composition of C&D material being sent to metro landfills during 2007 audit (Zero
Waste SA, 2007b)

57
3.4.3 Suitability of Existing Facilities for Processing Waste Residual
It is the consultants’ view, the current paradigm in the South Australian industry for commercially
viable resource recovery is to design and operate facilities for material inputs that are highly
controlled and contain source separated and/or aggregated materials low in contamination.
o In this respect, it is the consultants’ experience that many of the existing facilities are not
designed to be multi-purpose or deal with highly contaminated material.
There would therefore not be existing facilities that could easily step up for
resource recovery of the remaining residual or non-source separated material.
o In fact, the consultants note that most examples of where such multi-purpose facilities
have been attempted are interstate.
These facilities are generally referred to as AWTs or Alternative Waste
Technology facilities and have been used to process waste where source
separation has not been, or is not able to be efficiently, practised.
In view of the above, these facilities have essentially been built for use with
Municipal Waste, not C&I and C&D Waste where source separation is easy to
achieve.
The experiences of other jurisdictions with these facilities have not proven to be
positive, both in terms of cost and outcomes.
A significant problem with AWTs has been difficulty in avoiding
contamination of recovered products; because once waste materials are
mixed it is difficult, without substantial processing and cost, to remove
them to acceptable levels for market acceptance.
Most jurisdictions that have deployed AWTs have subsequently adopted
source separation strategies to improve resource recovery outcomes,
which is in-line with the South Australian industry paradigm.
3.5 Interstate and Overseas Trends – Resource Recovery Facilities
3.5.1 Introduction
Building on the discussion above, this section provides a brief desktop analysis to review what are the
main processes and procedures in relation to resource recovery being used interstate and overseas
that may be relevant to the South Australian context for future improvements. This review does not
directly consider the residual municipal stream as this stream is excluded from a need for any further
resource recovery under the W2REPP. As a consequence, AWTs built to deal with processing of
municipal waste have not been explicitly considered although it is noted in our conclusion to this
section that technology/processes in these Municipal AWTs could have some potential value and
application for processing C&I and C&D residual waste.
In view of this, relevant trends in resource recovery facilities for the Commercial and Industrial (C&I)
and Construction and Demolition (C&D) waste sectors are reviewed below by state/territory. Several
examples of trends in other major international jurisdictions and/or countries are also given.
3.5.2 Relevant Interstate Trends
3.5.2.1 New South Wales
The Inside Waste Industry Report 2011/12 (WMAA 2011) reports that resource recovery for C&I
sector waste in NSW is approximately 53%. This report comments that there is the lack of space for
multiple bins at many sites, and as a consequence, a large proportion of the C&I material will be
presented for collection as a mixed waste. In view of this issue, the initial response to this problem
has been to develop C&I Dirty MRFs that can process these mixed waste streams. It is estimated
58
that a number of C&I dirty MRF facilities will need to be built in the near future to a total capacity of
250,000tpa at a capital cost of $40-100 million and processing cost in the order of $40/tonne.
This same report also indicates that resource recovery from the C&D sector waste in NSW is currently
about 74%. The processes for resource recovery by the C&D sector in NSW are similar to those
employed in SA and waste-to-energy facilities are being looked at to achieve higher resource
recovery from the C&D waste stream.
3.5.2.2 Victoria
The resource recovery for C&I sector waste in Victoria is approximately 73% (WMAA 2011). Victoria
has a large manufacturing base, with significant volumes of pre-consumer recycling occurring from
these sites. As an example, Victoria leads the Australian states in plastics recovery, due primarily to
the recycling of large amounts of pre-consumer industrial manufacturing scrap (Sustainability Victoria,
2010). These high levels of pre-consumer recycling are largely achieved by source separation at
manufacturing sites, not requiring resource recovery facilities.
Nevertheless, there is growing emphasis on developing technology solutions such as C&I dirty MRFs to process the remaining mixed C&I waste streams in order to significantly increase resource recovery (WMAA 2011).
For C&D waste, the resource recovery achieved in Victoria is approximately 54% (WMAA June 2011).
This low level is attributed by the consultants to the availability of lower cost Inert Landfills in Victoria.
As a consequence, there does not appear to be a significant drive in this state to expand C&D
resource recovery capacity.
3.5.2.3 Queensland
Queensland can be considered to have low resource recovery performance in both C&I (58%) and
C&D (33%) (WMAA 2011). In the consultants’ opinion, there is limited resource recovery
processes/procedures currently used in Queensland that would assist SA resource recovery
improvement. This situation, however, may change with the introduction of a landfill levy on C&I and
C&D waste streams to landfill, which will encourage new facilities to be developed. It is expected that
Queensland will look to other states for inspiration as to what approaches it should take.
3.5.2.4 Western Australia, Tasmania, Northern Territory and ACT
The WA, Tasmania and NT jurisdictions have low recoveries in the C&I and C&D waste streams
(WMAA 2011).
In WA, there is a concerted effort to make new infrastructure investments to improve this situation.
For example, the consultants are aware of a new glass beneficiation opened in Kewdale in Perth by
Colmax, which appears to provide new technology for colour sorting and higher recovery from glass
fines. This technology could have application in the SA market to increase recovery from MRF glass
and glass fines.
The ACT reports a combined resource recovery of C&I/C&D of 81%, albeit on a low manufacturing
base (WMAA 2011). The ACT has flagged new future infrastructure for resource recovery from the
C&I waste stream and further organics processing from the commercial sector. However, it is
undefined at this time what this new infrastructure will entail.
3.5.2.5 Summary
It is the consultants’ opinion that, currently, there would be limited new learnings available from the
resource recovery processes/procedures used interstate. A few notable exceptions could include:
New glass beneficiation technologies available as recently installed in WA.
New interstate kerbside MRFs that have a higher recovery than the current processes utilised
in SA. South Australia could benefit from assessing these new technology kerbside MRFs

59
located interstate, to identify if there see if there are new technologies or processes which
increase resource recovery at SA MRFs, particularly in the plastics and glass components.
South Australia also is noted as having the only established waste-to-energy facility in Australia
(WMAA 2011) from C&I/C&D residuals. There appears to be gaining traction for this technology in
other states (ACT, NSW and Vic) to assist with increasing resource recovery to target levels set by
the jurisdictions.
However, as new facilities earmarked in the above discussion are developed in other jurisdictions,
new technologies/processes may be introduced. It would be important to keep a watching brief on
these developments to see what new technologies/processes can be adopted or retrofitted to South
Australian C&I and C&D resource recovery facilities.
3.5.3 Relevant Overseas Trends
3.5.3.1 European Union
Within the European Union there is a range of directives that cover waste management, including the
EU’s Landfill directive. This framework has led to a significant number of waste-to-energy facilities
being built to process municipal waste and C&I/C&D waste streams. The technology and efficiency of
these facilities could provide valuable learnings for SA resource recovery facilities. Organics
processing, particularly anaerobic in vessel processing, to produce energy and an organic soil
amendment is well established in various locations of the EU.
The EU is also moving towards Life Cycle Analysis to guide the best utilisation of materials and re-
emphasise the waste management hierarchy as its guiding principle (EU Commission, 2010)
3.5.3.2 United States
The US is moving down the path of looking at waste as a part of material management paradigm or
approach to sustainability. The US EPA has released the Sustainable Materials Management: The
Road Ahead in the US 2009-2020(US EPA 2009) which considers the sustainable use of materials as
its goal. The key shift is a changing emphasis from waste management to materials management.
Part of this materials management focus is an understanding the life cycle of the materials, which is a
similar approach to that which is being taken in the EU.
However, specific processes/technologies in the US that have higher resource recovery outcomes or
more advanced technologies than Australia could not be readily identified.
3.5.3.3 China
China’s government has been encouraging the use of new technologies in waste processing as
demonstrated by the construction of 61 new waste-to-energy plants in 2010 to process mainly MSW
(WMAA, 2011)
The rapid development of waste to energy technologies in China and potential modularising of these
units may provide future opportunities to import this technology in a cost effective manner.
3.5.3.4 Overview
There appears to be a large scale movement towards waste-to-energy facilities in Europe, China and
to a certain extent in the US, which could limit the potential for resource recovery of some waste
streams. This unintended consequence should be considered in the South Australian context.
In spite of this trend there is an ever increasing range of technologies from around the world that can
be applied to resource recovery facilities to increase recovery, reduce processing costs and increase
the quality of the recyclables. Examples include:

60
Improved magnets systems to remove specific metal types.
Improved bag opening facilities.
Improved aerobic and aerobics composting technologies.
Improved infrared and other sensors for removal of specific materials (e.g. types of plastics,
glass colours).
Improved product separation equipment.
Most Australian industries involved with resource recovery are continually reviewing these new
technologies as they develop for their applicability and robustness in the Australian context. It is
unusual for latest overseas developments in resource recovery technology not to be considered or
adopted by the Australian resource recovery industry within several years of commercial use.
61
4 Key Constraints for Resource Recovery Facilities
This section cites a number of existing facilities in metropolitan Adelaide when discussing constraints
relevant to some facility categories. Given low levels of detailed information from consultation
respondents on this topic, these examples and this information is primarily drawn independently from
Rawtec and Mike Haywood-SRS’s knowledge and understanding of the industry. Rawtec and Mike
Haywood-SRS’s understanding of these facilities may not necessarily be complete and these facilities
may not necessarily agree with constraints that we have implied these facilities may have.
4.1 Overview
The key constraints for resource recovery are described below for those facilities that are most likely
to want to be able to send their residual waste directly to landfill. This includes:
TS
TS (PS)
MRF(+ waste category)
R
C
The following facilities have not been reviewed for key constraints as they typically forward residual
waste to transfer stations rather than directly to landfill.
OW WP
Skip
C&D WP
C&I WP
RR WP

62
4.2 Key Constraints for Resource Recovery by Facility
4.2.1 Transfer Station (TS)
Refer to Table 4.1 for summary.
As previously mentioned in Section 3, there are potentially four sites that could be assigned to this
category for the purpose of the new classification. These are large facilities (70 -300k tonnes per
annum) that aggregate waste into either large capacity transfer trailers or bales for transport to landfill.
In the consultants’ experience and based on feedback from consultation respondents, they have a
fairly consistent set of Key Constraints for Additional Resource Recovery.
Table 4.1: Key Constraints for Additional Resource Recovery
Key Constraints for Additional Resource Recovery
Description of Constraint Number of Facilities Affected
Design of Facility Three of the sites have been commissioned predominantly for the purpose of consolidating volumes of waste into a container for economical transport to landfill. There was usually limited consideration given to resource recovery.
3
Land Area of Facility
The ability to change their process is extremely limited due to the lack of additional room in the facilities and so they will rely on other sources of separation either at source or at a separate facility prior to receipt for disposal. [This potential delegation by TSs back to upstream facilities to separate materials in advance of TS may be partially met by development of new dirty C&I MRFs mentioned in Section 3 and see below; but these new MRFs would not necessarily be able to deal with heavily contaminated and mixed C&I streams, which will still flow through to TSs.]
3
Additional Capital and Processing Costs
The total revenue collected from gate fees and commodity value of the materials collected may not cover the costs associated with the capital expenditure and processing costs for the materials compared with their landfill costs.
Even where mechanisms for improved recovery of waste have been installed, there can be limitations on the types of waste that the equipment or process can deal with.
3
Resource Recover on Limited Tonnes
A number of the TS facilities have very high % of kerbside collected general waste passing through their facility, which does not require further resource recovery as per the EPP. Hence, there is a small % of the waste received that may require further resource recovery and it may not be cost effective to install equipment to achieve this.
Example - One facility was built predominantly to manage the MSW from the councils. The facility also takes a small amount of waste, e.g. consultants’ estimate is 30,000 tonnes, from selected commercial operators where transport to other TSs is cost prohibitive. This site in its current format would have difficulty introducing a treatment aspect of the facility for the relatively small volume of C&I waste that is not covered by the exclusion.
2
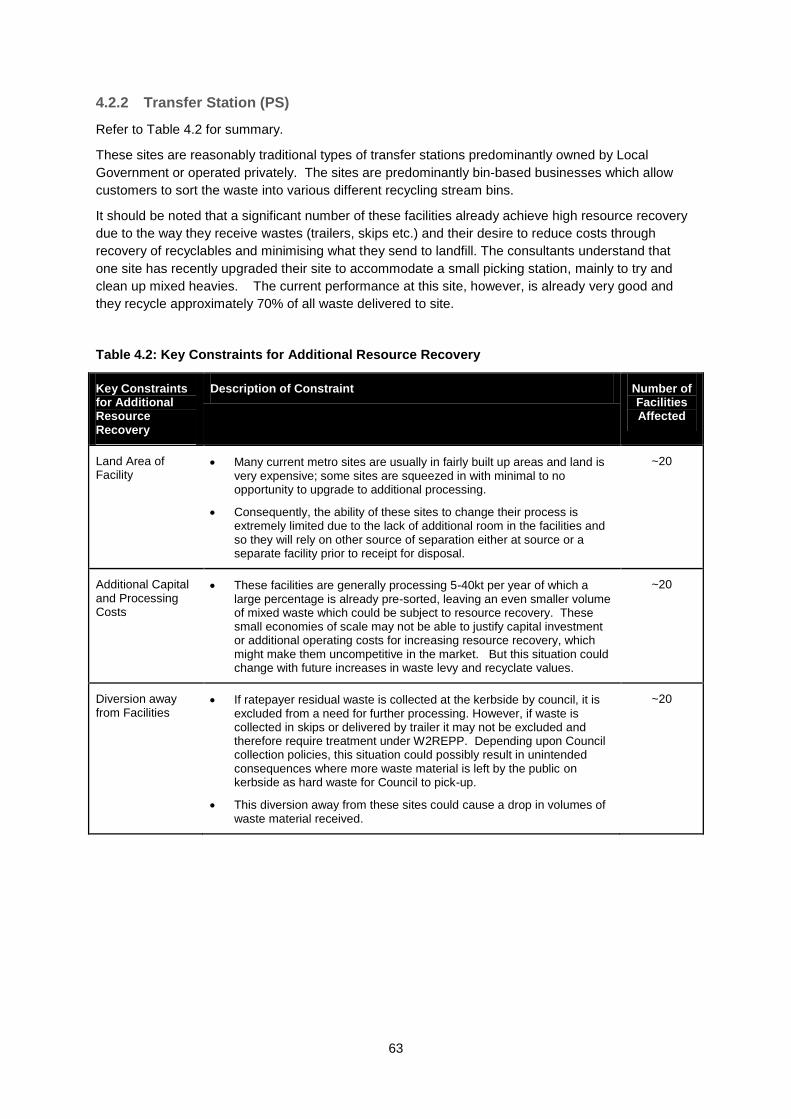
63
4.2.2 Transfer Station (PS)
Refer to Table 4.2 for summary.
These sites are reasonably traditional types of transfer stations predominantly owned by Local
Government or operated privately. The sites are predominantly bin-based businesses which allow
customers to sort the waste into various different recycling stream bins.
It should be noted that a significant number of these facilities already achieve high resource recovery
due to the way they receive wastes (trailers, skips etc.) and their desire to reduce costs through
recovery of recyclables and minimising what they send to landfill. The consultants understand that
one site has recently upgraded their site to accommodate a small picking station, mainly to try and
clean up mixed heavies. The current performance at this site, however, is already very good and
they recycle approximately 70% of all waste delivered to site.
Table 4.2: Key Constraints for Additional Resource Recovery
Key Constraints for Additional Resource Recovery
Description of Constraint Number of Facilities Affected
Land Area of Facility
Many current metro sites are usually in fairly built up areas and land is very expensive; some sites are squeezed in with minimal to no opportunity to upgrade to additional processing.
Consequently, the ability of these sites to change their process is extremely limited due to the lack of additional room in the facilities and so they will rely on other source of separation either at source or a separate facility prior to receipt for disposal.
~20
Additional Capital and Processing Costs
These facilities are generally processing 5-40kt per year of which a large percentage is already pre-sorted, leaving an even smaller volume of mixed waste which could be subject to resource recovery. These small economies of scale may not be able to justify capital investment or additional operating costs for increasing resource recovery, which might make them uncompetitive in the market. But this situation could change with future increases in waste levy and recyclate values.
~20
Diversion away from Facilities
If ratepayer residual waste is collected at the kerbside by council, it is excluded from a need for further processing. However, if waste is collected in skips or delivered by trailer it may not be excluded and therefore require treatment under W2REPP. Depending upon Council collection policies, this situation could possibly result in unintended consequences where more waste material is left by the public on kerbside as hard waste for Council to pick-up.
This diversion away from these sites could cause a drop in volumes of waste material received.
~20

64
4.2.3 MRF
Refer to Table 4.3 for summary.
By their nature MRF facilities undertake resource recovery as their main function. The residual from
these facilities may present limited opportunity for further resource recovery.
The key constraint for these sites to receive and process the waste is the quality of presentation by
the waste companies.
Table 4.3: Key Constraints for Additional Resource Recovery
Key Constraints for Additional Resource Recovery
Description of Constraint Number of Facilities Affected
High Level of Resource Recovery
There is already significant resource recovery occurring from most MRF facilities. There are still some recyclable /recoverable resources in the residual from these facilities, but may be costly to extract.
~2-5
Input Streams The recovery from these facilities can be increased by improving the quality of the input feed streams i.e. reduce contamination
Additional source separation at customer sites may provide additional streams to feed the MRF facilities. One operator in SA has been able to receive additional front lift as a result of restructuring of its collection operations to maximise dry recyclables and collect the wet waste separately
~2-5
Commodity Values The value of commodities can have a large bearing on what recycling streams are of value to collect and aggregate to market.
-2-5
Additional Capital and Processing Costs
Large additional investment in capital or operating cost could make the facilities uncompetitive in the market, unless economic to do so.
~2-5
4.2.4 Recycling Operations (R) and Recovered Recyclable Waste Processors (RR
WP)
Refer to Table 4.4 overleaf for summary.
These sites basically fall into two categories, source separated for processing for on selling i.e.
cardboard, paper, glass, plastics, e-waste etc. and those processing materials to specification for
reuse. Most of these facilities will produce limited residual waste to landfill, with the exception being
metals recyclers, which produce approximately 20-30% of their input as flock to landfill. Constraints to
additional resource recovery are similar to MRF above.
RR WP is a very mature market in many respects within the Metropolitan area and is largely dictated
by the demolition and construction areas to source raw materials and the civil and construction
industries to use the materials. In SA there is also a growing industry in plastics recycling and the
State has one of the largest Australian processors of plastic into reusable granules for sale into the
injection mouldings market.

65
Table 4.4: Key Constraints for Additional Resource Recovery
Key Constraints for Additional Resource Recovery
Description of Constraint Number of Facilities Affected
High Level of Resource Recovery
There is already significant resource recovery occurring from most R facilities. There are still some recyclable /recoverable resources in the residual from these facilities, but may be costly to extract.
~10-20
Input Streams The recovery from these facilities can be increased by improving the quality of the input feed streams i.e. reduce contamination.
Increases in source separated suitable materials.
~10-20
Additional Capital and Processing Costs
These facilities are generally processing 5-40kt per year so could not justify large capital or operating cost else make them uncompetitive in the market.
~10-20
Commodity Values/ Labour Costs
The value of commodities can have a large bearing on what recycling streams are of value to collect and aggregate to market. During the recent GFC there was a glut in the market of cellulose products and scrap. At one stage for about 3-4 months there was a very limited market for commodities. Scrap metal rapidly fell from over $400 to significantly reduced value in some instances. Many facilities either could not or could not suitably profitably sell their materials.
E-waste recycling is very time consuming and consumers may not want to pay much at the time of disposal (vs. at purchase point through product stewardship) to have them disassembled for recycling. Often these commodities are exported to the Asian region where labour and disposal is extremely cheap compared to Australia.
~10-20
Market Acceptance
Some Government Departments still release tenders that state that recycled pavement products are not suitable for use in their projects.
Stockpiling can become an issue during downturns in the economy if commercial storage needs conflict with stockpiling requirements designed to protect against environmental risks.
In the consultants’ opinion, there is a lack of uniformity in the use of many recycled products by local industry and it would be valuable if national industry codes of practice were developed by government to assist with acceptance and adoption of recycled materials
There is a risk (perceived or otherwise) that pavement materials may contain asbestos.
~10-20
.
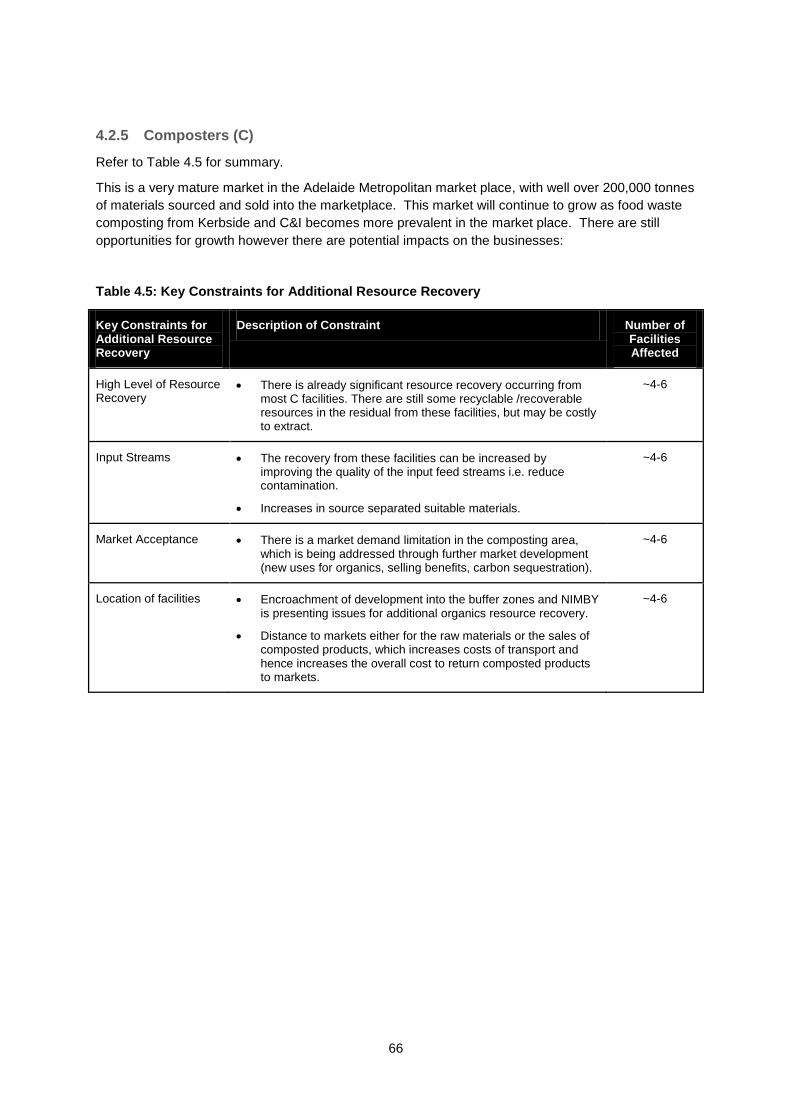
66
4.2.5 Composters (C)
Refer to Table 4.5 for summary.
This is a very mature market in the Adelaide Metropolitan market place, with well over 200,000 tonnes
of materials sourced and sold into the marketplace. This market will continue to grow as food waste
composting from Kerbside and C&I becomes more prevalent in the market place. There are still
opportunities for growth however there are potential impacts on the businesses:
Table 4.5: Key Constraints for Additional Resource Recovery
Key Constraints for Additional Resource Recovery
Description of Constraint Number of Facilities Affected
High Level of Resource Recovery
There is already significant resource recovery occurring from most C facilities. There are still some recyclable /recoverable resources in the residual from these facilities, but may be costly to extract.
~4-6
Input Streams The recovery from these facilities can be increased by improving the quality of the input feed streams i.e. reduce contamination.
Increases in source separated suitable materials.
~4-6
Market Acceptance There is a market demand limitation in the composting area, which is being addressed through further market development (new uses for organics, selling benefits, carbon sequestration).
~4-6
Location of facilities Encroachment of development into the buffer zones and NIMBY is presenting issues for additional organics resource recovery.
Distance to markets either for the raw materials or the sales of composted products, which increases costs of transport and hence increases the overall cost to return composted products to markets.
~4-6

67
5 Potential Costs & Benefits of Increasing Resource
Recovery Using Different Policy Response Options
5.1 Introduction
This section identifies:
Policy response options designed to increase resource recovery against a “business as
usual” scenario,
Considers the likely resource recovery outcomes for each of these options, and
Identifies the potential costs and benefits of the different options.
It is understood that the analysis of costs and benefits will be considered by the EPA when developing
guidance materials on what a facility will need to have done prior to being able to determine that
waste may be disposed of to landfill without further treatment under the W2REPP (per clauses 11(3)
and 11(8)).
5.2 Policy Response Options
This report’s analysis of facility processes, procedures and recovery rates as well as the constraints
faced by facilities has demonstrated that there is a marked degree of individuality in how businesses
operate, even within any single facility classification. This has important implications for the viability
of different policy responses for increasing resource recovery since it is not possible to nominate
specific actions that need to be undertaken uniformly across a facility classification.
Key policy response options therefore identified are:
Option 1 – Business as usual
Option 2 – Data Reporting
Option 3 – Resources Recovery Plans
Option 4 – Residual materials from source separated or resource recovered waste direct to
landfill
Option 5 – Specified processes for resource recovery
Option 6 – Resource recovery targets
Table 5.1 presents an outline of each option’s implications for facilities and EPA guidance materials
required. Additional information on the character of each option is given below.
Notably, many of these policy response options are not mutually exclusive and various responses
could be implemented over time to achieve further improved outcomes as knowledge increases.
Option 1 - Business as Usual (Baseline Policy Response)
This option involves setting minimal approval criteria & no resource recovery targets.
It relies on current market dynamics to drive continuing improvements in resource recovery.
o The waste levy has been increased in 2011-12 from $26 a tonne to $35 a tonne for
metropolitan Adelaide, with further increases after 2011-12 foreshadowed to potentially
$50 a tonne.
Investment in new resource recovery infrastructure would therefore continue to be decided by
industry based on market opportunity.

68
o However, it is assumed that State Government will continue grants and/or funding
schemes to industry to encourage new infrastructure development.
In the consultants’ opinion, source separation and/or resource recovery in South Australia should
continue to improve slowly on the back of these waste levy increases and from on-going industry
initiatives and infrastructure investment.
Option 2 – Data Reporting
This option would require approved facilities to report data to the EPA on their resource recovery
performance.
Table 5.3 suggests which facilities would likely be affected by this option and Section 8 of this
report provides details of the data that could be reported for this purpose.
In the consultants’ opinion the requirement to report data would provide an incentive for facilities
to monitor and improve performance by becoming better informed about, and having to disclose,
performance data.
Option 3 - Resource Recovery Plans
Approved facilities would be required to develop a resource recovery plan (RRP) for processing of
waste. The RRP would document, among other things:
o Waste management obligations and requirements, including relevant policies and
guidelines;
o Description of resource recovery process and procedures;
o Setting of resource recovery objectives and targets for the facility;
o Monitoring and reporting of resource recovery performance;
o System and/or initiatives for continuous improvement.
The suggested content above for a RRP can be considered analogous to the environmental
management system (EMS) concept, which is widely adopted in other industries and for which
there are international standards (e.g. ISO 14001:2004).
The RRP could provide an auditable facility management system, putting in place verifiable
process and procedures, as well as continuous improvement programs for a facility’s resource
recovery performance.
o This system would incorporate the data reporting requirement and describe the methods
adopted for collection and analysis of a facility’s resource recovery performance data
In the consultants’ opinion, the requirement for, and adoption of a RRP, should enable facilities to
improve resource recovery performance through better understanding and considered analysis of
existing processes and performance data.
Table 5.3 suggests which facilities would likely be affected by this option
Option 4 – Residual materials from source separated and resource recovered waste
direct to landfill
In this option, approved facilities would be allowed to divert waste residual from source separated
sites or existing resource recovery facilities directly to landfill.
o The approval to directly divert such material would need be subject to safeguards against
potential misuse, i.e.
Demonstrating acceptable resource recovery at site or other facility.
This would allow these other sites or facility to be non-approved so long
as it could be properly verified that source separation or resource
recovery at the other site or facility had satisfactorily occurred.
(Cont. two pages over)
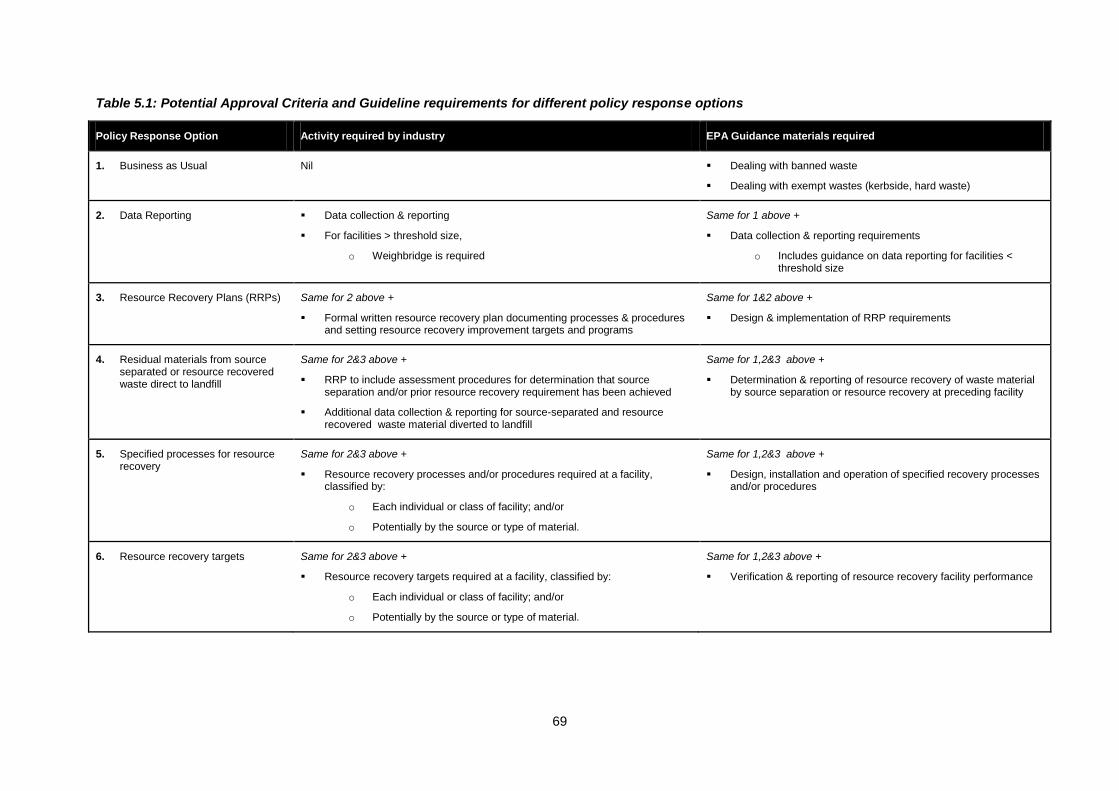
69
Table 5.1: Potential Approval Criteria and Guideline requirements for different policy response options
Policy Response Option Activity required by industry EPA Guidance materials required
1. Business as Usual Nil Dealing with banned waste
Dealing with exempt wastes (kerbside, hard waste)
2. Data Reporting Data collection & reporting
For facilities > threshold size,
o Weighbridge is required
Same for 1 above +
Data collection & reporting requirements
o Includes guidance on data reporting for facilities < threshold size
3. Resource Recovery Plans (RRPs) Same for 2 above +
Formal written resource recovery plan documenting processes & procedures and setting resource recovery improvement targets and programs
Same for 1&2 above +
Design & implementation of RRP requirements
4. Residual materials from source separated or resource recovered waste direct to landfill
Same for 2&3 above +
RRP to include assessment procedures for determination that source separation and/or prior resource recovery requirement has been achieved
Additional data collection & reporting for source-separated and resource recovered waste material diverted to landfill
Same for 1,2&3 above +
Determination & reporting of resource recovery of waste material by source separation or resource recovery at preceding facility
5. Specified processes for resource recovery
Same for 2&3 above +
Resource recovery processes and/or procedures required at a facility, classified by:
o Each individual or class of facility; and/or
o Potentially by the source or type of material.
Same for 1,2&3 above +
Design, installation and operation of specified recovery processes and/or procedures
6. Resource recovery targets Same for 2&3 above +
Resource recovery targets required at a facility, classified by:
o Each individual or class of facility; and/or
o Potentially by the source or type of material.
Same for 1,2&3 above +
Verification & reporting of resource recovery facility performance

70
For this purpose, the EPA may need to specify minimum requirements for
source separation or prior resource recovery to be achieved, before
waste could be diverted directly to landfill.
For source separation, this could be in terms of services offered
at that site.
For resource recovery, this could be in terms of resource
recovery process and/or targets.
It is important to recognise that the success of this option may be heavily influenced by future levy
increases, which would improve the commercial incentive for the industry to support greater
source separation initiatives.
o If the commercial incentive does not exist, it may not be supported and the market might
determine ways to achieve compliance without necessarily achieving more source
separation and resource recovery.
Option 5 – Specified processes for resource recovery
Waste material would be subject to defined resource recovery processes prior to disposal.
o The extent of resource recovery processing would be dictated by achieving State Waste
Strategy targets and could depend on facility & material type.
o The specified processes could be applied to all waste material or only that material where
prior source separation or resource recovery per Option 4 above had not occurred.
o Potential Implementation approach:
Approved facilities would audit performance during initial period.
Based on measured performance above the EPA would decide additional
resource recovery processes to be operated (but no explicit resource recovery
targets set) at a facility.
The EPA would need to consider if specified processes were applied to all
facilities receiving certain waste materials or on a facility-by-facility basis.
The success of this policy response option could also be strongly influenced by future levy rises
helping provide the commercial driver for investment by industry in new resource recovery
infrastructure.
o If required additional resource recovery were not commercially viable, this could result in
market failure (e.g. no new industry investment in new infrastructure) and unintended
consequences (e.g. industry determines ways to circumvent the new requirement so it
can continue to operate with existing processes without achieving improved resource
recovery).
Option 6 - Resource recovery targets
In this policy response option, all facilities would need to achieve specified resource
recovery targets for nominated materials (e.g. paper, steel, etc.).
Again, this policy response could be applied:
o To all waste material or only that material where prior source separation or
resource recovery, per Option 4 above, had not occurred.
o As general across-industry or facility-by-facility targets.
Furthermore, rises in the waste levy would probably be needed to ensure that the market
can support the additional investment in new resource recovery infrastructure that would
be needed.

71
5.3 Resource Recovery Performance/Outcomes
5.3.1 Initial Comment
One of the principal costs and benefits to be assessed for this study is to consider what affect a
potential policy option might have on the achieving targets in the State’s Waste Strategy. To conduct
this assessment, we need to have an understanding of the State Waste Targets, as well as a baseline
from which to judge performance improvements in the current resource recovery performance of the
South Australian waste and recycling industry. These issues are discussed in the following sections,
including identification of a proposed baseline for C&I and C&D resource recovery for South Australia.
5.3.2 State Waste Strategy Targets
The 2011-2015 State Waste Strategy (Zero Waste SA 2011) has the following targets for Metropolitan
Adelaide relevant to this study:
C&I:
o 65% Diversion by 2012
o 75% Diversion by 2015
C&D:
o 85% Diversion by 2012
o 90% Diversion by 2015
5.3.3 Baseline Current & Future Performance
There are several studies and reports that have assessed current and projected future resource
recovery performance for South Australia, including separate consideration of the C&I and C&D
sectors. Key findings from these previous assessments are discussed below.
5.3.3.1 Recycling Industry Review 2009
The South Australian Recycling Industry Review (Zero Waste SA, 2009) made projections of future
C&I and C&D resource recovery for South Australia – see Figures 5.1 and 5.2, respectively. Also
shown in each Figure is the estimated diversion for C&I and C&D from the 2009-10 Recycling Activity
survey.
The projections assumed that there would be increases in the waste levy, including the increase in
the waste levy from $25.20/tonne (metro area) in 2008/09, but did not specify precisely what other
increases would occur and when. This Review also noted that the industry believed a significant
tipping point for investment in higher resource recovery would require the levy to rise to $50/tonne
(metro area).

72
68%
70%
72%
74%
76%
78%
80%
82%
84%
0
200,000
400,000
600,000
800,000
1,000,000
1,200,000
1,400,000
1,600,000
1,800,000
Landf ill Resource Recovery (inc. Flyash)
Diversion (exc. Flyash) Diversion (inc. Flyash)
2009-10 Recycling Activity (inc. Flyash) Baseline - Diversion (no W2REPP)
Baseline - Diversion (no W2REPP) Baseline - Diversion (no W2REPP)
Figure 5.1: South Australian Recycling Industry Review (Zero Waste SA, 2009) C&I Projections
for Landfill, Resource Recovery & Diversion – including and excluding fly ash. Data and
figures modified by consultants to include baseline projections proposed for this study
80%
82%
84%
86%
88%
90%
92%
0
200,000
400,000
600,000
800,000
1,000,000
1,200,000
1,400,000
1,600,000
1,800,000
Landf ill Resource Recovery
Diversion 2009-10 Recycling Activity
Baseline Diversion (no W2REPP) Baseline Diversion (no W2REPP)
Baseline Diversion (no W2REPP)
Figure 5.2: South Australian Recycling Industry Review (Zero Waste SA, 2009) C&D
Projections for Landfill, Resource Recovery & Diversion. Data and figures modified by
consultants to include baseline projections for this study.
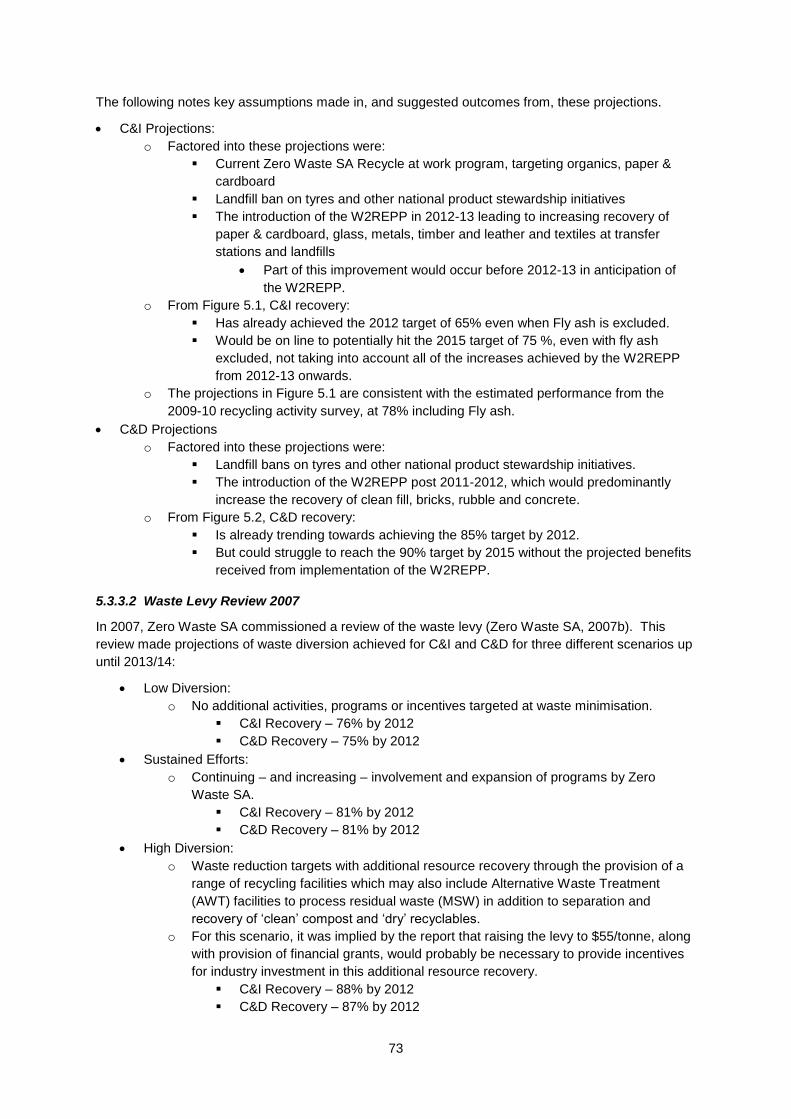
73
The following notes key assumptions made in, and suggested outcomes from, these projections.
C&I Projections:
o Factored into these projections were:
Current Zero Waste SA Recycle at work program, targeting organics, paper &
cardboard
Landfill ban on tyres and other national product stewardship initiatives
The introduction of the W2REPP in 2012-13 leading to increasing recovery of
paper & cardboard, glass, metals, timber and leather and textiles at transfer
stations and landfills
Part of this improvement would occur before 2012-13 in anticipation of
the W2REPP.
o From Figure 5.1, C&I recovery:
Has already achieved the 2012 target of 65% even when Fly ash is excluded.
Would be on line to potentially hit the 2015 target of 75 %, even with fly ash
excluded, not taking into account all of the increases achieved by the W2REPP
from 2012-13 onwards.
o The projections in Figure 5.1 are consistent with the estimated performance from the
2009-10 recycling activity survey, at 78% including Fly ash.
C&D Projections
o Factored into these projections were:
Landfill bans on tyres and other national product stewardship initiatives.
The introduction of the W2REPP post 2011-2012, which would predominantly
increase the recovery of clean fill, bricks, rubble and concrete.
o From Figure 5.2, C&D recovery:
Is already trending towards achieving the 85% target by 2012.
But could struggle to reach the 90% target by 2015 without the projected benefits
received from implementation of the W2REPP.
5.3.3.2 Waste Levy Review 2007
In 2007, Zero Waste SA commissioned a review of the waste levy (Zero Waste SA, 2007b). This
review made projections of waste diversion achieved for C&I and C&D for three different scenarios up
until 2013/14:
Low Diversion:
o No additional activities, programs or incentives targeted at waste minimisation.
C&I Recovery – 76% by 2012
C&D Recovery – 75% by 2012
Sustained Efforts:
o Continuing – and increasing – involvement and expansion of programs by Zero
Waste SA.
C&I Recovery – 81% by 2012
C&D Recovery – 81% by 2012
High Diversion:
o Waste reduction targets with additional resource recovery through the provision of a
range of recycling facilities which may also include Alternative Waste Treatment
(AWT) facilities to process residual waste (MSW) in addition to separation and
recovery of ‘clean’ compost and ‘dry’ recyclables.
o For this scenario, it was implied by the report that raising the levy to $55/tonne, along
with provision of financial grants, would probably be necessary to provide incentives
for industry investment in this additional resource recovery.
C&I Recovery – 88% by 2012
C&D Recovery – 87% by 2012

74
Figure 5.3: Waste levy review projections of changed in C&I diversion for three different
scenarios: Low Diversion, Sustained Efforts and High Diversion. Figure reproduced from Zero
Waste SA (2007b)
Figure 5.4: Waste levy review projections of changed in C&D diversion for three different
scenarios: Low Diversion, Sustained Efforts and High Diversion. Figure reproduced from Zero
Waste SA (2007b)

75
For all Levy Review scenarios above, the C&I State Waste Strategy targets would be achieved for
2012 and 2013. However, the C&D State Waste Strategy targets could probably only be achieved
under the High Diversion scenario.
The Sustained Efforts scenario above is considered similar to the Recycling Industry Review
projections where potential benefits of the W2REPP are not considered.
5.3.4 Baseline for Assessing Policy Response Outcomes
In view of the above, the South Australian Recycling Industry Review projections (Zero Waste SA
2009), excluding benefits of W2REPP outcomes and taking account of some future incremental
improvements achieved by a potential levy increase to $50/tonne, has been proposed as a suitable
baseline to judge outcomes from potential policy response options in this study. These new
projections for both C&I and C&D have been developed by the consultants from the original data set
for this report and are depicted in Figures 5.1 and 5.2 and summarised in the Table 5.2 overleaf. As
can be seen in these Figures, this baseline is shown as a range, reflecting uncertainty in resource
recovery outcomes that might occur.
o For the purpose of this study, this baseline will essentially represent the resource recovery
achieved by the Business-as-Usual option.
Figures 5.1 and 5.2 also suggest that the resource recovery performance will ultimately tend towards
an upper bound or asymptote. It needs to be recognised that linear improvements in resource
recovery performance can no longer be expected. Eventually all material that can be economically
resource recovered will be, and the residuals that are left will either be the material that is too
contaminated or which is the by-product from resource recovery or recycling operations. The cost of
recovering resources of further value from this residual will be cost prohibitive. It may not necessarily
even be suitable for waste-to-energy.
What this upper limit for resource recovery is has not been established, and it is beyond the scope of
this study to do so, although it could be worked out with more detailed analysis and time.
Nonetheless, we suggest that it might already be increasingly challenging to make substantial gains
beyond the current baseline. This potential constraint is considered in projections of improvement
achieved by policy response options in this study.
Table 5.2: Baseline Diversion outcomes for C&I and C&D assumed for this study. Derived
from Baseline projection in Figures 5.1 and 5.2
Year C&I (Fly ash excluded) C&D
2009-10 77% (70%) 84%
2012-13 78-79% (73-74%) 85-86%
2017-18 79-81% (75-77%) 86-88%

76
5.4 Industry Outcomes of Policy Options
This section focuses on recognising and understanding, at a high-level, some of the key outcomes for
industry from the implementation for each of policy options. The outcomes considered are given
below. Table 5.3, which is presented several pages over, summarises the consultants’ assessment of
these expected industry outcomes for each of the policy response options. The following sections
also provide brief overviews of these industry impacts:
The number of facilities likely to be affected by the policy.
o This number could not be accurately predicted at this time but the consultants’ view is
that between 4-25 facilities could elect to seek approval at some time during the
implementation of the W2REPP across all policy options.
The facilities first seeking approval, logically, would be the 4 current transfer
stations. Two other landfills, which may elect to upgrade on-site infrastructure,
are also likely to seek approval at some time in the first couple of years.
Additional facilities may wait to see how these initial approvals influence the
market and their obligations and costs of disposing to landfill via TS, before
deciding – which will probably be a commercial decision – to seek approval.
The number of these additional facilities seeking approval will also
depend on clarification by the EPA of what approval criteria will apply for
facilities.
The potential investment costs – for industry and customers – to implement the policy response
option.
o It is important to realise that investment costs may dictate the commercial practicability
and timeframes of industry responding to a policy response action.
o It should be noted that the values in Table 5.3 are high-level estimates and will vary
widely between facilities depending on size, location, materials received, and existing
plant/process.
The $/tonne increase in handling/processing cost to the industry for implementing the policy
response option.
o The basis for the calculation of additional $/tonne for each Option is set out in Table 5.3.
o This additional cost reflects both the investment and on-going operating costs per tonne
of material processed as a consequence of industry implementing the policy response
action. This additional cost again could dictate the commercial practicability and response
timeframes involved with implementation of a policy response option.
o It is also important to recognise that this additional cost will either have to be absorbed by
the industry or passed onto customers as higher gate fees.
o The additional cost should also be judged relative to the current processing cost of a
facility.
In the consultants’ opinion, the current processing costs of resource recovery
facilities would generally range between $30 and $60/tonne. This processing
cost would not include:
Rebates or payments that facilities receive for recyclable materials or the
costs;
Collection costs;
Disposal costs for residual material, including landfill gate fee.
o Per comment for investment cost above, the additional processing cost estimate is a
high-level estimate. The actual additional processing cost could vary widely between
facilities depending on size, location, materials received, resource recovery achieved, and
existing plant/process.
The timeframe it would take for the policy response option to be fully implemented.

77
o These timeframes assume that the policy response option is commercially viable for a
facility to reasonably implement and there are no other regulatory or commercial barriers
to implementation. These assumptions, however, may not be valid depending on other
Government policy actions (e.g. waste levy increases); restrictions on EPA licences or
development approvals; funding support; etc.
The estimated improvement in resource recovery the policy response option could achieve on
material being received.
o This estimated improvement does not include any processing of waste residuals by
energy recovery.
o The estimated improvement is considered to be across all facilities likely to implement the
policy response option.
Advantages / disadvantages of the policy response option.
o These advantages / disadvantages include comments on the ease of implementation and
administration of the policy response option for the EPA and industry.
5.4.1 Option 1 – Business as Usual (Baseline)
In this policy response option, nothing really changes but improvement in resource recovery continues
along the current trajectory, supported by existing industry initiatives and interventions by Zero Waste
SA and Government, including a future increase in the waste levy to $50/tonne.
This is the easy and low cost, low administration option for EPA, industry and customers but it still
requires guidelines from the EPA for industry to deal with banned and exempt materials.
It enables the 2015 State Waste Strategy target of 75% for C&I to be delivered but not the 2015 C&D
target of 90%, where it falls short.
5.4.2 Option 2 – Data Reporting
This policy response option motivates industry improvement by requiring relevant facilities to collect
and report data.
It may seem surprising but this in itself may well catalyse better understanding by the industry of their
own performance, leading to self-improvement and efficiency gains, and also transparency by which
under-performing facilities can be identified and Government assistance and interventions can be
better targeted.
In this respect, data reporting would additionally enable the EPA to confirm that actual performance is
consistent with reported performance when auditing these facilities.
There is a slightly higher administrative load for both EPA and Government and the industry. The
EPA will need to develop and administer new guidelines for data reporting. The industry may need to
make investments to improve its current data measurement and collection systems, and then ensure
that data is reported. For industry, these administrative loads could be lessened for smaller facilities
by less frequent reporting and/or a smaller sub-set of reported data being required.
However, the estimated cost to industry of implementing this option is relatively low, at up to $100-
$250k in total across the metropolitan area, depending on which sites/facilities seek approval and the
existing data collection or reporting systems they already have in place. This expenditure and the
additional work involved in maintaining and supporting these data collection systems is likely to add a
small cost to existing processing costs, estimated at up to 50¢/tonne for approved facilities before any
offsets of that cost through increased payments or rebates arising from increased recovery of
recyclable materials and reduced waste levy payments through less waste to landfill.
An advantage of data reporting is it would allow collection of data that may then enable more reliable
assessment of the performance of approved facilities to determine if other policy response options are
feasible and how they might best be implemented. For instance, once a baseline for a facility is
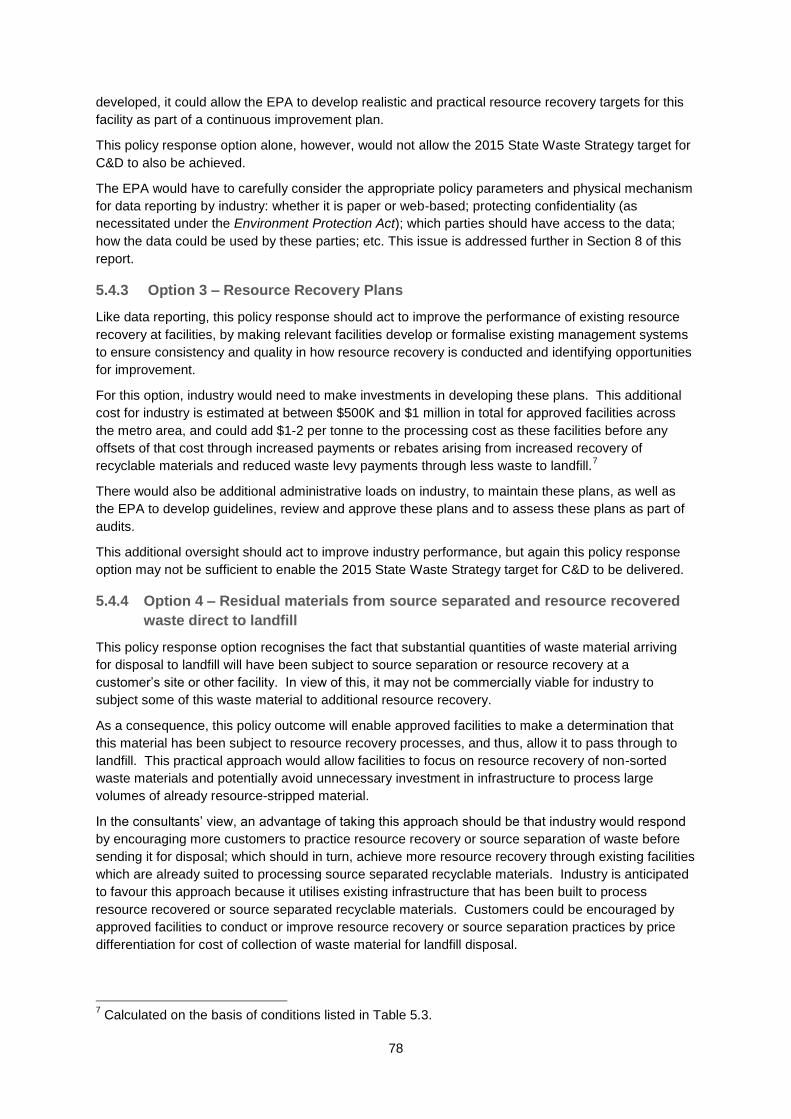
78
developed, it could allow the EPA to develop realistic and practical resource recovery targets for this
facility as part of a continuous improvement plan.
This policy response option alone, however, would not allow the 2015 State Waste Strategy target for
C&D to also be achieved.
The EPA would have to carefully consider the appropriate policy parameters and physical mechanism
for data reporting by industry: whether it is paper or web-based; protecting confidentiality (as
necessitated under the Environment Protection Act); which parties should have access to the data;
how the data could be used by these parties; etc. This issue is addressed further in Section 8 of this
report.
5.4.3 Option 3 – Resource Recovery Plans
Like data reporting, this policy response should act to improve the performance of existing resource
recovery at facilities, by making relevant facilities develop or formalise existing management systems
to ensure consistency and quality in how resource recovery is conducted and identifying opportunities
for improvement.
For this option, industry would need to make investments in developing these plans. This additional
cost for industry is estimated at between $500K and $1 million in total for approved facilities across
the metro area, and could add $1-2 per tonne to the processing cost as these facilities before any
offsets of that cost through increased payments or rebates arising from increased recovery of
recyclable materials and reduced waste levy payments through less waste to landfill.7
There would also be additional administrative loads on industry, to maintain these plans, as well as
the EPA to develop guidelines, review and approve these plans and to assess these plans as part of
audits.
This additional oversight should act to improve industry performance, but again this policy response
option may not be sufficient to enable the 2015 State Waste Strategy target for C&D to be delivered.
5.4.4 Option 4 – Residual materials from source separated and resource recovered
waste direct to landfill
This policy response option recognises the fact that substantial quantities of waste material arriving
for disposal to landfill will have been subject to source separation or resource recovery at a
customer’s site or other facility. In view of this, it may not be commercially viable for industry to
subject some of this waste material to additional resource recovery.
As a consequence, this policy outcome will enable approved facilities to make a determination that
this material has been subject to resource recovery processes, and thus, allow it to pass through to
landfill. This practical approach would allow facilities to focus on resource recovery of non-sorted
waste materials and potentially avoid unnecessary investment in infrastructure to process large
volumes of already resource-stripped material.
In the consultants’ view, an advantage of taking this approach should be that industry would respond
by encouraging more customers to practice resource recovery or source separation of waste before
sending it for disposal; which should in turn, achieve more resource recovery through existing facilities
which are already suited to processing source separated recyclable materials. Industry is anticipated
to favour this approach because it utilises existing infrastructure that has been built to process
resource recovered or source separated recyclable materials. Customers could be encouraged by
approved facilities to conduct or improve resource recovery or source separation practices by price
differentiation for cost of collection of waste material for landfill disposal.
7 Calculated on the basis of conditions listed in Table 5.3.
79
Given the extent of source separation that is already practiced, this policy response may not
necessarily achieve substantial reductions in material sent to landfill. As a consequence, it may still
not enable the 2015 State Waste Strategy target for C&D to also be achieved.
This uncertainty reiterates the importance of first obtaining data on industry performance through the
above data reporting policy response.
For this option to be successful, however, there may still need to be a market intervention to support
industry in encouraging customers towards greater participation in source separation and/or resource
recovery. This market intervention may need to be suitable increases in the waste levy, which would
act to make landfill disposal more expensive relative to resource recovery.
The industry would also need to make a range of investments to support this policy response option
as follows.
Approved facilities may need to upgrade business support systems for collection and
management of data to identify which waste loads had been determined as subject to
appropriate resource recovery.
o This new data set would need to include more detailed information about the origin of
the waste load and what source separation or resource recovery it had been subject
to, e.g.
Customer site or facility;
Source separation systems or resource recovery process;
Diversion to landfill achieved by above systems or process.
o In the consultants’ estimation, the additional cost to industry of putting these new
systems in place could be up to $500k-$1million in total for approved facilities across
the metropolitan area or up to $50-$100k per site/facility.
To facilitate the expected likely additional demand for source separation systems, the industry
would have to invest in new bins to supply to customer sites, as well as additional vehicles to
support the additional collections that would be required.
o In the consultants’ estimation, the number of new bins and vehicles could involve
investment of up to $6million by the industry as a whole.
In the consultants’ opinion, the above investments plus associated costs could equate to an additional
ongoing cost of $30-40/tonne for the industry to handle waste material through their facility or site
before any offsets of that cost through increased payments or rebates arising from increased recovery
of recyclable materials and reduced waste levy payments through less waste to landfill.8
5.4.5 Option 5 – Specified processes for resource recovery
In this policy option, the EPA would start setting facility requirements for resource recovery by
requiring minimum levels or types of processing for waste material. In the first instance, we expect
that this would largely target transfer stations (TS and TS (PS)), where resource recovery from waste
material is relatively low. But it could be expanded subsequently to other facility categories, such as
skip businesses, MRFs and/or C&I, C&D and RR processors.
As this policy response would start targeting the waste material not already source separated or
resource recovered at TS and TS (PS), this would provide the opportunity to achieve greater gains in
resource recovery outcomes.
Depending upon the processing requirements set, this could require introduction of
completely new types of resource recovery processing capabilities to that which already is
available at existing facilities, which may need to deal with highly mixed and contaminated
material inputs through AWT-type resource recovery processes.
8 Calculated on the basis of conditions listed in Table 5.3.

80
Some facilities may also seek approval to achieve increased resource recovery through
implementation of waste-to-energy strategies to process residuals, if this is more cost-
effective.
Successful implementation of this option should provide the opportunity for the 2015 State Waste
Strategy C&D target to be delivered.
The key challenge of this policy response option is that those facilities affected would have to start
making substantial investments in infrastructure, to introduce the type of new resource recovery plant
mentioned above. For instance, in the consultants’ estimate, the total cost of this infrastructure could
be in the order of up to $50 million across the metro area. This estimate of infrastructure investment
is high level, and the current lack of information and data on existing facility processes and
performance and volumes of material being processed, make it challenging to accurately quantify
what would be required and at which facilities. Once again, this issue reinforces the value of
collecting relevant accurate data and information from industry about existing facilities and
performance, which could be achieved through the above policy responses for industry to report data
and develop resource recovery plans.
These potentially high levels of expenditure by industry, could add up to $60-70/tonne to processing
costs for this material before any offsets of that cost through increased payments or rebates arising
from increased recovery of recyclable materials and reduced waste levy payments through less waste
to landfill.9 As a consequence, this policy response is likely to require significant increases in waste
levy, which may need to go beyond $50/tonne, and/or funding support and/or subsidies to ensure that
these infrastructure investments by industry are commercially viable.
Another challenge in implementing this policy response option would be what processes should be
specified. Being too specific, may involve picking winners and losers, and may not suit every facility.
Being too general may not lead to adoption of the most effective types of processes and achieving the
desired resource recovery outcomes. It is likely this requirement would need to be assessed on a
facility-by-facility basis, but then there might be potential industry complaints of inequitable
requirements being applied between different facilities.
Given the variability of operations servicing metropolitan Adelaide, this option would also be likely to
greatly increase administrative requirements for the EPA in assessing what these requirements
should be for any given facility and monitoring and enforcing that implementation has successfully
occurred.
5.4.6 Option 6 – Resource recovery targets
Under this option the EPA would set resource recovery targets for materials that would need to be
satisfied but leave it open to the industry as to how to successfully achieve those targets.
This option carries with it all of the same challenges as Option 5 with the addition that both generic or
specific resource recovery targets for facilities may be harder to set and enforce, given the variability
in input waste material and process performance which can exist.
In view of this, resource recovery targets may need to be individually tailored for different facilities,
even where they appear to be receiving similar material inputs. For instance, TS in metropolitan
Adelaide would receive different types and mixes of C&I and C&D waste materials, depending on
location and the contractors that supply waste material, and may have or could install different
resource recovery plant.
This variability between facilities could require that some clever metrics and strategies to be
developed for benchmarking and performance assessment, which enable appropriate differentiation
between types and quantities of input material processed and the installed resource recovery
technology and plant. For example, the resource recovery target may need to be expressed as a
9 Calculated on the basis of conditions listed in Table 5.3.

81
formula related to the proportion of different C&I and/or C&D materials received (e.g. by composition;
commercial/industry source type; extent of prior resource-recovery/source-separation already
conducted, etc.) and the type plant installed for resource recovery. Such a formula could need to
recognise that facilities may batch process some loads of the materials that are received, which could
be the best way to handle this variability.
This policy response option, however, presents the greatest opportunity to achieve resource recovery
improvements, and for the 2015 State Waste Strategy C&D target to be successfully achieved.
Depending on what resource recovery targets are specified by the EPA, some or all of the affected
facilities are likely to require significant upgrades or expansion to existing plant. As per the above
policy option for specified processes for resource recovery, these upgrades or expansion to plant
could involve AWT-type technology or use of waste-to-energy systems – the infrastructure costs could
be up to $50million across the metropolitan area before any offsets of that cost through increased
payments or rebates arising from increased recovery of recyclable materials and reduced waste levy
payments through less waste to landfill.
As a consequence, this policy option would likely necessitate a significant increase in the waste levy
to support the infrastructure investment required by industry.
This policy option also has the same many similar challenges for implementation as cited for Option 5
(specified processes for resource recovery).

82
Table 5.3: Summary of policy response outcomes. Please see table notes for further explanation of table headings.
Policy Response Option
Metropolitan Sites/Facilities Approved
1
Estimated Industry Investment Cost(s), $k
2
Estimated Gross Extra (On-going) Processing Cost, $/tonne
3
Estimated Resource Recovery Improvement
4
Estimated State Diversion Outcome, 2017
5
Estimated Time frame to Implement
Key Advantages/Disadvantages
1. Business as Usual
Nil Nil
Investments will be predominantly based on economic drivers , due to commodity values and levy increases
Nil Nil (i.e. Baseline) C&I: 79-81%
(75-77%)*
C&D: 85-88%
NA Advantages:
No additional requirements of industry
Low administration
Disadvantages:
Limited improvement
Limited measurement of improvements
2. Data Reporting
4-25
Only those facilities that which elect to dispose direct to landfill would require data reporting.
Thus, likely to include large transfer stations (TS) through to TS (PS) , R & RR WP.
Up to $100-200k
(Based on an estimate of $0-$10k per site for systems changes to enable reporting.)
Up to 50¢/tonne 2-8% reduction in current combined C&I and C&D waste to landfill
C&I: 80-82%
(75-78%)*
C&D: 87-89%
6-12 months
Advantages:
Low capital and administration costs
Will enable EPA to track if industry is continuing to improve performance over time
Will enable reasonable and achievable target to be set if EPA chooses to at a later time
Reporting of resource recovery may in itself encourage industry to improve
Disadvantages:
Limited improvement
Some additional admin for industry and EPA
3. Resource Recovery Plan
4-25
Only those facilities that which elect to dispose direct to landfill would require would require a resource recovery plan.
Thus, likely to include large transfer stations (TS) through to TS (PS) , R & RR WP)
Up to $500k-$1 million
(Based on an estimate of $10-$50k per site to develop Resource Recovery Plan and gain SA EPA approval)
Up to $1-2/ tonne
Based on total processing of 500,000 tonnes per annum
10-15% reduction in current combined C&I and C&D waste to landfill
C&I: 81-83%
(77-79%)*
C&D: 88-90%
6-18months Advantages:
Low – medium administration costs
Low capital costs
Will enable EPA to track if industry is continuing to improve performance over time
Will enable reasonable and achievable target to be set if EPA chooses to at a later time
Establishing a Resource Recovery Plan will provide commitments to improvements over time that can be monitored for compliance
Data reporting of resource recovery will enable

83
Policy Response Option
Metropolitan Sites/Facilities Approved
1
Estimated Industry Investment Cost(s), $k
2
Estimated Gross Extra (On-going) Processing Cost, $/tonne
3
Estimated Resource Recovery Improvement
4
Estimated State Diversion Outcome, 2017
5
Estimated Time frame to Implement
Key Advantages/Disadvantages
performance against plan to be measured
Disadvantages:
Modest resource recovery improvement
Administration load and cost is more significant for industry and EPA
4. Source Separation & Resource recovered direct to Landfill
4-25
Most likely to include large transfer stations (TS) through to include TS (PS), R & RR WP.
Other sites/facilities outside those directly disposing to landfill may seek approval for convenience or commercial reasons.
Up to $500k-$1 million on data collection systems to manage customer/site information
(Based on an estimate of $10-$50k per site.)
Up to $3m on additional bins for source separation
Up to $3m on vehicles for additional collections
Up to $1-2/ tonne on systems
Up to $12 per tonne on bins and collection vehicles
Up to $20 per tonne on collection costs
(Based on collecting an additional 100,000 tonnes per annum source separated materials.)
5-10% reduction in current combined C&I and C&D waste to landfill
C&I: 80-82%
(75-78%)*
C&D: 87-89%
1-2 years Advantages:
Encourages source separated systems at generators sites and improves resource quality for recycling
Will enable EPA to track if industry is continuing to improve performance over time
Disadvantages:
Limited resource recovery improvement over current situation
Potential for system to be manipulated
High administration load and cost on industry and EPA to approve source separated customers and maintain over time
Difficulty for industry to collect only from approved source separated sites and maintain efficiency
Residual general waste from these source separated sites may still have good resources that can be recovered if further processed
5. Specified processes for resource recovery
4- 25
Range covers if only large transfer stations ( TS) through to include TS ( PS) , R, RR WP)
Only those facilities that which to take their residual direct to landfill will require a resource recovery criteria ( process Driven) applied to them
$2m - $50m capital
$300k to $5million per facility for infrastructure
(Allowance for range if facility upgrades which could include simple processing or picking /sorting stations and baling but may also involve selected AWT-type processes or waste-energy-strategies suitable for C&I and C&D material. It does include brand new AWT plants)
Up to $20/-$30/tonne for capital
Up to $30-$40 /tonne for operating
Based on 5 year straight line depreciation and processing 500,000 tonnes per annum
10- 30% reduction in current combined C&I and C&D waste to landfill
(Assumes data reporting & resource recovery plans also implemented)
C&I: 81-85%
(77-82%)*
C&D: 88-91%
1-4 years Advantages:
Resource recovery will be increased through investment in process improvements designed to recover more resources.
Will enable EPA to track if industry is continuing to improve performance over time
Will enable reasonable and achievable target to be set if EPA chooses to at a later time
Disadvantages:
Potentially high capital costs required depending on what

84
Policy Response Option
Metropolitan Sites/Facilities Approved
1
Estimated Industry Investment Cost(s), $k
2
Estimated Gross Extra (On-going) Processing Cost, $/tonne
3
Estimated Resource Recovery Improvement
4
Estimated State Diversion Outcome, 2017
5
Estimated Time frame to Implement
Key Advantages/Disadvantages
processes are specified
Potential for some facilities to withdraw from receiving waste that needs to go to an approved resource recovery facility. This may increase cost through additional transport and market concentration.
Difficult to specify the processes required for each difference waste streams being received at facilities
Administration load and cost is more significant for industry and EPA
Long implementation time for design, approvals (planning, EPA, company board etc), purchase of equipment and installation, commissioning
May end up with too much resource recovery processing capacity with limited tonnes to process, making facilities not viable
6. Resource Recovery targets
4- 25
Range covers if only large transfer stations ( TS) through to include TS ( PS) , R, RR WP)
Only those facilities that which to take their residual direct to landfill will require a resource recovery criteria ( Target Driven) applied to them
$2m - $50m capital
$300k to $1million per facility for infrastructure
(Allowance for simple processing including picking /sorting stations, bailing. It does not consider AWT style processing)
up to $20/tonne for capital
up to $30 /tonne for operating
Based on 5 year straight line depreciation and processing 500,000 tonnes per annum
10-30% reduction in current combined C&I and C&D waste to landfill
It is assumed the target for additional resource recovery from current performance would be in this range.
(Assumes data reporting & resource recovery plans also implemented)
C&I: 81-85%
(77-82%)*
C&D: 88-91%
2-10 years Advantages:
Resource recovery will be increased through investment in process improvements designed to recover more resources to a target recovery
Target may be set to increase over time to allow industry to plan
Will enable EPA to track if industry is continuing to improve performance over time
Disadvantages:
Very difficult to set targets due to different waste streams received and different products being recovered.
It will be difficult to apply consistent targets between facilities
Potentially high capital costs required depending on what processes are pursued
Potential for some facilities to withdraw from receiving waste that needs to go to an approved resource recovery facility. This may increase cost through additional transport and market concentration.
Administration load and cost is more significant for
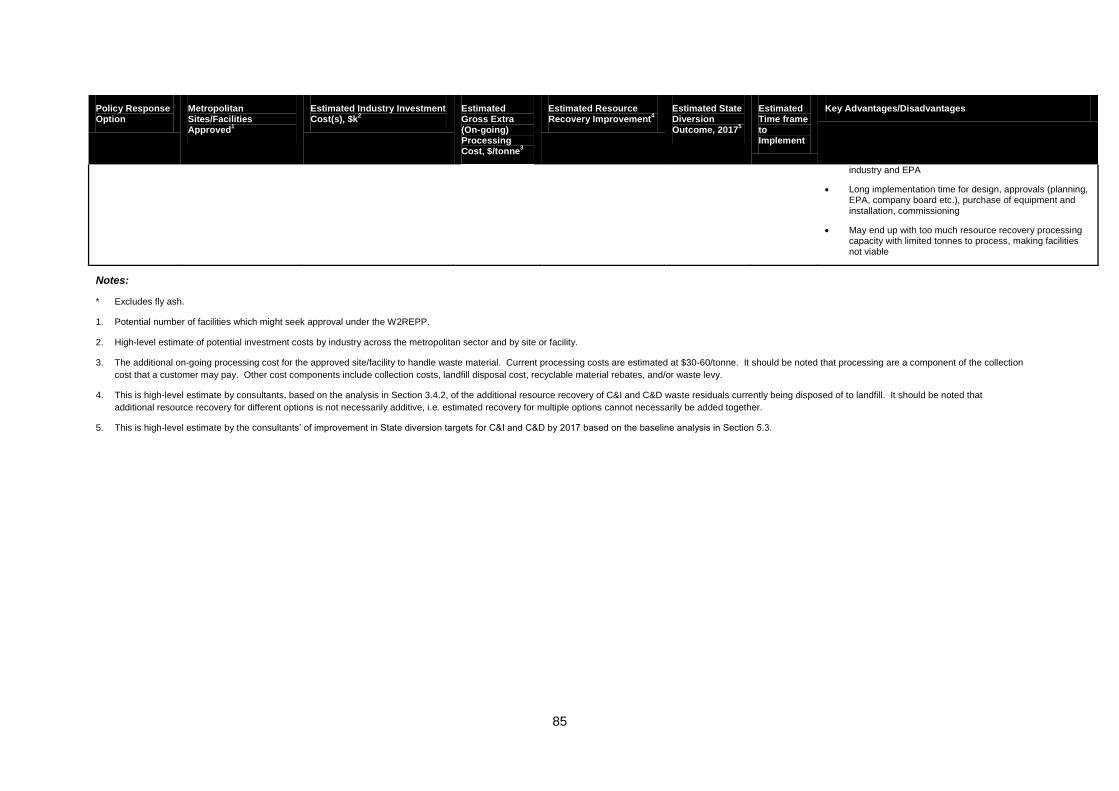
85
Policy Response Option
Metropolitan Sites/Facilities Approved
1
Estimated Industry Investment Cost(s), $k
2
Estimated Gross Extra (On-going) Processing Cost, $/tonne
3
Estimated Resource Recovery Improvement
4
Estimated State Diversion Outcome, 2017
5
Estimated Time frame to Implement
Key Advantages/Disadvantages
industry and EPA
Long implementation time for design, approvals (planning, EPA, company board etc.), purchase of equipment and installation, commissioning
May end up with too much resource recovery processing capacity with limited tonnes to process, making facilities not viable
Notes:
* Excludes fly ash.
1. Potential number of facilities which might seek approval under the W2REPP.
2. High-level estimate of potential investment costs by industry across the metropolitan sector and by site or facility.
3. The additional on-going processing cost for the approved site/facility to handle waste material. Current processing costs are estimated at $30-60/tonne. It should be noted that processing are a component of the collection
cost that a customer may pay. Other cost components include collection costs, landfill disposal cost, recyclable material rebates, and/or waste levy.
4. This is high-level estimate by consultants, based on the analysis in Section 3.4.2, of the additional resource recovery of C&I and C&D waste residuals currently being disposed of to landfill. It should be noted that
additional resource recovery for different options is not necessarily additive, i.e. estimated recovery for multiple options cannot necessarily be added together.
5. This is high-level estimate by the consultants’ of improvement in State diversion targets for C&I and C&D by 2017 based on the baseline analysis in Section 5.3.

86
5.5 Identification of Other Benefits & Costs
5.5.1 Other Identifiable Costs & Benefits
This section broadly identifies, at a high-level, a range of other potential cost and benefits, in addition
to those industry impacts assessed and presented in Section 5.3, which might occur as a
consequence of each of the policy response options. The potential benefits and costs are itemised
and described generally below and Table 5.4 overleaf also summarises which options particular
benefits and costs apply to, and where feasible, provides a relative ranking of the magnitude of a
specific benefit or cost between options.
It is important to recognise that many of these benefits or costs are conditional on what actions both
the Government and industry takes as a result of each policy response option, and whether additional
costs of implementing the policy response options are passed on or absorbed into existing cost
structures by the industry.
Before these benefits and costs can potentially be assessed further and/or quantified, the policy
response options need to be developed and refined by the EPA. This more developed information
would enable more detailed investigation of how the policy response would impact on the industry and
other stakeholders, including Government and the community. These investigations would need to
involve consultation with the industry to better understand how they would intend to respond to the
proposed policy response option(s), including which facilities might seek approval and/or how other
industry stakeholders, including other facilities, contractors and/or customers, could be affected.
Furthermore, the other potential benefits and costs noted here is not necessarily an exhaustive list,
and could be expanded once there is greater clarity and certainty about the intended policy response
actions.
5.5.2 Benefits
5.5.2.1 Government understanding of industry resource recovery performance
Policy response Options 2 and 3 would provide data and information that would enable the
EPA and, potentially, other Government agencies to vastly enhance their understanding of
the industry’s resource recovery performance.
o This insight and knowledge would be able to accurately inform future policy
development, thereby potentially improving targeting of, and efficiency in outcomes
from, future Government regulation and funding of the waste sector.
The potential benefit derived could potentially help achieve better resource
recovery outcomes for South Australia per unit dollar invested.
5.5.2.2 Industry investment contribution to economic activity
Policy response options 2 – 6 all require additional investment by the industry in advice,
systems, plant and/or equipment. These investments would contribute to economic activity,
which would directly and indirectly benefit the community.

87
Table 5.4: Summary of other identified potential costs and benefits. Ranking are cost relative to other options for that particular benefit or cost.
Option 1 –
Business-As-
Usual
Option 2 –
Data
Reporting
Option 3 –
Resource
Recovery
Plans
Option 4 – Residual
materials from source
separated and resource
recovered waste direct to
landfill
Option 5 –
Specified
processes for
resource
recovery
Option 6 –
Resource
recovery
targets
Benefits
Government understanding of industry resource
recovery performance
- Medium Medium-High High - -
Industry investment contribution to economic activity - Low Low Medium High High
Increased employment - Low Low Low-Medium High High
Industry management efficiency improvements - Low Medium High - -
Environmental Benefits: Landfill Diversion,
Greenhouse emissions & Resource Efficiency
- Low Low Medium High High
Costs
Government administrative costs - Low Low Medium High High
Higher Gross Waste Management Costs - Low Low Medium High High
Less Government Revenue from Waste Levy - Low Low Low-Medium High High

88
5.5.2.3 Increased employment
Policy responses 2 – 6 would also create new employment opportunities in the industry, from
capital investment, to extra on-going positions required for data collection, IT, management,
sales, training, through to operation of new plant and equipment.
o The employment opportunities created could be anticipated to progressively grow
from Option 2 through to Options 5 and 6.
Increased greater resource recovery achieved by each option should also generate additional
jobs in recycling of the recovered materials. Nationally, it has been found that recycling
provides 9.2 jobs per 10 000 tonnes of waste recycled, whereas landfill disposal provides 2.8
jobs per 10 000 tonnes of waste landfilled (Department of the Environment, Water, Heritage
and the Arts, 2009).
5.5.2.4 Industry management efficiency improvements
Policy responses 2-4 oblige the industry to collect and develop data, information and/or
management systems, which should, in addition to informing government, should help
businesses without such existing systems to better understand their own resource recovery
performance and/or operations.
o Data collected and reported by industry under Option 2 would provide some sites
and/or facilities with information about their resource recovery performance that they
would not have developed otherwise.
This information may catalyse these sites and/or facilities to easily identify
ways of improving their performance.
o The development of Resource Recovery plans under Option 3 would formalise and
substantially enhance management systems at a large number of facilities where they
would otherwise not exist.
These systems should improve consistency and reliability in all aspects of
operation at these sites and/or facilities.
A key element of these plans would be continuous improvement strategies
and systems.
o Option 4 would provide the majority operators and/or facilities with more detailed
information about the waste materials that are received for processing, thereby
providing them with greater scope and opportunity to interact with customers and/or
other facilities to pro-actively improve the quality of the waste material.
This knowledge would, in-effect, enable operators to practise a form of
supply-chain management, which should enable them to improve the
performance of their own operations.
o In summary, the flow-on-effect of the above knowledge could be identification of
opportunities for resource recovery improvements at these site(s) and/or facility(ies).
This outcome should lead to:
Improved efficiency and lower operating costs for the industry, which if
passed on, could also achieve lower waste management costs for the
community;
Greater recycling and increased diversion from landfill, which would reduce
greenhouse gas emissions from landfills and improve resource
efficiency/utilisation of the State, making it more sustainable;
Better reporting by industry of resource recovery performance back to
businesses and customers, which in turn, could inspire them to improve their
source separation or resource recovery performance.

89
5.5.2.5 Environmental Benefits
Policy responses 2-6, through improving resource recovery, would bring with them associated
environmental benefits for South Australia:
o Higher levels of landfill diversion, which would decrease associated greenhouse
emissions.
o Increased resource efficiency, by:
Recycling more material instead of using virgin materials, which in turn would
also reduce associated energy and water use and greenhouse gas emissions
involved with the manufacture of these virgin materials; and/or
Potentially reducing waste generation rates if waste disposal becomes more
costly, and through this, raising awareness in the community and business of
the importance of resource conservation.
5.5.3 Costs
5.5.3.1 Increased Government Administrative Costs
For the EPA and other Government agencies, the implementation of policy response options
would be involve administrative costs for setting up and managing data reporting systems,
and monitoring and analysing additional data. However, these costs could be contained
through careful consideration of the details and structuring of any of the options.
o The increase in these costs to Government would progressively grow from Option 2
through to Options 5 and 6.
5.5.3.2 Possible Reduced Industry Profitability or Higher Waste Management Costs
For facilities or sites seeking approval, there will be additional gross costs for implementing
Options 2-6 as discussed in section 5.3. If these cannot be offset by the financial gains arising
from improved recovery of waste or passed on through increases in collection or gate fees,
these added costs could reduce profitability of the industry.
o This outcome would undermine the commercial viability of the industry and may
reduce new investment and/or innovation.
For businesses and the community, there could be additional costs if gate fees or collection
costs are increased by the industry.
The risk of reduction in profitability and/or additional waste management costs for businesses
and the community would progressively grow from Option 2 through to Options 5 and 6.
5.5.3.3 Less Government Revenue from Waste Levy
An expected consequence of improving resource recovery over time would be less waste to
landfill. As a result there would be reduced Government revenue from the waste levy over
time (unless increases levy rates were to be applied).
o Reductions in Government revenue could impact on its ability to support further new
initiatives in the waste management and recycling industry.

90
5.5.4 General Community Benefits
According to the EPA, there are a number of benefits from increased resource recovery that accrue
across the community generally. These include:
South Australians have been found to attach extremely high levels of importance to the
environment when considering all the issues they think about in their life (Zero Waste SA, 2008).
There is also a very high level of care about recycling as much material as possible (given an
average rating of 8.5/10) (Zero Waste SA, 2008).
The continued disposal of material to landfill creates long-term environmental impacts, both
directly through the degradation of land and generation of greenhouse gases, and indirectly
through wasting resources that may otherwise be used for beneficial purposes.
The annual benefits of existing recycling nationally were reported in 2008 as follows (ACOR
2008):
o The abatement of emissions through recycling is 8.8 million tonnes of CO2; around 30 percent of the Australian Greenhouse Office’s estimates of total abatement measures of 30 million tonnes of CO2.
o Energy savings equivalent to the average electricity consumption in 2.1 million households.
o Water savings of 90 GL - equivalent to more than 37,000 olympic pools.
o Conservation of natural resources, including bauxite, iron ore, sand, oil for plastic production and timber - equivalent to 8.8 million tonnes.
For South Australia, it was reported that:
o Recycling activity was avoiding 483 tonnes CO2 per 1000 people, equivalent to about 99 cars off the road for every 1000 people, and around 214,000 cars off the road in total when organic recycling was included.
o Electricity consumption in some 189,000 households.
5.6 Policy Implementation Strategies
Based on the previous observations in this report, we would recommend a soft-start approach to
implementation of the suggested policy options as follows.
1. We suggest that the requirements for Option 2 Data Reporting and Option 3 Resource
Recovery Plan could be introduced at the commencement of clause 11 of the W2REPP, i.e. 1
September 2012
Facilities could have written into their approvals the requirement to comply with these
requirements within a certain period, e.g.
o Data reporting to be commenced within 6 months
o A resource recovery plan to be developed and submitted for approval and
commenced by the end of the 1st year.
This would enable the EPA to start collecting data and assessing the resource
recovery performance and processes at approved facilities and ensure best-practice
management of these facilities is implemented.
o This would include following the EPA’s guidelines for dealing with exempt
and banned materials.
At the same time, a proper quantitative assessment could be commenced:
o The quantities of material going to landfill which:
Had been source separated and to what extent;

91
Originated from other resource recovery facilities and what resource
recovery had been achieved;
Was delivered from sites where no source separation had occurred.
Armed with the above information as well as an understanding of how these changes
had improved resource recovery, the EPA could consider what next steps to take.
o We would suggest a period of 2-3 years of collecting and analysing data and
industry outcomes and consultation or negotiation with facilities might be
necessary before an informed decision could be made.
o It may also be important to consider the economics of resource recovery and
identify what increase in the waste levy or other measures would achieve the
tipping point to make investment in infrastructure for additional resource
recovery at facilities commercially viable, to accompany implementation of
Options 4-6.
2. In years 2 and/or 3 after commencement of clause 11 of the W2REPP, i.e. 2014-15,
introduction of Options 4-6 could be contemplated.
Which of these options were implemented would depend on the outcomes of above
studies and improvements in resource recovery performance seen in the first two
years.
These options may also need to be accompanied by increases in waste levy to
enable the market to invest in the required resource recovery infrastructure at
facilities.

92
6 Dealing with Banned Wastes Dealing with banned waste streams at resource recovery facilities as they are progressively rolled out
does present a range of challenges for the waste and recycling industry, as well as other stakeholders
such as councils, businesses and residents.
Figure 6.1 overleaf shows at a high level the banned materials and effective dates for metro landfills
in SA when these items will become banned. Table 6.1 further overleaf explores the processes and
constraints that exist and/or may become necessary for specific categories of facilities to remove, as
far as practical, banned waste from residual waste destined to landfill.
At a more general level, some key points with respect to dealing with banned wastes are as follows.
Dealing with banned materials is an area of concern for the industry.
o From comments by consultation respondents, it was considered impractical and
uneconomic to guarantee removal of all items from waste material as facility operators
do not control what customers put in bins and waste is well mixed and aggregated before
they receive it.
o However, there was little constructive feedback from consultation respondents on how
this issue should be dealt with by the EPA. Consultation respondents seemed to be
taking a reactive approach and expecting the EPA to propose how this issue should be
handled.
In the consultants’ view, the EPA’s guidelines to deal with banned materials should support a
whole of industry approach and consider taking a quality management approach.
o The guidelines should encourage industry to develop banned waste mitigation strategies
for sites or facilities and incorporate these strategies into management systems or
resource recovery plans, if this policy response option is elected. Such strategies could
include the following.
Clear policies for mitigation of banned waste.
Identify and implement opportunities for intervention in their supply chains to
control and minimise banned waste contamination of waste streams.
This could involve providing upstream support to customers by providing
bins and other services.
Develop appropriate inspection and assessment procedures to identify the
presence of waste with banned items.
Procedures for investigating banned waste contamination incidents and
identifying the cause and/or sources, so these can be addressed.
Quality assurance programs to monitor and assess frequency of banned waste
contamination and facility performance in identifying and removing these items.
How waste should be handled if banned waste is identified in it.
This may include requirements for procedures to handle the different type
of banned waste, i.e. risk-based, aggregated recoverable materials or
other prohibited landfill waste.
The EPA’s banned waste guidelines could also set:
o Industry performance benchmarks for banned waste mitigation in waste disposed of to
landfill.
This should take a statistical approach, allowing for the fact that removal of all
banned waste is not practical.
o Provide guidance resources for industry that can be used by them to develop banned
waste mitigation strategies.

93
o Clearly outline the EPA’s approach to enforcing the guidelines, including:
Industry data reporting requirements;
Audit requirements;
The processes that would apply in the event that a facility’s performance was
inadequate.
Figure 6.1: Prohibited Landfill Waste Implementation Schedule

94
Table 6.1: Outline of processes and constraints on the removal of banned wastes. Based on consultations’ industry experience and feedback from
consultation respondents.
Dealing With Banned Waste by Facility Type
Banned Waste
Stream
Sites Constraints Current Strategy Potential Response(s)
Electrical and
Electronic Waste in
Loads
TS, TS(PS),
Skip MRF
Mixed and broken in
compacted loads
May be hard to discover in
mixed loads/compacted
loads
This waste stream largely falls into two categories:
Materials that have a value once recovered –
for example white goods– which are usually
recovered and sold into the scrap industry.
Materials which do not currently have value for
the facility – for example computers, mobiles,
monitors and television sets – and therefore
will be will remain in the landfill waste stream.
Develop site or facility-specific strategy to manage the
removal of these materials from the landfill waste stream
and with appropriate redirection for recovery.
Note: Future product-stewardship schemes may ultimately
assist sites with managing some of these materials,
primarily through avoiding their entry into general waste
streams but also through potentially giving a value for
removal.
Asbestos TS, TS(PS),
Skip MRF,
RR(WP)
Identification in each load
is difficult
Asbestos is rejected from most sites – except
those with a licence to store and transport it
separately. Asbestos is rejected on all sites if
delivered as a mixed load.
Develop site or facility-specific strategy for the identification
of asbestos and its rejection from the site.
Tyres, Lead Acid
Batteries
TS, TS(PS),
Skip MRF
May be hard to discover in
mixed loads/compacted
loads
Tyres and Lead Acid Batteries are currently
removed from the loads. Tyres are either
charged to the customer at an additional rate
between $5-$8 per tyre or the customer may
be asked to take the tyres from the site
This is accepted industry practice and should already be
part of a site or facility-specific strategy or system.
Aggregated
cardboard, paper,
glass, PET, HDPE,
PP, LDPE, PVC, PP
TS, TS(PS),
Skip MRF
Glass contaminating other
recyclables in co-mingled
collections when over-
compacted.
These materials will rarely be presented to a
resource recovery facility for landfill, due to the
differential in cost between landfill and the
recycling option. Exception is if contaminated
in transport.
For the majority of materials, if it was presented
for landfill, the facility would typically be
pleased to send it for recycling and gain the
financial benefit.
Consider facility requirements for transporters in delivering
the materials.
Continue to work on industry development for less
established material markets.

95
Fluorescent & mercury
containing lighting
TS, TS(PS),
Skip MRF
Mixed and broken in
compacted loads
Cannot identify where
from or in which load
There are limited strategies in place currently
to deal with fluorescent and mercury containing
lighting.
Zero Waste SA is working with stakeholders to
help prevent the entry of these materials into
mixed loads through the BackLight Household
Light Globe Recycling Program.
Develop site or facility-specific strategy for the identification
of fluorescent and mercury containing lighting and its
management on site. Again, only what is practical and
reasonable should be considered in the recovery of
fluorescent and mercury containing lighting.
However, these banned wastes should not be allowed into
mixed loads in the first place. Thus, facilities and
government should further develop strategies with their
customer base and in the community to ensure source
separation of these products so they do not reach the
facility.

96
7 Future Achievable Recovery Rates, 2012-2017
7.1 Introduction The future achievable recovery rates depend on the policy response options which are implemented
and the timing of this implementation. In Section 5.5, a policy implementation strategy was
suggested.
1. Commence Option 2 (Data Reporting) & Option 3 (Resource Recovery Plan) in 2012-13, when
the W2REPP comes into operation.
There would be a lag of about 12 months before the benefits of these policy options
started flowing through to resource recovery performance, and it would probably take
another 2 years before the full quantum of expected resource recovery improvement was
realised.
2. Commence Options 4 (Residual materials from source separated and resource recovered waste
direct to landfill), 5 (Specified processes for resource recovery ) and/or 6 (Resource recovery
targets) in 2014-15
These options may take several years (i.e. 2-5) to fully implement, depending on the
ability of industry to make the necessary investments and build and bring on-line new
infrastructure.
Therefore, the full resource recovery gains achieved may not be realised by 2017-2020.
7.2 Recovery rates by facility
Table 7.1 below summarises the possible improvements in resource recovery that might be achieved
by different facility categories according to each response option.
These are the consultants’ estimates based on the analysis of material flows in Section 3.4.2
and the baseline for Option 1 (Business-as-usual) discussed in Section 5.3.
This data is presented by the % potential improvement in recovery rate that might be
achieved according to each policy option.
o It should be noted that this is the recovery at the facility boundary.
Some of the material leaving the facility may subsequently pass to another
facility where additional resource recovery occurs, e.g. improved skip
business may only achieve 1-2% resource recovery from operations at its
yard, but the resource recovery of collected waste material at other facilities
can achieve a >95% resource recovery.
o The projected future achievable potential recovery for these facilities assumes no
processing of waste residual to energy.
As can be seen, there will essentially be no changes in performance of C&D WP to OW WP
facilities.
o These facilities essentially receive already source separated material from other
facilities or in-house front-end MRFs.
o This will not change but the quantities of the material these facilities might receive
may increase for different policy operations as greater resource recovery is achieved
by expanded source separation or by greater resource recovery at other facilities.
Consequently, the biggest changes in resource recovery will occur via TS, TS (PS), perhaps
with some marginal improvements in Skip and MRF facilities.
o These improvements will be highly variable across these facilities depending on what
changes are instituted in response to each policy option. In this respect, it should be
expected that each facility or site could respond uniquely to a policy option, which will
lead to a range of resource recovery outcomes across a facility category.

97
Table 7.1: Future potential improvements in resource recovery that might be achieved by
different facility categories according to policy response option – see Table 5.1 for options
By facility category
Current Resource Recovery Performance
Future achievable by Policy Option (relative to Baseline and by 2017 assuming full quantum achieved)
% 1 2 3 4 5 6
TS 5-15% No change 5-20% 10-20% 10-20% 10-40% 10-40%
TS(PS) 30-60% No change 40-70% 40-75% 40-75% 40-80% 40-80%
Skip 5-15% No change No change 10-20% No change 5-25%* 5-25%*
MRF 65-90% No change No change 70-90% 70-90% 70-90% 70-90%
C&D WP >95% No change No change No change No change No change No change
C&I WP >95% No change No change No change No change No change No change
R >98% No change No change No change No change No change No change
RR WP >95% No change No change No change No change No change No change
C >95% No change No change No change No change No change No change
OW WP >95% No change No change No change No change No change No change
*The impact of these policy options on skip businesses is uncertain and depends on how the policy option is implemented and
skip-businesses respond. For example, if skip-businesses are required to undertake specified processes or achieve resource
recovery targets for material taken to their yards, they may elect to not take material to their yards and resource recover it. This
unintended consequence could reduce resource recovery achieved at these sites. However, this material would end up being
resource recovered at another site.
7.3 Projections across the State Table 7.2 below summarises how the above policy implementation strategy may play out in terms of
future achievable recovery rates for C&I and C&D sectors in South Australia. This is based on the
semi-quantitative analysis using the data from the South Australian Recycling Investment Review that
was presented in Section 5.3 and the above implementation timeframe. The table includes the 2010-
2015 State Waste Strategy targets for Metropolitan Adelaide.
Table 7.2: Projected future potential improvements in South Australia’s resource recovery
performance with progressive implementation of all identified policy options
Year C&I C&D Note
Inc. Fly ash
Exc. Fly ash
State Waste Strategy Target
State Waste Strategy Target
2009-10 77% (72%) 84%
2010-11 77-78% (72-73%) 84-85%
2011-12 78-79% (73-74%) 85-86%
2012-13 78-79% (73-74%) 65% 86-87% 85% W2REPP commences
2013-14 79-81% (74-76%) 86-88% Option 2: Data reporting & Option 3: RRP implemented
2014-15 80-82% (75-77%) 87-88%
Options 4-6 implemented Increase in waste levy as required
2015-16 80-83% (76-80%) 75% 87-89% 90%
2016-17 81-84% (77-81%) 87-90%
2017-18 81-85% (77-82%) 88-91%
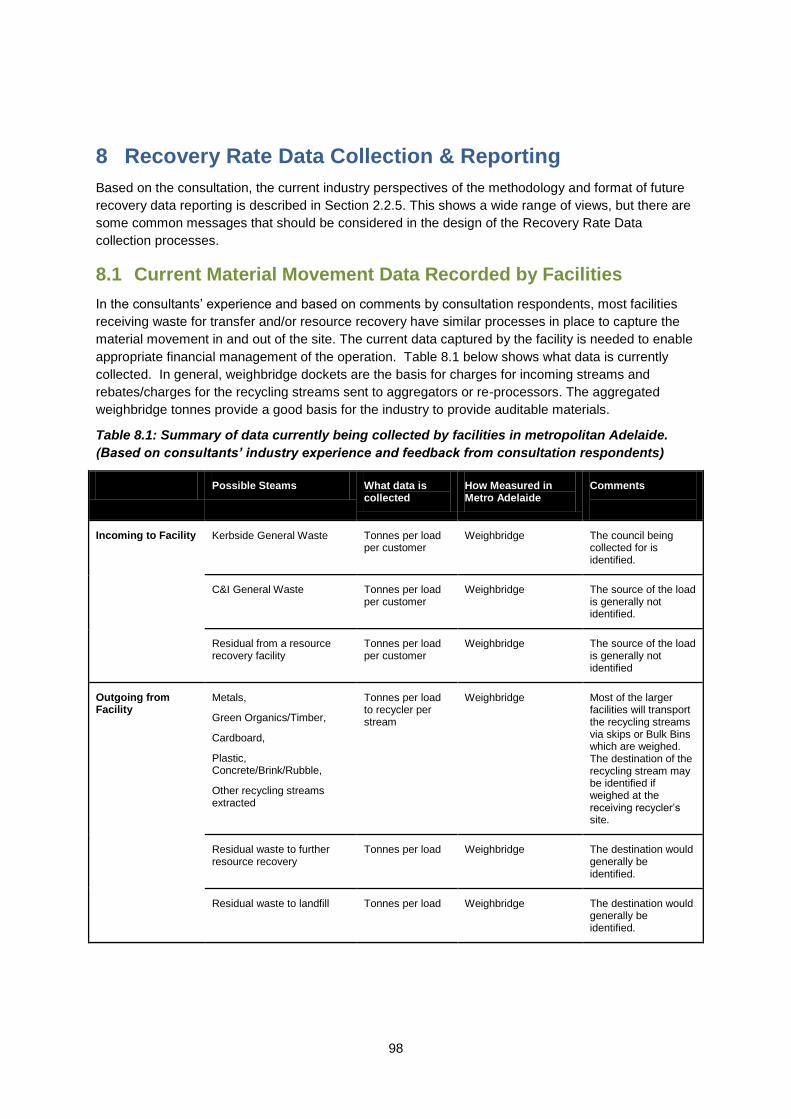
98
8 Recovery Rate Data Collection & Reporting
Based on the consultation, the current industry perspectives of the methodology and format of future
recovery data reporting is described in Section 2.2.5. This shows a wide range of views, but there are
some common messages that should be considered in the design of the Recovery Rate Data
collection processes.
8.1 Current Material Movement Data Recorded by Facilities
In the consultants’ experience and based on comments by consultation respondents, most facilities
receiving waste for transfer and/or resource recovery have similar processes in place to capture the
material movement in and out of the site. The current data captured by the facility is needed to enable
appropriate financial management of the operation. Table 8.1 below shows what data is currently
collected. In general, weighbridge dockets are the basis for charges for incoming streams and
rebates/charges for the recycling streams sent to aggregators or re-processors. The aggregated
weighbridge tonnes provide a good basis for the industry to provide auditable materials.
Table 8.1: Summary of data currently being collected by facilities in metropolitan Adelaide.
(Based on consultants’ industry experience and feedback from consultation respondents)
Possible Steams What data is collected
How Measured in Metro Adelaide
Comments
Incoming to Facility Kerbside General Waste
Tonnes per load per customer
Weighbridge The council being collected for is identified.
C&I General Waste Tonnes per load per customer
Weighbridge The source of the load is generally not identified.
Residual from a resource recovery facility
Tonnes per load per customer
Weighbridge The source of the load is generally not identified
Outgoing from Facility
Metals,
Green Organics/Timber,
Cardboard,
Plastic, Concrete/Brink/Rubble,
Other recycling streams extracted
Tonnes per load to recycler per stream
Weighbridge Most of the larger facilities will transport the recycling streams via skips or Bulk Bins which are weighed. The destination of the recycling stream may be identified if weighed at the receiving recycler’s site.
Residual waste to further resource recovery
Tonnes per load Weighbridge The destination would generally be identified.
Residual waste to landfill Tonnes per load Weighbridge The destination would generally be identified.

99
8.2 Current Systems Used to Capture Materials Movement Data
In the consultants’ experience, there are a large range of different systems and software packages
that the industry uses to store this information. It ranges from:
Spreadsheets (Excel and Lotus)
Databases
Accounting software
Proprietary software
Those sites which are currently required to submit SA EPA returns to account for the solid waste levy
payments would use these systems to access their data and populate their return to the EPA. In most
instances this is a manual exercise to transfer the aggregated tonnes data to the solid waste levy pro-
forma.
8.3 Data Required from Approved Facilities
8.3.1 Standard requirement
Only facilities which wish to be approved as acceptable resource recovery processors are assumed to
need to report resource recovery data to the EPA. These approved facilities will be the only facilities
allowed to take residual waste directly to landfill.
The boundary for where data is required for each approved facility would need to be established.
Some sites may have a number of facilities/processes operating where the output of one becomes the
input of another. To enable assessment of the resource recovery to be made for each approved
facility, a set of resource recovery data should be captured for that facility.
The minimum data reporting for the period that should be provided includes:
Total tonnes received at the facility broken into:
o Total tonnes Kerbside General Waste received
o Total tonnes C&D General Waste received
o Total tonnes C&I General Waste received
o Total tonnes Residual from another resource recovery process or other
The total tonnes outgoing from the facility broken into:
o Total tonnes for each recycling stream sent offsite
o Total tonnes to landfill
o Total tonnes of residual waste to further resource recovery.
Estimate of total stock on site at the end of the period (include all materials including waste in,
recycling streams and landfill stream)
This will enable the EPA to calculate for each facility:
% incoming waste recovered to be directed for resource recovery
% incoming waste sent to landfill
It will also provide a context in terms of types of waste streams being processed by the facility. For
example, a large transfer station receiving predominantly council kerbside residual general waste
collections will have that tonnage go directly to the landfill stream, as no further recovery is required
under the W2REPP.
Additional data reporting that would be beneficial to track the movement of waste and recycling
streams in Metro Adelaide may include:
The destination(s) of each of the resource recovered streams by tonnage
The destination(s) of the waste being sent directly to landfill by tonnage
100
The destination(s) of any other streams send for further resource recovery or other
processing
8.3.2 Policy response option 4
If the EPA adopts Policy Response 4, which allows approved facilities to determine that source
separated or already resource recovered material is acceptable for disposal to landfill, approved
facilities may be obliged to collect and report additional data:
For source separated material, details on what source separation had occurred, including
services provided and/or diversion information.
For resource recovered material from another facility (which is not approved), the materials
recovered and the resource recovery performance of that facility.
8.3.3 Reporting data - Scope
An important issue is what data needs to be regularly reported to the EPA from the facility and what
data might a facility need to report to the EPA in the event of an audit. In this respect, the EPA may
be able to condense the data set for regular reporting, but also ensure that the facility has the
necessary data available in the event of an audit to confirm resource recovery performance.
In this respect, the EPA may need to identify data reporting requirements to achieve two objectives.
Objective 1: Regular reporting of data
o This would be used to monitor industry performance and could possibly be publicly
used in aggregated form.
o This data to be reported may include:
Total tonnes received at the facility broken into:
o Total tonnes Kerbside General Waste received
o Total tonnes C&I General Waste received
o Total tonnes C&D General Waste received
o Total tonnes Residual from another resource recovery process or
other
The total tonnes outgoing from the facility broken into:
o Total tonnes for each recycling stream sent offsite
o Total tonnes to landfill
o Total tonnes of residual waste to further resource recovery.
Estimate of total stock on site at the end of the period (include all
materials included waste in, recycling streams and landfill stream)
o Objective 2: Audit data reporting
For this purpose additional data that may need to be presented would include:
The destination(s) and associated quantities of each of the resource
recovered streams by tonnage
The destination(s) and associated quantities of the waste being sent
directly to landfill by tonnage
The destination(s) and associated quantities of any other streams send
for further resource recovery or other processing
8.4 Options for Resource Recovery Data Capture
There is a range of ways the resource recovery data could be captured. Taking into account the
industry feedback, the data capture need to consider:
Being non-onerous on industry in terms of administration and time required for responding.
Simple and clear format for reporting.
Where possible, aligned with current industry reporting timeframes.

101
The option for paper based return, spreadsheet return and online return. Based on
responses from consultation respondents’, data reporting options acceptable to industry
included either paper or electronic returns.
The options for reporting frequency to the EPA could include:
Monthly reporting ( as per Solid Waste Levy reporting)
Quarterly reporting
Six Monthly Reporting
Annual Reporting
There was a range of feedback from industry, with some indicating they were happy with reporting to
align with the monthly solid waste levy reporting, whilst others indicated quarterly or six monthly
reporting would be preferred to reduce administration times.
It is considered that monthly reporting for these facilities, once established in the organisation, would
provide the SA EPA with the optimal resolution of data for determining if the resource recovery
outcomes are being achieved and for auditing purposes, if required.
Whichever option for the process of returning the resource recovery data for approved facilities is
chosen, the methodology and format would be similar.
Table 8.2 overleaf shows a possible format for a data report from an approved resource recovery
facility.

102
Table 8.2: Example of possible format for a data report from an approved facility
Approved Resource Recovery Facility Name
EPA Licence Number Address
Month September 2012 1/9/12 30/9/12
Incoming Waste Streams Outgoing Waste Streams
Total tonnes Kerbside General Waste received
Total tonnes to landfill
Total tonnes C&I General Waste Received
Tonnes per Stream Sent Offsite for recycling
Total tonnes C&D General Waste Received
Ferrous Metals
Total tonnes Residual from another resource recovery facility
Non Ferrous Metals
Green Organics
Timber
Concrete/Brick/Rubble
Other recycling stream as relevant or residual for further resource recovery etc
Residual waste for further resource recovery etc
Total Tonnes xxx xxx
Estimated Total Closing Stock
xxx xxx

103
9 Key Findings & Recommendations
9.1 Approval Criteria
The approval criteria for facilities under the W2REPP will depend on how the EPA elects to
implement and administer the operation of this policy – i.e. policy response actions.
In view of this, we suggest that the policy response options and associated approval criteria
that could be applied are as summarised in Table 9.1 overleaf.
o These policy response options are not mutually exclusive and options could be
implemented in different combinations and scheduling.
o All options will potentially increase administration requirements for the EPA, the
industry facility operators and/or customers.
o The administrative burden, including for data reporting, increases in Table 9.1 from
Option 1 (low) up to Option 6 (high)
o The up-front investment costs by industry for new infrastructure and added operating
costs also increase in Table 9.1 from Option 1 (low) up to Option 6 (high).
Options 2 to 3 involve minimal up-front, i.e. up to $1 million industry wide, and
added processing cost, i.e. up to $1-2/tonne before any offsets and rebates10
,
for approved facilities.
Option 4 involves an intermediate level of industry investment, i.e. up to $10
million industry wide, and extra on-going processing cost, i.e. up to $30-
40/tonne before any offsets and rebates, for approved facilities.
Options 5 and 6 could necessitate substantial infrastructure investment, i.e.
up to $50 million across metro Adelaide) and much higher additional
processing costs, i.e. up to an extra $60-70/tonne before any offsets and
rebates.
o For policy response options 4-6, increases in waste levy to $50/tonne or higher may
be need to be contemplated to support successful industry outcomes by ensuring that
infrastructure investments are commercially viable for the industry.
o Resource recovery outcomes:
All policy response options should see 2010-15 State Waste Strategy C&I
targets for 2012 and 2015 delivered
Options 5-6 are deemed necessary for the 2010-15 State Waste Strategy
C&D target in 2015 to be achieved
Table 9.1 also lists the types of guidelines that the EPA may need to develop for each policy
response option, to provide industry with direction and to allow them to understand what is
required of them.
10
Offsets and rebates include: increased payments or rebates arising from increased recovery of recyclable materials and reduced waste levy payments through less waste to landfill.

104
Table 9.1: Potential Approval Criteria and Guideline requirements for different policy response
options
Policy Response Option Approval Criteria Guidelines
1. Business as Usual Nil Dealing with banned waste
Dealing with exempt wastes (kerbside, hard waste)
2. Data Reporting
Data collection & reporting
Weighbridge(s) for facilities > threshold size,
Same for 1 above +
Data collection & reporting
3. Resource Recovery Plan Same for 2 above +
Written resource recovery plan for facility operation
Same for 1&2 above +
Design & implementation of RRPs
4. Source Separated & Resource recovered material direct to Landfill
Same for 2&3 above +
Assessment procedures for source separated and/or resource recovered material
Additional data collection & reporting for these materials
Same for 1,2&3 above +
Assessment & reporting of source separated and/or resource recovered material
5. Specified processes for resource recovery
Same for 2&3 above +
Resource recovery processes and/or procedures for facility categories or individual facilities
Same for 1,2&3 above +
Design, installation and operation of designated recovery processes and/or procedures
6. Resource Recovery targets
Same for 2&3 above +
Resource recovery targets for facility categories or individual facilities
Same for 1,2&3 above +
Development of resource recovery targets by facilities
Verification & reporting of resource recovery facility performance
9.2 Resource Recovery Criteria
The objective of this study was to recommend achievable recovery rates within specified
facility types for 2012-2017. However, it is the consultants’ view that setting resource recovery
criteria for approved facilities would be a challenging and problematic exercise.
o The performance of facilities, even within a category, is highly variable and
dependent on the material inputs and the types of processes and procedures which
are used, which in turn depend on the type and quality of material output being
sought.
In this respect, South Australian resource recovery facilities have, in
response to the source separation paradigm implemented in this State,
mainly developed highly specialised facilities to receive various source
separated mixed, aggregated and/or single material streams for resource
recovery.
o These facilities were not designed to take mixed waste streams with putrescible
matter, which unless expanded source separation practices are encouraged, would
be the waste streams requiring resource recovery before disposal to landfill.

105
o It is therefore difficult to standardise resource recovery criteria by either process or
resource recovery targets across facilities.
Even if this was possible there is insufficient industry data available on which
to reliably form opinions on what criteria can and should be realistically be
set.
o This suggests that, if resource recovery criteria (whether process or target based) are
to be applied in the future, they may need to be considered on a facility-by-facility
basis.
This supports the idea of undertaking a period of data reporting by facilities,
so they can be benchmarked and assessed in order to decide what resource
recovery criteria would be appropriate.
o Furthermore, it is important to recognise that processing of the waste residual will
require existing facilities to substantially change or adapt current processes and
approaches away from current material inputs.
o These observations suggest that Policy Response Options 5 and 6 may need to be
preceded by Policy Response Options 2 and 3 to collect relevant industry and facility
resource recovery performance data and process descriptions.
o Furthermore, implementation of Options 5 and 6 would require a considered
approach addressing the differences between individual facilities and their operations.
9.3 Guidelines for Banned Materials
Dealing with banned materials is an area of concern for the industry.
o It is considered impractical and uneconomic to guarantee removal of all items from waste
material as facility operators do not control what customers put in bins and waste is often
well mixed and aggregated before they receive it.
Therefore, guidelines to deal with banned materials should support a whole of industry focus and
consider taking a quality management approach.
o They should encourage industry to incorporate banned waste mitigation strategies into
resource recovery plans or existing management systems. Such strategies could include
the following.
Clear policies for mitigation of banned waste.
Identification and implementation of opportunities for intervention in their supply
chains to control and minimise banned waste contamination of waste streams.
This could involve providing upstream support to customers by providing
bins and other services.
Development of appropriate inspection and assessment procedures to identify
presence of waste with banned items.
Investigation of banned waste contamination incidents and identify the cause
and/or sources, so these can be addressed.
Development of quality assurance programs to monitor and assess frequency of
banned waste contamination and facility performance in identifying and removing
these items.
Procedures for how waste should be handled if banned waste is identified in it.
This may include procedures to handle the different type of banned
waste, i.e. risk-based, aggregated recoverable materials or other
prohibited landfill waste.
These guidelines may also set:
o Industry performance benchmarks for banned waste mitigation in waste disposed of to
landfill.
This should take a scientific and statistical approach, allowing for the fact that
removal of all banned waste is not practical.

106
o Provide resources for industry that can be used by them to develop banned waste
mitigation strategies.
o Clearly outline the EPA’s approach to enforcing the guidelines, including:
Industry data reporting requirements;
Audit requirements;
The processes that would apply in the event that a facility’s performance was
inadequate.
9.4 Future achievable recovery Table 9.2 summarises the projected future achievable recovery rates for South Australia’s
C&I and C&D sectors, including the 2010-2015 State Waste Strategy targets.
o These projections assume a two-step implementation of policy options for approval
criteria in Table 9.1 above.
Options 2 and 3 commencing on 1 September 2012, when the W2REPP
commences operation.
Options 4-6 introduced by 2014-2015.
o It is assumed that implementation of policy options are accompanied by an increase
in the waste levy to a level which ensures new infrastructure and operational
investments are commercially viable for industry.
The table indicates that this implementation strategy should enable all of C&I State Waste
Strategy Targets to be achieved but may not allow the C&D 2015 target to be delivered until
2017-18.
Table 9.2: Future potential improvements in South Australia’s resource recovery performance
Year C&I C&D Note
Inc. Fly ash
Exc. Fly ash
State Waste Strategy Target
State Waste Strategy Target
2009-10 77% (72%) 84%
2010-11 77-78% (72-73%) 84-85%
2011-12 78-79% (73-74%) 85-86%
2012-13 78-79% (73-74%) 65% 86-87% 85% W2REPP commences
2013-14 79-81% (74-76%) 86-88% Option 2: Data reporting & Option 3: RRP implemented
2014-15 80-82% (75-77%) 87-88%
Options 4-6 implemented Increase in waste levy as required
2015-16 80-83% (76-80%) 75% 87-89% 90%
2016-17 81-84% (77-81%) 87-90%
2017-18 81-85% (77-82%) 88-91%

107
9.5 Data reporting
The EPA may need to identify data reporting requirements to achieve two objectives.
o Objective 1: Regular reporting of data
This would be used to monitor industry performance and could possibly be
publicly used in aggregated form.
This data to be reported may include:
Total tonnes received at the facility broken into:
o Total tonnes Kerbside General Waste received
o Total tonnes C&D General Waste received
o Total tonnes C&I General Waste received
o Total tonnes Residual from another resource recovery
process or other
The total tonnes outgoing from the facility broken into:
o Total tonnes for each recycling stream sent offsite
o Total tonnes to landfill
Estimate of total stock on site at the end of the period (include all
materials included waste in, recycling streams and landfill stream)
o Objective 2: Audit data reporting
For this purpose additional data that may need to be reported would include
The destination(s) and associated quantities of each of the resource
recovered streams by tonnage
The destination(s) and associated quantities of the waste being sent
directly to landfill by tonnage
The destination(s) and associated quantities of any other streams
send for further resource recovery or other processing
If the EPA adopts Policy Response 4, approved facilities may be also be required to report
additional data:
o For source separated material, details on what source separation had occurred,
including services provided and/or diversion information.
o For resource recovered material from another facility (which is not approved), the
materials recovered and the resource recovery performance of that facility.
For industry to comply with the above requirements, approved facilities may need to upgrade
and improve measurement and data collection capabilities and systems.
Data reporting options acceptable to industry included either paper or electronic returns.
Industry were flexible in reporting frequency to the EPA:
o Some would be happy with reporting to align with the monthly solid waste levy
reporting;
o Others indicated quarterly or six monthly reporting would be preferred to reduce
administration times.
108
10 References
Australian Council of Recyclers Inc. (2008); Recyclers Call on Government to Recognise Recycling
Department of the Environment, Water, Heritage and the Arts (2009); Employment in Waste
Management and Recycling
European Union Commission (2010); Being wise with waste: the EU’s approach to waste
management
ISO (2004); ANSI/ASQ/ISO 14001:2004 - Environmental Management Systems - Specifications with
Guidance for Use
SA Environment Protection Authority (2007); EPA Guidelines Environmental management of landfill
facilities (municipal solid waste and commercial and industrial general waste)
SA Environment Protection Authority (August 2009); Response to submissions on the Draft
Environmental (Waste to Resources) Protection Policy
SA Government (2010b); Environment Protection (Waste to Resources) Policy 2010, Version:
2.9.2010
Sustainability Victoria (2010); Victorian Recycling Industries Annual Survey 2008–2009
US Environment Protection Agency (2009); Sustainable Materials Management: The Road Ahead in
the US, 2009-2020
Waste Management Association of Australia (2011); Inside Waste Industry Report 2011/12, June
2011
Zero Waste SA (2007a); Review of Solid Waste Levy, Report no: 1-6, 2 February
Zero Waste SA (2007b); South Australia Disposal Based (Landfill) Survey, October/November 2007
Zero Waste SA (2008); Community and Industry Attitudes: General Public Survey
Zero Waste SA (2009); South Australian Recycling Industry Investment Review: Setting the Picture
(for Zero Waste SA)
Zero Waste SA (2011); Draft South Australia’s Waste Strategy 2010-2015

109
Appendix 1: Industry Consultation Survey Questions

110
Table A.1: More detailed list of question types asked during the consultation interviews. Note:
Which questions were asked, the order in which they were asked, and the context in which they were
posed, often depended on a consultation interviewee’s circumstances and initial responses.
Consultation Interview Questions
1. The consultation candidate’s views of the W2REPP and its implications for your business or facility, i.e.
Level of awareness of the W2REPP & implications for your facility?
Is the W2REPP likely to affect how the facility handles waste & recyclables?
Will the business be seeking an approval for a facility under Division 2 clause 11 of the EPP?
Views on approval criteria & processes that will occur or be needed, in particular determination of waste acceptability for resource recovery under Clause 2?
Awareness that changes to existing licence conditions could be applied to support the EPP?
2. Relevant information on the facility’s processes and procedures, i.e.
What waste types does the facility receive?
What is the facility’s current capacity & recovery performance objectives?
Provide a brief description of the main process employed.
Is different waste streams processed separately?
How is the suitability of material for resource recovery currently assessed, including presence of banned materials?
What is the percentage of material that is rejected?
Could this rejected material be re-processed with changes to the current process, or would it still have to be sent elsewhere?
How much waste (estimated if known) is source separated before receipt? In what manner? (e.g. metals, cardboard, paper, etc., or simply dry co-mingled, wet co-mingled)
How is source separation verified?
What is extent of resource recovery attempted on waste streams received? Does it vary between source separated and un-segregated waste?
How does the facility deal with banned waste materials?
What are the facility’s management procedures in relation to the material assessment, dealing with banned materials and controlling and/or monitoring facility performance and resource recovery?
What is the perceived/estimated content or remaining resource value in facility residuals? Where is it sent?
Opinions on the costs of re-processing these residuals to extract further resource and value.
Is the business proposing site up-grades and if there are what is the proposed time frame?
Are there practices that the facility uses that you consider may distinguish its performance from other comparable facilities?

111
3. Perceived challenges and opportunities for the facility arising from introduction of the W2REPP, including capacity and costs or benefits for expanding the facility’s capability to accept more and other types of material, i.e.
What would need to happen for the facility to recover more of the material it receives (e.g. source separated waste receipt, other changes in waste receipt, different or additional machinery or processes, education, ready markets for materials, price of materials, landfill levy)?
Views or information on likely costs of such change(s)? (including likely investment and operating costs) Costs to facility? Costs for others?
What are the key constraints to the facility recovering more materials received at your facility? How could these constraints could be reduced or removed?
Views or estimates on what these changes might cost?
Views or opinions on other extra costs (if any) that might be involved?
4. If the consultation candidate had any views on how they would like to see the W2REPP implemented, i.e.
Approval criteria, Resource recovery criteria, Guidelines, EPA Licence Conditions, etc.
5. What types of support would be valuable to helping them and/or their facility adapt to the W2REPP, i.e.
Funding for infrastructure, Guidelines providing advice & information, etc.
6. How they would like to see data reporting of compliance and/or performance to the EPA handled, i.e.
How is the site or facility’s data currently collected / determined?
Views and opinions on facility data that should be reported under the W2REPP, and the best method for reporting this data to the EPA? E.g. Quantities of waste & recyclables received; Material processed & resources recovered + residuals (and where sent); Material rejected, including banned materials, and which facility sent to?