epa method 557 quantitation of haloacetic acids, … method 557 quantitation of haloacetic acids,...
TRANSCRIPT

EPA Method 557 Quantitation of Haloacetic Acids, Bromate, and Dalapon in Drinking Water Using Ion Chromatography and Tandem Mass Spectrometry Jonathan R. Beck, Terri Christison, Hans Schweingruber, Charles T. Yang; Thermo Fisher Scienti� c, San Jose, CA
Po
ster No
te 64
430EPA Method 557 Quantitation of Haloacetic Acids, Bromate, and Dalapon in Drinking Water Using
Ion Chromatography and Tandem Mass Spectrometry Jonathan R. Beck, Terri Christison, Hans Schweingruber, Charles T. Yang; Thermo Fisher Scientific, San Jose, CA, USA
Conclusion Reagent-Free IC systems coupled with an MS/MS detector is a powerful tool used
in the quantitation of haloacetic acid samples.
When compared to the conventional EPA methods using GC with electron capture, using the combination of the Dionex ICS-5000 ion chromatography system and the TSQ Endura triple quadrupole mass spectrometer to analyze for haloacetic acids saves analysts several hours of sample preparation.
The resolution between the matrix peaks and haloacetic acids is excellent, which allows for minimum interference in detection, as well as ensuring a cleaner ion source of the mass spectrometer.
Excellent reproducibility and quantitation of HAAs was achieved when samples were spiked into a simulated matrix.
References 1. Microbial Health Effects Tables: Potential Adverse Health Effects from High/Long-
term Exposure to Hazardous Chemicals in Drinking Water; U.S. Environmental Protection Agency, 2002.
2. Method 552.1, Determination of Haloacetic Acids and Dalapon in Drinking Water by Ion Exchange Liquid-Solid Extraction and Gas Chromatography with Electron Capture Detection (Rev. 1.0); U.S. Environmental Protection Agency, 1992.
3. Method 552.2, Determination of Haloacetic Acids and Dalapon in Drinking Water by Liquid-Liquid Extraction, Derivatization, and Gas Chromatography with Electron Capture Detection (Rev. 1.0); U.S. Environmental Protection Agency, 1995.
4. Method 552.3, Determination of Haloacetic Acids and Dalapon in Drinking Water Liquid-Liquid Microextraction, Derivatization, and Gas Chromatography with Electron Capture Detection (Rev. 1.0); U.S. Environmental Protection Agency, 2003.
5. Method 557, Determination of Haloacetic Acids, Bromate, and Dalapon in Drinking Water by Ion Chromatography Electrospray Ionization Tandem Mass Spectrometry (IC-ESI-MS/MS) (Rev. 1.0); U.S. Environmental Protection Agency, 2009
6. Slingsby, R.; Saini, C.; Pohl, C.; Jack, R. The Measurement of Haloacetic Acids in Drinking Water Using IC-MS/MS–Method Performance. Presented at the Pittsburgh Conference, New Orleans, LA, March 2008.
Overview Purpose: To demonstrate a simple and sensitive IC-MS/MS method for analyzing haloacetic acids, the pesticide dalapon, and bromate in water using EPA Method 557.
Methods: Direct injection of drinking water samples using IC-MS/MS.
Results: Quantitative analysis of nine haloacetic acids, bromate, and dalapon at sub ppb levels.
Introduction Haloacetic acids (HAAs) are formed as disinfection byproducts when water is chlorinated to remove microbial content. Chlorine reacts with naturally occurring organic and inorganic matter in the water, such as decaying vegetation, to produce disinfection by-products (DBPs) that include HAAs. Of the nine species of HAAs, five are currently regulated by the EPA (HAA5): monochloroacetic acid (MCAA), dichloroacetic acid (DCAA), trichloroacetic acid (TCAA), monobromoacetic acid (MBAA), and dibromoacetic acid (DBAA). The remaining four HAAs are currently unregulated: bromochloroacetic acid (BCAA), bromodichloroacetic acid (BDCAA), dibromochloroacetic acid (DBCAA), and tribromoacetic acid (TBAA). However, they are also of health concern, and are often analyzed along with the HAA5. This method allows for the analysis of all nine HAAs, plus bromate and the pesticide dalapon in the same IC-MS/MS run without sample preparation.
According to the U.S. Environmental Protection Agency (EPA), there is an increased risk of cancer associated with long-term consumption of water containing levels of HAAs that exceed 0.06 mg/L.1 EPA Methods 552.1, 552.2, and 552.3 are used to determine the level of all nine HAAs in drinking water.2,3,4 These methods require derivatization and multiple extraction steps followed by gas chromatography (GC) with electron capture detection (ECD).
By comparison to the conventional EPA methods using GC with ECD, the combination of ion chromatography and mass spectrometry (IC-MS and IC-MS/MS) offers sensitive and rapid detection without the need for sample pre-treatment. In order to develop a simple, easy-to-use direct-injection method, the U.S. EPA promulgated Method 5575 for the analysis of haloacetic acids, bromate, and dalapon in drinking water by IC-MS/MS.
Methods Sample Preparation
Drinking water samples were collected from municipal tap water sources. NH4Cl was added as a preservative at 100 mg/L to all water samples. No further sample preparation was performed prior to injection.
Ion Chromatography
IC analysis was performed on a Thermo Scientific™ Dionex™ ICS-5000 system. Samples were directly injected and no sample pre-treatment was required. The IC conditions used are shown in Table 1.
The sample is injected without cleanup or concentration onto a Thermo Scientific™ Dionex™ IonPac™ AS24 column specifically designed to separate method analytes from the following common anions (matrix components) in drinking water: chloride, carbonate, sulfate, and nitrate.
Hydroxide eluent is generated using an electrolytic eluent generation which provides smoother gradients than conventional pump proportioning valves, and a continuously regenerated trap column continuously removes contaminants to provide pure eluent throughout the run. A Thermo Scientific™ Dionex™ ASRS™ 300 Anion Self-Regenerating Suppressor™ is placed in line after the column and electrolytically converts hydroxide eluent into water and simultaneously removes cations present in the drinking water and eluent. The gradient profile used is shown in Table 2. An overall schematic diagram of the system is shown in Figure 1.
TABLE 1. Ion chromatography system conditions.
TABLE 2. Electrolytically formed hydroxide gradient.
Results Calibrators and Simulated Sample Matrix
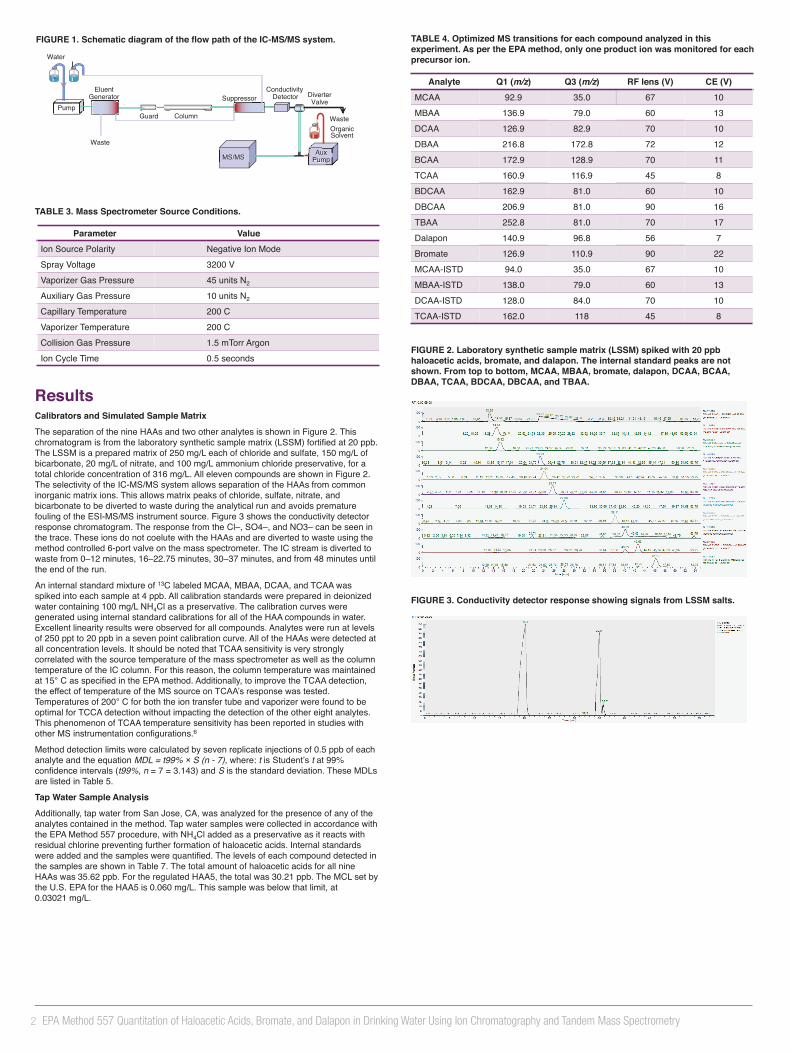
The separation of the nine HAAs and two other analytes is shown in Figure 2. This chromatogram is from the laboratory synthetic sample matrix (LSSM) fortified at 20 ppb. The LSSM is a prepared matrix of 250 mg/L each of chloride and sulfate, 150 mg/L of bicarbonate, 20 mg/L of nitrate, and 100 mg/L ammonium chloride preservative, for a total chloride concentration of 316 mg/L. All eleven compounds are shown in Figure 2. The selectivity of the IC-MS/MS system allows separation of the HAAs from common inorganic matrix ions. This allows matrix peaks of chloride, sulfate, nitrate, and bicarbonate to be diverted to waste during the analytical run and avoids premature fouling of the ESI-MS/MS instrument source. Figure 3 shows the conductivity detector response chromatogram. The response from the Cl–, SO4–, and NO3– can be seen in the trace. These ions do not coelute with the HAAs and are diverted to waste using the method controlled 6-port valve on the mass spectrometer. The IC stream is diverted to waste from 0–12 minutes, 16–22.75 minutes, 30–37 minutes, and from 48 minutes until the end of the run.
An internal standard mixture of 13C labeled MCAA, MBAA, DCAA, and TCAA was spiked into each sample at 4 ppb. All calibration standards were prepared in deionized water containing 100 mg/L NH4Cl as a preservative. The calibration curves were generated using internal standard calibrations for all of the HAA compounds in water. Excellent linearity results were observed for all compounds. Analytes were run at levels of 250 ppt to 20 ppb in a seven point calibration curve. All of the HAAs were detected at all concentration levels. It should be noted that TCAA sensitivity is very strongly correlated with the source temperature of the mass spectrometer as well as the column temperature of the IC column. For this reason, the column temperature was maintained at 15° C as specified in the EPA method. Additionally, to improve the TCAA detection, the effect of temperature of the MS source on TCAA’s response was tested. Temperatures of 200° C for both the ion transfer tube and vaporizer were found to be optimal for TCCA detection without impacting the detection of the other eight analytes. This phenomenon of TCAA temperature sensitivity has been reported in studies with other MS instrumentation configurations.6
Method detection limits were calculated by seven replicate injections of 0.5 ppb of each analyte and the equation MDL = t99% × S (n - 7), where: t is Student’s t at 99% confidence intervals (t99%, n = 7 = 3.143) and S is the standard deviation. These MDLs are listed in Table 5.
Tap Water Sample Analysis
Additionally, tap water from San Jose, CA, was analyzed for the presence of any of the analytes contained in the method. Tap water samples were collected in accordance with the EPA Method 557 procedure, with NH4Cl added as a preservative as it reacts with residual chlorine preventing further formation of haloacetic acids. Internal standards were added and the samples were quantified. The levels of each compound detected in the samples are shown in Table 7. The total amount of haloacetic acids for all nine HAAs was 35.62 ppb. For the regulated HAA5, the total was 30.21 ppb. The MCL set by the U.S. EPA for the HAA5 is 0.060 mg/L. This sample was below that limit, at 0.03021 mg/L.
© 2015 Thermo Fisher Scientific Inc. All rights reserved. All trademarks are the property of Thermo Fisher Scientific and its subsidiaries. This information is not intended to encourage use of these products in any manner that might infringe the intellectual property rights of others.
A matrix diversion valve was placed in line prior to the mass spectrometer to divert the high sample matrix anions from the MS source that normally cause signal suppression in the MS. Thus the use of hydroxide eluent and suppression in the Reagent-Free IC system is more powerful for the separation and detection of organic acids than reversed phase separations that require acidic addition (to protonate the compounds to acetic acids) or addition of stabilizing salts, both of which undermine analysis. Isopropyl alcohol was added into the eluent stream via a mixing T immediately after the matrix diversion valve. The isopropyl alcohol was added at a flow rate of 0.2 mL/min. The isopropyl alcohol had two main purposes: to assist in the desolvation of the mobile phase and to act as a makeup flow when the IC eluent was diverted to waste. Acetonitrile can also be used instead of isopropyl alcohol, however the lower cost of isopropyl alcohol is an advantage to the chemist.
Mass Spectrometry
MS analysis was carried out on a Thermo Scientific™ TSQ Endrua™ triple stage quadrupole mass spectrometer with a heated electrospray ionization (H-ESI-II) probe. The MS conditions used are shown in Table 3.
Individual standards were infused into the mass spectrometer to determine optimum RF lens settings and collision energies for the product ions. Table 4 describes the MS conditions for specific HAAs, dalapon, bromate, and internal standards.
Data Analysis
Data acquisition and processing were carried out using Thermo Scientific™ TraceFinder™ software version 3.2.
TABLE 4. Optimized MS transitions for each compound analyzed in this experiment. As per the EPA method, only one product ion was monitored for each precursor ion.
Column Dionex IonPac AG24 (2 × 50 mm), IonPac AS24 (2 × 250mm) Suppressor ASRS 300 2mm Column Temperature 15° C Injection Volume 100 uL Flow Rate 0.3 mL/min KOH gradient, electrolytically generated
Analyte Q1 (m/z) Q3 (m/z) RF lens (V) CE (V) MCAA 92.9 35.0 67 10 MBAA 136.9 79.0 60 13 DCAA 126.9 82.9 70 10 DBAA 216.8 172.8 72 12 BCAA 172.9 128.9 70 11 TCAA 160.9 116.9 45 8 BDCAA 162.9 81.0 60 10 DBCAA 206.9 81.0 90 16 TBAA 252.8 81.0 70 17 Dalapon 140.9 96.8 56 7 Bromate 126.9 110.9 90 22 MCAA-ISTD 94.0 35.0 67 10 MBAA-ISTD 138.0 79.0 60 13 DCAA-ISTD 128.0 84.0 70 10 TCAA-ISTD 162.0 118 45 8
Retention Time (min) [KOH] mM 0.0 7.0 15.1 7.0 30.8 18.0 31 60 46 60 47 7 58 7
Conductivity Detector
Waste
Eluent Generator
Column Guard
Suppressor Pump
Water
Aux Pump
Organic Solvent
Diverter Valve
Waste
MS/MS
FIGURE 1. Schematic diagram of the flow path of the IC-MS/MS system.
Parameter Value Ion Source Polarity Negative Ion Mode Spray Voltage 3200 V Vaporizer Gas Pressure 45 units N2 Auxiliary Gas Pressure 10 units N2 Capillary Temperature 200 C Vaporizer Temperature 200 C Collision Gas Pressure 1.5 mTorr Argon Ion Cycle Time 0.5 seconds
TABLE 3. Mass Spectrometer Source Conditions.
FIGURE 2. Laboratory synthetic sample matrix (LSSM) spiked with 20 ppb haloacetic acids, bromate, and dalapon. The internal standard peaks are not shown. From top to bottom, MCAA, MBAA, bromate, dalapon, DCAA, BCAA, DBAA, TCAA, BDCAA, DBCAA, and TBAA.
FIGURE 3. Conductivity detector response showing signals from LSSM salts.
Analyte MDL (ppb) MCAA 0.105
MBAA 0.104
DCAA 0.044
DBAA 0.021
BCAA 0.059
TCAA 0.033
BDCAA 0.141
DBCAA 0.214
TBAA 0.159
Dalapon 0.050
Bromate 0.059
TABLE 5. Method Detection Limits for each compound.
EPA Method 557 Quantitation of Haloacetic Acids, Bromate, and Dalapon in Drinking Water Using Ion Chromatography and Tandem Mass Spectrometry Jonathan R. Beck, Terri Christison, Hans Schweingruber, Charles T. Yang; Thermo Fisher Scientific, San Jose, CA, USA
Conclusion Reagent-Free IC systems coupled with an MS/MS detector is a powerful tool used
in the quantitation of haloacetic acid samples.
When compared to the conventional EPA methods using GC with electron capture, using the combination of the Dionex ICS-5000 ion chromatography system and the TSQ Endura triple quadrupole mass spectrometer to analyze for haloacetic acids saves analysts several hours of sample preparation.
The resolution between the matrix peaks and haloacetic acids is excellent, which allows for minimum interference in detection, as well as ensuring a cleaner ion source of the mass spectrometer.
Excellent reproducibility and quantitation of HAAs was achieved when samples were spiked into a simulated matrix.
References 1. Microbial Health Effects Tables: Potential Adverse Health Effects from High/Long-
term Exposure to Hazardous Chemicals in Drinking Water; U.S. Environmental Protection Agency, 2002.
2. Method 552.1, Determination of Haloacetic Acids and Dalapon in Drinking Water by Ion Exchange Liquid-Solid Extraction and Gas Chromatography with Electron Capture Detection (Rev. 1.0); U.S. Environmental Protection Agency, 1992.
3. Method 552.2, Determination of Haloacetic Acids and Dalapon in Drinking Water by Liquid-Liquid Extraction, Derivatization, and Gas Chromatography with Electron Capture Detection (Rev. 1.0); U.S. Environmental Protection Agency, 1995.
4. Method 552.3, Determination of Haloacetic Acids and Dalapon in Drinking Water Liquid-Liquid Microextraction, Derivatization, and Gas Chromatography with Electron Capture Detection (Rev. 1.0); U.S. Environmental Protection Agency, 2003.
5. Method 557, Determination of Haloacetic Acids, Bromate, and Dalapon in Drinking Water by Ion Chromatography Electrospray Ionization Tandem Mass Spectrometry (IC-ESI-MS/MS) (Rev. 1.0); U.S. Environmental Protection Agency, 2009
6. Slingsby, R.; Saini, C.; Pohl, C.; Jack, R. The Measurement of Haloacetic Acids in Drinking Water Using IC-MS/MS–Method Performance. Presented at the Pittsburgh Conference, New Orleans, LA, March 2008.
Overview Purpose: To demonstrate a simple and sensitive IC-MS/MS method for analyzing haloacetic acids, the pesticide dalapon, and bromate in water using EPA Method 557.
Methods: Direct injection of drinking water samples using IC-MS/MS.
Results: Quantitative analysis of nine haloacetic acids, bromate, and dalapon at sub ppb levels.
Introduction Haloacetic acids (HAAs) are formed as disinfection byproducts when water is chlorinated to remove microbial content. Chlorine reacts with naturally occurring organic and inorganic matter in the water, such as decaying vegetation, to produce disinfection by-products (DBPs) that include HAAs. Of the nine species of HAAs, five are currently regulated by the EPA (HAA5): monochloroacetic acid (MCAA), dichloroacetic acid (DCAA), trichloroacetic acid (TCAA), monobromoacetic acid (MBAA), and dibromoacetic acid (DBAA). The remaining four HAAs are currently unregulated: bromochloroacetic acid (BCAA), bromodichloroacetic acid (BDCAA), dibromochloroacetic acid (DBCAA), and tribromoacetic acid (TBAA). However, they are also of health concern, and are often analyzed along with the HAA5. This method allows for the analysis of all nine HAAs, plus bromate and the pesticide dalapon in the same IC-MS/MS run without sample preparation.
According to the U.S. Environmental Protection Agency (EPA), there is an increased risk of cancer associated with long-term consumption of water containing levels of HAAs that exceed 0.06 mg/L.1 EPA Methods 552.1, 552.2, and 552.3 are used to determine the level of all nine HAAs in drinking water.2,3,4 These methods require derivatization and multiple extraction steps followed by gas chromatography (GC) with electron capture detection (ECD).
By comparison to the conventional EPA methods using GC with ECD, the combination of ion chromatography and mass spectrometry (IC-MS and IC-MS/MS) offers sensitive and rapid detection without the need for sample pre-treatment. In order to develop a simple, easy-to-use direct-injection method, the U.S. EPA promulgated Method 5575 for the analysis of haloacetic acids, bromate, and dalapon in drinking water by IC-MS/MS.
Methods Sample Preparation
Drinking water samples were collected from municipal tap water sources. NH4Cl was added as a preservative at 100 mg/L to all water samples. No further sample preparation was performed prior to injection.
Ion Chromatography
IC analysis was performed on a Thermo Scientific™ Dionex™ ICS-5000 system. Samples were directly injected and no sample pre-treatment was required. The IC conditions used are shown in Table 1.
The sample is injected without cleanup or concentration onto a Thermo Scientific™ Dionex™ IonPac™ AS24 column specifically designed to separate method analytes from the following common anions (matrix components) in drinking water: chloride, carbonate, sulfate, and nitrate.
Hydroxide eluent is generated using an electrolytic eluent generation which provides smoother gradients than conventional pump proportioning valves, and a continuously regenerated trap column continuously removes contaminants to provide pure eluent throughout the run. A Thermo Scientific™ Dionex™ ASRS™ 300 Anion Self-Regenerating Suppressor™ is placed in line after the column and electrolytically converts hydroxide eluent into water and simultaneously removes cations present in the drinking water and eluent. The gradient profile used is shown in Table 2. An overall schematic diagram of the system is shown in Figure 1.
TABLE 1. Ion chromatography system conditions.
TABLE 2. Electrolytically formed hydroxide gradient.
Results Calibrators and Simulated Sample Matrix
The separation of the nine HAAs and two other analytes is shown in Figure 2. This chromatogram is from the laboratory synthetic sample matrix (LSSM) fortified at 20 ppb. The LSSM is a prepared matrix of 250 mg/L each of chloride and sulfate, 150 mg/L of bicarbonate, 20 mg/L of nitrate, and 100 mg/L ammonium chloride preservative, for a total chloride concentration of 316 mg/L. All eleven compounds are shown in Figure 2. The selectivity of the IC-MS/MS system allows separation of the HAAs from common inorganic matrix ions. This allows matrix peaks of chloride, sulfate, nitrate, and bicarbonate to be diverted to waste during the analytical run and avoids premature fouling of the ESI-MS/MS instrument source. Figure 3 shows the conductivity detector response chromatogram. The response from the Cl–, SO4–, and NO3– can be seen in the trace. These ions do not coelute with the HAAs and are diverted to waste using the method controlled 6-port valve on the mass spectrometer. The IC stream is diverted to waste from 0–12 minutes, 16–22.75 minutes, 30–37 minutes, and from 48 minutes until the end of the run.
An internal standard mixture of 13C labeled MCAA, MBAA, DCAA, and TCAA was spiked into each sample at 4 ppb. All calibration standards were prepared in deionized water containing 100 mg/L NH4Cl as a preservative. The calibration curves were generated using internal standard calibrations for all of the HAA compounds in water. Excellent linearity results were observed for all compounds. Analytes were run at levels of 250 ppt to 20 ppb in a seven point calibration curve. All of the HAAs were detected at all concentration levels. It should be noted that TCAA sensitivity is very strongly correlated with the source temperature of the mass spectrometer as well as the column temperature of the IC column. For this reason, the column temperature was maintained at 15° C as specified in the EPA method. Additionally, to improve the TCAA detection, the effect of temperature of the MS source on TCAA’s response was tested. Temperatures of 200° C for both the ion transfer tube and vaporizer were found to be optimal for TCCA detection without impacting the detection of the other eight analytes. This phenomenon of TCAA temperature sensitivity has been reported in studies with other MS instrumentation configurations.6
Method detection limits were calculated by seven replicate injections of 0.5 ppb of each analyte and the equation MDL = t99% × S (n - 7), where: t is Student’s t at 99% confidence intervals (t99%, n = 7 = 3.143) and S is the standard deviation. These MDLs are listed in Table 5.
Tap Water Sample Analysis
Additionally, tap water from San Jose, CA, was analyzed for the presence of any of the analytes contained in the method. Tap water samples were collected in accordance with the EPA Method 557 procedure, with NH4Cl added as a preservative as it reacts with residual chlorine preventing further formation of haloacetic acids. Internal standards were added and the samples were quantified. The levels of each compound detected in the samples are shown in Table 7. The total amount of haloacetic acids for all nine HAAs was 35.62 ppb. For the regulated HAA5, the total was 30.21 ppb. The MCL set by the U.S. EPA for the HAA5 is 0.060 mg/L. This sample was below that limit, at 0.03021 mg/L.
© 2015 Thermo Fisher Scientific Inc. All rights reserved. All trademarks are the property of Thermo Fisher Scientific and its subsidiaries. This information is not intended to encourage use of these products in any manner that might infringe the intellectual property rights of others.
A matrix diversion valve was placed in line prior to the mass spectrometer to divert the high sample matrix anions from the MS source that normally cause signal suppression in the MS. Thus the use of hydroxide eluent and suppression in the Reagent-Free IC system is more powerful for the separation and detection of organic acids than reversed phase separations that require acidic addition (to protonate the compounds to acetic acids) or addition of stabilizing salts, both of which undermine analysis. Isopropyl alcohol was added into the eluent stream via a mixing T immediately after the matrix diversion valve. The isopropyl alcohol was added at a flow rate of 0.2 mL/min. The isopropyl alcohol had two main purposes: to assist in the desolvation of the mobile phase and to act as a makeup flow when the IC eluent was diverted to waste. Acetonitrile can also be used instead of isopropyl alcohol, however the lower cost of isopropyl alcohol is an advantage to the chemist.
Mass Spectrometry
MS analysis was carried out on a Thermo Scientific™ TSQ Endrua™ triple stage quadrupole mass spectrometer with a heated electrospray ionization (H-ESI-II) probe. The MS conditions used are shown in Table 3.
Individual standards were infused into the mass spectrometer to determine optimum RF lens settings and collision energies for the product ions. Table 4 describes the MS conditions for specific HAAs, dalapon, bromate, and internal standards.
Data Analysis
Data acquisition and processing were carried out using Thermo Scientific™ TraceFinder™ software version 3.2.
TABLE 4. Optimized MS transitions for each compound analyzed in this experiment. As per the EPA method, only one product ion was monitored for each precursor ion.
Column Dionex IonPac AG24 (2 × 50 mm), IonPac AS24 (2 × 250mm) Suppressor ASRS 300 2mm Column Temperature 15° C Injection Volume 100 uL Flow Rate 0.3 mL/min KOH gradient, electrolytically generated
Analyte Q1 (m/z) Q3 (m/z) RF lens (V) CE (V) MCAA 92.9 35.0 67 10 MBAA 136.9 79.0 60 13 DCAA 126.9 82.9 70 10 DBAA 216.8 172.8 72 12 BCAA 172.9 128.9 70 11 TCAA 160.9 116.9 45 8 BDCAA 162.9 81.0 60 10 DBCAA 206.9 81.0 90 16 TBAA 252.8 81.0 70 17 Dalapon 140.9 96.8 56 7 Bromate 126.9 110.9 90 22 MCAA-ISTD 94.0 35.0 67 10 MBAA-ISTD 138.0 79.0 60 13 DCAA-ISTD 128.0 84.0 70 10 TCAA-ISTD 162.0 118 45 8
Retention Time (min) [KOH] mM 0.0 7.0 15.1 7.0 30.8 18.0 31 60 46 60 47 7 58 7
Conductivity Detector
Waste
Eluent Generator
Column Guard
Suppressor Pump
Water
Aux Pump
Organic Solvent
Diverter Valve
Waste
MS/MS
FIGURE 1. Schematic diagram of the flow path of the IC-MS/MS system.
Parameter Value Ion Source Polarity Negative Ion Mode Spray Voltage 3200 V Vaporizer Gas Pressure 45 units N2 Auxiliary Gas Pressure 10 units N2 Capillary Temperature 200 C Vaporizer Temperature 200 C Collision Gas Pressure 1.5 mTorr Argon Ion Cycle Time 0.5 seconds
TABLE 3. Mass Spectrometer Source Conditions.
FIGURE 2. Laboratory synthetic sample matrix (LSSM) spiked with 20 ppb haloacetic acids, bromate, and dalapon. The internal standard peaks are not shown. From top to bottom, MCAA, MBAA, bromate, dalapon, DCAA, BCAA, DBAA, TCAA, BDCAA, DBCAA, and TBAA.
FIGURE 3. Conductivity detector response showing signals from LSSM salts.
Analyte MDL (ppb) MCAA 0.105
MBAA 0.104
DCAA 0.044
DBAA 0.021
BCAA 0.059
TCAA 0.033
BDCAA 0.141
DBCAA 0.214
TBAA 0.159
Dalapon 0.050
Bromate 0.059
TABLE 5. Method Detection Limits for each compound.
2 EPA Method 557 Quantitation of Haloacetic Acids, Bromate, and Dalapon in Drinking Water Using Ion Chromatography and Tandem Mass Spectrometry
EPA Method 557 Quantitation of Haloacetic Acids, Bromate, and Dalapon in Drinking Water Using Ion Chromatography and Tandem Mass Spectrometry Jonathan R. Beck, Terri Christison, Hans Schweingruber, Charles T. Yang; Thermo Fisher Scientific, San Jose, CA, USA
Conclusion Reagent-Free IC systems coupled with an MS/MS detector is a powerful tool used
in the quantitation of haloacetic acid samples.
When compared to the conventional EPA methods using GC with electron capture, using the combination of the Dionex ICS-5000 ion chromatography system and the TSQ Endura triple quadrupole mass spectrometer to analyze for haloacetic acids saves analysts several hours of sample preparation.
The resolution between the matrix peaks and haloacetic acids is excellent, which allows for minimum interference in detection, as well as ensuring a cleaner ion source of the mass spectrometer.
Excellent reproducibility and quantitation of HAAs was achieved when samples were spiked into a simulated matrix.
References 1. Microbial Health Effects Tables: Potential Adverse Health Effects from High/Long-
term Exposure to Hazardous Chemicals in Drinking Water; U.S. Environmental Protection Agency, 2002.
2. Method 552.1, Determination of Haloacetic Acids and Dalapon in Drinking Water by Ion Exchange Liquid-Solid Extraction and Gas Chromatography with Electron Capture Detection (Rev. 1.0); U.S. Environmental Protection Agency, 1992.
3. Method 552.2, Determination of Haloacetic Acids and Dalapon in Drinking Water by Liquid-Liquid Extraction, Derivatization, and Gas Chromatography with Electron Capture Detection (Rev. 1.0); U.S. Environmental Protection Agency, 1995.
4. Method 552.3, Determination of Haloacetic Acids and Dalapon in Drinking Water Liquid-Liquid Microextraction, Derivatization, and Gas Chromatography with Electron Capture Detection (Rev. 1.0); U.S. Environmental Protection Agency, 2003.
5. Method 557, Determination of Haloacetic Acids, Bromate, and Dalapon in Drinking Water by Ion Chromatography Electrospray Ionization Tandem Mass Spectrometry (IC-ESI-MS/MS) (Rev. 1.0); U.S. Environmental Protection Agency, 2009
6. Slingsby, R.; Saini, C.; Pohl, C.; Jack, R. The Measurement of Haloacetic Acids in Drinking Water Using IC-MS/MS–Method Performance. Presented at the Pittsburgh Conference, New Orleans, LA, March 2008.
Overview Purpose: To demonstrate a simple and sensitive IC-MS/MS method for analyzing haloacetic acids, the pesticide dalapon, and bromate in water using EPA Method 557.
Methods: Direct injection of drinking water samples using IC-MS/MS.
Results: Quantitative analysis of nine haloacetic acids, bromate, and dalapon at sub ppb levels.
Introduction Haloacetic acids (HAAs) are formed as disinfection byproducts when water is chlorinated to remove microbial content. Chlorine reacts with naturally occurring organic and inorganic matter in the water, such as decaying vegetation, to produce disinfection by-products (DBPs) that include HAAs. Of the nine species of HAAs, five are currently regulated by the EPA (HAA5): monochloroacetic acid (MCAA), dichloroacetic acid (DCAA), trichloroacetic acid (TCAA), monobromoacetic acid (MBAA), and dibromoacetic acid (DBAA). The remaining four HAAs are currently unregulated: bromochloroacetic acid (BCAA), bromodichloroacetic acid (BDCAA), dibromochloroacetic acid (DBCAA), and tribromoacetic acid (TBAA). However, they are also of health concern, and are often analyzed along with the HAA5. This method allows for the analysis of all nine HAAs, plus bromate and the pesticide dalapon in the same IC-MS/MS run without sample preparation.
According to the U.S. Environmental Protection Agency (EPA), there is an increased risk of cancer associated with long-term consumption of water containing levels of HAAs that exceed 0.06 mg/L.1 EPA Methods 552.1, 552.2, and 552.3 are used to determine the level of all nine HAAs in drinking water.2,3,4 These methods require derivatization and multiple extraction steps followed by gas chromatography (GC) with electron capture detection (ECD).
By comparison to the conventional EPA methods using GC with ECD, the combination of ion chromatography and mass spectrometry (IC-MS and IC-MS/MS) offers sensitive and rapid detection without the need for sample pre-treatment. In order to develop a simple, easy-to-use direct-injection method, the U.S. EPA promulgated Method 5575 for the analysis of haloacetic acids, bromate, and dalapon in drinking water by IC-MS/MS.
Methods Sample Preparation
Drinking water samples were collected from municipal tap water sources. NH4Cl was added as a preservative at 100 mg/L to all water samples. No further sample preparation was performed prior to injection.
Ion Chromatography
IC analysis was performed on a Thermo Scientific™ Dionex™ ICS-5000 system. Samples were directly injected and no sample pre-treatment was required. The IC conditions used are shown in Table 1.
The sample is injected without cleanup or concentration onto a Thermo Scientific™ Dionex™ IonPac™ AS24 column specifically designed to separate method analytes from the following common anions (matrix components) in drinking water: chloride, carbonate, sulfate, and nitrate.
Hydroxide eluent is generated using an electrolytic eluent generation which provides smoother gradients than conventional pump proportioning valves, and a continuously regenerated trap column continuously removes contaminants to provide pure eluent throughout the run. A Thermo Scientific™ Dionex™ ASRS™ 300 Anion Self-Regenerating Suppressor™ is placed in line after the column and electrolytically converts hydroxide eluent into water and simultaneously removes cations present in the drinking water and eluent. The gradient profile used is shown in Table 2. An overall schematic diagram of the system is shown in Figure 1.
TABLE 1. Ion chromatography system conditions.
TABLE 2. Electrolytically formed hydroxide gradient.
Results Calibrators and Simulated Sample Matrix
The separation of the nine HAAs and two other analytes is shown in Figure 2. This chromatogram is from the laboratory synthetic sample matrix (LSSM) fortified at 20 ppb. The LSSM is a prepared matrix of 250 mg/L each of chloride and sulfate, 150 mg/L of bicarbonate, 20 mg/L of nitrate, and 100 mg/L ammonium chloride preservative, for a total chloride concentration of 316 mg/L. All eleven compounds are shown in Figure 2. The selectivity of the IC-MS/MS system allows separation of the HAAs from common inorganic matrix ions. This allows matrix peaks of chloride, sulfate, nitrate, and bicarbonate to be diverted to waste during the analytical run and avoids premature fouling of the ESI-MS/MS instrument source. Figure 3 shows the conductivity detector response chromatogram. The response from the Cl–, SO4–, and NO3– can be seen in the trace. These ions do not coelute with the HAAs and are diverted to waste using the method controlled 6-port valve on the mass spectrometer. The IC stream is diverted to waste from 0–12 minutes, 16–22.75 minutes, 30–37 minutes, and from 48 minutes until the end of the run.
An internal standard mixture of 13C labeled MCAA, MBAA, DCAA, and TCAA was spiked into each sample at 4 ppb. All calibration standards were prepared in deionized water containing 100 mg/L NH4Cl as a preservative. The calibration curves were generated using internal standard calibrations for all of the HAA compounds in water. Excellent linearity results were observed for all compounds. Analytes were run at levels of 250 ppt to 20 ppb in a seven point calibration curve. All of the HAAs were detected at all concentration levels. It should be noted that TCAA sensitivity is very strongly correlated with the source temperature of the mass spectrometer as well as the column temperature of the IC column. For this reason, the column temperature was maintained at 15° C as specified in the EPA method. Additionally, to improve the TCAA detection, the effect of temperature of the MS source on TCAA’s response was tested. Temperatures of 200° C for both the ion transfer tube and vaporizer were found to be optimal for TCCA detection without impacting the detection of the other eight analytes. This phenomenon of TCAA temperature sensitivity has been reported in studies with other MS instrumentation configurations.6
Method detection limits were calculated by seven replicate injections of 0.5 ppb of each analyte and the equation MDL = t99% × S (n - 7), where: t is Student’s t at 99% confidence intervals (t99%, n = 7 = 3.143) and S is the standard deviation. These MDLs are listed in Table 5.
Tap Water Sample Analysis
Additionally, tap water from San Jose, CA, was analyzed for the presence of any of the analytes contained in the method. Tap water samples were collected in accordance with the EPA Method 557 procedure, with NH4Cl added as a preservative as it reacts with residual chlorine preventing further formation of haloacetic acids. Internal standards were added and the samples were quantified. The levels of each compound detected in the samples are shown in Table 7. The total amount of haloacetic acids for all nine HAAs was 35.62 ppb. For the regulated HAA5, the total was 30.21 ppb. The MCL set by the U.S. EPA for the HAA5 is 0.060 mg/L. This sample was below that limit, at 0.03021 mg/L.
© 2015 Thermo Fisher Scientific Inc. All rights reserved. All trademarks are the property of Thermo Fisher Scientific and its subsidiaries. This information is not intended to encourage use of these products in any manner that might infringe the intellectual property rights of others.
A matrix diversion valve was placed in line prior to the mass spectrometer to divert the high sample matrix anions from the MS source that normally cause signal suppression in the MS. Thus the use of hydroxide eluent and suppression in the Reagent-Free IC system is more powerful for the separation and detection of organic acids than reversed phase separations that require acidic addition (to protonate the compounds to acetic acids) or addition of stabilizing salts, both of which undermine analysis. Isopropyl alcohol was added into the eluent stream via a mixing T immediately after the matrix diversion valve. The isopropyl alcohol was added at a flow rate of 0.2 mL/min. The isopropyl alcohol had two main purposes: to assist in the desolvation of the mobile phase and to act as a makeup flow when the IC eluent was diverted to waste. Acetonitrile can also be used instead of isopropyl alcohol, however the lower cost of isopropyl alcohol is an advantage to the chemist.
Mass Spectrometry
MS analysis was carried out on a Thermo Scientific™ TSQ Endrua™ triple stage quadrupole mass spectrometer with a heated electrospray ionization (H-ESI-II) probe. The MS conditions used are shown in Table 3.
Individual standards were infused into the mass spectrometer to determine optimum RF lens settings and collision energies for the product ions. Table 4 describes the MS conditions for specific HAAs, dalapon, bromate, and internal standards.
Data Analysis
Data acquisition and processing were carried out using Thermo Scientific™ TraceFinder™ software version 3.2.
TABLE 4. Optimized MS transitions for each compound analyzed in this experiment. As per the EPA method, only one product ion was monitored for each precursor ion.
Column Dionex IonPac AG24 (2 × 50 mm), IonPac AS24 (2 × 250mm) Suppressor ASRS 300 2mm Column Temperature 15° C Injection Volume 100 uL Flow Rate 0.3 mL/min KOH gradient, electrolytically generated
Analyte Q1 (m/z) Q3 (m/z) RF lens (V) CE (V) MCAA 92.9 35.0 67 10 MBAA 136.9 79.0 60 13 DCAA 126.9 82.9 70 10 DBAA 216.8 172.8 72 12 BCAA 172.9 128.9 70 11 TCAA 160.9 116.9 45 8 BDCAA 162.9 81.0 60 10 DBCAA 206.9 81.0 90 16 TBAA 252.8 81.0 70 17 Dalapon 140.9 96.8 56 7 Bromate 126.9 110.9 90 22 MCAA-ISTD 94.0 35.0 67 10 MBAA-ISTD 138.0 79.0 60 13 DCAA-ISTD 128.0 84.0 70 10 TCAA-ISTD 162.0 118 45 8
Retention Time (min) [KOH] mM 0.0 7.0 15.1 7.0 30.8 18.0 31 60 46 60 47 7 58 7
Conductivity Detector
Waste
Eluent Generator
Column Guard
Suppressor Pump
Water
Aux Pump
Organic Solvent
Diverter Valve
Waste
MS/MS
FIGURE 1. Schematic diagram of the flow path of the IC-MS/MS system.
Parameter Value Ion Source Polarity Negative Ion Mode Spray Voltage 3200 V Vaporizer Gas Pressure 45 units N2 Auxiliary Gas Pressure 10 units N2 Capillary Temperature 200 C Vaporizer Temperature 200 C Collision Gas Pressure 1.5 mTorr Argon Ion Cycle Time 0.5 seconds
TABLE 3. Mass Spectrometer Source Conditions.
FIGURE 2. Laboratory synthetic sample matrix (LSSM) spiked with 20 ppb haloacetic acids, bromate, and dalapon. The internal standard peaks are not shown. From top to bottom, MCAA, MBAA, bromate, dalapon, DCAA, BCAA, DBAA, TCAA, BDCAA, DBCAA, and TBAA.
FIGURE 3. Conductivity detector response showing signals from LSSM salts.
Analyte MDL (ppb) MCAA 0.105
MBAA 0.104
DCAA 0.044
DBAA 0.021
BCAA 0.059
TCAA 0.033
BDCAA 0.141
DBCAA 0.214
TBAA 0.159
Dalapon 0.050
Bromate 0.059
TABLE 5. Method Detection Limits for each compound.

EPA Method 557 Quantitation of Haloacetic Acids, Bromate, and Dalapon in Drinking Water Using Ion Chromatography and Tandem Mass Spectrometry Jonathan R. Beck, Terri Christison, Hans Schweingruber, Charles T. Yang; Thermo Fisher Scientific, San Jose, CA, USA
Conclusion Reagent-Free IC systems coupled with an MS/MS detector is a powerful tool used
in the quantitation of haloacetic acid samples.
When compared to the conventional EPA methods using GC with electron capture, using the combination of the Dionex ICS-5000 ion chromatography system and the TSQ Endura triple quadrupole mass spectrometer to analyze for haloacetic acids saves analysts several hours of sample preparation.
The resolution between the matrix peaks and haloacetic acids is excellent, whichallows for minimum interference in detection, as well as ensuring a cleaner ion source of the mass spectrometer.
Excellent reproducibility and quantitation of HAAs was achieved when samples were spiked into a simulated matrix.
References 1. Microbial Health Effects Tables: Potential Adverse Health Effects from High/Long-
term Exposure to Hazardous Chemicals in Drinking Water; U.S. Environmental Protection Agency, 2002.
2. Method 552.1, Determination of Haloacetic Acids and Dalapon in Drinking Water by Ion Exchange Liquid-Solid Extraction and Gas Chromatography with Electron Capture Detection (Rev. 1.0); U.S. Environmental Protection Agency, 1992.
3. Method 552.2, Determination of Haloacetic Acids and Dalapon in Drinking Water by Liquid-Liquid Extraction, Derivatization, and Gas Chromatography with Electron Capture Detection (Rev. 1.0); U.S. Environmental Protection Agency, 1995.
4. Method 552.3, Determination of Haloacetic Acids and Dalapon in Drinking Water Liquid-Liquid Microextraction, Derivatization, and Gas Chromatography with Electron Capture Detection (Rev. 1.0); U.S. Environmental Protection Agency, 2003.
5. Method 557, Determination of Haloacetic Acids, Bromate, and Dalapon in Drinking Water by Ion Chromatography Electrospray Ionization Tandem Mass Spectrometry (IC-ESI-MS/MS) (Rev. 1.0); U.S. Environmental Protection Agency, 2009
6. Slingsby, R.; Saini, C.; Pohl, C.; Jack, R. The Measurement of Haloacetic Acids in Drinking Water Using IC-MS/MS–Method Performance. Presented at the Pittsburgh Conference, New Orleans, LA, March 2008.
OverviewPurpose: To demonstrate a simple and sensitive IC-MS/MS method for analyzing haloacetic acids, the pesticide dalapon, and bromate in water using EPA Method 557.
Methods: Direct injection of drinking water samples using IC-MS/MS.
Results: Quantitative analysis of nine haloacetic acids, bromate, and dalapon at sub ppb levels.
IntroductionHaloacetic acids (HAAs) are formed as disinfection byproducts when water ischlorinated to remove microbial content. Chlorine reacts with naturally occurring organicand inorganic matter in the water, such as decaying vegetation, to produce disinfection by-products (DBPs) that include HAAs. Of the nine species of HAAs, five are currently regulated by the EPA (HAA5): monochloroacetic acid (MCAA), dichloroacetic acid (DCAA), trichloroacetic acid (TCAA), monobromoacetic acid (MBAA), and dibromoaceticacid (DBAA). The remaining four HAAs are currently unregulated: bromochloroaceticacid (BCAA), bromodichloroacetic acid (BDCAA), dibromochloroacetic acid (DBCAA), and tribromoacetic acid (TBAA). However, they are also of health concern, and are often analyzed along with the HAA5. This method allows for the analysis of all nine HAAs, plus bromate and the pesticide dalapon in the same IC-MS/MS run without samplepreparation.
According to the U.S. Environmental Protection Agency (EPA), there is an increased risk of cancer associated with long-term consumption of water containing levels of HAAs that exceed 0.06 mg/L.1 EPA Methods 552.1, 552.2, and 552.3 are used to determine the level of all nine HAAs in drinking water.2,3,4 These methods require derivatization and multiple extraction steps followed by gas chromatography (GC) with electron capture detection (ECD).
By comparison to the conventional EPA methods using GC with ECD, the combination of ion chromatography and mass spectrometry (IC-MS and IC-MS/MS) offers sensitive and rapid detection without the need for sample pre-treatment. In order to develop a simple, easy-to-use direct-injection method, the U.S. EPA promulgated Method 5575 for theanalysis of haloacetic acids, bromate, and dalapon in drinking water by IC-MS/MS.
MethodsSample Preparation
Drinking water samples were collected from municipal tap water sources. NH4Cl was added as a preservative at 100 mg/L to all water samples. No further samplepreparation was performed prior to injection.
Ion Chromatography
IC analysis was performed on a Thermo Scientific™ Dionex™ ICS-5000 system. Samples were directly injected and no sample pre-treatment was required. The IC conditions used are shown in Table 1.
The sample is injected without cleanup or concentration onto a Thermo Scientific™ Dionex™ IonPac™ AS24 column specifically designed to separate method analytes from the following common anions (matrix components) in drinking water: chloride, carbonate, sulfate, and nitrate.
Hydroxide eluent is generated using an electrolytic eluent generation which providessmoother gradients than conventional pump proportioning valves, and a continuously regenerated trap column continuously removes contaminants to provide pure eluent throughout the run. A Thermo Scientific™ Dionex™ ASRS™ 300 Anion Self-Regenerating Suppressor™ is placed in line after the column and electrolyticallyconverts hydroxide eluent into water and simultaneously removes cations present in the drinking water and eluent. The gradient profile used is shown in Table 2. An overall schematic diagram of the system is shown in Figure 1.
TABLE 1. Ion chromatography system conditions.
TABLE 2. Electrolytically formed hydroxide gradient.
ResultsCalibrators and Simulated Sample Matrix
The separation of the nine HAAs and two other analytes is shown in Figure 2. This chromatogram is from the laboratory synthetic sample matrix (LSSM) fortified at 20 ppb. The LSSM is a prepared matrix of 250 mg/L each of chloride and sulfate, 150 mg/L of bicarbonate, 20 mg/L of nitrate, and 100 mg/L ammonium chloride preservative, for a total chloride concentration of 316 mg/L. All eleven compounds are shown in Figure 2.The selectivity of the IC-MS/MS system allows separation of the HAAs from common inorganic matrix ions. This allows matrix peaks of chloride, sulfate, nitrate, and bicarbonate to be diverted to waste during the analytical run and avoids premature fouling of the ESI-MS/MS instrument source. Figure 3 shows the conductivity detector response chromatogram. The response from the Cl–, SO4–, and NO3– can be seen in the trace. These ions do not coelute with the HAAs and are diverted to waste using the method controlled 6-port valve on the mass spectrometer. The IC stream is diverted to waste from 0–12 minutes, 16–22.75 minutes, 30–37 minutes, and from 48 minutes untilthe end of the run.
An internal standard mixture of 13C labeled MCAA, MBAA, DCAA, and TCAA was spiked into each sample at 4 ppb. All calibration standards were prepared in deionizedwater containing 100 mg/L NH4Cl as a preservative. The calibration curves were generated using internal standard calibrations for all of the HAA compounds in water. Excellent linearity results were observed for all compounds. Analytes were run at levels of 250 ppt to 20 ppb in a seven point calibration curve. All of the HAAs were detected at all concentration levels. It should be noted that TCAA sensitivity is very strongly correlated with the source temperature of the mass spectrometer as well as the columntemperature of the IC column. For this reason, the column temperature was maintainedat 15° C as specified in the EPA method. Additionally, to improve the TCAA detection, the effect of temperature of the MS source on TCAA’s response was tested. Temperatures of 200° C for both the ion transfer tube and vaporizer were found to be optimal for TCCA detection without impacting the detection of the other eight analytes. This phenomenon of TCAA temperature sensitivity has been reported in studies with other MS instrumentation configurations.6
Method detection limits were calculated by seven replicate injections of 0.5 ppb of eachanalyte and the equation MDL = t99% × S (n - 7), where: t is Student’s t at 99% confidence intervals (t99%, n = 7 = 3.143) and S is the standard deviation. These MDLs are listed in Table 5.
Tap Water Sample Analysis
Additionally, tap water from San Jose, CA, was analyzed for the presence of any of the analytes contained in the method. Tap water samples were collected in accordance with the EPA Method 557 procedure, with NH4Cl added as a preservative as it reacts with residual chlorine preventing further formation of haloacetic acids. Internal standards were added and the samples were quantified. The levels of each compound detected in the samples are shown in Table 7. The total amount of haloacetic acids for all nine HAAs was 35.62 ppb. For the regulated HAA5, the total was 30.21 ppb. The MCL set bythe U.S. EPA for the HAA5 is 0.060 mg/L. This sample was below that limit, at 0.03021 mg/L.
© 2015 Thermo Fisher Scientific Inc. All rights reserved. All trademarks are the property of Thermo FisherScientific and its subsidiaries. This information is not intended to encourage use of these products in any mannerthat might infringe the intellectual property rights of others.
A matrix diversion valve was placed in line prior to the mass spectrometer to divert thehigh sample matrix anions from the MS source that normally cause signal suppression in the MS. Thus the use of hydroxide eluent and suppression in the Reagent-Free IC system is more powerful for the separation and detection of organic acids than reversedphase separations that require acidic addition (to protonate the compounds to acetic acids) or addition of stabilizing salts, both of which undermine analysis. Isopropyl alcohol was added into the eluent stream via a mixing T immediately after the matrix diversion valve. The isopropyl alcohol was added at a flow rate of 0.2 mL/min. The isopropyl alcohol had two main purposes: to assist in the desolvation of the mobile phase and to act as a makeup flow when the IC eluent was diverted to waste. Acetonitrile can also be used instead of isopropyl alcohol, however the lower cost of isopropyl alcohol is an advantage to the chemist.
Mass Spectrometry
MS analysis was carried out on a Thermo Scientific™ TSQ Endrua™ triple stage quadrupole mass spectrometer with a heated electrospray ionization (H-ESI-II) probe. The MS conditions used are shown in Table 3.
Individual standards were infused into the mass spectrometer to determine optimum RFlens settings and collision energies for the product ions. Table 4 describes the MS conditions for specific HAAs, dalapon, bromate, and internal standards.
Data Analysis
Data acquisition and processing were carried out using Thermo Scientific™ TraceFinder™ software version 3.2.
TABLE 4. Optimized MS transitions for each compound analyzed in this experiment. As per the EPA method, only one product ion was monitored for each precursor ion.
Column Dionex IonPac AG24 (2 × 50 mm), IonPac AS24 (2 × 250mm)Suppressor ASRS 300 2mmColumn Temperature 15° CInjection Volume 100 uLFlow Rate 0.3 mL/min KOH gradient, electrolytically generated
Analyte Q1 (m/z) Q3 (m/z) RF lens (V) CE (V)MCAA 92.9 35.0 67 10MBAA 136.9 79.0 60 13DCAA 126.9 82.9 70 10DBAA 216.8 172.8 72 12BCAA 172.9 128.9 70 11TCAA 160.9 116.9 45 8BDCAA 162.9 81.0 60 10DBCAA 206.9 81.0 90 16TBAA 252.8 81.0 70 17Dalapon 140.9 96.8 56 7Bromate 126.9 110.9 90 22MCAA-ISTD 94.0 35.0 67 10MBAA-ISTD 138.0 79.0 60 13DCAA-ISTD 128.0 84.0 70 10TCAA-ISTD 162.0 118 45 8
Retention Time (min) [KOH] mM0.0 7.015.1 7.030.8 18.031 6046 6047 758 7
ConductivityDetector
Waste
Eluent Generator
ColumnGuard
SuppressorPump
Water
AuxPump
OrganicSolvent
Diverter Valve
Waste
MS/MS
FIGURE 1. Schematic diagram of the flow path of the IC-MS/MS system.
Parameter ValueIon Source Polarity Negative Ion ModeSpray Voltage 3200 VVaporizer Gas Pressure 45 units N2
Auxiliary Gas Pressure 10 units N2
Capillary Temperature 200 CVaporizer Temperature 200 CCollision Gas Pressure 1.5 mTorr ArgonIon Cycle Time 0.5 seconds
TABLE 3. Mass Spectrometer Source Conditions.
FIGURE 2. Laboratory synthetic sample matrix (LSSM) spiked with 20 ppb haloacetic acids, bromate, and dalapon. The internal standard peaks are not shown. From top to bottom, MCAA, MBAA, bromate, dalapon, DCAA, BCAA, DBAA, TCAA, BDCAA, DBCAA, and TBAA.
FIGURE 3. Conductivity detector response showing signals from LSSM salts.
Analyte MDL (ppb) MCAA 0.105
MBAA 0.104
DCAA 0.044
DBAA 0.021
BCAA 0.059
TCAA 0.033
BDCAA 0.141
DBCAA 0.214
TBAA 0.159
Dalapon 0.050
Bromate 0.059
TABLE 5. Method Detection Limits for each compound.
Africa +43 1 333 50 34 0 Australia +61 3 9757 4300 Austria +43 810 282 206 Belgium +32 53 73 42 41Canada +1 800 530 8447China 800 810 5118 (free call domestic)
400 650 5118 PN64430-EN 0716S
Denmark +45 70 23 62 60Europe-Other +43 1 333 50 34 0Finland +358 10 3292 200France +33 1 60 92 48 00Germany +49 6103 408 1014India +91 22 6742 9494Italy +39 02 950 591
Japan +81 45 453 9100Korea +82 2 3420 8600Latin America +1 561 688 8700Middle East +43 1 333 50 34 0Netherlands +31 76 579 55 55New Zealand +64 9 980 6700Norway +46 8 556 468 00
Russia/CIS +43 1 333 50 34 0Singapore +65 6289 1190Spain +34 914 845 965Sweden +46 8 556 468 00Switzerland +41 61 716 77 00UK +44 1442 233555USA +1 800 532 4752
www.thermoscientific.com©2016 Thermo Fisher Scientifi c Inc. All rights reserved. All trademarks are the property of Thermo Fisher Scientifi c and its subsidiaries. This information is presented as an example of the capabilities of Thermo Fisher Scientifi c products. It is not intended to encourage use of these products in any manners that might infringe the intellectual property rights of others. Specifi cations, terms and pricing are subject to change. Not all products are available in all countries. Please consult your local sales representative for details.