method 552.2 determination of haloacetic acids …
TRANSCRIPT

552.2-1
METHOD 552.2 DETERMINATION OF HALOACETIC ACIDS AND DALAPON IN DRINKINGWATER BY LIQUID-LIQUID EXTRACTION, DERIVATIZATION AND GASCHROMATOGRAPHY WITH ELECTRON CAPTURE DETECTION.
Revision 1.0
J.W. Hodgeson (USEPA), J. Collins and R.E. Barth (Technology Applications Inc.) - Method552.0, (1990)
J.W. Hodgeson (USEPA), D. Becker (Technology Applications Inc.) - Method 552.1, (1992)
D.J. Munch, J.W. Munch (USEPA) and A.M. Pawlecki (International Consultants, Inc.), Method552.2, Rev. 1.0, (1995)
NATIONAL EXPOSURE RESEARCH LABORATORYOFFICE OF RESEARCH AND DEVELOPMENT
U.S. ENVIRONMENTAL PROTECTION AGENCYCINCINNATI, OHIO 45268

552.2-2
METHOD 552.2 DETERMINATION OF HALOACETIC ACIDS AND DALAPONIN DRINKING WATER BY LIQUID-LIQUID EXTRACTION, DERIVATIZATIONAND GAS CHROMATOGRAPHY WITH ELECTRON CAPTURE DETECTION
1. SCOPE AND APPLICATION
1.1 This is a gas chromatographic (GC) method (1-8) applicable to the determination of thelisted halogenated acetic acids in drinking water, ground water, raw source water andwater at any intermediate treatment stage. In addition, the chlorinated herbicide,Dalapon, may be determined using this method.
Chemical Abstract Services Analyte Registry Number
Bromochloroacetic Acid (BCAA) 5589-96-3Bromodichloroacetic Acid (BDCAA) 7113-314-7Chlorodibromoacetic Acid (CDBAA) 5278-95-5Dalapon 75-99-0Dibromoacetic Acid (DBAA) 631-64-1Dichloroacetic Acid (DCAA) 79-43-6Monobromoacetic Acid (MBAA) 79-08-3Monochloroacetic Acid (MCAA) 79-11-8Tribromoacetic Acid (TBAA) 75-96-7Trichloroacetic Acid (TCAA) 76-03-9
1.2 This method is applicable to the determination of the target analytes over theconcentration ranges typically found in drinking water (1,2,4). Experimentallydetermined method detection limits (MDLs) for the above listed analytes are providedin Table 2. Actual MDLs may vary according to the particular matrix analyzed and thespecific instrumentation employed. The haloacetic acids are observed ubiquitously inchlorinated drinking water supplies at concentrations ranging from <1 to >50 :g/L.
1.3 This method is designed for analysts skilled in liquid-liquid extractions, derivatizationprocedures and the use of GC and interpretation of gas chromatograms. Each analystmust demonstrate the ability to generate acceptable results with this method using theprocedure described in Section 9.3.
1.4 When this method is used for the analyses of waters from unfamiliar sources, it isstrongly recommended that analyte identifications be confirmed by GC using a dissimi-lar column or by GC/MS if concentrations are sufficient.
2. SUMMARY OF METHOD
2.1 A 40-mL volume of sample is adjusted to pH <0.5 and extracted with 4-mL of methyl-tert-butyl-ether (MTBE). The haloacetic acids that have been partitioned into theorganic phase are then converted to their methyl esters by the addition of acidic

552.2-3
methanol followed by slight heating. The acidic extract is neutralized by a back-extraction with a saturated solution of sodium bicarbonate and the target analytes areidentified and measured by capillary column gas chromatography using an electroncapture detector (GC/ECD). Analytes are quantitated using procedural standardcalibration.
3. DEFINITIONS
3.1 INTERNAL STANDARD (IS) -- A pure analyte(s) added to a sample, extract, or stan-dard solution in known amount(s) and used to measure the relative responses of othermethod analytes and surrogates thatare components of the same sample or solution. The internal standard must be an analyte that is not a sample component.
3.2 SURROGATE ANALYTE (SA) -- A pure analyte(s), which is extremely unlikely to befound in any sample, and which is added to a sample aliquot in known amount(s)before extraction or other processing and is measured with the same procedures usedto measure other sample components. The purpose of the SA is to monitor methodperformance with each sample.
3.3 LABORATORY DUPLICATES (LD1 AND LD2) -- Two aliquots of the same sampledesignated as such in the laboratory. Each aliquot is extracted, derivatized andanalyzed separately with identical procedures. Analyses of LD1 and LD2 indicate theprecision associated with laboratory procedures, but not with sample collection,preservation, or storage procedures.
3.4 FIELD DUPLICATES (FD1 AND FD2) -- Two separate samples collected at the sametime and place under identical circumstances and treated exactly the same throughoutfield and laboratory procedures. Analyses of FD1 and FD2 give a measure of theprecision associated with sample collection, preservation and storage, as well as withlaboratory procedures.
3.5 LABORATORY REAGENT BLANK (LRB) -- An aliquot of reagent water or other blankmatrix that are treated exactly as a sample including exposure to all glassware,equipment, solvents, reagents, internal standards, and surrogates that are used withother samples. The LRB is used to determine if method analytes or other interferencesare present in the laboratory environment, the reagents, or the apparatus.
3.6 FIELD REAGENT BLANK (FRB) -- An aliquot of reagent water or other blank matrixthat is placed in a sample container in the laboratory and treated as a sample in allrespects, including shipment to the sampling site, exposure to sampling site conditions,storage, preservation and all analytical procedures. The purpose of the FRB is todetermine if method analytes or other interferences are present in the field environ-ment.
3.7 LABORATORY FORTIFIED BLANK (LFB) -- An aliquot of reagent water or other blankmatrix to which known quantities of the method analytes are added in the laboratory.

552.2-4
The LFB is analyzed exactly like a sample, and its purpose is to determine whether themethodology is in control, and whether the laboratory is capable of making accurateand precise measurements.
3.8 LABORATORY FORTIFIED SAMPLE MATRIX (LFM) -- An aliquot of an environmentalsample to which known quantities of the method analytes are added in the laboratory. The LFM is analyzed exactly like a sample, and its purpose is to determine whether thesample matrix contributes bias to the analytical results. The background concentrations of the analytes in the sample matrix must be determined in a separatealiquot and the measured values in the LFM corrected for background concentrations.
3.9 STOCK STANDARD SOLUTION (SSS) -- A concentrated solution containing one ormore method analytes prepared in the laboratory using assayed reference materials orpurchased from a reputable commercial source.
3.10 PRIMARY DILUTION STANDARD SOLUTION (PDS) -- A solution of several analytesprepared in the laboratory from stock standard solutions and diluted as needed to pre-pare calibration solutions and other needed analyte solutions.
3.11 CALIBRATION STANDARD (CAL) -- A solution prepared from the primary dilutionstandard solution and stock standard solutions of the internal standards and surrogateanalytes. The CAL solutions are used to calibrate the instrument response with respectto analyte concentration.
3.12 QUALITY CONTROL SAMPLE (QCS) -- A solution of method analytes of knownconcentration which is used to fortify an aliquot of reagent water or sample matrix. The QCS is obtained from a source external to the laboratory and different from thesource of calibration standards. It is used to check laboratory performance with externally prepared test materials.
3.13 LABORATORY PERFORMANCE CHECK SOLUTION (LPC) -- A solution of select-ed method analytes used to evaluate the performance of the instrumental system withrespect to a defined set of method criteria.
3.14 METHOD DETECTION LIMIT (MDL) -- The minimum concentration of an analyte thatcan be identified, measured and reported with 99% confidence that the analyteconcentration is greater than zero.
3.15 MATERIAL SAFETY DATA SHEET (MSDS) -- Written information provided by vendorsconcerning a chemical's toxicity, health hazards, physical properties, fire and reactivitydata including storage, spill, and handling precautions.
3.16 ESTIMATED DETECTION LIMIT (EDL) -- Defined as either the MDL or a level of acompound in a sample yielding a peak in the final extract with a signal to noise (S/N)ratio of approximately 5, whichever is greater.

552.2-5
3.17 PROCEDURAL STANDARD CALIBRATION -- A calibration method where aqueouscalibration standards are prepared and processed (e.g. purged, extracted and/orderivatized) in exactly the same manner as a sample. All steps in the process fromaddition of sampling preservatives through instrumental analyses are included in thecalibration. Using procedural standard calibration compensates for any inefficiencies inthe processing procedure.
3.18 CONTINUING CALIBRATION CHECK (CCC) -- A calibration standard containing one ormore method analytes, which is analyzed periodically to verify the accuracy of theexisting calibration curves or response factors for those analytes.
4. INTERFERENCES
4.1 Method interferences may be caused by contaminants in solvents, reagents, glasswareand other sample processing apparatus that lead to discrete artifacts or elevatedbaselines in chromatograms. All reagents and apparatus must be routinely demon-strated to be free from interferences under the conditions of the analysis by analyzinglaboratory reagent blanks as described in Section 9.5. Subtracting blank values fromsample results is not permitted.
4.1.1 Glassware must be scrupulously cleaned. Clean all glassware as soon aspossible after use by thoroughly rinsing with the last solvent used in it. Followby washing with hot water and detergent and thorough rinsing with tap waterand reagent water. Drain and heat in an oven or muffle furnace at 400°C for1 hr. Do not heat volumetric ware but instead rinse three times with HPLCgrade or better acetone. Thorough rinsing with reagent grade acetone may besubstituted for the heating provided method blank analysis confirms nobackground interferant contamination is present. Thermally stable materialssuch as PCBs may not be eliminated by these treatments. After drying andcooling, store glassware in a clean environment free of all potential contamina-tion. To prevent any accumulation of dust or other contaminants, store glass-ware inverted or capped with aluminum foil.
4.1.2 The use of high purity reagents and solvents helps to minimize interferenceproblems. Each new bottle of solvent should be analyzed before use. Aninterference free solvent is a solvent containing no peaks yielding data at $MDL (Table 2) and at the retention times of the analytes of interest. Purifica-tion of solvents by distillation in all-glass systems may be required.
4.2 Interfering contamination may occur when a sample containing low concentrations ofanalytes is analyzed immediately following a sample containing relatively high concen-trations of analytes. Routine between-sample rinsing of the sample syringe andassociated equipment with MTBE can minimize sample cross-contamination. After analysis of a sample containing high concentrations of analytes, one or more injectionsof MTBE should be made to ensure that accurate values are obtained for the nextsample.

552.2-6
4.3 Matrix interferences may be caused by contaminants that are coextracted from thesample. The extent of matrix interferences will vary considerably from source tosource, depending upon the water sampled. Analyte identifications should be con-firmed using the confirmation column specified in Table 1 or by GC/MS if the concen-trations are sufficient.
4.4 Bromochloroacetic acid coelutes with an interferant on the DB-1701 confirmationcolumn. The interferant has been tentatively identi-fied as dimethyl sulfide. However,because of the difference in peak shapes, the peak for the ester of BCAA tends to "rideon" the interferant peak and quantitative confirmation can be performed by manualintegration that includes only the peak area of the target ester.
4.5 Methylation using acidic methanol results in a partial decarboxylation of tribromoaceticacid (8). Therefore a substantial peak for bromoform will be observed in thechromatograms. Its elution does not, however, interfere with any other analytes. Furthermore, this demonstrates the need for procedural standards to establish the cali-bration curve by which unknown samples are quantitated.
5. SAFETY
5.1 The toxicity or carcinogenicity of each reagent used in this method has not beenprecisely defined; however, each chemical compound must be treated as a potentialhealth hazard. From this viewpoint, exposure to these chemicals must be minimized. The laboratory is responsible for maintaining a current awareness file of OSHA regula-tions regarding the safe handling of the chemicals specified in this method. A refer-ence file of material safety data sheets should also be made available to all personnelinvolved in the chemical analysis. Additional references to laboratory safety areavailable and have been identified (9-11) for the information of the analyst.
5.2 The toxicity of the extraction solvent, MTBE, has not been well defined. Susceptibleindividuals may experience adverse affects upon skin contact or inhalation of vapors. Therefore protective clothing and gloves should be used and MTBE should be used onlyin a chemical fume hood or glove box. The same precaution applies to pure standardmaterials.

552.2-7
6. APPARATUS AND EQUIPMENT
6.1 SAMPLE CONTAINERS -- Amber glass bottles, approximately 50 mL, fitted withTeflon-lined screw caps.
6.2 EXTRACTION VIALS -- 60 mL clear glass vials with teflon-lined screw caps.
6.3 VIALS -- Autosampler, 2.0 mL vials with screw or crimp cap and a teflon-faced seal.
6.4 STANDARD SOLUTION STORAGE CONTAINERS -- 10-20 ml amber glass vials with teflon lined-screw caps.
6.5 GRADUATED CONICAL CENTRIFUGE TUBES WITH TEFLON-LINED SCREW CAPS --15-mL with graduated 1 mL markings.
6.6 BLOCK HEATER (or SAND BATH) -- Capable of holding screw cap conical centrifugetubes in Section 6.4.
6.7 PASTEUR PIPETS -- Glass, disposable.
6.8 PIPETS -- 2.0 mL and 4.0 mL, type A, TD, glass.
6.9 VOLUMETRIC FLASKS -- 5 ml, 10 mL.
6.10 MICRO SYRINGES -- 10 :L, 25 :L, 50 :L, 100 :L, 250 :L, 500 :L and 1000 :L.
6.11 BALANCE -- analytical, capable of weighing to 0.0001 g.
6.12 GAS CHROMATOGRAPH -- Analytical system complete with gas chromatographequipped for electron capture detection, split/splitless capillary or direct injection,temperature programming, differential flow control, and with all required accessoriesincluding syringes, analytical columns, gases and strip-chart recorder. A data system isrecommended for measuring peak areas. An autoinjector is recommended for im-proved precision of analyses. The gases flowing through the electron capture detectorshould be vented through the laboratory fume hood system.
6.13 PRIMARY GC COLUMN -- DB-5.625 [fused silica capillary with chemically bonded(5% phenyl)-methylpolysiloxane)] or equivalent bonded, fused silica column, 30m x0.25mm ID, 0.25 :m film thickness.
6.14 CONFIRMATION GC COLUMN -- DB-1701 [fused silica capillary with chemicallybonded (14% cyanopropylphenyl)-methylpolysiloxane)] or equivalent bonded, fusedsilica column, 30 m x 0.25 mm ID, 0.25 :m film thickness.
552.2-8
7. REAGENTS AND STANDARDS
7.1 REAGENT WATER -- Reagent water is defined as a water in which an interference isnot observed $ to the MDL of each analyte of interest.
7.1.1 A Millipore Super-Q water system or its equivalent may be used to generatedeionized reagent water. Distilled water that has been passed throughgranular charcoal may also be suitable.
7.1.2 Reagent water is monitored through analysis of the labora-tory reagent blank (Section 9.5).
7.2 SOLVENTS
7.2.1 METHYL-TERT-BUTYL ETHER -- High purity, demonstrated to be free of analytes and interferences, redistilled in glass if necessary.
7.2.2 METHANOL -- High purity, demonstrated to be free of analytes and interferences.
7.2.3 ACETONE -- High purity, demonstrated to be free of analytes and interferences.
7.3 REAGENTS
7.3.1 SODIUM SULFATE, Na2SO4 -- (ACS) granular, anhydrous. If interferences areobserved, it may be necessary to heat the sodium sulfate in a shallow tray at400oC for up to 4 hr. to remove phthalates and other interfering organic sub-stances. Alternatively, it can be extracted with methylene chloride in aSoxhlet apparatus for 48 hr. Store in a capped glass bottle rather than aplastic container.
7.3.2 COPPER II SULFATE PENTAHYDRATE, CuSO4.5H2O -- ACS reagent
grade.
7.3.3 SODIUM BICARBONATE, NaHCO3 -- ACS reagent grade.
7.3.4 AMMONIUM CHLORIDE, NH4Cl -- ACS reagent grade, used to convertfree chlorine to monochloramine. Although this is not the traditionaldechlorination mechanism, ammonium chloride is categorized as adechlorinating agent in this method.
7.4 SOLUTIONS
7.4.1 10% H2SO4/METHANOL SOLUTION -- Use caution when preparingsulfuric acid solutions. To prepare a 10% solution, add 5 mL sulfuric

552.2-9
acid dropwise (due to heat evolution) to 20-30 mL methanol containedin a 50.0 mL volumetric flask that has been placed in a cooling bath. Then dilute to the 50.0 mL mark with methanol.
7.4.2 SATURATED SODIUM BICARBONATE SOLUTION -- Add sodiumbicarbonate to a volume of water, mixing periodically until the solutionhas reached saturation.
7.5 STANDARDS
7.5.1 1,2,3-TRICHLOROPROPANE, 99+% -- For use as the internal standard. Prepare an internal standard stock standard solution of 1,2,3-trichloropropanein MTBE at a concentration of approximately 1 mg/mL. From this stockstandard solution, prepare a primary dilution standard in MTBE at aconcentration of 25 :g/mL.
7.5.2 2,3-DIBROMOPROPIONIC ACID, 99+% -- For use as a surrogate compound. Prepare a surrogate stock standard solution of 2,3-dibromopropionic acid inMTBE at a concentration of approximately 1 mg/mL. From this stockstandard solution, prepare a primary dilution standard in MTBE at aconcentration of 10 :g/mL.
7.5.3 STOCK STANDARD SOLUTION (SSS)
Prepare separate stock standard solutions for each analyte of interest at aconcentration of 1-5 mg/mL in MTBE. Method analytes may be obtained asneat materials or ampulized solutions (> 99% purity) from a number ofcommercial suppliers. These stock standard solutions should be stored at -10oC and protected from light. They are stable for at least one month butshould be checked frequently for signs of evaporation.
7.5.3.1. For analytes which are solids in their pure form, prepare stock
standard solutions by accurately weighing approximately 0.01to 0.05 grams of pure material in a 10.0 mL volumetric flask. Dilute to volume with MTBE. When a compound purity is assayedto be 96% or greater, the weight can be used without correction tocalculate the concentration of the stock standard.
7.5.3.2. Stock standard solutions for analytes which are liquid in theirpure form at room temperature can be accurately prepared in thefollowing manner.
7.5.3.3. Place about 9.8 mL of MTBE into a 10.0 mL volumetric flask. Allow the flask to stand, unstoppered, for about 10 minutes toallow solvent film to evaporate from the inner walls of thevolumetric, and weigh to the nearest 0.1 mg.

552.2-10
7.5.3.4. Use a 10 :L syringe and immediately add 10.0 :L of standardmaterial to the flask by keeping the syringe needle just above thesurface of the MTBE. Be sure that the standard material fallsdropwise directly into the MTBE without contacting the inner wallof the volumetric.
7.5.3.5. Reweigh, dilute to volume, stopper, then mix by inverting the flaskseveral times. Calculate the concentration in milligrams permilliliter from the net gain in weight.
7.5.4 PRIMARY DILUTION STANDARD (PDS) -- Prepare the primary dilutionstandard solution by combining and diluting stock standard solutions withMTBE (the surrogate stock standard solution was prepared in Section 7.5.2). This primary dilution standard solution should be stored at -10°C andprotected from light. It is stable for at least one month but should be checkedbefore use for signs of evaporation. As a guideline to the analyst, the primarydilution standard solution used in the validation of this method is describedbelow.
Concentration, :g/mL
Monochloroacetic AcidMonobromoacetic AcidDalaponDichloroacetic AcidTrichloroacetic AcidBromochloroacetic AcidDibromoacetic AcidBromodichloroacetic AcidChlorodibromoacetic AcidTribromoacetic Acid2,3-Dibromopropionic Acid (surr.)
6040406020402040
100200100
This primary dilution standard is used to prepare calibration standards, whichcomprise five concentration levels of each analyte with the lowest standardbeing at or near the MDL of each analyte. The concentrations of the otherstandards should define a range containing the expected sampleconcentrations or the working range of the detector.
NOTE: When purchasing commercially prepared standards, solutionsprepared in methanol must not be used because it has been found that thehaloacetic acids are subject to spontaneous methylation when stored in thissolvent (12). Furthermore, tribromoacetic acid has been found to be unstablein methanol because it undergoes decarboxylation when stored in this solvent.

552.2-11
7.5.4.1. Include the surrogate analyte, 2,3-dibromopropionic acid, withinthe primary dilution standard prepared in Section 7.5.4. Byincorporating the surrogate into the primary dilution standard, it isdiluted alongside the target analytes in the standard calibrationcurve. This is done so that the peaks for the surrogate and theester of chlorodibromo-acetic acid, which elute fairly closely, arerelatively close in size and adequate resolution is therefore insured. Furthermore, if a sample should have a very large concentration ofchlorodibromo-acetic acid, it may be impossible to obtain anaccurate measurement of surrogate recovery. If this happens,reextraction with a higher surrogate concentration would be anoption.
7.5.6 LABORATORY PERFORMANCE CHECK STANDARD (LPC) -- A low levelcalibration standard can serve as the LPC standard.
8. SAMPLE COLLECTION, PRESERVATION AND STORAGE
8.1 SAMPLE VIAL PREPARATION
8.1.1 Grab samples must be collected in accordance with conventional samplingpractices (13) using amber glass containers with TFE-lined screw-caps andcapacities of at least 50 ml.
8.1.2 Prior to shipment to the field, add crystalline or granular ammonium chloride(NH4Cl) to the sample container in an amount to produce a concentration of100 mg/L in the sample. For a typical 50 mL sample, 5 mg of ammoniumchloride is added.
NOTE: Enough ammonium chloride must be added to the sample to convertthe free chlorine residual in the sample matrix to combined chlorine. Typically,the ammonium chloride concentration here will accomplish that. If highdoses of chlorine are used, additional ammonium chloride may be required.
8.2 SAMPLE COLLECTION
8.2.1 Fill sample bottles to just overflowing but take care not to flush out theammonium chloride.
8.2.2 When sampling from a water tap, open the tap and allow the system to flushuntil the water temperature has stabilized (usually about 3-5 minutes). Remove the aerator so that no air bubbles can be visibly detected and collectsamples from the flowing system.
8.2.3 When sampling from an open body of water, fill a 1-quart wide-mouth bottleor 1-liter beaker with sample from a representative area, and carefully fillsample vials from the container.

552.2-12
8.2.4 After collecting the sample in the bottle containing the ammoniumchloride, seal the bottle and agitate by hand for 1 min.
8.3 SAMPLE STORAGE/HOLDING TIMES
8.3.1 Samples must be iced or refrigerated at 4oC and maintained at theseconditions away from light until extraction. Synthetic ice (i.e., blue ice) is notrecommended. Holding studies performed to date have suggested that, insamples preserved with NH4Cl, the analytes are stable for up to 14 days. Since stability may be matrix dependent, the analyst should verify that theprescribed preservation technique is suitable for the samples under study.
8.3.2 Extracts (Section 11.2.7) must be stored at 4oC or less away from light inglass vials with Teflon-lined caps. Extracts must be analyzed within 7 daysfrom extraction if stored at 4°C or within 14 days if stored at -10°C or less.
9. QUALITY CONTROL
9.1 Each laboratory that uses this method is required to operate a formal quality control(QC) program. Minimum quality control requirements are monitoring the laboratoryperformance check standard, initial demonstration of laboratory capability, performanceof the method detection limit study, analysis of laboratory reagent blanks andlaboratory fortified sample matrices, determination of surrogate compound recoveriesin each sample and blank, monitoring internal standard peak area or height in eachsample, blank and CCC, and analysis of QC samples. Additional QC practices may beadded.
9.2 LABORATORY PERFORMANCE CHECK STANDARD (LPC)
At the beginning of an analysis set, prior to any calibration standard or sample analysisand after an initial solvent analysis, a laboratory performance check standard must beanalyzed. This check standard insures proper performance of the GC by evaluation ofthe instrument parameters of detector sensitivity, peak symmetry, and peak resolution. It furthermore serves as a check on the continuity of the instrument's performance. Inregards to sensitivity, it allows the analyst to ascertain that this parameter has notchanged drastically since the analysis of the MDL study. Inability to demonstrateacceptable instrument performance indicates the need for re-evaluation of theinstrument system. Criteria are listed in Table 8.
9.2.1 The sensitivity requirement is based on the EDLs published in this method. Iflaboratory EDLs differ from those listed in Table 2, concentrations of the LPCstandard may be adjusted to be compatible with the laboratory EDLs.
9.2.2 If column or chromatographic performance cannot be met, one or more of thefollowing remedial actions should be taken. Break off approximately 1 meterof the injector end of the column and re-install, install a new column, adjustcolumn flows or modify the oven temperature program.

552.2-13
9.3 INITIAL DEMONSTRATION OF CAPABILITY (IDC)
9.3.1 Calibrate for each analyte of interest as specified in Section 10. Select arepresentative fortification concentration for each of the target analytes. Concentrations near those in Table 4 are recommended. Prepare 4-7replicates laboratory fortified blanks by adding an appropriate aliquot of theprimary dilution standard or quality control sample to reagent water. (Thisreagent water should contain ammonium chloride at the same concentrationas that specified for samples as per Section 8.1.2.) Analyze the LFBsaccording to the method beginning in Section 11.
9.3.2 Calculate the mean percent recovery and the standard deviation of therecoveries. For each analyte, the mean recovery value, expressed as apercentage of the true value, must fall in the range of 80-120% and therelative standard deviation should be less than 20%. For those compoundsthat meet these criteria, performance is considered acceptable and sampleanalysis may begin. For those compounds that fail these criteria, thisprocedure must be repeated using 4-7 fresh samples until satisfactoryperformance has been demonstrated. Maintain these data on file to demon-strate initial capabilities.
9.3.3 Furthermore, before processing any samples, the analyst must analyze at leastone laboratory reagent blank to demonstrate that all glassware and reagentinterferences are under control.
9.3.4 The initial demonstration of capability is used primarily to preclude alaboratory from analyzing unknown samples via a new, unfamiliar methodprior to obtaining some experience with it. As laboratory personnel gainexperience with this method, the quality of data should improve beyond thoserequired here.
9.3.5 The analyst is permitted to modify GC columns, GC conditions, internalstandard or surrogate compounds. Each time such method modifications aremade, the analyst must repeat the procedures in Section 9.3.1 throughSection 9.3.4 and Sect. 9.4.
9.4 METHOD DETECTION LIMIT STUDY (MDL)
9.4.1. Prior to the analysis of any field samples, the method detection limits must bedetermined. Initially, estimate the concentration of an analyte which wouldyield a peak equal to 5 times the baseline noise and drift. Prepare sevenreplicate laboratory fortified blanks at this estimated concentration withreagent water that contains ammonium chloride at the same concentration asthat specified for samples as per Section 8.1.2. Analyze the LFB's accordingto the method beginning in Section 11.

552.2-14
9.4.2. Calculate the mean recovery and the standard deviation for each analyte. Multiply the student's t value at 99% confidence and n-1 degrees of freedom(3.143 for seven replicates) by this standard deviation to yield a statisticalestimate of the detection limit. This calculated value is the MDL.
9.4.3. Since the statistical estimate is based on the preci- sion of the analysis, anadditional estimate of detection can be determined based upon the noise anddrift of the baseline as well as precision. This estimate is the EDL (Table 2).
9.5 LABORATORY REAGENT BLANKS (LRB) -- Each time a set of samples is extracted orreagents are changed, a LRB must be analyzed. If the LRB produces an interferantpeak within the retention time window (Section 12.3) of any analyte that wouldprevent the determination of that analyte or a peak of concentration greater than theMDL for that analyte, the analyst must determine the source of contamination andeliminate the interference before processing samples. Field samples of an extractionset associated with an LRB that has failed the specified criteria are considered suspect.
NOTE: Reagent water containing ammonium chloride at the same concentrations as inthe samples (Section 8.1.2) is used to prepare the LRB.
9.6 LABORATORY FORTIFIED BLANK (LFB) -- Since this method utilizes proceduralcalibration standards, which are fortified reagent water, there is no difference betweenthe LFB and the continuing calibration check standard. Consequently, the analysis ofan LFB is not required (Section 10.2).
9.7 LABORATORY FORTIFIED SAMPLE MATRIX (LFM)
9.7.1 Chlorinated water supplies will usually contain significant backgroundconcentrations of several method analytes, especially dichloroacetic acid(DCAA) and trichloroacetic acid (TCAA). The concentrations of these acidsmay be equal to or greater than the fortified concentrations. Relatively pooraccuracy and precision may be anticipated when a large background must besubtracted. For many samples, the concentrations may be so high thatfortification may lead to a final extract with instrumental responses exceedingthe linear range of the electron capture detector. If this occurs, the extractmust be diluted. In spite of these problems, sample sources should befortified and analyzed as described below. By fortifying sample matrices andcalculating analyte recoveries, any matrix induced analyte bias is evaluated.
9.7.2. The laboratory must add known concentrations of analytes to one sample per
extraction set or a minimum of 10% of the samples, whichever is greater. The concentrations should be equal to or greater than the backgroundconcentrations in the sample selected for fortification. If the fortification levelis less than the background concentration, recoveries are not reported. Overtime, samples from all routine sample sources should be fortified.

552.2-15
9.7.3 Calculate the mean percent recovery, R, of the concentration for each analyte,after correcting the total mean measured concentration, A, from the fortifiedsample for the back-ground concentration, B, measured in the unfortifiedsample, i.e.:
R = 100 (A - B) / C,
where C is the fortifying concentration. In order for the recoveries to beconsidered acceptable, they must fall between 70% and 130% for all thetarget analytes.
9.7.4 If a recovery falls outside of this acceptance range, a matrix induced bias canbe assumed for the respective analyte and the data for that analyte must bereported to the data user as suspect due to matrix effects.
9.8 ASSESSING SURROGATE RECOVERY
The surrogate analyte is fortified into the aqueous portion of all continuing calibrationstandards, samples and laboratory reagent blanks. The surrogate is a means of assess-ing method performance in every analysis from extraction to final chromatographicperformance. 9.8.1 When surrogate recovery from a sample, blank or CCC is < 70% or > 130%,
check (1) calculations to locate possible errors, (2) standard solutions fordegradation, (3) contamination, and (4) instrument performance. If thosesteps do not reveal the cause of the problem, reanalyze the extract.
9.8.2 If the extract reanalysis meets the surrogate recovery criterion, report only datafor the reanalyzed extract.
9.8.3 If the extract reanalysis fails the 70-130% recovery criterion, the analyst
should check the calibration by analyzing the most recently acceptablecontinuing calibration check standard. If the CCC fails the criteria of Section10.2.1, recalibration is in order per Section 10.1. If the CCC is acceptable, itmay be necessary to extract another aliquot of sample. If the sample re-extract also fails the recovery criterion, report all data for that sample assuspect.
9.9 ASSESSING THE INTERNAL STANDARD
9.9.1. The analyst must to monitor the IS response (peak area or peak height) of allinjections during each analysis day. A mean IS response should bedetermined from the five point calibration curve. The IS response for any runshould not deviate from this mean IS response by more than 30%. It is alsoacceptable if the IS response of a injection is within 15% of the dailycontinuing calibration standard IS response.

552.2-16
9.9.2 If a deviation greater than this occurs with an individual extract, optimizeinstrument performance and inject a second aliquot of that extract.
9.9.2.1 If the reinjected aliquot produces an acceptable internal standardresponse, report results for that aliquot.
9.9.2.2 If a deviation of greater than 30% is obtained for the reinjectedextract, the analyst should check the calibration by analyzing themost recently acceptable CCC. If the CCC fails the criteria ofSection 10.2.1, recalibration is in order per Section 10.1. If theCCC is acceptable, analysis of the sample should be repeated be-ginning with Section 11, provided the sample is still available. Otherwise, report results obtained from the reinjected extract, butannotate as suspect.
9.10 QUALITY CONTROL SAMPLE (QCS) -- At least quarterly, analyze a QCS from anexternal source. If measured analyte concentrations are not of acceptable accuracy,check the entire analytical procedure to locate and correct the problem source.
9.11 The laboratory may adapt additional QC practices for use with this method. Thespecific practices that are most productive depend upon the needs of the laboratoryand the nature of the samples. For example, field or laboratory duplicates may be ana-lyzed to assess the precision of the environmental measurements or field reagentblanks may be used to assess contamination of samples under site conditions,transportation and storage.
10. CALIBRATION AND STANDARDIZATION
10.1 INITIAL CALIBRATION CURVE
10.1.1 Calibration is performed by extracting procedural standards, i.e.; fortifiedreagent water, by the procedure set forth in Section 11. A five-pointcalibration curve is to be prepared by diluting the primary dilution standardinto MTBE at the appropriate levels. The desired amount of each MTBEcalibration standard is added to separate 40 mL aliquots of reagent water toproduce a calibration curve ranging from the detection limit to approximately50 times the detection limit. (These MTBE calibration standards should beprepared so that 20 µL or less of the solution is added the water aliquots.) Also, the reagent water used for the procedural standards contains ammoniumchloride at the same concentration as that in the samples as per Section8.1.2.
10.1.2 Establish GC operating parameters equivalent to the suggested specificationsin Table 1. The GC system must be calibrated using the internal standard (IS)technique. Other columns or conditions may be used if equivalent or betterperformance can be demonstrated.

552.2-17
10.1.2 Five calibration standards are required. The lowest should contain the analytesat a concentration near to but greater than the MDL (Table 2) for eachcompound. The others should be evenly distributed throughout theconcentration range expected in the samples.
10.1.3 Inject 2 :L of each calibration standard extract and tabulate peak height orarea response and concentration for each analyte and the internal standard.
10.1.4 Generate a calibration curve by plotting the area ratios (Aa/Ais) against theconcentration Ca of the five calibration standards where
Aa is the peak area of the analyte.Ais is the peak area of the internal standard.Ca is the concentration of the analyte.
This curve can be defined as either first or second order.Also, the working calibration curve must be verified daily by measurement ofone or more calibration standards (Section 10.2). If the response for anyanalyte falls outside the predicted response by more than 30%, the calibrationcheck must be repeated using a freshly prepared calibration standard. Shouldthe retest fail, a new calibration curve must be generated.
10.1.5 Alternately, an average relative response factor can be calculated and used forquantitation. Relative response factors are calculated for each analyte at thefive concentration levels using the equation below:
(Aa)(Cis) RRF = ----------
(Ais)(Ca)
If the RRF value over the working range is constant (<20% RSD), the RRF can be assumed to be invariant and the average RRF used forcalculations. Also, the average RRF must be verified daily by measurement ofone or more calibration standards (Section 10.2). If the RRF for thecontinuing calibration standard deviates from the average RRF by more than30%, the calibration check must be repeated using a freshly preparedcalibration standard. Should the retest fail, a new calibration curve must begenerated.
10.1.6 A data system may be used to collect the chromatographic data, calculaterelative response factors, or calculate linear or second order calibration curves.

552.2-18
10.2 CONTINUING CALIBRATION CHECK (CCC)
10.2.1 At least one CCC must be extracted with each set of samples. A CCC must beanalyzed at the beginning of each analysis set, after every tenth sampleanalysis and after the final sample analysis, to ensure that the instrument isstill within calibration. These checks should be at two different concentrationlevels. Calculate analyte recoveries for all target analytes. In order for thecalibration check to be considered valid and subsequently for the precedingten samples to be considered acceptable with respect to calibration, recoveriesmust fall between 70% and 130% for all the target analytes.
NOTE: Continuing calibration check standards need not necessarily bedifferent extracts but can be injections from the same extract as long as theholding time requirements (Sect. 8.3.2) are met.
10.2.2 If this criteria cannot be met, the continuing calibration check standard extractis re-injected in order to determine if the response deviations observed fromthe initial analysis are repeated. If this criteria still cannot be met, a secondCCC should be extracted and analyzed or a CCC that has already beenanalyzed and has been found to be acceptable should be run. If this secondCCC fails, then the instrument is considered out of calibration and needs to berecalibrated.
11. PROCEDURE
11.1 SAMPLE EXTRACTION
11.1.1 Remove the samples from storage (Sect. 8.3.1) and allow them to equilibrateto room temperature.
11.1.2 Place 40 mL of the water sample into a precleaned 60 mL glass vial with ateflon-lined screw cap using a graduated cylinder.
11.1.3 Add 20 :L of surrogate standard (10.0 :g/mL 2,3-dibromopropionic acid inMTBE per Section 7.5.2).
NOTE: When fortifying an aqueous sample with either surrogate or targetanalytes contained in MTBE, be sure that the needle of the syringe is wellbelow the level of the water. After injection, cap the sample and invert once. This insures that the standard solution is mixed well with the water.
11.1.4 Adjust the pH to less than 0.5 by adding at least 2 mL of concentratedsulfuric acid. Cap, shake and then check the pH with a pH meter or narrowrange pH paper.
11.1.5 Quickly add approximately 2 g of copper II sulfate pentahydrate and shakeuntil dissolved. This colors the aqueous phase blue and therefore allows for
552.2-19
the analyst to better distinguish between the aqueous phase and the organicphase in this micro extraction.
11.1.6 Quickly add 16 g of muffled sodium sulfate and shake for 3 to 5 minutes untilalmost all is dissolved. Sodium sulfate is added to increase the ionic strengthof the aqueous phase and thus further drive the haloacetic acids into theorganic phase. The addition of this salt and the copper II sulfate should bedone quickly so that the heat generated from the addition of the acid (Section11.1.4) will help dissolve the salts.
11.1.7 Add 4.0 mL MTBE and place on the mechanical shaker for 30 minutes. (Ifhand-shaken, two minutes is sufficient if performed vigorously).
11.1.8 Allow the phases to separate for approximately 5 minutes.
11.2 METHYLATION
11.2.1 Using a pasteur pipet, transfer approximately 3 mL of the upper MTBE layerto a 15 mL graduated conical centrifuge tube.
11.2.2 Add 1 mL 10% sulfuric acid in methanol to each centrifuge tube.
11.2.3 Cap the centrifuge tubes and place in the heating block (or sand bath) at 50°Cand maintain for 2 hr. The vials must fit snugly into the heating block toensure proper heat transfer. At this stage, methylation of the method analytesis attained.
11.2.4 Remove the centrifuge tubes from the heating block (or sand bath) and allowthem to cool before removing the caps.
11.2.5 Add 4 mL saturated sodium bicarbonate solution to each centrifuge tube in 1mL increments. Exercise caution when adding the solution because theevolution of CO2 in this neutralization reaction is rather rapid.
11.2.6 Shake each centrifuge tube for 2 minutes. As the neutralization reactionmoves to completion, it is important to continue to exercise caution by ventingfrequently to release the evolved CO2.
11.2.7 Transfer exactly 1.0 ml of the upper MTBE layer to an autosampler vial. Aduplicate vial should be filled using the excess extract.
11.2.8 Add 10 :L of internal standard to the vial to be analyzed. (25 :g/mL 1,2,3-trichloropropane in MTBE per Section 7.5.1).
11.2.9 Analyze the samples as soon as possible. The sample extract may be storedup to 7 days if kept at 4°C or less or up to 14 days if kept at -10°C or less. Keep the extracts away from light in amber glass vials with Teflon-lined caps.

552.2-20
11.3 GAS CHROMATOGRAPHY
11.3.1 Table 1 summarizes recommended GC operating conditions and retentiontimes observed using this method. Figure 1 illustrates the performance of therecommended primary column with the method analytes. Figure 2 illustratesthe performance of the recommended confirmation column with the methodanalytes. Concentrations of the analytes of these chromatograms are thoselisted in Table 4 for the fortified reagent water samples. Other GC columns orchromatographic conditions may be used if the requirements of Section 9 aremet.
11.3.2 Calibrate the system (Section 10.1) or verify the existing calibration byanalysis of a CCC daily as described in Section 10.2.
11.3.3 Inject 2 :L of the sample extract. Record the resulting peak sizes in area orheight units.
11.3.4 If the response for the peak exceeds the working range of the system, dilutethe extract, add an appropriate additional amount of internal standard andreanalyze. The analyst must not extrapolate beyond the calibration rangeestablished.
12. DATA ANALYSIS AND CALCULATIONS
12.1 Identify sample components by comparison of retention times to retention data fromthe calibration standard analysis. If the retention time of an unknown peakcorresponds, within limits (Section 12.2), to the retention time of a standardcompound, then the identification is considered positive. Calculate analyte concentra-tions in the samples and reagent blanks from the calibration curves generated inSection 10.1.
12.2 If an average relative response factor has been calculated (Sect 10.1.5), analyteconcentrations in the samples and reagent blanks are calculated using the followingequation:
(Aa)(Cis) Ca = --------------
(Ais)(RRF)
12.3 The width of the retention time window used to make identifications should be basedupon measurements of actual retention time variations of standards over the course ofa day. Three times the standard deviation of a retention time can be used to calculatea suggested window size for a compound. However, the experience of the analystshould weigh heavily in the interpretation of chromatogram.

552.2-21
13. METHOD PERFORMANCE
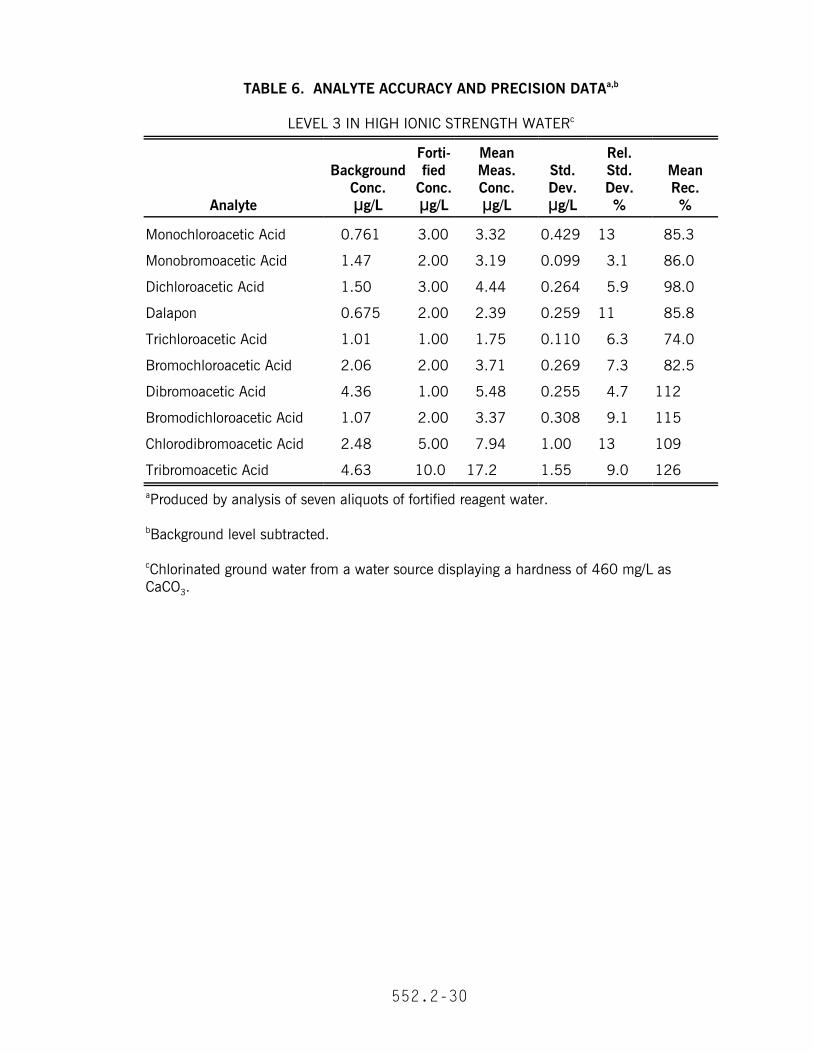
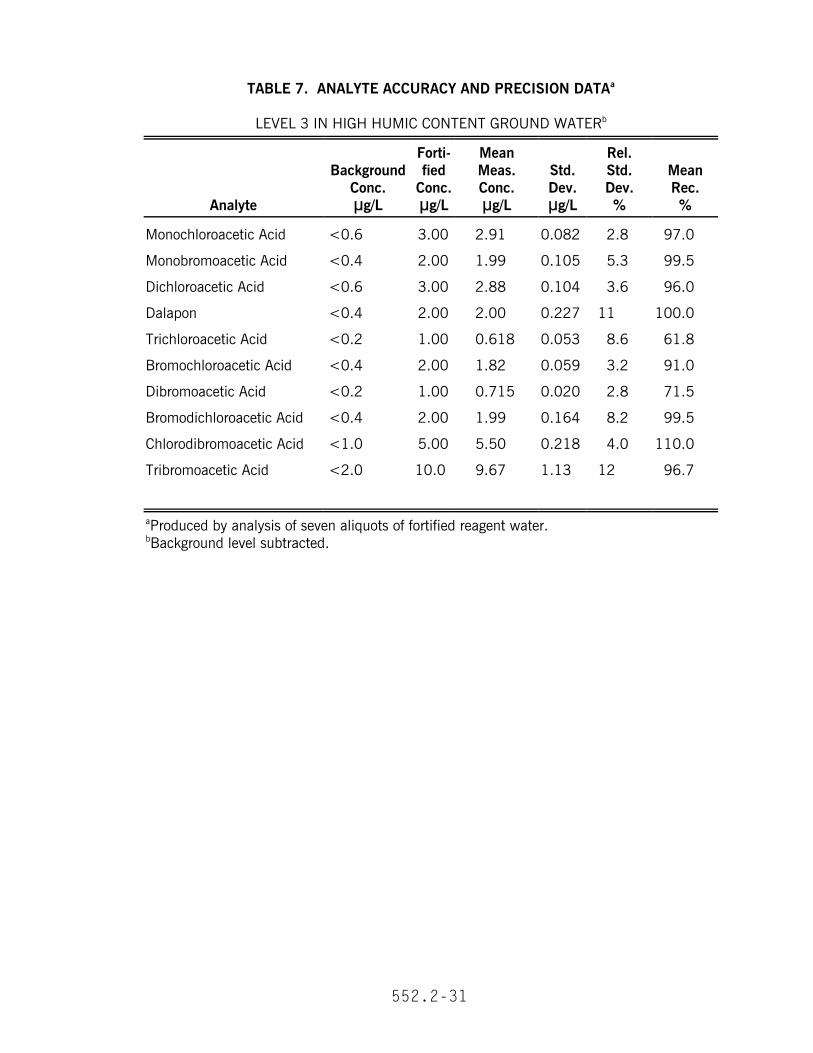
13.1 In a single laboratory, recovery and precision data were obtained at threeconcentrations in reagent water (Tables 3 and 4). The MDL and EDL data are given inTable 2. In addition, recovery and precision data were obtained at a mediumconcentration for dechlorinated tap water (Table 5), high ionic strength reagent water(Table 6) and high humectant ground water (Table 7).
14. POLLUTION PREVENTION
14.1 This method utilizes a micro-extraction procedure which requires the use of very smallquantities of organic solvents. This feature reduces the hazards involved with the use oflarge volumes of potentially harmful organic solvents needed for conventional liquid-liquid extractions. This method also uses acidic methanol as the derivatizing reagent.
14.2 For information about pollution prevention that may be applicable to laboratoryoperations consult "Less is Better: Laboratory Chemical Management for WasteReduction" available from the American Chemical Society's Department of GovernmentRelations and Science Policy, 1155 16th Street N.W., Washington, D.C. 20036.
15. WASTE MANAGEMENT
15.1 Due to the nature of this method there is little need for waste management. No largevolumes of solvents or hazardous chemicals are used. The matrices of concern arefinished drinking water or source water. However, the Agency requires that laboratorywaste management practices be conducted consistent with all applicable rules andregulations, and that laboratories protect the air, water, and land by minimizing andcontrolling all releases from fume hoods and bench operations. Also compliance isrequired with any sewage discharge permits and regulations, particularly the hazardouswaste identification rules and land disposal restrictions. For further information onwaste management, consult "The Waste Management Manual for LaboratoryPersonnel" also available from the American Chemical Society at the address in Sect.14.2.
16. REFERENCES
1. Quimby, B.D., Delaney, M.F., Uden. P.C. and Barnes, R.M. Anal. Chem. 52, 1980,pp. 259-263.
2. Uden, P.C. and Miller, J.W., J. Am. Water Works Assoc. 75, 1983, pp. 524-527.
3. Hodgeson, J.W. and Cohen, A.L. and Collins, J.D., "Analytical Methods for MeasuringOrganic Chlorination Byproducts", Proceedings Water Quality Technology Conference(WQTC-16), St. Louis, MO, Nov. 13-17, 1988, American Water Works Association,Denver, CO, pp. 981-1001.

552.2-22
4. Fair. P.S., Barth, R.C., "Comparison of the Microextraction Procedure and Method 552for the Analysis of HAAs and Chlorophenols", Journal AWWA, November, 1992, pp.94-98.
5. Chinn, R. and Krasner, S. " A Simplified Technique for the Measurement ofHalogenated Organic Acids in Drinking Water by Electron Capture GasChromatography". Presented at the 28th Pacific Conference on Chemistry andSpectroscopy, Pasadena, CA, October, 1989
6. Hodgeson, J. W., Collins, J. D., and Becker, D. A., "Advanced Techniques for theMeasurement of Acidic Herbicides and Disinfection Byproducts in Aqueous Samples,"Proceedings of the 14th Annual EPA Conference on Analysis of Pollutants in theEnvironment, Norfolk, VA., May 8-9, 1991. Office of Water Publication No. 821-R-92-001, U.S. Environmental Protection Agency, Washington, DC, pp 165-194.
7. Shorney, Holly L. and Randtke, Stephen J., "Improved Methods for Haloacetic AcidAnalysis", Proceedings Water Quality Technology Conference, San Francisco, CA,November 6-10, 1994, American Water Works Association, pp 453-475.
8. Peters, Rund J.B., Erkelens, Corrie, De Leer, Ed W.B. and De Galan, Leo, "The Analysisof Halogenated Acetic Acids in Dutch Drinking Water", Wat. Res., Vol.25, No.4,1991, Great Britain, pp 473-477.
9. "Carcinogens-Working with Carcinogens", Publication No. 77-206, Department ofHealth, Education, and Welfare, Public Health Service, Center for Disease Control,National Institute of Occupational Safety and Health, Atlanta, Georgia, August 1977.
10. "OSHA Safety and Health Standards, General Industry", (29CFR1910), OSHA 2206,Occupational Safety and Health Administration, Washington, D.C. Revised January1976.
11. "Safety In Academic Chemistry Laboratories", 3rd Edition, American Chemical SocietyPublication, Committee on Chemical Safety, Washington, D.C., 1979.
12. Xie, Yuefeng, Reckhow, David A., and Rajan, R.V., "Spontaneous Methylation ofHaloacetic Acids in Methanolic Stock Solutions", Environ. Sci. Technol., Vol.27, No.6,1993, pp1232-1234.
13. ASTM Annual Book of Standards, Part 31, D3370, "Standard Practice for SamplingWater", American Society for Testing and Materials, Philadelphia, PA, p. 76, 1980.
14. ASTM Annual Book of Standards, Part 31, D3694, "Standard Practice for Preparationof Sample Containers and for Preservation", American Society for Testing and Materials,Philadelphia, PA, p. 679, 1980.
15. Glaser, J. A., Foerst, D. L., McKee, G. D., Quave, S. A. and Budde, W. L., Environ. Sci.Technol. 15, 1981, pp. 1426-1435.

17.
TAB
LES,
DIA
GR
AM
S, F
LOW
CH
AR
TS, A
ND
VA
LID
ATI
ON
DA
TA
FIG
UR
E 1
. E
LUTI
ON
OF
METH
OD
AN
ALY
TES
ON
TH
E P
RIM
AR
Y C
OLU
MN
(D
B-5
.625)

FIG
UR
E 2
. E
LUTI
ON
OF
METH
OD
AN
ALY
TES
ON
TH
E C
ON
FIR
MA
TIO
N C
OLU
MN
(D
B-1
701)

552.2-25
TABLE 1. RETENTION DATA AND CHROMATOGRAPHIC CONDITIONS
Retention Time, minutes
Analyte Column A Column B
Monochloroacetic Acid (MCAA)
Monobromoacetic Acid (MBAA)
Dichloroacetic Acid (DCAA)
Dalapon
Trichloroacetic Acid (TCAA)
Bromochloroacetic Acid (BCAA)
1,2,3-Trichloropropane (I.S.)
Dibromoacetic Acid (DBAA)
Bromodichloroacetic Acid (BDCAA)
Chlorodibromoacetic Acid (CDBAA)
2,3-Dibromopropionic Acid (SURR)
Tribromoacetic Acid (TBAA)
13.03
17.15
17.80
19.08
22.67
23.15
23.70
31.38
32.18
41.57
41.77
49.22
13.70
17.33
17.88
17.73
20.73
22.87
22.35
30.27
28.55
38.78
39.72
47.08
Column A: DB-5.625, 30 m x 0.25 mm i.d., 0.25 :m film thickness, Injector Temp. =200°C, Detector Temp. = 260°C, Helium Linear Velocity = 24 cm/sec. at35°C, Splitless injection with 30 second delay.
Program: Hold at 35°C for 10 minutes, ramp to 75°C at 5°C/min. and hold15 minutes, ramp to 100°C at 5°C/min. and hold five minutes, ramp to135°C at 5°C/min. and hold two minutes.
Column B: DB-1701, 30 m x 0.25 mm i.d., 0.25 :m film thickness, Injector Temp. =200°C, Detector Temp. = 260°C, Linear Helium Velocity = 25 cm/sec. at35°C, splitless injection with 30 second delay.
Program: Hold at 35°C for 10 minutes, ramp to 75°C at 5°C/min. and hold15 minutes, ramp to 100°C at 5°C/min. and hold five minutes, ramp to135°C at 5°C/min. and hold 0 minutes.

552.2-26
TABLE 2. ANALYTE ACCURACY AND PRECISION DATA AND METHOD DETECTIONLIMITSa
LEVEL 1 IN REAGENT WATER
Analyte
FortifiedConc.:g/L
Mean.Meas.Conc.:g/L
Std.Dev.:g/L
Rel.Std.Dev.%
MethodDetection
Limitb
:g/L
EstimatedDetection
Limitc
:g/L
MCAA
MBAA
DCAA
Dalapon
TCAA
BCAA
DBAA
BDCAA
CDBAA
TBAA
0.600
0.400
0.600
0.400
0.200
0.400
0.200
0.400
1.00
2.00
0.516
0.527
0.494
0.455
0.219
0.498
0.238
0.357
1.19
1.91
0.087
0.065
0.077
0.038
0.025
0.080
0.021
0.029
0.149
0.261
17
12
16
8.4
11
16
8.8
8.1
12
14
0.273
0.204
0.242
0.119
0.079
0.251
0.066
0.091
0.468
0.820
0.60
0.20
0.24
0.40
0.20
0.25
0.20
0.40
0.75
1.5
aProduced by analysis of seven aliquots of fortified reagent water.
bThe MDL is a statistical estimate of the detection limit. To determine the MDL for eachanalyte, the standard deviation of the mean concentration of the seven replicates iscalculated. This standard deviation is then multiplied by the student's t-value at 99%confidence and n-1 degrees of freedom (3.143 for seven replicates). The result is the MDL.
cThe EDL is defined as either the MDL or a level of a compound in a sample yielding a peakin the final extract with a signal to noise (S/N) ratio of approximately five, whichever isgreater.

552.2-27
TABLE 3. ANALYTE ACCURACY AND PRECISION DATAa
LEVEL 2 IN REAGENT WATER
Analyte
FortifiedConc.:g/L
Mean.Meas.Conc.:g/L
Std.Dev.:g/L
Rel.Std.Dev.%
MeanRecovery
%
Monochloroacetic Acid
Monobromoacetic Acid
Dichloroacetic Acid
Dalapon
Trichloroacetic Acid
Bromochloroacetic Acid
Dibromoacetic Acid
Bromodichloroacetic Acid
Chlorodibromoacetic Acid
Tribromoacetic Acid
1.50
1.00
1.50
1.00
0.500
1.00
0.500
1.00
2.50
5.00
1.42
1.02
1.27
0.935
0.465
0.869
0.477
1.07
2.62
5.19
0.103
0.051
0.122
0.087
0.048
0.049
0.044
0.098
0.150
0.587
7.3
5.0
9.6
9.3
10
5.6
9.2
9.2
5.7
11
94.7
102
84.7
93.5
93.0
86.9
95.4
107
105
104
aProduced by analysis of seven aliquots of fortified reagent water.

552.2-28
TABLE 4. ANALYTE ACCURACY AND PRECISION DATAa
LEVEL 4 IN REAGENT WATER
Analyte
FortifiedConc.:g/L
Mean.Meas.Conc.:g/L
Std.Dev.:g/L
Rel.Std.Dev.%
MeanRecovery
%
Monochloroacetic Acid
Monobromoacetic Acid
Dichloroacetic Acid
Dalapon
Trichloroacetic Acid
Bromochloroacetic Acid
Dibromoacetic Acid
Bromodichloroacetic Acid
Chlorodibromoacetic Acid
Tribromoacetic Acid
6.00
4.00
6.00
4.00
2.00
4.00
2.00
4.00
10.0
20.0
5.24
4.36
6.89
3.87
1.74
4.33
1.87
3.93
11.4
24.0
0.664
0.475
0.782
0.147
0.144
0.402
0.113
0.377
0.866
1.82
13
11
11
3.8
8.3
9.3
6.0
9.6
7.6
7.6
87.3
109
115
96.8
87.0
108
93.5
98.2
114
120
aProduced by analysis of seven aliquots of fortified reagent water.

552.2-29
TABLE 5. ANALYTE ACCURACY AND PRECISION DATAa,b
LEVEL 3 IN DECHLORINATED TAP WATERc
Analyte
BackgroundConc.:g/L
Forti-fied
Conc.:g/L
MeanMeas.Conc.:g/L
Std.Dev.:g/L
Rel.Std.Dev.%
MeanRec.%
Monochloroacetic Acid
Monobromoacetic Acid
Dichloroacetic Acid
Dalapon
Trichloroacetic Acid
Bromochloroacetic Acid
Dibromoacetic Acid
Bromodichloroacetic Acid
Chlorodibromoacetic Acid
Tribromoacetic Acid
<0.6
0.420
0.625
<0.4
0.300
1.23
1.27
0.588
1.23
<2.0
3.00
2.00
3.00
2.00
1.00
2.00
1.00
2.00
5.00
10.0
2.53
2.20
3.77
1.96
1.12
2.91
2.35
2.52
6.36
11.8
0.090
0.034
0.096
0.157
0.167
0.062
0.110
0.388
0.502
1.65
3.6
1.5
2.5
8.0
15
2.1
4.7
15
7.9
14
84.3
89.0
105
98.0
82.0
84.0
108
96.6
103
118
a Produced by analysis of seven aliquots of fortified reagent water.
b Background level subtracted.
c Chlorinated surface water from a local utility to which ammonium chloride was added as the dechlorinating agent.
552.2-30
TABLE 6. ANALYTE ACCURACY AND PRECISION DATAa,b
LEVEL 3 IN HIGH IONIC STRENGTH WATERc
Analyte
BackgroundConc.:g/L
Forti-fied
Conc.:g/L
MeanMeas.Conc.:g/L
Std.Dev.:g/L
Rel.Std.Dev.%
MeanRec.%
Monochloroacetic Acid
Monobromoacetic Acid
Dichloroacetic Acid
Dalapon
Trichloroacetic Acid
Bromochloroacetic Acid
Dibromoacetic Acid
Bromodichloroacetic Acid
Chlorodibromoacetic Acid
Tribromoacetic Acid
0.761
1.47
1.50
0.675
1.01
2.06
4.36
1.07
2.48
4.63
3.00
2.00
3.00
2.00
1.00
2.00
1.00
2.00
5.00
10.0
3.32
3.19
4.44
2.39
1.75
3.71
5.48
3.37
7.94
17.2
0.429
0.099
0.264
0.259
0.110
0.269
0.255
0.308
1.00
1.55
13
3.1
5.9
11
6.3
7.3
4.7
9.1
13
9.0
85.3
86.0
98.0
85.8
74.0
82.5
112
115
109
126
aProduced by analysis of seven aliquots of fortified reagent water.
bBackground level subtracted.
cChlorinated ground water from a water source displaying a hardness of 460 mg/L asCaCO3.
552.2-31
TABLE 7. ANALYTE ACCURACY AND PRECISION DATAa
LEVEL 3 IN HIGH HUMIC CONTENT GROUND WATERb
Analyte
BackgroundConc.:g/L
Forti-fied
Conc.:g/L
MeanMeas.Conc.:g/L
Std.Dev.:g/L
Rel.Std.Dev.%
MeanRec.%
Monochloroacetic Acid
Monobromoacetic Acid
Dichloroacetic Acid
Dalapon
Trichloroacetic Acid
Bromochloroacetic Acid
Dibromoacetic Acid
Bromodichloroacetic Acid
Chlorodibromoacetic Acid
Tribromoacetic Acid
<0.6
<0.4
<0.6
<0.4
<0.2
<0.4
<0.2
<0.4
<1.0
<2.0
3.00
2.00
3.00
2.00
1.00
2.00
1.00
2.00
5.00
10.0
2.91
1.99
2.88
2.00
0.618
1.82
0.715
1.99
5.50
9.67
0.082
0.105
0.104
0.227
0.053
0.059
0.020
0.164
0.218
1.13
2.8
5.3
3.6
11
8.6
3.2
2.8
8.2
4.0
12
97.0
99.5
96.0
100.0
61.8
91.0
71.5
99.5
110.0
96.7
aProduced by analysis of seven aliquots of fortified reagent water.bBackground level subtracted.

552.2-32
TABLE 8. LABORATORY PERFORMANCE CHECK SOLUTION
Parameter Analyte
Conc.:g/mL
inMTBE
AcceptanceCriteria
INSTRUMENTSENSITIVITY
CHROMATOGRAPHICPERFORMANCE
COLUMNPERFORMANCE
MCAA
BCAA
CDBAASURROGATE (2,3-DBPA)
0.006
0.004
0.0100.010
DETECTION OF ANALYTE;S/Na >3
PGFb BETWEEN 0.80 AND1.15
RESOLUTIONc >0.50
aS/N = a ratio of peak signal to baseline noise.
peak signal - measured as height of peak. baseline noise - measured as maximum deviation in baseline (in units of height)
over a width equal to the width of the base of the peak.
bPGF -- Peak Gaussian factor
where: W1/2 = the peak width at half height in secondsW1/10 = the peak width in seconds at one-tenth height (in seconds)
bResolution between the two peaks as defined by the equation:
where: t = the difference in elution times between the two peaksWave = the average peak width of the two peaks (measurements take
at baseline)
This is a measure of the degree of separation of two peaks under specific chromatographicconditions.

552.2-33
THIS PAGE LEFT BLANK INTENTIONALLY