eograph year 8 - acara€¦ · · 2018-04-1710 australian curriculum: ... economic and social...
TRANSCRIPT

Geography
May 2013 Page 1 of 25
Year 8
Student Portfolio Summary
WORK SAMPLE PORTFOLIO
The 2013 portfolios are a resource to support teachers in the planning and implementation of the Foundation to Year
10 Australian Curriculum: Geography. Each portfolio comprises a collection of student work illustrating evidence of
student learning in relation to the achievement standard.
Each work sample in the portfolio varies in terms of how much time was available to complete the task and/or the
degree of scaffolding provided by the teacher.
There is no pre-determined number of samples required in a portfolio nor are the work samples sequenced in any
particular order. Together as a portfolio, the samples provide evidence of all aspects of the achievement standard
unless otherwise specified.
As the Australian Curriculum is progressively implemented in schools, the portfolios will continue to be reviewed and
enhanced in relation to their comprehensiveness in coverage of the achievement standard and their representation of
the diversity of student work that can be used to highlight evidence of student learning.
THIS PORTFOLIO – Year 8 Geography
This portfolio comprises a number of work samples drawn from a range of assessment tasks, namely:
Sample 1 Inquiry – Riverine landscapes
Sample 2 Data response – Changing nations
Sample 3 Data response – Population distribution
This portfolio of student work shows that the student can explain the human and physical processes that influence
the characteristics of places (WS1, WS2, WS3) and explain how places such as the Ross Creek are perceived
and valued differently by different people (WS1). The student explains interconnections within environments
and between people and places (WS1, WS2, WS3) and how these interconnections change places (WS3) and
environments (WS1, WS2). The student proposes explanations for spatial distributions and patterns among
phenomena and identifies associations between distribution patterns (WS1, WS2, WS3). The student compares
alternative strategies to a geographical challenge and proposes a response, taking into account environmental,
economic and social factors (WS1).
The student’s work shows an ability to identify geographically significant questions from observations to frame an
inquiry. The student locates relevant information from a range of primary and secondary sources to answer inquiry
questions (WS1). The student represents data and the location and distribution of geographical phenomena in a
range of appropriate graphic forms, including maps (WS1). The student analyses geographical data and other
information to propose explanations for spatial patterns (WS1, WS2, WS3), trends and relationships (WS2, WS3)
and draw reasoned conclusions (WS1, WS2, WS3). The student presents findings, arguments and ideas using
relevant geographical terminology and graphic representations (WS1, WS2) in a range of appropriate communication
forms (WS1, WS2, WS3). The student proposes action in response to a geographical challenge taking account of

Geography
May 2013 Page 2 of 25
Year 8
Work sample 1
environmental, economic and social considerations and predicts the outcomes of their proposal (WS1).
The annotated samples in this portfolio provide evidence of most (but not necessarily all) aspects of the achievement
standard. The following aspect of the standard is not evident in this portfolio:
• represent data on maps at different scales that conform to cartographic conventions

Geography
May 2013 Page 3 of 25
Year 8
Work sample 1
Inquiry – Riverine landscapes
Relevant part of the achievement standard
By the end of Year 8, students explain geographical processes that influence the characteristics of places and explain how places are perceived and valued differently. They explain interconnections within environments and between people and places and explain how they change places and environments. They propose explanations for spatial distributions and patterns among phenomena and identify associations between distribution patterns. They compare alternative strategies to a geographical challenge and propose a response, taking into account environmental, economic and social factors.
Students identify geographically significant questions from observations to frame an inquiry. They locate relevant information from a range of primary and secondary sources to answer inquiry questions. They represent data and the location and distribution of geographical phenomena in a range of appropriate graphic forms, including maps at different scales that conform to cartographic conventions. They analyse geographical data and other information to propose explanations for spatial patterns, trends and relationships and draw reasoned conclusions. Students present findings, arguments and ideas using relevant geographical terminology and graphic representations in a range of appropriate communication forms. They propose action in response to a geographical challenge taking account of environmental, economic and social considerations and predict the outcomes of their proposal.
Summary of task
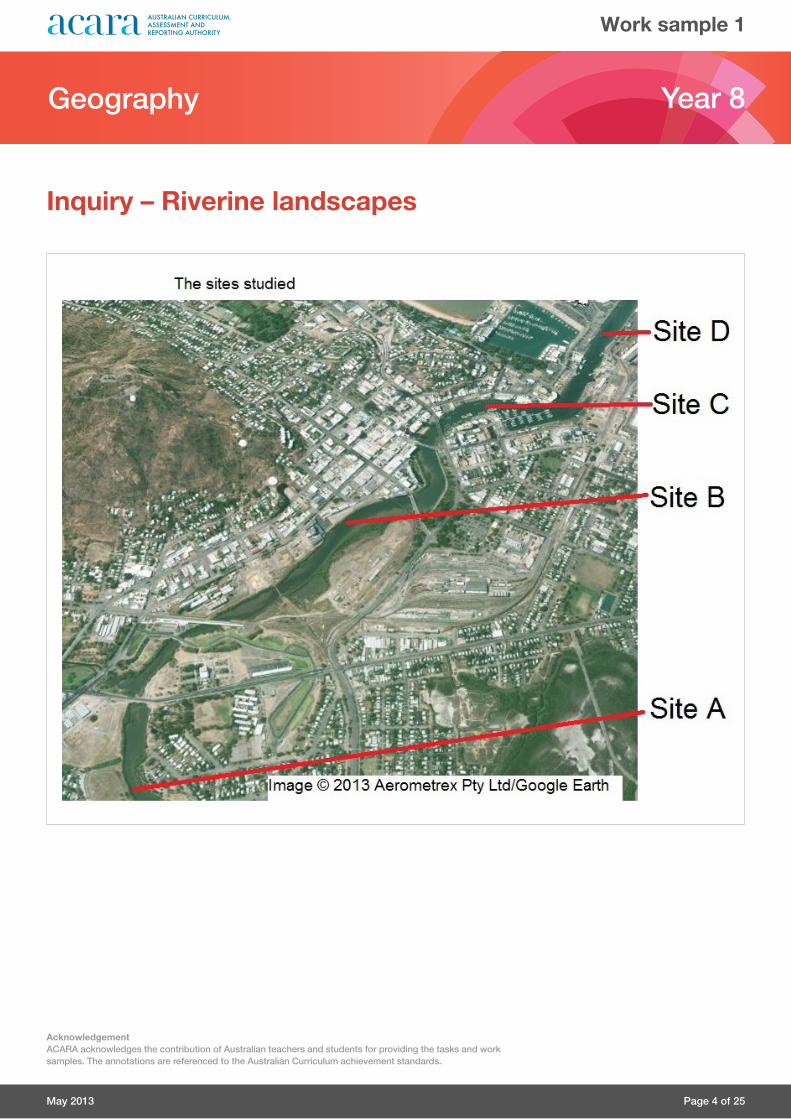
As part of an inquiry, students visited a local riverine landscape and studied four sites. They were provided with the
following instructions to guide their inquiry:
• take a series of photographs at each site that illustrate the features, land use and the geomorphic, biotic and
cultural processes
• record these detailed observations in a table
• identify and explain the processes at work at each site
• annotate selected photographs with observations
• illustrate the land use patterns on a map using appropriate geographic conventions
• conduct a survey to determine the value of the Ross Creek to different groups of people and summarise these findings
• propose three options for development of the vacant land on ross creek and use criteria to evaluate these options
• draw a conclusion and make a recommendation on the best land use for the site.
This inquiry was completed over a term and the fieldtrip was conducted on a full-school day.
May 2013 Page 4 of 25
AcknowledgementACARA acknowledges the contribution of Australian teachers and students for providing the tasks and work samples. The annotations are referenced to the Australian Curriculum achievement standards.
Geography Year 8
Work sample 1
Inquiry – Riverine landscapes

May 2013 Page 5 of 25
Work sample 1
AcknowledgementACARA acknowledges the contribution of Australian teachers and students for providing the tasks and work samples. The annotations are referenced to the Australian Curriculum achievement standards.
Geography Year 8
Annotations
Identifies the main geographical features of the environment at each study site using annotated photographs.
Makes observations in the field to identify geographically significant features and land use patterns and processes.
Uses relevant geographical terminology, for example biotic features.
Inquiry – Riverine landscapes
Annotated photographs from fieldwork
Land use:
Residential, high density
Small concrete wall to reduce erosion
Biotic feature:
Mangrove
Photograph showing: Site A
Recreational land use and important area of Townsville.
Commercial land use
Transportation
land use Bridge crossing over site B of Ross Creek.
Photograph showing: Site B
Point bar
Rocks placed to keep road in place during floodwater
Mangroves and brush Care and
Management:
2. Rocks set up to protect road from flood
3. Paths and residential area built around source of river
The source
of Ross
Creek
Biotic features:
Mangroves
Fish
Crabs
Small bush animals
Different kinds of flora.
1. Possibly
Still water, not causing erosion.
Photograph showing: Site A
Photograph showing: Site A

May 2013 Page 6 of 25
Work sample 1
Geography Year 8
AcknowledgementACARA acknowledges the contribution of Australian teachers and students for providing the tasks and work samples. The annotations are referenced to the Australian Curriculum achievement standards.
Annotations
Identifies different land uses at one site.
Identifies strategies to prevent the process of erosion.
Inquiry – Riverine landscapes
Land use:
Residential, high density
Small concrete wall to reduce erosion
Biotic feature:
Mangrove
Photograph showing: Site A
Recreational land use and important area of Townsville.
Commercial land use
Transportation
land use Bridge crossing over site B of Ross Creek.
Photograph showing: Site B
Care and management:
Rocks placed to reduce constant erosion.
Care and management:
Bridge across creek
Biotic features:
1. Fish
2. Turtles
3. Crabs
4. Small animals on bank
5. Possibility of crocodiles
Photograph showing: Site B
High velocity river flow carrying sediment through
the water and causing transportation Mangroves and small brush
Residential land use
Photograph showing: Site B
Care and management:
Rocks placed to reduce constant erosion.
Care and management:
Bridge across creek
Biotic features:
1. Fish
2. Turtles
3. Crabs
4. Small animals on bank
5. Possibility of crocodiles
Photograph showing: Site B
High velocity river flow carrying sediment through
the water and causing transportation Mangroves and small brush
Residential land use
Photograph showing: Site B

May 2013 Page 7 of 25
Work sample 1
Geography Year 8
AcknowledgementACARA acknowledges the contribution of Australian teachers and students for providing the tasks and work samples. The annotations are referenced to the Australian Curriculum achievement standards.
Annotations
Recognises geographical processes that influence the characteristics of the environment.
Identifies how interconnections within and between environments cause change.
Identifies ways in which people change environments.
Inquiry – Riverine landscapes
Tidal water moving at
high velocity
Geomorphic process:
Point bar
Deposition Erosion
Castle hill
Photograph showing: Site C
Large amount of erosion caused by Tidal water
moving at high velocity
Small tree living on nutrients in the muddy water.
Photograph showing: Site C
Biotic Processes:
Crabs
Fish
Small animals
Mangroves
Weed
Grass
Meanders occurring in river\ point bar being formed by deposition.
The Concrete wall is having no useful effect on the erosion caused
by the water.
Photograph showing: Site C
Care and management:
Bridge
Land use: Transportation (train tracks)
Photograph showing: Site C
Tidal water moving at
high velocity
Geomorphic process:
Point bar
Deposition Erosion
Castle hill
Photograph showing: Site C
Large amount of erosion caused by Tidal water
moving at high velocity
Small tree living on nutrients in the muddy water.
Photograph showing: Site C

May 2013 Page 8 of 25
Work sample 1
Geography Year 8
AcknowledgementACARA acknowledges the contribution of Australian teachers and students for providing the tasks and work samples. The annotations are referenced to the Australian Curriculum achievement standards.
Annotations
Explains how geomorphic processes change the characteristics of environments.
Inquiry – Riverine landscapes
Biotic Processes:
Crabs
Fish
Small animals
Mangroves
Weed
Grass
Meanders occurring in river\ point bar being formed by deposition.
The Concrete wall is having no useful effect on the erosion caused
by the water.
Photograph showing: Site C
Care and management:
Bridge
Land use: Transportation (train tracks)
Photograph showing: Site C
High density Residential
Geomorphic processes: Deposition forms point bar on the inside of a river, water moving at high velocity which causes erosion.
Photograph showing: Site C
High commercial and recreational land use- parks, ovals etc.
Cars- people around CBD Parks
Water moving at high velocity, carrying
sediment and causing transportation
Photograph showing: Site C

May 2013 Page 9 of 25
Work sample 1
Geography Year 8
AcknowledgementACARA acknowledges the contribution of Australian teachers and students for providing the tasks and work samples. The annotations are referenced to the Australian Curriculum achievement standards.
Annotations
Identities strategies used to prevent change caused by the process of erosion.
Inquiry – Riverine landscapes
Industrial Land use
Geomorphic processes: Water moving at high velocity, transportation and slight erosion occurring.
Care and management: rocks placed to protect harbour from erosion
Rocks placed along harbour to prevent erosion
residential\ commercial land use (in the city)
Transportation land use
Photograph showing: Site D

May 2013 Page 10 of 25
Work sample 1
AcknowledgementACARA acknowledges the contribution of Australian teachers and students for providing the tasks and work samples. The annotations are referenced to the Australian Curriculum achievement standards.
Geography Year 8
Inquiry – Riverine landscapes
Annotations
Records observations in a table.
Describes the location of each study site using relevant geographical terminology.
Explains how characteristics of the environment influence land use patterns.

May 2013 Page 11 of 25
Work sample 1
AcknowledgementACARA acknowledges the contribution of Australian teachers and students for providing the tasks and work samples. The annotations are referenced to the Australian Curriculum achievement standards.
Geography Year 8
Inquiry – Riverine landscapes
Annotations
Explains the processes that influence the characteristics of the creek at each study site.
Identifies and explains ways in which people influence the environment through management.
May 2013 Page 12 of 25
Work sample 1
AcknowledgementACARA acknowledges the contribution of Australian teachers and students for providing the tasks and work samples. The annotations are referenced to the Australian Curriculum achievement standards.
Geography Year 8
Inquiry – Riverine landscapes
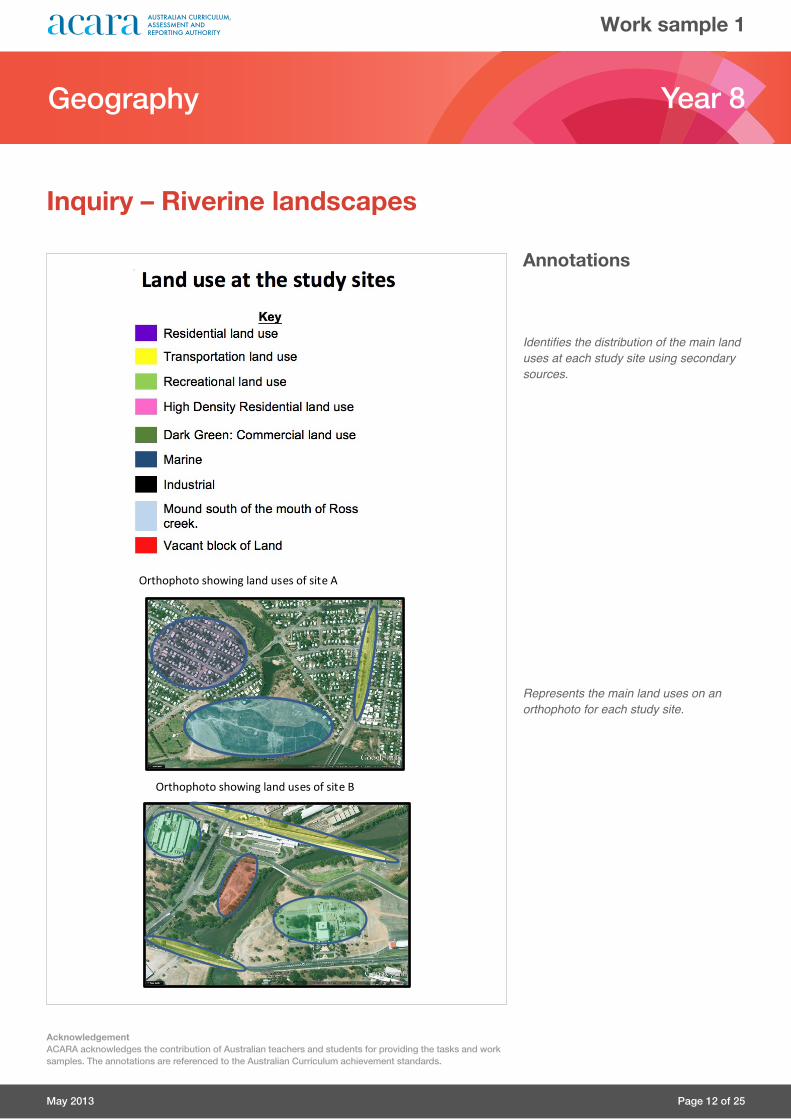
Annotations
Identifies the distribution of the main land uses at each study site using secondary sources.
Represents the main land uses on an orthophoto for each study site.
Orthophoto showing land uses of site A
Orthophoto showing land uses of site B
Orthophoto showing land uses of site A
Orthophoto showing land uses of site B
Orthophoto showing land uses of site A
Orthophoto showing land uses of site B
Orthophoto showing land uses of site A
Orthophoto showing land uses of site B

May 2013 Page 13 of 25
Work sample 1
AcknowledgementACARA acknowledges the contribution of Australian teachers and students for providing the tasks and work samples. The annotations are referenced to the Australian Curriculum achievement standards.
Geography Year 8
Inquiry – Riverine landscapes
Annotations
Locates and records data from a range of primary and secondary sources.
Annotates a photograph to present findings.
Communicates observations and findings from field observations in a range of forms (photos and text).
Orthophoto showing land uses of site
Orthophoto showing land uses of site D

May 2013 Page 14 of 25
Work sample 1
AcknowledgementACARA acknowledges the contribution of Australian teachers and students for providing the tasks and work samples. The annotations are referenced to the Australian Curriculum achievement standards.
Geography Year 8
Inquiry – Riverine landscapes
Annotations
Collects primary data by interviewing representatives of different community groups.
Constructs a graph using appropriate conventions.
Graphically represents the primary data gathered.
0
2
4
6
8
10
12
14
16
Rank
ing
Community Groups
Bar Graph Showing Values Of Ross Creek By Community Groups, 2013
Economic
Social
Environmental
Aesthetic
Spiritual
Source: Class survey
The value of the Ross Creel to different groups of people

May 2013 Page 15 of 25
Work sample 1
AcknowledgementACARA acknowledges the contribution of Australian teachers and students for providing the tasks and work samples. The annotations are referenced to the Australian Curriculum achievement standards.
Geography Year 8
Inquiry – Riverine landscapes
Annotations
Analyses the data to explain how different groups within a community perceive and value places differently.
Identifies patterns in primary data and offers an explanation for these patterns.

May 2013 Page 16 of 25
Work sample 1
AcknowledgementACARA acknowledges the contribution of Australian teachers and students for providing the tasks and work samples. The annotations are referenced to the Australian Curriculum achievement standards.
Geography Year 8
Inquiry – Riverine landscapes
Annotations
Identifies the positive and negative impacts of the proposal for a Botanic garden.
Evaluates the proposed land use for the Ross Creek using a range of appropriate criteria.

May 2013 Page 17 of 25
Work sample 1
AcknowledgementACARA acknowledges the contribution of Australian teachers and students for providing the tasks and work samples. The annotations are referenced to the Australian Curriculum achievement standards.
Geography Year 8
Inquiry – Riverine landscapes
Annotations
Identifies the positive and negative impacts of the proposal for a development like Southbank.
Evaluates the proposed land use for the Ross Creek using a range of appropriate criteria.

May 2013 Page 18 of 25
Work sample 1
AcknowledgementACARA acknowledges the contribution of Australian teachers and students for providing the tasks and work samples. The annotations are referenced to the Australian Curriculum achievement standards.
Geography Year 8
Inquiry – Riverine landscapes
Annotations
Identifies the positive and negative impacts of the proposal for a development like that at the Hamilton Wharves.
Evaluates the proposed land use for the Ross Creek using a range of appropriate criteria.

May 2013 Page 19 of 25
Work sample 1
AcknowledgementACARA acknowledges the contribution of Australian teachers and students for providing the tasks and work samples. The annotations are referenced to the Australian Curriculum achievement standards.
Geography Year 8
Inquiry – Riverine landscapes
Annotations
Makes a justified decision about the most appropriate land use for the site.
Considers economic, social and environmental costs and benefits for each proposal.
Predicts expected outcomes of the proposal for a development like South Bank.
Proposes collective action to improve the value of the vacant site for Townsville residents.
Annotations (Overview)The student planned and undertook an extensive inquiry to explain the complex interconnections within and between environments and between people and places. They communicated findings, explanations and reasoned conclusions using appropriate geographical terminology and a range of graphic forms.

Geography
May 2013 Page 20 of 25
Year 8
Work sample 2
Data response – Changing nations
Relevant part of the achievement standard
By the end of Year 8, students explain geographical processes that influence the characteristics of places and explain how places are perceived and valued differently. They explain interconnections within environments and between people and places and explain how they change places and environments. They propose explanations for spatial distributions and patterns among phenomena and identify associations between distribution patterns. They compare alternative strategies to a geographical challenge and propose a response, taking into account environmental, economic and social factors.
Students identify geographically significant questions from observations to frame an inquiry. They locate relevant information from a range of primary and secondary sources to answer inquiry questions. They represent data and the location and distribution of geographical phenomena in a range of appropriate graphic forms, including maps at different scales that conform to cartographic conventions. They analyse geographical data and other information to propose explanations for spatial patterns, trends and relationships and draw reasoned conclusions. Students present findings, arguments and ideas using relevant geographical terminology and graphic representations in a range of appropriate communication forms. They propose action in response to a geographical challenge taking account of environmental, economic and social considerations and predict the outcomes of their proposal.
Summary of task
Students were introduced to the topic of human migration both within and between countries and its impact on the
concentration of populations in major cities of the world. For this task students were provided with maps showing
global population distribution over time and a table containing statistics of internal migration in Australia. They were
asked to interpret, analyse and present this data and respond to a number of questions.
This task was completed during class time over four lessons. Students recorded their answers using a computer and
constructed their graphs on Microsoft Excel.

May 2013 Page 21 of 25
AcknowledgementACARA acknowledges the contribution of Australian teachers and students for providing the tasks and work samples. The annotations are referenced to the Australian Curriculum achievement standards.
Geography Year 8
Annotations
Analyses geographical data from a map to answer questions.
Identifies countries, regions and hemispheres with the highest population.
Proposes simple explanations for some aspects of this pattern of population distribution.
Identifies the relationship between population distribution and climate.
Analyses geographical data from a map to identify where population change has occurred.
Proposes explanations for trends identified.
Work sample 2
Data response – Changing nations

May 2013 Page 22 of 25
AcknowledgementACARA acknowledges the contribution of Australian teachers and students for providing the tasks and work samples. The annotations are referenced to the Australian Curriculum achievement standards.
Geography Year 8
Annotations
Represents data in a bar graph following appropriate conventions.
Represents data in a column graph following appropriate conventions.
Work sample 2
Data response – Changing nations

May 2013 Page 23 of 25
AcknowledgementACARA acknowledges the contribution of Australian teachers and students for providing the tasks and work samples. The annotations are referenced to the Australian Curriculum achievement standards.
Geography Year 8
Annotations (Overview)The student uses geographical terminology and different graphic forms to communicate findings, explanations and ideas.
Annotations
Analyses internal migration data.
Identifies flows of migration between states and territories.
Proposes explanations for identified trends in the movement of people.
Explains geographical processes that cause the movement of people between places.
Uses relevant geographical terminology when presenting findings and ideas.
Analyses data to draw reasoned conclusions about the effects of people moving between states and territories.
Work sample 2
Data response – Changing nations

Geography
May 2013 Page 24 of 25
Year 8
Data response – Population distribution
Relevant part of the achievement standard
By the end of Year 8, students explain geographical processes that influence the characteristics of places and explain how places are perceived and valued differently. They explain interconnections within environments and between people and places and explain how they change places and environments. They propose explanations for spatial distributions and patterns among phenomena and identify associations between distribution patterns. They compare alternative strategies to a geographical challenge and propose a response, taking into account environmental, economic and social factors.
Students identify geographically significant questions from observations to frame an inquiry. They locate relevant information from a range of primary and secondary sources to answer inquiry questions. They represent data and the location and distribution of geographical phenomena in a range of appropriate graphic forms, including maps at different scales that conform to cartographic conventions. They analyse geographical data and other information to propose explanations for spatial patterns, trends and relationships and draw reasoned conclusions. Students present findings, arguments and ideas using relevant geographical terminology and graphic representations in a range of appropriate communication forms. They propose action in response to a geographical challenge taking account of environmental, economic and social considerations and predict the outcomes of their proposal.
Summary of task
Students were provided with a copy of the following maps:
• Population of Australia’s main cities in 2010
• Population in the USA in 2010.
They were given time to examine the maps and were then asked to identify and explain the following based on their
interpretation:
• the population distribution of each country
• the effects of this distribution
• the similarities and/or differences between the population distribution of each country.
This task was completed during class time over two lessons.
Work sample 3

Geography
May 2013 Page 25 of 25
Annotations
AcknowledgementACARA acknowledges the contribution of Australian teachers and students for providing the tasks and work samples. The annotations are referenced to the Australian Curriculum achievement standards.
Year 8
Annotations (Overview)The student has verbally communicated findings and ideas using geographical terminology.
Work sample 3
Data response – Population distribution