enzymes lab report
DESCRIPTION
Lab report about enzymesTRANSCRIPT

LSC-10034 The effect of temperature, pH, substrate
concentration and inhibitors on the enzyme activity.
Student number: 14003336 Word count: 3 804
Student number: 14003336
2
Introduction
Aims:
1. To determine optimum wavelength.
2. To produce calibration graph.
3. To investigate the effect of the following factors on the enzyme activity:
pH,
substrate concentration,
inhibitor,
temperature.
Background information
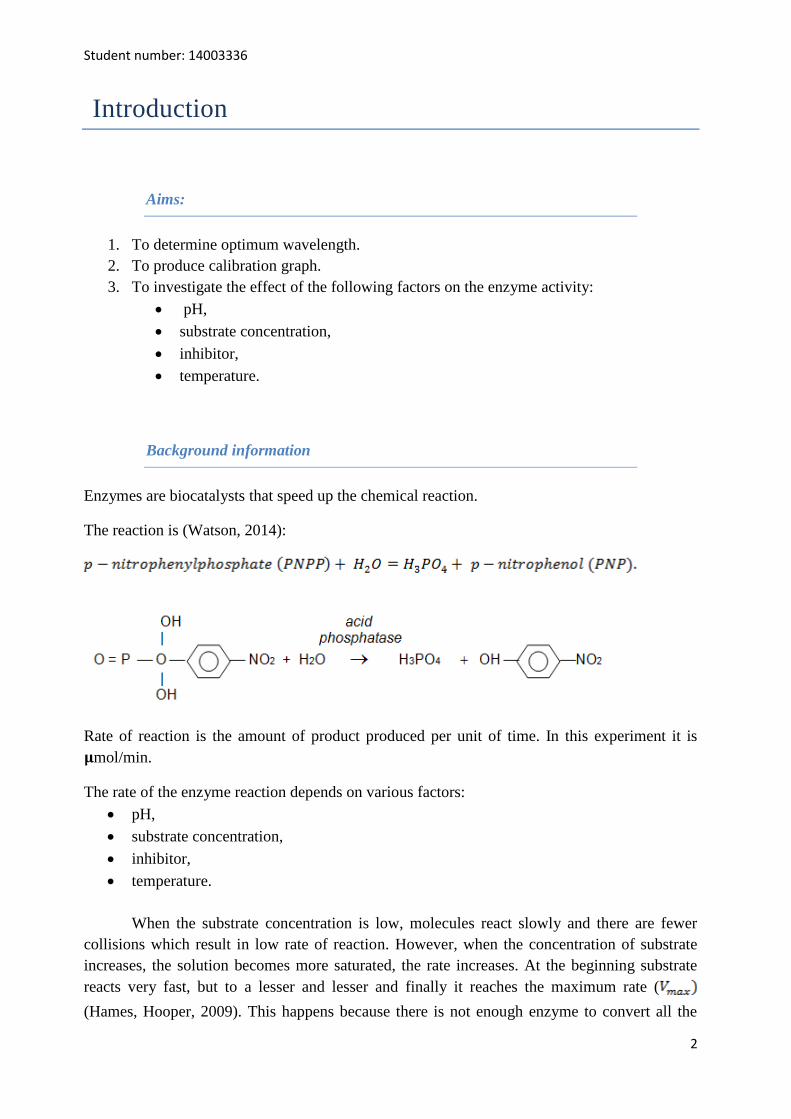
Enzymes are biocatalysts that speed up the chemical reaction.
The reaction is (Watson, 2014):
Rate of reaction is the amount of product produced per unit of time. In this experiment it is
mol/min.
The rate of the enzyme reaction depends on various factors:
pH,
substrate concentration,
inhibitor,
temperature.
When the substrate concentration is low, molecules react slowly and there are fewer
collisions which result in low rate of reaction. However, when the concentration of substrate
increases, the solution becomes more saturated, the rate increases. At the beginning substrate
reacts very fast, but to a lesser and lesser and finally it reaches the maximum rate (
(Hames, Hooper, 2009). This happens because there is not enough enzyme to convert all the
Student number: 14003336
3
substrate at once, enzyme is being damaged, a reversible reaction starts, or pH deviates from its
optimum value. It can be solved by the addition of enzyme (Berg, Tymoczko, Stryer, 2012).
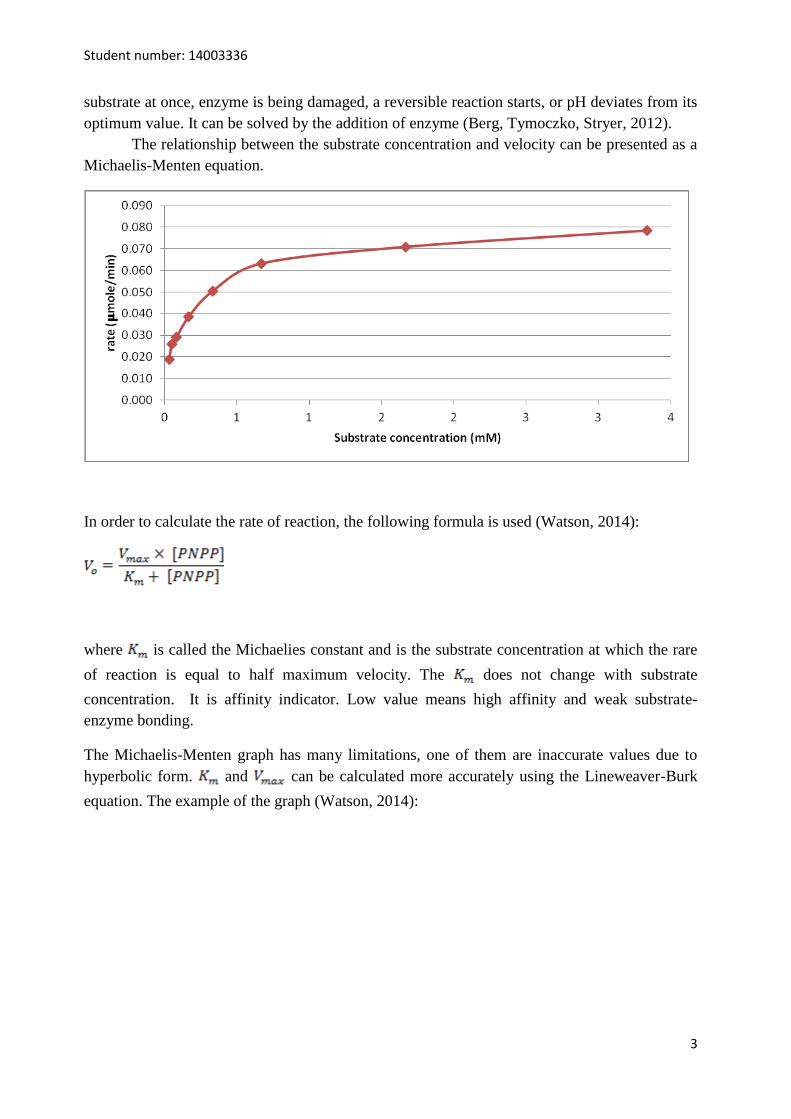
The relationship between the substrate concentration and velocity can be presented as a
Michaelis-Menten equation.
In order to calculate the rate of reaction, the following formula is used (Watson, 2014):
where is called the Michaelies constant and is the substrate concentration at which the rare
of reaction is equal to half maximum velocity. The does not change with substrate
concentration. It is affinity indicator. Low value means high affinity and weak substrate-
enzyme bonding.
The Michaelis-Menten graph has many limitations, one of them are inaccurate values due to
hyperbolic form. and can be calculated more accurately using the Lineweaver-Burk
equation. The example of the graph (Watson, 2014):

Student number: 14003336
4
Temperature and pH also affect enzymatic reactions. In both cases with the increase of
pH/ temperature, there is an increase in the rate of reaction, until it reaches peak value and
starts to denature. In case of temperature, enzyme get too much energy and the side chains
move, destroying the tertiary structure and changing the active site. Non-covalent interactions
are broken. The enzyme cannot work(Martini, Nath, Bartholomew, 2012).
With pH, even small change in pH can result in big difference in the rate of reaction. It happens
because, pH deviation causes changes in charges carried by ionisable side chains of amino
acids. This changes the intermolecular forces, tertiary structure is changed and protein
denatures (Hames, Hooper, 2009).
There are different types of inhibitors. They lower enzyme activity. One of them is
competitive inhibitor, it is reversible inhibitor which competes with substrate in order to bind to
enzymes. When it wins, the enzyme-inhibitor complex cannot react and the rate of reaction
decreases or falls to zero. With the increase of inhibitor, there is an increase in slope in the
Lineweaver-Burk equation and y-intercept remains unchanged. Competitive inhibitors do not
affect value. The increase in substrate concentration can overcome the inhibitor (Berg,
Tymoczko, Stryer, 2012).

Student number: 14003336
5
Data collection and presentation
Preliminary investigations
To determine optimum wavelength needed to determine the absorbance of product
(PNP), to both control (1 ml of distilled water) and sample (0.1 ml of 1mM PNP and 0.9 ml of
distilled water) tubes 2ml of diluting solution was added. The solution were mixed and next the
reaction was stopped by the addition of 3 ml of NaOH. Absorbance measurement was taken
using spectrophotometer at wavelength range of 340-500nm.
In order to determine the optimum wavelength, data from Table 1 were presented on graph.

Student number: 14003336
6
From the Graph 1, it can be determined that the wavelength gives the peak
absorbance and therefore is an optimum wavelength .
Absorbance depends on the concentration of the solution and the distance which the
light has to pass. The more saturated solution, the bigger absorbance value (Watson, 2014).
Therefore according to the Beer-Lambert Law, only concentrations that give the absorbance
value below 1.000 will be used in the next part of the experiment. To narrow PNP
concentration range, absorbance measurement of solutions containing different amounts of
1nM PNP were taken. The following results were obtained.
Table 2
Absorbance value obtained at different 1mM PNP volume using spectrophotometer.
Test tube number Amount of reagent (ml) Absorbance
1mM PNP Distilled water
1 0.000 1.000 0.000
2 0.010 0.990 0.026
3 0.050 0.950 0.172
4 0.100 0.900 0.745
5 0.250 0.750 1.111
6 0.500 0.500 1.770
7 0.750 0.250 2.664
8 0.900 0.100 3.053
9 1.000 0.000 2.276
It was observed that after 0.1M NaOH was added to each tube, colour change was
observed. First test tube was colourless, 2nd
had a slightly yellow colour which became more
saturated with the increase of PNP volume in the test tube. The last test tube (number 9) had a
dark yellow colour.
To determine the concentration that gives the absorbance 1.000, the volume of 1mM
PNP were converted into the concentration of PNP. Dilution equation was used (Watson,2014):
where C is the concentration and V is the volume. Therefore to calculate the concentration of
PNP in the test tube number 1, the following equation is used:

Student number: 14003336
7
Table 3
Concentration of 1 mM PNP calculated for different 1mM PNP volumes.
Test tube number Amount of reagent (ml) Absorbance Concentration of PNP
(mM) 1mM
PNP
Distilled
water
1 0.000 1.000 0.000 0.000
2 0.010 0.990 0.026 0.010
3 0.050 0.950 0.172 0.050
4 0.100 0.900 0.745 0.100
5 0.250 0.750 1.111 0.250
6 0.500 0.500 1.770 0.500
7 0.750 0.250 2.664 0.750
8 0.900 0.100 3.053 0.900
9 1.000 0.000 2.276 1.000
From the Graph 3, it can be determined that for the PNP concentration equal to
0.260mM, the absorbance is equal to 1.000. This means that the concentration range of 1mM
PNP, for which it is directly proportional to absorbance is 0.00-0.25ml of PNP. Hence for these
values absorbance readings were obtained.

Student number: 14003336
8
Table 4
The absorbance value at different volume of 1mM PNP.
Test tube
number
Volume of reagent (ml) Absorbance
1mM PNP Distilled water
1 0.000 1.000 0.000
2 0.030 0.970 0.094
3 0.060 0.940 0.214
4 0.090 0.910 0.302
5 0.120 0.880 0.391
6 0.150 0.850 0.474
7 0.180 0.820 0.589
8 0.210 0.790 0.713
9 0.250 0.750 0.793
To calculate the amount of PNP, the following equation is used (Watson, 2014):
where N is the amount of PNP, C is the concentration of PNP and V is the volume of PNP.
To calculate the amount of PNP in test tube number 3:
Table 5
The amount of PNP ( moles) at different volume of PNP reagent (ml).
Test tube
number
Volume of reagent (ml) Absorbance Amount of
PNP( moles) 1mM
PNP
Distilled water
1 0.000 1.000 0.000 0.000
2 0.030 0.970 0.094 0.030
3 0.060 0.940 0.214 0.060
4 0.090 0.910 0.302 0.090
5 0.120 0.880 0.391 0.120
6 0.150 0.850 0.474 0.150
7 0.180 0.820 0.589 0.180
8 0.210 0.790 0.713 0.210
9 0.250 0.750 0.793 0.250
Finally, the calibration graph was produced.

Student number: 14003336
9
Graph 3 shows that increase of PNP amount ( mol) is directly proportional to increase in
absorbance value. It is supported by high value of
Effect of substrate on enzyme activity
To understand the influence of substrate on enzyme activity, in this part of experiment,
different concentrations of substrate (PNPP) were used. Two sets of controlled and
experimental tubes were prepared. In both, the amount of citrate buffer (pH=4.8) and 10mM
PNPP were the same. The only difference was that each control tube had 1ml more of distilled
water. It was to equal the mass in experimental and control tubes, because 1.0 ml of enzyme
solution was added to each experimental tube.

Student number: 14003336
10
Table 6
The absorbance values at different amount of substrate (10mM PNPP).
Test
tube
Amount of reagent (ml) Absorbance
10mM
PNPP
Distilled water Citrate buffer
pH=4.8
1 0.010 0.990 1.000 0.087
3 0.015 0.985 1.000 0.120
5 0.025 0.975 1.000 0.135
7 0.050 0.950 1.000 0.179
9 0.100 0.900 1.000 0.234
11 0.200 0.800 1.000 0.293
13 0.500 0.500 1.000 0.329
15 1.000 0.000 1.000 0.364
In the test tubes 1-7, there is a higher increase in absorbance than in test tubes 11-15.
To calculate PNPP concentration ([PNPP]), dilution equation is used (Watson,2014):
where C is the concentration and V is the volume. Therefore to calculate the concentration of
PNP in the test tube number 3, the following equation is used:
Table 7
Concentration of PNPP at different 10mM PNPP volumes.
Test
tube
Amount of reagent (ml) Absorbance [PNPP]
(mM) 10mM
PNPP
Distilled water citrate buffer
pH=4.8
1 0.010 0.990 1.000 0.087 0.033
3 0.015 0.985 1.000 0.120 0.05
5 0.025 0.975 1.000 0.135 0.083
7 0.050 0.950 1.000 0.179 0.167
9 0.100 0.900 1.000 0.234 0.333
11 0.200 0.800 1.000 0.293 0.667
13 0.500 0.500 1.000 0.329 1.667
15 1.000 0.000 1.000 0.364 3.333
To calculate the amount of PNP produced, the calibration graph (Graph 4) is used. The
absorbance value for each tube is divided by the line gradient ( . To calculate the
rate of reaction, the amount of PNP is divided by time of reaction (15 minutes).

Student number: 14003336
11
Table 8
The amount of PNP produced and the rate of reaction in each tube.
Test
tube
Amount of reagent (ml)
PNP ( mole) rate
( mole/min) 10mM
PNPP
Distilled
water
citrate buffer
pH=4.8
1 0.010 0.990 1.000 0.281 0.019
3 0.015 0.985 1.000 0.388 0.026
5 0.025 0.975 1.000 0.437 0.029
7 0.050 0.950 1.000 0.579 0.039
9 0.100 0.900 1.000 0.757 0.05
11 0.200 0.800 1.000 0.948 0.063
13 0.500 0.500 1.000 1.064 0.071
15 1.000 0.000 1.000 1.177 0.078
From the Graph 4, it can be observed that at the beginning with the increase of substrate, there
is a sharp increase in the rate of reaction. However, with time the increase is slower and finally
at some PNPP concentration the rate of reaction does not increase anymore and the maximum

Student number: 14003336
12
rate ( is reached. The values of and can be determined from the Michaelis-
Menten equation.
In order to calculate the rate of reaction, we use the following formula (Watson, 2014):
Table 9
Theoretical values of rate of reaction at different PNPP concentration.
Theoretical [PNPP] (mM) Theoretical rate of reaction
0.034 0.012
0.056 0.018
0.087 0.024
0.170 0.037
0.360 0.051
0.764 0.063
1.460 0.070
1.780 0.072
2.570 0.074
2.900 0.075
3.400 0.076

Student number: 14003336
13
By comparing experimental and theoretical rate of reaction, it can be noticed that for both
curves are very similar.
However, to get more accurate values of and , the Michaelis-Menten equation must be
converted into linear Lineweaver-Burk plot. To do so, reciprocals of rate of reaction and PNPP
concentration were calculated.
Table 10
Values needed to plot the Lineweaver-Burk plot.
V
( mole/min)
[PNPP] (mM)
0.019 0.033 52.363 30.000
0.026 0.050 38.161 20.000
0.029 0.083 33.973 12.000
0.039 0.167 25.699 6.000
0.051 0.333 19.702 3.000
0.063 0.667 15.757 1.500
0.071 1.667 14.041 0.600
0.079 3.333 12.697 0.300
From this graph, much more accurate values of and can be obtained.

Student number: 14003336
14
The effect of inhibitor on the enzyme activity
In this part of the experiment, instead of adding normal citrate buffer, a phosphate-containing
buffer was added. This buffer will inhibit the enzymatic reaction. To determine the influence of
inhibitor on enzyme activity, solutions with different amount of 10mM PNPP were made and
the absorbance values were measured.
Table 11
Absorbance at different 10mM PNPP volumes in the presence of inhibitor.
Test
tube
Volume of reagent (ml) Absorbance
10mM
PNPP
Distilled water Phosphate –
containing citrate
buffer pH=4.8
1 0.010 0.990 1.000 0.017
3 0.050 0.950 1.000 0.030
5 0.100 0.900 1.000 0.095
7 0.200 0.800 1.000 0.141
9 0.500 0.500 1.000 0.199
11 1.000 0.000 1.000 0.206
Using the absorbance values and the calibration graph the amount of product and therefore the
rate of the reaction can be obtained.
Table 12
The amount of PNP produced and the rate of reaction in each tube in the presence of
inhibitor.
Test
tube
Amount of reagent (ml)
PNP ( mole) rate
( mole/min) 10mM
PNPP
Distilled
water
Phosphate-
containing citrate
buffer pH=4.8
1 0.010 0.990 1.000 0.055 0.004
3 0.050 0.950 1.000 0.097 0.006
5 0.100 0.900 1.000 0.307 0.020
7 0.200 0.800 1.000 0.456 0.030
9 0.500 0.500 1.000 0.644 0.043
11 1.000 0.000 1.000 0.666 0.044

Student number: 14003336
15
From the Table 12, it can be easily noticed that with an increase of 10mM PNPP volume, the
rate of the reaction increases from 0.004 mole/min to 0.044 mole/min.
Graph 7 shows the relationship between the concentration of PNPP and its rate of reaction. The
increase at the beginning is not as steep as in the Graph 4. However to get more accurate
values, as in previous part of the experiment, the concentration of PNPP, in solutions with
different PNPP volume and in the presence of inhibitor, was calculated.
Table 13
Concentration of PNPP at different 10mM PNPP volumes.
Test
tube
Amount of reagent (ml) Absorbance [PNPP]
(mM) 10mM
PNPP
Distilled water citrate buffer
pH=4.8
1 0.010 0.990 1.000 0.017 0.033
3 0.050 0.950 1.000 0.030 0.167
5 0.100 0.900 1.000 0.095 0.333
7 0.200 0.800 1.000 0.141 0.667
9 0.500 0.500 1.000 0.199 1.667
11 1.000 0.000 1.000 0.206 3.333
As previously, to get more accurate values of and , the Michaelis-Menten equation
must be converted into linear Lineweaver-Burk plot. Reciprocals of the rate of reaction and
PNPP concentration were calculated.

Student number: 14003336
16
Table 14
Values needed to make the Lineweaver-Burk plot.
V
(�mole/min)
[PNPP] (mM)
0.004 0.033 250.000 30.303
0.008 0.167 125.000 5.988
0.020 0.333 50.000 3.003
0.030 0.667 33.333 1.499
0.043 1.667 23.256 0.600
0.044 3.333 22.727 0.300

Student number: 14003336
17
From the Graph 8, values of and can be obtained.
Effects of temperature on enzyme activity
In order to determine the effect of temperature on enzyme activity, samples were kept
for 15 minutes at different temperatures (range: 5oC-75
oC) and after the addition of NaOH to
experimental test tubes, the absorbance was measured. The amount of citrate buffer and
substrate were constant.
Table 15
Absorbance value at different temperatures in control test tubes.
controls
test tuba number 2 4 6 8 10 12
5.0mM PNPP (ml) 1 1 1 1 1 1
Citrate buffer pH=4.8 (ml) 1 1 1 1 1 1
Distilled water (ml) 1 1 1 1 1 1
Incubation temp (oC) 5 20 25 37 50 75
Absorbance 0.082 0.092 0.092 0.099 0.166 1.896
Table 16
Absorbance value at different temperatures in experimental test tubes.
experimental
test tuba number 1 3 5 7 9 11
5.0mM PNPP (ml) 1 1 1 1 1 1
Citrate buffer pH=4.8 (ml) 1 1 1 1 1 1
Incubation temp (oC) 5 20 25 37 50 75
Absorbance 0.121 0.264 0.332 0.621 1.025 1.794
To calculate the optimum temperature, the difference in absorbance of the corresponding test
tubes must be calculated as well as PNP amount and the rate of reaction.

Student number: 14003336
18
Table 17
The amount of PNP and the rate of reaction.
corresponding test tubes Difference in
absorbance
Amount PNP
(�mole)
rate
(�mole/min)
1&2 0.039 0.126 0.008
3&4 0.172 0.556 0.032
5&6 0.240 0.776 0.052
7&8 0.522 1.688 0.113
9&10 0.859 2.778 0.185
11&12 0.003 0.010 0.001
Table 18
Temperature against the rate of reaction.
Corresponding test
tubes
Rate (�mole/min) Temperature
(oC)
1&2 0.008 5
3&4 0.032 20
5&6 0.052 25
7&8 0.113 37
9&10 0.185 50
11&12 0.001 75
With the increase in temperature there is an increase in the rate of reaction. The trend remains
until the optimum temperature when the highest rate is observed. With further increase in
temperature, the rate falls quickly. From the Graph 9, we can see that the peak value is reached
at temperature around 40.8oC. On the other hand the graph is not very accurate and therefore
the best way is to determine the optimum range. In this case, it is 40.4-50.2oC.

Student number: 14003336
19
Table 19
Values of log(V) and 1/temperature.
Corresponding
test tubes
Rate
(�mole/min)
Temperature
(o
log(v) 1/Temperature
(o
1&2 0.008 278.200 -2.097 0.0036
3&4 0.032 293.200 -1.495 0.0034
5&6 0.052 298.200 -1.284 0.0034
7&8 0.113 310.200 -0.947 0.0032
9&10 0.185 323.200 -0.733 0.0031
11&12 0.001 348.200 -3.000 0.0029
The effect of pH on enzyme activity.
To measure how the rate of reaction is affected by the pH, the absorbance was
measured. In this part of the experiment, the amount of substrate and citrate buffer were
constant. The independent variable are pH values of citrate buffer.

Student number: 14003336
20
Table 20
Absorbance value at different pH of 1.0ml citrate buffer.
Test tuba number 1 3 5 7 9 11 13
Enzyme solution (ml) 1.0 1.0 1.0 1.0 5.5 1.0 1.0
pH of 1.0ml Citrate
buffer
3.0 4.0 4.5 5.0 5.5 6.0 7.0
Absorbance 0.036 0.214 0.291 0.363 0.328 0.253 0.05
With the increase of pH, in the test tubes 1-7 there is an increase in absorbance. However in the
test tubes 9-13, a decrease in absorbance can be observed. From this data, at pH=5.0, the
highest absorbance was recorded. In order to determine the optimum pH range, the amount of
PNP and the rate of reaction were calculated.
Table 21
Rate of reaction at different pH of 1.0 ml citrate buffer.
Test tube pH of 1.0 ml
citrate buffer
Amount of PNP
(�mole)
Rate (�mole/min)
1 3.0 0.116 0.008
3 4.0 0.692 0.032
5 4.5 0.941 0.063
7 5.0 1.174 0.078
9 5.5 1.061 0.071
11 6.0 0.818 0.055
13 7.0 0.162 0.011

Student number: 14003336
21
The Graph 11 presents the relationship between pH of 1.0ml citrate buffer and its rate of
reaction. As in the case of temperature, with the increase in pH, the rate increases up to a
certain point where it reaches the highest value. With further increase in pH, the rate of reaction
decreases. From the curve, the optimum pH range for acid phosphate is between 4.8 and 5.3.
Discussion
In these experiments, it has been demonstrated that there is a variety of factors that have
a tremendous effect on the rate of the enzymatic reaction. Temperature, amount of substrate,
presence of inhibitor and pH were investigated.
In order to confirm that the increase in substrate concentration results in the increase in
the rate of reaction up to a certain point, rate of the reaction was determined for different
volumes of 10mM PNPP in the solution. The results presented in the Michaelis-Menten
equation confirmed that hypothesis. Using the Lineweaver-Burk plot, the and were
equal to and respectively. In the Michaelis-Menten equation,
and The difference in results obtained from the Graph
4 and 6, gives the evidence how the real values can be underestimated using the first graph. By
comparing experimental and theoretical rate of reaction, it can be noticed that for both
curves are very similar. This suggests that the experimental curve is correct with the theoretical
data and the results obtained are correct.
After reaching a maximal velocity, when more substrate (PNPP) is added, molecules
have to wait for free enzyme to undergo catalytic reaction (Berg, Tymoczko, Stryer, 2012).
Unlike the , is independent on the acid phosphatase concentration and therefore is an
excellent enzyme affinity indicator. A low suggests weak enzyme-substrate binding and
therefore a low substrate concentration may be enough to reach a maximum rate (Hames,
Hooper, 2009).
Secondly, the effects of the inhibitor presence on the enzyme activity were noticed.
Literature states that buffer will inhibit the enzymatic reaction (Martini, Nath, Bartholomew,
2012). To prove that, a constant amount (1ml) of phosphate-containing citrate buffer was added
to the solutions with different amount of 10mM PNPP and the absorbance values were
measured. At the beginning in the Michaelis-Menten equation, the increase in the rate is slower

Student number: 14003336
22
than in inhibitor free reaction, however with time the maximum velocity is reached, This
supports the hypothesis that the substrate increase overcome the acid phosphatase. From the
Graph 8, values of and were calculated.
Without Inhibitor With Inhibitor
By comparing the results for the reaction in the presence and without an inhibitor, it can
be noticed that there is a small decrease in in reaction with inhibitor and a bigger increase
in , equal to 0.145mM. This suggest that a phosphate-containing citrate buffer is an
competitive inhibitor.
The relationship between temperature and enzyme activity was determined by taking
the absorbance measurement for the solutions at different temperatures: 5, 20, 25, 37, 50, 75 oC.
The amount of substarte and citrate buffer were constant. The Table 18 shows that for the first
five sets of corresponding test tubes, there is an increase in the rate of reaction, reaching at 50 oC the velocity of 0.185 mole/min. In the last set, sharp decrease was noticed. This supports
the theoretical information that with the increase in temperature there is an increase in the rate
of reaction by increasing the thermal energy of the substrate molecules. It reaches the peak
value and then enzyme starts to denature, non-covalent interactions are disrupted and the
reaction rate rapidly falls down (Roberts, Reiss, 2000). Plotting the data (Graph 9), indicated
the optimum temperature range of 40.4-50.2oC for this reaction.
Calculating the values of log(V) and 1/temperature, presented the relationship between
the temperature and the reaction velocity in an linear pattern. The Graph 10 clearly shows
almost directly proportional dependence from which the optimum temperature can be more
accurately determined. On the other hand, in this experiment there are too big differences
between the following temperatures to safely determine the optimum value. From the same
graph, it can be observed that one result is separated from the others and does not follow the
linear pattern. This is a denatured enzyme and due to lost enzymatic activity it has a very low
rate of reaction ( ).
Finally, pH affects the rate of an enzyme- catalysed reaction by changing the charges
carried by ionisable side chains. This will result in disruption of tertiary structure of an enzyme
and finally in the denaturation. Even the small pH deviations lead to change in the rate of the
reaction (Martini, Nath, Bartholomew, 2012). As recorded in the Table 20, the change of pH from
4.0 to 4.5 resulted in pH change of 0.077. The results of the experiment shows that with the
increase of pH, in the test tubes 1-7 there is an increase in absorbance. However in the test

Student number: 14003336
23
tubes 9-13, a decrease in absorbance can be observed. As in case of temperature, the Graph 11
is not enough accurate to determine the optimum pH therefore, the optimum pH range for acid
phosphate is between 4.8 and 5.3.
The results of the experiment were correct with the information stated in literature.
However, conducting the same experiment for different types of enzymatic reaction and
comparing the results might give an interesting feedback.
References
1. Hames, D., Hooper, N. 2009. Biochemistry, 3rd
edn. Abingdon: Taylor & Francis
Group.
2. Kiskines, A.M.P., Klibanov, A.M. 1996. Enzymatic reactions in organic media.
Glasgow: Blackie Academic & Proffesional.
3. Martini, F.H., Nath, J.L., Bartholomew E.F. 2012. Fundaments of anatomy &
physiology, 10th
edn. Edinburgh: Pearson.
4. Roberts, M., Reiss, M. 2000. Advanced Biology, 2nd
edn. UK: Nelson.
5. Watson, D. 2014. Year 1Biochemistry and Biomedical ScienceProtocol Booklet
2014/14.Keele University.