enzyme-instructed self-assembly of taxol promotes axonal
TRANSCRIPT

S1
Electronic Supplementary Information
Enzyme-instructed self-assembly of taxol promotes axonal
branching
Bin Mei,a,b,§ Qingqing Miao,a,§ Anming Tang,a and Gaolin Liang*,a
aCAS Key Laboratory of Soft Matter Chemistry, Departments of Chemistry, 96 Jinzhai Road, Hefei, Anhui
230026, China
bDepartment of Biology, College of Life Science, Anhui Medical University, Hefei, Anhui 230032, China
* Corresponding author:
E-mail: [email protected] (G.-L. L.).
Contents:
1. Materials and methods
2. Synthetic route of compound 1
3. Supporting figures
Electronic Supplementary Material (ESI) for Nanoscale.This journal is © The Royal Society of Chemistry 2015

S2
1. Materials and methods
1.1 Materials
All the starting materials were obtained from Adamas or Sangon Biotech. Commercially available reagents
were used without further purification, unless noted otherwise. All other chemicals were reagent grade or
better.
1.2 Methods
1.2.1 General methods
HPLC analyses were performed on a Shimadzu UFLC system equipped with two LC-20AP pumps and an
SPD-20A UV-vis detector using a Shimadzu PRC-ODS column, or on an Agilent 1200 HPLC system
equipped with a G1322A pump and an in-line diode array UV detector using an Agilent Zorbax
300SB-C18 RP column, with CH3CN (0.1% of TFA) and ultrapure water (0.1% of TFA) as the eluent. The
spectra of electrospray ionization-mass spectrometry (ESI-MS) were recorded on a LCQ Advantage MAX
ion trap mass spectrometer (Thermo Fisher). 1H NMR spectrum was obtained on a Bruker AV 300. Cryo
transmission electron microscopy (Cryo-TEM) images were obtained on a Tecnai F20 Transmission
Electron Microscope from FEI Company, operating at 200 kV. The cryo samples were prepared as
following: a special copper grid coated with carbon was put into Gatan SOLARUSTM plasma-cleaning
system to remove hydrocarbon contamination on the sample holder, and then the sample was dropped on
the copper grid in FEI Vitrobot sample plunger. The sample preparation was completed in the plunger.

S3
1.2.2 Synthesis of Fmoc-Phe-Phe-Lys (taxol)-Tyr(H2PO4)-OH (1)
1.2.2.1 Synthesis of Fmoc-Phe-Phe-Lys-Tyr(H2PO4)-OH (E)
Tetrapeptide Fmoc-Phe-Phe-Lys(Boc)-Tyr(H2PO4)-OH (D) was prepared with solid phase peptide
synthesis (SPPS). The Boc protecting group was cleaved with 95% TFA in DCM for 3 h at room
temperature to yield Fmoc-Phe-Phe-Lys-Tyr(H2PO4)-OH (E) after HPLC purification (Scheme S1). Mass
of E: calc. for C48H53N5O11P, [(M+H)+]: 906.35, obsvd. ESI/MS: m/z 906.34 (Figure S1).
1.2.2.2 Synthesis of Suc-taxol (B)
Taxol (341 mg, 0.4 mmol) was added to succinic anhydride (140 mg, 1.4 mmol) in the presence of
4-dimethylamino-pyridine (86 mg, 0.7 mmol) which was previously dried under vacuum for 2 h. Then 8
mL of dry pyridine was added and the solution was stirred for 3 h at room temperature. The
2’-succinyl-taxol was purified by extraction according to following procedure: After 20 mL of dry
dichloromethane (DCM) was added into the reaction mixture, the organic phase was washed using 1 M
HCl solution (20 mL × 3) and water (20 mL × 3). Water phase was extracted by DCM (10 mL × 3). The
organic phase was combined and washed by brine (10 mL × 3) and dried over Na2SO4. The filtrate was
concentrated on rotary evaporator and the crude product suc-taxol was used without further purification
(Scheme S1).
1.2.2.3 Synthesis of NHS-suc-Taxol (C)
Suc-taxol (B, 190.6 mg, 0.2 mmol) was mixed with N-hydroxysuccinimide (23.0 mg, 0.2 mmol), then 10
mL of CHCl3 was added to obtain a well-dispersed solution. After N, N’-dicylcohexylcarbodiimide (41.2
mg, 0.2 mmol) was added into the mixture, the solution was stirred for 4 h at room temperature. The
S4
NHS-suc-Taxol (C) was purified by chromatography with chloroform-methanol as the eluent (19:1)
(Scheme S1).
1.2.2.4 Synthesis of Fmoc-Phe-Phe-Lys(taxol)-Tyr(H2PO4) (1)
Fmoc-Phe-Phe-Lys-Tyr(H2PO4) (E, 54.4 mg, 0.06 mmol) was dissolved in 5 mL water, and the pH of the
solution was adjusted to 8.5 with sodium carbonate. NHS-suc-taxol (C, 50 mg, 0.0476 mmol) was
dissolved in 3 mL acetone, and then added into the water solution drop wise. The ratio of water/acetone
was adjusted to keep the reaction mixture clear. The mixture was stirred at room temperature for 12 h. The
reaction mixture was subjected to HPLC purification to yield 1 (Scheme S1). Mass of 1: calc. for
C99H104N6O27P, [(M-H)-]: 1839.67, obsvd. ESI-MS: m/z 1839.92 (Figure S2). 1H NMR of 1 (d6-DMSO,
300 MHz, Figure S3) δ (ppm): 9.21 (d, J = 6.0 Hz, 1 H), 8.18 (d, J = 6.0 Hz, 1 H), 8.08 (t, 2 H), 7.97 (d, J =
9.0 Hz, 1 H), 7.86 (t, 6 H), 7.76-7.47 (br, 10 H), 7.44 (d, J = 3.0 Hz, 4 H), 7.29-7.11 (br, 16 H), 7.07 (d, J =
6.0 Hz, 2 H), 6.29 (s, 1 H), 5.82 (t, 1 H), 5.53 (t, J = 9.0 Hz, 1 H), 5.41 (d, J = 6.0 Hz, 1 H), 5.33 (d, J = 9.0
Hz, 1 H), 4.90 (d, J = 9.0 Hz, 1 H), 4.62 (m, 2 H), 4.41 (m, 1 H), 4.30-4.00 (br, 7 H), 3.08-2.53 (br, 14 H),
2.36 (m, 2 H), 2.23 (s, 3 H), 2.08 (s, 3 H), 1.76 (s, 3 H), 1.49 (s, 4 H), 1.23 (br, 6 H), 1.06-0.96 (br, 6 H).
1.2.3 MTT assay
The cytotoxicity was measured using the 3-(4, 5-dimethylthiazol-2-yl)-2, 5-diphenyltetrazolium bromide
(MTT) assay with HeLa cells. Cells growing in log phase were seeded into 96-well cell-culture plate at 3 ×
103/well. The cells were incubated for 12 h at 37 °C under 5% CO2. The solutions of 1 or taxol (100
µL/well) at concentrations of 1 nM, 10 nM, 100 nM, 1 µM, or 10 µM in 100 µL medium were added to the
wells, respectively. The cells were incubated for 24 and 48 h at 37 °C under 5% CO2. A solution of 5

S5
mg/mL MTT dissolved in phosphate buffered saline (PBS) (pH 7.4) (10 µL /well) was added to each well
of the 96-well plate. A solution of 10% SDS dissolved in 0.01 M HCl (100 µL/well) was added to dissolve
the formazan after an additional 4 h-incubation. The data were obtained using an ELISA reader
(VARIOSKAN FLASH) to detect its absorption at 570/680 nm. The following formula was used to
calculate the viability of cell growth: Viability (%) = (mean of Absorbance value of treatment group /
mean of Absorbance value of control) ×100.
1.2.4 Microtubule imaging assay
Transfected cherry-tubulin HeLa cell lines was offered by Laboratory of Cellular Dynamics in University
of Science and Technology of China. HeLa cells were cultured in Dulbecco’s modified eagle medium
(DMEM, GIBCO) supplemented with 10% fetal bovine serum (FBS, GIBCO) and streptomycin (100
μg/mL) and kept in a humid atmosphere of 5% CO2 at 37 °C. The HeLa cells were plated on 3.5 cm cell
culture dish at 50% cell density in the next day. Then the HeLa cells were washed for three times with
phosphate buffered saline (PBS) and incubated with 10 μM 1 or taxol in serum-free medium at 37 °C for 2
h in a CO2 incubator. Then, the cells were washed with PBS for another three times and fixed by 4%
paraformaldehyde for 30 min prior to imaging.
1.2.5 Neuronal morphology assay
1.2.5.1 Neurons culture
Primary cultured cortical neurons were obtained from 18-day-old C57BL/6 mouse embryos. Briefly, the
cerebral cortex was dissected and incubated with 0.25% trypsin at 37 °C for 15 minutes. Cells were then
mechanically dissociated using a Pasteur pipette with a fire-narrowed tip in culture medium and plated at a

S6
low density of 2 × 10⁴ cells/ml on the coverslips pre-coated with poly-D-lysine (10 µg/ml). Cells were
maintained in neurobasal/B27 medium containing 0.5 mM glutamine, 100 units/ml penicillin, and 100
µg/ml streptomycin in a humidified environment of 5% CO2/95% air at 37 °C. Half-changes of medium
were done twice weekly.
1.2.5.2 Immunofluorescence
Neurons (days in vitro 5, DIV5) were incubated with 1 or taxol at 10 nM for 20 h, then fixed with 4%
paraformaldehyde for 20 min at room temperature. Subsequently, fixed neurons were washed for 3 times
with PBS, followed by blocking with 5% bovine serum albumin in PBS for 1 h at room temperature. After
blocking, cells were incubated with monoclonal anti-MAP2 antibody (1:500, Millipore) overnight at 4 °C.
After washing for three times with PBS, cells were incubated with Alexa Fluor 488 (green)-conjugated
antimouse secondary antibody for 1 h at 37 °C. After washing with PBS for three times and distilled water
once, the final samples were mounted on a glass slide with VECTASHIELD mounting medium. Images
were acquired using Carl Zeiss microscope.
1.2.5.3 Neuron morphology analysis
ImageJ (National Institute of Health) with Neuron J plugin were respectively used for the reconstruction of
the neurons’ morphology and for the quantitative analysis.
1.3 Statistical analysis
All the data are analyzed using Origin 8.0. All the bars in figures are represented as mean ± sd. The data
was compared and analyzed using the one-way analysis of variance test (ANOVA). MTT assay result was
analyzed using pair sample t-test. Results were considered significant at P < 0.05.

S7
2. Synthetic route for compound 1
Scheme S1. Synthetic route for compound 1.
O
O
OO
OH
OOO
HO
NH
OH
OO
O
O
O
O
O
+
O
O
OO
OH
OOO
HO
NH
O
OO
O
O
O
OHO
O
O
OO
OH
OO
O
HO
NH
O
OO
O
O
O
OON
O
O
O NH
HN
NH
HN
O
O
O
NH2
O
O
OH
O
POHO
OH
DMAPDry Pyridine
NHSDCCCHCl3
Acetone/H2O PH 8.0
A B C
O NH
HN
NH
HN
O
O
O
HN
O
O
OH
O
POHO
OH
O
O
D
E
1
+
95% TFA in CH2Cl2
C2'
O
O
OO
OH
OO
O
HO
NH
O
OO
O
O
O NH
HN
NH
HN
O
O
O
HN
O
O
O
POHO
OH
O
OH
O

S8
3. Supporting figures
Figure S1. ESI-MS spectrum of E.
Figure S2. ESI-MS spectrum of 1.

S9
Figure S3. 1H NMR spectrum of 1.
Figure S4. HPLC trace of 1 (black), and time course HPLC traces of the solution containing 1 wt% 1
incubated with 300 U/mL alkali phosphatase at 37 °C at pH 8.5. Wavelength for detection: 300 nm.

S10
Figure S5. HR-ESI/MS spectrum of 2.
Figure S6. Tyndall effect of the 4-fold diluted incubation mixture of 1 at 1 wt% after 12 h incubation with
300 U/mL alkali phosphatase at 37 °C and pH 8.5 excited by laser light.
S11
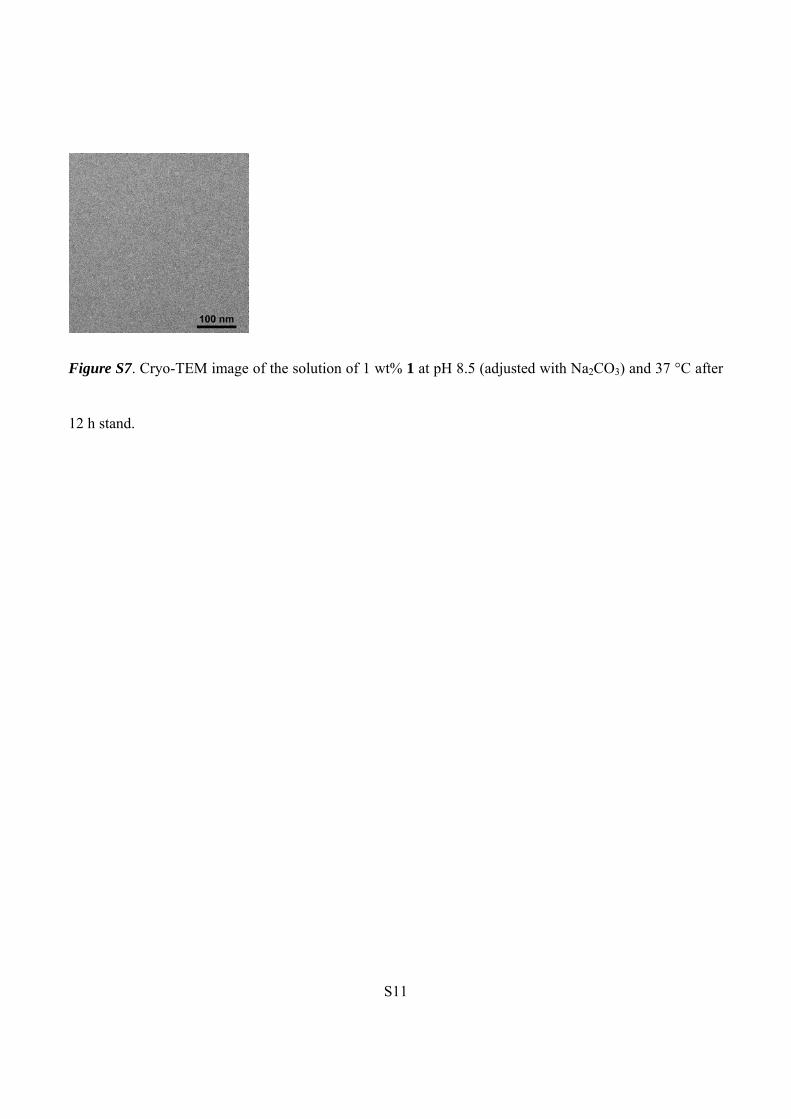
Figure S7. Cryo-TEM image of the solution of 1 wt% 1 at pH 8.5 (adjusted with Na2CO3) and 37 °C after
12 h stand.

S12
Figure S8. Fluorescence images (left) and differential interference contrast (DIC) images (right) of
HeLa cells in the absence (bottom row) or presence of 10 μM of 1 (top row) or taxol (middle row)
in serum-free medium at 37 °C for 2 h, washed with PBS for three times prior to imaging,
respectively.

S13
Figure S9. The average fluorescence intensity of microtubules in HeLa cells in Figure S8. There is no
difference between 1-treated and taxol-treated group (P > 0.05). But there is obvious difference between
treatment groups and control group (P < 0.001).
Figure S10. MTT assay of 1 or taxol on HeLa cells. These experiments were performed in triplicate. Error
bars represent standard deviations of three independent experiments.