enzyme dehydration using microglassification™...
TRANSCRIPT

Syddansk Universitet
Enzyme dehydration using Microglassification™ preserves the protein's structure andfunction
Aniket, [No Value]; Gaul, David A; Bitterfield, Deborah L; Su, Jonathan T; Li, Victoria M;Singh, Ishita; Morton, Jackson; Needham, DavidPublished in:Journal of Pharmaceutical Sciences
DOI:10.1002/jps.24279
Publication date:2015
Citation for pulished version (APA):Aniket, . N. V., Gaul, D. A., Bitterfield, D. L., Su, J. T., Li, V. M., Singh, I., ... Needham, D. (2015). Enzymedehydration using Microglassification™ preserves the protein's structure and function. Journal of PharmaceuticalSciences, 104(2), 640-51. DOI: 10.1002/jps.24279
General rightsCopyright and moral rights for the publications made accessible in the public portal are retained by the authors and/or other copyright ownersand it is a condition of accessing publications that users recognise and abide by the legal requirements associated with these rights.
• Users may download and print one copy of any publication from the public portal for the purpose of private study or research. • You may not further distribute the material or use it for any profit-making activity or commercial gain • You may freely distribute the URL identifying the publication in the public portal ?
Take down policyIf you believe that this document breaches copyright please contact us providing details, and we will remove access to the work immediatelyand investigate your claim.
Download date: 03. jun.. 2018

RESEARCH ARTICLE – Pharmaceutical Biotechnology
Enzyme Dehydration Using MicroglassificationTM Preserves theProtein’s Structure and Function
ANIKET,1 DAVID A. GAUL,2 DEBORAH L. BITTERFIELD,2 JONATHAN T. SU,1 VICTORIA M. LI,3 ISHITA SINGH,3
JACKSON MORTON,3 DAVID NEEDHAM1
1Department of Mechanical Engineering and Materials Science, Duke University, Durham, North Carolina 277082Drug Delivery, Southeast TechInventures, Inc, Durham, North Carolina 277133Department of Biomedical Engineering, Duke University, Durham, North Carolina 27708
Received 5 September 2014; revised 29 October 2014; accepted 3 November 2014
Published online in Wiley Online Library (wileyonlinelibrary.com). DOI 10.1002/jps.24279
ABSTRACT: Controlled enzyme dehydration using a new processing technique of MicroglassificationTM has been investigated. Aqueoussolution microdroplets of lysozyme, �-chymotrypsin, catalase, and horseradish peroxidase were dehydrated in n-pentanol, n-octanol,n-decanol, triacetin, or butyl lactate, and changes in their structure and function were analyzed upon rehydration. Water solubility andmicrodroplet dissolution rate in each solvent decreased in the order: butyl lactate > n-pentanol > triacetin > n-octanol > n-decanol.Enzymes MicroglassifiedTM in n-pentanol retained higher activity (93%–98%) than n-octanol (78%–85%) or n-decanol (75%–89%), whereasthose MicroglassifiedTM in triacetin (36%–75%) and butyl lactate (48%–79%) retained markedly lower activity. FTIR spectroscopy analysesshowed �-helix to �-sheet transformation for all enzymes upon MicroglassificationTM, reflecting a loss of bound water in the dried state;however, the enzymes reverted to native-like conformation upon rehydration. Accelerated stressed-storage tests using MicroglassifiedTM
lysozyme showed a significant (p < 0.01) decrease in enzymatic activity from 46,560 ± 2736 to 31,060 ± 4327 units/mg after 3 monthsof incubation; however, it was comparable to the activity of the lyophilized formulation throughout the test period. These results establishMicroglassificationTM as a viable technique for enzyme preservation without affecting its structure or function. C© 2014 Wiley Periodicals,Inc. and the American Pharmacists Association J Pharm SciKeywords: dehydration; enzymes; FTIR; microparticles; protein formulation; protein structure; drying
INTRODUCTION
The development of enzyme formulations that are stable dur-ing shipping and long-term storage is one of the most importantconsiderations in developing enzymes as commercial products.1
The chemical complexity and marginal stability of higher orderor multi domain protein structure often presents significantstability problems.2 For ease of preparation and handling, liq-uid preparations are generally preferred. However, the pres-ence of water in liquid preparations has the potential to en-courage structural changes or even serve as a reactant forchemical degradation.3 Stress conditions in liquid media, suchas heating and freezing, shaking, pH variations, and changesin amino acid side-chain structures may result in undesirableby-products and compromised functionality.4,5 Shear forces as-sociated with mechanical shaking can partition proteins to theair–water interface and thus expose them to degrading interfa-cial tensions. Gidalevitz et al.4 studied the behavior of glucoseoxidase, alcohol dehydrogenase, and urease, and found that theexposure of enzymes to such tensions and the more hydropho-bic air phase encouraged partial unfolding. Variations in liquidmedia pH can change the oxidation potential of oxidants, al-ter the binding affinity between the catalytic metal ions andionizable amino acids, and modify the stability of the oxida-tion intermediates.5 Therefore, when the inherent stability andfunction of the protein, or the economics and logistics of product
Correspondence to: David Needham (Telephone: +919-660-5355; Fax: +919-660-8963; E-mail: [email protected])
Journal of Pharmaceutical SciencesC© 2014 Wiley Periodicals, Inc. and the American Pharmacists Association
shipping (e.g., maintaining a cold chain) and use (e.g., loss ofsoluble protein because of surface or interfacial adsorption) pre-clude storage in the liquid form, the protein product is generallydried and stored in a solid form.6 Traditional drying methodsare often accompanied by a modification in the product’s ther-mal history, which may impact thermo-mechanical properties,such as diffusivity and stability, as well as product quality oractivity.7 Enzymes such as lysozyme and catalase undergo anirreversible loss in activity when freeze-dried in the absence ofexcipients, with activity losses of up to ∼7% for lysozyme and35%–50% for catalase.8 In the food processing industry, spraydrying of whey proteins has been known to result in partial de-naturation and increased insolubility of the dried product, evenat modest outlet temperatures of 60◦C.9,10 Freeze drying ligninperoxidase, an enzyme used in degradation of lignin in wood,has been shown to result in ∼30% loss of activity, although theinclusion of sucrose improved activity retention.11 Lyophiliza-tion and spray drying methods have been very well developedand customized within the pharmaceutical industry; the use ofexcipients and stabilizers in therapeutic protein formulationshave generally been very successful in minimizing loss in func-tional activity.1,12 Nevertheless, challenges remain in address-ing the dehydration of complex biologics, such as recombinanthuman interferon-(, which is prone to aggregation induced, inpart, because of adsorption at air–liquid and solid–air inter-faces during the drying procedure.13,14 Therefore, a successfuldrying technique should be able to minimize process dependentstresses such as thermal, mechanical, interfacial adsorption,and pressure induced instability without irreversible changesto enzyme function.15
Aniket et al., JOURNAL OF PHARMACEUTICAL SCIENCES 1

2 RESEARCH ARTICLE – Pharmaceutical Biotechnology
The presence of water in the surrounding microenvironmentof most globular proteins enhances its conformational freedomneeded to relieve stresses imposed by dynamic structural andenvironmental changes involving temperature, salt concentra-tion, or addition of hydrophobic interfaces.7,16 The removal ofthe surrounding water, in particular, the partial removal ofwater of hydration, can improve protein storage and stabil-ity by restricting intra-domain mobility and alleviating water-dependent physicochemical degradation pathways. The loss ofenzyme functionality is a two-step phenomenon that involvesreversible unfolding followed by kinetically irreversible stepsthat may lead to aggregation or covalent structural changes.17
We have recently reported that a new dehydration technol-ogy, called MicroglassificationTM, can controllably remove wa-ter from proteins leading to rapid solidification at ambienttemperature.18 Studies on single lysozyme microdroplet dehy-dration have shown that by adjusting the water activity of anorganic medium, such as n-decanol, the microdroplet can bedehydrated to sub-monolayer hydration levels in the form of asolid microsphere having a concentration of 700–1150 mg/mL.19
Globular proteins, such as bovine serum albumin (BSA) canbe similarly dehydrated to sub-monolayer water coverage withconcomitant and reversible structural changes upon rehydra-tion and only minor levels of irreversible aggregation.18 Inthis work, we report the continued evaluation and optimiza-tion of MicroglassificationTM on a series of enzymes: lysozyme,"-chymotrypsin, catalase, and horseradish peroxidase (HRP),using a range of dehydrating solvents. The enzymatic activityof each of the MicroglassifiedTM enzymes has been analyzedupon rehydration and compared with the activity of a commer-cially available lyophilized formulation. Moreover, comprehen-sive analyses of the effect of MicroglassificationTM on enzymesecondary structure have been carried out using Fourier trans-form infrared spectroscopy (FTIR). In a preliminary study, wehave also performed accelerated storage tests to evaluate theeffect of stressed storage conditions on the structure and func-tion of MicroglassifiedTM lysozyme powder.
MATERIALS AND METHODS
Materials
All reagents and enzymes including chicken egg whitelysozyme, bovine pancreas "-chymotrypsin, bovine liver cata-lase, and HRP were purchased in lyophilized form from Sigma–Aldrich (St. Louis, Missouri). The solvents n-pentanol, n-octanol, n-decanol, triacetin, and butyl lactate were used asreceived without further purification. Enzyme solutions wereobtained by dissolving the lyophilized samples in phosphatebuffer saline.
Water Solubility in Organic Phase
Prior to dehydrating the protein microdroplets, it is necessaryto measure the solubility of water in the dehydrating solvents inorder to determine water-saturation levels and fractional watersaturation (f). The f value represents the ratio of the experimen-tal water concentration to saturated water concentration in aparticular solvent and thus establishes the correlation betweenthe water removal and its chemical potential. Water solubilitywas measured and verified using two independent techniques:Refractive index method and Karl Fischer titration.
Refractive Index Method
A series of standard solutions (water-in-solvent) of the dryingsolvents were prepared by mixing the drying solvent with DIwater (0–100 mg/mL). The solution was allowed to equilibrateat room temperature (23◦C) for 24 h and its refractive index wasmeasured in triplicate using a digital DR-A1 Abbe refractome-ter (Atago, Bellevue, Washington). The refractive indices wereadjusted to the corresponding value at 22◦C using the equation:n22 = nx − 0.00045 (Tx – 22), where nx is the refractive indexof the solution at temperature Tx.
20 The refractive index val-ues were plotted against water concentration in that solvent,and the refractive indices of the solvent, which were partiallysaturated (one phase), were fit to a second-order polynomialtrend line. The intersection of this trend line with the averagerefractive index of the fully saturated solvent (two phases) wastaken to be the solubility limit of water in that drying solvent.
Karl Fisher Titration
The water content of the saturated solvent/water mixtureswas measured by Karl Fisher titration using Aquastar AQC34coulometer (Mettler Toledo, Columbus, Ohio). A 0.05–0.10 gsample of the solvent-rich phase was titrated against AquastarCombiCoulomat fritless reagent (n = 5), and the water contentwas reported in units of (g water/ 100 g solution).
To compare the enzyme hydration in different solvents, it isimportant to correlate water activity (aw) to fractional watersaturation (f) value. For the solvents used in this study, suchcorrelations have already been reported for n-pentanol and n-decanol by our group,18 and for n-octanol by Segatin et al.21 Theaw of water–triacetin and water–butyl lactate solutions wereset between 0.11 and 0.90 by saturated salt solutions usingpreviously described isopiestic protocols18 and equilibrated for1 month at 22◦C. The water content of the partially saturatedtriacetin or butyl lactate phase corresponding to each aw wasdetermined by Karl Fischer titration (n = 5).
Single Microdroplet Dissolution
A micropipette consisting of a single tapered glass capillarywith a tip diameter of 4–10 :m was employed to study the disso-lution of a single water droplet in each drying solvent. Followingthe methods established in our laboratory,22,23 the micropipettewas mounted upon a micromanipulation system attached to amicroscope equipped with a digital camera. The advantage ofthis setup is that it permits the manipulation of single pure-aqueous24 or aqueous protein solution microdroplets,19,23 or gasmicro-bubbles22 of the fluid, which are typically tens of micronsin diameter. Because each of the solvents in this study wasmutually soluble with, but not miscible in, water, it was possi-ble to clearly define an observable water–solvent interface. Inseparate experiments, single ∼80-:m diameter water micro-droplets were expelled in each of the organic phases and thetime-dependent dissolution of the droplets was recorded. Thetime required for complete droplet dissolution was calculated byextrapolating the droplet diameter to zero. The diffusion coeffi-cient of water in the drying solvent was calculated as describedby Su et al.23
Enzyme MicroglassificationTM
MicroglassificationTM of each enzyme was carried out by creat-ing a water-in-oil emulsion of each enzyme solution (20 mg/mL)with 1.5 mL of the dehydrating medium in a microcentrifuge
Aniket et al., JOURNAL OF PHARMACEUTICAL SCIENCES DOI 10.1002/jps.24279

RESEARCH ARTICLE – Pharmaceutical Biotechnology 3
tube. The volume of the enzyme solution to be added was ad-justed to achieve a final f value of 0.5, based on our previousexperience that most of the water from the protein can be re-moved at this condition.18,19 The volume of enzyme solution, Vw,was calculated according to: Vw = f × Vs × Cs × D, where f is thedesired water saturation fraction, Vs is the volume of solvent,Cs is the solubility of water in the solvent (g water/g solvent),and D is the density of the solvent. Based on the solubility limitof each solvent (see results), 24, 32, 52, 70, and 117 :L of theenzyme solution was added to 1.5 mL of n-decanol, n-octanol,triacetin, n-pentanol, and butyl lactate, respectively. As a rep-resentative calculation, 70 :L of enzyme solution was added to1.5 mL of n-pentanol, which has a density of 0.811 g/cm3 andwater solubility of 11.43 g water/100 g n-pentanol (equivalent to10.31 g water/100 g solution), to achieve f of 0.5. The emulsionwas vortexed at 10,000 rpm for 5 min leading to the forma-tion of MicroglassifiedTM beads. The supernatant was removed,and the MicroglassifiedTM product was rinsed with ethanol toremove any remaining solvent and vacuum dried overnight ina desiccator over drierite (W.A. Hammond Drierite CompanyLtd., Xenia, Ohio).
Particle Size Distribution
To analyze particle size distribution, a 20 :L drop of1 wt% MicroglassifiedTM particles suspended in n-pentanol wasmounted on a clean glass slide and covered with a cover-slip.Multiple images were acquired from 20 random regions (∼3000particles) using a Nikon Diaphot 200 (Nikon, Melville, NewYork) optical microscope equipped with a 40× objective. Theparticle size was measured by image analyses using the Im-ageJ program (http://rsb.info.nih.gov/ij/index.html), and theirfrequency distribution in the size ranges of 0–5, 5–10, and>10 :m was determined.
Measurements of Enzyme Activity
Lysozyme
The activity assay for lysozyme measures the rate atwhich the enzyme lyses intact Micrococcus lysodeikticus cells.MicroglassifiedTM and lyophilized lysozyme samples (n = 5)were dissolved in 0.1 M phosphate buffer (pH 6.24) and thendiluted to 0.025 mg/mL. A 100 :L volume of the test samplewas added to 2.6 mL of a 0.15 mg/mL solution of M. lysodeik-ticus cells in phosphate buffer. The decrease in solution ab-sorbance was measured at 450 nm for 3 min at 25◦C usinga UV–Vis spectrophotometer (Shimadzu UV-1601, ShimadzuCorporation, Columbia, Maryland). The enzyme activity wasbased on the premise that one unit of lysozyme produces achange of 0.001 absorbance units per minute in a suspension ofM. lysodeikticus cells (substrate) at 450 nm in a 2.6 mL reactionmixture at pH 6.24 and 25◦C.24
�-Chymotrypsin
MicroglassifiedTM and lyophilized "-chymotrypsin samples (n= 5) were dissolved in 1 mM cold HCl at a concentration of100 :g/mL. A 100 :L test solution was mixed with 1.42 mL of80 mM tris buffer (pH 7.8), 1.40 mL of 1.8 mM N-benzoyl-L-tyrosine ethyl ether (BTEE) substrate, and 80 :L of 2 M CaCl2.The increase in absorbance resulting from the breakdown ofBTEE into N-benzoyl-L-tyrosine and ethanol was monitored at256 nm. The determination of the enzyme activity was based on
the premise that one unit "-chymotrypsin hydrolyzes 1.0 :molBTEE per min at pH 7.8 in a 3.0 mL reaction mixture at 25◦C.25
Catalase
MicroglassifiedTM and lyophilized catalase samples (n = 5) wererehydrated in 50 :M phosphate buffer (pH 7.0) at a concentra-tion of 1.0 mg/mL and then diluted to 25 :g/mL. 100 :L testsolution was added to 2.9 mL of buffer followed by 5 :L of 30%H2O2 solution. The contents were mixed by inversion and therate of change of absorbance was monitored at 240 nm. Theactivity for catalase was determined on the premise that oneunit catalase decomposes 1.0 :mol of H2O2 per min at pH 7.0in a 3.0 mL reaction mixture at 25◦C.26
Horseradish Peroxidase
MicroglassifiedTM and lyophilized HRP samples (n = 5) weredissolved in 0.1 M phosphate buffer (pH 6.0) at a concentrationof 100 :g/mL. A 100 :L test solution was added to 160 :L of50% H2O2, 2.10 mL of DI water, and 320 :L each of phosphatebuffer and pyrogallol (substrate). The contents were mixed byinversion at 20◦C and the enzymatic conversion of pyrogallolto purpurogallin was monitored at 420 nm. The determinationof the enzyme activity was based on the premise that one unitHRP forms 1.0 mg of purpurogallin from pyrogallol in 20 s atpH 6.0 in a 3.0 mL reaction mixture at 20◦C.27
Protein Concentration
To normalize the enzymatic activity, the total protein content ofeach sample was determined using the bicinchoninic acid (BCA)assay according to the manufacturer’s instructions (ThermoScientific, Rockford, Illinois). Known concentrations of BSAserved as standards.
Analyses of Enzyme Secondary Structure
The secondary structure of both dried and rehydratedMicroglassifiedTM enzymes (n = 5) was analyzed by FTIR usingFTLA2000 spectrometer (ABB, Wickliffe, Ohio) equipped witha diamond crystal attenuated total reflectance (ATR) acces-sory. Samples were rehydrated at a concentration of 50 mg/mL.Lyophilized enzyme formulations, both dried and rehydrated,served as controls. For each sample, a 200-scan interferogramwas collected at a resolution of 4 cm−1 using an empty cell as thebackground. The spectra of the sample buffer were subtractedfrom the spectra of the rehydrated samples using PROTA soft-ware package implemented within Bomem-GRAMS/32 AI. Thebaseline of the spectra was adjusted from 1460 to 1720 cm−1 toaccommodate the amide I and amide II regions. A combinationof Fourier self-deconvolution (FSD), second derivatization, andcurve fitting algorithms were employed to elucidate enzymesecondary structure, as described by Dong et al.28 Briefly, res-olution enhancement of the original spectra was carried out inthe amide I region (1600–1700 cm−1) by FSD at an enhance-ment factor of 2.6. The secondary derivatives of the deconvo-luted spectra were obtained, baseline corrected, inverted, andsmoothed using seven-point Savitsky–Golay function. The re-solved spectra were fitted to a Gaussian curve profile and thepeaks were assigned as per the convention described in theliterature.29 The relative area of each of the resolved peaks wasused for quantitative analyses.
DOI 10.1002/jps.24279 Aniket et al., JOURNAL OF PHARMACEUTICAL SCIENCES

4 RESEARCH ARTICLE – Pharmaceutical Biotechnology
Accelerated Storage Test
The effect of stressed storage conditions on enzyme activityand structure was evaluated for lysozyme as a representa-tive model. We realize that real-time stability studies are ob-viously the most reliable demonstration of a product’s shelflife, and accelerated storage testing, based on the Arrheniusequation, is a practical means of quality assurance for biologi-cal standards.30,31 However, we chose to use a simpler test forpreliminary analysis, which has been previously described inthe literature.32,33 Briefly, ∼30 mg of dried MicroglassifiedTM
lysozyme prepared in n-pentanol was aliquoted in glass vialsand secured with rubber-lined plastic caps. The lyophilizedlysozyme samples served as control. The samples were stored at40◦C for 3 months in a hot air oven (n = 3/time-point), and theenzyme activity and secondary structure of the powders wereanalyzed at the end of each month using the methods describedearlier. Although the exact level of hydration of these sampleswas not determined, both the MicroglassifiedTM and lyophilizedsamples were stored under vacuum prior to sealing the vials.We have previously shown that MicroglassifiedTM lysozyme andlyophilized lysozyme powders absorb the same amount of wa-ter as a function of water activity,19 so it is assumed that bothsamples had the same low level of residual moisture.
Statistical Analyses
Where appropriate, the data were expressed as the means ± SDand analyzed statistically by one-way ANOVA using Tukey’spost-hoc test. A p value <0.05 was considered statistically sig-nificant.
RESULTS
Water Solubility Limit and Dehydration Rate
Figure 1 shows the variation in refractive index of the water–n-pentanol system with increasing water concentration. Asecond-order polynomial trend-line was fit to the data repre-senting the single-phase system, and its intersection with theaverage of the two-phase system represents the solubility limitof water in n-pentanol. Note that this slightly nonlinear trendfor refractive index versus water concentration is in agreementwith other measures of the same property for isomeric pentanolin water.34 The solubility limit of water in n-pentanol was foundto be 11.43 g water/100 g n-pentanol, which corresponds to10.31 g water/100 g solution. The solubility limit values calcu-lated using refractive index and Karl Fischer titration methods,and the diffusion coefficient of water in each solvent are shownin Table 1. The diffusion coefficient of water in n-pentanol andn-octanol has been previously reported by Su et al.23 Over-all, our results show that in the alcohol homologous series, anincrease in the chain length of the primary alkyl-alcohols de-creases their water solubility limit. We have included literaturevalues for the solubility limit,35,36 solvent’s refractive index,37
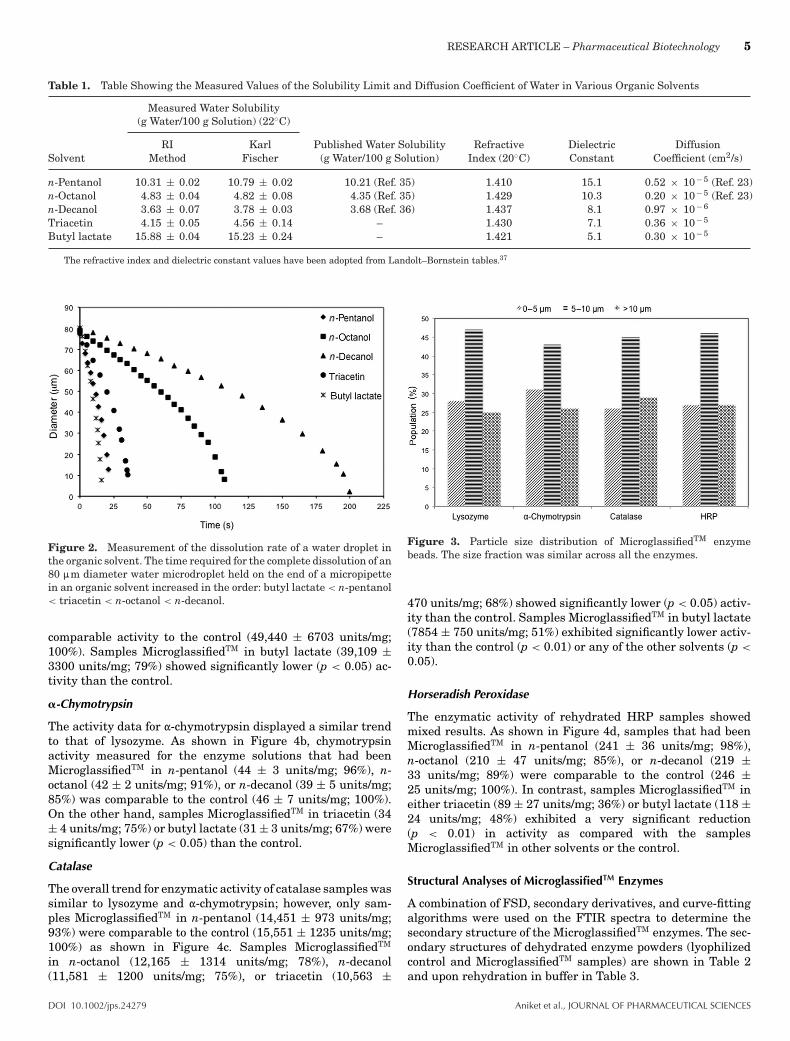
and dielectric constant37—which will be used in discussing thedehydration mechanism. Figure 2 shows the microdroplet dis-solution curves for 80-:m diameter water droplets for each ofthe drying solvents tested. It was found that the solubility ofwater as well as the initial water dissolution rate in the dry-ing media decreased in the order: butyl lactate > n-pentanol >
triacetin > n-octanol > n-decanol; time required for completedissolution of such an 80-:m diameter water microdroplet were
Figure 1. The variation of refractive index of water–n-pentanol sys-tem with increasing concentration of water in n-pentanol. The refrac-tive index of the partially saturated n-pentanol (one phase) was fit to asecond-order polynomial trend line, and the intersection of this trendline with the average refractive index of the fully saturated n-pentanol(two phases) was taken to be the solubility limit of water in n-pentanol.Similar curves were constructed for all the solvents in this study.
17, 24, 38, 114, and 202 s, respectively. The aw values for n-pentanol, n-octanol, n-decanol, triacetin, and butyl lactate forMicroglassificationTM conditions (f = 0.5) were 0.82,18 0.74,21
0.75,18 0.85, and 0.85, respectively.
Particle Size Distribution
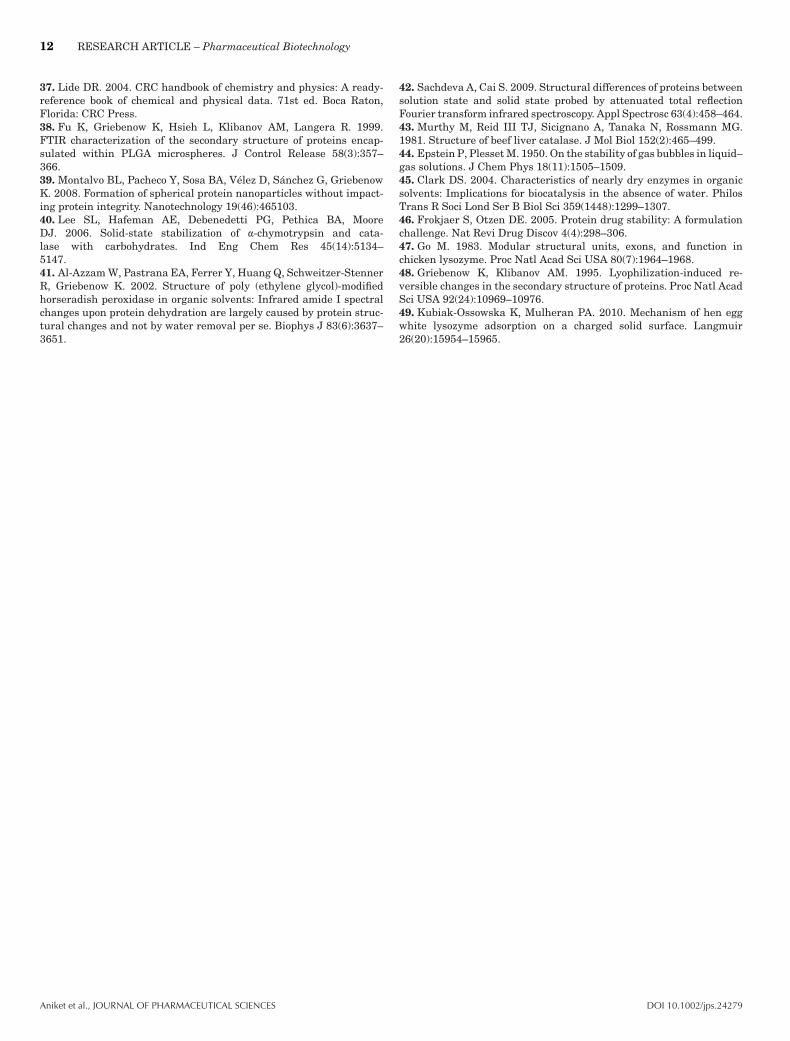
Figure 3 shows the particle size distribution of theMicroglassifiedTM enzyme beads in n-pentanol. It was foundthat just less than half (47%, 43%, 45%, and 46%) of theMicroglassifiedTM lysozyme, "-chymotrypsin, catalase, andHRP particles were in the size range of 5–10 :m, respec-tively. About one third (28%, 31%, 26%, and 27%) were inthe size range of 0–5 :m, whereas the remainder of theMicroglassifiedTM particles of each enzyme (25%, 26%, 29%,and 27%) was >10 :m in size.
Enzyme Activity
Enzymatic activity assays of MicroglassifiedTM lysozyme,"-chymotrypsin, catalase, and HRP upon reconstitutionin buffer are shown in Figure 4. In general, enzymesMicroglassifiedTM in primary alkyl-alcohols, particularly in n-pentanol, demonstrated higher activity upon reconstitutionthan those MicroglassifiedTM in triacetin or butyl lactate. Theactivities have been normalized to total protein content andalso expressed as percentage of lyophilized control.
Lysozyme
The average enzyme activity of rehydrated lysozyme decreasedin the series: control > n-pentanol > n-octanol > n-decanol >
triacetin > butyl lactate (Fig. 4a). Samples MicroglassifiedTM
in n-pentanol (46,560 ± 2736 units/mg; 94%), n-octanol (42,061± 4207 units/mg; 85%), n-decanol (41,323 ± 4811 units/mg;84%), or triacetin (40,585 ± 2609 units/mg; 82%) demonstrated
Aniket et al., JOURNAL OF PHARMACEUTICAL SCIENCES DOI 10.1002/jps.24279
RESEARCH ARTICLE – Pharmaceutical Biotechnology 5
Table 1. Table Showing the Measured Values of the Solubility Limit and Diffusion Coefficient of Water in Various Organic Solvents
Measured Water Solubility(g Water/100 g Solution) (22◦C)
RI Karl Published Water Solubility Refractive Dielectric DiffusionSolvent Method Fischer (g Water/100 g Solution) Index (20◦C) Constant Coefficient (cm2/s)
n-Pentanol 10.31 ± 0.02 10.79 ± 0.02 10.21 (Ref. 35) 1.410 15.1 0.52 × 10− 5 (Ref. 23)n-Octanol 4.83 ± 0.04 4.82 ± 0.08 4.35 (Ref. 35) 1.429 10.3 0.20 × 10− 5 (Ref. 23)n-Decanol 3.63 ± 0.07 3.78 ± 0.03 3.68 (Ref. 36) 1.437 8.1 0.97 × 10− 6
Triacetin 4.15 ± 0.05 4.56 ± 0.14 – 1.430 7.1 0.36 × 10− 5
Butyl lactate 15.88 ± 0.04 15.23 ± 0.24 – 1.421 5.1 0.30 × 10− 5
The refractive index and dielectric constant values have been adopted from Landolt–Bornstein tables.37
Figure 2. Measurement of the dissolution rate of a water droplet inthe organic solvent. The time required for the complete dissolution of an80 :m diameter water microdroplet held on the end of a micropipettein an organic solvent increased in the order: butyl lactate < n-pentanol< triacetin < n-octanol < n-decanol.
comparable activity to the control (49,440 ± 6703 units/mg;100%). Samples MicroglassifiedTM in butyl lactate (39,109 ±3300 units/mg; 79%) showed significantly lower (p < 0.05) ac-tivity than the control.
�-Chymotrypsin
The activity data for "-chymotrypsin displayed a similar trendto that of lysozyme. As shown in Figure 4b, chymotrypsinactivity measured for the enzyme solutions that had beenMicroglassifiedTM in n-pentanol (44 ± 3 units/mg; 96%), n-octanol (42 ± 2 units/mg; 91%), or n-decanol (39 ± 5 units/mg;85%) was comparable to the control (46 ± 7 units/mg; 100%).On the other hand, samples MicroglassifiedTM in triacetin (34± 4 units/mg; 75%) or butyl lactate (31 ± 3 units/mg; 67%) weresignificantly lower (p < 0.05) than the control.
Catalase
The overall trend for enzymatic activity of catalase samples wassimilar to lysozyme and "-chymotrypsin; however, only sam-ples MicroglassifiedTM in n-pentanol (14,451 ± 973 units/mg;93%) were comparable to the control (15,551 ± 1235 units/mg;100%) as shown in Figure 4c. Samples MicroglassifiedTM
in n-octanol (12,165 ± 1314 units/mg; 78%), n-decanol(11,581 ± 1200 units/mg; 75%), or triacetin (10,563 ±
Figure 3. Particle size distribution of MicroglassifiedTM enzymebeads. The size fraction was similar across all the enzymes.
470 units/mg; 68%) showed significantly lower (p < 0.05) activ-ity than the control. Samples MicroglassifiedTM in butyl lactate(7854 ± 750 units/mg; 51%) exhibited significantly lower activ-ity than the control (p < 0.01) or any of the other solvents (p <
0.05).
Horseradish Peroxidase
The enzymatic activity of rehydrated HRP samples showedmixed results. As shown in Figure 4d, samples that had beenMicroglassifiedTM in n-pentanol (241 ± 36 units/mg; 98%),n-octanol (210 ± 47 units/mg; 85%), or n-decanol (219 ±33 units/mg; 89%) were comparable to the control (246 ±25 units/mg; 100%). In contrast, samples MicroglassifiedTM ineither triacetin (89 ± 27 units/mg; 36%) or butyl lactate (118 ±24 units/mg; 48%) exhibited a very significant reduction(p < 0.01) in activity as compared with the samplesMicroglassifiedTM in other solvents or the control.
Structural Analyses of MicroglassifiedTM Enzymes
A combination of FSD, secondary derivatives, and curve-fittingalgorithms were used on the FTIR spectra to determine thesecondary structure of the MicroglassifiedTM enzymes. The sec-ondary structures of dehydrated enzyme powders (lyophilizedcontrol and MicroglassifiedTM samples) are shown in Table 2and upon rehydration in buffer in Table 3.
DOI 10.1002/jps.24279 Aniket et al., JOURNAL OF PHARMACEUTICAL SCIENCES

6 RESEARCH ARTICLE – Pharmaceutical Biotechnology
Figure 4. Enzymatic assays of microglassified (a) lysozyme, (b) "-chymotrypsin, (c) catalase, and (d) HRP, showing the recovery of enzymaticactivity upon rehydration. Commercially available lyophilized enzymes were used as control. (*p < 0.05), (**p < 0.01).
Lysozyme
MicroglassifiedTM Powder. The amide I peak center of allMicroglassifiedTM and lyophilized lysozyme samples occurredat 1648 cm−1. Overall, it was found that the secondary struc-ture of MicroglassifiedTM enzyme prepared in each solventwas comparable to the secondary structure of the lyophilizedsample (Table 2), and were consistent with previously pub-lished literature values for the lyophilized formulation38,39
("-helix: 22%–27%; $-sheet: 21%–23%; others 33%–51%). Asa representative example, lysozyme MicroglassifiedTM in n-pentanol was composed of 25 ± 2%, 22 ± 3%, 30 ±3%, and 22 ± 3% "-helix, $-sheet, $-turn, and randomstructures, respectively. These data are comparable to thelyophilized sample’s content of 28 ± 2%, 20 ± 5%, 34 ± 4%,and 18 ± 4%, respectively, for similar secondary structuralelements.
Enzyme Solution. The amide I peak shifted slightly from1648 cm−1 for the dried MicroglassifiedTM powder to 1651–1653 cm−1 for the rehydrated samples. The secondary struc-ture of rehydrated lysozyme that had been MicroglassifiedTM
in n-pentanol, n-octanol, or n-decanol was comparable to eachother, to the control (Table 3), as well as to previously publishedvalues for lysozyme solution39,42 ("-helix: 40%–45%; $-sheet:19%–41%; $-turn: 19%–32%; random: 0%–14%). Rehydratedlysozyme that had been MicroglassifiedTM in triacetin or butyllactate demonstrated significantly higher (p < 0.05) $-sheetcontent of 36 ± 7% and 30 ± 5%, respectively, as comparedwith samples MicroglassifiedTM in pentanol (22 ± 5%) or thecontrol (23 ± 5%). It was also found that the increase in $-sheetcontent in these samples was accompanied by a decrease in
$-turns and random structures, as compared with other sam-ples or the control.
�-Chymotrypsin
MicroglassifiedTM Powder. The peak center of the amide I re-gion of the dried MicroglassifiedTM and control (lyophilized)"-chymotrypsin was located at 1635 cm−1 indicating a majorpresence of $-sheet. It was found that the secondary structureof the MicroglassifiedTM "-chymotrypsin, with the exception ofthose MicroglassifiedTM in triacetin, was comparable to that ofthe control (Table 2), and previously published values for thelyophilized formulation39,40 ("-helix: 13%–19%; $-sheet: 30%–59%; $-turn: 19%–41%; random: 9%–14%). As a representativeexample, "-chymotrypsin MicroglassifiedTM in n-pentanol con-tained 54 ± 4% $-sheet and 18 ± 3% "-helix, which was compa-rable to the 58 ± 4% $-sheet and 14 ± 2% "-helix of the control.Samples MicroglassifiedTM in triacetin demonstrated a signif-icant increase (p < 0.05) in "-helix (24 ± 2%) largely at theexpense of lower content of $-sheet (49 ± 2%) and $-turn (17 ±3%), as compared with samples MicroglassifiedTM in n-pentanolor the control.
Enzyme Solution. The amide I peak center continued to occurat 1634–1637 cm−1 indicating that the molecule was still pre-dominantly composed of $-sheet. The overall secondary struc-ture of the rehydrated samples that had been MicroglassifiedTM
in n-pentanol, n-octanol, and n-decanol were comparable toeach other, to the control samples (Table 3), as well as tothe previously published literature values for "-chymotrypsinin solution28,40,42 ("-helix: 9%–15%; $-sheet: 47%–59%; $-turn: 17%–30%; random: 0%–15%). In contrast, rehydrated
Aniket et al., JOURNAL OF PHARMACEUTICAL SCIENCES DOI 10.1002/jps.24279

RESEARCH ARTICLE – Pharmaceutical Biotechnology 7
Table 2. FTIR Analyses of MicroglassifiedTM Enzyme Powders
Secondary Structural Element (%)
Enzyme Solvent "-Helix $-Sheet $-Turn Random
Lysozyme n-Pentanol 25 ± 2 22 ± 3 30 ± 3 22 ± 3n-Octanol 28 ± 4 20 ± 3 32 ± 2 19 ± 5n-Decanol 33 ± 4 22 ± 1 29 ± 1 16 ± 4Triacetin 30 ± 3 23 ± 3 29 ± 3 18 ± 5
Butyl lactate 32 ± 3 20 ± 2 28 ± 2 20 ± 5Lyophilized 28 ± 2 20 ± 5 34 ± 4 18 ± 4Literaturea 22–27 21–23 33–51b
"-Chymotrypsin n-Pentanol 18 ± 3 54 ± 4 18 ± 2 10 ± 4n-Octanol 16 ± 4 49 ± 4 26 ± 5 9 ± 3n-Decanol 17 ± 2 52 ± 3 21 ± 1 9 ± 1Triacetin 24 ± 2 49 ± 2 17 ± 3 9 ± 2
Butyl lactate 16 ± 1 53 ± 2 24 ± 3 7 ± 1Lyophilized 14 ± 2 58 ± 4 21 ± 2 7 ± 1Literaturea 13–19 30–59 19–41c 9–14
Catalase n-Pentanol 26 ± 3 22 ± 4 11 ± 3 41 ± 4n-Octanol 26 ± 2 16 ± 3 10 ± 4 48 ± 5n-Decanol 25 ± 4 20 ± 2 14 ± 2 41 ± 4Triacetin 20 ± 3 23 ± 4 16 ± 4 37 ± 3
Butyl lactate 23 ± 4 26 ± 5 16 ± 2 34 ± 3Lyophilized 26 ± 2 17 ± 3 10 ± 3 46 ± 4Literaturea 25 19 56b
HRP n-Pentanol 40 ± 4 29 ± 2 20 ± 3 11 ± 4n-Octanol 42 ± 3 36 ± 5 16 ± 3 6 ± 2n-Decanol 43 ± 5 36 ± 2 14 ± 2 7 ± 3Triacetin 38 ± 2 39 ± 4 21 ± 1 2 ± 1
Butyl lactate 27 ± 5 19 ± 6 15 ± 1 36 ± 5Lyophilized 43 ± 4 30 ± 3 9 ± 2 18 ± 5Literaturea 32–40 22–24
aThe literature values have been taken from Refs. 38–41.bSum of random coils, $-turns, and other undefined contents.cSum of $-turns, intermolecular $-sheets, and undefined contents.
samples obtained after MicroglassificationTM in triacetin orbutyl lactate demonstrated a significantly higher (p < 0.05)content of "-helix (17 ± 4% and 27 ± 3%, respectively), as com-pared to the rehydrated "-chymotrypsin samples that had beenMicroglassifiedTM in n-pentanol ("-helix: 10 ± 3%) or the control("-helix: 11 ± 3%). The content of $-turn and random structuresamong all rehydrated samples was comparable.
Catalase
MicroglassifiedTM Powder
The amide I peak center of all MicroglassifiedTM and control(lyophilized) catalase samples occurred at 1638 cm−1 indicat-ing a major presence of random structures in the molecule.Overall, the secondary structure of catalase MicroglassifiedTM
in n-pentanol, n-decanol, and n-octanol was similar to the con-trol (Table 2), and to a previously published study on lyophilizedcatalase40 ("-helix: 25%; $-sheet: 19%; others: 56%). As a rep-resentative example, catalase MicroglassifiedTM in n-pentanolwas composed of 26 ± 3%, 22 ± 4%, 11 ± 3%, and 41 ± 4% "-helix, $-sheet, $-turn, and random type structures, which wascomparable to control’s content of 26 ± 2%, 17 ± 2%, 10 ±3%, and 46 ± 4% of these secondary structural elements, re-spectively. However, the random structure content of catalaseMicroglassifiedTM in triacetin (37 ± 3%) or butyl lactate (34 ±
3%) was significantly less (p < 0.05) than that of the controlsamples.
Enzyme Solution. The amide I peak center for all rehydratedsamples occurred at 1642 cm−1 indicating that random struc-tures were still the major constituents in the molecule. Theoverall secondary structure of the rehydrated samples pre-viously MicroglassifiedTM in n-pentanol, n-octanol, n-decanol,and butyl lactate (Table 3) were comparable to each other, tothe control, and to previously published values for catalase insolution40,43 ("-helix: 25%–26%; $-sheet: 12%–19%; others 55%–63%). On the other hand, samples that were MicroglassifiedTM
in triacetin demonstrated a significantly higher (p < 0.05)content of random structures (47 ± 3%) at the expense of $-turn (14 ± 2%) as compared with the samples that had beenMicroglassifiedTM in n-pentanol ($-turn: 19 ± 5%; random: 35± 4%) or the control ($-turn: 18 ± 3%; random: 40 ± 5%).
Horseradish Peroxidase
MicroglassifiedTM Powder. The peak center of the amide I re-gion of the dried MicroglassifiedTM and control (lyophilized)HRP samples occurred at 1646 cm−1 indicating a major pres-ence of "-helix in these samples. The overall secondary struc-ture of the MicroglassifiedTM HRP, with the exception of HRPMicroglassifiedTM in butyl lactate, was similar to that of the
DOI 10.1002/jps.24279 Aniket et al., JOURNAL OF PHARMACEUTICAL SCIENCES

8 RESEARCH ARTICLE – Pharmaceutical Biotechnology
Table 3. FTIR Analyses of Rehydrated MicroglassifiedTM Enzyme Solutions
Secondary Structural Element (%)
Enzyme Solvent "-Helix $-Sheet $-Turn Random
Lysozyme n-Pentanol 39 ± 4 22 ± 5 26 ± 4 15 ± 2
n-Octanol 42 ± 7 25 ± 7 20 ± 2 12 ± 4n-Decanol 42 ± 3 22 ± 4 15 ± 4 16 ± 3Triacetin 40 ± 5 36 ± 7 13 ± 4 10 ± 5
Butyl lactate 41 ± 5 34 ± 5 16 ± 2 9 ± 3Lyophilized 41 ± 4 23 ± 5 23 ± 3 12 ± 2Literaturea 40–45 19–41 19–32 0–14
"-Chymotrypsin n-Pentanol 10 ± 3 48 ± 6 27 ± 2 15 ± 3n-Octanol 12 ± 4 43 ± 6 25 ± 6 12 ± 2n-Decanol 13 ± 3 50 ± 5 27 ± 4 10 ± 4Triacetin 17 ± 4 44 ± 3 25 ± 5 14 ± 5
Butyl lactate 27 ± 3 40 ± 7 18 ± 2 12 ± 4Lyophilized 11 ± 3 50 ± 6 25 ± 3 14 ± 2Literaturea 9–15 47–59 17–30 0–15
Catalase n-Pentanol 26 ± 3 20 ± 4 19 ± 5 35 ± 4n-Octanol 23 ± 5 22 ± 5 20 ± 6 36 ± 5n-Decanol 21 ± 3 18 ± 6 20 ± 4 41 ± 3Triacetin 23 ± 5 15 ± 5 14 ± 2 47 ± 3
Butyl lactate 23 ± 6 22 ± 7 24 ± 4 31 ± 5Lyophilized 26 ± 2 20 ± 3 18 ± 3 40 ± 5Literaturea 25–33 12–19 55–63b
HRP n-Pentanol 49 ± 3 8 ± 3 24 ± 3 19 ± 3n-Octanol 43 ± 5 12 ± 4 19 ± 4 26 ± 5n-Decanol 45 ± 4 12 ± 3 22 ± 3 20 ± 4Triacetin 57 ± 7 9 ± 4 12 ± 5 21 ± 4
Butyl lactate 41 ± 6 10 ± 5 26 ± 2 22 ± 6Lyophilized 48 ± 4 7 ± 2 24 ± 1 20 ± 3Literaturea 45–51 2–11 38–47b
aThe literature values have been taken from Refs. 28 and 39–43bSum of $-turns, intermolecular $-sheets, and random contents.
control (Table 2), and previously published literature valuesfor the lyophilized formulation39,41 ("-helix: 32%–40%; $-sheet:22%–24%; others 37%–46%). Thus, HRP MicroglassifiedTM inn-pentanol was composed of 40 ± 4%, 29 ± 2%, 20 ± 3%, and11 ± 4% "-helix, $-sheet, $-turn, and random structures, whichwas comparable to control’s content of 43 ± 4%, 30 ± 3%, 9± 2%, and 18 ± 5% of these structural elements, respectively.However, HRP MicroglassifiedTM in butyl lactate demonstrateda significant (p < 0.01) twofold to threefold increase in ran-dom structures reduced (p < 0.05) as compared with HRPMicroglassifiedTM in n-pentanol or the control.
Enzyme Solution. For the rehydrated HRP samples, theamide I peak center showed a major shift from 1645 cm−1 uponMicroglassificationTM to 1650–1652 cm−1 after rehydration.The overall secondary structure of the rehydrated HRP sam-ples MicroglassifiedTM in any of the solvents (Table 3), with theexception of triacetin, was comparable to each other, to the con-trol, and to previously published values for HRP in solution39,41
("-helix: 45%–51%; $-sheet: 2%–11%; others 38%–47%). Re-hydrated HRP that had been MicroglassifiedTM in triacetindemonstrated a significantly higher (p < 0.05) content of "-helix (57 ± 7%) and a lower content of $-turn (12 ± 5%) as com-pared with rehydrated samples that were MicroglassifiedTM inn-pentanol ("-helix: 49 ± 3%; $-turn: 24 ± 3%), or the control("-helix: 48 ± 4%; $-turn: 24 ± 1%). The content of $-sheet and
random structures among all rehydrated samples were compa-rable.
Accelerated Storage Test Results
In order to gain an early evaluation of the stability of theMicroglassifiedTM enzyme powders in these initial studies, wemeasured if and to what extent there were any changes in enzy-matic activity and secondary structure of MicroglassifiedTM andlyophilized lysozyme over a 3-month period at just one elevatedtemperature of 40◦C.
Lysozyme Activity upon Stress Storage
The enzymatic activity of the MicroglassifiedTM and lyophilizedlysozyme (control) samples decreased significantly (p < 0.01)(by ∼33%) from 46,560 ± 2736 and 49,440 ± 6702 units/mg atmonth 0, to 30,000 ± 1385 and 30,600 ± 3600 units/mg, respec-tively, after incubation at 40◦C for 1 month (Fig. 5). However,upon further incubation, the MicroglassifiedTM and lyophilizedsamples showed minimal changes in their enzymatic activity.The activities of the MicroglassifiedTM and lyophilized sampleswere 30,215 ± 5438 and 31,060 ± 4327 units/mg after month2, and 26,780 ± 3018 and 27,225 ± 2910 units/mg after month3, respectively. It is noteworthy that the enzymatic activities ofthe MicroglassifiedTM and lyophilized samples were compara-ble at all time points.
Aniket et al., JOURNAL OF PHARMACEUTICAL SCIENCES DOI 10.1002/jps.24279

RESEARCH ARTICLE – Pharmaceutical Biotechnology 9
Figure 5. Accelerated storage test results showed a significant reduc-tion (**p < 0.01) of ∼33% in the enzymatic activity of MicroglassifiedTM
and lyophilized lysozyme samples after 1 month of incubation at 40◦C,after which the activity of both sample types remained comparable.Note that the activity of the MicroglassifiedTM and lyophilized samplewas comparable throughout the test period.
Changes in Secondary Structure
As shown in Table 4, FTIR analyses of the MicroglassifiedTM
and lyophilized lysozyme powders incubated at 40◦C for 3months showed major changes in the structure of the enzyme.After 1 month of incubation, the content of $-sheet in thesamples decreased significantly (p < 0.05) from 22 ± 3% and20 ± 5% to 14 ± 4% and 13 ± 2% in the MicroglassifiedTM
and lyophilized samples, respectively. The decrease in the $-sheet content was accompanied by a significant (p < 0.05) in-crease in the content of random structures, which increasedfrom 22 ± 3% and 18 ± 4% to 35 ± 5% and 27 ± 4% in theMicroglassifiedTM and lyophilized samples, respectively, duringthe same time period. Thereafter, minimal structural changesin the powders, both MicroglassifiedTM and lyophilized, wereobserved. It was also observed that throughout the 3-monthstorage period, the content of "-helix and $-turn structures, inboth the MicroglassifiedTM and lyophilized samples, remainednearly identical.
DISCUSSION
The main objectives of this work were to test the feasibilityof MicroglassificationTM to controllably dehydrate enzymes ina series of dehydrating solvents, and evaluate the changes inenzyme structure and function upon rehydration. Using oursignature micropipet manipulation technique, it was foundthat butyl lactate and n-pentanol had higher dehydration
rates than n-octanol, n-decanol, or triacetin. Enzymatic ac-tivity assays showed that catalase, lysozyme, "-chymotrypsin,and HRP that had been MicroglassifiedTM in n-pentanol, re-tained an average of 93%, 94%, 96%, and 98% of theiractivity upon rehydration, respectively. FTIR analysesindicated that all the enzymes underwent significant structuralrearrangement upon MicroglassificationTM. Upon reconstitu-tion in buffer, the enzymes MicroglassifiedTM in n-pentanol,n-decanol, or n-octanol generally reverted to a native-likeconformation, whereas the enzymes MicroglassifiedTM in tri-acetin or butyl lactate demonstrated structural deviations fromthe native conformation. Accelerated storage tests for bothMicroglassifiedTM and lyophilized lysozyme showed that al-though the enzymatic activity reduced significantly after in-cubation at 40◦C for 3 months, the activities of both for-mulations were comparable to each other throughout thetest period. Taken together, these results demonstrate thatMicroglassificationTM is an attractive method to successfullyand conveniently dehydrate enzymes for long-term preserva-tion.
The removal of water from an aqueous protein micro-droplet immersed in an organic drying medium depends onthe droplet’s dissolution rate, and is proportional to the solubil-ity and diffusion of water in that drying solvent.44 Water dis-solution is primarily driven by enthalpic and entropic effectsarising from the difference in water activity (aw) between thetwo phases. In our earlier work, we have established that wa-ter continues to dissolve into the organic phase until aw of bothphases are in equilibrium, resulting in protein solidification inthe form of a MicroglassifiedTM bead.18,19 As shown in Table 1and Figure 2, water dissolution rates generally increased withincreasing solubility, and can be successfully modeled by theEpstein–Plesset equation44:
dRdt
= −DC3(1 − f )D
(1R
+ 1√BDt
)
where R is the droplet radius, D is the diffusion coefficient ofwater in the surrounding medium, Cs is water solubility, D isdroplet density, and t is time.
The Epstein–Plesset equation and our micropipet assay onsingle microdroplets of pure water23 and protein solutions18,19
provide fundamental guiding principles for dehydration proce-dures. The mass transfer rate of water (dR/dt) is dependenton the product of water solubility (Cs) and its diffusion coef-ficient (D). Water can form a hydrogen bond with the (–OH)group of n-octanol, and this hydrogen bonding between a so-lute and a solvent decreases D by an order of magnitude andslows the dissolution process.23 Therefore, for similar solubil-ities, a faster diffusion rate leads to a greater overall masstransfer rate of water out of the microdroplet. Similarly, a
Table 4. Accelerated Stability Test—Lysozyme Secondary Structure (%)
MicroglassifiedTM Lysozyme Lyophilized Lysozyme
Month 0 1 2 3 0 1 2 3
"-Helix 25 ± 2 23 ± 3 21 ± 5 26 ± 3 28 ± 2 25 ± 3 26 ± 4 24 ± 4$-Sheet 22 ± 3 14 ± 4 11 ± 2 10 ± 3 20 ± 5 13 ± 2 11 ± 3 11 ± 2$-Turn 30 ± 3 27 ± 2 29 ± 3 25 ± 4 34 ± 4 35 ± 2 31 ± 4 33 ± 2Random 22 ± 3 35 ± 5 38 ± 4 39 ± 5 18 ± 4 27 ± 4 32 ± 5 31 ± 2
DOI 10.1002/jps.24279 Aniket et al., JOURNAL OF PHARMACEUTICAL SCIENCES

10 RESEARCH ARTICLE – Pharmaceutical Biotechnology
drying solvent that has greater solubility for water increasesthe dissolution rate, thereby reducing the time required forequilibration. Our results showed that solvents with higher di-electric constant (g) also demonstrated a higher water solubilitylimit (Table 1). A high dielectric solvent, because of its greatercharge carrying capacity, and therefore a greater ability to of-fer a transition-state stabilization, weakens the electrostaticforces between polar residues and water.45 Therefore, becauseof the concomitant contributions from several factors includinghydrogen bonding, diffusivity, and dielectric properties, watersolubility and dissolution rate increased in the order: n-decanol< n-octanol < triacetin < n-pentanol < butyl lactate (Fig. 2).
Following the vortex procedure to produce water-in-oil emul-sions from which the MicroglassifiedTM beads formed, size anal-yses showed that the particle size distributions of all enzymebeads were quite similar to each other (Fig. 3). The largedifferences in molecular weights of the enzymes—lysozyme(14 kDa) is approximately twofold and threefold smaller than"-chymotrypsin (25 kDa) and HRP (44 kDa), and ∼18-foldsmaller than catalase (250 kDa)—was inconsequential, andthe MicroglassifiedTM bead size was influenced by physical fac-tors, such as enzyme concentration, and vortex speed thatdetermined the initial (water-in-oil) microdroplet size. Nev-ertheless, molecular weight may have had some influence onthe retention of enzymatic activity. Small, single-domain pro-teins usually require extreme conditions to unfold, whereasin larger, multi-domain proteins, modification of a few weaklinks, even under gentle conditions, can be sufficient to initi-ate unfolding and aggregation.46 Thus, HRP MicroglassifiedTM
in triacetin or butyl lactate retained only 36% and 48% ac-tivity upon rehydration, whereas lysozyme MicroglassifiedTM
in these solvents retained 82% and 79% activity, respectively,which is in agreement with lysozyme being a relatively stableprotein.47
Overall our results demonstrate that MicroglassificationTM
preserves the selective structure-function relationship ofan enzyme while gently dehydrating the molecule. En-zymes MicroglassifiedTM in primary alkyl-alcohols, espe-cially n-pentanol, demonstrated comparable enzymatic activ-ity to the control (lyophilized formulation) upon rehydration(Fig. 4), and maintained a secondary conformation that wassimilar to the native enzyme (Table 3). In contrast, en-zymes MicroglassifiedTM in triacetin or butyl lactate generallydemonstrated lower activity upon reconstitution than thoseMicroglassifiedTM in other solvents (also shown in Fig. 4). Whileevaluating overall changes in the whole molecule does littleto help understand the effects these solvents might have onstructure of the enzyme pocket, we may speculate as to somepossible effects, for later examination. Triacetin has a lowerdielectric constant than the alcohols. The dielectric constant ofpentanol is 15.1, whereas that of triacetin is 7.1 (Table 1). Itmay be possible that the lower dielectric constant of triacetinshields the weakening of electrostatic interactions betweenthe polar residues on the protein’s surface and water, whichcould have enabled undesirable irreversible structural reor-ganization upon MicroglassificationTM, particularly for bulkyenzymes, thus affecting their activity either directly in the en-zyme pocket or allosterically within the protein. In contrastto triacetin, butyl lactate showed a much greater hydrophiliccharacter as evidenced by its higher water solubility limit; how-ever, the activities of the rehydrated enzymes MicroglassifiedTM
in this solvent were the lowest among all solvents. In the
case of MicroglassifiedTM HRP, it showed significantly alteredconformation in the solid-state as compared to the control(Table 2), and despite the restoration of overall secondary struc-ture upon rehydration, it expressed significantly lower activitythan the control. Although speculative, these results suggestthat the deleterious effect of active-site disruption due to adrastic change in hydration environment may not be completelyreversible upon rehydration.
FTIR analyses of the enzyme secondary structure alsoshowed that the enzymes underwent structural rearrangementupon MicroglassificationTM (Tables 2 and 3). Because largeamounts of water of hydration were removed, such behavioris expected for the dehydrated samples. Specifically, it wasfound that the content of $-sheet structures increased, andthis was accompanied by a decrease in the content of "-helixstructures, although the magnitude of this transformation var-ied among different enzymes. For instance, $-sheet content ofcatalase tripled upon dehydration, from 22 ± 3% to 66 ± 4%,whereas its "-helix content decreased from 26 ± 2% to 16 ±3%. Water molecules can form hydrogen bonds more easilywith the (C=O) groups of the peptide backbone that consti-tutes the "-helix but not with the $-sheets48; hence, waterloss upon dehydration disrupts "-helix structure more than$-sheet. These results are consistent with other reports onstructural changes during lyophilization of insulin and poly(L-lysine), where a similar increase in $-sheet was observed mostlyat the expense of "-helix.48 Nevertheless, it should be notedthat the changes in enzyme conformation were largely re-versible, as the secondary structure of the enzymes before andafter MicroglassificationTM, and subsequent rehydration, werecomparable.
Accelerated storage test results showed that enzymatic ac-tivity of MicroglassifiedTM and lyophilized lysozyme samplesreduced by almost one-third after 1 month of incubation at40◦C (Fig. 5). The reduction in the enzymatic activity can beattributed to the structural changes in these molecules duringstorage, in particular, ∼50% loss of $-sheet observed in bothsamples (Table 4). The active-site of lysozyme is located withina cleft formed by "- and $-domain, wherein the former domainconsists primarily of "-helices and the latter domain consists ofthree $-sheets.49 Therefore, the significant loss of $-sheet underthe stressed storage conditions likely induced irreversible mod-ifications in the enzyme’s active site that resulted in reducedactivity.
CONCLUSIONS
The results of this study demonstrate the feasibility ofMicroglassificationTM to rapidly and controllably dehydrate aseries of common enzymes while largely preserving their struc-ture and enzymatic activity. It was found that the primaryalkyl-alcohols, in particular n-pentanol, were the most opti-mal solvents for enzyme dehydration. FTIR analyses of the en-zyme secondary structure showed that, as expected, all the en-zymes underwent structural rearrangements upon dehydrationby MicroglassificationTM and subsequent drying. Most promi-nently, this resulted in "-helix to $-sheet type transformationas the enzymes solidified from solution into a MicroglassifiedTM
state. The changes in enzyme secondary structure were essen-tially reversible as indicated by reorganization to a near native-like conformation upon rehydration. Accelerated storage testresults showed that the enzymatic activity of MicroglassifiedTM
Aniket et al., JOURNAL OF PHARMACEUTICAL SCIENCES DOI 10.1002/jps.24279

RESEARCH ARTICLE – Pharmaceutical Biotechnology 11
and lyophilized lysozyme reduced significantly upon storageat 40◦C; however, their activities were comparable to eachother. Thus, MicroglassificationTM can have direct applica-tion for the preservation of enzymes, proteins, and other bio-macromolecules. We envision that this method can also be usedas a formulation technique to develop high-concentration in-jectable biotherapeutics in the form of micro- and nano-sizedMicroglassifiedTM beads, including encapsulation in slow re-lease polymer formulations.
ACKNOWLEDGMENTS
The authors would like to thank Mr. Ryan Denkewicz for assis-tance with FTIR spectra analyses.
This work was supported by grant no. IIP-0848968 from theNational Science Foundation.
REFERENCES
1. Carpenter JF, Pikal MJ, Chang BS, Randolph TW. 1997. Rationaldesign of stable lyophilized protein formulations: Some practical advice.Pharm Res 14(8):969–975.2. Pikal MJ. 1999. Mechanisms of protein stabilization during freeze-drying and storage: The relative importance of thermodynamic stabi-lization and glassy state relaxation dynamics. Drugs Pharm Sci 96:161–198.3. Carpenter JF, Izutsu K-i, Randolph TW. 2004. Freezing-and drying-induced perturbations of protein structure and mechanisms of pro-tein protection by stabilizing additives. Drugs Pharm Sci 137:147–186.4. Gidalevitz D, Huang Z, Rice SA. 1999. Protein folding at the air–water interface studied with X-ray reflectivity. Proc Natl Acad Sci USA96(6):2608–2611.5. Wang W. 1999. Instability, stabilization, and formulation of liquidprotein pharmaceuticals. Int J Pharm 185(2):129–188.6. Carpenter J, Prestrelski S, Arakawa T. 1993. Separation of freezing-and drying-induced denaturation of lyophilized proteins using stress-specific stabilization: I. Enzyme activity and calorimetric studies. ArchBiochem Biophys 303(2):456–464.7. Abdul-Fattah AM, Kalonia DS, Pikal MJ. 2007. The challenge ofdrying method selection for protein pharmaceuticals: Product qualityimplications. J Pharm Sci 96(8):1886–1916.8. Liao Y-H, Brown MB, Quader A, Martin GP. 2002. Protective mecha-nism of stabilizing excipients against dehydration in the freeze-dryingof proteins. Pharm Res 19(12):1854–1861.9. Anandharamakrishnan C, Rielly C, Stapley A. 2007. Effects of pro-cess variables on the denaturation of whey proteins during spray dry-ing. Drying Technol 25(5):799–807.10. Anandharamakrishnan C, Rielly CD, Stapley A. 2008. Lossof solubility of "-lactalbumin and $-lactoglobulin during thespray drying of whey proteins. LWT-Food Sci Techol 41(2):270–277.11. Capolongo A, Barresi AA, Rovero G. 2003. Freeze-drying of ligninperoxidase: Influence of lyoprotectants on enzyme activity and stability.J Chem Technol Biotechnol 78(1):56–63.12. Carpenter JF, Chang BS, Garzon-Rodriguez W, Randolph TW.2002. Rational design of stable lyophilized protein formulations: The-ory and practice. In Rational design of stable protein formulations;Carpenter JF, Manning MC, Eds. New York: Kluwer Academic/PlenumPublishers, pp 109–133.13. Webb SD, Golledge SL, Cleland JL, Carpenter JF, RandolphTW. 2002. Surface adsorption of recombinant human interferon-( in lyophilized and spray-lyophilized formulations. J Pharm Sci91(6):1474–1487.
14. Webb SD, Cleland JL, Carpenter JF, Randolph TW. 2003. Effectsof annealing lyophilized and spray-lyophilized formulations of recom-binant human interferon-(. J Pharm Sci 92(4):715–729.15. Maltesen MJ, van de Weert M. 2008. Drying methods for proteinpharmaceuticals. Drug Discov Today Technol 5(2):e81–e88.16. Wang W. 2005. Protein aggregation and its inhibition in biophar-maceutics. Int J Pharm 289(1):1–30.17. Iyer PV, Ananthanarayan L. 2008. Enzyme stability andstabilization—Aqueous and non-aqueous environment. ProcessBiochem 43(10):1019–1032.18. Aniket, Gaul DA, Rickard DL, Needham D. 2014.MicroglassificationTM: A novel technique for protein dehydration.J Pharm Sci 103(3):810–820.19. Rickard DL, Duncan PB, Needham D. 2010. Hydration potential oflysozyme: Protein dehydration using a single microparticle technique.Biophys J 98(6):1075–1084.20. Mohrig JR, Hammond CN, Schatz PF. 2006. Techniques in organicchemistry. 2nd ed. New York: WH Freeman & Company.21. Segatin N, Klofutar C. 2004. Thermodynamics of the solubility ofwater in 1-hexanol, 1-octanol, 1-decanol, and cyclohexanol. Monatshfur Chemie/Chem Mon 135(3):241–248.22. Duncan PB, Needham D. 2004. Test of the Epstein–Plesset modelfor gas microparticle dissolution in aqueous media: Effect of surfacetension and gas undersaturation in solution. Langmuir 20(7):2567–2578.23. Su JT, Duncan PB, Momaya A, Jutila A, Needham D. 2010. Theeffect of hydrogen bonding on the diffusion of water in n-alkanes andn-alcohols measured with a novel single microdroplet method. J ChemPhys 132:044506.24. Smolelis A, Hartsell S. 1949. The determination of lysozyme. JBacteriol 58(6):731–736.25. Hummel BC. 1959. A modified spectrophotometric determina-tion of chymotrypsin, trypsin, and thrombin. Can J Biochem Physiol37(12):1393–1399.26. Beers RF, Sizer IW. 1952. A spectrophotometric method for mea-suring the breakdown of hydrogen peroxide by catalase. J Biol Chem195(1):133–140.27. Chance B, Maehly A. 1955. Assay of catalases and peroxidases.Methods Enzymol 2:764–775.28. Dong A, Huang P, Caughey WS. 1990. Protein secondary structuresin water from second-derivative amide I infrared spectra. Biochemistry29(13):3303–3308.29. Byler DM, Susi H. 1986. Examination of the secondary struc-ture of proteins by deconvolved FTIR spectra. Biopolymers 25(3):469–487.30. Kommanaboyina B, Rhodes C. 1999. Trends in stability testing,with emphasis on stability during distribution and storage. Drug DevInd Pharm 25(7):857–868.31. Bajaj S, Singla D, Sakhuja N. 2012. Stability testing of pharmaceu-tical products. J Appl Pharm Sci 2(3).32. Bowen M, Armstrong N, Maa Yf. 2012. Investigating high-concentration monoclonal antibody powder suspension in nonaque-ous suspension vehicles for subcutaneous injection. J Pharm Sci101(12):4433–4443.33. Bond MD, Panek ME, Zhang Z, Wang D, Mehndiratta P, Zhao H,Gunton K, Ni A, Nedved ML, Burman S. 2010. Evaluation of a dual-wavelength size exclusion HPLC method with improved sensitivity todetect protein aggregates and its use to better characterize degradationpathways of an IgG1 monoclonal antibody. J Pharm Sci 99(6):2582–2597.34. D’Aprano A, Donato DI, Agrigento V. 1982. Molecular associationin water–isomeric pentanol mixtures at 25◦ C. J Solut Chem 11(4):259–269.35. Stephenson R, Stuart J, Tabak M. 1984. Mutual solubility of waterand aliphatic alcohols. J Chem Eng Data 29(3):287–290.36. Stephenson R, Stuart J. 1986. Mutual binary solubilities: Water-alcohols and water-esters. J Chem Eng Data 31(1):56–70.
DOI 10.1002/jps.24279 Aniket et al., JOURNAL OF PHARMACEUTICAL SCIENCES
12 RESEARCH ARTICLE – Pharmaceutical Biotechnology
37. Lide DR. 2004. CRC handbook of chemistry and physics: A ready-reference book of chemical and physical data. 71st ed. Boca Raton,Florida: CRC Press.38. Fu K, Griebenow K, Hsieh L, Klibanov AM, Langera R. 1999.FTIR characterization of the secondary structure of proteins encap-sulated within PLGA microspheres. J Control Release 58(3):357–366.39. Montalvo BL, Pacheco Y, Sosa BA, Velez D, Sanchez G, GriebenowK. 2008. Formation of spherical protein nanoparticles without impact-ing protein integrity. Nanotechnology 19(46):465103.40. Lee SL, Hafeman AE, Debenedetti PG, Pethica BA, MooreDJ. 2006. Solid-state stabilization of "-chymotrypsin and cata-lase with carbohydrates. Ind Eng Chem Res 45(14):5134–5147.41. Al-Azzam W, Pastrana EA, Ferrer Y, Huang Q, Schweitzer-StennerR, Griebenow K. 2002. Structure of poly (ethylene glycol)-modifiedhorseradish peroxidase in organic solvents: Infrared amide I spectralchanges upon protein dehydration are largely caused by protein struc-tural changes and not by water removal per se. Biophys J 83(6):3637–3651.
42. Sachdeva A, Cai S. 2009. Structural differences of proteins betweensolution state and solid state probed by attenuated total reflectionFourier transform infrared spectroscopy. Appl Spectrosc 63(4):458–464.43. Murthy M, Reid III TJ, Sicignano A, Tanaka N, Rossmann MG.1981. Structure of beef liver catalase. J Mol Biol 152(2):465–499.44. Epstein P, Plesset M. 1950. On the stability of gas bubbles in liquid–gas solutions. J Chem Phys 18(11):1505–1509.45. Clark DS. 2004. Characteristics of nearly dry enzymes in organicsolvents: Implications for biocatalysis in the absence of water. PhilosTrans R Soci Lond Ser B Biol Sci 359(1448):1299–1307.46. Frokjaer S, Otzen DE. 2005. Protein drug stability: A formulationchallenge. Nat Revi Drug Discov 4(4):298–306.47. Go M. 1983. Modular structural units, exons, and function inchicken lysozyme. Proc Natl Acad Sci USA 80(7):1964–1968.48. Griebenow K, Klibanov AM. 1995. Lyophilization-induced re-versible changes in the secondary structure of proteins. Proc Natl AcadSci USA 92(24):10969–10976.49. Kubiak-Ossowska K, Mulheran PA. 2010. Mechanism of hen eggwhite lysozyme adsorption on a charged solid surface. Langmuir26(20):15954–15965.
Aniket et al., JOURNAL OF PHARMACEUTICAL SCIENCES DOI 10.1002/jps.24279