environmentally critical areas - pcsd nido planred.pdf · environmentally critical areas network...
TRANSCRIPT


ENVIRONMENTALLY CRITICAL AREAS
NETWORK (ECAN) ZONES MANAGEMENT PLAN
FOR EL NIDO MUNICIPALITY
September 2006

Prepared for:
PALAWAN COUNCIL FOR SUSTAINABLE DEVELOPMENT Palawan Center for Sustainable Development
Sta. Monica Heights, Puerto Princesa City, Palawan, Philippines 5300 Email: [email protected]
Tel.: (63-48) 434-4235, Fax: 434-4234
Funded through a loan from :
JAPAN BANK FOR INTERNATIONAL COOPERATION
Prepared by:
PACIFIC CONSULTANTS INTERNATIONAL in association with
ALMEC Corporation CERTEZA Information Systems, Inc.
DARUMA Technologies Inc. Geo-Surveys & Mapping, Inc.
Photo Credits:
All photos by SEMP-NP ECAN Zoning Component Project Management Office
ISBN _________________
Philippine Copyright © 2006 by Palawan Council for Sustainable Development, Puerto Princesa City, Philippines
ALL RIGHTS RESERVED
This report can be reproduced as long as the convenors are properly acknowledged as the source of information
Reproduction of this publication for sale or other commercial
purposes is prohibited without the written consent of the publisher.
Printed by:
Futuristic Printing Press, Puerto Princesa City, Philippines
Suggested Citation:
PCSDS. 2006. ECAN Zones Management Plan for El Nido Municipality Palawan Council for Sustainable Development, Puerto Princesa City, Philippines
978-971-0475-04-9

____________________________________________________________________________________
iii
TABLE OF CONTENTS
Title
Page
List of Tables vii List of Figures ix List of Abbreviations x EXECUTIVE SUMMARY
xii
1.0 INTRODUCTION
1.1 Purpose and Scope of the Management Plan 1.2 Legal Basis of the Management Plan
1 1 2
2.0 ECOLOGICAL PROFILE 2.1 Geographic Location
2.1.1 Administrative Boundaries 2.1.2 Municipal and Barangay Areas
2.2 Physical Environment
2.2.1 Topography 2.2.2 Geology 2.2.3 Soils 2.2.4 Climate 2.2.5 Oceanography 2.2.6 Surface Water
6 6 6 6 9 9 15 15 16 16 16
2.3 Biological Environment 2.3.1 Forest Resources 2.3.2 Wildlife Resources and Biodiversity 2.3.3 Coastal and Marine Resources
2.3.3.1 Coral Reefs 2.3.3.2 Reef Fish 2.3.3.3 Marine Mammals and Sea Turtles 2.3.3.4 Seagrass 2.3.3.5 Mangroves
17 17 24 26 27 31 31 34 36
2.4 Socioeconomic Profile 2.4.1 Population
2.4.1.1 Population and Demographic Characteristics 2.4.1.2 Urbanization and Migration Patterns
37 37 37 43
2.4.2 Social Condition 2.4.2.1 Dependency Ratios 2.4.2.2 Religious Affiliation and Ethnicity
43 43 44

____________________________________________________________________________________
iv
Title Page
2.4.2.3 Health and Nutrition 2.4.2.4 Education Status 2.4.2.5 Housing and Basic Utilities
45 46 47
2.4.3 Economic Condition 2.4.3.1 Poverty Incidence 2.4.3.2 Employment 2.4.3.3 Agriculture 2.4.3.4 Fisheries 2.4.3.5 Trade and Industry 2.4.3.6 Tourism
51 51 51 54 56 57 58
2.5 Land Use Profile 2.5.1 Land Classification 2.5.2 Existing Land Use 2.5.3 Land/Sea Cover Classification
60 60 60 65
3.0 ECAN ZONES MANAGEMENT PLAN 3.1 Vision and Mission 3.2 Goals and Objectives of ECAN Zones Management 3.3 Guiding Principles in ECAN Zones Planning and Management 3.4 Resource Assessment and Management
3.4.1 Resource Uses, Issues and Problems 3.4.1.1 Forest and Wildlife Resources 3.4.1.2 Coastal/Marine Resources
69 69 69 71 73 73 73 74
3.4.2 Resource Uses, Issues and Problems 3.4.2.1 Forest Resources and Biodiversity 3.4.2.2 Wildlife Resources and Biodiversity 3.4.2.3 Coastal and Marine Resources
76 76 78 78
3.4.3 Current Management Efforts in the Implementation of Environment and Natural Resources Management Programs
3.4.3.1 Enforcement of Environmental Laws 3.4.3.2 Collaboration with Partner Organizations in the Implementation of Environmental Management Programs 3.4.4.3 Capability Building Support 3.4.4.4 Financial Support
79
79 80
83 84
3.4.4 Gaps and Constraints in Current Management Efforts 3.4.4.1 Gaps and Constraints in Institutional Capacity 3.4.4.2 Gaps and Constraints in Technical and Managerial Capability
85 86 87

____________________________________________________________________________________
v
Title Page
3.5 ECAN Zones of El Nido Municipality 3.5.1 Criteria and Guidelines for Delineation of ECAN Zones 3.5.2 Core Zone Delineation of Terrestrial and Coastal/Marine Ecosystems
3.5.2.1 Forest Resources and Biodiversity 3.5.2.2 Wildlife Resources 3.5.2.3 Coastal and Marine Resources
87 87 88
91 92 92
3.5.3 Municipal Breakdown of ECAN Zones 3.5.3.1 Barangay Breakdown of ECAN Zones
97 97
3.5.4 Threats to Core Zones 3.5.4.1 Threats to Terrestrial Core Zones 3.5.4.2 Threats to Coastal/Marine Core Zones
102 102 102
3.5.5 Management Strategies for ECAN Zones 3.5.5.1 ECAN Zones for Protection and Preservation 3.5.5.2 ECAN Zones for Restoration 3.5.5.3 ECAN Zones for Rehabilitation 3.5.5.4 ECAN Zones for Reclamation or Conversion to Other Uses 3.5.5.5 ECAN Zones for Conservation and Sustainable Use 3.5.5.6 ECAN Zones for Conflict Resolution
103 103 104 104 104
105 105
3.5.6 ECAN Zones Management Guidelines
3.5.6.1 Objectives of ECAN Zones Management Guidelines 3.5.6.2 Proposed Allowable and Prohibited Uses of ECAN
Zones 3.5.6.3Constraints and Barriers to ECAN Zoning
Implementation
107 107 109
113
3.6 ECAN Zones Management Programs (2006-2015) 3.6.1 Institutionalization of Zoning and Management Guidelines 3.6.2 Marking of Core Zones on the Ground 3.6.3 Institutional Capacity Building 3.6.4 Law Enforcement 3.6.5 Ecosystem Rehabilitation 3.6.6 Sustainable Livelihood Development 3.6.7 Ecotourism Development and Visitor Management 3.6.8 Sustainable Financing 3.6.9 Research, Monitoring and Evaluation 3.6.10 Policy Reforms
115 115 116 117 119 120 121 125 126 127 128
3.7 Schedule of Plan Implementation
129

____________________________________________________________________________________
vi
Title Page
3.8 Estimated Budget Requirements for ECAN Zoning Implementation and Related Environmental Management Programs
130
3.9 Implementing Organizations and Possible Sources of Funds for ECAN Zoning Implementation
131
LIST OF REFERENCES
165

____________________________________________________________________________________
vii
LIST OF TABLES
Table No.
Title
Page
1 Land Area by Barangay, El Nido Municipality 7 2 Land Area of Small Islands and Islets, El Nido Municipality 8 3 Slope Classes, El Nido Municipality 13 4 Slope Classes by Barangay, El Nido Municipality 14 5 Major Rivers and Watersheds in El Nido Municipality 16 6 Terrestrial Forest Cover by Barangay, El Nido Municipality 19 7 Threatened Endemic Tree Species in El Nido Municipality 19 8 Barangays Covered, Land Use, Flora Transects and Elevation of
Observation Points in El Nido Municipality 20
9 Human Activities in the Uplands of El Nido Municipality 21 10 List of Endemic and Near Endemic Mammal Species Found in
El Nido Municipality 24
11 List of Endemic and Near Endemic Bird Species Found in El Nido Municipality
25
12 Coastal/Marine Habitats by Barangay, El Nido Municipality 27 13 Status of Coral Cover in the Islands Surveyed in El Nido
Municipality 27
14 Coral Reef Survey Results, El Nido Municipality 28 15 Changes in Coral Cover in Selected Sites, El Nido Municipality 29 16 Diversity (Generic) of Reef Corals at Selected Sites in El Nido
Municipality 29
17 Seagrass Meadow Extent, Canopy Cover, Diversity and Habitat Use by Dugong dugon, El Nido Municipality
35
18 List of True and Associate Mangrove Species in El Nido Municipality
36
19 Population Growth Rate, El Nido Municipality, 1918-2000 38 20 Population Density of El Nido Municipality, 2000 41 21 Major Population Groups, El Nido Municipality 44 22 Religious Affiliation, El Nido Municipality 44 23 Ethnic Groups, El Nido Municipality 45 24 Children’s Nutrition Status, El Nido Municipality 45 25 Enrollment, El Nido Municipality 46 26 Water Supply By Source, El Nido Municipality 49 27 Energy Used by Households for Cooking, El Nido Municipality 50 28 Number and Percent of Households with Income Below the
Poverty Line, El Nido Municipality, Palawan, 2004 51
29 Employment Status by Barangay, El Nido Municipality, 2000 52 30 Number and Percentage of Persons Employed in Agricultural
Sectors, El Nido Municipality 53
31 Household Engaged in Agriculture and Fishing, El Nido Municipality, 2000
53
32 Volume of Production By Barangay, El Nido Municipality, 2000
54

____________________________________________________________________________________
viii
Table No.
Title
Page
33 Food Self-sufficiency, El Nido Municipality, 2000 56 34 Number and Percentage of Households Engaged in Fishing,
Volume of Catch and Total Income from Sale of Fish Catch, El Nido Municipality, 2000
56
35 List of Identified Tourism Spots and Resources, El Nido Municipality
59
36 Inventory of Tourist Attractions/Spots, Arrivals, El Nido Municipality, 2000
59
37 Land Classification, El Nido Municipality 60 38 Existing Land Use Distribution, El Nido Municipality 61 39 Protected Area Coverage, El Nido Municipality, 2000 61 40 Land and Sea Cover Classification, El Nido Municipality 65 41 Land/Sea Cover Classification By Barangay, El Nido
Municipality 67
42 Effectiveness Rating of National and Local Environmental Laws Being Enforced in El Nido Municipality
80
43 Effectiveness of Training Programs Attended by LGU Personnel and Representatives from Partner Organizations
83
44 Budget Allocated for Environmental Management (1998-2002), El Nido Municipality
84
45 Criteria and Guidelines for ECAN Zones Delineation 89 46 Proposed Coral Reef Zone in El Nido Municipality 94 47 ECAN Zones, El Nido Municipality 97 48 ECAN Zones by Barangay Breakdown, El Nido Municipality 100 49 ECAN Zones by Small Islands and Islets Breakdown, El Nido
Municipality 101
50 Types of Threats Affecting Different Barangays of El Nido Municipality
103
51 Management Measures for Core Zones 106 52 ECAN Zones and Proposed Allowable and Prohibited Uses 109 53 Priority Areas Requiring Ecosystem Rehabilitation in El Nido
Municipality 121
54 Potential Products for Livelihood Development, El Nido Municipality
122
55 List of Potential Foreign Funding Organizations 132 56 Indicative Schedule of Activities (2006-2015), ECAN Zones
Management Plan Implementation 133
57 Estimated Budget Requirements for the Implementation of ECAN Zoning and Related Environmental Management Programs
139
58 Implementing Organizations, Cost Contribution and Possible Sources of Funds
147

____________________________________________________________________________________
ix
LIST OF FIGURES
Figure
Title
Page
1 Politico-administrative Map of El Nido Municipality 10 2 Elevation Map, El Nido Municipality 11 3 Slope Map, El Nido Municipality 12 4 Flora Biodiversity, El Nido Municipality 23 5 Status of Coral Reefs of El Nido based on Survey conducted by
ECAN Zoning Project (2004) 30
6 Sightings of Dugong dugon in El Nido Municipality 32 7 Location of Reported Turtle Nests, El Nido Municipality 33 8 Cetacean Sightings in El Nido Municipality 34 9 Population Trendline, El Nido Municipality 38 10 Household Distribution by Barangay, El Nido Municipality 39 11 Average Household Size by Barangay, El Nido Municipality 40 12 Population Density Map of El Nido Municipality 42 13 Population By Age Group, El Nido Municipality 43 14 Occupied Housing Units by Building Type, El Nido
Municipality 47
15 Trendline, Tenure Status of Lot and Housing Unit Type, El Nido Municipality
48
16 Households by Main Source of Water Supply for Drinking/Cooking, El Nido Municipality
49
17 Garbage Disposal Methods, El Nido Municipality 50 18 Members of Labor Force By Barangay, El Nido Municipality,
2004 52
19 Land Classification Map, El Nido Municipality 63 20 El Nido Marine Reserve Map 64 21 Land/Sea Cover Map, El Nido Municipality 66 22 Proposed Flora and Fauna Core Zones 93 23 Proposed Core Zones for Coral Reefs, Reef Fish and Seagrass,
El Nido Municipality 95
24 Mangrove Forest, El Nido Municipality 96 25 ECAN Zones Map of El Nido Municipality 99

____________________________________________________________________________________
x
LIST OF ABBREVIATIONS
ADMP Ancestral Domain Management Plan BAI Bureau of Animal Industry BBES El Nido Breeding and Experimental Station BFAR Bureau of Fisheries and Aquatic Resources BFARMC Barangay Fishery and Aquatic Resources Management
Council CADC Certificate of Ancestral Domain Claim CADT Certificate of Ancestral Domain Title CARP Comprehensive Agrarian Reform Program CBFMA Community Based Forest Management Agreement CITES Convention on International Trade in Endangered Species CLWUP Comprehensive Land and Water Use Plan DA Department of Agriculture DAO DENR Administrative Order DENR Department of Environment and Natural Resources DOT Department of Tourism DTI Department of Trade and Industry ECAN Environmentally Critical Areas Network ECC Environmental Compliance Certificate EIA Environmental Impact Assessment ELAC Environment and Legal Assistance Center ELC ECAN Locational Clearance ENR Environment and Natural Resources ENTMRPA El Nido-Taytay Managed Resource Protected Area EZMP ECAN Zones Management Plan GMP General Management Plan HLURB House and Land Use Regulatory Board ICC Indigenous Cultural Communities ICCs/IPs Indigenous Cultural Communities/Indigenous Peoples IEC Information, Education and Communication IP Indigenous People IPRA Indigenous Peoples Rights Act IRA Internal Revenue Allotment ISF Integrated Social Forestry ISFP Integrated Social Forestry Program IUCN International Union for Conservation of Nature KKP Kabang Kalikasan Ng Pilipinas LGU Local Government Unit MAO Municipal Agriculture Office MENRO Municipal Environment and Natural Resources Officer MFARC Municipal Fishery and Aquatic Resources Management
Council MSA Mangrove Stewardship Agreement MSC Mangrove Stewardship Contract

____________________________________________________________________________________
xi
NAMRIA National Mapping and Resource Information Authority NCIP National Commission on Indigenous People NCSO National Census and Statistics Office NGO Non Government Organization NIPAP National Integrated Protected Areas Programme NPAAD Network of Protected Areas for Agriculture and
Agroindustrial Development NSO National Statistics Office PAO Protected Area Office PAMB Protected Area Management Board PASu Protected Area Superintendent PAWB Protected Area Wildlife Bureau PENRO Provincial Environment and Natural Resources Office PCLRA Participatory Land and Coastal/Marine Resources AssessmentPCRA Participatory Coastal Resource Assessment PCSD Palawan Council for Sustainable Development PCSDS Palawan Council for Sustainable Development Staff PNP Philippine National Police PPDO Provincial Planning and Development Office PPFP Provincial Physical Framework Plan PRRM Philippine Rural Reconstruction Movement PTFPP Palawan Tropical Forestry Protection Program SB Sangguniang Bayan SEP Strategic Environmental Plan UNDP United Nations Development Programme WWF World Wildlife Fund

______________________________________________________________________EXECUTIVE SUMMARY xii
EXECUTIVE SUMMARY
The ECAN Zones Management Plan (EZMP) for El Nido is formulated to guide the implementation of ECAN Zoning in the municipality. ECAN Zoning is a management tool that will guide the long term sustainable development of El Nido. Without ECAN Zoning in place, the environmental resources and life-support ecosystems of the municipality will be indiscriminately utilized. The Plan defines the priority concerns and actions that are needed in the conservation of natural resources and the protection of ecological life support services of the Municipality of El Nido. In general, the Plan provides an analysis of existing and potential threats and issues on the disposition and utilization of terrestrial and aquatic resources, assessment of gaps, weaknesses and barriers of present policies and mechanisms necessary for the sustainable implementation of ECAN Zoning. ECAN Zoning by and large sets the ground for sustainable development to proceed. This Plan has two parts: 1) the Ecological Profile of El Nido and 2) Management plan that prescribes the actions needed to address the issues, threats and barriers so that the full implementation of the ECAN Zoning will be realized. The preparation of the EZMP is mandated under the Strategic Environmental Plan (SEP) Law (RA 7611) and further elaborated by various PCSD resolutions and guidelines. This Plan is a response to the call for support in the implementation of the SEP. ECOLOGICAL PROFILE OF THE MUNICIPALITY OF EL NIDO Geography and Other Physical Features
Geography, Location and Area
El Nido is located at the northernmost tip of mainland Palawan with a longitude of 119o27’ and latitude 11o27’. It is about 430 kilometers southwest of Manila and is bounded on the north by the Linapacan Strait (Luzon Sea), on the west by the South China Sea, on the south by the municipality of Taytay, and on the east by Taytay bay (Sulu sea). El Nido is composed of 18 barangays four of which are urban and the rest rural. Based on the latest SPOT -5 maps, the total land area of the 18 barangays is 56,084 hectares while the total area of the 35 small islands and islets is 4,157 hectares.
Physical Environment El Nido has mountainous terrain interspersed with small pactches of lowlands occurring on minor coastal plains and alluvial valleys. It has numerous islands and islets mostly located in the western portion with about 45 scattered in Bacuit bay. El Nido’s coastlines generally have width of 11 km from the sea with a total area of 160 sq km. A large portion (69.94%) of the municipality’s area is rugged to steeply sloping while only 18.6% usually found in patches, has flat to gentle slopes suitable for urban and agricultural development.

______________________________________________________________________EXECUTIVE SUMMARY xiii
Sedimentary and metamorphic rocks of the Paleozoic and Mesozoic era make up the geology of El Nido. Rock formations consist of alluvium, Bacuit formation, Kapoas diorite intrusive, Liminangcong chert and Miniloc limestone. Geologic faultlines traverse the municipality on the south to the north of Villa Libertad/Pasadena boundary. The hotspring in Pasadena arises from a deep seated fault. The soils of El Nido are mostly of clay to sandy loam types by texture classes. Eight soil types are present in El Nido: Aborlan loam, Coron clay loam, hydrosol, Tagburos clay, Tapul clay loam, San Miguel clay loam, beach sand and rough mountain soil. The municipality has two distinct climate types: six months dry from December to May and rainy from June to November. The average annual precipitation is 2,200 mm. Tidal variation is approximately 1.5 m and the lack of narrow channels results in relatively sluggish tidal currents during outgoing tides and calm wind conditions. El Nido has 13 major river systems which drain several watersheds in the municipality.
Biological Environment
Forest Resources
Based on SPOT 5 data, the municipality has about 23,600 hectares of forest cover (excluding mangrove forest) comprising 43% of its total land area. Of the total forest cover, secondary growth forest consist of about 17,200 has (73%), primary forest about 3,400 ha (14%) and limestone forest of about 3,000 has (13%). Seven (7) endangered tree species were recorded in the municipality, such as kamagong, mala ipil, sakat, apitong, antipolo, and malasantol.
Wildlife Resources
The municipality harbors a total of 98 species of vertebrate fauna; 66 of which are birds, 19 species of mammals, 5 species of amphibians and 8 species of reptiles. Mt. Cabengkukay was noted to have the highest number of species recorded with 55 mammals, 208 birds, 3 reptiles and 27 amphibians.
Coastal and Marine Resources
The coral reef of the municipality was estimated to cover a total area of 1,207 has using IKONOS. Barangay Bebeladan has the largest area (about 291 has) of coral reef among the other barangays of El Nido. The other barangays with significant coral reef area are Mabini and Teniguiban. Over 60% of the reefs visited by the ECAN marine survey team have coral cover of less than 30% and none has a cover of from 76-100%. Coral reefs at the eastern side of El Nido were found to be in better condition than those at the western side which could be attributed to the presence of built-up areas and tourism resorts discharging effluents and solid wastes to the coastal water. Overall, a general decline in reef condition was observed in the sites visited. Only 3 (Cadlao island, Tapiutan island and Miniloc island) out of 8 sites were observed to have maintained their coral cover.

______________________________________________________________________EXECUTIVE SUMMARY xiv
The reef fish communities in El Nido are relatively in good condition with high species richness, abundance and biomass estimates. Since the last survey conducted in the area in 1993, it was observed by the ECAN marine team that the fish communities have remained stable at least in terms of species richness recorded to be 277. There are 95 target species and 27 indicator species recorded by the ECAN marine team. However, only few high value species of fish were observed in the sampling stations despite the high number of target species recorded which maybe due to high fishing pressure in the area. Seagrass cover was found extensive in the eastern portion of the municipality’s coastal waters from new Ibajay to Sibaltan and and on inner Bacuit bay (Bebeladan) while narrower beds were observed in San Fernando, Corong-corong and NW Bacuit bay. Overall canopy cover was low with 30% in most sites surveyed except in Sibaltan which exhibited a good cover of 53%. Five sampling stations located in Sibaltan, Corong-corong and Bebeladan harbored graze marks of Dugong dugon and these are candidate sites for core zoning because they serve as foraged areas of endangered animals. Mangrove areas in El Nido is estimated to be about 2,645 has; mostly second growth and regenerating mangrove species belonging to the genus Rhizopora, Bruguiera, Xylocarpus and Aegiceras. During the field surveys, 19 true and 22 associate mangrove species were identified and recorded. Mangrove flora has relatively low value in terms of biodiversity; with low volume forest and with an average volume stand at 36.428 m3, categorized as logged over or cleared/open areas. Socio-Economic Features
Population
El Nido has a total population of 27,029 with 5,191 households in 2000. Its average family size is about 5.2. Its population had a decreasing rate from 5.74% in 1980 to 3.06% in 1995 but had increased to 4.16% in 2000. Population density is low at only 0.48 persons per hectare.
Social Condition
Literacy rate in El Nido is 94%. There are 35 schools, 26 are elementary schools; 8 are high schools and a central school. Located at Villa Libertad and New Ibajay are the State Polytechnic College of Palawan (SPCP) and the Palawan State University (PSU) that offer tertiary education. Sixty five percent of El Nido residents have dug wells as the main source of water and only 3% of the population had their own water faucets. El Nido has a poorly managed water system and has no sewerage system at present. Garbage are commonly disposed by burning. Power supply is available daily only from 1:00 pm to 1:00 am, a disadvantage on the part of business establishments especially resort and beach cottages owners.

______________________________________________________________________EXECUTIVE SUMMARY xv
Economic Condition
Based on the survey of the ECAN Project in 2004, on the average about 71% of the households surveyed in 12 barangays have income below poverty line. Nine out of the 12 barangays have poverty incidence above 50%.
Unemployment rate is roughly estimated between 35 to 40%. Majority of the working population in El Nido are engaged in agriculture, 66% in agri-fishery and 41% in agriculture.
Agriculture and Fisheries
The top three agricultural products in El Nido are coconut, rice and cashew. Coconut is planted in 2,624 hectares with an average yield of 591 kg/ha while palay is planted in 2,354 has. Cashew is the top cash crop covering 2,425 has, said to be the biggest in Palawan. Average yield is 29 sacks per ha with a yearly produce valued at Php 30 million. El Nido also produces corn, mangoes, rootcrops and tubers, bananas and vegetables. About 702 households are engaged in fishing in 1999 but most of the fish caught were used for home consumption. However, the MAO reported that about 100 styrofoam boxes of fresh fish are being shipped out of the municipality during the months of March to May. Another major marine product of El Nido is squid and dried fish are likewise sold to traders in Manila.
Trade and Industry
Commerce in the municipality is dominated by retail and tourism based service establishments. There are cottages, pumpboats catering to tourists as well as tour guide and diving services. Major export products of El Nido are the traditional commodities like bird’s nests, cashew, fish and fish preparations..
Tourism
El Nido is famous for tourism not only in the province, in the country but also in the international tourism circuit. Its tourism potentials consist of beautiful beaches, cliffs, hills and mountains forms, islands and islets, corals and exotic marine species. It has two world renowned upscale resorts, the Lagen and Miniloc resorts. Other popular tourist sites include Bulalacao and Nagkaletkalet falls, Makinit hot spring in Pasadena and the cathedral cave in Bebeladan. In year 2000 tourist arrival at El Nido is 23, 807 domestic and foreign tourists. Majority of the tourists (about 90%) are from Asia, about 5% from Europe and about 10% from Manila. Land Use Profile Based on the NAMRIA-land classification map as analyzed by SEMP-ECAN Zoning Project, about 73.5% of the total land area in El Nido is still unclassified public forest while A&D lands and timberland are only about 23.7 and 3.8% respectively. There are

______________________________________________________________________EXECUTIVE SUMMARY xvi
discrepancies in the land statistics that need further study and validation to reconcile figures. El Nido’s CLWUP for 2003-2010 shows that about 50,849 has or 55% of its total land area is forestland while about 13% is being used for agriculture. Built up area is only about 0.22% or 205 has. However, the land/sea cover of the municipality based on SPOT 5 and IKONOS show different figures. Secondary forest consist of 17,151 has or about 34% of the total land area of El Nido. Primary forest and limestone forest is about 7 and 4% of its total area respectively. Agriculture area occupies only about 9 percent of the total municipal land area. The large tract of brushlands, 20,381 has or 40% of the total municipal land area indicates past disturbance of the forest ecosystem likewise causing a decrease in the forest area.
For coastal/marine habitats and ecosystems for which cover was measured by SPOT 5 and IKONOS, mangrove consist of 2,645 has. (46%); coral reef is 1207 has. (21%) while seagrass cover is 1,626 has (28%). ECAN ZONES MANAGEMENT PLAN FOR THE MUNICIPALITY OF EL NIDO
VISION
“A community that is healthy and peaceful, enjoying quality (with inherent capability to improve its quality of life) and an improving but sustainable quality of life, respectful of the integrity of the environment and its natural life forms and citizens who are God-fearing, humane,patriotic, acting with unity and increasing capabilities to create an ideal society for the next generation”..
MISSION
“Manage the environment and natural resources of El Nido for biodiversity conservation and for sustainable livelihood of its residents.”.
GOALS AND OBJECTIVES
• Sustainable development in the locality by the proper use of land and coastal/marine resources by which many benefits and opportunities will spring from to improve the peoples’ lives in El Nido.
• Attainment of sustainable tourism, agriculture, fisheries, forestry and urban development.

______________________________________________________________________EXECUTIVE SUMMARY xvii
ECAN ZONING AND MANAGEMENT PLAN IMPERATIVES
• Participatory planning and program implementation • Shared governance/partnership • Ecosystem management (protection and preservation of highly
threatened ecosystem, rehabilitation of degraded areas, adoption of conservation and sustainable use measures; reclamation to convert unproductive areas into productive uses)
• Monitoring, surveillance and evaluation • Law enforcement • Institutional Capacity Building • Sustainable Livelihood • Information, education, communication and advocacy campaigns
GUIDING PRINCIPLES IN ECAN ZONES PLANNING AND MANAGEMENT
• Usurfructuary Rights of Local Communities (Indigenous people and tenured migrants)
• Stakeholders’ Participation or Subsidiarity principle • Resource Sustainability • Polluters’ Pay Principle • Precautionary Principle • Promotion of Social Justice • Efficient use of ENR by Maximizing Resource Use Rent by Corporate
Users • Promotion of Women Sector Participation (Gender equality) • Science and Technology as Basic Foundation in ENR Policy-Making
and Management Decision-Making
TESTS OF SUSTAINABILITY FOR PROGRAMS AND PROJECTS UNDER THE ECAN ZONES
MANAGEMENT PLAN
• Economic Viability • Ecological Viability • Technological Viability • Socio-cultural Viability • Political Viability • Institutional Viability

______________________________________________________________________EXECUTIVE SUMMARY xviii
RESOURCE ISSUES AND PROBLEMS
I. Forest and Wildlife Resources 1. Overharvesting of bird’s nests 2. Illegal cutting of trees, illegal hunting of wildlife species 3. Squatting and illegal occupancy of forests 4. Burning of agricultural wastes in Bagong bayan, Corong corong,
Barotuan, Teneguiban and Ibajay 5. Expansion of kaingin plots in barangays Bagong bayan,
Aberawan, Manlag, Barotuan, Villa Paz, and New Ibajay
II. Coastal and Marine Resources 1. Beach quarrying in barangay Bebeladan 2. Pollution and sediment loading in coral reef areas of Pinasil
island and Tenegiban reef 3. Destructive fishing such as use of dynamite and cyanide 4. Unregulated tourism activities e.g. reckless diving,
indiscriminate dropping of anchors, humans stepping on coral formations
5. Destruction of seagrass meadows by cyanide and poison bait fishing and chemical pollutants from surface runoff
6. Gathering of wood for housing and charcoal materials from mangrove
7. Increase in fishing effort due to decline in fish catch attributed to proliferation of the use of cyanide and dynamite fishing and from pollution load coming from improper household waste disposal
. GAPS AND ISSUES IN MANAGEMENT
• Difficulty of the LGU in the enforcement of national laws due to:
limited manpower like forest rangers, deputized forest and fish wardens
limited IEC on Fisheries Code, Caves Act, Wildlife Act, Phil EIS System, other environmental laws
low LGU budget on environmental management programs lack of patrol boats and communication equipment to apprehend
violators delayed implementation of the delineation of 15 km municipal
waters absence of prosecutors to litigate environmental cases filed against
violators low level of awareness of constituents on environmental laws
• Weak and inadequate LGU technical and managerial capability in
environmental management

______________________________________________________________________EXECUTIVE SUMMARY xix
ECAN Zones of El Nido Criteria and Guidelines for Delineation of ECAN Zones The Strategic Environmental Plan (SEP) for Palawan as embodied in Republic Act 7611 serves as the framework for the sustainable development of the province. SEP provides for the establishment of the Environmentally Critical Areas Network (ECAN) with ECAN zoning as main strategy to achieve the following objectives of SEP.
• Forest conservation and protection • Protection of watersheds • Preservation of biological diversity • Protection of tribal people and the preservation of their culture • Maintenance of maximum sustainable yield • Protection of rare and endangered species and their habitat • Provision of areas for environmental and ecological research, education and
training • Provision of areas for tourism and recreation
The criteria for delineating ECAN Zones include a combination of the following:
• Elevation and slope • Type and condition of forest • Type and condition of habitat • Existing use of land • Biodiversity status • Presence of coral reefs and seagrass beds • Presence of endangered species of flora and fauna • Areas contributing to important ecological processes • Areas declared as protected areas
ECAN Zones, El Nido Municipality
ECAN Zones Area (Hectares) % of Total Core Zone 16,889.92 30.68 Restricted Use Area 8,390.49 15.23 Controlled Use Area 967.86 1.76 Traditional Use Zone 16,904.05 30.70 Multiple Use Zone 11,905.02 21.62 Grand Total 55,057.34 100.00
Based on PCSD Resolution No. 05-250, the terrestrial and coastal/marine
environment of El Nido Municipality were delineated and mapped into different types of ECAN Zones. Considering the management framework and guidelines for El Nido which involved further the designation of ECAN Zones for: a) protection and

___________________________________________________________________________EXECUTIVE SUMMARY xx
preservation; b) restoration; c) rehabilitation; d) reclamation or conversion to other uses; e) conservation and sustainable use; and f) conflict resolution the ECAN Zones Management Programs for the next ten (10) years was prepared. ECAN ZONES MANAGEMENT PROGRAMS (2006-2015)
The ECAN Zones Management Programs (EZMP) for the next ten years (2006-2015) contained in this Plan shall be jointly implemented by the PCSDS and the Municipality of El Nido with cooperation and support from stakeholders including other government agencies such as DENR, DA, DAR, NGO’s, local community organizations, private sector organizations (tourism establishments and other business establishments) which are operating in the area. The support of national and international funding organizations (grant and lending institutions) shall also be sought to fund selected activities of the program components. The following table shows the ECAN Zones Management Programs with the components, the corresponding objectives the major activities to attain the objectives and the corresponding implementing organizations.
Components Objectives Activities Implementing Organizations
1. Institutionalization
of Zoning and Management Guidelines
To adopt ECAN Zoning and its Management Guidelines and institute ECAN Zones management responsibility in PAMB and create ECAN Barangay Committees
• Expansion of
PAMB, creation of ECAN Barangay Committees
• Passage of ordinance adopting ECAN Zones map, management plan and Management Guidelines
• Data Base Development.
• Integration of ECAN Zoning in the CLUP/Passage of Ordinance
• Implementation/updating of EZMP and integration to Medium Term Investment Program of
LGU and PCSDS LGU and PCSDS LGU and PCSDS LGU and PCSDS LGU and PCSDS LGU and PCSDS LGU

___________________________________________________________________________EXECUTIVE SUMMARY xxi
Components Objectives Activities Implementing Organizations
Comprehensive Development Plan
• Preparation of Financial Plan and Mobilization of Financial Resources
2. Marking of Core Zones on the Ground
To establish markers on the ground (land and coastal waters) thereby setting the boundaries of core zones for monitoring and surveillance purposes
• Determination of Core Zone Areas using natural topographic features
• Ground Surveys. • Mobilization and
training of Barangay Volunteers
• Fund Sourcing • Implementation
of “Project Ground Marking of Busuanga’s Natural
PCSDS PCSDS and LGU LGU and PCSDS LGU and PCSDS LGU and PCSDS
3. Institutional Capacity Building
To strengthen the capability of established organizations that will implement ECAN Zoning
• Conduct of IEC and other mobilization activities
• Capacitation of municipal ECAN Board and Barangay ECAN Committees
LGU LGU
• Establishment of coordination mechanism among ECAN Zoning implementors
LGU and PCSDS
4. Law Enforcement To encourage stakeholders to comply with ECAN Zoning
• Mapping of hotspots on the ground
• Strengthening of Patrolling
PCSDS and LGU LGU

___________________________________________________________________________EXECUTIVE SUMMARY xxii
Components Objectives Activities Implementing Organizations
System • Instituting
ECAN Zones Clearance System
LGU
5. Ecosystem Rehabilitation
To improve the ecological status of the environment and natural resources through rehabilitative and restorative means
• Mapping of areas for restoration or rehabilitation
• Planning, project packaging, fund sourcing and project implementation
PCSDS and LGU PCSDS and LGU and DENR
• Establishment of marine sanctuaries
• Formulation of Watershed Management Program
• Packaging of agroforestry technology and soil conservation measures
BFAR, LGU, PCSDS, DENR LGU, PCSDS, DENR LGU, DENR, DA
6. Sustainable Livelihood Development
To promote sustainable livelihood for communities affected/dislocated by ECAN Zoning
• Packaging of prototype models
• Sourcing of funds; promoting establishment of micro credit financing and entrepreneurial training
• Providing educational support and vocational training
• Implementation of livelihood projects
LGU, NGO’S, PCSDS PCSDS, NGO’s LGU and Private Sector
7. Ecotourism Development and
To regulate tourism activities and number of
• Implementation of ECAN zoning
PCSDS and LGU

___________________________________________________________________________EXECUTIVE SUMMARY xxiii
Components Objectives Activities Implementing Organizations
Visitor Management
visitors vis-à-vis the carrying capacity of the municipality
and ecotourism guidelines
• IEC for resort owners, staff and visitors
• Support to enforcement of tourism guidelines and standards; support to tourist guides accreditation system
• Mapping and delineating of areas within core/restricted zones for allowable ecotourism activities
PCSDS, LGU, DOT, Tourism Establishments
8. Sustainable Financing
To develop schemes of financing for ECAN zoning implementation
• Establishment of sustainable financing mechanisms
• Identification of potential sources of funds
• Establishment of ECAN Trust Fund
PCSDS and LGU LGU and PCSDS PCSDS
9. Research, Monitoring and Evaluation
To conduct research to improve ecosystem management and establish and operationalize monitoring and evaluation system for ECAN Zoning
• Establishment of ECAN Zoning M & E at the Barangay Level and Operationa-
lization of the same • Assessment of
impacts of ECAN Zoning
PCSDS and LGU PCSDS and LGU
10. Policy Reforms To introduce policy reforms and new laws to improve ECAN Zoning
• Introduction of changes in zoning guidelines to adapt to new
PCSDS and LGU

___________________________________________________________________________EXECUTIVE SUMMARY xxiv
Components Objectives Activities Implementing Organizations
laws • Updating of
ECAN zones maps and information
• Identification of unclassified public forest lands for Congressional action
• Policy
recommendation for local implementation
PCSDS and LGU PCSDS, LGU, District Congressional Representatives LGU and PCSD
The estimated budgetary requirement for ECAN Zoning Implementation is /P 206.746 million over a period of ten years as reflected in the following table. Estimated Budget Requirements for ECAN Zoning Implementation and Related
Environmental Management Programs in El Nido (2006-2015) In Thousand Pesos
Components Cost(P000) 1.
Institutionalization of ECAN Zoning and Management Guidelines
/P 39,106
2. Marking of Core Zones on the Ground /P 21,680 3. Institutional Capacity Building 2,390 4. Law Enforcement 15,741 5. Ecosystem Rehabilitation 38,150 6. Sustainable Livelihood Development 60,300 7. Ecotourism Development and Visitor Management 8,150 8. Sustainable Financing for ECAN Zoning 6,640 9. Research, Monitoring and Evaluation 9,960 10. Policy Reforms 4,660 T O T A L /P 206,746

_______________________________________________________________________EXECUTIVE SUMMARY
xxv
Possible sources of funds include: 1) Share of the Province in the Malampaya Funds; 2) Land Bank of the Philippines, DBP and other private banks; 3) Shell Philippines Exploration; 4) Malampaya Foundation; 5) JBIC, WB, ADB, AUSAID, USAID, UNDP, GEF; 6) Other sources like foreign embassies, NGO’s, local foundations and NGO’s. It is also imperative for the LGU to generate revenues from user fees, charges and fines by adjusting the present low rates of these local taxes.
It is envisioned in this Plan that the improvement in the state of natural environment in El Nido will sustain the flow of income and benefits in tourism, agriculture, fisheries and forestry. Investments in ECAN Zoning and environmental management programs would also directly improve the economic welfare of the people of El Nido by giving them the opportunity to engage in alternative sustainable livelihood projects.
The key to sustainable development is ECAN Zoning and proper implementation of its guidelines and attendant management programs and projects.

______________________________________________________________________________________ INTRODUCTION 1
1.0 INTRODUCTION
1.1 Purpose and Scope of the Management Plan
The overall purpose of the Environmentally Critical Areas Network (ECAN) Zones Management Plan (EZMP) is to guide the implementation of ECAN Zoning in the Municipality of El Nido. The Plan defines the priority concerns and actions that are needed in the conservation of natural resources and the protection of ecological life support services so that the municipality’s communities can enjoy in a sustainable manner the benefits of their natural resources and the amenities of a healthy environment. The management prescriptions provided in the Plan are strategically designed to ensure the proper use of land and aquatic resources capital and the development of human, institutional and physical capital for the attainment of sustainable development in the locality. The EZMP primarily aims to provide directions to the Palawan Council for Sustainable Development (PCSD) and ECAN Boards in their decision-making, planning and implementation of ECAN zoning, socioeconomic development and environment and natural resources management programs and projects. ECAN zoning is an indispensable management tool that will guide the long-term sustainable development of the municipality. Without ECAN zoning in place, the environmental resources and life support ecosystems of the municipality will be indiscriminately utilized resulting in further acceleration of their despoliation and leading to greater impoverishment of the local people. In general, the Plan provides the analysis of existing and potential threats and issues on the disposition and utilization of terrestrial and aquatic resources, and the assessment of the gaps, weaknesses, and barriers of present policies and institutional set-up and mechanisms necessary for the sustainable implementation of ECAN zoning. The assessments will serve as the bases for the formulation of prescriptive measures and programs necessary to ensure the effective and efficient administration of ECAN zoning. The EZMP has two Parts: The first part of the Plan provides the Ecological Profile of El Nido which describes and assesses the present socioeconomic situation and the present uses, status and conditions of the terrestrial and marine environment and natural resources. The second part provides the management plan which prescribes the actions needed to address the issues, threats and barriers so that the full implementation of the ECAN zoning will be realized. The second part also lays down the delineation of the terrestrial and coastal/marine environments of the municipality according to types of ECAN Zones defining the threats and general management strategies for the conservation, protection and/or sustainable development of the various zonal types. The EZMP was validated with the stakeholders consisting of the officials and staff of PCSDS, LGUs, other government agencies, NGOs and representatives from local community organizations to integrate their concerns and legitimize the measures and action programs proposed in the Plan. After the ECAN Zoning Project is completed, further consultation and participatory planning with stakeholders shall be undertaken by counterpart PCSDS staff in partnership with the municipal government’s planners and environmental managers to refine and update the EZMP. The periodic updating of the

______________________________________________________________________________________ INTRODUCTION 2
EZMP especially its management guidelines will make the plan responsive and attuned to the needs and concerns of the local people. The Management Plan is designed to guide the implementation of the ECAN Zoning for the next ten years (2006 – 2015). It shall be updated every six years to account for recent progress that will be attained, new issues and concerns that will emerge, and respond to new policies and development thrusts the government will pass. The successful and sustained implementation of ECAN zoning is imperative in the attainment of sustainable development in the municipality that is expected to reduce poverty and improve the quality of life of the local communities while at the same time maintaining the ecological integrity and biodiversity endowment of the area. 1.2 Legal Basis of the Management Plan The preparation of the EZMP is mandated under the Strategic Environmental Plan (SEP) Law (RA 7611) and further elaborated by several PCSD resolutions and guidelines. Under Section 2 (Declaration of Policy) of the SEP law, it is stipulated that “a comprehensive framework for the sustainable development of Palawan compatible with protecting and enhancing the natural resources and endangered environment of the province is hereby adopted.” The management framework under the SEP law refers to the Strategic Environment Plan (SEP) for Palawan or SEP. The SEP, in turn, shall guide the preparation of plans and programs of the LGUs and national government agencies. This ECAN Zones Management Plan (EZMP) of El Nido is a response to the call for support in the implementation of the SEP. The importance and requirement for the preparation of a management plan for ECAN zones is stipulated in the latest PCSD Resolution No. 05-250 (Resolution Adopting the Revised Guidelines in Implementing the Environmentally Critical Areas Network, The Main Strategy of the Strategic Environmental Plan (SEP) for Palawan, Amending PCSD Resolution Nos. 94-44 and 99-144). Section 25 of this Resolution mandates the LGU through its ECAN Board with the assistance of PCSDS to prepare the ECAN Zoning Plan after the ECAN Zones Map has been approved by PCSD. In the preparation of the EZMP, other environmental laws and regulations were taken into account to ensure that the Plan supports and harmonizes its prescribed action programs with the goals and objectives of such legislations. The laws and regulations considered in framing the EZMP for El Nido are briefly described below.
National Environmental Laws and Regulations
1) NIPAS Act and Implementing Guidelines
The NIPAS Act aims to secure for the Filipino people of present and future generations the perpetual existence of all native plants and animals through the establishment of a comprehensive system of integrated protected areas within the classification of national park as provided for in the Constitution. NIPAS shall encompass outstanding remarkable areas and biologically important public lands that are habitats of rare and endangered

______________________________________________________________________________________ INTRODUCTION 3
species of plants and animals, biogeographic zones and related ecosystems, whether terrestrial, wetland or marine, all of which shall be designated as “protected areas.”
2) Indigenous Peoples Rights Act (IPRA)
The IPRA law is meant to protect the rights of ICCs/IPs to their ancestral domains to ensure their economic, social and cultural well-being and recognition of the applicability of customary laws governing property rights or relations in determining the ownership and extent of ancestral domain. It aims to maintain, manage and develop ancestral domains or portions thereof, which are found to be necessary for critical watersheds, mangroves, wildlife sanctuaries, wilderness, protected areas, forest cover, or reforestation as determined by appropriate agencies with the full participation of ICCs/IPs concerned.
3) Caves Conservation Act (CCA)
The Caves Conservation law was passed to conserve, protect and manage caves and cave resources as part of the country’s natural wealth. It also aims to regulate the utilization of caves and cave resources for scientific, educational, recreational, tourism and other purposes.
4) Wildlife Conservation Act (WCA) The Wildlife Conservation Act aims to conserve the country’s wildlife resources and their habitats for sustainability. It will regulate the collection and trade of wildlife, support the scientific studies on the conservation of biological diversity and pursue commitment to international conventions, protection of wildlife and their habitats.
5) Agriculture and Fisheries Modernization Act (AFMA) and Implementing Guidelines
The Act and its implementing guidelines have two key provisions related to zoning. These are:
• Network of Protected Areas for Agricultural and Agro-industrial Development (NPAAAD) - agricultural areas identified by DA through BSWM in coordination with the NAMRIA in order to ensure the efficient utilization of land for agriculture and agro-industrial development and promote sustainable growth. The NPAAAD covers all irrigated areas, irrigable lands already covered by irrigation projects with firm funding commitments; all alluvial plain lands highly suitable for agriculture whether irrigated or not; agro-industrial croplands or lands presently planted to industrial crops that support the viability of existing agricultural infrastructure and agro-based enterprises, highlands, or areas located at an elevation of 500 meters or above and have the potential for growing semi-temperate and high-value crops; all agricultural lands that are ecologically fragile, the conversion of which will result in serious environmental degradation, and mangrove and fish sanctuaries.
• Strategic Agriculture and Fisheries Development Zones (SAFDZ) - areas within the NPAAD identified for production, agro-processing and marketing activities to help develop and modernize, with the support of government, the

______________________________________________________________________________________ INTRODUCTION 4
agriculture and fisheries sector in an environmentally and socio-culturally sound manner.
6) Fisheries Code and Implementing Guidelines
The Fisheries Code aims to achieve food security in the utilization, management, development, conservation and protection of fishery resources in order to provide the food needs of the population.
The Code’s policies relevant to zoning are as follows:
• To limit the access to the fishery resources of the Philippines for the exclusive use and enjoyment of Filipino citizens.
• To ensure the rational and sustainable development, management and conservation of the fishery and aquatic resources in Philippine waters including the EEZ.
• To protect the rights of fisherfolk, especially of the local communities with priority to municipal fisherfolk, in the preferential use of the municipal waters.
• To manage fishery and aquatic resources in a manner consistent with the concept of an integrated coastal area management in specific natural fishery management areas, appropriately supported by research, technical services and guidance provided by the State.
7) Local Land Use Zoning Ordinance
The following laws and regulations mandate LGUs to prepare land use plans and zoning ordinance:
• RA 7160 (Local Government Code of 1991) provides that local government units (LGUs) shall, in conformity with existing laws, continue to prepare their respective comprehensive land use plans enacted through zoning ordinances which shall be the primary and dominant bases for the future use of land resources. The zoning ordinance is enacted pursuant to the provisions of the Code’s Sections 458 a.2 (7-9) and 447 a.2 (7-9) dated 10 October 1991- “Authorizing the City/Municipality through the Sangunian Panglunsod/Bayan to adopt Zoning Ordinance subject to the provisions of the existing laws and in conformity with EO 72.
• PD 933 and EO 648 series of 1981 as amended by EO 90 series of 1986
empower the HLURB to prescribe the standards and guidelines governing the preparation of land use plans, to monitor the implementation of such plans, and to adjudicate and settle disputes among LGUs over their land use plans and zoning programs.
• HLURB Board Resolution No. 590 Series of 1996 (Approving the Revised
Model Zoning Ordinance). HLURB issued planning guidelines for CLWUP preparation and one of these is the Model Zoning Ordinance (Volume X). The Zoning ordinance is a legal translation of the CLUP.

______________________________________________________________________________________ INTRODUCTION 5
Environmental Laws Specific to Palawan Province There are also other environmental laws specific to the Province of Palawan which have to be considered in ECAN zoning and its implementation. These are:
1) Presidential Proclamation No. 219 issued in 1967 which declared the province
of Palawan mainland and islands as a Game Refuge and Bird Sanctuary and the majority of small islands (less than 50,000 hectares) as national reserves. Many areas were later excluded due to amendments and passage of other proclamations.
2) Presidential Decree No. 2152 issued in 1981 which declared the entire
province of Palawan as Mangrove Swamp Forest Reserves to conserve and protect their ecological, scientific educational and recreational values, including flora and fauna and marine life found therein.
Environmental Laws Specific to El Nido Municipality
The El Nido Managed Resource Protected Area was declared as a protected area in 1998 through Presidential Proclamation No. 32 signed by then President Joseph Estrada. In the following year, the Protected Area Management Board passed a resolution to change the name of the protected area to El Nido – Taytay Managed Resource Protected Area to recognize the inclusion of the three barangays of Taytay. The PA is approximately 90,321 hectares with 36,018 hectares comprising the terrestrial component and 54,303 hectares of marine component.
Other Proclamations on El Nido are briefly described below:
1) Presidential Proclamation No. 785 issued in 1935 – Establishing the Bacuit Watershed Forest Reserve (94 hectares) for the purpose of conserving and regulating water, Municipality of Bacuit (changed in 1954 to Municipality of El Nido).
2) Presidential Proclamation No. 786 issued in 1935 – Establishing the Cadlao
Forest Reserve (849 hectares) for general forest protection and timber production on Cadlao island, Municipality of Bacuit
3) Presidential Proclamation No. 799 - Establishing the Inabuyatan Forest
Reserve for general forest protection and timber production.
4) Presidential Proclamation No. 814 – Establishing the Bacuit Cliff Forest Reserve, for forest protection (265 hectares).
Two administrative orders from the DENR were issued to protect areas of interest in El Nido with national and local significance. These are:
1) MNR Administrative Order No. 518 issued in 1984 which established the northwestern portion of El Nido as a “Marine Turtle Sanctuary” (36,000 hectares) to enhance national conservation of marine turtles.

______________________________________________________________________________________ ECOLOGICAL PROFILE 6
2) DENR Administrative Order No. 14 in 1991 which established the 95,000- hectare El Nido Marine Reserve. The islands within the marine reserve were classified into ecological zones such as core zone and multiple use zones to allocate areas for biodiversity conservation and sustainable use of coastal and marine resources.
The foregoing laws served as legal backdrop in the formulation of the ECAN Zones Management Plan for El Nido. The policy intent and provisions of these laws which are relevant to ECAN zoning were taken into account in the preparation of the Management Plan.
2.0 ECOLOGICAL PROFILE
2.1 Geographic Location
2.1.1 Administrative Boundaries El Nido is located in the northernmost tip of Palawan with a longitude of 119°27’ and latitude of 11° 27’. It is about 430 kilometers southwest of Manila. It is bounded on the north by Linapacan Strait (Luzon Sea), on the east by Taytay Bay (Sulu Sea), on the south by the Municipality of Taytay, and the west by South China Sea.
El Nido Municipality is composed of 18 barangays where 4 are classified urban and the rest rural. The total land area of the 18 barangays based on SPOT-5 maps is 56,084 hectares (Table 1) and the total area of the 35 small islands and islets covered is 4,157 hectares (Table 2). Figure 1 shows the boundaries of the barangays comprising the municipality of El Nido (barangay boundaries are marked in red color).
2.1.2 Municipal and Barangay Areas
The CLUP (2003-2010) of El Nido reported that the municipality has a total land area of 92,326 hectares but the report has not presented an accompanying table to show the breakdown of this total by barangay and island level. In view of this, the ECAN Zoning Project produced two tables (Table 1 and Table 2) from the digitized data obtained from SPOT-5 generated map which provide the estimated area breakdown in hectares of the 18 barangays and 35 small islands and islets, respectively, comprising the municipality. The combined total area of 56,084.08 hectares and 4,157.35 hectares presented in tables 1 and 2 is 60,241.43 hectares which is 32,084.57 hectares short of the reported total area of 92,326 hectares. The discrepancy in the reported figure could not be found in El Nido documents that were reviewed by the project. However, the reported existing land use of the area broken down by different land use categories (see Table 38 on page 60) shows a total of 92,326 hectares based on the CLWUP (2001) report. Nonetheless, if the total area of 92,326 hectares cannot be accounted for in terms of barangay and island breakdown, this reported figure remains questionable and subject to detailed land area survey.

______________________________________________________________________________________ ECOLOGICAL PROFILE 7
Based on Table 1, barangays New Ibajay and Pasadena have the largest land area comprising about 10.95% and 9.19%, respectively, of the total land area of the municipality. The smallest barangays are Maligaya, Buena Suerte and Masagana with land areas below 500 hectares. The biggest islands in the municipality includes: Cadlao (975 hectares), Matinloc (641 hectares), Tapiutan (383 hectares), Miniloc (304 hectares) and Lagen (302) as shown in Table 2.
Table 1. Land Area by Barangay, El Nido Municipality
Source: Digitized SPOT-5 Data, ECAN Zoning Project 2006
Barangay Total Land Area
(hectares) % of Total Land Area
1) Aberawan 2,374.61 4.31 2) Bagong Bayan 3,308.20 6.01 3) Barotuan 2,845.89 5.17 4) Bebeladan 6,340.63 11.52 5) Bucana 2,222.47 4.04 6) Buena Suerte 206.55 0.37 7) Corong-corong 2,150.28 3.91 8) Mabini 3,854.14 7.00 9) Maligaya 84.54 0.15 10) Manlag 2,050.74 3.72 11) Masagana 181.75 0.33 12) New Ibajay 6,025.32 10.95 13) Pasadena 5,056.21 9.19 14) Sibaltan 4,207.74 7.64 15) San Fernando 2,243.26 4.08 16) Tenequiban 4,711.96 8.56 17) Villa Libertad 3,555.55 6.46 18) Villa Paz 3,619.79 6.58
TOTAL 55,039.63 100.00

______________________________________________________________________________________ ECOLOGICAL PROFILE 8
Table 2. Land Area of Small Islands and Islets, El Nido Municipality
Small Islands and Islets
Land Area (Hectares)
% of Total Land Area
1) Binulbulan Island 283.46 6.81 2) Bolog Island 4.37 0.10 3) Brother Island 7.70 0.18 4) Bury Island 2.06 0.04 5) Cabuli Island 157.75 3.79 6) Cadlao Island 975.63 23.46 7) Calitan Island 11.82 0.28 8) Cauayan Island 133.24 3.20 9) Caverna Island 7.71 0.18 10) Comocutan Island 1.66 0.03 11) Darocotan Island 80.19 1.92 12) Depeldet Island 4.79 0.11 13) Diapila Island 12.16 0.29 14) Dibuluan Island 48.98 1.17 15) Dilumacad Island 57.16 1.37 16) Entalula Island 29.37 0.70 17) Imorigue Island 129.63 3.11 18) Inabayatan Island 35.89 0.86 19) Inambuyod Island 110.11 2.64 20)Inatula Island 24.65 0.59 21) Lagen Island 302.67 7.28 22) Lalutaya Island 137.21 3.30 23) Maatag Island 2.65 0.06 24) Malapacao Island 2.96 0.07 25) Malpacao Island 32.01 0.76 26) Matinloc Island 641.20 15.42 27) Miniloc Island 304.73 7.32 28) Mitre Island 4.60 0.11 29) Nalbut Island 1.61 0.03 30) North and South Guntao Island 159.13 3.82 31) Pangulasian Island 42.43 1.02 32) Picoton Island 13.57 0.32 33) Tagbao Island 5.50 0.13 34) Tapiutan Island 383.49 9.22 35) Turtle Island 5.26 0.12
GRAND TOTAL 4,157.35 100.00 Source: ECAN Zoning Project, SPOT-5 Digitized Data on Land Area (2006)

______________________________________________________________________________________ ECOLOGICAL PROFILE 9
2.2 Physical Environment
2.2.1 Topography
El Nido has mountainous terrain interspersed with small patches of lowlands occurring on minor coastal plains and alluvial valleys. It has numerous islands and islets mostly located in the western portion. About 45 islands and islets are scattered in Bacuit Bay.
El Nido’s coastlines generally have a width of 11 km from the sea with a total area of 160 square kilometers. The municipality’s highest elevation is 630 meters above sea level which is the peak of Inupawan mountain in Barangay Pasadena. The Elevation Map of the municipality (Figure 2) shows that areas with highest elevation are located on the northern and southern sides of the municipality.

________________________________________________________________________________________________ ECOLOGICAL PROFILE 10
Figure 1. Politico-administrative Map of El Nido Municipality

________________________________________________________________________________________________ ECOLOGICAL PROFILE 11
ure 3. Slope Map of El Nido Municipality
Figure 2. Elevation Map, El Nido Municipality

__________________________________________________________________________________ ECOLOGICAL PROFILE 12
Figure 3. Slope Map of El Nido Municipality

__________________________________________________________________________________ ECOLOGICAL PROFILE 13
A large portion (47.94%) of the land area of El Nido is steeply sloping while only a small portion (18.69%), usually found in patches, has flat to gentle slopes (Table 3). The same area (18.69%) are suitable for urban and agriculture development comprise about while the rest comprises upland areas which may pose some risks or entail additional costs when developed for settlements and agriculture. About 89% of the combined total land area of the small islands and islets of El Nido is above 36% slope or steeply sloping and is better left off with their forest cover to avoid land degradation and siltation of pristine coastal waters.
Table 3. Slope Classes, El Nido Municipality
Based on digitized data of Slope Map derived from NAMRIA’s Topographic Map The barangays which have the largest land area with flat to gentle slopes include: Bagong Bayan (1,418.59 ha) and New Ibajay (1278.08 ha). These barangays have enough land area for settlements and agriculture development. On the other hand, the barangays which have the largest areas with steep slopes (>36%) are: Bebeladan (4,176.93 ha), Pasadena (2,998.29 ha), Teniguiban (2,495.83 ha) and Sibaltan (2,308.83). These barangays have the largest areas for forest protection and soil conservation. The barangays which have more than 70% of their total land area with rugged to steep slopes are Maligaya (88.48%), Buena Suerte (83.53%), Bebeladan (82.65%), San Fernando (77.77%), Pasadena (78.71%), Sibaltan (73.63%), Teniguiban (77.34%) and Corong corong (77.13%). These barangays have limited suitable lands for urban and agriculture expansion and would require more efforts and resources to maintain and rehabilitate their forest cover.
Slope Type Hectares % 0 - 3 % (Flat) 2,795.46 5.08 3 - 8 % (Gentle) 7,490.12 13.61 8 - 18 % (Moderate) 6,261.13 11.38 18 – 36 % (Rugged) 12,106.56 22.00 36 - 50 % (Steep) 16,653.96 30.26 > 50 % (Above broken) 9,732.40 17.68 Grand Total 55,039.63 100.00

______________________________________________________________________________________________________________________________________ ECOLOGICAL PROFILE 14
Table 4. Slope Classes by Barangay, El Nido Municipality
Barangay 0 - 3 % 3 - 8 % 8 - 18 % 18 - 36 % 36 - 50 % 50 and above TOTAL Ha. % Ha. % Ha. % Ha. % Ha. % Ha. %
Aberawan 335.26 11.99 153.41 2.05 218.78 3.49 807.45 6.67 572.20 3.44 287.51 2.95 2,374.61 Bagong Bayan 1,016.05 36.35 402.54 5.37 403.34 6.44 838.92 6.93 459.24 2.76 188.11 1.93 3,308.20 Barutuan 31.72 1.13 771.61 10.30 179.47 2.87 471.24 3.89 918.67 5.52 473.18 4.86 2,845.89 Bebeladan 71.85 2.57 409.68 5.47 563.18 8.99 1,000.13 8.26 2,041.18 12.26 1,209.07 12.42 5,295.09 Bucana 69.83 2.50 608.78 8.13 312.61 4.99 439.88 3.63 572.32 3.44 219.05 2.25 2,222.47 Buena Suerte 7.42 0.27 0.21 0.00 5.01 0.08 10.69 0.09 20.23 0.12 162.99 1.67 206.55 Coron Corong 8.82 0.32 199.94 2.67 282.94 4.52 453.32 3.74 757.66 4.55 447.60 4.60 2,150.28 Inambuyod Is. 2.41 0.09 0.00 0.00 4.57 0.07 4.73 0.04 25.84 0.16 72.56 0.75 110.11 Mabini 15.60 0.56 679.88 9.08 411.49 6.57 936.80 7.74 1,264.90 7.60 545.47 5.60 3,854.14 Maligaya 0.16 0.01 4.71 0.06 4.87 0.08 10.45 0.09 12.87 0.08 51.48 0.53 84.54 Manlag 557.58 19.95 174.06 2.32 235.29 3.76 574.84 4.75 333.19 2.00 175.78 1.81 2,050.74 Masagana 0.11 0.00 11.28 0.15 28.99 0.46 75.79 0.63 41.65 0.25 23.93 0.25 181.75 Matinloc Is. 16.10 0.58 1.00 0.01 5.85 0.09 25.09 0.21 65.11 0.39 324.08 3.33 437.23 New Ibajay 102.35 3.66 1,172.73 15.66 964.23 15.40 1,748.18 14.44 1,323.35 7.95 714.48 7.34 6,025.32 North Guntao Is. 1.00 0.04 0.00 0.00 3.70 0.06 6.70 0.06 15.03 0.09 27.38 0.28 53.81 Pasadeña 21.05 0.75 521.20 6.96 534.18 8.53 981.49 8.11 1,991.33 11.96 1,006.96 10.35 5,056.21 San Fernando 19.28 0.69 225.34 3.01 254.02 4.06 467.23 3.86 885.84 5.32 391.55 4.02 2,243.26 Sibaltan 325.85 11.66 337.66 4.51 445.99 7.12 789.41 6.52 1,538.35 9.24 770.48 7.92 4,207.74 South Guntao Is. 3.48 0.12 1.00 0.01 3.63 0.06 8.06 0.07 12.68 0.08 54.09 0.56 82.94 Tapiutan Is. 3.62 0.13 2.02 0.03 7.23 0.12 18.49 0.15 29.16 0.18 300.93 3.09 361.45 Teneguiban 63.57 2.27 476.67 6.36 527.43 8.42 1,148.46 9.49 1,879.55 11.29 616.28 6.33 4,711.96 Villa Libertad 94.12 3.37 620.15 8.28 433.29 6.92 608.11 5.02 798.27 4.79 1,001.61 10.29 3,555.55 Villa Paz 28.23 1.01 716.25 9.56 431.04 6.88 681.10 5.63 1,095.34 6.58 667.83 6.86 3,619.79 TOTAL 2,795.46 100.00 7,490.12 100.00 6,261.13 100.00 12,106.56 100.00 16,653.96 100.00 9,732.40 100.00 55,039.63
Source: ECAN Zoning Project, 2006 * Consolidated figures for 35 small islands and islets
______________________________________________________________________ECOLOGICAL PROFILE 15
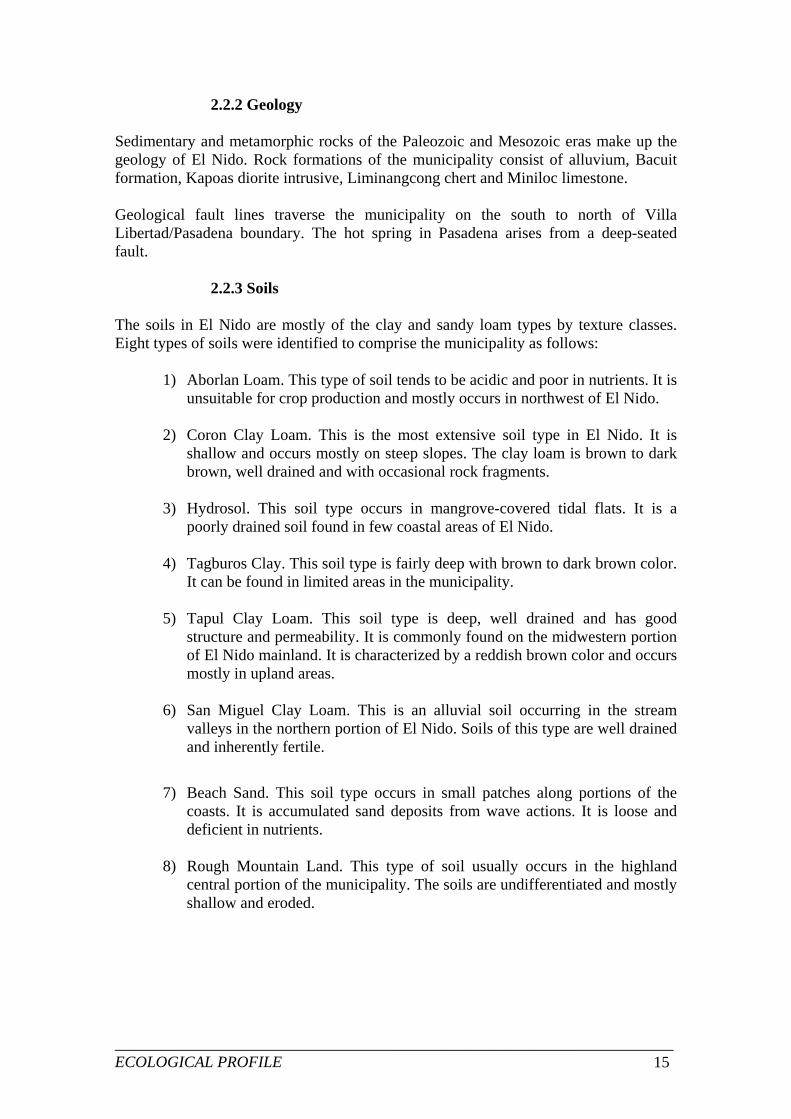
2.2.2 Geology Sedimentary and metamorphic rocks of the Paleozoic and Mesozoic eras make up the geology of El Nido. Rock formations of the municipality consist of alluvium, Bacuit formation, Kapoas diorite intrusive, Liminangcong chert and Miniloc limestone. Geological fault lines traverse the municipality on the south to north of Villa Libertad/Pasadena boundary. The hot spring in Pasadena arises from a deep-seated fault.
2.2.3 Soils
The soils in El Nido are mostly of the clay and sandy loam types by texture classes. Eight types of soils were identified to comprise the municipality as follows:
1) Aborlan Loam. This type of soil tends to be acidic and poor in nutrients. It is unsuitable for crop production and mostly occurs in northwest of El Nido.
2) Coron Clay Loam. This is the most extensive soil type in El Nido. It is
shallow and occurs mostly on steep slopes. The clay loam is brown to dark brown, well drained and with occasional rock fragments.
3) Hydrosol. This soil type occurs in mangrove-covered tidal flats. It is a poorly drained soil found in few coastal areas of El Nido.
4) Tagburos Clay. This soil type is fairly deep with brown to dark brown color. It can be found in limited areas in the municipality.
5) Tapul Clay Loam. This soil type is deep, well drained and has good
structure and permeability. It is commonly found on the midwestern portion of El Nido mainland. It is characterized by a reddish brown color and occurs mostly in upland areas.
6) San Miguel Clay Loam. This is an alluvial soil occurring in the stream
valleys in the northern portion of El Nido. Soils of this type are well drained and inherently fertile.
7) Beach Sand. This soil type occurs in small patches along portions of the coasts. It is accumulated sand deposits from wave actions. It is loose and deficient in nutrients.
8) Rough Mountain Land. This type of soil usually occurs in the highland
central portion of the municipality. The soils are undifferentiated and mostly shallow and eroded.

______________________________________________________________________ECOLOGICAL PROFILE 16
2.2.4 Climate
El Nido belongs to the Type 1 Climate which has two distinct seasons: the dry season from December to May and the wet season from June to November. The driest month is April, while the rainiest is August. The temperature does not vary much throughout the year with an average of 270C during the day and 220C during the night. The average annual precipitation is about 2,200 mm.
2.2.5 Oceanography
Based on NIPAP data ((NIPAP, 2000) the wind driven currents dominate water transport in Bacuit Bay. Wind speeds range from 1.7 and 5.8 m/s produce surface currents in the same direction of between 0.137 and 0.330m/s. In terms of tidal movements, tidal variation is approximately 1.5 m. The lack of narrow channels results in relatively sluggish tidal currents during outgoing tides and calm wind conditions. The mean monthly salinity of El Nido’s sea water ranges between 33 and 34 parts per thousand (ppt). Lower values have been recorded near river discharges (-30 ppt). Turbidity as measured by mean Secchi disk readings range from 1.25 – 20m depending on distance from river mouths. Greater water clarity has been observed at some of the island locations in Bacuit Bay. 2.2.6 Surface Water
El Nido has thirteen major river systems which drain several watersheds in the municipality as shown in Table 5. Table 5. Major Rivers and Watersheds in El Nido Municipality
Name of River Location Watershed Drainage
Kaparayan Aberawan Aberawan watershed
Camago point
Aberawan Aberawan Aberawan watershed
Camago point
Manlag Manlag Manlag watershed Manlag bay Manlalic Manlag Manlag watershed Manlag bay Danat Manlag Danat watershed Dagal-dagal bay Lio Villa Libertad Villa Libertad
watershed Bacuit bay
Quinawangan Pasadena Bulalacao watershed
Bacuit bay

______________________________________________________________________ECOLOGICAL PROFILE 17
Name of River Location Watershed Drainage
Nagkalitkalit Pasadena Bacuit watershed Quinawangan, Bacuit bay
Barotuan Barotuan Bucana watershed, Barotuan and Happy Valley
Bucana bay
Taberna Bucana Maranlao watershed, Tinegueban
Bucana bay
New Ibajay New Ibajay Cagbanaba watershed
New Ibajay, Villa Paz
Batakalan Villa Paz Villa Paz watershed Villa Paz sea Sibaltan Sibaltan Sibaltan watershed Sibaltan sea Source: NIPAP, 2000.
2.3 Biological Environment
The assessment of the status and conditions of the terrestrial and coastal/marine ecosystems and resources of El Nido used the information and data generated by the field surveys and research studies conducted by the ECAN Zoning Project. The field surveys selected transect lines and quadrats which are representatives of the ecosystems of the municipality. The study sites covered as much as possible the different barangays of the municipality and pre-selected islands and islets. For El Nido, both baseline and in-depth surveys and studies were done to generate a comprehensive dissection and in-depth analysis of its ecosystems. The results of the field surveys were supplemented by secondary data generated by similar studies done in the past by other institutions and projects.
2.3.1 Forest Resources 2.3.1.1 Terrestrial Flora
Four types of terrestrial natural forests and one coastal (mangrove) forest are found in El Nido. The terrestrial forests and their species are briefly described in Table 6. Lowland evergreen rainforest which is comprised of old growth and secondary growth forests are found in the hills and mountains of the municipality’s mainland. Old growth and young generation forest found in the mainland include trees belonging to the family Dipterocarpaceae, Burseraceae, Sapotaceae, Melianceae, Moraceae, Annonaceae, Leguminosae, and Guttiferae which were found to be dominant . Semi-deciduous forest type is found on the more gentle slopes and include the following trees: oak family (Sterculia sp.), dapdap (Erythrina orientalis), narra (Pterocarpus indicus) and ipil (Intsia bijuga). In areas where the soil is thicker, large-diameter tree species of narra (Pterocarpus indicus) and ipil (Instia bijuga) thrive well:

______________________________________________________________________ECOLOGICAL PROFILE 18
Beach forest is found on the sandy fringes of the small islands and includes the following tree species: Sterculi foetida, Barringtonia asiatica, Heritiera littoralis, Hernandia ovigera, erythrina, Thespesia, Pongamia pinnata, Pometia, Calophyllum inophyllum, Terminalia catappa, Ficus spp. Alstonia scholaris, Guettarda speciosa, Scaevola, Premna, Schefflera, Caesalpinia nuga, Cerbera manghas, Crinum asiaticum, Pandanus, Alocasia, Dona cannaeformis, Tabernaemontana, Sesuvium portalacastrum, Ipomoea pes-caprae, Cynodon dactylon, Eupatorium, Flagellaria indica and Morinda citrifolia, among others.
Forest over limestone is composed of plants species highly adaptive to both acidic and basic soils and to exposed, dry and windy conditions. Most of the plant species growing on karst substrate form assemblages with semi-deciduous forest species in areas with adequate soils. In brushlands, the dominant species are buho and malatungaw. Other species include: alibangbang, aurora, bayabas, bat-bat, binayuyo, bagang aso, bangan, banban, badyang, carabao grass, cogon, calopogium sp, dona, elephant grass, hagimit, hagonoi, kollo-kollot, koronitas, kandila-kandilaan, kuya-luyaan, inyam, malatungaw, makahiya, malasambong, paragis, pandan tibig, tagbak, tuhod manok, tukod langit. Table 6 provides the results of SPOT-5 Land/Sea Cover Map which depict the area coverage of the different forest types found in the different barangays including small islands and islets of El Nido. Of about 55,000.00 hectares total land area of the municipality as estimated by the ECAN Zoning Project’s mapping team, about 44% is comprised of forest cover consisting of primary forest, secondary forest and limestone forest. Mangrove forest is excluded and was classified under coastal/marine habitats instead. Primary forest occupies 13.9%, secondary forest, 70.78% and limestone forest, 12.45% of the total forest cover in the municipality including those in small islands and islets. The barangays with the biggest primary forest cover requiring strict protection include: Pasadena (899 ha), Villa Paz (675 ha) Villa Libertad (338 ha), and San Fernando (325 ha). The small islands and islets, barangays Bagong Bayan, Bucana, Buena Suerte, Mabini, Maligaya, Masagana and Teniguiban have been reported to no longer have any primary or old growth forest cover. On the other hand, secondary forest cover still abounds in barangays New Ibajay (2,739.85 ha), Pasadena (2,111.95 ha), and Mabini (2,386.64 ha). Limestone forest is abundant in small islands and islets and barangays Villa Paz (1,073.52 ha), Bebeladan (692.98 ha.), Teneguiban (841.74 ha) and Villa Libertad (759.16 ha). In terms of forest cover of all types, barangays New Ibajay and Pasadeña registered the highest with 13.22 and 12.39% respectively of the municipality’s total forest cover. Barangays with very minimal cover of less than 1% of the municipality’s total forest cover include: Maligaya, Masagana, Bucana and Buena Suerte.

______________________________________________________________________ECOLOGICAL PROFILE 19
Table 6. Terrestrial Forest Cover by Barangay, El Nido Municipality
Barangay/Site
Primary Forest (ha)
Secondary Forest (ha)
Limestone Forest (ha)
Total Area (ha)
% of Municipal
Total Aberawan 4.78 1,253.04 2.30 1,260.12 5.18 Bagong Bayan 2.28 1,006.11 55.58 1,063.97 4.37 Barutuan 154.77 643.80 0.00 798.57 3.28 Bebeladan 92.66 1,234.51 692.28 2,019.45 8.31 Bucana 0.00 192.57 1.57 194.14 0.79 Buena Suerte 0.00 0.00 198.19 198.19 0.81 Corong corong 110.14 938.97 0.00 1,049.13 4.31 Mabini 0.00 2,386.64 0.60 2,387.25 9.82 Maligaya 0.00 0.78 48.29 49.06 0.20 Manlag 0.00 820.40 0.00 820.40 3.37 Masagana 0.00 30.77 0.00 30.77 0.13 New Ibajay 277.68 2,739.85 194.79 3,212.32 13.22 Pasadena 898.96 2,111.95 0.00 3,010.90 12.39 San Fernando 325.80 242.76 0.00 568.56 2.34 Sibaltan 518.58 864.61 0.00 1,383.18 5.69 Tenuiguiban 0.00 841.74 841.74 1,683.48 6.93 Villa Libertad 337.94 759.16 759.16 1,856.26 7.62 Villa Paz 675.40 1,073.52 1.93 1,750.85 7.20 Small islands and Islets*
0.00 56.35 902.23 958.58 3.95
Grand Total 3,398.98 17,197.54 3,024.05 24,295.18 100.00 Source: SPOT-5 Land and Sea Cover Map, ECAN Zoning Project 2006 Mangrove forest is excluded from terrestrial forest cover and subsumed under Coastal/Marine *Consolidated figures for 35 small islands and islets Listed below are the tree species in El Nido that were found to be endangered based on a flora field survey conducted by the ECAN Zoning Project in 2004.
Table. 7. Threatened Endemic Tree Species in El Nido Municipality
Species Barangay Antipolo Pasadena and Villa Libertad Apitong Kamagong Manlag, Cadlao island, Pasadena, Villa
Libertad Mala-ipil Corong-corong, Malakawayan Aberawan and Pasadena Sakat Pasadena Malasantol Source: Flora Survey, ECAN Zoning Project, 2004

______________________________________________________________________RESOURCE ASSESSMENT AND MANAGEMENT 20
A profile of the vegetation cover and land use of areas surveyed by the Flora Team of the ECAN Zoning Project (survey team) is shown in Table 8. The dominant types of vegetation cover encountered in the 11 barangays surveyed are: forest, brushlands, agriculture and beach vegetation.
Table 8. Barangays Covered, Land Use, Flora Transects and Elevation of Observation Points in El Nido Municipality
Mountain Elev (m)
Barangay Name of Mountain
Landuse/Cover Encountered
No. of
transects
No. of
Quadrats
Highest
Lowest Pasadeña Mt. Inupawan Forest, brush
and agricultural 15 45 630 15
Bagong Bayan
Mt. Cabengkukay
Forest, brush and agricultural
8 24 225 20
Corong Corong
Mt. Corong Corong
Forest, brush and agricultural and beach forest
5 15 105 50
Aberawan Mt. Suso Forest, brush and agricultural
10 30 324 10
Manlag (Manlalik)
Mt. Inaumbagan
Forest, brush and agricultural
8 24 328 49
Manlag (Danat)
Mt. Inaumtagum
Forest, brush and agricultural
9 9 330 49
Villa Libertad
Mt. Inaumtagum
Forest, brush and agricultural
9 27 338 35
Bebeladan Mt. Pita Forest, brush and agricultural
7 7 200 27
Maligaya Tarau Cliff Limestone forest
5 5 130 3
Buena Suerte
Cadlao Island Forest, brush and agricultural and beach forest
6 18 137 1
Source: ECAN Zoning Project, Flora Team Assessment, 2003 Secondary forest stands were seen in all of the surveyed barangays. Substantial forest cover was found in Pasadeña, Bebeladan, Villa Libertad, Villa Paz, Bagong Bayan, San Fernando, Aberawan, Bucana, Corong Corong, and Teneguiban.
Brushlands and agricultural areas were observed, except in Cadlao Island in barangay Buena Suerte which has beach forest type. Corong Corong also has beach forest. Old growth forest stands were identified in barangays Manlag and Villa Libertad while the Tarau cliff in Maligaya has limestone forest. Adequate forest stands were mostly found in higher elevation areas which are hardly accessible to the local residents. Kaingin plots were seen in all ten barangays surveyed (Table 9). Squatters were noted in barangays Barotuan, Bucana, San Fernando and Ibajay while large scale timber poaching was observed in Aberawan, Bagong Bayan and Corong-corong.

______________________________________________________________________RESOURCE ASSESSMENT AND MANAGEMENT 21
Table 9. Human Activities in the Uplands of El Nido Municipality.
Land uses/Activities Barangay Kaingin Squatting Timber Poaching Grazing Fire
Barotuan Bucana San Fernando Tiniguiban Villa Paz Ibajay Aberawan Large scale Manlag Bagong Bayan Large scale Corong corong Large scale Source: ECAN Zoning Project, Flora Team Assessment, 2003
Municipal Floral Diversity The number of floral species identified in the municipality is 434 with an overall biodiversity index of H’ = 4.83 and a distribution index of J’ = 0.795. This means that the floral diversity in El Nido is very high. There is a semblance of clustering of the species because of the distribution index being J’ = 0.795. One specie may be found in a particular site but may not be found in some other sites because of this clustering which is caused by environmental factors such as soil and available moisture. The beach forest in Maligaya and Tarau cliff are entirely different in terms of vegetative composition from the rest. This is so because both have unique ecosystems compared to the rest of the sites. Figure 4 shows the flora biodiversity map of El Nido Municipality. The areas (colored red) need protection from human encroachment and extractive activities. The top 15 dominant species in El Nido are: carabao grass (Axonopus compressus), Euphorbia Sp., Hagonoi (Chromolaena odorata), nito (Lygodium flexuosum), malatungaw (Melastoma malabathricum), apitong (Dipterocarpus haseltii), cogon (Imperata cylindrica), kalumpang (Sterculia foetida), bikal (Dinochloa acutiflora), Neotriwia sp., tagbak (Alpinia elegans), siksik (Calamus sp.), dao (Dracontomelon dao), amugis (Koordesiodendron pinnatum), and a rattan species (Calamus sp.). The top 5 dominant species are all pioneer species thriving in open areas and shrubland. As indicators, this means that much of El Nido is either open areas or shrubs, e.g. the malatungaw. The local apitong (Dipterocarpus hasseltii), a dipterocarp species, dominates the forest ecosystem in El Nido. Grasses and shrubs are also found in the landscape such as cogon, bikal, siksik and rattan species. These plants are indicators of open canopy and disturbed forest.

______________________________________________________________________RESOURCE ASSESSMENT AND MANAGEMENT 22
Endangered Species About 40 endangered species were identified in El Nido. Some species have been identified to be rare or threatened according to expert opinion since some species would have been difficult to find in the forests throughout the country. The species identified to be endangered include: apitong, Hasselt’s Panau, white Lauan, Palosapis, and all the dipterocarps identified; also endangered are the narra, tindalo and ipil, all are leguminous trees; all the rattan species such as the Calamus sp., and the siksik; all orchids as listed under CITES; and others.

______________________________________________________________________RESOURCE ASSESSMENT AND MANAGEMENT 23
Figure 4. Flora Biodiversity, El Nido Municipality

______________________________________________________________________RESOURCE ASSESSMENT AND MANAGEMENT 24
2.3.2 Wildlife Resources and Biodiversity
There are about 98 species of vertebrate fauna identified in El Nido. This includes 19 mammals, 66 birds, 8 reptiles and 5 amphibians. In the fauna survey conducted by the ECAN Zoning Project Team in the municipality, Mt. Cabengkukay was noted to have the highest number of species recorded with 308 species distributed as follows: 55 mammals, 208 birds, 13 reptiles and 27 amphibians. Mt. Ynantagung comes next with 214 species followed by Mt. Suso with 207 species.
The ECAN Zoning project team identified several endemic and near endemic mammal in El Nido based on a survey conducted in 2004. Table 10. List of Endemic and Near Endemic Mammal Species Found in El Nido
Municipality
Family Common Name Species Cervidae Axis calamianensis Hystricidae Hystrix pumila Sciuridae Sundasciurus steerii Sciuridae Sundasciurus moellendorfi Sciuridae Sundasciurus rabori Sciuridae Hylopetes nigripes Sciuridae Sundasciurus hoogstraali Sciuridae Tree squirrel Sundasciurus juvencus Muridae Chiropodomys
calamianensis Muridae Maxomys panglima Muridae Palawan rat Palawanomys furvus Muridae Haeromys sp. Pteropodidae Palawan flying fox Acedoron leucotis Sorcidae Crocidura palawanensis Source: El Nido Fauna Survey Report, ECAN Zoning Project, 2004 In terms of mammal species diversity and richness, Mt. Ynantagung got the highest mammal species richness index value of 2.16. Also, it ranked second in the reptilian group and had the highest index in amphibians with a value of 1.34. Next to Mt. Ynantagung is Mt. Nagbaklaw with a richness index of 1.76. Mt. Cabengkukay is third with the value of 1.48. Mt. Ynantagung also had the highest mammal species diversity index value of 0.98. Mt. Nagbaklaw is second and Cabengkukay third with 0.91 and 0.90 respectively. Survey results indicate a relatively high species endemism among the sampled sites. With the exception of Cadlao Island, all of the 5 sampled sites show endemic species of mammals with 17.65% species endemism. Endemic mammal species recorded in the area are as follows:
• Palawan tree squirrel, • Palawan stink badger,

______________________________________________________________________RESOURCE ASSESSMENT AND MANAGEMENT 25
• Palawan porcupine, • Small-clawed otter • Gliding tree squirrel.
Endemic birds in the area range from 33 % to 44 %. Mt. Pita and Mt. Nagbaklaw both showed 44 % bird species endemism; Mt. Cabengkukay had 39 % endemism; Mt. Ynantagung had 33 %; Mt. Suso 28 % and Cadlao Island 17 %. Endemic species of birds in these sites include the following:
• Palawan peacock-pheasant, • Palawan scops owl, • Blue-headed racquet-tailed parrot, • Palawan hornbill, and • Palawan swiftlet.
Table 11. List of Endemic and Near Endemic Bird Species Found in El Nido
Municipality
Family Common Name Species Phasianidae Palawan peacock Polyplectron emphanum Columbidae Grey imperial-pigeon Ducula pickeringii Psittacidae Blue-headed racquet-tail Prioniturus platenae Strigidae Mantanani scops-owl Otus mantananensis Strigidae Palawan scops-owl Otus fuliginosus Apodidae Palawan swiftlet Aerodramus palawanensis Bucconidae Palawan hornbill Anthracoceros marchei Monarchidae Blue paradise-flycatcher Terpsiphone cyanescens Irenidae Yellow-throated leafbird Chloropsis palawanensis Muscicapidae Palawan flycatcher Ficedula platenae Muscicapidae Palawan blue-flycatcher Cyonis lemprieri Muscicapidae White-vented shama Copsychus niger Pycnonotidae Sulphur-bellied bulbul Ixos palawanensis Timaliidae Ashy-headed babbler Malacocincla cinereiceps Timaliidae Palawan babbler Malacopteron palawanenseTimaliidae Falcated wren-babbler Ptilocichla falcata Timaliidae Palawan striped-babbler Stachyris hypogrammatica Paridae Palawan tit Parus amabilis Paridae White-fronted tit Parus semilarvatus Dicaeidae Palawan flowerpecker Prionochilus plateni Source: ECAN Zoning Project Team, Fauna Survey, 2004 For bird species diversity and richness, Mt. Cabengkukay had the highest bird species diversity index value of 1.54, followed by Mt. Nagbaklaw with 1.51 and Mt. Ynantagung with 1.50. Mt. Nagbaklaw had the highest index estimated for bird species richness with a value of 3.44, followed by Mt. Cabengkukay with 3.19 and Mt. Pita with 3.15. The fourth, fifth and sixth are Mt. Ynantagung, Mt. Suso and Cadlao Island with a value of 3.14, 2.54 and 2.29, respectively.

______________________________________________________________________RESOURCE ASSESSMENT AND MANAGEMENT 26
For reptilian species diversity and richness, Mt. Pita recorded the highest reptilian species diversity with an index value of 0.64, followed by Mt. Ynantagung with an index of 0.54 and Mt. Nagbaklaw with 0.50. Mt. Pita also recorded the highest reptilian species richness with an estimated value of 1.89, followed by Mt. Ynantagung with an index valued at 1.63. Next in rank is Mt. Nagbaklaw with a richness index of 1.51. Mt. Cabengkukay and Mt. Suso ranked fourth and fifth with a corresponding index value of 1.39 and 1.13, respectively. Cadlao Island had the lowest value of 1.00. In terms of amphibian species diversity and richness, Mt. Suso had the highest amphibian species diversity index value of 0.55; the second highest value of 0.52 for Mt. Cabengkukay and 0.51 for Mt. Pita. Mt. Ynantagung showed the highest estimate for amphibian species richness with an index value of 1.34, followed by Mt. Pita and Mt. Suso with the index value of 1.07 and 1.03, respectively. Endemic species of amphibians in 4 sampled sites (Mt. Cabengkukay, Mt. Pita, Mt. Suso and Mt. Ynantagung) were all equally represented at 25 %. Endemic species include the Philippine toad. About 23 faunal species found in El Nido are threatened. These are comprised of 9 birds, 6 mammals, 5 reptiles, and 1 amphibian. At least 14 of the threatened species (61%) are endemic to Palawan.
2.3.3 Coastal/Marine Resources Using SPOT-5 and IKONOS satellite image maps, the area of coastal habitats in El Nido was measured (Table 12). Mangrove forest cover was estimated to be 2,645 hectares, coral reefs – 30.73 hectares, dense seagrass – 42.75 hectares, and sparse seagrass – 15.55. The barangays with the highest mangrove cover include: Bebeldan (562 ha), New Ibajay (415 ha), Manlag (152 ha), Mabini (260 ha) and Villa Paz (267 ha).

______________________________________________________________________RESOURCE ASSESSMENT AND MANAGEMENT 27
Table 12. Coastal/Marine Habitats by Barangay, El Nido Municipality
Barangay/Site
Mangrove Forest (ha)
Coral Reef (ha)
Seagrass Dense (ha)
Seagrass Sparse
(ha)
Total Area (ha)
% of Municipal
Total
Aberawan 128.87 0.00 0.02 0.00 128.89 4.71 Bagong Bayan 221.61 0.00 2.71 0.12 224.44 8.21 Barutuan 45.61 0.00 0.00 0.00 45.61 1.67 Bebeladan 562.20 15.44 6.92 7.50 592.06 21.65 Bucana 112.91 8.71 12.38 2.18 136.18 4.98 Buena Suerte 0.00 0.00 0.00 0.00 0.00 0.00 Corong corong 145.97 0.00 3.40 0.30 149.67 5.47 Mabini 260.27 0.00 0.59 0.00 260.86 9.54 Maligaya 5.14 0.00 0.00 0.00 5.14 0.19 Manlag 151.72 0.00 2.94 0.00 154.66 5.66 Masagana 0.00 0.00 0.00 0.00 0.00 0.00 New Ibajay 414.76 0.00 3.22 0.00 417.98 15.29 Pasadena 27.92 0.53 0.00 0.03 28.48 1.04 San Fernando 29.97 4.80 0.00 0.00 34.77 1.27 Sibaltan 158.63 0.60 3.62 0.00 162.85 5.96 Tenuiguiban 86.26 0.64 3.39 2.77 93.06 3.40 Villa Libertad 26.52 0.00 1.47 2.65 30.64 1.12 Villa Paz 266.74 0.00 2.09 0.00 268.83 9.83 Grand Total 2,645.10 30.73 42.75 15.55 2,734.12 100.00 Source: SPOT-5 and IKONOS Land and Sea Cover Map, ECAN Zoning Project, 2006 *Consolidated figures for 35 small islands and islets
2.3.3.1 Coral Reefs The coral reef baseline survey conducted in El Nido by the ECAN Zoning Project Team revealed that 60% of the coral reefs visited have a cover of less than 30%. However, an in-depth survey indicated that only one area has a coral cover of more than 50%. Table 13 below shows the status of coral cover in the islands visited by the Project Team. Table 13. Status of Coral Cover in the Islands Surveyed in El Nido Municipality
Islands Surveyed Status of Coral Cover (%) Cadlao Island More than 50% coral cover Pinasil Island Close to 50 % coral cover Daracotan Island Close to 50 % coral cover Talawtawan Island Close to 50 % coral cover Cabugao Island Close to 50 % coral cover Tiniguiban reef Low coral cover Tapiutan Island Low coral cover; has rare coral species Source: In-Depth Survey Report on Coral Reefs, ECAN Zoning Project, 2004) From the in-depth survey of coral reefs conducted in El Nido, different islands show varying percentages of coral species cover and composition. Pinasil Island has a

______________________________________________________________________RESOURCE ASSESSMENT AND MANAGEMENT 28
protected reef that is abundant with Acropora and foliose corals. Tapiutan Island, on the other hand, is the only island that contains Acrelia horrescens, a rare coral species. Such species can only be found on reef areas with good water circulation and water clarity.
In particular, the survey yielded the following results (Table 14 and Figure 5)):
• Very few reefs have substantial coral cover. • None had a cover class of 5 (76-100%). • Only one spot was noted to have a coral cover of 51-75%. • Most reefs, about 60%, that were assessed in the manta tow survey were only in
cover category of 10% or less. • Cover category of 11-30% was seen in about 30% of the reefs. • Only about 7% of the reefs surveyed had a cover score of 31-50%.
Table 14. Coral Reef Survey Results, El Nido Municipality
Location Latitude Longitude % Hard Coral Cover
Genera
Brother Island 11.410750 19.518306 31-50 Pocillopora Daracotan Island 11.365583 119.529889 31-50 Hydnophora Daracotan Island 11.364139 119.529528 31-50 Anacropora, porites Teniguiban Shoal 11.356889 119.530250 51-75 Teniguiban Reef 11.350861 119.516972 31-50 Cadlao Island 11.231750 119.343750 31-50 New Ibajay Reef 11.163667 119.530972 31-50 Porites New Ibajay Reef 11.162806 119.529861 31-50 Anacropora New Ibajay Reef 11.158389 119.528306 31-50 Porites, fungiids Mabini Reef 11.138278 119.505611 31-50 Pavona, Porites Mabini Reef 11.133444 119.508472 31-50 Pavona, Porites Cabugao Island 11.128694 119.527722 31-50 Porites, Acropora Pinasil Island 11.071667 119.384083 31-50
Source: ECAN Zoning Project, Marine Survey Team (2004) Changes in coral reef cover were examined (Table 15) by comparing previous coral reef data gathered by other researchers to the survey results conducted by the ECAN Zoning Project’s Marine Team. Overall, a general decline in reef condition in the sites revisited was noted. Only 3 out of 8 sites were observed to have maintained the coral cover and these were in Cadlao Island, Tapiutan Island and Miniloc Island. More reef areas at the eastern side of the municipality were found to be in better condition than on the western side. One shoal in Teneguiban was even observed to be recovering with small and numerous plate-like corals. The poor condition of most coral reefs on the western side is postulated to be due to the presence of built-up areas and tourism resorts which discharges effluents and disposes solid wastes. Table 15. Changes in Coral Cover in Selected Sites, El Nido Municipality

______________________________________________________________________RESOURCE ASSESSMENT AND MANAGEMENT 29
Hard Coral Cover Location
N-Latitude
E-
Longitude Secondary
data ECAN 20043
Change
Cadlao South 11.203000 119.365417 32.24%1 30-58% Maintained Tapiutan-Matinloc Channel 11.195333 119.272967 28.66%1 11-30% Maintained Labnog Island 11.233700 119.365567 33.05%1 less 10% Decreased Cadlao North West 11.234767 119.342567 67.78%1 31-50% Decreased Miniloc Front 11.153333 119.318333 16.83%2 11-30% Maintained South Miniloc 11.140983 119.317000 29.97%2 less 10% Decreased Bajura de Serena 11.121633 119.313500 50.97%2 less 10% Decreased West Matinloc 11.154367 119.279800 24.79%2 less 10% Decreased
1Fortes et. al. (1998) 2Alino et. al. (1996) 3Coral cover from the manta tow reconnaissance technique except for Cadlao which is from transect data, ECAN Zoning Project, Marine Survey Team, 2004. In terms of the diversity of coral reefs in the areas surveyed (Table 16), Cadlao island, barangay Teniguiban and Darocotan island harbor the highest number of genera while Tapiutan island has a unique species of coral (Acrhelia horrescens) which should be strictly protected. Table 16. Diversity (Generic) of Reef Corals at Selected Sites in El Nido
Municipality
Site
N-Latitude
E-Longitude
No. of Genera
Diversity
Class
Remarks
Cadlao Is 11.202904 119.365421 26 58% (high) Teniguiban 11.350871 119.517003 25 56% (high) Daracotan Is
11.363650 119.529109 25 56% (high)
Pinasil Is 11.071660 119.384083 24 53% (moderate)
Tapiutan Is 11.203527 119.270833 20 44% (moderate)
Acrhelia horrescens
Tapiutan Is 11.195842 119.270672 19 42% (moderate)
Acrhelia horrescens
Diapila Is 11.391058 119.455883 18 40% (moderate)
Bird Is 11.423342 119.466644 21 47% (moderate)
Source: ECAN Zoning Project, Marine Survey Team, 2004

______________________________________________________________________RESOURCE ASSESSMENT AND MANAGEMENT 30
119.25 119.30 119.35 119.40 119.45 119.50 119.55
East longitude (degrees)
11.00
11.05
11.10
11.15
11.20
11.25
11.30
11.35
11.40
11.45
Nor
th la
titud
e (d
egre
es)
0 1 2 3 4 5
= none= up to 10%= 11-30%= 31-50%= 51-75%= 76-100%
Figure 5. Status of Coral Reefs of El Nido based on Survey Conducted by ECAN Zoning Project (2004).

______________________________________________________________________RESOURCE ASSESSMENT AND MANAGEMENT 31
2.3.3.2 Reef Fish The marine survey and research team find the reef fish communities in the seven sampling stations in El Nido to be in relatively good condition, with high species richness, abundance and biomass estimates. Since the last survey conducted by another group of researchers in 1993, it was observed by the ECAN marine survey team that the fish communities in El Nido have remained stable at least in terms of species richness. Overall species richness was recorded by the ECAN marine survey team to be 277. Target species was recorded to have 95 species while indicator species registered 27 species. Very few high-value species were observed in the sampling stations despite the relatively high number of target species recorded. This may be due to high fishing pressure on high-value species.
2.3.3.3 Marine Mammals and Sea Turtles Dugongs, sea turtles and cetaceans are important mammals found in El Nido which are becoming critically endangered species.
According to the NIPAP (2000) report, four types of marine turtles were sighted in the municipal waters of El Nido the whole year round. These are: hawksbill turtle (Eretmochelys imbricata), the green sea turtle (Chelonia mydas), the Olive ridley sea turtle (Lepidochelys olivaceae) and the leatherback sea turtle (Dermochelys coriacea). Nesting of sea turtles occurs during the months of February to May except for hawksbill turtle which nest the whole year round. Turtle island is the major marine turtle nesting habitat in El Nido. Dolphins and whales were also sighted in El Nido’s marine waters. The species sighted in the area include: bottlenose dolphin (Tursiops truncatus), spinner dolphins (Stenella longirostris), Bryde’s whale (Balaenoptera edeni), and humpback whale (Megaptera novaeanglia). Sea cows or Dugong-dugon were sighted from May to August when seagrass are abundant particularly Halophila and Halodule spp. Dugong animals are commonly sighted around the El Nido poblacion, Cadlao island, Dagal-dagal bay, and Mainlog bay. The distribution of dugong sighting in near shore waters of coastal and island barangays is depicted in Figure 6. They were reported to be seen in Buena Suerte, Corong-Corong, Manlag, Sitio Calitang in Bucana, and Daracotan island. Individual dugongs and mother and calf pairs were frequently sighted in Corong Corong.

______________________________________________________________________RESOURCE ASSESSMENT AND MANAGEMENT 32
Figure 6. Sightings of Dugong dugon in El Nido Municipality
Turtles were widely distributed in the municipality in both coastal and offshore waters. Based on respondents account, turtles can be seen almost anywhere in the areas surveyed. In most cases, the animals can be found singly except in Manlag where five individuals were seen together. Turtles were also frequently spotted in barangay Bucana. Turtle nests (Figure 7) were reportedly present in barangays Teneguiban, Bucana, Bebeladan, Inabuyatan island, Pasadeña, San Fernando, Sibaltan, and Binulbulan island.
Calitan island
Bucana
Cauayan Island
Pasadeña
Corong Corong
Manlag
Daracotan Island
Binulbulan Island
Mabini
Buena Suerte

______________________________________________________________________RESOURCE ASSESSMENT AND MANAGEMENT 33
Cetaceans were distributed more (Figure 8) in the western section of El Nido. Dolphins can be found in both inshore and offshore water while whales were generally seen offshore with occasional near shore sightings. Dolphins in groups were sighted in offshore waters of Diapila island, Daracotan island, and Sibaltan. Sightings were highest in barangay Bucana specifically between the islands of Lalutaya and Diapila. Whales were sighted in Cagbuli and Vilma islands, and Daracotan Island in barangay Teneguiban. They are more frequently encountered in Daracotan island. Figure 8 shows the cetacean sightings in El Nido for a six month period, September 2003 to February 2004.
Bucana
Pasadeña
Inabuyatan island
Bebeladan
Binulbulan Island
Figure 7. Location of Reported Turtle Nests, El Nido Municipality

______________________________________________________________________RESOURCE ASSESSMENT AND MANAGEMENT 34
Figure 8. Cetacean Sightings in El Nido Municipality
2.3.3.4 Seagrass A good cover of seagrass meadows was extensively found by the ECAN Zoning Project Team in the eastern portion of the municipality’s coastal waters from New Ibajay to Sibaltan and on inner Bacuit Bay (Bebeladan) while narrower beds were observed in San Fernando, Corong-Corong, and NW Bacuit Bay. Other coastal barangays such as Mabini, Aberawan, Manlag, Lalutaya island, Bucana, and Teneguiban have sparse distributions of seagrass because of heavy siltation and strong wave action in these areas. The overall leaf canopy cover was low at 30% in most sites surveyed except in Sibaltan which exhibited good cover at 53%. Nine species of seagrasses were recorded in El Nido: Enhalus acoroides was found everywhere, Thalassia hemprichii, Cymodocea rotundata, Halodule uninervis, Halophila ovalis, Cymodocea serrulata, Syringodium isoetifolium, Halophila species, and Thalassodendron ciliatum which is a relatively rare-occurring Philippine specie. Table 17 shows the extent of the seagrass meadows, percent canopy cover category, species richness and habitats use by Dugong in different barangays and islands surveyed by the Marine Team of the ECAN Zoning Project.
Legend:
Dolphin Sighting
Whale Sighting

______________________________________________________________________RESOURCE ASSESSMENT AND MANAGEMENT 35
The overall leaf canopy of seagrass cover in El Nido was low with 30%, mean range in most stations to <50% but a lone station in Sibaltan exhibited good cover at 53%. Nine species of seagrasses were recorded in El Nido: Enhalus acoroides was found everywhere, Thalassia hemprichii, Cymodocea rotundata, Halodule uninervis, Halophila ovalis, Cymodocea serrulata, Syringodium isoetifolium, Halophila species, and Thalassodendron ciliatum which is a relatively rare-occurring Philippine species. The seagrass meadows were generally speciose (6 species modal), with the most diverse assemblage of nine species found in Sibaltan. Seaweeds associated with seagrass beds contributed ~10% to total vegetative cover (max = 25%) and were represented by 22 genera, three of which were commonly encountered – Padina, Sargassum, and Turbinaria (Phaeophyceae). Conspicuous macrofaunal components included the echinoderm Synapta sp., clams (Tridacna crocea) embedded in scattered live and dead corals, ascidians (Didemnum molle), various sponges, and burrowing shrimps (gauged from the presence of mounds and small sand patches). Five sampling stations located in three barangays harbored graze marks of Dugong dugon, namely: Sibaltan, Corong-Corong, and Bebeladan. These areas are candidate sites for core zoning because they serve as forage areas of endangered animals. Table 17. Seagrass Meadow Extent, Canopy Cover, Diversity, and Habitat Use by
Dugong dugon, El Nido Municipality
Location N Latitude E Longitude
Perpendicular width
Cover category
Species richness
Habitatused by
1. Villa Paz 11.2178333 119.5553333 Extensive 2 • 6 2. Sibaltan Site 11.2594444 119.5620278 Extensive 3 • 8 a Dugongs3. Sibaltan Site 11.2654722 119.5639167 Moderate 3 • 6 4. Sibaltan Site 11.2993611 119.5630833 Moderate 3 • 9 Dugongs5. San Fernando 11.3222500 119.5290833 Extensive 2 • 6 a Dugongs6. Teneguiban 11.3580833 119.5095000 Moderate 3 • 6 a 7. Bucana 11.3558611 119.4105278 Narrow 2 6 8. Buena Suerte 11.2130000 119.3741667 Narrow 1 6 a 9. Maligaya 11.1699444 119.3900556 Narrow 2 • 6 10. Corong-
Corong Site 1 11.1547778 119.3957500 Narrow 1 • 3 Dugongs
11. Corong-Corong Site 2 11.1363889 119.3968333 Extensive 1 • 7
12. Bebeladan Site 1 11.0353889 119.4001111 Extensive 2 • 7 Dugongs
13. Bebeladan Site 2 11.0428611 119.3823889 Moderate 2 • 5 Dugongs
14. Bebeladan Site 3 11.0999167 119.3335833 Extensive 1 7
Legend: cover categories 1, ≤10%; 2, ≤30%; 3, ≤50%; a, includes rarely occurring species; ●, with observations of ≥50% cover on plots. Source: Baseline Survey Report on Seagrasses and Bed-Associated Seaweeds of El Nido, ECAN Zoning Project 2005

______________________________________________________________________RESOURCE ASSESSMENT AND MANAGEMENT 36
2.3.3.5 Mangroves Estuarine mangrove forests are found around major rivers and creeks on the mainland of the municipality. The coastal/island mangrove which are smaller than estuarine mangroves are found in narrow strips fringing the small islands such as Cadlao island, Snake island, Pasadena, Bebeladan and Manlag. Mangrove areas in El Nido are estimated to be at about 2,645 hectares. These are mostly second growth and regenerating mangrove species. Existing mangrove forests are found in the following barangays: Villa Libertad, Pasadena, Bucana, Teniguiban, Sibaltan, Coron-corong, Manlag, Villa Paz, Mabini, New Ibajay, and Bebeladan.
Mangrove species found in El Nido are those belonging to the genus Rhizophora, Bruguiera, Excoecaria, Xylocarpus and Aegiceras. Commonly found species within the mangrove area also include Acrostichum, Buchanania, Licuala and Oncosperma. Table 18. List of True and Associate Mangrove Species in El Nido Municipality
True Mangrove
Common Name
Associate Mangrove
Common Name
Aegiceras floridum Tinduk-tindukan Acanthus ebracteatus Tigbau Aegiceras corniculatun Saging-saging Acacia farnesiana Aroma Bruguiera gymnorrhiza Busain Acrostichum aureum Lagolo Bruguiera sexangula Pototan Barringtonia asiatica Botong Bruguiera cylindrical Pototan lalaki Barringtonia racemosa Putat Bruguiera parviflora Langarai Caesalpinia nuga Sapinit Ceriops tagal Tangal Cynometra ramiflora Balitbitan Ceriops decandra Malatangal Derris trifoliate Mangasin Lumnitzera littorea Tabau Hibiscus tiliaceus Malubago Lumnitzera racemosa Kulasi Instia bijuga Ipil Nypa fruticans Nipa Morinda citrifolia Bangkoro Rhizophora apiculata Bakauan lalaki Osbornia octodonta Tualis Rhizophora mucronata Bakauan babae Pandanus tectorius Prickly pandan Rhizophora stylosa Bakauan bato Pongamia pinnata Bani
Sonneratia alba Pagatpat Scyphiphora hydrophyllacea Nilad
Sonneratia caseolaris Pedada Terminalia catappa Talisai Excoecaria agallocha Buta-buta Thespesia populneoides Malabanalo Xylocarpus granatum Tabigi Thespesia populnea Banalo Xylocarpus moluccensis Piagau Cerbera manghas Baraibai
Source: Mangrove Resource Assessment in El Nido, Palawan, ECAN Zoning Project (2004)
Mangrove species identified and recorded are 19 true and 22 associate mangrove species which belongs to 19 families and 26 genera of vascular plants.
The most widely distributed species in El Nido are Rhizophora apiculata , Bruguiera gymnorrhiza, Xylocarpus granatum, Ceriops tagal, Rhizophora mucronata, Bruguiera cylindrica, Heritiera littorea, Bruguiera sexangula, Sonneratia alba and Rhizophora stylosa.
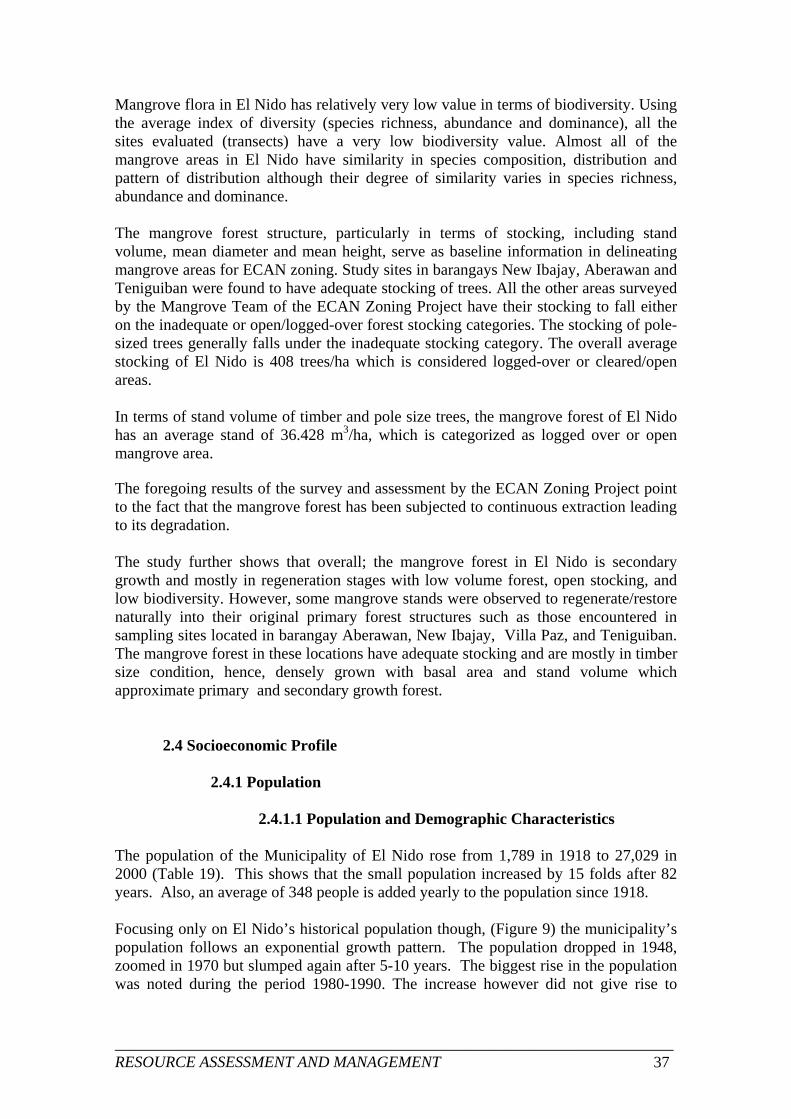
______________________________________________________________________RESOURCE ASSESSMENT AND MANAGEMENT 37
Mangrove flora in El Nido has relatively very low value in terms of biodiversity. Using the average index of diversity (species richness, abundance and dominance), all the sites evaluated (transects) have a very low biodiversity value. Almost all of the mangrove areas in El Nido have similarity in species composition, distribution and pattern of distribution although their degree of similarity varies in species richness, abundance and dominance. The mangrove forest structure, particularly in terms of stocking, including stand volume, mean diameter and mean height, serve as baseline information in delineating mangrove areas for ECAN zoning. Study sites in barangays New Ibajay, Aberawan and Teniguiban were found to have adequate stocking of trees. All the other areas surveyed by the Mangrove Team of the ECAN Zoning Project have their stocking to fall either on the inadequate or open/logged-over forest stocking categories. The stocking of pole-sized trees generally falls under the inadequate stocking category. The overall average stocking of El Nido is 408 trees/ha which is considered logged-over or cleared/open areas. In terms of stand volume of timber and pole size trees, the mangrove forest of El Nido has an average stand of 36.428 m3/ha, which is categorized as logged over or open mangrove area. The foregoing results of the survey and assessment by the ECAN Zoning Project point to the fact that the mangrove forest has been subjected to continuous extraction leading to its degradation. The study further shows that overall; the mangrove forest in El Nido is secondary growth and mostly in regeneration stages with low volume forest, open stocking, and low biodiversity. However, some mangrove stands were observed to regenerate/restore naturally into their original primary forest structures such as those encountered in sampling sites located in barangay Aberawan, New Ibajay, Villa Paz, and Teniguiban. The mangrove forest in these locations have adequate stocking and are mostly in timber size condition, hence, densely grown with basal area and stand volume which approximate primary and secondary growth forest.
2.4 Socioeconomic Profile
2.4.1 Population
2.4.1.1 Population and Demographic Characteristics The population of the Municipality of El Nido rose from 1,789 in 1918 to 27,029 in 2000 (Table 19). This shows that the small population increased by 15 folds after 82 years. Also, an average of 348 people is added yearly to the population since 1918. Focusing only on El Nido’s historical population though, (Figure 9) the municipality’s population follows an exponential growth pattern. The population dropped in 1948, zoomed in 1970 but slumped again after 5-10 years. The biggest rise in the population was noted during the period 1980-1990. The increase however did not give rise to

______________________________________________________________________SOCIOECONOMIC PROFILE 38
higher increments for the succeeding years. The population is lower than the expected turn-out from the exponential trend instead.
Population Growth Rates and Projection The table below shows the population growth rates of El Nido from 1918 to 2000 and its projected population for 2005-2035. Table 12 illustrates that the meager population of about 27,000 in year 2000 hides the fact that the municipal population is actually growing at a very high rate. Thus, projected growth rates for the coming several years hover from 3.8% to 4.1%. Doubling Time El Nido’s doubling time grows much faster than the country’s projected doubling time in 29 years. With a rate between 4.14% - 4 .26%, the municipality could expect to double its population in about 16 years. This is not even enough to provide a proper generation gap between parents and their offspring, much less make them provide for the newborns.
Table 19. Population Growth Rate, El Nido Municipality, 1918-2000
1918-2000 (NSO) 2005 - 2035 Projected Population
Year Population r (%) Year Population r (%) 1918 1789 - 2005 33106 4.14 1939 2280 1.15 2010 40285 4.00 1948 2306 0.12 2015 48928 3.96
Figure 9. Population Trendline, El Nido Municipality NSO 2000
0
5000
10000
15000
20000
25000
30000
35000
1918 1939 1948 1960 1970 1975 1980 1990 1995 2000
El NidoExpon. (El Nido)

______________________________________________________________________SOCIOECONOMIC PROFILE 39
1918-2000 (NSO) 2005 - 2035 Projected Population
1960 4075 4.74 2020 59308 3.92 1970 7358 5.91 2025 71732 3.88 1975 8749 3.46 2030 86539 3.82 1980 11657 5.74 2035 104104 3.76 1990 18832 4.79 1995 21940 3.06 2000 27029 4.16
9th order polynomial curve-fitting explaining 99.8529% of the population
behavior. Source: NSO 2000 Barangay Population With 14% of the 5,191 households in El Nido, Brgy. Bucana has the highest number of households in the municipality. It is followed by Teneguiban's 10% share and New Ibajay's 8%. The average household size for these three areas is 5.33, 5.14, and 5.70 respectively (Figures 9 and 10). The three barangays with the least number of households are Bagong Bayan (176 households), Villa Paz (164 households), and Corong-corong Poblacion (143 households). Correspondingly, their average household sizes are: 4.94, 5.13, and 4.99. With this range of data above, the average household size for the municipality is placed at 5.15. Figure 11 presents the average household sizes in the eighteen barangays in the municipality. Twelve of them are below the average household size of 5.15. All of the poblacion barangays fall under this group as well. The six others are within the peak size of 5.81 as that of Bebeladan and Pasadeña and Mabini’s 5.26.
Distribution of Households
10%
4%3% 4% 3%
7%
6%
14%
7%
3%3%4%5%
4%
8%
4%
5%
5%
AberawanBagong BayanBarotuanBebeladanBucanaBuena Suerte PobCorong-corong PobMabiniMaligaya PobManlagMasagana PobNew IbajayPasadeñaSan FernandoSibaltanTeneguibanVilla LibertadVilla Paz
Figure 10. Household Distribution by Barangay, El Nido Municipality Rañola et al (2004)

______________________________________________________________________SOCIOECONOMIC PROFILE 40
4.87 4.94 5.01
5.815.33 5.12 5.13 5.26
4.995.45
4.39
5.705.26 5.12 5.14 5.14 5.10 4.99
0
1
2
3
4
5
6
7
Aberawan
Bagong Baya
n
Barotuan
Bebeladan
Bucana
Buena Suerte
Pob
Corong-co
rong P
obMabini
Maligaya
Pob
Manlag
Masagana P
ob
New Ibajay
San Fern
ando
Sibaltan
Teneguiban
Villa Liberta
d
Villa P
az
Ave. HH Size
Figure 11. Average Household Size By Barangay, El Nido Municipality Rañola et al (2004)
Population Density The 18 barangays of El Nido have a total land area of 56,084 hectares based on the ECAN Zoning Project’s digitized data obtained from SPOT-5 generated land area map. Considering its vast expanse of land area, the overall population density of El Nido is expectedly low at 0.48 persons per hectare of land (Table 20). Barangay Maligaya has the highest density with 10.46 persons per hectare followed by Buena Suerte with 5.22, Masagana with 4, and Bucana with 1.84. The barangays with the lowest population density include Villa Paz, Mabini, New Ibajay, Pasadena, and Sibaltan with less than 0.30 persons per hectare. Figure 7 depicts the population density of El Nido.

______________________________________________________________________SOCIOECONOMIC PROFILE 41
Table 20. Population Density of El Nido Municipality, 2000
*Source: ECAN Zoning Project, SPOT-5 Digitized Data on Land Area (2006)
Barangay Population
(2000) Total Land Area
(hectares)* Population density
(Persons per hectare)1) Aberawan 930 2,956.11 0.31 2) Bagong Bayan 869 2,587.38 0.33 3) Barotuan 1,708 3,648.08 0.46 4) Bebeladan 1,785 4,685.12 0.38 5) Bucana 3,945 2,141.82 1.84 6) Buena Suerte 1,761 336.96 5.22 7) Corong-corong 733 2,238.90 0.32 8) Mabini 937 4,337.31 0.21 9) Maligaya 914 88.17 10.36 10) Manlag 1,493 4,579.52 0.32 11) Masagana 921 229.52 4.0 12) New Ibajay 2,355 6,059.09 0.22 13) Pasadena 1,214 5,164.68 0.23 14) Sibaltan 1,214 4,158.71 0.29 15) San Fernando 1,445 2,238.68 0.64 16) Tenequiban 2,799 4,595.86 0.60 17) Villa Libertad 1,188 2,433.04 0.48 18) Villa Paz 818 3,605.13 0.22 Total 27,029 56,084.08 0.48

______________________________________________________________________SOCIOECONOMIC PROFILE 42
Figure 12. Population Density Map of El Nido Municipality

______________________________________________________________________SOCIOECONOMIC PROFILE 43
2.4.1.2 Urbanization and Migration Patters Tempo of Urbanization Only four of the eighteen barangays form part of the Poblacion. These are the urban areas having a population of 4,329. These barangays are Buena Suerte, Corong-Corong, Maligaya, and Masagana. The level of urbanization of the municipality is placed at 16% in 2000. Migration Patterns Data shows that most people residing in El Nido have intended and decided to settle down in the area. Approximately ninety-six percent (96%) of the household population 5 years old and over (21,376) have resided in the locality 5 years ago and probably even longer. That leaves only 1.03% residents from other provinces, and the less than a percent population that came from other municipalities. This could suggest that people who settled at El Nido have very little migration activity. This finding is consistent with the provincial pattern where about 94% of the household populations are residents of Palawan 5 years back.
2.4.2 Social Condition
2.4.2.1 Dependency Ratios Fifty-two percent (52%) of the population in El Nido are minors. Those with ages 1-4 alone are 17.23% of the population, 15.65% are aged 5-9, 12.47% are aged 10-14, and another 9.52% are aged 15-19. These are the age groups with the highest population shares such that the combined population of 19 years old and younger consists of 54.87% of the total population (Figure 13).
0 1000 2000 3000 4000 5000
under 1
5 - 9
15 - 19
25 - 29
35 - 39
45 - 49
55 - 59
65 - 69
75 - 79
age grou
p
population
both sexes
.
Figure 13. Population By Age Group, El Nido Municipality NSO 2000

______________________________________________________________________SOCIOECONOMIC PROFILE 44
The young dependency ratio is 1.13 demonstrating that every 100 economically active resident of El Nido is burdened with 113 children. The old dependency ratio, on the other hand, is rather low since the population is very young. The fruits of labor of every 19 working resident of El Nido join together to provide for the public needs of one old member of the municipality. The economic dependency ratio is then placed at 93 dependents per 100 economically active population. See Table 21 below for reference.
Table 21. Major Population Groups, El Nido Municipality
Groups
Frequency
Percent Share
Young age (under 1 - 14) 12,342 45% Economically Active (15 - 64) 13,985 51% Old Age (65 and above) 702 3%
Source: NSO 2000
2.4.2.2 Religious Affiliation and Ethnicity Religious Affiliation Table 22 shows that approximately 83% of the population of El Nido are members of the Roman Catholic Church and a small percentage of 5.73% belongs to the Evangelicals sect. Table 22. Religious Affiliation, El Nido Municipality Religious Affiliation and
LGU Both Sexes Male Female
EL NIDO Total 27,029 14,201 12,828 Evangelicals 1,550 810 740 Roman Catholic 22,389 11,786 10,603

______________________________________________________________________SOCIOECONOMIC PROFILE 45
Ethnicity Half of the people in El Nido are Cuyunons while another 47% are Aklanons, Bikolanos, Cebuanos, Ilonggos, Tagalogs, and Masbatenons (Table 23). Table 23. Ethnic Groups, El Nido Municipality
Ethnic Group EL NIDO %
Akeanon / Aklanon 2813 11.00 Bikol 562 2.19 Cebuano 1838 7.19 Cuyunon / Cuyunan 13710 53.65 Hiligaynon, Ilonggo 771 3.01 Masbatenon 1073 4.19 Tagalog 4787 18.73 Total 25554 100.00
2.4.2.3 Health and Nutrition In a survey made by the ECAN Zoning Project Team (Rañola et. al., 2004) on the state of nutrition of children in 12 of the 18 barangays in the municipality, Villa Paz and Barotuan were found to be among those with the highest percentage of malnourished children. A significant number of the children in Bucana and Aberawan were malnourished as well. Table 24 shows the percent distribution of malnourished children in the different barangays of El Nido. Table 24. Children’s Nutrition Status, El Nido Municipality
ECAN Zoning Project, 2004
Barangay No. of
Malnourished Children
%
Bagong Bayan - - New Ibajay - - Sibaltan - - Teneguiban - - Bebeladan 3 1.8 Mabini 7 4.1 Masagana Pob 7 4.1 Manlag 14 8.3 Aberawan 27 16.0 Bucana 28 16.6 Barotuan 33 19.5 Villa Paz 50 29.6
Total 169 100

______________________________________________________________________SOCIOECONOMIC PROFILE 46
Morbidity and Mortality As of 2000, the recorded leading cause of morbidity in the municipality was malaria (5.7% of total registered cases). On the other hand, the leading causes of death were cardiac arrest, malaria, and bronchopneumonia. Malaria ranked second among the leading causes of mortality in the municipality. In terms of health facilities, no district hospital can be found in El Nido. In cases when there’s an emergency, the patient has to be brought to Taytay for medical accommodation. There is a building for the district hospital but it is empty – no personnel, no equipment and no supplies..
2.4.2.4 Education Status Literacy Rate The average literacy rate for the whole population is 93.61%. The male population is slightly more literate than the female population with literacy rates placed at 93.8 and 93.3, respectively. Enrolment In the survey conducted by the ECAN Zoning Project Team (Rañola et. al., 2004), enrolment data on 12 of the 18 barangays in El Nido showed that barangays, Bucana has the highest elementary enrolment population followed by Barotuan and Teneguiban. Consistently, Bucana has the highest secondary enrolment as well. Lagging behind it are Barotuan, New Ibajay and Teneguiban (Table 25). Table 25. Enrollment, El Nido Municipality, 2004
Barangay Elementary % Secondary % Aberawan 162 6.2 29 3.86Bagong Bayan 161 6.2 17 2.26Barotuan 298 11.5 86 11.45Bebeladan 234 9.0 46 6.13Bucana 415 16.0 112 14.91Mabini 172 6.6 38 5.06Manlag 222 8.5 66 8.79Masagana Pob 112 4.3 53 7.06New Ibajay 288 11.1 105 13.98Sibaltan 153 5.9 68 9.05Teneguiban 269 10.3 92 12.25Villa Paz 114 4.4 39 5.19
Total 2600 100.0 751 100Source: ECAN Zoning Project, 2004

______________________________________________________________________SOCIOECONOMIC PROFILE 47
Educational Facilities A total of 35 schools serve the school age population. Of these, 26 are elementary schools, 8 are high schools, and a central school. Almost all the barangays have elementary schools except for barangay Buena Suerte, Corong-Corong, Maligaya, and Masagana. Nonetheless, Maligaya Poblacion has a central school. Located at Villa Libertad and New Ibajay are State Polytechnic College of Palawan (SPCP) and Palawan State University (PSU) that offers tertiary education. Each has 3 classrooms and 1 library. SPCP has 7 teachers and PSU has 6. Enrollment Participation Rates Overall, the enrollment participation ratios (EPR) are: Elementary (104) and High School (69). Therefore, all the supposed elementary students in the municipality are enrolled but only 69 of the 100 supposedly high school students are enrolled.
2.4.2.5 Housing and Basic Utilities Housing Situation With a population of 27,029 in El Nido as of year 2000, there were 5176 occupied housing units for the 5191 households in the municipality. From this alone, the municipality was short of 15 housing units if a one-to-one house and household correspondence is aimed. Figure 14 above depicts the distribution of housing units by building type. Almost 96% of the units are single houses and about 2% are duplex units. About 1.68% is not reported.
0.15%
95.65%
1.68%
0.08%2.43% single house
duplex
mult-unit residential
commercial/ industrial/agriculturalnot reported
Figure 14. Occupied Housing Units by Building Type, El Nido Municipality
NSO 2000

______________________________________________________________________SOCIOECONOMIC PROFILE 48
Almost 76% of roofs of houses in El Nido are made up of cogon/nipa coupled with 80% of houses with nipa/bamboo/sawali as walls. Houses with roofs and walls both made of cogon/nipa are 3809 or 73.6% of the total occupied housing units in 2000. The second highest roof material used is galvanized iron/aluminum (24%) and half concrete/stone/wood for walls (20%). Of the 5,191 occupied housing units in El Nido, 4,289 or about 83% are being amortized. It is higher than the average 76% for that of the province. Most of the houses in El Nido are single houses (97.45%) under three unit categories – single, duplex, and multi-unit residential. Of these, about 3529 are built on owned/being-amortized lots while 144 units stand on lots free of rent without consent of owner (only about 3%). The 2.47% duplex unit lots are likewise mostly owned (68%) with 20% housing lots used free of rent with consent of owner. There are only 4 duplex units lots used for free without consent of owner (Figure 15).
Water Supply Figure 15 highlights the sources of water supply for drinking and cooking as of 2000. Sixty-five percent (65%) of El Nido residents have dug well as their main source. Only 3% of the population had their own faucet with about 17% having shared faucet community water system. Very few buy water from peddlers and bottled water are not yet popular. As opposed to that, only 60% of the population get water from dug well for laundering considering that a striking 65% get water from this source for drinking (Table 20). The 5% gap is perhaps explained by the population using tubed/piped shallow well for laundering. Only about 14% of the population uses the faucet system (exclusive and
97.45%
0.08%
2.47%
single house duplex multi-unit residential (3 units or more)
0 1000 2000 3000 4000
owned/being amortized
rented
rent-free with consent of owner
rent-free without consent of owner
not reported
not applicable
Figure 15. Trendline, Tenure Status of Lot and Housing Unit Type, El Nido Municipality
NSO 2000

______________________________________________________________________SOCIOECONOMIC PROFILE 49
shared) for this purpose as well. Also, from the 7% of the population fetching spring/lake water, an additional 8% fetch water from the same source for laundering and bathing. The poblacion of El Nido has a poorly managed water system and has no sewerage system. The water is not enough and needs new sources. Sewage is discharged directly to the bay without treatment. DILG has done a feasibility study for water service and recommended two underground water sources. Bulalacao Falls, a possible source of surface water, is 15 kilometers away from the poblacion.
Table 26. Water Supply By Source, El Nido Municipality
Faucet, comm. water system
Tubed/ piped deep well LGU Total
HH Owned Shared Owned Shared
Tubed/ Piped
shallow well
Dug well
Spring lake, river,
rain, etc.
Peddler Bottled water Others
El Nido 5191 159 872 20 144 80 3390 385 22 0 119% of total 100 3.06 16.79 0.38 2.77 1.54 65.30 7.41 0.42 0 2.29
Energy Sources Table 27 describes the kind of fuel used for cooking by El Nido residents as of year 2000. A big majority (68.58%) of the residents use wood for cooking while 10% use kerosene and 11% use LPG.
0
10
20
30
40
50
60
70
own use,faucet,comm.water
system
shared,faucet,comm.water
system
own use,tubed deep
well
shared,tubed deep
well
tubed/pipedshallow well
dug well spring lake,river, rain,
etc.
peddler bottled water others
Palawan El Nido
perc
enta
ge
Figure 16. Households by Main Source of Water Supply for Drinking / Cooking, El Nido Municipality
NSO 2000

______________________________________________________________________SOCIOECONOMIC PROFILE 50
In terms of electric supply, PALECO presently runs its power supply services daily for 12 hours (from 1 p.m. to 1 a.m.), which is very disadvantageous on the part of business establishment owners especially those with beach resorts and cottages. PALECO, however, believes that extending the service for more than 12 hours will cause them to lose money. Table 27. Energy Used by Households for Cooking, El Nido Municipality
Sewerage Facilities The most prevalent waste disposal facility in El Nido is the closed pit followed by exclusive water-sealed septic tank and exclusive depository. About 491 households (9.46%) have no means of properly disposing their wastes. The prevalence of closed pit system threatens the quality of dug wells which remain to be the main source of water for drinking in the locality. Solid Waste Collection
It seems that the residents of El Nido including some resort owners are used to burning their garbage such that the percentage of households that do this reached up to 60-65%. The second most popular method of garbage disposal in El Nido is burying. Collection through garbage truck is still fairly low at 6.6% for El Nido (Figure 17).
LGU Total
Household Electricity Kerosene LPG Charcoal Wood Others None
El Nido 5191 54 520 589 345 3560 12 111 % of total 100 1.04 10.01 11.34 6.64 68.58 0.23 2.31
0
10
20
30
40
50
60
70
picked upby garbage
truck
dumping inindividual pit
burning composting burying feeding toanimals
others
manner of garbage disposal
perc
enta
ge
PalawanEl Nido
Figure 17. Garbage Disposal Methods, El Nido Municipality and Palawan Province
NSO 2000

______________________________________________________________________SOCIOECONOMIC PROFILE 51
2.4.3 Economic Condition
2.4.3.1 Poverty Incidence Based on the survey of the ECAN Project Team (Rañola, et. al., 2004) in twelve barangays, a big percentage (about 71%) of the households in El Nido have income below the poverty line (Table 28) which indicates economic hardship despite the presence of world-class tourism resorts in the municipality. Poverty incidence, as measured by the percentage of households that have incomes below the poverty line, shows that nine of the twelve barangays have poverty incidence above 50%. The worst-off barangays with poverty incidence above 85% include: Villa Paz (98.6%), New Ibajay (94.6%), Bagong Bayan (93%), Mabini (92%), Sibaltan (89.3%), Teneguiban (88.9%), and Manlag (85.6%). Table 28. Number and Percent of Households with Income Below the Poverty
Line, El Nido Municipality, Palawan, 2004.
Barangay No. of HH No. of HH with Income Below the
Poverty Line
% of HH with Income Below the Poverty
Line Masagana Poblacion 183 14 7.7 Barotuan 296 107 36.1 Aberawan 176 73 41.5 Bucana 420 224 53.3 Bebeladan 257 195 75.9 Manlag 215 184 85.6 Teneguiban 396 352 88.9 Sibaltan 169 151 89.3 Mabini 175 161 92.0 Bagong Bayan 200 186 93.0 New Ibajay 371 351 94.6 Villa Paz 144 142 98.6
Total 3002 2,140 71.28 Source: ECAN Zoning Project, 2004
2.4.3.2 Employment Based on Figure 18, more than half of the members of the labor force came only from the four barangays of El Nido: Teneguiban has the most number of people in the labor force (1,455 members) followed by Bebeladan (979); Bucana (584) and New Ibajay (462). Table 29 shows that in all the barangays listed, there are a lot of males who are underemployed. Unemployment rate in El Nido is roughly estimated at about 35-40%. The majority of the working population of El Nido are engaged in agriculture, 66.06% in agri-fishery and 41.45% in agriculture (Table 30). Fishing occupies 23.74% of the labor force while only 0.88% is engaged in forestry activities. Table 31 shows that there are reportedly 1531 households engaged in agriculture and 702 families engaged in fishing.

______________________________________________________________________SOCIOECONOMIC PROFILE 52
0
200
400
600
800
1000
1200
1400
1600
Members in the labor force
Barangay BarangayFreq % Freq %
Teneguiban 1455 23.6 Masagana Pob 373 6.1Bebeladan 979 15.9 Manlag 361 5.9Bucana 584 9.5 Sibaltan 285 4.6New Ibajay 462 7.5 Mabini 281 4.6Barotuan 447 7.3 Aberawan 266 4.3Bagong Bayan 426 6.9 Villa Paz 236 3.8
Members in the labor force
Members in the labor force
Figure 18. Members of Labor Force By Barangay, El Nido,
Municipality, 2004. Source: ECAN Zoning Project, 2004
Table 29. Employment Status by Barangay, El Nido Municipality, 2000.
Percent Underemployed Barangay Members in the
Labor Force Male Female Aberawan 266 57.84 42.16 Villa Paz 236 75.00 25.00 Mabini 281 86.67 19.11 Sibaltan 285 82.26 17.74 Manlag 361 90.57 9.43 Masagana Poblacion 373 64.20 35.80 Bagong Bayan 426 75.46 24.54 Barotuan 447 86.30 13.70 New Ibajay 462 71.24 28.76 Bucana 584 81.25 18.75 Bebeladan 979 52.44 47.56 Teniguiban 1455 74.61 25.39
Total 6155 Source: Rañola, 2004
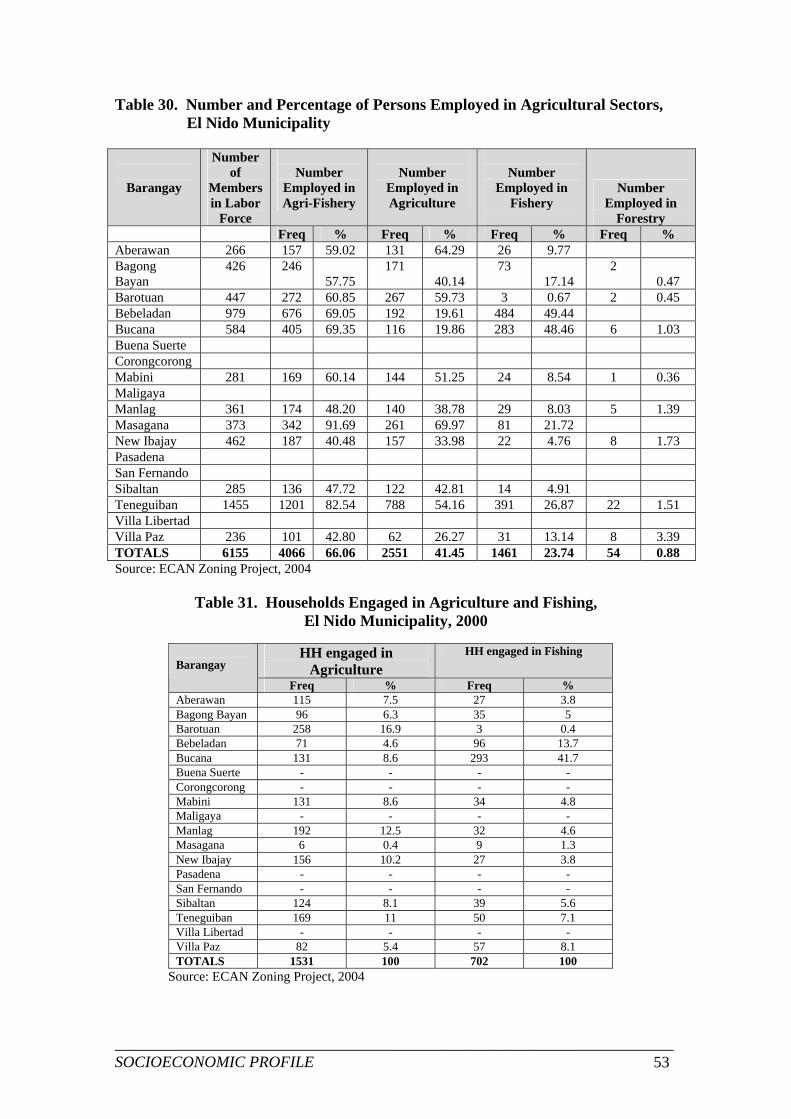
______________________________________________________________________SOCIOECONOMIC PROFILE 53
Table 30. Number and Percentage of Persons Employed in Agricultural Sectors, El Nido Municipality
Barangay
Number of
Members in Labor
Force
Number
Employed in Agri-Fishery
Number
Employed in Agriculture
Number
Employed in Fishery
Number Employed in
Forestry Freq % Freq % Freq % Freq % Aberawan 266 157 59.02 131 64.29 26 9.77 Bagong Bayan
426 246 57.75
171 40.14
73 17.14
2 0.47
Barotuan 447 272 60.85 267 59.73 3 0.67 2 0.45 Bebeladan 979 676 69.05 192 19.61 484 49.44 Bucana 584 405 69.35 116 19.86 283 48.46 6 1.03 Buena Suerte Corongcorong Mabini 281 169 60.14 144 51.25 24 8.54 1 0.36 Maligaya Manlag 361 174 48.20 140 38.78 29 8.03 5 1.39 Masagana 373 342 91.69 261 69.97 81 21.72 New Ibajay 462 187 40.48 157 33.98 22 4.76 8 1.73 Pasadena San Fernando Sibaltan 285 136 47.72 122 42.81 14 4.91 Teneguiban 1455 1201 82.54 788 54.16 391 26.87 22 1.51 Villa Libertad Villa Paz 236 101 42.80 62 26.27 31 13.14 8 3.39 TOTALS 6155 4066 66.06 2551 41.45 1461 23.74 54 0.88 Source: ECAN Zoning Project, 2004
Table 31. Households Engaged in Agriculture and Fishing,
El Nido Municipality, 2000
HH engaged in Agriculture
HH engaged in Fishing Barangay
Freq % Freq % Aberawan 115 7.5 27 3.8 Bagong Bayan 96 6.3 35 5 Barotuan 258 16.9 3 0.4 Bebeladan 71 4.6 96 13.7 Bucana 131 8.6 293 41.7 Buena Suerte - - - - Corongcorong - - - - Mabini 131 8.6 34 4.8 Maligaya - - - - Manlag 192 12.5 32 4.6 Masagana 6 0.4 9 1.3 New Ibajay 156 10.2 27 3.8 Pasadena - - - - San Fernando - - - - Sibaltan 124 8.1 39 5.6 Teneguiban 169 11 50 7.1 Villa Libertad - - - - Villa Paz 82 5.4 57 8.1 TOTALS 1531 100 702 100
Source: ECAN Zoning Project, 2004

______________________________________________________________________SOCIOECONOMIC PROFILE 54
2.4.3.3 Agriculture The top three agricultural products of the municipality are coconuts, rice and cashew. Coconut is planted in 2,624 hectares with an average yield of 591 kg/ha. In 2000 the municipality’s coconut production was valued at PhP 155 million.
Palay is planted in 2,354 has of the municipality’s land area. The average yield in 2000 was 103 sacks per hectare, up from 64 cavans per hectare in 1999. In 1990 the total rice production was 86,000 cavans. The steady increase is attributed to the increase in land area devoted to rice growing.
Cashew, on the other hand is El Nido’s top cash crop covering 2,425 has of land, said to be the biggest in all of Palawan. The average yield is 29 sacks per hectare with a yearly produce valued by the MAO at Php 30 million at least. In 2000, the income from this product was PhP 49 million. The MAO has also noted an increase in cashew production of 20% over ten years from 1990-2000 also attributed to the increased land area devoted to cashew trees. El Nido cashew is considered to be of superior quality and because of this it is believed to have greater industry potential than mangoes.
It is reported that in the 1990s, mangoes were a major source of income for the municipality, with one farm producing up to 200 to 500 kaings. There are still at least 7,000 mango trees in El Nido, some of them about a hundred years old. The municipality also produces corn; roots and tubers; fruits such as mangoes and bananas; and vegetables. Table 32 shows the volume of agricultural produce by the different barangays studied by the ECAN Zoning Project Team (Rañola, 2004).
Table 32. Volume of Production by Barangay, El Nido Municipality, 2000
Barangay
Cereal produced (kg)
Roots and Tubers (kg)
Fruits and vegetables
Freq % Freq % Freq % Aberawan 255,840 11.6 2,540 2.3 3,008 3.0 Bagong Bayan 15,955 0.7 30 0.0 725 0.7 Barotuan 1,003,250 45.6 5,000 4.6 1,025 1.0 Bebeladan 77,100 3.5 45 0.0 5,893 5.9 Bucana 16,950 0.8 30,500 36.5 19,300 19.3 Buena Suerte - - - - - - Corong-corong - - - - - - Mabini 169,750 7.7 42,400 39.1 30,800 30.7 Maligaya No data No data No data No data No data No data Manlag 194,350 8.8 18,400 17.0 20,700 20.7 Masagana 5,550 0.3 No data No data No data No data New Ibajay 4,366 0.2 No data No data 15,028 15.0 Pasadena - - - - - - San Fernando - - - - - - Sibaltan 111,050 5.0 150 0.1 45 0.0 Teneguiban 301,982 13.7 39 0.0 3,600 3.6 Villa Libertad - - - - - - Villa Paz 45,450 2.1 227 0.2 80 0.1
Source: ECAN Zoning Project, 2004

______________________________________________________________________SOCIOECONOMIC PROFILE 55
The Department of Trade and Industry (DTI) listings of businesses in El Nido show only one registered establishment engaged in agri-processing, a cashew nut-processor. The enterprise minimally processes the nuts by drying, shelling and roasting or minimal cooking into candies called bandi.
This is a remarkable finding considering cashew nut production is a major source of income for the municipality. Key informant interviews and public consultations conducted by the ECAN Zoning Project Team (Fillone, 2004) revealed that capital is sorely lacking for the maintenance and operation of cashew nut plantations particularly for the processing of the produce. El Nido’s ricelands are rainfed. The lack of irrigation is cited as the leading factor limiting local agricultural development. There are reportedly 14 rice mills in El Nido, most of which are found in Barotuan.
There are no commercial or rural banks operating in El Nido. Local entrepreneurs capitalize their businesses with loans sourced informally – from family members and friends. Local traders also offer credit in cash and non-cash terms. There are private sector institutions that offer micro-financing such as the El Nido Foundation, a community relations project of the Soriano group of companies. In 2001, the Provincial Cooperative Development Office listed two cooperatives focusing particularly on the production of cashew and meat.
The lack of technical assistance is also cited as a major drawback in the municipality’s agriculture sector. As there are no major commercial farms in El Nido, local farmers receive assistance in crop production, fishing and livestock raising from the MAO alone, which is understaffed with only five agriculturists. The El Nido Foundation occasionally runs projects on resource management, ecological protection and agricultural technology transfer. One of the Foundation’s projects resulted in a project proposal to increase the vegetative cover of a 19-ha cashew area in Bebeladan.
The Office of the Mayor also cites three NGOs concerned with farmers’ needs, two of them are barangay-based and one services the entire municipality.
The municipality of El Nido is hardly self-sufficient in common commodity requirements and is generally dependent on outside sources (Table 33). The production of these commodities is limited by physical and topographical constraints and local cultural practices. El Nido farm production generally supplies only household requirements with only a small surplus going to the local market.

______________________________________________________________________SOCIOECONOMIC PROFILE 56
Table 33. Food Self-sufficiency, El Nido Municipality, 2000
Commodity
Supply (Mt)
Per Capita Per year
Requirement
Demand
(Mt)
Self-sufficiency
level Grains 2201.6 0.10596 3579.991 61.5% Sugar None 0.00781 263.8706 00 Assorted vegetables
100.2 0.10348 3496.201 2.87%
Root crops 99.33 0.02606 880.4697 11.28% Animal products Data not available 0.12925 4366.873 00
NOTE: 1. Supply data were taken from Rañola. Volumes of supplies were converted to metric tons. 2. Per capita per year requirement for each commodity is based on recommended dietary allowance (RDA) and desirable dietary pattern (DDP) determined for Region IV by the Food and Nutrition Research Institute, Department of Science and Technology, 1993. Converted from grams per capita per day to metric ton. 3. Demand is derived using population in 2000 multiplied by the per capita per year requirement, and 25% as buffer stock, seed stock, and wastage. 4. Self-sufficiency level is the ratio of demand to supply
2.4.3.4 Fisheries In year 2000, the total income from fish sales in El Nido amounted to Php 582,787 of which 67% were contributed by Bebeladan and Bucana. The MAO reports that there are at least 100 styrofoam boxes of fresh fish being shipped off the island weekly during the summer months of March to May. Dried fish are also sold to traders in Manila.
Another major marine product of the municipality is squid. At least 20 thousand kg were reportedly sold to Taiwan at one time. The ECAN Zoning Project Team (Fillone, 2004) estimated that earnings from the sale of raw, unprocessed squid reached at least Php 40 million in 2003. Seven hundred and two households were engaged in fishing in 1999, recording a total catch of 15,304 kgs or 1.53 MT, which is believed to be an excellent performance level. However, only 3,464 kgs of this volume were sold indicating that most fishing activities are being done for home consumption. Table 34 provides the number of households engaged in fishing and their volume of catch and income from selling fish. Table 34. Number and Percentage of Households Engaged in Fishing, Volume of
Catch and Total Income from Sale of Fish Catch, El Nido Municipality, 2000
HH engaged
in fishing Vol catch in
1999 HH selling
part of catch HH selling
entire catch Barangay No. % Kg. % No. % No. %
Total income from sale of catch
(Php) Aberawan 27 3.8 4311 28.2 25 3.8 3694 27.4 72,612 Bagong Bayan
35 5.0 289.5 1.9 34 5.2 242 1.8 6,760
Barotuan 3 0.4 503 3.3 3 0.5 200 1.5 5,035

______________________________________________________________________SOCIOECONOMIC PROFILE 57
HH engaged in fishing
Vol catch in 1999
HH selling part of catch
HH selling entire catch
Barangay No. % Kg. % No. % No. %
Total income from sale of catch
(Php) Bebeladan 96 13.7 1238 8.1 96 14.5 1078 8.0 152,395 Bucana 293 41.7 6708 43.8 285 43.2 6554 48.7 229,390 Buena Suerte - - - - - - - - - Corongcorong - - - - - - - - - Mabini 34 4.8 280 1.8 33 5.0 245 1.8 6,218 Maligaya - - - - - - - - - Manlag 32 4.6 245 1.6 28 4.2 196 1.5 5,900 Masagana 9 1.3 630 4.1 9 1.4 493 3.7 47,850 New Ibajay 27 3.8 172 1.1 27 4.1 138 1.0 4,061 Pasadena - - - - - - - - - San Fernando - - - - - - - - - Sibaltan 39 5.6 294 1.9 36 5.5 224 1.7 6,207 Teneguiban 50 7.1 376 2.5 50 7.6 270 2.0 43,100 Villa Libertad - - - - - - - - - Villa Paz 57 8.1 257 1.7 34 5.2 130 1.0 3,259 TOTALS 702 100 15,304 100 660 100 13,464 100 582,787 Source: ECAN Zoning Project, 2004 The volume of and kind of fish catch changes with varying weather conditions and wind directions throughout the course of the year. But while many species are seasonal, some are caught year-round. 2.4.3.5 Trade and Industry Most of the existing commercial establishments in El Nido are retail or sari-sari-stores (60 percent). Far second to it are rice mills (9.9 percent), catering to the local produce of the municipality. Cottages and boarding houses (5.8 percent), mainly accommodating tourists also comprise a large share of the existing commercial establishments. Tourism-based service establishments consisting mainly of transport services like pump boats, tour guide and diving services, account for as much as more than half (53.2 percent) of all service establishments, accounting for more than 50 percent of the total capitalization of all service firms. Total employees engaged in tourism already accounts for the 35.7 percent of all workers or more than half of all service firm employees. Tourism based service establishments, however, peaks up only during the months from October to May, where influx of domestic and foreign tourists occur. Major export products of El Nido consist of traditional commodities such as cashew, bird’s nest, fish and fish preparation, amounting to 2,432.2-mt as recorded by PPA in 2002. Bird’s nest industry is distinctive that its yearly revenue is estimated to reach Php 5 million. Souvenir items, mainly tourist-oriented shirts, are the only nontraditional export products of EL Nido, particularly retailed to an outlet in Coron. However, trading situation in EL Nido is being affected by many factors. Export industry is affected by the declining fish catch due to increasing number of fisherfolk and illegal fishing practices. There is also lack of technological innovation for fish

______________________________________________________________________SOCIOECONOMIC PROFILE 58
processing. This is even worsened by the low buying prices in Manila. Bird’s nest industry also appears to be unsustainable in the long run as it is threatened by illegal and destructive gathering. More opportunities for cashew nuts products remain to be untapped because of lack of processing capabilities. Lack of low-cost but fast transportation modes also add to production expenses, worsening trading situation as high prices only end up to consumers. There is also poor market linkaging of local products (i.e. handicrafts, cashew nuts, rice products, etc.) between local producer units and tourism industry. Manufacturing establishments constitute the remaining 8.3 percent of all registered commercial establishments. These firms produce handicrafts (baskets), noodles, furniture and semi-processed cashew nuts for export. Its total capitalization was 1.5 percent (Php 152 thousand) of total, also employing 11 percent or 20 workers of the total workforce.
2.4.3.6 Tourism El Nido is noted for tourism, not only in the province not only nationwide, but also in the international tourism circuit. Its tourism potentials consist of beautiful beaches, cliffs, hills and mountain forms, corals and exotic sea species. To date, its two upscale resorts, Lagen and Miniloc resorts are world-renowned giving rise to the municipality’s popularity. Other well-known tourist sites in El Nido include Bulalacao and Nagkaletkalet falls in Pasadena, Makinit Hot spring also in Pasadena and the cathedral cave in Babeladan. Table 35 shows the list of identified tourist spots and resources in El Nido. In 2000, an estimated 23, 807 domestic and foreign tourists visited El Nido where influx occurred between October to May (Table 36). Tourists originated mainly from Asia (90 percent) and Europe (5 percent) as well as Metro Manila (10 percent) where they stayed between three to seven days. Asian tourists are mostly Japanese and Korean nationalities who opt to book at the upscale resorts of Lagen and Miniloc Islands at Bacuit Bay. On the other hand, domestic tourists, working on a limited budget opted to stay in the Poblacion where some modest lodging facilities are available at very reasonable prices. Island hopping, a favorite activity of domestic and foreign tourists, were also availed of because of their affordable costs.

______________________________________________________________________SOCIOECONOMIC PROFILE 59
Table 35. List of Identified Tourism Spots and Resources, El Nido Municipality
Category Cluster/Area Marine Inland Cultural Others
El Nido town and surrounding area
Poblacion/Lio/Lamarao/Cagpatang beaches
Burial C. Bulalacao waterfall
Handicraft. Cashew
Caves Birds’ nests Small townscape and amenities
Northern El Nido coastal area
Nagpan Beach and beaches on Yocoton/Base/Diapila Bays
Nagkalit-kalit/Malingay waterfall and Peng & Makalimot Hotspring
Cliff Cave Birds’ nests
Bacuit Bay and offshore islands Area
Miniloc/Pangalusian/Malapacao Islands and Cadlao/Lagen Islands
Island mountain Marble cliff
Nido hunting Cliff Cave Birds’ nests
Source: Fillone, O. 2004. El Nido Livelihood Development Plan. ECAN Zoning Project Table 36. Inventory of Tourist Attractions/Spots, Arrivals, El Nido Municipality,
2000
Visitors Attraction/Spots Location Volume % Balaclava Falls Pasadena 60 0.3 Nagkaletkalet Falls Pasadena 100 0.4 Makinit Springs Barotan 100 0.4 Santikan View Point Corongcorong 200 0.8 Cathedral Cave Bebeladan 8,000 33.6 Island Dive Sites
Bacuit Bay Islands - Pinaglungaban, Intatula, Tapuitan, Matinloc, and Pinagbuyutan Islands
1,809 7.6
Island Resorts Bacuit Bay Islands - Miniloc, Malapacao and Lagen Islands 10,192 42.8
Lodging Houses Poblacion 3,346 14.1 Total 23,807 100.0 Based on the 1996 JICA’s study, it was found out that El Nido’s western beach area has high tourism development potentials along with the El Nido East Area and Puerto Princesa-St. Paul tourism corridor. El Nido’s prevailing features include good accessibility, presence of basic infrastructure and availability of accommodation facilities. Based on a 1996 survey, the top five perceived community needs for tourism in El Nido consist of the following: resorts (37.4 percent), roads (36.8 percent), seaport (19.8 percent), water system (18.9 percent) and airport (11.5 percent).

______________________________________________________________________SOCIOECONOMIC PROFILE 60
2.5 Land Use Profile 2.5.1 Land Classification A very large area (73.5%) of the municipality is still unclassified public forest land and only a small portion is classified as Alienable and Disposable (A&D) land. The present status in land classification in the municipality prevents the legal ownership and pace of land development from taking place in areas suitable for urban and agriculture uses.
Table 37. Land Classification, El Nido Municipality
Land Class Area (hectares) % of Total Land Area A&D lands 12,682.94 22.68 Timberland 2,107.46 3.76 Unclassified Public Forest Land 41,125.86
73.54
Grand Total 55,916.26 100.00 Source: ECAN Zoning Project, 2006 Figure 19 shows the Land Classification Map of El Nido Municipality.
2.5.2 Existing Land Use Based on the El Nido’s CLUP for 2003-2010, about 55% of the total land area of the municipality is forestland, approximately 13% is being used for agriculture, and less than 1% is presently used for human settlements or built-up area (Table 38). A big chunk of land categorized as “other land uses” comprise about 32% of the municipality’s total land area and these include the roads, vacant lands and other open spaces, and those areas used for tourism purposes. The types of forest that abound in the area include: mangroves, old growth, mossy forest, residual forest and marginal forest. For agricultural uses, cashew is the leading commercial crop planted in the municipality occupying about 3,300 hectares. Some forestland areas are cleared to plant cashew resulting in its expansion in secondary forest lands. Major producers of cashew is barangay Sibaltan; it is also commonly produced in barangays Bebeladan, Mabini, San Fernando, Pasadena, Barotuan, Bucana and New Ibajay. Other common agricultural crops planted include coconut, corn, mango, and banana. Ricelands, which are usually located on lowlands along major roads, cover an area of about 2,308.02 hectares or 19.44% of the municipality’s agricultural lands.
Grasslands and Brushlands cover about 17.11 hectares or 0.019 % of total land area of the municipality. Most of these grasslands and brushlands are found in barangays Aberawan and Bagong Bayan on the northwestern part of the island.

______________________________________________________________________SOCIOECONOMIC PROFILE 61
Table 38. Existing Land Use Distribution, El Nido Municipality
Land Use Category Area (hectares) (% )Land Area Forestland 50,849.54 55.07 (mainland) (47,368.58) (island) (3,480.97) Agriculture 11,871.49 12.86 Grassland/Brushland 17.11 0.02 Built-up 204.86 0.22 Others 29, 382.99 31.83
Total 92,326 100 Source: CLUP of El Nido for 2003-2010
Close to half of El Nido’s land area (48.8 percent) was classified by the Department of Environment and Natural Resources (DENR) as protected areas in 2000 (Table 39). Every single barangay, except for Pasadena, had at least a hundred hectares of environmentally vulnerable ecosystems that need protection from destructive human activities, much of which is livelihood-oriented. Figure 20 shows the El Nido Marine Reserve Area which is a protected area by virtue of a Presidential Proclamation issued in 1998. Table 39 shows that six barangays totally fall within the protected areas, namely: 1) Aberawan; 2) Bagong Bayan; 3) Bebeladan; 4) Buena Suerte; 5) Maligaya, and 6) Masagana. Four others have at least half of their total barangay land area within protected areas -- Bucana, Corong-corong, Manlag, and Pasadena. Except for Bucana and Pasadena, all these barangays are situated in the fringes of Bacuit Bay and they have much influence on the ecological integrity of the bay’s coastal habitats. Thus, regulating destructive activities in these upland areas is critical to the protection of Bacuit bay.
Table 39. Protected Area Coverage, El Nido, 2000
Barangay Population (2000)
Main Livelihood
Total Area (hectare)
Area within the PA
(ha)
% of Total by
Barangay
1) Aberawan 930 Farming 2,805 2,805 100.02) Bagong Bayan 869 Farming 487 487 100.03) Barotuan 1,708 Farming 2,166 876 40.44) Bebeladan 1,785 Farming/Fishing 4,476 4,476 100.05) Bucana 3,945 Fishing 2,399 1,354 56.46) Buena Suerte 1,761 Fishing 214 214 100.07) Corong-corong 733 Farming/Fishing 2,691 2,331 86.6
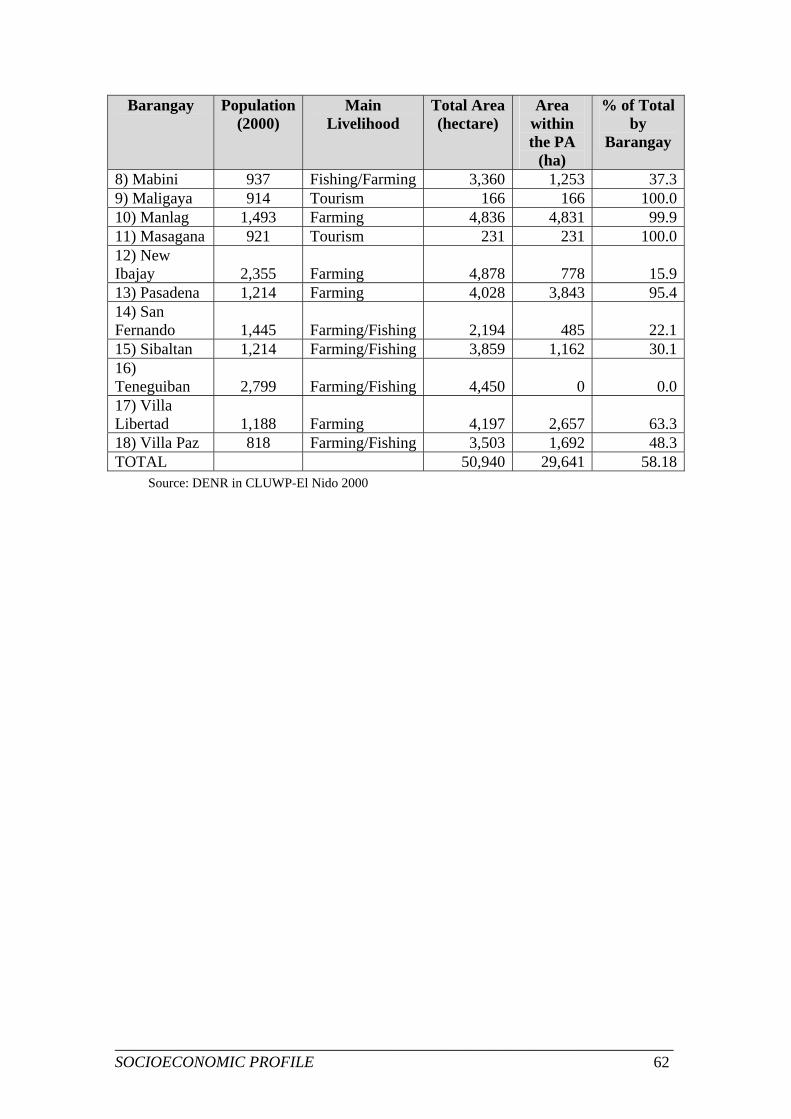
______________________________________________________________________SOCIOECONOMIC PROFILE 62
Barangay Population (2000)
Main Livelihood
Total Area (hectare)
Area within the PA
(ha)
% of Total by
Barangay
8) Mabini 937 Fishing/Farming 3,360 1,253 37.39) Maligaya 914 Tourism 166 166 100.010) Manlag 1,493 Farming 4,836 4,831 99.911) Masagana 921 Tourism 231 231 100.012) New Ibajay 2,355 Farming 4,878 778 15.913) Pasadena 1,214 Farming 4,028 3,843 95.414) San Fernando 1,445 Farming/Fishing 2,194 485 22.115) Sibaltan 1,214 Farming/Fishing 3,859 1,162 30.116) Teneguiban 2,799 Farming/Fishing 4,450 0 0.017) Villa Libertad 1,188 Farming 4,197 2,657 63.318) Villa Paz 818 Farming/Fishing 3,503 1,692 48.3TOTAL 50,940 29,641 58.18 Source: DENR in CLUWP-El Nido 2000

______________________________________________________________________SOCIOECONOMIC PROFILE 63
Figure 19. Land Classification Map, El Nido Municipality

______________________________________________________________________SOCIOECONOMIC PROFILE 64
Figure 20. El Nido Marine Reserve Map

______________________________________________________________________SOCIOECONOMIC PROFILE 65
2.5.3 Land/Sea Cover Classification The ECAN Zoning Project used two types of satellite imageries in the mapping of the land and sea cover of El Nido Municipality. For its terrestrial features and some coastal habitats (corals and seagrass cover found in shallower waters), SPOT-5 was used, and in order to capture clearer pictures of corals and seagrass found in deeper portion of the sea, the IKONOS satellite imagery was employed. The results of the land and sea cover mapping are summarized in Table 40. Using SPOT5, agriculture areas were estimated to comprise about 9% of the land area of El Nido. Kaingin was noted to cover 894 hectares during the time when the satellite image was taken in 2004. Forest comprised about 47% (excluding mangrove forest) of the total land area while brushland covers 39%. Built-up areas cover a very small part of about 1% of the municipal’s land area because of the high proportion of steeply sloping areas which are unsuitable for settlements. Of the total area of coastal habitats mapped using SPOT-5 and IKONOS, a large part is covered by mangroves (42%) followed by seagrass (27%) and coral reefs (25%). About three hectares of fishpond were mapped in El Nido. Table 41 provides the barangay breakdown of the different classes of land and sea cover of the municipality including its small islands and islets, about 35 of them that were mapped using SPOT-5 and IKONOS. Figure 21 shows that Land/Sea Cover Map of El Nido municipality.
Table 40. Land and Sea Cover Classification, El Nido Municipality
Land/Sea Cover Hectares % of Total Built-up areas 508.87 1.02 Agricultural areas 4,594.73 9.18 Coconut 53.01 0.11 Kaingin 894.81 1.79 Brushland 19,582.57 39.11 Grassland 1,042.80 2.08 Primary forest 3,398.99 6.33 Secondary forest 16,377.14 32.71 Limestone forest 3,024.05 6.04 River 167.89 0.34 Road 425.89 0.85 Sub-Total for Terrestrial 50,070.75 100.00 Mangrove forest 2,493.38 88.99 Corals 30.73 1.10 Dense seagrass 39.81 1.42 Sparse seagrass 15.46 0.55 Sand/rock 222.59 7.94 Sub-Total for coastal/marine 2,801.96 100.00 Grand Total 52,872.71 100.00 Source: ECAN Zoning Project, 2006

______________________________________________________________________SOCIOECONOMIC PROFILE 66
Figure 21. Land/Sea Cover Map, El Nido Municipality

____________________________________________________________________________________________________________________________________ SOCIOECONOMIC PROFILE 67
Table 41. Land/Sea Cover Classification, By Barangay, El Nido Municipality
Primary Forest Secondary Forest Limestone Forest Agricultural
Areas Brushland Grassland River Built-up Roads Coconut Kaingin GRAND TOTAL
Name Ha % Ha % Ha % Ha % Ha % Ha % Ha % Ha % Ha % Ha % Ha % Ha %
Aberawan 4.78 0.14 1,253.04 7.65 2.30 0.08 109.28 2.38 722.67 3.69 81.96 7.86 5.84 3.48 4.85 0.95 13.94 3.27 0.00 0 41.46 4.63 2,240.10 4.47
Bagong Bayan 2.28 0.07 1,006.11 6.14 55.58 1.84 256.92 5.59 1,460.03 7.46 145.31 13.93 15.51 9.24 30.37 5.97 37.18 8.73 0.00 0.00 78.61 8.79 3,087.92 6.17
Barutuan 154.77 4.55 643.80 3.93 0.00 0.00 615.80 13.40 1,338.19 6.83 3.13 0.30 7.35 4.38 16.95 3.33 17.42 4.09 0.00 0.00 2.86 0.32 2,800.27 5.59
Bebeladan 92.66 2.73 1,290.86 7.54 1,594.51 22.89 286.19 6.23 1,884.39 9.42 426.50 38.15 0.31 0.18 43.90 8.63 13.40 3.15 0.00 0.00 53.96 6.03 5,686.66 9.31
Bucana 0.00 0.00 192.57 1.18 1.57 0.05 501.89 10.92 997.54 5.09 74.81 7.17 30.00 17.87 52.62 10.34 37.40 8.78 50.63 95.50 76.43 8.54 2,110.96 4.03
Buena Suerte 0.00 0.00 0.00 0.00 198.19 6.55 0.00 0.00 0.00 0.00 0.00 0.00 0.00 0.00 6.75 1.33 0.00 0.00 0.00 0.00 0.00 0.00 204.94 0.41
Corong-corong 110.14 3.24 938.98 5.73 0.00 0.00 111.81 2.43 756.05 3.86 0.00 0.00 10.45 6.22 36.29 7.13 21.36 5.02 0.00 0.00 6.46 0.72 1,991.54 3.98
Mabini 0.00 0.00 2,386.64 14.57 0.60 0.02 198.15 4.31 830.26 4.24 34.78 3.34 5.60 3.34 64.64 12.70 33.80 7.94 0.00 0.00 41.14 4.60 3,629.43 7.18
Maligaya 0.00 0.00 0.78 0.00 48.29 1.60 0.00 0.00 8.37 0.04 1.72 0.16 0.00 0.00 14.13 2.78 5.09 1.20 0.00 0.00 0.00 0.00 78.38 0.16
Manlag 0.00 0.00 820.40 4.77 0.00 0.00 183.07 3.83 836.37 4.10 0.00 0.00 8.60 4.87 17.70 3.36 21.32 4.77 0.00 0.00 1.62 0.18 1889.08 3.63
Masagana 0.00 0.00 30.77 0.19 0.92 0.03 26.77 0.58 94.40 0.48 2.64 0.25 0.00 0.00 16.94 3.33 6.81 1.60 0.00 0.00 1.11 0.12 180.37 0.36
New Ibajay 277.68 8.17 2,739.85 16.73 194.79 6.44 597.96 13.01 1,670.85 8.53 0.00 0.00 48.88 29.11 22.72 4.46 49.24 11.56 0.00 0.00 0.00 0.00 5,601.97 11.2
Pasadena 898.96 26.45 2,111.95 12.90 0.00 0.00 406.43 8.85 1,334.40 6.81 119.70 11.48 19.66 11.71 51.99 10.22 45.06 10.58 0.00 0.00 16.46 1.84 5,004.61 10
San Fernando 325.80 9.59 242.76 1.48 0.00 0.00 197.90 4.31 1,291.61 6.60 1.27 0.12 0.00 0.00 12.93 2.54 17.90 4.20 0.00 0.00 90.80 10.20 2,180.96 4.36
Sibaltan 518.58 15.26 864.61 5.28 0.00 0.00 129.93 2.83 2,355.05 12.03 0.00 0.00 3.30 1.97 8.39 1.65 37.07 8.70 0.00 0.00 95.46 10.70 4,012.38 8.01
Teneguiban 0.00 0.00 841.74 5.14 0.00 0.00 474.80 10.33 2,647.62 13.52 117.69 11.29 0.00 0.00 72.84 14.31 34.74 8.16 1.00 1.89 339.49 37.90 4,529.92 9.05
Villa Libertad 337.94 9.94 759.16 4.64 925.37 30.60 474.77 10.33 880.55 4.50 33.29 3.19 9.98 5.94 40.02 7.86 25.15 5.91 1.38 2.60 21.00 2.35 3,511.21 7.01
Villa Paz 675.40 19.87 1,073.52 6.55 1.93 0.06 206.13 4.49 1,310.53 6.69 0.00 0.00 11.01 6.56 12.54 2.46 30.33 7.12 0.00 0.00 29.57 3.30 3,350.97 6.69
GRAND TOTAL 3,398.98 100 17,197.53 100 3,024.06 100 4,777.79 100 20,418.87 100 1,042.80 100 176.49 100 526.57 100 447.22 100 53.01 100 896.43 100 52,091.65 100

_________________________________________________________________________________________________________ SOCIOECONOMIC PROFILE 68
Table 41 (cont’n…) Sea Cover, By Barangay, El Nido, Municipality
Mangroves Corals Dense Seagrass Sparse Seagrass Sand/Rock T O T A L Name Ha % Ha % Ha % Ha % Ha % Ha %
Aberawan 128.87 5.17 0.00 0.00 0.02 0.04 0.00 0.00 7.28 3.27 136.16 4.86 Bagong Bayan 221.61 8.89 0.00 0.00 2.71 6.81 0.12 0.78 1.51 0.68 225.96 8.06 Barutuan 45.61 1.83 0.00 0.00 0.00 0.00 0.00 0.00 0.00 0.00 45.61 1.63 Bebeladan 562.20 22.55 15.44 50.25 6.92 17.38 7.50 47.87 39.80 10.20 631.86 21.92 Bucana 112.91 4.53 8.71 28.34 12.38 31.10 2.18 14.10 44.28 19.89 180.46 6.44 Buena Suerte 0.00 0.00 0.00 0.00 0.00 0.00 0.00 0.00 0.51 0.23 0.51 0.02 Corong-corong 145.97 5.85 0.00 0.00 3.40 8.54 0.30 1.94 3.09 1.39 152.76 5.45 Mabini 260.27 10.44 0.00 0.00 0.59 1.48 0.00 0.00 0.00 0.00 260.86 9.31 Maligaya 5.14 0.21 0.00 0.00 0.00 0.00 0.00 0.00 0.34 0.15 5.48 0.20 Manlag 151.72 5.74 0.00 0.00 2.94 6.88 0.00 0.00 5.64 2.53 160.30 5.42 Masagana 0.00 0.00 0.00 0.00 0.00 0.00 0.00 0.00 0.00 0.00 0.00 0.00 New Ibajay 414.76 16.63 0.00 0.00 3.22 8.09 0.00 0.00 5.37 2.41 423.35 15.11 Pasadena 27.92 1.12 0.53 1.72 0.00 0.00 0.03 0.19 14.22 6.39 42.70 1.52 San Fernando 29.97 1.20 4.80 15.62 0.00 0.00 0.00 0.00 17.47 7.85 52.24 1.86 Sibaltan 158.63 6.36 0.60 1.95 3.62 9.09 0.00 0.00 7.06 3.17 169.91 6.06 Teneguiban 86.26 3.46 0.64 2.08 3.39 8.52 2.77 17.92 66.84 32.42 159.90 5.90 Villa Libertad 26.52 1.06 0.00 0.00 1.47 3.69 2.65 17.14 9.50 4.27 40.14 1.43 Villa Paz 266.74 10.70 0.00 0.00 2.09 5.25 0.00 0.00 0.00 0.00 268.83 9.59 GRAND TOTAL 2,645.10 100 30.73 100 42.75 100 15.55 100 222.91 100 2,957.03 100 Source: ECAN Zoning Component, SEMP-NP

_____________________________________________________________________ ECAN ZONES MANAGEMENT PLAN 69
3.0 ECAN ZONES MANAGEMENT PLAN 3.1 Vision and Mission The vision provided by the stakeholders in their planning of the El Nido Managed Resource Protected Area conducted in July 1999 is adopted as the vision statement for this ECAN Zone Management Plan because of its similarity with the latter. However, PCSDS can conduct an updating of this vision statement with the stakeholders if found necessary. The vision for managing the environment and natural resources of El Nido is as follows:
“A community that is healthy and peaceful, enjoying equality (with inherent capability to improve its quality of life) and an improving but sustainable quality of life, respectful of the integrity of the environment and its natural life forms and citizens who are God-fearing, humane, patriotic, acting with unity and increasing capabilities to create an ideal society for the next generation.” Its Tagalog version is “Isang komunidad na malusog, mapayapa, may pagkapantay-pantay, may likas-kayang (kaunlaran) katiwasayan ng buhay, gumagalang sa integridad ng kapaligiran at buhay sa kapaligiran, ang mamamaya’y maka-Diyos, makatao, makabayan, nagkakaisa at may maunlad na kakayanan tungo sa isang ganap na lipunan ng susunod na henerasyon.”
The Mission of the ECAN Management Board or expanded Protected Area Management Board (PAMB) is: To manage the environment and natural resources of El Nido for biodiversity conservation and for sustainable livelihood of its residents.
3.2 Goals and Objectives of ECAN Zones Management ECAN zoning is a strategic tool in implementing the SEP law and making sustainable development happen in the locality. It is a primordial instrument to put things in order --- the proper use of land and coastal/marine resources. The LGU and other sectors in El Nido are cognizant of the actions needed in ensuring the successful implementation of ECAN zoning as evidenced by the results of the several workshops conducted in the municipality by the ECAN Zoning Project. Many participants to the workshops easily understood that from the successful implementation of ECAN zoning and its management plan will spring many benefits and opportunities that will improve their children’s lives. They are aware that “Ecanization” of El Nido will promote objectives towards the attainment of sustainable tourism, agriculture and fisheries, forestry, and urban development. However, there are issues and problems that would have to be resolved, and barriers that need to be overcome by the local residents themselves before the benefits and opportunities offered by the successful implementation of ECAN zoning and its management plan can be attained. The following unified actions

_____________________________________________________________________ ECAN ZONES MANAGEMENT PLAN 70
are demanded from the stakeholders to make Ecanization successful and its impacts attained:
• Participate in planning and program implementation: That the choice for a better future is in their hands and whatever they do or do not do will spell out their welfare now and in the future;
• Share governance, partner with concerned organizations and undertake
unified actions through bayanihan and cooperativism: That they have to organize and mobilize themselves to get things going.
• Conduct IEC and advocacy campaigns: That local residents have to
understand the importance of ECAN zoning in improving their livelihood and income and eventually, their quality of life;
• Participate vigilantly in ECAN zoning enforcement: That they have to
advocate and participate in the enforcement of ECAN zoning guidelines;
• Voluntary change, peer pressure, and respect for ecological integrity: That they have to change their undesirable behavior in exploiting natural resources and practice proper conservation methods;
• Pursue sustainable livelihood: That they have to develop their skills for
alternative means of livelihood to lessen pressure on environment and natural resources exploitation;
• Invest in human resources capital development: That they have to invest in
the education of their children to provide them better future;
• Ensure sustainable financing for ECAN Zones management: That they have to develop ways and means of sustaining the implementation of ECAN zoning and its corresponding management plan;
• Undertake ecosystem management, rehabilitation of degraded areas,
adoption of conservation methods, promotion of property rights and/or usufructuary rights: That they have to take care of the natural assets they used for earning a living, whether these natural assets are owned, leased or borrowed;
• Conduct monitoring, surveillance and evaluation: That they have to keep a
close watch of the progress of implementing ECAN zoning and its management plan to make the necessary adjustments in the means and modes of their actions;
• Enforce laws and regulations including apprehension and prosecution:
That they have to police their ranks and participate in the enforcement of ECAN zoning guidelines and other environmental laws and regulations;

_____________________________________________________________________ ECAN ZONES MANAGEMENT PLAN 71
• Establish safeguards against resource exploitation by the powerful and influential: That they do not allow the interest of other persons, groups or entities to go above the interest of the local communities;
• Internalize ENR management and reform value system: That they have to make environment and natural resources management a part of their value system and lifestyle and imbue them in the culture of their children.
These are the pathways leading to the road of sustainable development in the municipality of El Nido and the other municipalities of Palawan province. These pathways make up the backbone of the El Nido ECAN Zones Management Plan.
3.3 Guiding Principles in ECAN Zones Planning and Management ECAN Zoning becomes meaningless unless it is institutionalized by the key actors, in this case, PCSD, LGU, DENR and other partner implementing organizations including NGOs and local community organizations. Secondly, ECAN zoning and resource management measures should benefit the local communities including indigenous people and tenured migrants to sustain compliance by stakeholders. Thirdly, ECAN zoning should be able to balance environment and natural resources protection with socioeconomic development to be acceptable to stakeholders and to promote sustainable development in the locality. Lastly, the implementation of ECAN Zoning should, in the medium-term or as soon as possible, be devolved to the municipality and the barangays to foster lasting partnership between communities and the government. In planning for ECAN zoning and management of ecosystems and natural resources for sustainable development, it is of utmost importance to consider the following principles and guidelines in order to ensure success in their implementation:
1) Local communities (indigenous people and tenured migrants) should have property right over natural resources within their locality (Usufructuary rights - where a person or group of persons are granted limited use of the land and the enjoyment of its fruits without granting ownership to the land itself, with strict conditions on the care and protection of the resource). Indigenous people’s right over access to natural resources in core and tribal use zones should be protected and supported.
2) Planning and decision-making in the implementation of ECAN zoning should
involve stakeholders’ participation (Subsidiarity principle). The stakeholders should be properly represented in the ECAN Board or PAMB.
3) Use of resources in buffer (controlled and traditional) and multiple use zones
should be regulated within sustainable yield or according to sustainable harvestable yield to prevent resource degradation and depletion (Resource sustainability principle).
4) Economic activities with unknown or uncertain impacts which may be
irreversible and impose greater risk to population and ecosystems should be disallowed even in multiple use zone (Precautionary principle).

_____________________________________________________________________ ECAN ZONES MANAGEMENT PLAN 72
5) Polluters should be made responsible for controlling pollution and restoring damaged environmental resources (Polluter’s pay principle). Mechanisms for enabling polluters to internalize environmental and social costs through use of economic and command and control instruments should be put in place.
6) Resource management policies and program of actions on ECAN zoning
should give priority to protecting society’s well-being and promoting social justice.
7) Efficient use of ENR should be ensured by maximizing resource use rent to
corporate users such as logging and grazing land concessions, aquaculture and fishpond owners, pearl farm owners, live fish and bird’s nest traders, mining concessions, plantation forest concessions, and tourism establishments, etc.
8) Strategies to develop the potentials of women to manage ENR and benefit
from its use should be promoted (Gender equality). The women should be given equal access to education, livelihood opportunities, technology and information.
9) Science and technology should be applied as the basic foundation in ENR
policy making and management decision-making. Policies and actions affecting environment and natural resources integrity should have scientific basis and not dominantly political motivation.
The programs and projects to implement ECAN Zoning should be guided by the six tests of sustainability to ensure their success and long-term viability. These tests are as follows:
1) Economic viability – the development policy or program will benefit the
greater majority and not cause serious harm or permanent disbenefits to the affected minority. Proper safety nets and compensatory measures are put in place for the affected minority. The fruits of development are equitably shared among the population.
2) Ecological viability – development will not significantly hamper or alter the ecological functions of the environment and the regeneration capacity of natural resources.
3) Technological viability – development will adopt technologies that are cleaner, more efficient and environment-friendly.
4) Socio-cultural viability- development will enhance and not oppose core
values, beliefs and worldview of a community which are consistent with human ecological principles of life-giving and peace-keeping. Women are given equal opportunity to decide and participate in all facets of development in their locality and enjoy the benefits of nature.
5) Political viability – development will enhance people empowerment and promote social justice, protect cultural diversity, encourage democratic participation and support good governance and shared responsibilities.

_____________________________________________________________________ ECAN ZONES MANAGEMENT PLAN 73
6) Institutional viability – development will enhance the capacity of local institutions to sustain its initiatives and flow of benefits.
All programs and projects that will be undertaken in the municipality should pass these tests of sustainability to ensure that they will not inadvertently cause harm to people and environment.
3.4 Resource Assessment and Management 3.4.1 Resource Uses, Issues and Problems 3.4.1.1 Forest and Wildlife Resources The forest resources in the municipality have been used by the local residents for various purposes which benefited them economically. The different uses of forest resources include: trees for lumber, furniture making, housing materials, boat and boat hull making, bridge and building construction. The municipality’s second growth forests have been used for upland farming and the source of non-timber products such as honey, wild vines, palm and bamboo for handicrafts and cogon for shingle making. The municipality’s tribal people, 76.3% of the Tagbanuas and the Bataks, augment their farming incomes with honey gathering while 67.8% of them make a livelihood from rattan gathering. The forest is also a source of wild pigs and other animals for food as in the case of the residents from barangays Bebeladan and Bucana.
Caves in forest lands are widely exploited in El Nido for bird’s nest gathering. In the study conducted by the ECAN Zoning Project in 2004, bird’s nest gathering was found to thrive in the municipality for the last 40 years. One of the major producer area is Lagen Island where one gatherer harvests from at least 32 caves and in Inambuyod Island which has more than 100 caves. Despite heavy guarding of caves from theft of bird’s nests, the production has been declining in recent years due to overharvesting. Gatherers and local environmentalists note the appearance of mouth sores in many of the swiftlets, symptoms of stress in birds forced to replace nests in shortened nesting cycles.
Except for barangay Teneguiban, all the study sites covered by the ECAN Zoning Project have problems on illegal forest activities such as illegal cutting of trees, illegal hunting of wild and endangered species, and kaingin. Kaingin has expanded significantly in barangays Bagong Bayan, Aberawan, Manlag, Barotuan, Villa Paz and New Ibajay. Settlers were also observed by the flora survey team to be cultivating hill slopes in barangays Pasadeña and Villa Libertad. Kaingin farmers clear the forest to plant rice and interplant it with cashew. Old growth forest is reportedly cut in January and secondary forest in February. The areas are only planted to rice for two years due to increasing difficulty in weed control and decreasing soil fertility. Cashew is left to grow permanently and further expanded to cover wider

_____________________________________________________________________ ECAN ZONES MANAGEMENT PLAN 74
areas. In effect, secondary forests are displaced by the expansion of cashew plantation. Burning of agricultural wastes prior to land preparation for planting is common in agricultural lands and hillside farms and this has accidentally spread in some occasions to the nearby forest areas. Burning was reported by the survey team to be a serious problem in barangays Bagong Bayan, Corong Corong, Barotuan, Teneguiban and Ibajay. Illegal harvesting of timber is a serious threat which was observed in El Nido forest areas. Merchantable timber sizes of apitong and ipil were noted by the survey team to be illegally harvested in Aberawan. Felled timbers were particularly seen in barangays Pasadeña, Aberawan, Bagong Bayan and Corong Corong. Squatting or illegal occupancy of forest areas is another threat to the stability of upland and forest ecosystem in El Nido. Almost all of the forested barangays in El Nido have encountered illegal forest occupancy problems. But this problem is more widespread in barangays Barotuan, Bucana, New Ibajay and Villa Paz. 3.4.1.2 Coastal/Marine Resources
Beaches
Based on the study conducted by the Socioeconomic Appraisal Team of the ECAN Zoning Project, the local communities derive both social and economic benefits from the use of the beach ecosystems. Although the beaches serve as picnic areas for all sites, the ecosystem also provides livelihood opportunities for the local people. In Mabini, the ecosystem serves as a source of gravel and sand for hollow block making. The beach also provides areas for fish drying and boat docking area needed for purposes of their fishing activity. The only problem cited in the use of beach resources is quarrying which was observed in barangay Bebeladan. Coral Reefs Shell gathering and fishing are activities commonly undertaken in coral reef areas in Teneguiban, Mabini, Bebeladan and Bucana based on the feedback from local residents gathered by the Socioeconomic Appraisal Team of the ECAN Zoning Project. Fishing activities in coral reef areas are usually done by way of the hook and line, kitang, fish trap, and spear fishing methods. The intact coral reefs in Pinasil island and Teneguiban reef are very much prone to pollution effects and sediment loading of land-based activities. Pollution of coastal waters is caused by improper disposal of solid and liquid wastes and chemicals from farmlands. Sediments come from kaingin areas in steeply sloping portion of the watersheds that drain into coastal waters. Barangays Sibaltan and Villa Paz have poor coastal condition due to kaingin in their contiguous terrestrial area.
A large part of the coral reefs in El Nido was destroyed by destructive fishing methods such as dynamite, cyanide and muro-ami. Dynamite fishing is still widely

_____________________________________________________________________ ECAN ZONES MANAGEMENT PLAN 75
practiced in El Nido. A single blast can make a hole up to 5 meters in diameter, destroying coral reefs within it. Cyanide fishing is another destructive fishing method still employed by fishermen in catching live fish. Muro-ami fishing destroys coral reefs because of the use of weighted scarelines that break corals. Teneguiban Island has fragmented coral growth areas, probably due to this method of fishing. Except for Miniloc and Cadlao Island, illegal fishing practices are reported to still persist in El Nido’s islands with little or no control. Additionally, the phenomenon of bleaching also threatens the coral reefs in El Nido. The whitening of corals from loss of zooxanthellae results in exposing the corals’ calcium content and causes their death. Some unregulated tourism recreational activities such as reckless diving, humans stepping on coral formations, indiscriminate dropping of anchors, among others, contribute to the decimation of coral reefs in the locality.
Seagrass Seagrass meadows are used by local residents to gather shell, catch fish, seahorse and culture seaweeds. Destruction of seagrass beds are caused by cyanide and poison bait methods of fishing. Chemical pollutants carried by surface runoff from farmlands and settlements also cause the decimation of seagrass.
Muddy/Brackish Mangrove Area
Aside from the water-related economic activities such as fishing, shell and crab gathering, the vegetative component of the mangrove areas is primarily used for gathering of wood. In barangays, Teneguiban, Mabini and Bebeladan, mangrove forest is the source of wood for housing and charcoal materials. In barangay Bucana, the local residents also cut trees for fuelwood and gather nipa. Mangrove areas are also used for crab fattening and fishpond establishment in barangay Teneguiban; and fish cage establishment in barangay Bucana. The rampant cutting of trees for house construction and for meeting the household fuel-wood requirements started in the early 70’s and continued on up till 2000s. This resulted in the widespread degradation of mangrove forests in El Nido particularly in barangays Bebeladan, Bucana, Teneguiban and Mabini. The Mangrove Survey Team of the ECAN Zoning Project reported that there are at least 18 sights found to have been subjected to cutting, clearing and charcoal making in barangays Banlag, Bucana, Baratuan, Mabini, New Ibajay, Sibaltan and Teneguiban. In addition, shoreline developments such as the construction of harbors, ports and illegal construction of houses have contributed significantly to the destruction of mangrove areas. The ECAN Zoning Project’s Mangrove Team identified two endemic species of mangrove that were found in El Nido to be highly threatened of being decimated if not strictly protected. Thus, it is imperative that these species be given special attention in efforts to protect mangroves from illegal cutting for domestic uses.

_____________________________________________________________________ ECAN ZONES MANAGEMENT PLAN 76
Marine Mammals and Sea Turtles
Respondents to the survey conducted by the ECAN Zoning Project in 2004 identified several threats to marine mammals and sea turtles to include dynamite and cyanide fishing, and accidental catch in fish nets especially of dugongs and turtles. When caught, dugongs are oftentimes slaughtered while turtles are mostly released. A common threat in turtles’ nesting sites is the disturbances created by settlements near the shore. The noise created in settlements areas deter nesters from their egg laying while the light emitted disorient newly hatched turtles from making it to the sea.
Fisheries There are more than 40 different species of fish caught by El Nido fishermen, among them Spanish mackerel, dotted rabbi fish, grey mullet and common pony fish, blue-lined surgeon fish, banak, samaral, molmol, mudcrab, blue crab, kikiro, mangagat, tauban, mayamaya, bisugo and kalaso. The species of fish caught depend on the location of the fishing ground.
A common observation in four study sites is that over the last three decades, the level of fishing effort required to catch the same amount of fish has been increasing. The observed decline of fish caught and number of fish species is attributed to a number of factors. The common major factor mentioned in all study sites is the proliferation of the use of dynamite and cyanide methods of fishing. The other major factor is the pollution load coming from improper household waste disposal, and chemical wastes and sediments from farmlands and kaingin areas.
3.4.2 Resource Management Measures
3.4.2.1 Forest Resources and Biodiversity Several management measures are applicable for different types of ecosystems. For El Nido, the following measures are proposed by the Flora Survey Team of the ECAN Zoning Project: 1) Grasslands
Unproductive grasslands located in timberlands need to be reverted to forest to improve upland ecosystem stability and productivity. Rehabilitation of grasslands into forest necessitates the following actions.
• Grasses adjacent to forest should be monitored periodically by authorized government agencies and cooperating organizations (POs, NGO and community organizations) especially during the summer months, the time in which this vegetation are most prone to fire whether accidentally or through kaingin practices.
• Forest species which can compete with grasses should be selected as reforestation species. These plants include narra (Pterocarpus indicus),

_____________________________________________________________________ ECAN ZONES MANAGEMENT PLAN 77
alibangbang (Peliostigma malabaricum), molave (Vitex parviflora) and lingo-lingo (Vitex sp.) Other species that compete well with cogon and survive in hot and dry areas include Bagalunga (Melia dubia) and Kalumpang (Parkia roxburgii).
• Planting should be done during the rainy season from June to August to ensure
better survival and good growth.
2) Brushlands
• Forest species that are shade tolerant and grow well in acidic or alkaline and dry sites should be selected in the rehabilitation of brushlands into forest. Forest species that perform well in brushlands include molave, Narra, Malapapaya, Batino, and Kusibeng (Sapindus asponaria).
• Planting should be done during the rainy season from June to August to ensure better survival and good growth.
3) Denuded Forests and Eroded Slopes The common and effective means to control erosion in denuded areas include mechanical and vegetative methods. Good forest tree species for the reforestation of denuded sites include agoho (Casuarina equisetifolia), dapdap, talisay gubat, and banaba (Lagerstroemia speciosa) because they thrive well in less fertile and eroded soils. Mechanical methods to arrest erosion include wattling, small check dams, rip rapping, and gabions.
4) Kaingin Areas
If kaingin is effectively stopped and kaingin plots are established in more suitable sites, former kaingin areas should be reforested to stabilize the slopes. Tree species that are suitable to open or dry conditions which characterize kaingin areas in hillsides include molave, banaba, lingo-lingo, bagalunga, and kalumpit. Lamio and dao are also suitable species in open areas but grow well in low-lying kaingin sites.
5) Recently Logged Over Areas
Recently logged-over areas should be protected from kaingineros to prevent the clearing of smaller diameter trees that are usually left after logging. When the remaining standing trees grow, they help regenerate forest stands in logged over areas. Local organizations such as Pos, NGOs, and prospective CBFM recipients can be tapped to protect and reforest logged-over areas.

_____________________________________________________________________ ECAN ZONES MANAGEMENT PLAN 78
3.4.2.2 Wildlife Resources and Biodiversity To protect wildlife from further decimation, the following management measures have to be undertaken by the PAMB or ECAN Board in collaboration with NGOs, community organizations and the private sector such as the tourism organization:
1) information, education, communication and advocacy campaigns with special focus on communities located near faunal core zone areas;
2) monitoring, surveillance and enforcement of environmental laws and
regulations concentrating on areas where endangered species of wildlife are found;
3) provision of alternative livelihoods to communities engaged in hunting
wildlife for food and trade;
4) stock assessment of swiflet’s population, establishment of sustainable yield harvest level of bird’s nest and monitoring of established harvest quota; and
5) imposition of appropriate users’ fees and charges for wildlife traders and bird
nests gatherers;
6) Protecting the rights and livelihood of IPs in the gathering of bird’s nest and assisting them in getting fair market price for their produce.
3.4.2.3 Coastal and Marine Resources Pertinent to the issues and problems identified in the municipality, the following measures are necessary to manage the rich coastal habitats and resources of the area:
1) establishment of marine sanctuaries to protect pristine coral reefs, seagrass and mangroves while at the same time allowing recovery of fishery stocks;
2) promotion of ecotourism activities such as coral diving in suitable sites to
deter illegal fishing in intact coral reef areas and at the same time provide employment for local fishing communities;
3) conduct of surveillance, monitoring, apprehension and prosecution of illegal
fishers with the assistance of deputized local Baywatch volunteers to convey the message that the local government is serious in implementing the laws and its local ordinances;
4) implementation of an integrated CRM plan with the collaboration of NGOs,
local community organizations and the Department of Agriculture (DA) and DENR to curb land-based pollutants such as solid and liquid wastes, sediments and chemicals

_____________________________________________________________________ ECAN ZONES MANAGEMENT PLAN 79
5) undertake coral reef rehabilitation and restoration programs such as coral transplantation and or deployment of suitable artificial reefs in selected areas;
6) establishment of quota system based on sustainable harvest yield and closely
monitor its enforcement to control depletion of groupers traded as live fish;
7) undertake enrichment planting or assisted-natural regeneration in degraded mangrove areas and reforestation in logged-over areas;
8) delineation and allocation of mangrove areas for community-based
management where people can gather thinnings for fuelwood and poles;
9) development of grassland and brushland into plantation forest to serve as source of fuelwood and housing materials for coastal communities;
10) identification of suitable forest areas for communal forestry to meet the wood
requirements of upland dwellers and to avoid cutting of trees in protected areas;
11) identification of suitable areas for issuance of tenurial instruments or property
rights for community-based forest management, and expand this to include coral reef management and caves resources management, wherein IPs and bonafide residents of El Nido will be given usufructuary rights and management responsibilities;
12) conduct of IEC on the importance and on the ways of protecting marine
mammals and sea turtles;
13) strict monitoring and apprehension of poachers of sea turtle eggs, Dugong and other endangered marine mammals;
14) promotion of ecotourism activities such as whale, dolphin and dugong
watching to generate interest and funds to protect them and for the local communities to appreciate their importance and value as a tourist attraction.
The foregoing management measures shall be incorporated in the management plan for ECAN zoning in the municipality to ensure that the requirement to protect the fragile environments of the locality is balanced with the proper utilization of its resources for the improvement of the socioeconomic status of the communities.
3.4.3 Current Management Efforts in the Implementation of Environment and Natural Resources Management Programs
3.4.3.1 Enforcement of Environmental Laws
In the consultation and validation workshops conducted by the Institutional Capacity Building Team of the ECAN Zoning Project, they noted that the LGU is aware of and

_____________________________________________________________________ ECAN ZONES MANAGEMENT PLAN 80
enforcing ten (10) major national and four (4) local laws and policies to protect and conserve the environment and natural resources. These laws and regulations were evaluated and rated by the workshop participants based on their perception of the effectiveness of their implementation by the LGUs. Table 42 lists the national and local environmental laws and regulations currently being enforced by the LGU and their corresponding rating based on a scale of 1 to 10 with 10 being the highest level of effectiveness of implementation. The evaluation results show that three of the national laws and two of the local laws were being implemented with high level of effectiveness (rating of 7 and above) while six national and 2 local laws are poorly implemented (rating of 5 and below). Table 42. Effectiveness Rating of National and Local Environmental Laws Being
Enforced in El Nido Municipality
Environmental Laws and Regulation Rating National Environmental Laws and Regulation
Philippine Forestry Code of the Philippines (PD 705). 7 National Integrated protected Area System or NIPAS ACT (RA 7586) 8 National Cave and Cave Resources Management and Protection Act (RA 9072).
2
Philippine Fisheries Code (RA 8550) 3 Environmental Impact Statement System (PD 1586) with Implementing Rules and Regulations (DAO 96-37) and Supplemented by DAO 97-18 for Environmental Compliance Certificate)
4
Indigenous Peoples Rights Act (RA 8371) 4 Delineation of Municipal Waters (DENR Administrative Order No. 17); Marine Reserve (DENR DAO 14)
5
Provincial Strategic Environmental Plan for Palawan (RA 7611) 7 Declaring Palawan as Mangrove Forest Reserve (PD 2152). 5 Wildlife Resources Conservation and Protection Act (RA 9147) 6
Local Environmental Laws and Regulations Provincial Ordinance on the Live Fish Ban 8 Municipal Fishery Ordinance 8 Ecological Waste Management Ordinance 5 Anti-littering Ordinance 5 Source of data: ECAN Zoning Project, Institutional Capacity Assessment, 2004 Rating Scale: 10 being the highest in terms of the level of effectiveness of implementation.
3.4.3.2 Collaboration with Partner Organizations in the Implementation of Environmental Management Programs
There are several organizations that assist the LGU in the implementation of environment and natural resources management programs in the locality. These organizations include the DENR, DA, DILG, NGOs, the private sector and local community organizations.

_____________________________________________________________________ ECAN ZONES MANAGEMENT PLAN 81
Since El Nido is a proclaimed marine protected area, a Protected Area Management Board (PAMB) was created in 1998 by virtue of Presidential Proclamation No. 32 to oversee the development and undertake environment-related initiatives in the area according to the resource management framework established by its predecessor, the El Nido Marine Reserve (ENMR) Management Board. The proclamation covers all 18 barangays of the municipality. The PAMB is jointly chaired by the DENR and PCSDS and composed of representatives from LGU (every barangay in the municipality), concerned government agencies, IPs, NGOs and local business organizations with the Protected Area Superintendent (PASu) serving as the secretariat. The PAMB is expected to continue the work started by its predecessor in managing the Marine Protected Areas of El Nido. The conservation efforts of the ENMR focused on 12 barangays facing Bacuit Bay which started in 1989. One of its concrete accomplishments was banning the gathering, transporting and introduction of exotic vegetation to preserve the biological diversity of El Nido. Forest products such as rattan, nito and mangroves were protected from commercial utilization, effectively making handicraft making incompatible with conservation efforts. The use of wood in housing construction was also discouraged to prevent the cutting of old growth trees, particularly in the watershed areas. Destructive fishing methods were strictly prohibited, a measure that has resulted in sustaining the reproduction and yield of fishes and other marine products. The ENMR also implemented research and pilot projects on mariculture, which included the growing of oysters, mussels, squids, sea cucumbers, groupers and seaweeds, to offer alternative sources of livelihood and lessen the economic reliance of the local community on limited and fragile marine-based resources. In August 2000, the General Management Plan for the El Nido-Taytay Managed Resource Protected Area was prepared under the National Protected Areas Program (NIPAP) of the DENR which was supported by the European Union. The Plan was intended for implementation for the period 2000-2004 but many of its proposed activities did not fully materialize or take off the ground until now (2006). The implementation of the Plan is expected to be spearheaded and sustained by the PAMB but the lack of personnel, material and financial resources prevented it from undertaking many projects and activities requiring substantial amount of investments. Nonetheless, the proposed activities under the Plan remain valid and can still be implemented in the future as resources become available. Several resolutions were passed by the PAMB from 1998 to 2004 to sustain previous initiatives and to introduce measures that would further improve its management of the protected areas in El Nido. During the implementation of the NIPAP, the PAMB was reported to have conducted the following activities: capacity building for PAMB members and local communities, law enforcement, training and deputizing of community rangers, IEC, planning, turtle management, construction of the office of the Protected Area Staff, and trail construction of one marine and one island trail.

_____________________________________________________________________ ECAN ZONES MANAGEMENT PLAN 82
There are presently national agencies providing assistance to the LGU of El Nido in the planning and implementation of environmental laws and the guidance of sound practices in environmental management. These agencies and their functions are briefly enumerated below.
1) DENR – NIPAP (PAO). Functions: Helps in the formulation of General Management Plan (GMP); Promotes and establishes CBFM projects with LGU participation; Provides technical support assistance to LGU; Provides support in the implementation of environmental protection and conservation activities in the Protected Areas (monitoring, enforcement, trainings for forest rangers, fish warden).
2) PCSD. Functions: Provides assistance in the formulation and implementation
of ECAN Zones; Serves as co-chair in PAMB; and performs the same functions as the DENR.
3) KKP/WWF (NGO). Functions: Serves as members of the PA-TWG and
enhances the formulation of the CLWUP; Provides technical support for training and livelihood assistance to the community level. It is undertaking a 2-year project called “Anti-Marine Degradation Program” focusing on monitoring and enforcement on coastal areas. Eight (8) WWF staff and office equipment will be supplied by WWF to El Nido under this project.
4) EL NIDO FOUNDATION INC (NGO). Provides technical support for
training and enterprise development program to the community level; serves as a regular member of the PAMB and the ECAN Zoning TWG and assists in the formulation of the CLWUP. Part of its outreach and IEC programs include festivals, e.g., “Kulambo Festival”, held annually in December. Health services in malaria control, family planning are integrated into coastal resource management undertaken by the Foundation.
5) TEN KNOTS DEVELOPMENT CORPORATION. Functions: Member of
the PAMB and ECAN Zoning-TWG; assists in the formulation of the CLUWP included in the business sector; chairs the Municipal Tourism Council; serves as an active member of CCRAEN.
6) DILG. Functions: IEC, monitoring and evaluation of solid waste
management; Implements the Clean and Green program; Implements the “Best LGU’s” and inland body water program.
7) Liga ng Mga Barangay has started a program of clustering 3-5 barangay to
contribute funds to pool resources for monitoring and law enforcement.
8) LGU-MAO. Monitoring and enforcement of Municipal fishery code/other illegal activities; Strengthening of B-FARMC’s and M-FARMC’s; Promotion of proper farming system on high value crops; Provides and extends environment friendly livelihood projects.

_____________________________________________________________________ ECAN ZONES MANAGEMENT PLAN 83
9) DENR-PAO. Implementation of protected area policies as stipulated in NIPAS Act and the General Management Plan; Preservation and conservation of forest and marine resources; Member of the TWG of CLWUP.
3.4.3.3 Capability Building Support
Several representatives from the LGU of El Nido and their partner organizations have been given the opportunity to attend training programs on environmental planning and management to develop their technical and managerial capabilities. These training programs were identified and rated according to their effectiveness during the consultation workshop conducted by the ECAN Zoning Project. The results are summarized in Table 43.
Table 43. Effectiveness of Training Programs Attended by LGU Personnel and Representatives from Partner Organizations
Training program Sponsor and
Date
Participants Effectiveness
Rating Training on Fish Warden and Forest Warden Deputation
WWF and NIPAP in 2000-2001
MAO, Barangay officials and Barangay Fisheries Aquatic Resource Management Council (BFARMC’s).
8
Fire Prevention and Control NIPAP and NGO PA Rangers, NGO’s, MAO 8 Paralegal Training for Fishery and Forest Officers
WWF and NIPAP PA Rangers NGO’s, MAO & Barangay officials, BFARMC’s
8
BMS Training NIPAP and PAMB in 2000
PA Rangers, PAO staff, NGO’s, LGU’s Barangay officials & BFARMC’s
8
Ecological Solid Waste Management
NIPAP in 2001 Participants: PA Rangers NGO’s, LGU’s Barangay officials
No rating
NIPAS Training (Strengthening of Capability of Integrated Protected Area Stakeholders)
NIPAP in 2000 PAMB Members No rating
3-D Modeling Training NIPAP in 1999 PA rangers, NGO’s & Barangay officials
7
Capability Building Training
NIPAP in 2002 PA rangers, PO & Barangay officials.
No rating
Integrated Protected Area Fund (IPAF) Training
NIPAP in 2002 PAMB members, PO, NGOs, Barangay officials, and other stakeholders
No rating
SCUBA Diving Training NIPAP in 1998 PA Rangers
No rating
Source of data: ECAN Zoning Project, Institutional Capacity Assessment, 2004 Rating Scale: 10 being the highest in terms of the level of effectiveness of implementation. All of the foregoing trainings were conducted under the NIPAP project from 1998 to 2002 to enhance the capability of the Protected Area Office (PAO) staff, municipal

_____________________________________________________________________ ECAN ZONES MANAGEMENT PLAN 84
and barangay officials, NGOs and PAMB members, among others, in implementing the management programs of the El Nido Protected Areas.
3.4.3.4 Financial Support During the last fiver years (1998-2002), the budget allocated by the LGU for environmental management programs comprise an average of 2.5% of its total budget (Table 44). This amount is low and should be increased to about 10% considering the importance of maintaining the environmental quality of El Nido in which many local residents and business establishments especially tourism resorts depend for economic growth. The LGU can easily raise its revenues by reforming it taxation schemes such as increasing the amount of user fees and charges, business permits, waste disposal fees, etc. With higher tax collection from tourism establishments, tourists, and commercial businesses extracting natural resources, the municipality can increase its funds for environmental management. Table 44 shows that the total LGU budget tapered down from 2000 to 2002 with an incremental amount of less than one million pesos. During the same period, the percent share of the environment budget to total LGU budget grew by less that one percent.
Table 44. Budget Allocated for Environmental Management (1998-2002), El
Nido Municipality
Year
Environmental
Management Programs
Budget (Pesos)
Total LGU Budget
% Share of Environment
to Total Budget
Total for Environment Programs
800,000.00 32,709,313.66 2.44
Oplan Linis Program 400,000.00 1.21
1998
Poblacion Drainage Canal
400,000.00 1.21
Total for Environment Programs
94,404.00 40,388,767.00 0.24
Bantay Dagat Program 64,404.00 0.16
1999
Toilet (Bgy. Maligaya) 30,000.00 0.08 Total for Environment Programs
1,302,600.00 50,659,628.06
2.57
Construction and Rehabilitation of Poblacion Drainage Canal
500,000.00 0.99
Oplan Linis Program 550,000.00 1.09 Clean and Green Program
60,000.00 0.12
Proposed Dumpsite 100,000.00 0.20
2000
Bantay Dagat Program 92,600.00 0.19

_____________________________________________________________________ ECAN ZONES MANAGEMENT PLAN 85
Year
Environmental
Management Programs
Budget (Pesos)
Total LGU Budget
% Share of Environment
to Total Budget
Total for Environment Programs
1,607,495.00 51,129,918.00 3.14
Oplan Linis Program 907,495.00 1.78 Poblacion Drainage Canal
500,000.00 0.97
Improvement of Dumpsite
150,000.00 0.30
2001
Bantay Dagat Program
50,000.00 0.10
Total for Environment Programs
1,804.812.00 51,907,978.00 3.47
Oplan Linis Program 904,812.00 1.75 Poblacion Drainage Canal
500,000.00 0.97
Clean & Green Program
150,000.00 0.29
2002
Reinforcement of Bantay Dagat
50,000.00 0.10
Improvement and Maintenance of Dumpsite
100,000.00 0.20
Environmental Protection (Sibaltan)
50,000.00 0.10
Aid to NIPAP (Environmental Aspect)
50,000.00 0.10
1998-2002
Grand Total 5,609,311.00 226,795,604.00 2.47
Source of data: Municipality of El Nido, 2004
3.4.4 Gaps and Constraints in Current Management Efforts The gaps and constraints in the current efforts of the LGU to manage its environment and natural resources are classified into two general categories: 1) institutional capacity to implement environmental policies and programs; and 2) technical capability of LGU staff and partner organizations in implementing their mandates on environmental management.
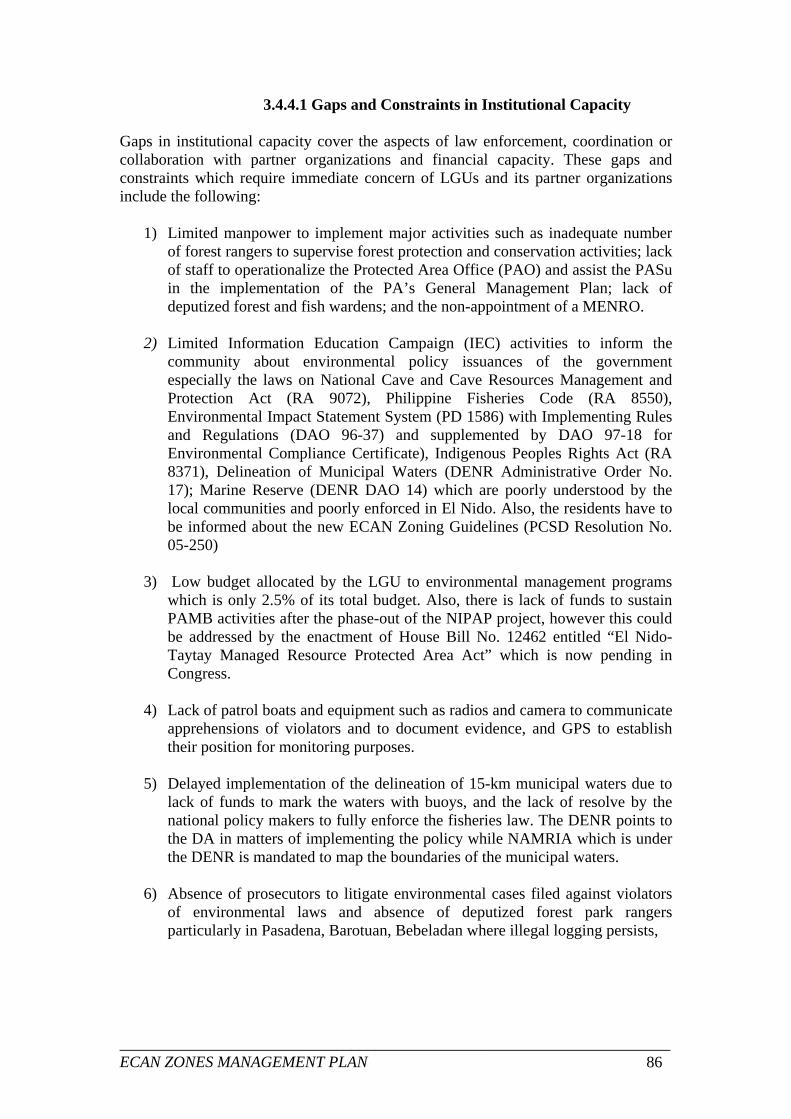
_____________________________________________________________________ ECAN ZONES MANAGEMENT PLAN 86
3.4.4.1 Gaps and Constraints in Institutional Capacity Gaps in institutional capacity cover the aspects of law enforcement, coordination or collaboration with partner organizations and financial capacity. These gaps and constraints which require immediate concern of LGUs and its partner organizations include the following:
1) Limited manpower to implement major activities such as inadequate number of forest rangers to supervise forest protection and conservation activities; lack of staff to operationalize the Protected Area Office (PAO) and assist the PASu in the implementation of the PA’s General Management Plan; lack of deputized forest and fish wardens; and the non-appointment of a MENRO.
2) Limited Information Education Campaign (IEC) activities to inform the
community about environmental policy issuances of the government especially the laws on National Cave and Cave Resources Management and Protection Act (RA 9072), Philippine Fisheries Code (RA 8550), Environmental Impact Statement System (PD 1586) with Implementing Rules and Regulations (DAO 96-37) and supplemented by DAO 97-18 for Environmental Compliance Certificate), Indigenous Peoples Rights Act (RA 8371), Delineation of Municipal Waters (DENR Administrative Order No. 17); Marine Reserve (DENR DAO 14) which are poorly understood by the local communities and poorly enforced in El Nido. Also, the residents have to be informed about the new ECAN Zoning Guidelines (PCSD Resolution No. 05-250)
3) Low budget allocated by the LGU to environmental management programs
which is only 2.5% of its total budget. Also, there is lack of funds to sustain PAMB activities after the phase-out of the NIPAP project, however this could be addressed by the enactment of House Bill No. 12462 entitled “El Nido-Taytay Managed Resource Protected Area Act” which is now pending in Congress.
4) Lack of patrol boats and equipment such as radios and camera to communicate
apprehensions of violators and to document evidence, and GPS to establish their position for monitoring purposes.
5) Delayed implementation of the delineation of 15-km municipal waters due to
lack of funds to mark the waters with buoys, and the lack of resolve by the national policy makers to fully enforce the fisheries law. The DENR points to the DA in matters of implementing the policy while NAMRIA which is under the DENR is mandated to map the boundaries of the municipal waters.
6) Absence of prosecutors to litigate environmental cases filed against violators
of environmental laws and absence of deputized forest park rangers particularly in Pasadena, Barotuan, Bebeladan where illegal logging persists,

_____________________________________________________________________ ECAN ZONES MANAGEMENT PLAN 87
3.4.4.2 Gaps and Constraints in Technical and Managerial Capability
The technical and managerial capabilities of the LGU and their partner organizations are still weak and inadequate in certain areas of environmental management. Based on the consultation workshops conducted by the ECAN Zoning Project, the LGU and their partner organizations still need training on the following:
1) Deputation Training on fish warden and SDENRO’s of selected Barangays
officials & Barangay Fisheries Aquatic Resource Management Council (BFARMC’s);
2) Paralegal Training of deputized fish and forest wardens;
3) Coastal Resource Planning and Management Training
4) Water Quality Monitoring Training
5) GPS and GIS Training
6) Environmental Impact Assessment Training
7) ECAN Zones Management Training
3.5 ECAN Zones of El Nido
3.5.1 Criteria and Guidelines for Delineation of ECAN Zones The Strategic Environmental Plan (SEP) for Palawan as embodied in Republic Act 7611 serves as the comprehensive framework for the sustainable development of the province. SEP provides for the establishment of the Environmentally Critical Areas Network (ECAN) with ECAN zoning serving as its main strategy. ECAN zoning is a system of protection and development control over the whole province of Palawan to achieve the following objectives of SEP.
• Forest conservation and protection • Protection of watersheds • Preservation of biological diversity • Protection of tribal people and the preservation of their culture • Maintenance of maximum sustainable yield • Protection of rare and endangered species and their habitat • Provision of areas for environmental and ecological research, education and
training • Provision of areas for tourism and recreation

_____________________________________________________________________ ECAN ZONES MANAGEMENT PLAN 88
ECAN Zoning Criteria The criteria for delineating ECAN Zones include a combination of the following:
• Elevation and slope • Type and condition of forest • Type and condition of habitat • Existing use of land • Biodiversity status • Presence of coral reefs and seagrass beds • Presence of endangered species of flora and fauna • Areas contributing to important ecological processes • Areas declared as protected areas
Characteristics of Core zones The following ecological features were applied in mapping the terrestrial and coastal/marine core zones for El Nido: A. Terrestrial core zone
• Steep slopes (>50%) and elevation (>1000 meters) • Primary or old growth forest • Habitats of endangered species of fauna • Declared wildlife sanctuary • Forest ecosystem with high biodiversity and highly threatened by human
activities (biodiversity hotspots) B. Coastal/marine core zone
• Coral cover of >50 percent • Coral cover with high biodiversity • Seagrass beds >50% cover and more than one species • Seagrass beds with Dugong-dugong feeding tracks • Coastal areas with sightings of endangered marine mammals and sea turtles • Nesting sites of sea turtles • All mangrove areas except those with MSA, CBFMA, and ISF • Declared marine protected areas, parks and sanctuaries
3.5.2 Core Zone Delineation of Terrestrial and Coastal/Marine Ecosystems
Based on the criteria established under PCSD Resolution No. 05-250 (Table 45), the terrestrial and coastal/marine environments of El Nido Municipality were delineated and mapped into different types of ECAN Zones. After the initial maps on land/sea cover and ECAN zones were prepared, they were presented to PCSDS and representatives from the LGUs in a technical validation

_____________________________________________________________________ ECAN ZONES MANAGEMENT PLAN 89
workshop. The main objective of the workshop is to validate the data and information generated by the survey and mapping teams of the ECAN Zoning Project. The maps were presented at the scale of 1:50,000. The revised maps were then submitted to PCSDS for further comments and approval prior to validation at the barangay level. The second revised maps were then presented in larger scales (1:25,000) to barangay heads or their representatives in a workshop conducted for validation and comments. This workshop allows scrutiny by barangay representatives of the location and coverage of core zones. They also verified the accuracy of the land/sea cover maps in terms of the consultants’ interpretation of the satellite imageries on the location of primary forest and mangrove forest, in particular. The comments of the barangay representatives were then examined jointly by the consultants and PCSDS counterpart staff to determine their validity and to distinguish “wish list” or desired zoning from rationale or justified zoning in accordance with PCSD criteria. The final map is then produced using agreed cartographic standards of labeling and markings. Table 45. Criteria and Guidelines for ECAN Zones Delineation
ECAN Zone Criteria Terrestrial Ecosystem
Areas above 1000 meters elevation Virgin forest or primary growth forest Areas with steep gradient, above 50% slope Critically threatened/endangered habitats and habitats or rare endangered species or habitat of Palawan local endemic species of flora and fauna
Core Zone
Other areas which may be identified and designated as such by the Council
Buffer Zone Areas with elevation ranging 500-1000 meters Areas with slope ranging 36%-50% Critical watersheds which were identified, classified or declared as such by the government In areas where none of the above criteria apply, a two hundred (200)- meter belt in the mainland and one hundred (100)- meter belt in the islands surrounding the core zone shall apply Poor, stunted and sparse stands of semi-deciduous forest which has a low regeneration capacity
1) Restricted Use Area
Areas designated as biodiversity hotspots and highly threatened by human activities based on scientific studies Areas with elevation ranging 300-500 meters Areas with slope ranging 19%-35%
2) Controlled Use Area
Areas within the criteria of the restricted use zone where there is a community

_____________________________________________________________________ ECAN ZONES MANAGEMENT PLAN 90
ECAN Zone Criteria Areas above 18% slope but below 300 meters elevation subjected earlier to deforestation but are already stabilized or suitable to stable upland farming system Edges of intact forests where traditional land use is already stabilized or is being stabilized Open, brushland or grassland areas that are still classified as timberland or public land with elevation below 300 meters
3) Traditional Use Area
All other areas with elevation below 300 meters Areas classified as Alienable and Disposable lands Areas with slope 18% and below but not exceeding 300 meters in elevation
4) Multiple Use Zone
Built-up or settlement areas located in lowlands (less than 18% slope) Areas proclaimed/declared/issued with CADCs and CALCs Areas proclaimed/declared by PCSD as tribal ancestral zone
Tribal Ancestral Lands/Zones
Areas declared/classified as ancestral lands/domains by other concerned agencies with prior concurrence of the PCSD
Coastal/Marine Ecosystem
Coral reefs with intact resources, good to excellent coral cover condition or 50% - 100% coral cover Coralline sites containing at least 50% of coral genera found in the management unit of live coral cover ranging from 25-50% Seagrass beds serving as link habitat of the coral zones and/or providing habitat to rare, threatened and endemic species Seagrass beds with at least 50% cover of more than one species of seagrass Seagrass beds with sightings or signs of Dugong dugon feeding tracks Coastal/marine habitats of endangered species declared by IUCN or CITES, DA or DENR or the PCSD Primary growth mangrove areas which serve as protection against storm erosion, flood and other similar hazards; primary growth mangroves regardless of location, for maintenance of ecological balance, protection against riverbank erosion, wildlife sanctuaries and used for educational research purposes; and all areas with standing mangrove forest cover except areas allocated for MSA, CBMFMA, ISF and FLA
Core Zone
Areas identified/declared by PCSD, Bureau of Fisheries and Aquatic Resources (BFAR) or under local government zoning ordinance as fish sanctuaries, spawning areas, nursery areas, breeding/feeding grounds, etc.
Coastal/Marine Multiple Use Zone
1) Transition (Buffer) Zone
Uninhabited islands or undeveloped portions thereof not subject to private rights shall be classified as transition zone except when identified/declared as ancestral coastal/marine waters

_____________________________________________________________________ ECAN ZONES MANAGEMENT PLAN 91
ECAN Zone Criteria Uninhabited islands or islets with an area of less than 500 hectares Degraded small islands with an area of less than 500 hectares Released areas for fishpond development which were utilized and abandoned including those not utilized for 5 years from the date of the release Degraded habitats of endangered marine species Denuded mangrove forest Areas identified as contributing to important ecological processes such as spawning, nursery areas, breeding/feeding grounds that otherwise could have been classified as coastal-marine core zone but during the approval of these guidelines, these areas are occupied or have been released by virtue of existing laws or due to inappropriate management of local coastal marine areas. These areas shall be maintained for their existing use or a phase-out strategy shall be implemented in these areas reverting them to their natural state or for their appropriate uses. No further development, growth or expansion shall be allowed in these areas to encourage habitat enhancement or maintenance of the resource to increase production level or ecosystem maintenance. In areas where none of the above criteria apply, a 50-meter belt surrounding the mangrove core zone and 100-meter belt for other coastal core zones shall be delineated as buffer zone.
2) Sustainable (General) Use Zone
Coastal/marine areas not classified/delineated as core zone, buffer zone and ancestral coastal/marine waters.
3) Ancestral Coastal/Marine Waters
Coastal/marine areas traditionally occupied by ICCs/IPs identified as ancestral waters in consultation with tribal communities concerned and appropriate agencies of the government. These shall be treated in the same zonation system of environmental protection as the other coastal/marine zones considered in these guidelines except, for stronger emphasis in cultural consideration pursuant to the provisions of PCSD Resolution No. 99-147 and subsequent amendment thereto and the IPRA law.
4) Coastal-Marine Waters of Protected Areas
Coastal/marine areas forming part of declared parks and sanctuaries shall be governed by special guidelines to be formulated by PCSD.
Based on PCSD Resolution No. 05-250 3.5.2.1 Forest Resources and Biodiversity
Proposed Core Zone Using the criteria established by the PCSD, the recommended core zones for El Nido are the forest cover in the mountains of the municipality located 200 masl and above.

_____________________________________________________________________ ECAN ZONES MANAGEMENT PLAN 92
It was observed by the survey team that kaingin plots were limited to elevations within 150 to 200 masl. Such situation contributes to the preservation of the intact forests found in higher altitudes. Because of this, forest cover above this elevation remains relatively intact. Forest found in barangay Manlag was pristine and seems to be untouched. Therefore areas suitable for core zone delineation are found in forest areas above 200 masl. Figure 22 shows the rough location of the core zones in El Nido. The figure for Cadlao island is too small to indicate the core zone; however, as recommended, the forested areas of Cadlao island should also be declared as core zone. Moreover, all pristine island ecosystems are recommended as core zones. Island ecosystems in the municipality which have no occupants have intact forest cover and harbor endemic and endangered species of flora and fauna. They are potential areas for core zone delineation. Likewise, the unique ecosystems found in El Nido such as the vegetation over limestone can be declared as core zones. 3.5.2.2 Wildlife Resources Proposed Core Zones The location and distribution of ecologically important species of fauna (e.g., rare, threatened, endangered and endemic species) in El Nido, Northern Palawan is shown in Figure 22.
Identification and delineation of core zones for fauna habitat protection were based on the analyses and interpretation of the primary and secondary data generated from the field work of the Fauna survey and research team of the ECAN Zoning Project, and in compliance with the revised PCSD guidelines for delineating ECAN Zones. The parameters used in core zone delineation include: fauna species composition, distribution, ecological roles and values, biodiversity indices (e.g., species diversity and species richness) and other functional attributes whenever appropriate. Given the above criteria and parameters, four (4) areas, namely Mt. Nagbaklaw range in barangay Pasadena, Mt. Ynantagung range in barangay Libertad, Mt. Cabengkukay range in barangay Bagong Bayan and Mt. Pita range in barangay Bebeladan are candidate sites for core zones. 3.5.2.3 Coastal and Marine Resources Proposed Core Zones for Coral reefs Using coral cover in identifying and delineating areas for core zoning, the Marine survey team selected the following as potential core zones: Cadlao islands, Pinasil island, Daracotan island, Talawtawan island, Teneguiban shoal and Cabugao island. These islands have coral cover that is close to 50% and needs to be protected. On the other hand, Tapiutan island which has a low cover is also proposed for core zoning because it harbors coral species that are uncommon and perhaps unique.

_____________________________________________________________________ ECAN ZONES MANAGEMENT PLAN 93
Figure 22. Proposed Flora and Fauna

_____________________________________________________________________ ECAN ZONES MANAGEMENT PLAN 94
Table 46 shows the location of coral reef areas proposed for core zones. Figure 23 provides the map showing the different locations of proposed core zone areas for coral reefs, reef fish, and seagrass in El Nido. Core zones for reef fish and seagrass were identified using the criteria and guidelines of the PCSD. Table 46. Proposed Coral Reef Core Zones in El Nido Municipality
Site Name N-Latitude
E-Longitude Criteria
Pinasil Island 11.071660 11.071660 Diversity >50%, Hard corals >40%
Tapiutan Island 11.203527 11.203527 Acrhelia horrescens which is uncommon
Cadlao Island 11.202904 11.202904 Diversity >50%, Hard corals >50% Tiniguiban Reef 11.350871 11.350871 Diversity >50% Tiniguiban Shoal 11.357009 11.357009 Hard corals >50%, recovering Daracotan Island 11.363650 11.363650 Diversity >50%, Hard corals >40% Talawtawan Island 11.164889 11.164889 Hard corals >40% Cabugao Island 11.127528 11.127528 Hard corals >40% Proposed Core Zones for Reef Fish Based on the combined results of the surveys conducted by the ECAN Marine team in 2003 and MERF in 1993, six locations are recommended for core zoning because of their high species richness. These locations as shown in Figure 23 (Reef fish Core Zones in square magenta-colored symbol) are as follows: Bebeladan, Cadlao, Daracotan, Tapiutan, Inambuyod and Tres Marias. These areas also harbor some of the highest abundance of indicator and target species. Proposed Core Zones for Seagrass Based on the combination of ecological characters (relatively high bottom cover, seagrass diversity), habitat use to a suite of animals (fish, large mammals, turtles), and/or the occurrence of rarely occurring seagrass species, the following three areas are rated as high priority for core zoning: Sibaltan, Corong-Corong, and Bebeladan. Other potential areas for core zoning include: San Fernando, Teneguiban, Villa Paz, Lalutaya island, and Maligaya (See Figure 23; Seagrass Core Zone in round green-colored symbol). Core Zone for Mangrove Based on the SEP Law and PCSD ECAN Zoning guidelines (PCSD Resolution 05-250), all mangrove areas are classified as core zone except those which have been allocated for community-based forest management such as CBFM, MSA, ISF and FLA. In view of this legal mandate, the mangrove areas potential for core zonation are shown in Figure 24.
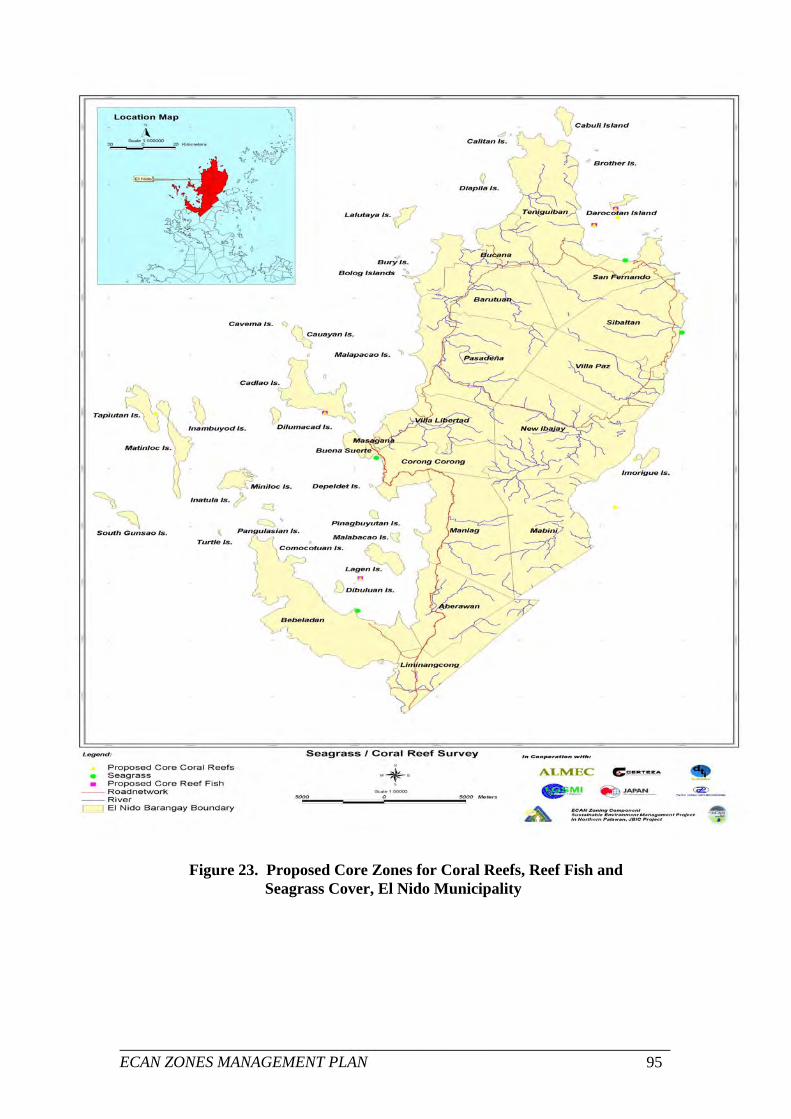
_____________________________________________________________________ ECAN ZONES MANAGEMENT PLAN 95
Figure 23. Proposed Core Zones for Coral Reefs, Reef Fish and Seagrass Cover, El Nido Municipality

_____________________________________________________________________ ECAN ZONES MANAGEMENT PLAN 96
Figure 24. Mangrove Forest, El Nido Municipality

_____________________________________________________________________ ECAN ZONES MANAGEMENT PLAN 97
3.5.3 Municipal Breakdown of ECAN Zones Employing the Sustainable Development Model in ECAN Zoning mapping, Table 47 shows the breakdown of ECAN zones in El Nido. Core zone areas comprise the biggest portion (30.68%) of the total land area of the municipality (Table 47). Traditional use areas occupy almost the same size as that of the core zones. The municipality has about 21.62% of its total land area or 11,905 hectares delineated as multiple use zone. Only a small part (1.76%) of the municipality is delineated as controlled use area where regulated extraction may be allowed. When the total land area in terms of strict protection is accounted for, the combined area of the core zone and the restricted use zone makes up almost half (45.92%) of the total area of the municipality. Figure 25 shows the ECAN Zones Map of El Nido Municipality. Table 47. ECAN Zones, El Nido Municipality
ECAN Zone Area (Hectares) % of Total Core Zone 16,889.92 30.68 Restricted Use Area 8,390.49 15.24 Controlled Use Area 967.86 1.76 Traditional Use Zone 16,904.05 30.70 Multiple Use Zone 11,905.02 21.62 Grand Total 55,057.34 100.00
3.5.3.1 Barangay Breakdown of ECAN Zones Tables 48 shows the breakdown of the ECAN zones classes by barangays. The table tell us the following important information which is useful for planning and management of the ECAN zones:
1) A large part of the core zone areas is in barangays Bebeladan (15.13%), New Ibajay (9.79%) and Manlag (4.03%) comprising a combined total of 28.95% of municipality’s total area of core zones and therefore investments to protect the fragile ecosystems in these localities should be prioritized. On the other hand, barangay Masagana has no core zone area while barangays Maligaya, Bucana, Buena Suerte, Teniguiban and Barotuan have very small area of core zone (less than 2% of the total core zone of El Nido).
2) Barangays having the largest areas delineated as multiple use zones include
barangays Bagong Bayan (10.64%), Teneguiban (9.94%), Bucana (9.77%), New Ibajay (9.48%), Barutuan (8.70%) and Sibaltan (7.98%) comprising a combined total of about 56.51% of the municipality’s total area for multiple use zones. These are the barangays with available lands for human settlements and agriculture development. Barangays with very small area of less than 2% of the total area of multiple use zone include: Buena Suerte (0.10%), Maligaya (0.25%) and Masagana (0.78%).

_____________________________________________________________________ ECAN ZONES MANAGEMENT PLAN 98
3) The area distribution of the other ECAN zones such as restricted use, traditional use and controlled use are given in Table 48. Barangays Teniguiban (23.09%), Pasadena (21.27%) and Bucana (19.98%) have the largest areas of land delineated as controlled use zone and where extraction of natural resources may be allowed. Barangays Teniguiban (15.16%) and New Ibajay (14.76%) top the list for traditional use areas while barangays Pasadena (20.61%), and Bebeladan (11.98%) have large areas under restricted use zone.
4) Out of the 35 small islands and islets that were mapped, 12 islands as follows
(Table 49) have their total land area delineated as core zones: Bolog, Calitan, Caverna, Comocutan, Diapila, Entalula, Inambuyod, Inatula, Maatag, Malapacao, Tagbao and Turtle. Moreover, the following islands have more than 90% of their total land area delineated as core zone: Cauayan (96%), Inabayatan (91%), Lagen (90%), Matinloc (92%), Miniloc (99%), Piocoton (92%) and Tapiutan (98%).
5) Multiple use zones have been delineated in the following islands because of
the presence of human settlements (housing and tourism resort) and agriculture (Table 49): Cadlao, Daracotan, Dilumacad, Lagen, Lalutaya, Malpacao, Matinloc, North and South Guntao and Tapiutan.
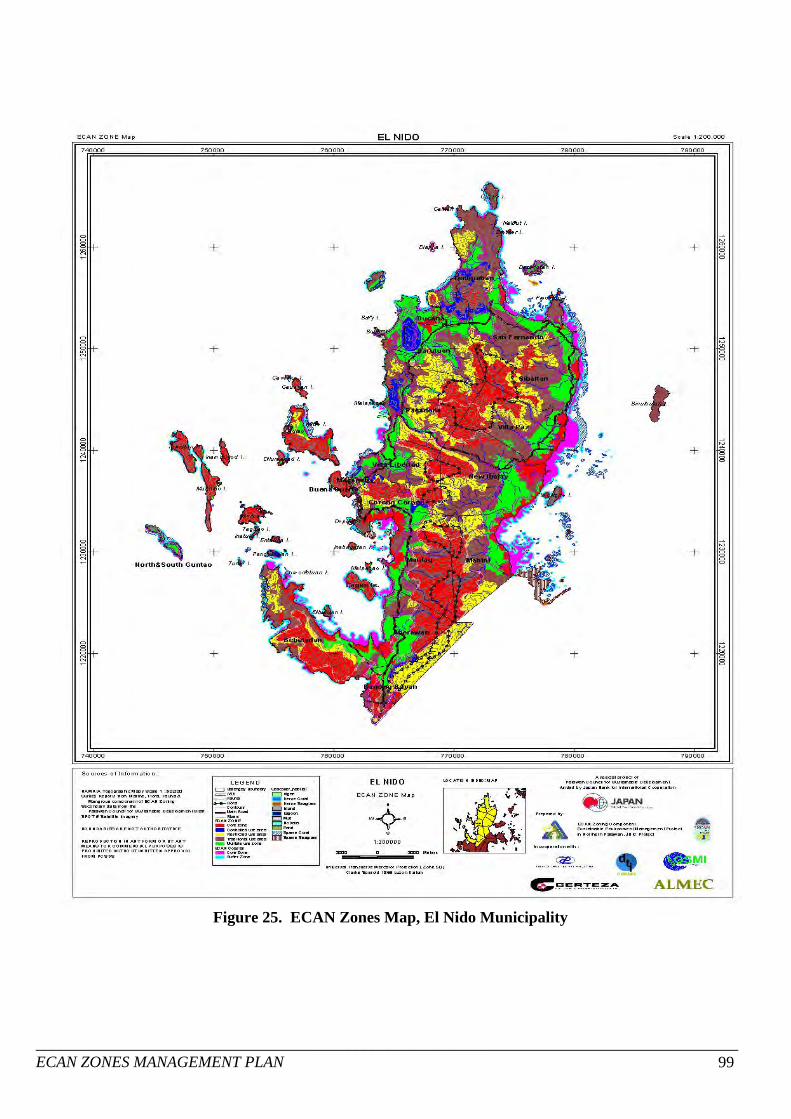
________________________________________________________________________________________ ECAN ZONES MANAGEMENT PLAN 99
Barangays Core Zone Controlled Restricted Traditional Multiple Total
Aberawan 1,093.20 79.82 170.04 704.49 1,266.47 3,314.02Barutuan 228.42 0.01 930.03 652.24 1,035.18 2,845.88Bebeladan 2,555.93 11.99 1,005.01 1,156.63 565.96 5,295.52Bucana 181.25 193.34 154.75 531.03 1,162.54 2,222.91Buena Suerte 192.70 1.80 0.00 0.00 12.04 206.54Corong-corong 904.53 79.17 574.66 226.43 365.49 2,150.28Inambuyod Island 110.11 0.00 0.00 0.00 0.00 110.11Mabini 1,242.19 0.00 349.74 1,617.49 647.06 3,856.48Maligaya 53.54 0.90 0.13 0.00 29.97 84.54Manlag 2,005.98 8.95 50.86 1,544.12 823.54 4,433.45Masagana 0.00 23.33 52.71 12.56 93.16 181.76Matinloc Island 411.45 23.99 0.00 1.80 0.00 437.24New Ibajay 1,653.96 0.01 747.19 2,495.87 1,128.29 6,025.32North Guntao Island 0.00 22.28 0.00 0.00 31.52 53.80Pasadena 1,390.61 205.87 1,729.34 1,107.39 623.01 5,056.22San Fernando 386.70 0.00 371.51 990.73 494.32 2,243.26Sibaltan 952.93 0.01 673.28 1,631.38 950.15 4,207.75South Gunsao Island 0.00 40.28 0.00 0.00 42.66 82.94Tapiutan Island 360.74 0.71 0.00 0.00 0.00 361.45Teneguiban 291.26 223.50 450.65 2,562.60 1,183.94 4,711.95Villa Libertad 1,569.11 51.92 569.28 538.61 827.28 3,556.20Villa Paz 1,305.32 0.00 561.31 1,130.69 622.46 3,619.78
T O T A L 16,889.93 967.88 8,390.49 16,904.06 11,905.04 55,057.40
Figure 25. ECAN Zones Map, El Nido Municipality

___________________________________________________________________________________________________________ ECAN ZONES MANAGEMENT PLAN 100
Table 48. ECAN Zones by Barangay Breakdown, El Nido Municipality
Barangays Core Zone Controlled Restricted Traditional Multiple TOTAL Hectares % Hectares % Hectares % Hectares % Hectares % Hectares %
Aberawan 1,326.042 7.85 0.001 0.00 0.000 0.00 687.942 4.07 366.333 3.08 2,380.32 4.32 Bagong Bayan 1,093.196 6.47 79.819 8.25 170.036 2.03 704.492 4.17 1,266.473 10.64 3,314.02 6.02 Barutuan 228.42 1.35 0.01 0.00 930.03 11.08 652.24 3.86 1,035.18 8.70 2,845.88 5.17 Bebeladan 2,555.93 15.13 11.99 1.24 1,005.01 11.98 1,156.63 6.84 565.96 4.75 5,295.52 9.62 Bucana 181.25 1.07 193.34 19.98 154.75 1.84 531.03 3.14 1,162.54 9.77 2,222.91 4.04 Buena Suerte 192.70 1.14 1.80 0.19 0.00 0.00 0.00 0.00 12.04 0.10 206.54 0.38 Corong-corong 904.53 5.36 79.17 8.18 574.66 6.85 226.43 1.34 365.49 3.07 2,150.28 3.91 Inambuyod Island 110.11 0.65 0.00 0.00 0.00 0.00 0.00 0.00 0.00 0.00 110.11 0.20 Mabini 1,242.19 7.35 0.00 0.00 349.74 4.17 1,617.49 9.57 647.06 5.44 3,856.48 7.00 Maligaya 53.54 0.32 0.90 0.09 0.13 0.00 0.00 0.00 29.97 0.25 84.54 0.15 Manlag 679.940 4.03 8.945 0.92 50.86 0.61 856.176 5.06 457.210 3.84 2,053.13 3.73 Masagana 0.00 0.00 23.33 2.41 52.71 0.63 12.56 0.07 93.16 0.78 181.76 0.33 Matinloc Island 411.45 2.44 23.99 2.48 0.00 0.00 1.80 0.01 0.00 0.00 437.24 0.79 New Ibajay 1,653.96 9.79 0.01 0.00 747.19 8.91 2,495.87 14.76 1,128.29 9.48 6,025.32 10.94 North Guntao Island 0.00 0.00 22.28 2.30 0.00 0.00 0.00 0.00 31.52 0.26 53.80 0.10 Pasadena 1,390.61 8.23 205.87 21.27 1,729.34 20.61 1,107.39 6.55 623.01 5.23 5,056.22 9.18 San Fernando 386.70 2.29 0.00 0.00 371.51 4.43 990.73 5.86 494.32 4.15 2,243.26 4.07 Sibaltan 952.93 5.64 0.01 0.00 673.28 8.02 1,631.38 9.65 950.15 7.98 4,207.75 7.64 South Gunsao Island 0.00 0.00 40.28 4.16 0.00 0.00 0.00 0.00 42.66 0.36 82.94 0.15 Tapiutan Island 360.74 2.14 0.71 0.07 0.00 0.00 0.00 0.00 0.00 0.00 361.45 0.66 Teneguiban 291.26 1.72 223.50 23.09 450.65 5.37 2,562.60 15.16 1,183.94 9.94 4,711.95 8.56 Villa Libertad 1,569.11 9.29 51.92 5.36 569.28 6.78 538.61 3.19 827.28 6.95 3,556.20 6.46 Villa Paz 1,305.32 7.73 0.00 0.00 561.31 6.69 1,130.69 6.69 622.46 5.23 3,619.78 6.57
T O T A L 16,889.93 100.00 967.88 100.00 8,390.49 100.00 16,904.06 100.00 11,905.05 100.00 55,057.40 100.00

__________________________________________________________________________________________ ECAN ZONES MANAGEMENT PLAN 101
Table 49. ECAN Zones by Small Islands and Islets Breakdown, El Nido Municipality
Core Zone Controlled Use
Area Restricted Use
Area Traditional Use
Area Multiple Use
Zone Grand Total
Barangay
Name Hectares % Hectares % Hectares % Hectares % Hectares % Bolog I. 4.37 0.17 0.00 0.00 0.00 0.00 0.00 0.00 0.00 0.00 4.37 Binulbulan I. 0.00 0.00 0.00 0.00 0.00 0.00 283.46 40.05 0.00 0.00 283.46 Brother I. 7.70 0.30 0.00 0.00 0.00 0.00 0.00 0.00 0.00 0.00 7.70 Bury I. 0.74 0.02 0.00 0.00 0.00 0.00 1.32 0.18 0.00 0.00 2.06 Cabuli I. 0.00 0.00 0.00 0.00 7.04 4.76 142.87 20.18 7.83 1.39 157.75 Cadlao I. 759.06 30.29 0.04 0.13 119.68 81.00 0.00 0.00 96.88 17.30 975.66 Calitan I. 11.82 0.47 0.00 0.00 0.00 0.00 0.00 0.00 0.00 0.00 11.82 Cauayan I. 99.38 3.96 0.00 0.00 0.00 0.00 0.00 0.00 3.58 0.63 102.96 Caverna I. 7.71 0.30 0.00 0.00 0.00 0.00 0.00 0.00 0.00 0.00 7.71 Comocutuan I. 1.66 0.06 0.00 0.00 0.00 0.00 0.00 0.00 0.00 0.00 1.66
Darocotan I. 0.00 0.00 0.00 0.00 0.00 0.00 0.00 0.00 169.76 30.32 169.76 Depeldet I. 3.84 0.15 0.00 0.00 0.00 0.00 0.95 0.13 0.00 0.00 4.79 Diapila I. 12.16 0.48 0.00 0.00 0.00 0.00 0.00 0.00 0.00 0.00 12.16 Dibuluan I. 2.35 0.09 0.00 0.00 6.55 4.43 42.51 6.00 0.00 0.00 51.42 Dilumacad I. 47.61 1.90 0.00 0.00 0.00 0.00 0.00 0.00 9.55 1.70 57.16 Entalula I. 29.36 1.17 0.00 0.00 0.00 0.00 0.00 0.00 0.00 0.00 29.36 Imorigue I. 17.47 0.69 0.00 0.00 0.00 0.00 108.43 15.32 0.00 0.00 125.90 Inabayatan I. 32.72 1.30 0.00 0.00 0.00 0.00 0.00 0.00 3.17 0.56 35.89 Inambuyod I. 110.11 4.39 0.00 0.00 0.00 0.00 0.00 0.00 0.00 0.00 110.11 Inatula I. 24.65 0.98 0.00 0.00 0.00 0.00 0.00 0.00 0.00 0.00 24.65 Lagen Is. 274.01 10.93 0.00 0.00 0.00 0.00 0.00 0.00 28.78 5.14 302.79 Lalutaya I. 0.00 0.00 0.00 0.00 14.38 9.73 107.85 15.23 32.65 5.83 154.87 Maatag I. 2.65 0.10 0.00 0.00 0.00 0.00 0.00 0.00 0.00 0.00 2.65 Malapacao I. 2.96 0.11 0.00 0.00 0.00 0.00 0.00 0.00 0.00 0.00 2.96 Malpacao I. 24.64 0.98 0.00 0.00 0.00 0.00 0.00 0.00 7.37 1.31 32.01 Matinloc I. 402.49 16.06 0.00 0.00 0.00 0.00 0.00 0.00 34.74 6.20 437.22 Miniloc I. 246.79 9.84 0.00 0.00 0.00 0.00 0.00 0.00 0.85 0.15 247.64 Mitre I. 0.00 0.00 4.60 15.62 0.00 0.00 0.00 0.00 0.00 0.00 4.60 Nalbut I. 0.00 0.00 0.00 0.00 0.00 1.61 0.22 0.00 0.00 1.61 North&South Guntao 0.44 0.01 0.00 0.00 0.00 0.00 0.00 0.00 158.69 28.34 159.13
Pangulasian I. 0.00 0.00 24.80 84.23 0.00 0.00 17.63 2.49 0.00 0.00 42.43
Piocoton I. 12.50 0.49 0.00 0.00 0.00 0.00 1.07 0.15 0.00 0.00 13.57 Tagbao I. 5.50 0.21 0.00 0.00 0.00 0.00 0.00 0.00 0.00 0.00 5.50 Tapiutan I. 355.54 14.19 0.00 0.00 0.00 0.00 0.00 0.00 5.92 1.05 361.46 Turtle I. 5.26 0.20 0.00 0.00 0.00 0.00 0.00 0.00 0.00 0.00 5.26 Grand Total 2,505.49 100.00 29.44 100.00 147.65 100.00 707.7 100.00 559.77 100.00 3,950.05

_____________________________________________________________________ ECAN ZONES MANAGEMENT PLAN 102
3.5.4 Threats to Core Zones 3.5.4.1 Threats to Terrestrial Core Zones There are various types of threats to identified flora and fauna core zones in El Nido. The most prominent threats stem from the following conditions:
• Classification of steeply sloping lands into A&D lands. • Weak enforcement of forestry and wildlife laws. • Slow/weak prosecution of forest violators. • Inadequacy or lack of alternative jobs or livelihood for majority of rural
people. • Illegal occupancy in forest areas. • Delay in the implementation of the ECAN Zoning in El Nido. • Unclear complementation between the NIPAS Law the SEP Law • Slash-and-burn agriculture even in natural forests. • Rampant hillside farming and wildlife hunting. • Practice of burning of agricultural debris on hillside farms. • Illegal harvesting of forest products especially timber. • Rapid expansion of cashew plantation into secondary forest
3.5.4.2 Threats to Coastal/Marine Core Zones The identification and analysis of threats are important steps in the preparation of management strategies for El Nido. The serious threats that should be considered in the planning and implementation of management programs for the coastal and marine core zones in the municipality of El Nido are as follows:
• Use of destructive fishing methods and inappropriate fishing gears • Encroachment of commercial fishing boats in municipal waters • Organic and chemical pollution coming from tourism resorts, coastal
settlements, agricultural farms • Siltation and sedimentation coming from denuded hills and mountains, road
construction and quarries • Widespread cutting of mangroves by coastal communities • Disturbance of turtle nesting grounds and rampant poaching of turtle eggs • Hunting of Dugong for meat
Barangays most vulnerable to the different kinds of threats to terrestrial and coastal/marine ecosystems are as listed in Table 50.

_____________________________________________________________________ ECAN ZONES MANAGEMENT PLAN 103
Table 50. Types of Threats Affecting Different Barangays of El Nido Municipality
Types of Threat Most Vulnerable Barangays
Rampant illegal logging activities Pasadena, Teniguiban, Bagong bayan, Villa Libertad, Masagana, Manlag and Bebeladan
Illegal occupation of public lands (squatting in upland areas and beaches)
Buena Suerte, Masagana, Maligaya, Corong-Corong & Villa Libertad
Widespread kaingin Teniguiban, Villa Libertad, Masagana, Bagong Bayan
Wildlife poaching (hunting of endangered wildlife such as leopard cats, Palawan peacock-pheasant, Philippine cockatoos, Pangolin, Blue-headed racquet tail and Blue-naped parrots
San Fernando, Villa Paz, Tiniguiban, New Ibajay, Barotuan
Treasure hunting (destruction of the landscape and marine habitats)
Buena Suerte, Corong-corong, Bucana, and Bebeladan
Accelerated soil erosion and siltation of rivers Tinigueban, Sibaltan, Corong- corong (Bobolongan, Logadia), Masagana and Buena Suerte
Rampant mangrove cutting for fuelwood, charcoal-making , pole and timber for housing materials.
New Ibajay, Bucana, Sitio Bubulongan, Barangay Corong-corong, Bagumbayan, Cataban, Sitios Vigan and Kiminawit (Barangay Bebeladan), & Villa Paz
Illegal fishing Teniguiban, Mabini, Villa Paz, Bucana, Bebeladan, San Fernando, Manlag, Bagong Bayan, Corong-corong, Buena Suerte, Masagana
Illegal quarrying activities Manlag, Aberawan, Pasadenia Bulalacao and Lamoro), and Barutuan
3.5.5 Management Strategies for ECAN Zones
The various threats to the ECAN Zones can be prevented or minimized by adopting the following general management strategies:
• Protection and preservation • Restoration • Rehabilitation • Reclamation or conversion to other uses • Conservation and sustainable use • Conflict resolution
3.5.5.1 ECAN Zones for Protection and Preservation
Areas for protection and preservation are highly restricted to human activities. They include:
• Primary/closed canopy forest • Intact and closed canopy secondary growth forest • Old growth mangrove forest

_____________________________________________________________________ ECAN ZONES MANAGEMENT PLAN 104
• Limestone/karst forest • Habitat of endangered flora and fauna • Biodiversity hotspots (flora, fauna, coral reefs, seagrass, reef fish, marine
mammals, and sea turtles)
3.5.5.2 ECAN Zones for Restoration
Areas for restoration are reverted back to core zones, strict protection zone, controlled use zone or multiple use zone depending on the ecological features of the area being restored.
• Areas with slope of 18- 50% with marginal or no forest • Areas with slope above 50% with marginal or no forest cover • Mangrove areas with idle and abandoned fishponds • Degraded habitat of endangered fauna and marine mammals/sea turtles
3.5.5.3 ECAN Zones for Rehabilitation
Areas for rehabilitation are those ecosystems which are degraded or denuded or polluted and require intervention such as reforestation or replanting or adoption of pollution control measures.
• Denuded watersheds • Denuded mangrove areas • Brushlands (>18% slope) • Denuded forest lands (>18% forest land without forest cover) • Grasslands (>18% slope) • Denuded seagrass beds (<31% cover or sparse seagrass beds) • Degraded coral reefs (<50% live cover) • Degraded kaingin areas or marginal upland agriculture areas (>18% slope) • Polluted and silted coastal waters
3.5.5.4 ECAN Zones for Reclamation or Conversion to Other Uses
Areas for reclamation are less productive ecosystems which existing land uses are irreversible, and will involve costly restoration, and are therefore best suited for conversion into other uses.
• Grasslands (0-18% slope) • Brushlands (0-18% slope) • Agricultural lands (poor soil fertility or with problem soils)

_____________________________________________________________________ ECAN ZONES MANAGEMENT PLAN 105
3.5.5.5 ECAN Zones for Conservation and Sustainable Use
Areas for conservation and sustainable use are those where human activities are allowed.
• Controlled use zone • Traditional use zone • Multiple use zone • Community-based forest plantation where controlled logging is allowed • Areas where responsible mining projects are allowed • Areas where agroforestry uses exist • Communal fishing grounds • Tourism development areas (diving sites, terrestrial and marine nature parks) • Areas for settlements (built-up areas and infrastructures) • Lowland agriculture and pasture areas • Aquaculture and mariculture areas
3.5.5.6 ECAN Zones for Conflict Resolution
Areas for conflict resolution are those which current or proposed uses under approved CLUPs conflict with ECAN zoning. Resolution may involve any or a combination of the following: a) consultation and negotiation, b) adjudication in court, and c) establishment of use management or restricted uses (management guidelines for allowable and prohibited uses). Land use situations requiring conflict resolution are as follows:
• Built-up areas within core zones or restricted use zones • CADTs within core zones or restricted use zones • A&D lands within core zones • Titled small islands or small islands for construction of tourism facilities • Settlements within protected areas (NIPAS) or core zone • Communal forest within core zone • Agriculture and urban development in unclassified public forest land • Tourism activities within marine core zones • Infrastructures (roads, power plants) within core zones • Mining within protected areas (NIPAS) or core zone • Fishpond in mangrove areas • Urban development within Network of Protected Areas for Agriculture and
Agro-industrial Development (NPAAD)
Table 51 summarizes the threats to core zones and the management measures to deal with them.

_____________________________________________________________________ ECAN ZONES MANAGEMENT PLAN 106
Table 51. Management Measures for Core Zones Core Zones Types of Threats Management Measures*
Flora Biodiversity Hotspots
-Encroachment of human settlements -Illegal logging -Forest clearing for kaingin and cashew plantation -Fragmentation due to road construction -Grassland fires -Destructive methods of gathering of minor forest products -Mining and infrastructure development -Opening of roads
-Land use planning and zoning -Monitoring and enforcement of zoning and environmental laws -Introduction of agroforestry plots to replace kaingin -Charging of heavy user fees to illegal cashew plantation -Proper siting of mining and infrastructure development projects (roads and power plants) -Strict regulation of minor forest product gathering (almaciga, rattan, etc.) -Fire control barriers -Resettlement of families occupying core zones -Road realignment away from biodiversity hotspots; require adoption of road bank stabilization measures
Habitat of Endangered Species of Fauna
-Encroachment of human settlements -Grassland fires -Hunting and poaching -Intensive gathering of bird’s nests and Tabon eggs -Illegal logging -Forest clearing for kaingin
-Land use planning and zoning -Resettlement of families occupying core zones -Establishment of fire control barriers -Establishment of wildlife sanctuaries through local ordinances -Monitoring and enforcement of laws -Information and education campaigns -Alternative livelihood for hunters and traders -Stock farming of wildlife hunted for food and pet -In-situ and ex-situ conservation breeding -Declare closed season for caves to regulate bird’s nest gathering; establish sustainable yield quota system -Strictly implement wildlife laws and apprehend violators
Old growth forest and closed canopy forest
-Encroachment of human settlements -Illegal logging -Forest clearing for kaingin -Grassland fires -Destructive gathering of minor forest products -Mining and infrastructure development -Opening of roads
-Land use planning and zoning -Marking of core zones on the ground -Resettlement of families occupying core zones -Monitoring and enforcement of laws -Proper siting of mining and infrastructure development projects (roads and power plants) -Strict regulation of minor forest product gathering (almaciga, rattan, etc.) -Road realignment away from old growth forest -Establishment of forest plantation as wood and fuelwood source
Intact coral reefs and Seagrass beds; and Dugong feeding areas
-Cyanide and dynamite fishing -Siltation from denuded watersheds -Pollution from ships, agriculture and households -Rampant gathering of corals, sea horse and abalones -Destruction of corals through anchorage and trampling by divers -
-Zoning and establishment of fish/marine sanctuaries -Monitoring and enforcement of fisheries laws -Apprehension and prosecution of notorious illegal fishers -Establishment of communal property rights over coral reef areas -Transplantation of corals in degraded but critically important reefs such as those declared as marine sanctuaries -Supervised SCUBA diving and designate areas for anchorage -Reforestation of denuded watersheds -Waste management (wastewater treatment) -Solid waste management -Surveillance and regulation of ship waste disposal and chemical/oil spills -Regulation of gathering of corals, sea horse and abalones

_____________________________________________________________________ ECAN ZONES MANAGEMENT PLAN 107
Core Zones Types of Threats Management Measures* -Promotion of aquaculture (fish cage for lapu-lapu culture) away from pristine coral reefs and seagrass beds -Protection of Dugong feeding areas
Habitat of endangered marine mammals and sea turtles
-Intentional and accidental catching of marine mammals and sea turtles -Gathering of eggs -Encroachment of settlements and tourism establishments near nesting areas
-Information and education campaigns about habitats of endangered marine mammals and sea turtles -Alternative livelihood for coastal families located near nesting grounds -Establishment of buffer zone around nesting sites wherein pedestrian passage will be restricted or closed during egg laying and hatching seasons and disallow lighting of public lamp posts during nesting season
-Degradation and pollution of feeding grounds
-Monitoring and enforcement of laws -Zoning and declaration of sea turtles nesting grounds and feeding grounds of Dugong dugon as marine sanctuaries -Proper disposal system for household wastes -Waste treatment facilities for commercial poultry, hog and livestock farms
Mangroves -Cutting of mangroves for timber, pole and charcoal -Clearing for fishponds and house lots -Pollution from solid and liquid wastes from households and agriculture
-Strict monitoring and enforcement of laws -Establishment of tree plantation for coastal population as source of fuelwood and timber -Provision of alternative livelihood such as fish cages, crab fattening, nipa processing, etc. -Proper disposal system for household wastes -Waste treatment facilities for commercial poultry, hog and livestock farms -Resettlement of families occupying mangrove areas delineated as core zones.
Small islands -Encroachment of human settlements (illegal occupation or squatting) -Fake titling -Tourism infrastructure development
-Zoning enforcement (declaring small islands as core zones or restricted zone). -Resettlement of squatters in suitable resettlement sites outside of small islands -Cancellation of fake titles and prosecution of violators -Close monitoring of small islands from illegal occupancy -Regulate establishment of tourism infrastructures and monitor tourism activities in small islands
Declared marine/fish sanctuaries
-Encroachment of fishers -Pollution and siltation
-Patrolling, apprehension and prosecution of violators -Information and education campaigns -Proper disposal of wastes by coastal communities
Protected coastal/marine areas under NIPAS
-Encroachment of fishers -Pollution and siltation -Influx of squatters
-Patrolling, apprehension and prosecution of violators -Information and education campaigns -Proper disposal of wastes by coastal communities -Prevent entry of illegal occupants -Zoning of Protected Areas and relocation of settlements in multiple use zone
*Management measures are also applicable to other types of ECAN Zones 3.5.6 ECAN Zones Management Guidelines
3.5.6.1 Objectives of ECAN Zones Management Guidelines The ECAN Zones Management Guidelines is founded on environmental, socio-institutional and economic objectives to attain the overall goal of sustainability of resource uses. These objectives should be satisfied in the formulation of guidelines to manage the ECAN zones.

_____________________________________________________________________ ECAN ZONES MANAGEMENT PLAN 108
3.5.6.1.1 Environmental objectives The environmental objectives of ECAN Zones management are to:
• conserve natural resources and protect biodiversity rich areas, important life support ecosystems, and environmentally-critical areas;
• rehabilitate natural habitats and degraded ecosystems; • protect rare, threatened and endangered species of wildlife and flora; and • reduce the incidence of illegal and destructive uses of environment and natural
resources.
3.5.6.1.2 Social and institutional objectives
The socio-institutional objectives of ECAN Zones management are to:
• mobilize stakeholders participation in the enforcement of zoning regulations • strengthen the capability of ECAN boards to implement the guidelines and
enforce land/marine use regulations • improve the awareness and concerns of local communities towards
environmental protection, ECAN zones and allowable/prohibited uses of land/marine resources, and sustainable production that will cascade to advocacy and action
• proper assistance (house lot relocation and livelihood support) to communities which shall be affected or dislocated in the implementation of the ECAN zoning guidelines
3.5.6.1.3 Economic Objectives The economic objectives of ECAN Zones management are to:
• identify areas for sustainable production and inclusion under DENR’s Community-based forest management (CBFM), coastal area management, and related subsidized programs of the government in order to direct development within suitable environments
• regulate the extraction of natural resource to optimize production without destroying natural capital base (e.g., optimal volume and timing of bird’s nest harvesting, non-destructive means of catching live fish and the adopt optimum harvest rate, regulated almaciga tapping, and require adoption of environmentally safe methods for small scale mining, etc.)
• identify areas for development (e.g., tourism) and production (agro-forestry, agriculture, plantation forestry, orchard, pasture, etc.) to generate income for local communities and improve socio-economic conditions
• promote alternative livelihood opportunities and provide credit access and market support

_____________________________________________________________________ ECAN ZONES MANAGEMENT PLAN 109
3.5.6.2 Proposed Allowable and Prohibited Uses of ECAN Zones The proposed allowable uses of ECAN zones in El Nido are provided in Table 52. Table 52. ECAN Zones and Proposed Allowable and Prohibited Uses (Proposed ecotourism activities are provided in italics)
ECAN Zones Terrestrial
Existing Allowed Uses of ECAN Zones (As per PCSD Resolution
No. 05-250)
Proposed Uses of ECAN Zones (ECAN Zoning Component, SEMP-NP)
Core zones
Fully and strictly protected and maintained free of human disruption. Traditional uses of tribal communities for minimal and soft impact gathering of forest species for ceremonial and religious purposes may be allowed.
Core zone – primary forest
-Scientific research, resource inventory and monitoring authorized by PCSD -Allowed traditional activities of indigenous peoples (religious and cultural practices which are not causing ecosystem degradation)
Core zone – habitat of endangered fauna (excluding habitat located in primary forest) Core zone – critical slopes
-Restoration/rehabilitation of degraded areas (natural regeneration and assisted-natural regeneration) in areas authorized by PCSD -Restoration and rehabilitation of degraded portions (degraded habitats of endangered species) in areas authorized by PCSD -Scientific research, resource inventory and monitoring in areas authorized by PCSD -Non-obtrusive and non-disruptive ecotourism activities (regulated hiking, sight-seeing, bird watching, and photography) in ecotourism areas (within core zone) designated and approved by PCSD -Allowed traditional activities of indigenous peoples (religious and cultural practices which are not causing ecosystem degradation) -Restoration and rehabilitation of degraded portions (denuded critical slopes >50%) authorized by PCSD -Scientific research, resource inventory and monitoring authorized by PCSD -Allowed traditional activities of indigenous peoples (religious and cultural practices which are not causing ecosystem degradation) - Regulated hiking and mountain climbing

_____________________________________________________________________ ECAN ZONES MANAGEMENT PLAN 110
ECAN Zones Terrestrial
Existing Allowed Uses of ECAN Zones (As per PCSD Resolution
No. 05-250)
Proposed Uses of ECAN Zones (ECAN Zoning Component, SEMP-NP)
Restricted Use Area
Limited and non-consumptive activities which shall include but not limited to gathering of wild honey, almaciga tapping, soft-impact recreational activities (hiking, sight-seeing, bird watching), research, sustainable activities of IPs and ecosystem restoration or rehabilitation.
-Monitoring in areas designated by PCSD -Restoration/rehabilitation of degraded areas -Wildlife management in areas designated by PCSD -Land management in areas designated by PCSD -Scientific research -Limited fauna observation and wildlife interpretation in areas designated and approved by PCSD -Nature study in areas designated and approved by PCSD -Supervised nature-based forest tourism and recreation (regulated botanical tours, walking/ sight-seeing, nature photography, bird watching) in areas designated and approved by PCSD -Indigenous peoples’ traditional activities: hunting and gathering of forest materials, rituals and ceremonies (almaciga tapping, wild honey, etc.)
Controlled Use Area
Strictly controlled mining and logging, which is not for profit (i.e., communal forest, CBFM, etc.), almaciga tapping, tourism development, research, grazing, gathering of honey, rattan and other minor forest products
-Subsistence extraction of resources -Gathering of minor forest products (honey, rattan, nito, etc.) -Orchards and forest plantations -Agroforestry and stable upland agriculture (SALT) -Ecotourism and recreation (ridge climbing, tree climbing, biking, forest trekking, horse-back riding, nature based sporting events: orienteering, marathons and triathlons)
Traditional Use Area
Activities associated with Upland Stabilization Program, Catchment Management, Hillside Farming, Reforestation, Integrated Social Forestry (ISF), Industrial Tree Plantation (ITP) and Community-Based Forest management (CBFM)
-Sustainable extraction (birds nest) -Agroforestry -Community-based forestry -Tree plantation (for fuelwood and housing materials) -Indigenous peoples’ traditional activities (forest materials gathering, hunting, forest species planting/husbandry, ritual ceremony) -Identified and approved livelihood activities for IPs -Natural area sporting activities (orienteering, regulated biking) other non-obtrusive recreation approved by PCSD
-Approved structures associated with authorized ecotourism (trails, pedestrian bridges, overhead canopy walkways) – in areas designated and approved by PCSDS -Reforestation and land rehabilitation works

_____________________________________________________________________ ECAN ZONES MANAGEMENT PLAN 111
ECAN Zones Terrestrial
Existing Allowed Uses of ECAN Zones (As per PCSD Resolution
No. 05-250)
Proposed Uses of ECAN Zones (ECAN Zoning Component, SEMP-NP)
Multiple use zone
Timber extraction with community-based forest management, grazing and pastures, agriculture, infrastructure and industrial development, recreation, education, research and other sustainable human activities subjected to EIA.
-Urban development and agriculture development -Regulated mining (responsible mining) -Forest/timber extraction and processing -Infrastructure development -Earthworks -Drainage works -Demolition of existing structures and removal of foreign materials and site remediation of toxic substances -Construction and installation of improvements -Reforestation
Tribal Ancestral Lands
Transcends all zones and allows activities on the bases of the material and cultural needs of the tribes using consultative processes and cultural mapping.
-Ecotourism and cultural tourism activities authorized by PCSD with concurrence of NCIP
ECAN Zones Coastal
Existing Allowed Uses of ECAN Zones (As per PCSD Resolution
No. 05-250)
Proposed Uses of ECAN Zones (ECAN Zoning Component, SEMP-NP)
Core zones
Fully and strictly protected and maintained free from human disruptions including general navigation, snorkeling, diving, hiking, etc. Allowed activities include: navigation purposes of the local fishing communities where there is no alternative routes; emergency situations such as navigational routes to save life and property; and researches previously authorized by PCSD
Core zone – critical marine habitats (small islands/islets, coral reefs and seagrass beds)
-Restoration and rehabilitation of degraded critical habitats (mangroves, corals, seagrass and small islands/islets) authorized by PCSD -Science research, resource inventory and monitoring authorized by PCSD
-Non-obtrusive and non-disruptive ecotourism activities (regulated kayaking, canoeing, marine photography) in designated ecotourism areas (within core zone) designated and approved by PCSD -Regulated swimming and snorkeling in designated ecotourism areas approved by PCSD -Supervised SCUBA diving in designated ecotourism areas approved by PCSD

_____________________________________________________________________ ECAN ZONES MANAGEMENT PLAN 112
ECAN Zones
Coastal Existing Allowed Uses of ECAN Zones (As per PCSD Resolution
No. 05-250)
Proposed Uses of ECAN Zones (ECAN Zoning Component, SEMP-NP)
Core zone – mangrove forest Core Zone -Turtle Nesting Beach
- Habitat clean-up of litter and solid wastes/material debris -Traditional indigenous peoples activities -Restoration and rehabilitation of degraded mangrove forest as authorized by PCSD -Ecotourism activities (regulated botanical tours, photography, sight-seeing, bird watching, canoeing and kayaking) in designated areas authorized by PCSD -Hatcheries establishment -Limited pedestrian access during egg laying and hatching seasons -Beach recreation activities, marine wildlife observation except during turtle nesting season
Multiple Use Zone
a) Buffer zone Habitat restoration, rehabilitation and enhancement activities. Rehabilitation of small islands and mangrove ecosystem Swimming/snorkeling Non-motored boating (row boats, kayaks, canoes, wind surfing, etc.,) Guided scuba diving Fishing using highly selected gears (i.e., hook and line and gill net) with specification to be determined by studies Research/regular monitoring previously authorized by PCSD Pre-approved visit or educational activities (i.e., educational tours given on well marked erosion prevention trails or guided boat sailing) Installation of information boards for environmental management, conservation and protection purposes Resource enhancement activities such as habitat restoration and rehabilitation (i.e., mangrove rehabilitation)
-Restricted swimming and non-motorized water sports -Restricted SCUBA diving and snorkeling -Restricted small dinghy sailing and sea kayaking/canoeing -Power boat usage permitted in designated navigable zones by PCSD -Water skiing, jet skiing and para gliding allowed in designated zones only -Lure and fly catch and release fishing -Activity to restore habitat or biological values -Monitoring and science research including experiments on artificial underwater structures -Marine human use activities compatible with restoration activities -Mariculture activities -Reseeding of seagrasses
b) Sustainable Use zone
Sustainable human activities subjected to existing laws and regulations and EIA system which may include but not limited to the following: 1. Communal fishing/active fisheries development -non-destructive fishing activities
-Extraction of resources subjected to EIA -Infrastructure development subjected to EIA -Commercial tourism facilities subjected to EIA and other relevant laws -Seaweed farming

_____________________________________________________________________ ECAN ZONES MANAGEMENT PLAN 113
ECAN Zones
Coastal Existing Allowed Uses of ECAN Zones (As per PCSD Resolution
No. 05-250)
Proposed Uses of ECAN Zones (ECAN Zoning Component, SEMP-NP)
-fry collection and shell and other marine products gathering -navigational routes -fishery support facilities and infrastructure (docking areas, etc.) 2. Tourism development -tourism infrastructures such as resorts -recreational activities -habitat structures (bird watching huts, etc.) -small community projects supporting ecotourism (cottages, canoeing, kayaking, information and souvenir shops, pump boats, etc.)
-Fish cages, traps -Fishing -Swimming -Unrestricted yatch and dinghy sailing -Unrestricted swimming and non-motorized water sports -Unrestricted SCUBA diving and snorkeling -Power boat usage permitted in designated navigable zones by PCSD
3. Other activities -environmental education activities such as study tours -recreational activities such as snorkeling, swimming, scuba diving, kayaking, canoeing, sailing, rock climbing, etc. -sports fishing limited to local operators observing seasonal regulations and size of catch as well as the LGU regulations on sports fishing -picnic grounds and beach shed -rehabilitation/habitat enhancement activities -existing use/activities in the area -community-based mangrove forest activities in denuded areas -researches previously approved by PCSD
-Water skiing, jet skiing and para gliding allowed in designated zones only -Lure and fly catch and release fishing -Unrestricted canoeing and kayaking -Unrestricted rowing -Para gliding -Sports fishing -Catch and release competition fishing -Anchoring in designated anchorage areas -Pedestrian access -Beach recreation activities
Ancestral coastal/marine waters
Cultural activities performed by IPs according to their religious rites and heritage IP activities related to their subsistence and tradition
Cultural activities performed by IPs according to their religious rites and heritage IP activities related to their subsistence and tradition
Coastal-Marine Waters of Protected Areas
Same activities listed under Coastal/Marine Core Zone
3.5.6.3 Constraints and Barriers to ECAN Zoning Implementation
1) Prevailing poverty in the municipality, high unemployment and
underemployment rates drive local communities to indiscriminately exploit natural resources unmindful of being apprehended and jailed. This situation will make it difficult for ECAN zoning to be implemented in forest and coastal/marine areas where local communities are highly dependent for their
_____________________________________________________________________ ECAN ZONES MANAGEMENT PLAN 114
livelihood. This is the greatest barrier to the successful implementation of ECAN zoning.
2) Lack of awareness on ECAN zoning by some local residents will make it
difficult to get their support and thus delay its implementation. Communities living far from the poblacion are less accessible to information and are not aware of the existence and importance of ECAN zones and how this will affect their livelihood activities. This situation may lead to resistance by local communities against the implementation of ECAN zoning.
3) Core zones are not demarcated on the ground and water making it hard for
local residents to know that they are entering core zone areas when they gather forest products or when they go fishing or conduct their livelihood activities. This makes core zoning difficult to implement on the ground in terms of regulating economic activities of local residents. Demarcation of core zones is a tedious, time-consuming and expensive undertaking that can change in relatively short period of time.
4) Any potential conflict between ECAN zoning and NIPAS-PA zoning in El
Nido covering both terrestrial and coastal areas may block or delay the implementation of ECAN zoning in areas (barangays) where conflicts are found. When zoning conflicts take time to be resolved by the DENR, LGU and PCSD, core zone areas are compromised and not immediately protected.
5) Any potential conflict between ECAN zoning and the approved CLUP of the
municipality may block or delay the implementation of ECAN zoning. The reluctance of the LGU officials to immediately revise its CLUP and zoning ordinance to integrate ECAN zoning will delay the implementation and may compromise the protection of core zone areas. The incumbent LGU officials insist that ECAN zoning will only be integrated into their CLUP during the time when the plan is updated.
6) Lack of budget by the LGU to fund the implementation of ECAN zoning will
postpone indefinitely the conduct of some important activities. Implementation of the ECAN zoning would require undertaking several activities such as IEC, on-the-ground core boundary survey and marking, monitoring, apprehension and prosecution of violators, enforcement of zoning management guidelines, and others which would entail large amount of expenditures which the local government cannot afford for now until ways and means of generating funds are devised and established.
7) Lack of technical and managerial competence of some LGU staff on ECAN
zones management will slow down its implementation. The absence of a MENRO in El Nido is a disadvantage to the effective implementation of ECAN zoning. Absence of the MENRO, which is considered to be the office dedicated to implementing environment and natural resources management together with the PAO or PASu, would affect the timely implementation of ECAN zoning.

_____________________________________________________________________ ECAN ZONES MANAGEMENT PLAN 115
8) Business interests of local officials, landlords and private firms may influence the zoning of land, coastal waters and small islands in disregard of the scientific criteria and guidelines established by PCSD. This group of stakeholders may disagree with PCSD over core zone areas and possibly impose zoning classes favorable to their business interest thereby compromising appropriate ECAN zones once PCSD accede to their position.
9) Permit taxes, user fees and charges on the use of the environment and natural
resources paid by business groups and concessionaires are not adjusted according to reasonable rates based on resource rent computation. In effect, the low rates of taxation become an economic incentive to resource users to over extract or overexploit environment and natural resources. The inability of the LGU to generate enough revenues from the users of its environment and natural resources will make it hard for them to fund the implementation of ECAN zoning programs and activities.
10) A large part of the land (73% of the total land area of El Nido) is still
unclassified public forest land. Slow reclassification of suitable areas (i.e., grasslands and brushlands below 18% slope) into A&D lands deprives bonafide landless residents to own land thereby driving them to illegally occupy public lands. The potentials idle grasslands and brushlands for agricultural and urban development cannot be realized because they remain unclassified public forest land. ECAN zoning, which is based on existing forestry laws, will encounter difficulties in implementation in areas where local residents illegally occupied unclassified public forest land.
3.6 ECAN Zones Management Programs (2006 – 2015) The ECAN Zones Management Programs (EZMP) for the next ten years (2006-2015) shall be jointly implemented by the PCSDS and the Municipality of El Nido with cooperation and support from stakeholders including other government agencies such as DENR, DA, DAR, NCIP, NGOs, local community organizations, private sector organizations (tourism establishments, and other business establishments) which are operating in the area. The support of national and international funding organizations (grant and lending institutions) shall also be sought to fund selected activities of the program components.
3.6.1 Institutionalization of Zoning and Management Guidelines
Main Objective: To adopt ECAN zoning and its management guidelines by the LGU and to institute ECAN Zones management responsibility in PAMB and ECAN Barangay Committees to be created.
Key Activities:
3.6.1.1 Expansion of PAMB and capacity building of its members on ECAN zones management -- passage of a resolution creating the expanded PAMB and ECAN Barangay Committees and appropriating regular budget for their operations. This activity also involves the provision of

_____________________________________________________________________ ECAN ZONES MANAGEMENT PLAN 116
funding support to the operations of the expanded PAMB and ECAN Barangay Committees.
3.6.1.2 Passage of an ordinance adopting the ECAN Zones map, ECAN Zones
Management Plan and Management Guidelines.
3.6.1.3 Build-up of Data Base by the LGU (development of decision-support system in ENRIS at PCSDS and provision of data base to Municipal Office and Barangay offices).
3.6.1.4 Integration of ECAN zoning in the updating of CLWUP and passage
of zoning ordinance incorporating ECAN zoning. This activity involves the training of LGU planners on the integration of ECAN zoning into their CLWUP and accompanying zoning ordinance.
3.6.1.5 Implementation and periodic updating of the ECAN Zones
Management Plan. Integration of ECAN zones management programs into the Annual and Medium Term Investment Program of the Comprehensive Development Plan (CDP). Proposal packaging to outsource funds to support ECAN zoning project activities.
3.6.2 Marking of Core Zones on the Ground Main Objective: To establish markers on the ground (land and coastal waters) that will set the boundaries of core zones for monitoring and compliance purposes
Key Activities:
3.6.2.1 Conduct of a study to determine the core zone areas which can use natural topographic features to set their boundaries on the ground (e.g., ridges, rivers, trails, etc.).
3.6.2.2 Conduct of ground surveys to verify and establish the core zone
boundaries on the ground based on the ECAN zone maps prepared by the ECAN Zoning Project.
3.6.2.3 Determination and assessment of the viability (cost effectiveness,
maintenance, and practicability) of various types of markers such as physical monuments or living markers (distinctive tree or plant markers) or a combination of both.
3.6.2.4 Mobilization and hands-on training of barangay volunteers in the
staking of markers on the ground (concrete markers or living markers in terrestrial core zones and buoy markers in coastal/marine core zones) in a pre-selected pilot area
3.6.2.5 Sourcing of funds and prioritizing of areas for ground marking
(Packaging of project proposal for funding by donor institutions).

_____________________________________________________________________ ECAN ZONES MANAGEMENT PLAN 117
3.6.2.6 Implementation of “Project Ground Marking of El Nido’s Natural Treasures” (mobilizing ideas, manpower and funds to initiate the project). Start of implementation covering priority areas (i.e., threatened core zone areas and biodiversity hotspots) and expand to include other areas once enough resources are generated or sourced.
3.6.3 Institutional Capacity Building Main Objective: To strengthen the capability of established organizations that will collaboratively implement ECAN zoning and its guidelines
Key activities:
3.6.3.1 Conduct of IEC and social mobilization activities to gain stakeholders’ support to ECAN zoning.
• Conduct of information campaign at the barangay level using
information materials developed by the ECAN zoning project (multi-media materials on understanding of the ECAN zoning and how to implement it; the duties of the implementers and the approach in implementation);
• Holding periodically of environmental festivities (reforestation, coastal clean up, fairs, environmental fiesta with song and dance contests, poster and slogan contests);
• Educating teachers on ECAN zoning and integrating ECAN zoning in the subjects of elementary, high school and college students.
• Preparing and implementing an IEC Plan with details on the IEC priority thrusts, IEC approaches and messages.
3.6.3.2 Capacitation of the expanded PAMB, Barangay ECAN Committees,
partner organizations (DENR, PCSD, NCIP, and NGO) including deputized members of ECAN task force.
Conduct of training on the following subjects which are needed to impart knowledge and develop the skills of concerned personnel in the implementation of ECAN zoning:
• Trainers Training on ECAN Zones Management. • Ground Marking of Core Zones • GPS and GIS Mapping • Skills Training on Alternative Livelihoods • Agroforestry Technology • Nursery management and operations • Surveillance, Monitoring and Evaluation • Paralegal Training • Assisted Natural Regeneration and Enrichment Planting • Deputation Training on SDENRO’s and Forest Ranger • Deputation Training on Fish Warden & Fish Examiner

_____________________________________________________________________ ECAN ZONES MANAGEMENT PLAN 118
• IEC Plan Preparation and Implementation • Reorientation Seminar and Workshop on SEP law, Environmental
and Natural Resources Laws and PCSD Resolutions and Guidelines
3.6.3.3 Establishment of improved coordination mechanism and
harmonization of policies and programs among PCSD, LGU, DENR, DAR, DA and NCIP in the implementation of ECAN zoning and its management programs.
This institutional capacity building activity will involve two sub-activities: establishment of a coordination mechanism among the implementers of ECAN zoning, and the harmonization of their policies and programs.
• Conduct of an institutional development study by PCSDS and the LGU to
determine and define the coordination mechanisms most appropriate in the implementation of ECAN zoning. The ways and means of improving LGU coordination with PCSDS, Provincial Government, DENR, DA, NCIP and other government agencies will be examined and established.
• Co-management of ECAN zones with local community organizations,
NGOs and the private sector will be established and strengthened. A system of working together in the implementation of ECAN zoning especially in monitoring compliance to its management guidelines will be established. The responsibilities of the partner organizations will center but not necessarily be limited to the following:
a) Local community organizations will be involved in staking the
boundaries of the core zones and in monitoring compliance of local residents in ECAN zoning.
b) NGOs will be involved in IEC on ECAN zoning and in monitoring compliance of local residents.
c) Private sector – tourism resort establishments and other business establishments in the area will be involved in monitoring compliance of the business community to ECAN zoning and in spearheading rehabilitation of degraded ecosystems within their area of operations.
• Harmonization of policies and programs among PCSDS, DENR, NCIP,
DAR, DA and the LGU will be forged through mutual agreements such as joint MOA, Resolutions and Administrative Orders. Harmonization will focus on the following areas of concerns:
a) Harmonization of the zoning classification and management guidelines
between PCSDS’s ECAN zoning system and DENR’s Protected Area Zoning system;
b) Integration of ECAN zoning and its management guidelines into the Ancestral Domain Management Plan (ADMP) for CADC/CADT areas through the intercession of NCIP

_____________________________________________________________________ ECAN ZONES MANAGEMENT PLAN 119
c) Joint policy fora and continuous dialogue to resolve policy and operational and procedural problems in resource disposition, utilization and management among LGUs, PCSDS, NCIP, DA, DAR and DENR.
d) Devise modes of complementation and forge agreement among LGU, PCSDS, DENR, DA, DAR, NCIP, PNP, and NGOs in the planning and implementation of their programs and projects that support ECAN zoning and its guidelines
3.6.4 Law Enforcement
Main Objective: To encourage and motivate stakeholders at the municipal and barangay levels to comply with ECAN zoning and its guidelines for the use of land and coastal/marine resources
Key activities:
3.6.4.1 Mapping of hotspots on the ground with the assistance of Barangay ECAN Committees, NGOs and PNP (Areas where ECAN zoning violation is rampant)
3.6.4.2 Strengthening of patrolling system for compliance to ECAN zoning
and its management guidelines (tap and deputize as fish wardens Bantay Dagat and as forest guards Bantay Gubat volunteers and mobilize other community volunteers) and provide equipment, facilities and other logistic support needed for the conduct of regular patrols to monitor core zones and hotspots. Train and deputize community rangers and provide communication equipment and vehicles (motorcycles and motorboats).
3.6.4.3 Instituting ECAN zones clearance system at the LGU level for
development projects and for endorsement to PCSD.
3.6.4.4 Instituting punitive measures for ECAN zoning violations. Passage of an ordinance stipulating fines and punishments for violators of ECAN zoning.
3.6.4.5 Mobilizing, training and deputizing local volunteers (Bay watch and
Forest watch) to monitor and apprehend violators of ECAN zoning and environmental laws.

_____________________________________________________________________ ECAN ZONES MANAGEMENT PLAN 120
3.6.5 Ecosystem Rehabilitation
Main Objective: To improve the ecological status of environment and natural resources through rehabilitative and restorative means
Key activities:
3.6.5.1 Using the GIS maps generated by the ECAN Zoning Project, identify
areas for restoration or rehabilitation (denuded forest, silted rivers, denuded mangrove areas, degraded coral reefs and seagrass, polluted waters with solid and liquid wastes, etc.)
3.6.5.2 Planning, project packaging, fund sourcing and implementation of
rehabilitation programs for priority areas for reforestation, assisted natural regeneration, and enrichment planting of denuded forest and mangroves, river bank stabilization through vegetative and mechanical means (gabions, weirs, etc.), and transplantation of coral colonies and seagrass in degraded habitats in partnership with PCSDS, DENR, DA, NGOs, academic institutions and local organizations. This component includes the establishment of nurseries for wildlings of indigenous tree species that will be used for reforestation.
3.6.5.3 Packaging of appropriate agroforestry technology and soil
conservation measures for technology transfer in collaboration with DENR and DA. This activity will involve the preparation of technology kits (user-friendly instruction materials – fully illustrated), hands-on piloting and demonstration farms establishment.
3.6.5.4 Formulation of a Participatory Coastal Resource Management Program
and establishment of marine sanctuaries in partnership with NGOs and PCSDS. This activity will involve the identification and selection of priority areas for the establishment of marine sanctuaries. It will also support the undertaking of patrolling, apprehension and prosecution of violators.
3.6.5.5 Formulation of a Watershed Management Program in partnership with
PCSDS and DENR. This activity will undertake the preparation of Watershed Management Programs covering identified priority watersheds, piloting of management measures and dissemination of management and rehabilitation technology to barangay LGUs for their implementation in other priority sites.
3.6.5.6 Identification of suitable relocation sites for illegal settlers occupying
core zone areas. Based on the ECAN Zoning Project’s assessment of the ecosystems of the municipality, the priority areas requiring rehabilitation were identified (Table 53).

_____________________________________________________________________ ECAN ZONES MANAGEMENT PLAN 121
Table 53. Priority Areas Requiring Ecosystem Rehabilitation in El Nido Municipality
Ecosystem Problem
Ecosystem Rehabilitation Measures
Areas for Rehabilitation
Large scale Illegal logging
Assisted natural regeneration, Reforestation
Aberawan, Bagong-bayan, Corong-corong, Pasadena, Teniguiban, Villa Libertad, Masagana, Manlag, Bebeladan
Widespread kaingin plots
Agro-forestry, Reforestation, Soil conservation farming
Teniguiban, Villa Libertad, Masagana, Bagong bayan
Squatting in public forest and coastal lands
Relocation of settlers, Reforestation of cleared areas
Barutuan, Bucana, San Fernando, New Ibajay, Villa Paz, Buena Suerte, Masagana, Maligaya, Corong-corong, Villa Libertad
Accelerated soil erosion
Soil erosion control measures (vegetative and mechanical methods), Soil conservation farming, Sediment traps
Teniguiban, Sibaltan, Corong-corong, Masagana, Buena Suerte
Widespread mangrove forest denudation
Assisted natural regeneration, Enrichment planting, Reforestation, Forestation
Bebeladan, Bucana, Baratuan, Mabini, Sibaltan, Teniguiban, Corong-corong
Seagrass destruction Natural regeneration, Seagrass transplantation
Mabini, Bebeladan
Coral reef destruction
Natural regeneration, Coral transplantation, Artificial reefs deployment
South Miniloc, Bajura de Serena, West Miniloc,
3.6.6 Sustainable Livelihood Development
Main Objective: To promote sustainable livelihood for communities affected by ECAN zoning (core zone dislocated families) and wean them away from destructive extraction of natural resources.
Key activities: 3.6.6.1 Implementation of the Sustainable Livelihood Development Plan
(SLDP) prepared by the ECAN Zoning Project by packaging of priority prototype models identified under the SLDP. The SLDP will be the basis in packaging project proposals for specific target areas and clientele in terms of availability of raw materials and skills requirements, equipment and facilities for processing products, potential markets, credit sources and profitability.

________________________________________________________________________________ ECAN ZONES MANAGEMENT PLAN 122
3.6.6.2 Promoting the implementation of livelihood projects with high potential for success as identified in the SLDP. Implementation of potential products as sources of livelihood (see Table 53) would require the provision of skills training, preparation of project development modules, and establishment of linkage to market and credit sources.
3.6.6.3 Providing educational support for high school, college, technical and
vocational training to children of marginal upland farming families (kaingineros) and marginal fishing families to improve their access to education. Better education will give the children of impoverished families the opportunity to find better jobs here and abroad with the end in view of reducing the number of poor households dependent on kaingin and subsistence fishing. Providing vocational and technical skills training to young upland farmers and fishers to give them the opportunity to work as skilled workers in industries and services sectors here and abroad.
3.6.6.4 Promoting the establishment of micro-credit financing and
entrepreneurial training to individual and community organizations intending to engage in small business ventures in their locality. This is in support to their undertaking of alternative livelihood projects identified in Table 54.
Table 54. Potential Products for Livelihood Development, El Nido Municipality
Proposed Commodity/Service
Proposed Markets within
Five Years
Target By-Products in Ten Years Recommendations*
Organic rice and high-value crops (spices, vegetables and fruits)
Beach resorts and lodging facilities in Palawan and the Visayas, public markets in Coron and Culion
Pre-packed food preparations for institutional buyers in El Nido
Conduct market study to determine demand requirements; possible to be supplemented with low-end vegetables that will cater to local household needs; source sustainable farming technology from government and private institutions (e.g., CRREE)
Aquaculture along Dagal-dagal Bay of Corong-corong, particularly the culture of oysters and mussels, as well as milkfish, tilapia, shrimps and crabs
Beach resorts and lodging facilities in El Nido and specialty markets and restaurants in Metro Manila
Pre-packed food preparations for institutional buyers in El Nido and Metro Manila
Conduct market study in El Nido resorts, as well as markets and seafood restaurants in Baclaran, Paranaque, Binondo and Malate; pilot production sites best in river deltas, mangroves and swamps facing Bacuit Bay; determine

________________________________________________________________________________ ECAN ZONES MANAGEMENT PLAN 123
Proposed Commodity/Service
Proposed Markets within
Five Years
Target By-Products in Ten Years Recommendations*
mitigation measures to avoid overpopulation of fish pens and cages
Rice-based food products such as appealing delicacies and snack items
Tourists in El Nido
Attractively packaged rice-based food products sold in retail outlets in El Nido, Puerto Princesa and Metro Manila
Improve rice productivity to produce surplus for processing; research and promote rice-based food preparations; develop attractive and technically viable packaging for retailing and develop appropriate food technology requirements
Roasted and honey-glazed cashew nuts
Tourists in El Nido
Vacuum-packed and aesthetically packaged cashew-based snack food items sold in Asian shops in OFW-rich retail markets worldwide
Organize sourcing of raw nuts; semi-processing (e.g., shelling and packing) of nuts in El Nido; improve marketing linkages and develop appropriate food technology requirements
Sassu chicken Miniloc and Lagen beach resorts
Exotic dishes prepared and packaged in distinct El Nido fashion, sold in organic food outlets in Metro Manila
Study feasibility of producing this product in El Nido and initiate marketing linkages; design production site to function as part of a farm tour
Salt
Local markets (end-consumers) and institutional buyers in El Nido and Taytay
Table salt in distinct El Nido packaging as a “green” product
Source technology from DOST and private institutions; conduct market study to determine demand requirements
Virgin coconut oil as dietary supplement
Beach resorts and lodging facilities in Palawan and the Visayas
Virgin coconut oil used in food and homeopathic concoctions
Study feasibility of producing this product in El Nido and initiate marketing linkages; design production site to function as part of a farm tour
Processed mango and coconut products (candy, jam, jelly, puree)
Beach resorts and lodging facilities in Palawan and the Visayas; retail outlets in Palawan and Metro Manila
Semi-vacuumed and aesthetically packaged products sold in Asian shops in OFW-rich retail markets worldwide
Source technology from DOST and private institutions; conduct market study to determine demand requirements; inventory local supply of fresh mangoes; design production site to function as part of a package tour

________________________________________________________________________________ ECAN ZONES MANAGEMENT PLAN 124
Proposed Commodity/Service
Proposed Markets within
Five Years
Target By-Products in Ten Years Recommendations*
Functional handicraft items such as frames, trays, bags and mats using minor forest products (bamboo, rattan, nito)
Beach resorts and lodging facilities in Palawan and the Visayas
Same products using added mixed materials and market-driven design
Develop updated product lines and designs based on market research; inventory local supply and check carrying capacity of minor forest products used as raw materials (buho, rattan) and install pertinent mitigation measures; design production site to function as part of a package tour
Indigenous paper industry using pina fiber and local foliage as gift wrapper, stationery, lamp shade
Beach resorts and lodging facilities in Palawan and the Visayas
Added items such as notebooks and albums
Develop updated product lines and designs based on market research; check carrying capacity of minor forest products used as raw materials (buho, rattan) and install pertinent mitigation measures; design production site to function as part of a package tour
Dried seaweeds
Shemberg Corp., Cebu; Coron-based traders
Semi-processed seaweeds
Conduct market study; survey feasible sites; hire services of product specialist to disseminate seaweed farming technology
Wellness center offering massage and homeopathic therapy
Tourists in El Nido and health-conscious locals in northern Palawan
Integrated wellness activities and products ranging from food preparation to individual and group therapy sessions
Check out Mandala Spa of Boracay to stake a competitive advantage; prepare feasibility study and offer to prospective investors within and outside El Nido; organize the local masseurs
Local cuisine featuring birds’ nest and cashew as distinctive ingredients
Tourists in El Nido
Distinctive El Nido cuisine using birds’ nest
Explore feasible quota and pricing for food preparation requirements in El Nido; devise incentives for participating suppliers; develop and promote bird’s nest-based recipes
Local museum cum activity center dedicated to the swifts and the indigenous peoples
Tourists in El Nido and students from mainland and northern Palawan
Creative workshop and accommodation site for lecturing, writing, acting activities
Design as close to nature as possible; could benefit from tax incentives from local government
Source: ECAN Zoning Project, Livelihood Development Plan, 2004

_____________________________________________________________________ ECAN ZONES MANAGEMENT PLAN 125
3.6.7 Ecotourism Development and Visitor Management
Main Objective: To regulate tourism activities and the number of visitors according to the physical and biological carrying capacity of natural amenities without reducing their satisfaction and enjoyment and the income generated from tourism
Key activities:
3.6.7.1 Implementation of ECAN zoning and ecotourism guidelines (protocols and codes of conduct and health and safety measures for visitors) prepared under the ECAN Zoning Component and the Tourism Development Project Component of the SEMP-NP.
3.6.7.2 Educating and informing resort owners and staff and visitors regarding
ecotourism regulations, codes of conduct and ECAN Zones Management Guidelines on ecotourism activities. The allowable and non-allowable uses of various ecotourism activities are provided in the ECAN Zones Management Guidelines.
3.6.7.3 Supporting the accreditation system for tourism guides and
incorporating ecotourism concerns and guidelines in the education of professional guides. Prior to their accreditation, the tourist guides must be able to pass relevant theoretical and practical examinations. They should have a working knowledge on the ECAN Zones management guidelines for ecotourism and the codes of conduct for ecotourism activities such as mountain climbing, SCUBA diving, other recreational activities allowed in core and restricted use zones.
3.6.7.4 Supporting the enforcement of tourism standards and guidelines
(easement, waste disposal and sanitation, etc.) prepared under the Tourism Development Project Component of SEMP-NP.
3.6.7.5 Detailed mapping at the site level and delineating areas within core and
restricted use zones for allowable ecotourism activities; and establishing carrying capacity thresholds and standards for these areas for compliance by resort owners.
3.6.7.6 Promoting terrestrial tourism and recreation (forest tourism and
recreation). This activity will develop incentive schemes to encourage the private sector to engage in forest tourism development. It will also publish information and maps for forest tourism and recreation.

_____________________________________________________________________ ECAN ZONES MANAGEMENT PLAN 126
3.6.8 Sustainable Financing
Main Objective: to develop various schemes of financing the implementation of ECAN zoning and its attendant management programs
Key Activities:
3.6.8.1 Establishment of sustainable financing modes and mechanisms to fund the implementation of ECAN zoning in partnership with PCSDS.
A study on the willingness to pay of visitors was conducted in 2000
under the NIPAP (Bacudo, 2000). The results revealed that the respondents were willing to pay an entrance fee of P50 per night per person or a one-time payment of P200. The study also reported that an average of 20,000 visitors go to El Nido per year thereby generating a total amount of entrance fee of about P5million. Given the potential to generate the much needed funds to implement ECAN Zoning, the following activities should be undertaken:
• Conduct of resource valuation studies to determine appropriate user
fees and charges, identify taxation targets (e.g., concessionaires, raw material buyers and middlemen; devise policies and means to exempt the IPs and subsistence gatherers from taxation), modes of collection and fund utilization.
• Update user charges and fees for the following ecotourism activities:
a) dolphin, bird watching, whale watching, b) sight seeing and mountain trekking, c) SCUBA diving d) lake boating and swimming e) others
• Update user charges and fees for the use or extraction of the following natural resources: a) irrigation water b) docking and mooring c) non-timber forest products-NTFPs (almaciga resin tapping, birds
nest gathering, rattan, nipa, cogon, honey, bamboo, bamban, pandan, buri gathering, ornamental plants (orchids) and medicinal plants gathering, ),
d) live fish catching, turtle eggs collection and shell collection e) pearl farms f) fishpond and aquaculture (floating cages, fish cages, fish pens, etc) g) pebble and sand quarrying
• Cost sharing or counterpart funding with concerned government agencies, NGOs and the private sector in the implementation of ECAN zoning programs and activities.
• Establishment of ECAN zoning taxation scheme

_____________________________________________________________________ ECAN ZONES MANAGEMENT PLAN 127
3.6.8.2 Preparation of financial plan and mobilization of potential sources of funds to implement ECAN Zoning administration, particularly to support staffing, purchase of equipment and facilities, capacity building needed, monitoring and research, rehabilitation, enforcement, surveillance and evaluation of performance
3.6.8.3 Development of a system of fines for all apprehensions whose
proceeds will be shared between the ECAN Board/ECAN Barangay Committees, the municipal treasury, and the informant/apprehender. This system should be legalized through barangay ordinance.
3.6.8.4 Establishment of an ECAN Trust Fund where the collection from user
fees and charges will be deposited for utilization in the implementation of the ECAN zoning and its management programs.
3.6.9 Research, Monitoring and Evaluation
Main Objective: To conduct research to improve ecosystem management and establish and operationalize a participatory monitoring and evaluation system for ECAN zoning.
Key activities:
3.6.9.1 Establishment and operationalization of a participatory ECAN zoning M&E at the barangay and municipal levels.
• Prepare and publish a popularized ECAN M&E and reporting manual
for use of municipal and barangay LGUs • Mobilize and train barangay stakeholders through the barangay ECAN
Committees in the implementation of the ECAN zoning M&E system 3.6.9.2 Assessment of the impacts of ECAN zoning on social, economic and
environmental conditions in the municipality every five years to determine areas for improvement in management measures
3.6.9.3 Monitoring and evaluation annually of the implementation of ECAN
zoning and its guidelines at the barangay level including the changes in ECAN zoning (if any) and the guidelines for allowable uses to know how the people are using the land and coastal/marine resources and their compliance to zoning
3.6.9.4 Monitoring and evaluation of the terrestrial and coastal/marine
resources and habitats every 3-5 years to identify environmental parameters where critical changes are taking place so that the necessary mitigative measures are immediately undertaken. The environment and natural resources that should be closely monitored include forest cover (primary and secondary forest), rattan resources, and mangrove cover, fishery resources, coral reefs, seagrass beds,

_____________________________________________________________________ ECAN ZONES MANAGEMENT PLAN 128
breeding sites of terrestrial wildlife and marine mammals and sea turtles, water quality, soil fertility and soil erosion.
3.6.10 Policy Reforms
Main Objective: To introduce policy reforms and new laws and regulations to improve the effectiveness of ECAN zoning and its management programs
Key activities:
3.6.10.1 Introduction of changes in zoning guidelines periodically to adapt to new laws, regulations and local development needs and situation. Every new national environmental law that is enacted should be reviewed by the ECAN Board with technical assistance from PCSD-DMO to determine their implications on ECAN zoning. New proposed local resolutions and ordinances should be reviewed first by the ECAN Board in terms of their implications to ECAN zoning before they are passed by the SB.
3.6.10.2 Updating of ECAN zones maps and information to capture changes
taking place in the localities. The maps give to the barangays may be used by the ECAN Barangay Committees to update changes in their area and these will be verified and consolidated by PCSDS every three years.
3.6.10.3 Identification of unclassified public forest lands which are ripe and
suitable for reclassification and submission of proposal to the Palawan First District Representative for enactment in Congress. Unclassified public forest lands which are below 18% in slope, do not harbor endangered plants and wildlife animals, and vegetated with grasslands or non-economically important brushlands may be suitable for land reclassification into A&D lands.
3.6.10.4 Policy recommendations for local implementation
While the ECAN zones management guidelines lists the allowable uses of various zonal types, there are some policy guidelines that need to be further clarified to avoid misinterpretation and confusion in their implementation. The following are the proposed policy guidelines that have to be clarified to the stakeholders so that they are properly informed and likewise, the local government officials are able to implement them without doubts. These guidelines will answer questions commonly and often raised by resource dependent communities and should therefore be included in information materials to be disseminated to them.
• Building of new houses in forested areas and mangrove areas is strictly disallowed
• Families occupying core zone areas will have to be resettled

_____________________________________________________________________ ECAN ZONES MANAGEMENT PLAN 129
• Further expansion of kaingin areas in forested areas is disallowed and kaingin areas within core and restricted use zones shall be abandoned by their tillers for rehabilitation
• Further expansion of orchards that will result in the clearing of forest trees is disallowed; orchards established in sloping areas (>18% slope) will not be allowed to be cut.
• Removal of vegetation along river banks is disallowed • Hunting of wildlife (e.g., wild boars) for subsistence food need will
require the issuance of permit from PAMB or DENR • Harvesting of salvageable logs (20-50 cm DBH) in core and restricted
use zones is disallowed; it is allowed only in controlled use zone. • Harvesting of salvageable logs with more than 50 cm DBH (these logs
will serve as homes for some animals) is disallowed • Extraction of salvage timber will require a permit from DENR • Gathering of rattan in core zone is disallowed; and gathering in
commercial quantity within restricted use zones is also disallowed; gathering of rattan in commercial quantity in controlled use zone will require a permit from DENR
• Only Tagbanuas are allowed to tap almaciga; only those with permit from DENR shall be allowed to tap almaciga resin. Licenses to operate almaciga concession areas located within CADC or CALC areas should no longer be issued to non-ICC members and those on-going concessions owned by non-ICCs should no longer be renewed. Concession areas falling inside core zones should be revoked.
• Exotic species of plants and animals will not be allowed to be introduced in rivers and coastal waters for rehabilitation purposes
• The issuance of permits for live fish harvesting shall be regulated and a quota for allowable harvest volume based on fish stock assessment and results of inventory and monitoring shall be established and enforced.
• Birds nest gathering shall be regulated by disallowing harvesting during off season (May to December) and setting quota limitations based on the results of population studies
• Turtle eggs gathering is disallowed and an ordinance providing the fines and penalties for violations shall be passed.
3.7 Schedule of Plan Implementation The indicative schedule of implementation of the different components and activities of ECAN Zoning in El Nido Municipality is shown in Table 56. The schedule covers a period of ten years (2006 to 2015) with project implementation crescending after the first 3 years as more resources are sourced. The schedule also depicts regular and intermittent activities such as updating of maps, plans, guidelines, and zoning ordinances which are required to adjust to changes happening in the biophysical and socioeconomic conditions in the municipality. Furthermore, it also accounts for anticipated changes or reforms in policies and new improved mechanisms of administering zoning. Periodic upgrading of the rate of fines, fees and charges is also depicted in the schedule.

_____________________________________________________________________ ECAN ZONES MANAGEMENT PLAN 130
3.8 Estimated Budget Requirements for ECAN Zoning Implementation
and Related Environmental Management Programs A rough estimate of the budget requirements for the implementation of the components and activities in the implementation of ECAN zoning and related environmental management programs are given in detail in Table 56. These budget estimates should be adjusted by the LGU and cooperating organizations as more accurate data and information are made available. The annual total amount to undertake planned activities ranges from a low of Php 5 million to a high of Php 34 million. The total amount for each component for a ten year period range from a low of Php 2.4 million to a high of Php 60.3 million. The activities requiring big amount of funds for the ten year period are as follows: 1) Sustainable Livelihood Development Projects – Php 60.3 million, 2) Expanded PAMB and Barangay ECAN Committees Operations – Php 39.1 million 3) Ecosystem rehabilitation – Php 38.1 million, 4) Ground marking of Core Zone - Php 21.6 million, and 5) Law enforcement including logistic support, facilities and equipment - Php 15.7 million. The funds needed for each activity listed under Table 57 show the total amount irrespective of their sources. The possible sources of funds for the different components and activities are provided in section 3.10 (Table 58). It is important for the LGU to source funds from external sources and/or generates funds through a reformed taxation scheme to fully implement the activities of its management programs for the next ten years. The possible sources and ways of generating funds are as follows: 1) from other government agencies, NGOs, and the private sector through cost sharing in cash or in kind (e.g., counterpart funds, technical services, use of facilities and equipment and cash contributions especially from NGOs, the private sector and donor institutions both local and international); 2) from collections of adjusted various environmental taxes (permits, fees, user charges, fines and penalties and others) by the LGU; 3) from imposition of an ECAN zoning tax which shall comprise an additional 10% of the business tax for resorts, pearl farms, orchards, forest plantation, mining and quarrying, milling, aquaculture and real estate development, and 4) from international donor agencies (grants and/or loans). In summary, for a ten year period, a total amount of Php 206.7 million is needed to fully implement ECAN zoning and related environmental management programs such as ecosystem rehabilitation and sustainable livelihood projects in El Nido. This amount is expected to come through contributions from various sources and not from the LGU alone. It is expected that this amount of investment would yield far greater benefits to the people of El Nido through improvement in the conditions of degraded

_____________________________________________________________________ ECAN ZONES MANAGEMENT PLAN 131
ecosystems and preservation of critical ecosystems which would redound to higher productivity of land and coastal/marine resources and more stable life support system. Moreover, the investments in ECAN zoning and environmental management programs would also directly improve the economic welfare of the local people by giving them the opportunity to engage in alternative sustainable livelihood projects. It is envisioned that the maintenance and improvement of the state of natural environment in the municipality will sustain the flow of income and benefits in tourism, agriculture, fisheries, and forestry. Without ECAN zoning, sustainable development in the locality will either be snail paced or unattainable; degradation and depletion of natural wealth will be accelerated and social welfare and the quality of life of the residents of El Nido will further deteriorate. Thus, the key instrument to sustainable development is ECAN zoning and proper implementation of its guidelines and attendant management programs and projects. The total amount of Php 206 million needed over a ten year period to manage the environment through the implementation of ECAN zoning programs is a small amount compared to the huge benefits derived by the various sectors (agriculture, fisheries, forestry, trade and industry, tourism, water) from the use of environment and natural resources as goods and services. A lot is taken from the environment and so little is given back to sustain its ecological integrity --- is an exact formula for future disaster. The collapse of the ecosystem will eventually cause the collapse of the economy of El Nido. The choices and decisions have to be taken now.
3.9 Implementing Organizations and Possible Sources of Funds for ECAN Zoning Implementation
Implementation of the components and activities of ECAN zoning will not be possible without the active participation of other concerned agencies such as PCSDS, DENR, DA, DAR, NCIP, PNP and others. Civil society and the private sector are also expected to contribute to the implementation of ECAN zoning inasmuch as the deterioration of the environment will directly affect their socioeconomic welfare and business profits, respectively. Tourism, fisheries, agriculture, and forestry will suffer from ecosystem and habitat degradation thereby affecting households and businesses dependent on natural resources as their source of employment and income. The participation, roles and responsibilities of the LGU’s partner agencies in implementing ECAN zoning are briefly described in Table 58. The funds indicated in the budget table (Table 57) will not solely come from the LGU; other cooperating organizations such as government agencies (DA, DENR, PCSDS, NCIP, etc.), NGOs, and the private sector (resort owners, business establishments, pearl farm owners, etc.) will also be tapped to contribute their share in the implementation of ECAN zoning. Other potential sources of funds include the following:
• Share of the Province in the Malampaya Funds

_____________________________________________________________________ ECAN ZONES MANAGEMENT PLAN 132
• Special lending windows for environment of the Land Bank of the Philippines (LBP), Development Bank of the Philippines (DBP), and other private banks
• Shell Philippines Exploration (SPEX) grant for sustainable development projects
• Malampaya Foundation grant for sustainable development projects • On-going and pipeline foreign-assisted projects of DENR, DA and other
government agencies which cover Northern Palawan such as the on-going FISH Project funded by USAID and the forthcoming ENRMP funded by the GEF and World Bank, etc.
• Bilateral and multi-lateral donor institutions such as JBIC, the World Bank, ADB, AUSAID, USAID, UNDP, GEF (Table 55 provides the list of multilateral and bilateral funding agencies which can be tapped for environment and sustainable development programs and projects).
• Foreign embassies and international foundations and NGOs • Local foundations and NGOs • Philanthropic organizations (local and international)
Table 55. List of Potential Foreign Funding Organizations
Bilateral Multilateral Australian Agency for International Development (AusAID)
Asian Development Bank (ADB)
Canadian International Development Agency (CIDA)
European Union (EU)
Danish International Development Agency (DANIDA)
Global Environment Facility (GEF)
Development Fund for International Development (DFID)
International Bank for Reconstruction and Development (IBRD-World Bank)
German Agency for Technical Cooperation (GTZ)
International Financing Corporation (IFC)
Japan International Cooperation Agency (JICA)
International Fund for Agricultural Development (IFAD)
Japan Bank for International Cooperation (JBIC)
United Nations Development Programme (UNDP)
New Zealand Agency for International Development (NZAID)
United Nations Food and Agriculture Organization (UNFAO)
Swedish International Development Agency (SIDA)
United Nations Environment Programme (UNEP)
United States Agency for International Development (USAID)
Netherlands Embassy British Embassy
It is also imperative for the LGU to generate revenues internally from user fees, charges and fines by adjusting the present low rates of these local taxes.

______________________________________________________________________________________ ECAN ZONES MANAGEMENT PLAN 133
Activities involving large sums of expenditures such as ecosystem rehabilitation, sustainable livelihood projects, ground marking of ECAN zones, and law enforcement may be submitted for foreign funding through the NEDA administered Official Development Assistance (ODA) portfolio or through the Global Environment Facility (GEF) fund. To avail of foreign funding support through Official Development Assistance (ODA), the proponent LGU should identify the Country Program Priorities of the donor agencies and match them with the needs of the locality. The next step is to prepare project proposal for funding assistance in consultation and with the collaboration of partner agencies such as DENR, DA and others. The proposal is then submitted to NEDA for consideration under its ODA program. Being the first of its kind of undertaking that will employ the marking of core zones on the ground using a combination of various methods will possibly draw the interest and support of international funding agencies because of the potential local and global replication of such techniques. The successful implementation of ground marking methods that will be developed can be applied in other areas in the country and abroad in physically delineating Protected Areas. One of the possible international donor institutions that can be approached for this undertaking is the UNDP which administers, together with the World Bank, the GEF fund in the form of a grant. The JBIC is another potential source of loan which is currently upscaling its support to environmental projects. Likewise, the European Union which had supported a lot of projects on Protected Areas in Palawan may possibly consider funding selected activities of the Rehabilitation Component for El Nido. Marking of the ECAN zones in coastal waters may be supported by resort owners considering the impacts of their activities in these areas. Table 56. Indicative Schedule of Activities, ECAN Zones Management
Implementation, (2006-2015)
Component/Activities Year 1 Year 2 Year 3 Year 4 Year 5 Year 6 Year 7 Year 8 Year 9 Year 10 1.0 Institutionalization of ECAN Zoning and Management Guidelines and Operations of ECAN Committees (Municipal and Barangays)
1.1 Official Expansion of the PAMB and creation of the Barangay ECAN Committees
Elect new members
Elect new members
Elect new members
1.2 Passage of an ordinance adopting ECAN Zones Map, Management Plan and Management Guidelines
Pass ordinance
Update maps & guidelines
Update zoning ordinance
Update maps & guidelines
1.3 Development of a data base on ECAN Zones
Develop data base
Update data base
Update data base
1.4 Integration of ECAN Integrate Update Update

_____________________________________________________________________________________ ECAN ZONES MANAGEMENT PLAN 134
Component/Activities Year 1 Year 2 Year 3 Year 4 Year 5 Year 6 Year 7 Year 8 Year 9 Year 10 zoning in CLWUP and passage of a zoning ordinance
ECA zoning
CLWUP CLWUP
1.5 Implementation and periodic updating of the ECAN Zones Management Plan
Update mgt plan
Update mgt plan
2.0 Marking of core zones on the ground
2.1 Conduct of a study to determine core zone areas which can adopt natural topographic features to set their boundaries on the ground
2.2 Conduct of ground surveys to verify and establish core zone boundaries on the ground based on the ECAN zones maps
2.3 Determination and assessment of the viability of various types of markers (vegetation and physical markers)
2.4 Mobilization and hands-on training of barangay volunteers in staking of markers on the ground in a pre-selected pilot area
2.5 Sourcing of funds and prioritizing areas for ground marking (project packaging)
2.6 Implementation of “Project Ground Marking of El Nido’s Natural Treasures”
Maintenance of markers
3.0 Institutional Capacity Building
3.1 Conduct of IEC and social mobilization activities
3.2 Capacitation of Expanded PAMB and Barangay ECAN Committees
Create & train members
Train new members
Train new members
Train new members
3.3 Establishment of improved coordination mechanism and harmonization of policies and programs among PCSDS, LGU, DENR, DAR, DA and NCIP in the implementation of ECAN zoning
New policies & mechanisms
New policies & mechanisms
4.0 Law enforcement 4.1 Mapping of hotspots on the ground with the assistance of Barangay ECAN Committees
Site mapping
Site mapping
Update maps
Update maps
4.2 Strengthening of patrolling system and providing for logistic support, equipment and facilities & operating expenses
New equipment
New equipment
MOE MOE New equipment
MOE New equipment
MOE MOE
4.3 Instituting ECAN Establish Impleme Impleme Implemen Update Implem Implem Implemen Update

_____________________________________________________________________________________ ECAN ZONES MANAGEMENT PLAN 135
Component/Activities Year 1 Year 2 Year 3 Year 4 Year 5 Year 6 Year 7 Year 8 Year 9 Year 10 zones clearance system at the LGU level for development projects and endorsement to PCSD for approval
system nt system nt system
t system system ent system
ent system
t system system
4.4 Instituting punitive measures for ECAN zoning violations through the issuance of an ordinance
Issue ordinance
Implement ordinance
Implement ordinance
Implement ordinance
Update ordinance
Implement ordinance
Implement ordinance
Implement ordinance
Update ordinance
4.5 Mobilizing, training and deputizing local volunteers (Bay watch and Forest watch) to monitor and apprehend violators of ECAN zoning and environmental laws
Mobilize & train
Train new members
Train new members
Train new members
Train new members

_____________________________________________________________________________________ ECAN ZONES MANAGEMENT PLAN 136
Component/Activities Year 1
Year 2 Year 3 Year 4 Year 5 Year 6 Year 7 Year 8 Year 9 Year 10
5.0 Ecosystem Rehabilitation
5.1 Detailed site mapping of areas for restoration and rehabilitation
Site mapping
Update maps
Update maps
5.2 Planning, project packaging, fund sourcing and implementation of rehabilitation programs for priority areas
Priority sites for rehab
Implement rehab
Implement rehab
Additional sites for rehab
Implement rehab
Implement rehab
Implement rehab
Additional sites for rehab
5.3 Packaging of appropriate agroforestry technology, soil conservation measures and soil fertility restoration and management for technology transfer
Packaging of technology
Tech transfer
Tech transfer
New tech for packaging
Tech transfer
Tech transfer
Tech transfer
New tech for packaging
5.4 Formulation of Participatory Coastal Resource Management Program and establishment of marine sanctuaries in partnership with NGOs and PCSDS
2 marine sanctua-ries
4 marine sanctua- ries
4 marine sanctua-ries
5 marine sanctuaries
5.5 Formulation of a Watershed Management Program in partnership with PCSDS and DENR
1 sites 2 sites 2 sites 2 sites
6.0 Sustainable Livelihood Development
6.1 Packaging of prototype models for sustainable livelihood projects (See SLD Plan) and sourcing of funds
6.2 Promoting the implementation of livelihood projects with high potential for success by providing skills training, technical assistance, project packaging, linkage to market and credit sources
6.3 Promoting the establishment of micro-credit financing and entrepreneurial training to community organizations
6.4 Providing educational support for high school, college, technical and vocational training of the children of kaingineros and marginal fishers

_______________________________________________________________________________________________ ECAN ZONES MANAGEMENT PLAN 137
Component/Activities Year 1 Year 2 Year 3 Year 4 Year 5 Year 6 Year 7 Year 8 Year 9 Year 10 7.0 Ecotourism Development and Visitor Management
7.1 Implementation of ECAN zoning and ecotourism guidelines formulated under the SEMP-NP
Update guidelines
Update guidelines
7.2 Educating and informing resort owners and staff and visitors regarding ecotourism regulations and codes of conduct
7.3 Supporting the accreditation system for tourism guides and incorporating ecotourism guidelines in the education of professional guides
Prepare ecotourism guidelines
Implement guidelines
Implement guidelines
Update system & guidelines
Implement guidelines
Implement guidelines
Implement guidelines
Implement guidelines
Update system & guidelines
7.4 Supporting the enforcement of tourism standards and guidelines (easement, waste disposal and sanitation, etc.) prepared under the Tourism Development Project Component of SEMP-NP
ECAN input to stds & guidelines
Update stds & guidelines
Update stds & guidelines
7.5 Mapping and delineation of core and restricted use zones in coastal/marine waters for allowable ecotourism activities and establishing carrying capacity thresholds and standards for compliance by resort owners
Site mapping
Site mapping & establish carrying cap. stds
Site mapping & establish carrying cap. stds
Replace markers
Replace markers
Replace markers
7.6 Promoting terrestrial tourism and recreation in selected sites in the municipality (forest tourism and recreation)
8.0 Sustainable Financing for ECAN Zoning
8.1 Establishment of sustainable financing modes and mechanisms to fund the implementation of ECAN zoning (e.g., user fees and charges, cost sharing, ECAN zoning tax, etc.)
Establish financing modes
Pilot test mechanisms
Implement modes & mechanism
Implement modes & mechanism
Implement modes & mechanism
Update mechanisms
Implement modes & mechanism
Implement modes & mechanism
Implement modes & mechanism
Update mechanisms
8.2 Preparation of detailed financial plan needed by Municipal and Barangay LGUs to implement ECAN zoning programs and mobilization of potential sources of funds
Prepare detailed financial plan
Prepare detailed financial plan
Prepare detailed financial plan
Prepare detailed financial plan
Prepare detailed financial plan
8.3 Development of a system of fines for all apprehensions and pass an ordinance with provisions for the sharing of proceeds among Municipal ECAN Board, Barangay ECAN Committees, Municipal Treasury and the
Develop system & pass ordinance
Implement system of fines & revenue sharing
Implement system of fines & revenue sharing
Update fines & ordinance
Implement system of fines & revenue sharing
Implement system of fines & revenue sharing
Implement system of fines & revenue sharing
Update fines & ordinance
Implement system of fines & revenue sharing

_______________________________________________________________________________________________ ECAN ZONES MANAGEMENT PLAN 138
Component/Activities Year 1 Year 2 Year 3 Year 4 Year 5 Year 6 Year 7 Year 8 Year 9 Year 10 informant. 8.4 Establishment of an ECAN Trust Fund where collections from user fees and charges will be deposited
Establish ECAN Trust Fund
Implement Trust Fund
Implement Trust Fund
Implement Trust Fund
Implement Trust Fund
Implement Trust Fund
Implement Trust Fund
Implement Trust Fund
9.0 Research, monitoring and Evaluation
9.1 Establishment and operationalization of a participatory ECAN zoning M&E at the municipal and barangay levels
Establish M&E
Pilot test M&E
Implement M&E
Implement M&E
Implement M&E
Implement M&E
Implement M&E
Implement M&E
Implement M&E
Implement M&E
9.2 Assessment of the impacts of ECAN zoning on social, economic and environmental conditions in the municipality every five years to determine areas for improvement in management measures
Impact assessment of ECAN zoning
Impact assessment of ECAN zoning
9.3 Monitoring and evaluation annually of the implementation of ECAN zoning and its guidelines at the barangay level including the changes in ECAN zoning (if any) and the guidelines for allowable uses to know how the people are using the land and coastal/marine resources and their compliance to zoning
9.4 Monitoring and evaluation of the terrestrial and coastal/marine resources and habitats every 3-5 years to identify environmental parameters where critical changes are taking place so that the necessary mitigative measures are immediately undertaken
10.0 Policy Reforms 10.1 Introduction of changes in zoning guidelines periodically to adapt to new laws, regulations and local development needs and situation
Revision in ECAN zoning
Revision in ECAN zoning
Revision in ECAN zoning
10.2 Updating of ECAN zones maps and information to capture changes taking place in the localities
10.3 Identification of unclassified public forest lands which are ripe and suitable for reclassification and submission of proposal to the Palawan First District Representative for enactment in Congress
10.5 Policy agenda recommended for local implementation
New policies New policies

__________________________________________________________________________________________________________________________ ECAN ZONES MANAGEMENT PLAN 139
Table 57. Estimated Budget Requirements for the Implementation of ECAN Zoning and Related Environmental Management Programs (2006 – 2015) in Thousand Pesos (‘000)
Component/Activities Year
1 Year
2 Year
3 Year 4 Year
5 Year
6 Year
7 Year
8 Year
9 Year
10 Total
1.0 Institutionalization of ECAN Zoning and Management Guidelines and Operations of ECAN Committees (Total amount)
2,50030
2,690 2,904 3,194 3,763 3,945 4,250 4,676 5,294 5,860 39,106
1.1 Official expansion of the PAMB and creation of the Barangay ECAN Committees (Operational expenses of the Municipal and Barangay ECAN Committees)
2,400 2,640 2,904 3,194 3,513 3,865 4,250 4,676 5,144 5,650 38,236
1.2 Passage of an ordinance adopting ECAN Zones Map, Management Plan and Management Guidelines
30 50 30 70 180
1.3 Development of a data base on ECAN Zones
100 150 150 400
1.4 Integration of ECAN zoning in CLWUP and passage of a zoning ordinance
50 50 70 170
1.5 Implementation and periodic updating of the ECAN Zones Management Plan (updating expenses only, implementation expenses charged in other items below)
50 70 120
2.0 Marking of core zones on the ground (Total amount)
1,200 5,080 5,400 5,000 3,000 1,000 1,000 21,680
2.1 Conduct of a study to determine core zone areas which can adopt natural
100 100

__________________________________________________________________________________________________________________________ ECAN ZONES MANAGEMENT PLAN 140
Component/Activities Year 1
Year 2
Year 3
Year 4 Year 5
Year 6
Year 7
Year 8
Year 9
Year 10
Total
topographic features to set their boundaries on the ground 2.2 Conduct of ground surveys to verify and establish core zone boundaries on the ground based on the ECAN zones maps
400 400 400 1,200
2.3 Determination and assessment of the viability of various types of markers (vegetative and physical markers)
50 50
2.4 Mobilization and hands-on training of barangay volunteers in staking of markers on the ground in a pre-selected pilot area
600 600 1,200
2.5 Sourcing of funds and prioritizing areas for ground marking (project packaging)
50 80 130
2.6 Implementation of “Project Ground Marking of El Nido’s Natural Treasures” – Priority Areas only
4,000 5,000 5,000 3,000 1,000 1,000 19,000
3.0 Institutional Capacity Building (Total amount)
300 410 320 130 250 270 100 120 370 120 2,390
3.1 Conduct of IEC and social mobilization activities
100 110 120 130 150 170 100 120 120 120 1,240
3.2 Capacitation of Expanded PAMB and Barangay ECAN Committees
200 200 200 100 150 850
3.3 Establishment of improved coordination mechanism and harmonization of policies and programs among PCSDS, LGU,
100 100 100 300

__________________________________________________________________________________________________________________________ ECAN ZONES MANAGEMENT PLAN 141
Component/Activities Year 1
Year 2
Year 3
Year 4 Year 5
Year 6
Year 7
Year 8
Year 9
Year 10
Total
DENR, DAR, DA and NCIP in the implementation of ECAN zoning 4.0 Law enforcement (Total amount) 0 2,450 2,400 720 500 1,810 840 1,760 580 4,650 15,710 4.1 Mapping of hotspots on the ground with the assistance of Barangay ECAN Committees
200 400 300 300 1,200
4.2 Strengthening of patrolling system and providing for logistic support, equipment and facilities
2,000 2,000 500 500 1,500 540 1,500 580 4,000 13,120
4.3 Instituting ECAN zones clearance system at the LGU level for development projects and endorsement to PCSD for approval
20 30 30 80
4.4 Instituting punitive measures for ECAN zoning violations through the issuance of an ordinance
30 40 40 110
4.5 Mobilizing, training and deputizing local volunteers (Bay watch and Forest watch) to monitor and apprehend violators of ECAN zoning and environmental laws
200 220 240 260 280 1,200
5.0 Ecosystem Rehabilitation (Total amount)
0 1,450 6,900 2,200 2,700 12,300 2,100 1,600 1,100 7,800 38,150
5.1 Detailed site mapping of areas for restoration and rehabilitation
200 200 200 600
5.2 Planning, project packaging, fund sourcing and implementation of rehabilitation programs for priority areas
150 5,000 2,000 2,500 10,000 2,000 1,500 1,000 5,000 29,150
5.3 Packaging of appropriate agroforestry technology, soil
500 200 200 700 100 100 100 1,000 2,900

__________________________________________________________________________________________________________________________ ECAN ZONES MANAGEMENT PLAN 142
Component/Activities Year 1
Year 2
Year 3
Year 4 Year 5
Year 6
Year 7
Year 8
Year 9
Year 10
Total
conservation measures and soil fertility restoration and management for technology transfer 5.4 Formulation of a Participatory Coastal Resource Management Program and establishment of marine sanctuaries in partnership with NGOs and PCSDS
800 800 800 1,000 3,400
5.5 Formulation of a Watershed Management Program in partnership with PCSDS and DENR
300 600 600 600 2,100
6.0 Sustainable Livelihood Development (Total Amount)
800 9,500 10,500 7,500 5,500 5,000 6,500 4,500 4,500 6,000 60,300
6.1 Packaging and piloting of prototype models for sustainable livelihood projects and sourcing of funds
3,000 5,000 2,000 2,000 2,000 14,000
6.2 Promoting the implementation of livelihood projects with high potential for success by providing skills training, technical assistance, project packaging, linkage to market and credit sources
3,000 2,000 2,000 2,000 2,000 2,000 2,000 2,000 2,000 19,000
6.3 Promoting the establishment of micro-credit financing and entrepreneurial training to community organizations
300 1,000 1,000 1,000 1,000 1,000 1,000 1,000 1,000 1,000 9,300
6.4 Providing educational support for high school, college, technical and vocational training of the children of kaingineros and marginal fishers
500 2,500 2,500 2,500 2,500 2,000 1,500 1,500 1,500 1,000 18,000

__________________________________________________________________________________________________________________ ECAN ZONES MANAGEMENT PLAN 143
Component/Activities Year
1 Year
2 Year 3 Year
4 Year
5 Year 6 Year
7 Year
8 Year
9 Year
10 Total
7.0 Ecotourism Development and Visitor Management (Total Amount)
300 1,100 930 370 850 930 460 1,090 520 1,600 8,150
7.1 Implementation of ECAN zoning and ecotourism guidelines formulated under the SEMP-NP
50 50 70 100 120 140 160 180 200 220 1,290
7.2 Educating and informing resort owners and staff and visitors regarding ecotourism regulations and codes of conduct
150 200 300 200 200 200 200 200 200 200 2,050
7.3 Supporting the accreditation system for tourism guides and incorporating ecotourism guidelines in the education of professional guides
100 150 150 400
7.4 Supporting the enforcement of tourism standards and guidelines (easement, waste disposal and sanitation, etc.) prepared under the Tourism Development Project Component of SEMP-NP
200 300 200 700
7.5 Mapping and delineation of core and restricted use zones in coastal/marine waters for allowable ecotourism activities and establishing carrying capacity thresholds and standards for compliance by resort owners
500 500 500 600 700 2,800

__________________________________________________________________________________________________________________ ECAN ZONES MANAGEMENT PLAN 144
Component/Activities Year 1
Year 2
Year 3 Year 4
Year 5
Year 6 Year 7
Year 8
Year 9
Year 10
Total
7.6 Promoting terrestrial tourism and recreation in selected sites in the municipality (forest tourism and recreation)
100 50 60 70 80 90 100 110 120 130
910
8.0 Sustainable Financing for ECAN Zoning (Total Amount)
320 1,300 2,550 520 400 20 490 20 500 520 6,640
8.1 Establishment of sustainable financing modes and mechanisms to fund the implementation of ECAN zoning (resource valuation studies, updating of user fees and charges, cost-sharing, ECAN zoning taxes, etc.)
300 1,000 2,000 400 500 4,200
8.2 Preparation of detailed financial plan needed by Municipal and Barangays LGUs to implement ECAN zoning programs and mobilization of potential sources of funds
20 30 50 70 100 270
8.3 Development of a system of fines for all apprehensions and pass an ordinance with provisions for the sharing of proceeds among Municipal ECAN Board, Barangay ECAN Committees, Municipal Treasury and the informant.
300 20 20 350 20 20 20 400 20 1,170
8.4 Establishment of an ECAN Trust Fund where collections from user fees and charges will be deposited
500 500 1,000

__________________________________________________________________________________________________________________ ECAN ZONES MANAGEMENT PLAN 145
Component/Activities Year
1 Year
2 Year 3 Year
4 Year
5 Year 6 Year
7 Year
8 Year
9 Year
10 Total
9.0 Research, Monitoring and Evaluation (Total Amount)
400 420 1,430 440 1,470 1,500 530 560 1,590 1,620 9,960
9.1 Establishment and operationalization of a participatory ECAN zoning M&E at the municipal and barangay levels
300 300 300 300 320 340 360 380 400 420 3,420
9.2 Assessment of the impacts of ECAN zoning on social, economic and environmental conditions in the municipality every five years to determine areas for improvement in management measures
1,000 1,000 2,000
9.3 Monitoring and evaluation annually of the implementation of ECAN zoning and its guidelines at the barangay level including the changes in ECAN zoning (if any) and the guidelines for allowable uses to know how the people are using the land and coastal/marine resources and their compliance to zoning
100 120 130 140 150 160 170 180 190 200 1,540
9.4 Monitoring and evaluation of the terrestrial and coastal/marine resources and habitats every 3-5 years to identify environmental parameters where critical changes are taking place so that the
1,000 1,000 1,000 3,000

__________________________________________________________________________________________________________________ ECAN ZONES MANAGEMENT PLAN 146
Component/Activities Year 1
Year 2
Year 3 Year 4
Year 5
Year 6 Year 7
Year 8
Year 9
Year 10
Total
necessary mitigative measures are immediately undertaken 10.0 Policy Reforms (Total Amount)
400 650 1,100 1,120 1,140 250 4,660
10.1 Introduction of changes in zoning guidelines periodically to adapt to new laws, regulations and local development needs and situation
100 120 140 360
10.2 Updating of ECAN zones maps and information to capture changes taking place in the localities
500 800 1,000 2,300
10.3 Identification of unclassified public forest lands which are ripe and suitable for reclassification and submission of proposal to the Palawan First District Representative for enactment in Congress
300 500 500 1,300
10.4 Policy agenda recommended for local implementation
100 150 200 250 700
Grand Total 5,050 21,170 34,114 20,474 20,433 29,895 16,270 14,326 15,594 29,420 206,746

______________________________________________________________________________________________________________________ ECAN ZONES MANAGEMENT PLAN 147
Table 58. Implementing Organizations, Cost Contribution and Possible Sources of Funds
Component/Activities Implementing Organizations
Key roles and responsibilities Cost Contribution and Possible Sources of Funds
1.0 Institutionalization of ECAN Zoning and Management Guidelines and Operations of ECAN Committees (Total amount)
1.1 Official expansion of the PAMB and creation of the Barangay ECAN Committees (Operational expenses of the Municipal and Barangay ECAN Committees for implementing ECAN Zones management guidelines and plans)
LGU and PCSDS PCSDS will provide technical assistance in identifying the members of the expanded PAMB, defining the roles and responsibilities of the members, and preparing its three year plan. It shall also do the same in the creation of the ECAN Barangay Committees LGU with DENR will establish the expanded PAMB and Barangay ECAN Committees and allocate budget for their operations.
LGU – funds the activity PCSDS – cost of technical assistance (staff inputs) Potential sources of funds: ECAN zoning taxes, and updated user fees and charges.
1.2 Passage of an ordinance adopting ECAN Zones Map, Management Plan and Management Guidelines
LGU and PCSDS PCSDS will provide the ECAN zones map, management plan and guidelines and help the SB draft the ordinance LGU will pass the ordinance
LGU - funds the activity PCSDS – cost of printing of maps and reports and technical assistance in the drafting of the ordinance Potential sources of funds: ECAN zoning taxes, and updated user fees and charges.

______________________________________________________________________________________________________________________ ECAN ZONES MANAGEMENT PLAN 148
Component/Activities Implementing Organizations
Key roles and responsibilities Cost Contribution and Possible Sources of Funds
1.3 Development of a data base on ECAN Zones
PCSDS and LGU PCSDS will provide the data and maps for storage at the LGU office. LGU will operate, maintain and update the data base.
LGU – cost of maintenance and updating of the data base PCSDS – cost of e-file reproduction and printing of data/information. Potential sources of funds: ECAN zoning taxes, and updated user fees and charges.
1.4 Integration of ECAN zoning in CLWUP and passage of a zoning ordinance
LGU and PCSDS LGU will pass the ordinance with PCSDS helping in preparing its draft. PCSDS will provide technical assistance in the integration of ECAN zones into the CLWUP. LGU’s MPDO will prepare the updated CLWUP.
LGU – cost of the passage of the ordinance and updating of the CLWUP PCSDS – cost of technical assistance in the drafting of the ordinance and integration of ECAN zones into he CLWUP (staff inputs) Potential sources of funds: ECAN zoning taxes, updated user fees and charges.
1.5 Implementation and periodic updating of the ECAN Zones Management Plan
LGU and PCSDS PCSDS will provide advisory services to the LGU in the implementation of the ECAN Zones Management Plan. It will also give comments and advice on the updated ECAN Zones Management Plan prepared by the LGU.
LGU – cost of updating management plan. Contributing organizations in the implementation of the ECAN Zones Management Plan are described in the following sections below. Potential sources of funds: ECAN zoning taxes, bilateral and multi-lateral donor institutions.

______________________________________________________________________________________________________________________ ECAN ZONES MANAGEMENT PLAN 149
Component/Activities Implementing Organizations
Key roles and responsibilities Cost Contribution and Possible Sources of Funds
2.0 Marking of core zones on the ground
2.1 Conduct of a study to determine core zone areas which can adopt natural topographic features to set their boundaries on the ground
PCSDS LGU MPDO will assist PCSDS staff in the delineation of core zones using topographic features or natural landmarks. DENR will provide technical assistance and inputs to the study
PCSDS – cost of study in kind and in cash (staff inputs and use of survey equipment and GIS facilities) LGU – cost of workshops with barangay ECAN committees DENR – cost of staff services and data inputs Potential sources of funds: International donor agencies (GEF, WB, ADB or JBIC)
2.2 Conduct of ground surveys to verify and establish core zone boundaries on the ground based on the ECAN zones maps
PCSDS, LGU and NAMRIA
PCSDS will train selected LGU staff (trainors’ training) on ground verification of core zones and marking of boundaries. LGU will assign staff to train on ground verification of core zone and marking of boundaries (Barangay volunteers) NAMRIA will assist in ground verification, delineation and training of barangay volunteers
PCSDS – cost of training and provide the services of staff in the conduct of training. LGU – share the cost of training NAMRIA – cost of staff inputs and equipment Potential sources of funds: International donor agencies (GEF, WB, ADB or JBIC)
2.3 Determination and assessment of the viability of various types of markers (vegetative and physical markers)
PCSDS PCSDS will study the various options and types of markers for core zone delineation on the ground DENR will provide technical inputs in the study
PCSDS – cost of study (staff services) DENR – cost of staff services and data inputs Potential sources of funds: International donor agencies (GEF, WB, ADB or JBIC)

______________________________________________________________________________________________________________________ ECAN ZONES MANAGEMENT PLAN 150
Component/Activities Implementing Organizations
Key roles and responsibilities Cost Contribution and Possible Sources of Funds
2.4 Mobilization and hands-on training of barangay volunteers in staking of markers on the ground in a pre-selected pilot area
LGU, NAMRIA and PCSDS
LGU will provide hands-on training to barangay volunteers through their trained staff in partnership with PCSDS and NAMRIA. PCSDS and NAMRIA will provide resource persons in the training
LGU – cost of hands-on training PCSDS and NAMRIA – cost of technical support in the conduct of training Potential sources of funds: International donor agencies (GEF, WB, ADB or JBIC)
2.5 Sourcing of funds and prioritizing areas for ground marking
LGU and PCSDS LGU and PCSDS will set the criteria and select priority areas for ground marking. PCSDS will identify potential external donors and prepare proposal for funding
PCSDS – cost of preparing proposal for funding LGU – share in the cost of preparing proposal Potential sources of funds: International donor agencies (GEF, WB, ADB or JBIC)
2.6 Implementation of “Project Ground Marking of El Nido’s Natural Treasures” – Priority Areas only
LGU, NAMRIA and PCSDS
PCSDS and NAMRIA will provide technical assistance in identifying areas for marking and will oversee the accuracy of ground marking DENR will participate in the ground marking by verifying forest land boundaries
LGU collections from adjusted user fees and charges PCSDS – cost of maps and staff services Contributions from business companies operating in the locality (resort owners, pearl farm owners, forest plantation and orchard concessionaires) Potential sources of funds: International donor agencies (GEF, WB, ADB or JBIC)

______________________________________________________________________________________________________________________ ECAN ZONES MANAGEMENT PLAN 151
Component/Activities Implementing Organizations
Key roles and responsibilities Cost Contribution and Possible Sources of Funds
3.0 Institutional Capacity Building
3.1 Conduct of IEC and social mobilization activities
LGU and PCSDS LGU will conduct IEC PCSDS will provide technical advice in the preparation of IEC materials
LGU – collections from user fees and charges PCSDS – cost of services of staff Potential sources of funds: national and international foundations, NGOs and philanthropic organizations
3.2 Capacitation of Expanded PAMB and Barangay ECAN Committees
LGU PCSDS will assist in the preparation of training programs and provide the resource persons LGU will organize and conduct the training DENR, BFAR, ELAC will provide resource persons
LGU – cost of training PCSDS – share the cost of the production of training materials DENR, BFAR, ELAC – cost of staff services as resource persons Potential sources of funds: national and international foundations, NGOs and philanthropic organizations
3.3 Establishment of improved coordination mechanism and harmonization of policies and programs among PCSDS, LGU, DENR, DAR, DA and NCIP in the implementation of ECAN zoning
LGU and PCSDS PCSDS will conduct an institutional coordination study LGU will mobilize partners in setting up a formal coordination mechanism for ECAN zoning implementation DENR, DA, NCIP, DAR, Provincial Government, PNP, NGOs and the private sector will participate in the management of ECAN zones
PCSDS – cost of institutional development study LGU – cost of establishing a system of coordination and co-management of ECAN zones DENR, DA, DAR, NCIP – share the cost of policy and program harmonization and policy fora NGOs – share the cost of IEC Private business establishments – share the cost of monitoring and policy fora

______________________________________________________________________________________________________________________ ECAN ZONES MANAGEMENT PLAN 152
Component/Activities Implementing Organizations
Key roles and responsibilities Cost Contribution and Possible Sources of Funds
Potential sources of funds: ECAN zoning taxes, national and international foundations, NGOs and philanthropic organizations
4.0 Law enforcement 4.1 Mapping of hotspots on the ground with the assistance of Barangay ECAN Committees
PCSDS and LGU PCSDS will provide barangay level map of hotspots LGU will tap barangay informers on the location of hotspots for inputs to mapping
PCSDS – cost of preparing maps LGU – cost of providing information and printing of barangay maps Potential sources of funds: ECAN zoning taxes and updated user fees and charges
4.2 Strengthening of patrolling system and providing for logistic support, equipment and facilities
LGU LGU will mobilize Bantay Dagat and Bantay Gubat volunteers and provide them logistic support and patrolling allowance
LGU – cost of patrolling operations and procurement of equipment and facilities Potential sources of funds: ECAN zoning taxes, updated user fees and charges, international donor institutions (equipment), foundations (e.g., Malampaya Foundation)
4.3 Instituting ECAN zones clearance system at the LGU level for development projects and endorsement to PCSD for approval
LGU LGU will establish a clearing office for ECAN zoning PCSDS will provide assistance to LGU in the formulation of clearance system and procedures and submission of endorsement to PCSD
LGU – cost of establishing the clearance system and its operations PCSDS – cost of staff services (technical assistance) Potential sources of funds: ECAN zoning taxes and updated user fees and charges

______________________________________________________________________________________________________________________ ECAN ZONES MANAGEMENT PLAN 153
Component/Activities Implementing Organizations
Key roles and responsibilities Cost Contribution and Possible Sources of Funds
4.4 Instituting punitive measures for ECAN zoning violations through the issuance of an ordinance
LGU LGU will pass an ordinance on punitive measures for violations on ECAN zoning
LGU – cost of preparing and passing of an ordinance Potential sources of funds: ECAN zoning taxes and updated user fees and charges
4.5 Mobilizing, training and deputizing local volunteers (Bay watch and Forest watch) to monitor and apprehend violators of ECAN zoning and environmental laws
LGU, PCSDS, NGOs LGU will mobilize barangay volunteers and conduct the training PCSDS will provide resource persons for the training NGOs will provide resource person for the training
LGU – cost of training PCSDS – cost of staff services NGOs – cost of staff services Potential sources of funds: ECAN zoning taxes and updated user fees and charges
5.0 Ecosystem Rehabilitation 5.1 Detailed site mapping of areas for restoration and rehabilitation
PCSDS and LGU PCSDS will identify and map areas at the barangay level for restoration and rehabilitation LGU will identify degraded areas for rehabilitation DENR will identify degraded areas for rehabilitation
PCSDS – cost of mapping and staff services LGU - cost of printing the maps DENR – cost of staff services in identifying degraded areas Potential sources of funds: ECAN zoning taxes, updated user fees and charges and international donor institutions
5.2 Planning, project packaging, fund sourcing and implementation of rehabilitation programs for priority areas
PCSDS, LGU and DENR
PCSDS will prepare rehabilitation plan and project proposals and submit these for funding; and assist in the implementation of rehabilitation projects DENR will assist in preparing
PCSDS – cost of preparing plan and project proposals DENR and LGU – share the cost of rehabilitation (staff services and budget contributions) Private business establishments – share

______________________________________________________________________________________________________________________ ECAN ZONES MANAGEMENT PLAN 154
Component/Activities Implementing Organizations
Key roles and responsibilities Cost Contribution and Possible Sources of Funds
rehabilitation plan and project proposals and in looking for sources of funds; it will undertake the implementation of rehabilitation projects LGU will oversee and monitor the implementation of rehabilitation projects by the DENR
the cost of rehabilitating the degraded environments affected by their operations (tourism establishments, orchard growers, live fish traders, bird’s nest concessionaires and traders) Potential sources of funds: ECAN zoning taxes, updated user fees and charges and international donor institutions
5.3 Packaging of appropriate agroforestry technology, soil conservation measures and soil fertility restoration and management for technology transfer
LGU, DENR and DA DENR will package agroforestry technology in upland areas for dissemination DA will package soil conservation measures and soil fertility management in lowland and upland farms for dissemination LGU will facilitate transfer of technology
DENR – share the cost of technology transfer in selected areas (staff services) DA – share the cost of technology transfer in selected areas (staff services) External funding sources – cost of technology development and diffusion (pilot demonstration farms) Potential sources of funds: ECAN zoning taxes, updated user fees and charges and international donor institutions
5.4 Formulation of a Participatory Coastal Resource Management Program and establishment of marine sanctuaries in partnership with NGOs and PCSDS
LGU, PCSDS, DENR , BFAR and LGU
PCSDS will assist in the formulation of PCRM plan and program and in monitoring its implementation DENR will provide technical inputs in the formulation of PCRM plan and program and implement selected projects and activities on habitat
LGU – share the cost of implementing PCRM program and the establishment of marine sanctuaries DENR – share the cost of implementing selected projects of the PCRM and identifying sites for marine sanctuaries (staff services cost)

______________________________________________________________________________________________________________________ ECAN ZONES MANAGEMENT PLAN 155
Component/Activities Implementing Organizations
Key roles and responsibilities Cost Contribution and Possible Sources of Funds
management and identify sites for establishment of marine sanctuaries BFAR will provide technical inputs in the formulation of PCRM plan and program and implement selected fishery and aquaculture projects and activities and identify sites for establishment of marine sanctuaries LGU will oversee the implementation of the PCRM and monitor the performance of participating agencies; and pass the ordinance on the establishment of marine sanctuaries NGOs will assist in community organization, establishment of marine sanctuaries and participate in the implementation and monitoring of PCRM program implementation
BFAR – share the cost of implementing selected projects of the PCRM and selecting sites for marine sanctuaries (staff services cost) NGOs – share the cost of PCRM planning and implementation Stakeholders – share the cost (labor services) of implementing PCRM and maintaining marine sanctuaries PCSDS – share the cost of plan preparation and implementation (staff services cost) External funding sources – cost of implementing PCRM projects Potential sources of funds: ECAN zoning taxes, updated user fees and charges and international donor institutions
5.5 Formulation of a Watershed Management Program in partnership with PCSDS and DENR
LGU, PCSDS and DENR
PCSDS will lead the formulation of a watershed management program DENR will provide technical assistance in preparing the watershed management program and in implementing selected projects LGU will participate in program planning, implementation and monitoring
PCSDS – share the cost of planning and project packaging for funding (staff services cost) DENR – share the cost of program planning and implementation of selected projects (staff services cost) LGU – share the cost of planning, implementation and monitoring of the program

______________________________________________________________________________________________________________________ ECAN ZONES MANAGEMENT PLAN 156
Component/Activities Implementing Organizations
Key roles and responsibilities Cost Contribution and Possible Sources of Funds
External funding sources – cost of implementing watershed management projects Potential sources of funds: ECAN zoning taxes, updated user fees and charges and international donor institutions
6.0 Sustainable Livelihood Development
6.1 Packaging of prototype models for sustainable livelihood projects and sourcing of funds
LGU, PCSDS and NGOs
LGU will identify priority target beneficiaries for sustainable livelihood projects; and will generate funds to support the piloting of sustainable livelihood projects PCSDS will assist LGU in prioritizing target beneficiaries and in packaging prototype sustainable livelihood projects suitable for specific areas with comparative advantage over certain products; will identify potential funding sources; and assist the LGU in piloting selected livelihood projects. NGOs will assist PCSDS in project identification and packaging; and assist the LGU in the piloting of livelihood development projects
PCSDS – cost of preparing project proposals and donors’ meeting; staff services in piloting livelihood projects LGU – share the cost of proposal preparation and piloting of livelihood projects External funding sources – cost of piloting sustainable livelihood projects NGOs – share the cost of project packaging Potential sources of funds: ECAN zoning taxes, updated user fees and charges, international donor institutions, and foundations (El Nido Foundation, Malampaya Foundation, Pilipinas Shell Foundation and others

______________________________________________________________________________________________________________________ ECAN ZONES MANAGEMENT PLAN 157
Component/Activities Implementing Organizations
Key roles and responsibilities Cost Contribution and Possible Sources of Funds
6.2 Promoting the establishment of micro-credit financing and entrepreneurial training to community organizations
LGU and NGOs LGU will encourage small investors into micro-credit financing NGO in partnership with the academe will train community organization in entrepreneurship
LGU cost of passing ordinance giving incentives and support to micro-credit financing ventures and entrepreneurial training NGOs cost of staff services as resource persons in training Potential sources of funds: ECAN zoning taxes, updated user fees and charges, international donor institutions, and foundations (El Nido Foundation, Malampaya Foundation, Pilipinas Shell Foundation and others
6.3 Promoting the implementation of livelihood projects with high potential for success by providing skills training, technical assistance, project packaging, linkage to market and credit sources
PCSDS, NGOs, Private sector and LGU
NGOs and the Private Sector will assist in training and providing market support in the implementation of livelihood projects; and establish micro-credit facilities PCSDS will provide resource persons for skills training and project packaging for funding LGU will oversee the implementation of livelihood projects and provide funding support for skills training and project packaging
NGOs and the private sector – share the cost of skills training and market linkages; and establishment of micro-credit facilities PCSDS – share the cost of training and project packaging LGU – cost of funding selected sustainable livelihood projects through small grants or low interest loans (soft loans) Potential sources of funds: ECAN zoning taxes, updated user fees and charges, international donor institutions, and foundations (El Nido Foundation, Malampaya Foundation, Pilipinas Shell Foundation and others

______________________________________________________________________________________________________________________ ECAN ZONES MANAGEMENT PLAN 158
Component/Activities Implementing Organizations
Key roles and responsibilities Cost Contribution and Possible Sources of Funds
6.4 Providing educational support for high school, college, technical and vocational training of the children of kaingineros and marginal fishers
LGU and the private sector
LGU will identify and select candidates for scholarship and pass resolution soliciting support from the private sector to adopt scholars
LGU cost of screening and selection of scholars and providing scholarship funds Private sector doing business in the municipality to adopt scholars and contribute to the scholarship fund Potential sources of funds: ECAN zoning taxes, updated user fees and charges, international donor institutions, and foundations (El Nido Foundation, Malampaya Foundation, Pilipinas Shell Foundation and others
7.0 Ecotourism Development and Visitor Management
7.1 Implementation of ECAN zoning and ecotourism guidelines formulated under the SEMP-NP
PCSDS and LGU PCSDS will orient LGU on the ecotourism guidelines and prepare detailed codes of conduct for visitors LGU will issue resolution adopting guidelines and inform tourism business establishments of compliance requirements
PCSDS – cost of orientation of LGU (staff services cost) LGU – cost of passing the resolution and monitoring compliance of business establishments Potential sources of funds: ECAN zoning taxes, updated user fees and charges, and tourism establishments
7.2 Educating and informing resort owners and staff and visitors regarding ecotourism regulations and codes of conduct
LGU, PCSDS, DOT and tourism business establishments
PCSDS will assist the LGUs in educating tourism establishments on the ecotourism guidelines and codes of conduct LGU will be assisted by DOT in
PCSDS and DOT – share in the cost of orientation workshops (staff services cost) LGU – cost of orienting tourism business establishments and monitoring

______________________________________________________________________________________________________________________ ECAN ZONES MANAGEMENT PLAN 159
Component/Activities Implementing Organizations
Key roles and responsibilities Cost Contribution and Possible Sources of Funds
overseeing the implementation of the ecotourism guidelines and codes of conduct and the compliance of business establishments
their compliance Tourism business establishments – cost of orienting their visitors on ecotourism guidelines Potential sources of funds: ECAN zoning taxes, updated user fees and charges, and tourism establishments
7.3 Supporting the accreditation system for tourism guides and incorporating ecotourism guidelines in the education of professional guides
LGU and DOT LGU and DOT will establish a local accreditation system for tourist guides and train them on the ecotourism guidelines and protocols
LGU – cost of setting-up an accreditation system and training of their professional guides. DOT – cost of technical advise (staff services cost) Potential sources of funds: ECAN zoning taxes, updated user fees and charges, and tourism establishments
7.4 Supporting the enforcement of tourism standards and guidelines (easement, waste disposal and sanitation, etc.) prepared under the Tourism Development Project Component of SEMP-NP
LGU and DOT LGU will enforce tourism standards and guidelines DOT will provide and orient the LGU in the enforcement of tourism standards and guidelines
LGU – cost of the enforcement of tourism standards and guidelines developed by the DOT DOT – cost of technical advise (staff services cost) Potential sources of funds: ECAN zoning taxes, updated user fees and charges, and tourism establishments
7.5 Mapping and delineation of core and restricted use zones in coastal/marine waters for allowable ecotourism activities
PCSDS, DOT, LGU and Tourism Business Association
PCSDS will map at the barangay level the coastal/marine core and restricted use zones and prepare the carrying capacity thresholds and compliance to
PCSDS and DOT – share the cost of mapping and preparation of maps; and establishing carrying capacity thresholds adoption by resort owners (staff services

______________________________________________________________________________________________________________________ ECAN ZONES MANAGEMENT PLAN 160
Component/Activities Implementing Organizations
Key roles and responsibilities Cost Contribution and Possible Sources of Funds
and establishing carrying capacity thresholds and standards for compliance by resort owners
standards LGU will enforce the carrying capacity thresholds and compliance standards for tourism resort owners Tourism business association – monitors the implementation of the carrying capacity standards and police their own ranks
cost) LGU – cost of enforcing carrying capacity standards and adherence to the laws Potential sources of funds: ECAN zoning taxes, updated user fees and charges, international donor agencies and tourism establishments
7.6 Promoting terrestrial tourism and recreation in selected sites in the municipality (forest tourism and recreation)
DOT, PCSDS, DENR and LGU
PCSDS and DENR will identify sites and suitable forest tourism activities and recreation; train locals on protocols and management of visitors DOT will include forest tourism and recreation in its promotion package LGU will assist in mobilizing workers and train them for forest tourism and recreation
PCSDS and DENR – share the cost of site identification and the types of ecotourism and recreation appropriate for selected sites (staff services cost) DOT – share the cost of promotional materials LGU – cost of promotional materials and the training of service providers for forest tourism and recreation Potential sources of funds: ECAN zoning taxes, updated user fees and charges, and tourism establishments
8.0 Sustainable Financing for ECAN Zoning
8.1 Establishment of sustainable financing modes and mechanisms to fund the implementation of ECAN zoning
PCSDS and LGU PCSDS will conduct a study to determine appropriate economic instruments to generate revenues to fund ECAN zoning implementation; and will determine adjusted rates based on
PCSDS – cost of study on economic instruments LGU – cost of passing a new scheme of taxation for tourism activities; cost of preparing updated taxation rates and the

______________________________________________________________________________________________________________________ ECAN ZONES MANAGEMENT PLAN 161
Component/Activities Implementing Organizations
Key roles and responsibilities Cost Contribution and Possible Sources of Funds
resource rent computations LGU will pass a new taxation scheme on various ecotourism activities; and will update user fees and charges for ecotourism activities and the use of natural resources
implementation of these new rates Potential sources of funds: LGU environment funds and international donor institutions (e.g., Environment and Economic Foundation Center (EEFC) based in Malaysia, the Netherlands Embassy, ADB and the World Bank)
8.2 Preparation of detailed financial plan needed by Municipal and Barangays LGUs to implement ECAN zoning programs and mobilization of potential sources of funds
LGU and PCSDS LGU will prepare annual and medium term budget for the implementation of ECAN zoning PCSDS will assist the LGU in identifying potential sources of fund for activities requiring large amount of funding
LGU – cost of budget planning and consultation workshops PCSDS – cost of identifying external sources of funds (staff services cost) Potential sources of funding: LGU budget
8.3 Development of a system of fines for all apprehensions and pass an ordinance to this effect with provisions for the sharing of proceeds among Municipal ECAN Board, Barangay ECAN Committees, Municipal Treasury and the informant.
LGU and PCSDS LGU will set up a system of fines for violations of environmental laws and regulations including ECAN zoning guidelines and implement the system PCSDS will extend legal assistance to LGU in establishing fines system
LGU – cost of establishing fines system, passage of an ordinance and implementation of the system PCSDS – cost of legal advice in setting up the fining system Potential sources of funding: LGU budget

______________________________________________________________________________________________________________________ ECAN ZONES MANAGEMENT PLAN 162
Component/Activities Implementing Organizations
Key roles and responsibilities Cost Contribution and Possible Sources of Funds
8.4 Establishment of an ECAN Trust Fund where collections from user fees and charges will be deposited
PCSDS PCSDS will prepare draft legislation on the establishment of an ECAN Trust Fund for endorsement by the PCSD council to Congress for enactment.
PCSDS – cost of preparing the draft legislation, consultation workshops and lobbying in Congress Potential sources of fund: PCSDS budget
9.0 Research, monitoring and Evaluation
9.1 Establishment and operationalization of a participatory ECAN zoning M&E at the municipal and barangay levels
PCSDS and LGU PCSDS will develop a participatory M&E system and train the LGU on how to use it LGU will formally adopt, allot budget and implement an ECAN zoning M&E system
PCSDS – cost of M&E system development and training LGU – share the cost of training and implementation of the M&E system Potential sources of funds: ECAN zoning taxes, updated user fees and charges and international donor agencies
9.2 Assessment of the impacts of ECAN zoning on social, economic and environmental conditions in the municipality every five years to determine areas for improvement in management measures
PCSDS and LGU PCSDS will develop the methods for the evaluation, train LGU staff and undertake the evaluation LGU will participate in the assessment of impacts
PCSDS – cost of preparing assessment instrument and undertaking the evaluation of the impacts of ECAN zoning LGU – cost of training and undertaking the evaluation Potential sources of funds: ECAN zoning taxes, updated user fees and charges and international donor agencies
9.3 Monitoring and evaluation annually of the implementation of ECAN zoning and its guidelines at the barangay
LGU and PCSDS LGU will provide inputs to PCSDS in the monitoring and evaluation of the ECAN zoning management programs PCSDS will develop an evaluation
LGU – cost of gathering information and data inputs for PCSDS PCSDS – cost of developing an evaluation instrument, processing of

______________________________________________________________________________________________________________________ ECAN ZONES MANAGEMENT PLAN 163
Component/Activities Implementing Organizations
Key roles and responsibilities Cost Contribution and Possible Sources of Funds
level including the changes in ECAN zoning (if any) and the guidelines for allowable uses to know how the people are using the land and coastal/marine resources and their compliance to zoning
instrument for the performance of the implementation of the ECAN zoning management programs and undertake the evaluation with the LGU
data and undertaking the evaluation and report preparation Potential sources of funds: ECAN zoning taxes, updated user fees and charges and international donor agencies
9.4 Monitoring and evaluation of the terrestrial and coastal/marine resources and habitats every 3-5 years to identify environmental parameters where critical changes are taking place so that the necessary mitigative measures are immediately undertaken
PCSDS, LGU, DENR, DA, NGOs and the Private Sector
PCSDS will form the tripartite monitoring teams and make laboratory analysis of collected samples and conduct resource assessment on the ground DENR, DA, NGOs and the private sector will help collect samples and conduct resource assessment on the ground LGU will provide survey inputs taken by barangay members of the monitoring team
PCSDS – cost of laboratory analysis and preparation of assessment reports DENR, DA, NGOs and the Private sector – cost of field surveys, collection of data, processing of data and preparation of report. Potential sources of funds: ECAN zoning taxes, updated user fees and charges and international donor agencies
10.0 Policy Reforms 10.1 Introduction of changes in zoning guidelines periodically to adapt to new laws, regulations and local development needs and situation
PCSDS and LGU PCSDS will periodically introduce changes in the ECAN zoning guidelines to adapt to local conditions LGU will localize and prepare detailed and specific guidelines suitable to local conditions
PCSDS – cost of updating the ECAN zoning guidelines LGU – cost of localizing the guidelines and its enforcement Potential sources of funds: ECAN zoning taxes and updated user fees and charges

______________________________________________________________________________________________________________________ ECAN ZONES MANAGEMENT PLAN 164
Component/Activities Implementing Organizations
Key roles and responsibilities Cost Contribution and Possible Sources of Funds
10.2 Updating of ECAN zones maps and information to capture changes taking place in the localities
PCSDS and LGU PCSDS will update thematic maps and ECAN zones map as new more information and data are collected LGU will provide inputs in the updating of the maps
PCSDS – cost of updating maps (staff services cost) LGU – cost of map reproduction Potential sources of funds: ECAN zoning taxes and updated user fees and charges
10.3 Identification of unclassified public forest lands which are ripe and suitable for reclassification and submission of proposal to the Palawan First District Representative for enactment in Congress
LGU, PCSDS and District Congressional Representatives
LGU will identify lands suitable for reclassification and use for agriculture and/or urban development PCSDS will provide technical advice and information to LGU in the identification of lands for reclassification Congressmen of Palawan will sponsor the passage of law reclassifying lands in Palawan
LGU – cost of identifying lands for reclassification PCSDS – cost of providing technical information (maps and evaluation reports) to LGU Congressmen – cost of drafting bill on reclassification of lands in Palawan Potential sources of funds: ECAN zoning taxes and updated user fees and charges
10.4 Policy agenda recommended for local implementation
LGU and PCSD LGU will prepare and implement the policy guidelines in support of the ECAN zoning guidelines PCSD will resolve policy issues in the implementation of the ECAN zoning guidelines
LGU – cost of local implementation of policy guidelines PCSD – cost of policy for a and consultation in resolving policy issues and enacting policies to resolve contentious issues Potential sources of funds: ECAN zoning taxes and updated user fees and charges

_____________________________________________________________________ LIST OF REFERENCES 165
LIST OF REFERENCES Astillero, N. Institutional Capacity Development. Technical Report. ECAN Zoning Component. Sustainable Environmental Management Project in Northern Palawan. Palawan Council for Sustainable Development Staff (PCSDS). June 2004 Astillero, N. Capacity Building Plan of El Nido Municipality. Technical Report. ECAN Zoning Component. Sustainable Environmental Management Project in Northern Palawan. Palawan Council for Sustainable Development Staff (PCSDS). June 2004 Bacudo, I. Results of the Willingness-to-Pay Survey in El Nido-Taytay Managed Resource Protected Area: Recommendations for the Establishment of Appropriate Entrance Fees. National Integrated Protected Areas Programme. June 2000. 17 pp. Cabrido, C. Review and Evaluation of Zoning Delineation Criteria of Strategic Environmental Plan (SEP) Law and Other Related Laws. Technical Report. ECAN Zoning Component. Sustainable Environmental Management Project in Northern Palawan. Palawan Council for Sustainable Development Staff (PCSDS). March 2004. 83 pp. Comprehensive Land Use Plan and Zoning. Municipality of El Nido: 2003-2010. 132 pp. Fillone, O. Livelihood Assessment Report for El Nido, Northern Palawan. Technical Report. ECAN Zoning Component. Sustainable Environmental Management Project in Northern Palawan. Palawan Council for Sustainable Development Staff (PCSDS). February 2005. Fillone, O. Livelihood Development Plan for El Nido, Northern Palawan. Technical Report. ECAN Zoning Component. Sustainable Environmental Management Project in Northern Palawan. Palawan Council for Sustainable Development Staff (PCSDS). June 2005. Kenchington, R. and G. Kelleher. 1995. Making a Management Plan. Pp. 85-102 in “Marine Protected Areas” edited by S. Gubay. Chapman and Hall. London. 232 pp. Limpo, T. Participatory Coastal Resources Assessment of El Nido Municipality. Technical Report. ECAN Zoning Component. Sustainable Environmental Management Project in Northern Palawan. Palawan Council for Sustainable Development Staff (PCSDS). July 2003. 122 pp. Magallona, A. Municipality of El Nido: Compilation of Thematic Layers for the Development of the Geographic Information Systems Database for the Implementation of the Strategic Environmental Plan (SEP) for Palawan. Technical Report. ECAN Zoning Component. Sustainable Environmental Management Project in Northern Palawan. Palawan Council for Sustainable Development Staff (PCSDS). Undated. 38 pp.

_____________________________________________________________________ LIST OF REFERENCES 166
Mendoza, V. Terrestrial Flora in El Nido, Palawan. Technical Report. ECAN Zoning Component. Sustainable Environmental Management Project in Northern Palawan. Palawan Council for Sustainable Development Staff (PCSDS). June 2004. Montebon, R. Baseline Survey Report on Coral Reefs of El Nido Municipality. Technical Report. ECAN Zoning Component. Sustainable Environmental Management Project in Northern Palawan. Palawan Council for Sustainable Development Staff (PCSDS). September 2004. Montebon, R. In-Depth Survey Report on Coral Reefs of El Nido Municipality. Technical Report. ECAN Zoning Component. Sustainable Environmental Management Project in Northern Palawan. Palawan Council for Sustainable Development Staff (PCSDS). December 2004. Samaniego, B. Baseline Survey Report on Reef Fish of El Nido Municipality. Technical Report. ECAN Zoning Component. Sustainable Environmental Management Project in Northern Palawan. Palawan Council for Sustainable Development Staff (PCSDS). September 2004. Samaniego, B. In-Depth Survey Report on Reef Fish of El Nido Municipality. Technical Report. ECAN Zoning Component. Sustainable Environmental Management Project in Northern Palawan. Palawan Council for Sustainable Development Staff (PCSDS). December 2004. Nacorda, H. Baseline Survey Report on Seagrass and Seaweeds of El Nido Municipality. Technical Report. ECAN Zoning Component. Sustainable Environmental Management Project in Northern Palawan. Palawan Council for Sustainable Development Staff (PCSDS). September 2004. Nacorda, H. In-Depth Survey Report on Seagrass and Seaweeds of El Nido Municipality. Technical Report. ECAN Zoning Component. Sustainable Environmental Management Project in Northern Palawan. Palawan Council for Sustainable Development Staff (PCSDS). December 2004. Digdigan, F. Baseline Survey Report on Marine Mammals and Sea Turtles of El Nido Municipality. Technical Report. ECAN Zoning Component. Sustainable Environmental Management Project in Northern Palawan. Palawan Council for Sustainable Development Staff (PCSDS). September 2004. National Integrated Protected Areas Programme (NIPAP). El Nido-Taytay Managed Resource Protected Area. General Management Plan. Volume 1. August 2000. 96 pp. National Integrated Protected Areas Programme (NIPAP). Draft General Management Plan for El Nido Marine Reserve. Managed Resource Protected Area. October 1998 – December 2003. Pollisco, F. and R. Castillo. Baseline Floral Biodiversity Report of El Nido. Technical Report. ECAN Zoning Component. Sustainable Environmental

_____________________________________________________________________ LIST OF REFERENCES 167
Management Project in Northern Palawan. Palawan Council for Sustainable Development Staff (PCSDS). August 2004. Rañola, R. et al., 2004. Socioeconomic Profile and Assessment of El Nido. Technical Report. ECAN Zoning Component. Sustainable Environmental Management Project in Northern Palawan. Palawan Council for Sustainable Development Staff (PCSDS). Surplus Consulting Group. (I. Basman, E. Cureg, M. Corpuz, N. Maranan, M. Subido, R. Taningco, R. Toledano). El Nido Ecological Profile with Insights and Comments on the CLUP. School of Urban and Regional Planning, U.P. Diliman. April, 2005.