environmental risks from discharges from exhaust gas
TRANSCRIPT
Environmental Risks from Discharges from Exhaust Gas Cleaning Systems on Ships in
Aotearoa New Zealand
Prepared for Ministry for the Environment
March 2021

© All rights reserved. This publication may not be reproduced or copied in any form without the permission of the copyright owner(s). Such permission is only to be given in accordance with the terms of the client’s contract with NIWA. This copyright extends to all forms of copying and any storage of material in any kind of information retrieval system.
Whilst NIWA has used all reasonable endeavours to ensure that the information contained in this document is accurate, NIWA does not give any express or implied warranty as to the completeness of the information contained herein, or that it will be suitable for any purpose(s) other than those specifically contemplated during the Project or agreed by NIWA and the Client.
Prepared by: Jennifer Gadd Jade Arnold Rikki Taylor Kararaina Te Puni Melanie Mayall Nahi Erica Williams Kim Currie Kimberley Seaward
For any information regarding this report please contact:
Jennifer Gadd Aquatic Chemist Urban Aquatic Environments +64-9-375 2058 [email protected]
National Institute of Water & Atmospheric Research Ltd
Private Bag 99940
Viaduct Harbour
Auckland 1010
Phone +64 9 375 2050
NIWA CLIENT REPORT No: 2021023AK Report date: 12 March 2021 NIWA Project: MFE21101
Revision Description Date
Version 1.0 Draft supplied to MfE 11 February 2021
Version 1.1 Final version 12 March 2021
Quality Assurance Statement
Reviewed by: Graeme Inglis
Formatting checked by: Emma Hope-Ede
Approved for release by: Michael Bruce
Contents
Executive summary ............................................................................................................. 8
1 Introduction ............................................................................................................ 10
1.1 Background ............................................................................................................. 10
1.2 Scope of this assessment ........................................................................................ 10
1.3 Locations included in this risk assessment ............................................................. 11
1.4 Overview of this report ........................................................................................... 17
2 Iwi Environmental Management Plans ..................................................................... 18
2.1 Introduction ............................................................................................................ 18
2.2 Methods .................................................................................................................. 18
2.3 Results ..................................................................................................................... 21
2.4 Discussion ............................................................................................................... 41
3 Estimation of contaminant emission rates ................................................................ 47
3.1 Introduction ............................................................................................................ 47
3.2 Number of vessels................................................................................................... 47
3.3 Scrubber usage and type ........................................................................................ 49
3.4 Discharge quality .................................................................................................... 50
3.5 Discharge rates ....................................................................................................... 58
3.6 Total daily power usage .......................................................................................... 59
3.7 Discharge duration .................................................................................................. 61
3.8 Calculation of emission rates .................................................................................. 62
3.9 Sensitivity testing of emission rates ....................................................................... 66
4 Modelling of predicted environmental concentrations .............................................. 68
4.1 Overview of MAMPEC-BW model .......................................................................... 68
4.2 Inputs for the MAMPEC-BW model ........................................................................ 69
4.3 Methods for pH modelling ...................................................................................... 77
4.4 Methods for modelling biota uptake ...................................................................... 77
4.5 Assessing potential for adverse effects .................................................................. 78
5 Risk Assessment Results ........................................................................................... 81
5.1 Introduction ............................................................................................................ 81
5.2 Predicted water concentrations ............................................................................. 81

5.3 Changes in seawater pH ......................................................................................... 89
5.4 Predicted sediment concentrations........................................................................ 90
5.5 Predicted biota concentrations .............................................................................. 92
6 Implications and recommendations for further investigations and management ....... 94
7 Acknowledgements ................................................................................................. 96
8 Glossary of Te Reo Māori ......................................................................................... 97
9 References ............................................................................................................... 99
Appendix A List of iwi potentially affected ........................................................ 103
Appendix B Data obtained from NIWA tidal model ............................................ 105
Tables
Table 1-1: Locations for assessing risks of scrubber discharges. 11
Table 2-1: IEMPs that informed this literature review. 19
Table 2-2: Issues, objectives, policies and methods identified in IEMPs relevant to Whangārei Harbour. 23
Table 2-3: Desired outcomes, issues, objectives and methods identified in IEMPs relevant to Ports of Auckland. 28
Table 2-4: Issues, objectives and policies identified in IEMP relevant to Tauranga Harbour. 31
Table 2-5: Issues, objectives and policies identified in IEMP relevant to Lyttleton Port. 33
Table 2-6: Issues, objectives, policies and methods identified in IEMPs relevant to Cook Strait. 36
Table 2-7: Issues, objectives, policies and/or methods identified in IEMP relevant to Milford Sound. 39
Table 2-8: Summary of North Island ship discharge and location-specific issues, objectives, methods and policies referred to in IEMPs. 44
Table 2-9: Summary of South Island ship discharge and location-specific issues, objectives, methods and policies referred to in IEMPs. 45
Table 3-1: Statistical summary of daily vessel counts in each location. 49
Table 3-2: Estimates of number of scrubbers fitted and pending worldwide. 50
Table 3-3: Summary statistics for the quality of scrubber discharges operating in open-loop and closed-loop modes. 57
Table 3-4: Summary statistics for discharge rates of scrubbers. 58
Table 3-5: Vessel types in MOT data, matched to vessel types from Aulinger et al. (2016). 59
Table 3-6: Load factors used for ports, shipping lanes and cruise ship locations. 60
Table 3-7: Duration of discharge in each location. 62
Table 3-8: Comparison of daily discharges under different scrubber mode and year scenarios. 63
Table 3-9: Emission rates for Port of Auckland from open loop scrubbers versus closed-loop scrubbers. 64
Table 3-10: Emission rates for 2020 and 2030 discharges under open loop mode. 65
Table 3-11: Predicted daily emissions in the Poor Knights Islands shipping lane under different scenarios. 66
Table 4-1: Dimensions used in MAMPEC modelling of Port sites. 69
Table 4-2: Dimensions used in MAMPEC modelling of Shipping Lanes and cruise ship areas. 70
Table 4-3: Hydrodynamic parameters and dimensions used in MAMPEC modelling of Port sites. 70
Table 4-4: Comparison of modelled values for flow velocity with measured flow velocity. 71
Table 4-5: Other input parameters used in MAMPEC modelling. 71
Table 4-6: Input data for water quality for ports, shipping lanes and cruise ship areas. 73
Table 4-7: Input data related to sediment accumulation used for all ports, shipping lanes and cruise ship areas. 73
Table 4-8: Properties of metals used in the MAMPEC-BW model to represent discharges from scrubbers. 74
Table 4-9: Properties of anthracene and phenanthrene used in the MAMPEC-BW model to represent discharges from scrubbers. 74
Table 4-10: Differing speed and depth values used in sensitivity testing of various locations. 75
Table 4-11: Concentrations of additional contaminants used in modelling for Port of Lyttelton. 75
Table 4-12: Concentrations of additional contaminants used in modelling for Port of Lyttelton. 76
Table 4-13: Background concentrations of metals measured in Auckland and Lyttelton. 76
Table 4-14: Bioaccumulation factors used to assess potential for effects on biota. 78
Table 4-15: Guidelines used to assess potential for environmental effects. 79
Table 5-1: Predicted concentrations of contaminants in water and shellfish or fish, compared to guideline values for consumption of fish products. 93
Figures
Figure 1-1: Locations of the Ports of Marsden Point (a), Auckland (b), Tauranga (c) and Lyttelton (d) as modelled in this risk assessment. 12
Figure 1-2: Approximate location of the Poor Knights Islands and Rangitoto Channel shipping lanes as modelled in this risk assessment. 13
Figure 1-3: Approximate location of the Mayor Island and Cook Strait shipping lanes as modelled in this risk assessment. 14
Figure 1-4: Approximate location of the Marlborough Sounds shipping lane as modelled in this risk assessment. 15
Figure 1-5: Location of the Akaroa Harbour cruise ship area as modelled in this risk assessment. 16
Figure 1-6: Location of the Milford Sound cruise ship area as modelled in this risk assessment. 16
Figure 3-1: Levels of pH by vessel type for open and closed loop scrubber modes. 51

Figure 3-2: Concentration of copper by vessel type for open and closed loop scrubber modes. 52
Figure 3-3: Concentration of chromium by vessel type for open and closed loop scrubber modes. 52
Figure 3-4: Concentration of nickel by vessel type for open and closed loop scrubber modes. 53
Figure 3-5: Concentration of zinc by vessel type for open and closed loop scrubber modes. 53
Figure 3-6: Concentration of lead by vessel type for open and closed loop scrubber modes. 54
Figure 3-7: Concentration of vanadium by vessel type for open and closed loop scrubber modes. 54
Figure 3-8: Concentration of mercury by vessel type for open and closed loop scrubber modes. 55
Figure 3-9: Concentration of anthracene by vessel type for open and closed loop scrubber modes. 55
Figure 3-10: Concentration of phenanthrene by vessel type for open and closed loop scrubber modes. 56
Figure 3-11: Variation in nickel and zinc by engine loading (%) for open and closed loop scrubber modes. 56
Figure 3-12: Flow rate (m3/MWh) by vessel type with open and closed loop engine modes. 58
Figure 3-13: Emission rates for chromium and copper in the Poor Knights Islands shipping lane under different scenarios. 67
Figure 4-1: MAMPEC Model environment types and dimensions. 68
Figure 5-1: Predicted concentrations of copper in water at each location modelled. 82
Figure 5-2: Predicted concentrations of chromium in water at each location modelled. 82
Figure 5-3: Predicted concentrations of nickel in water at each location modelled. 83
Figure 5-4: Predicted concentrations of zinc in water at each location modelled. 83
Figure 5-5: Predicted concentrations of anthracene in water at each location modelled. 84
Figure 5-6: Effect of different model input conditions on the predicted copper concentrations in water in four shipping lanes. 85
Figure 5-7: Effect of different model input conditions on the predicted copper concentrations in water at Ports of Marsden Point and Lyttelton and the Akaroa cruise ship area . 86
Figure 5-8: Predicted concentrations in water of additional contaminants at Port of Lyttelton. 87
Figure 5-9: Predicted concentrations of metals at Port of Lyttelton with and without scrubbers. 88
Figure 5-10: Predicted concentrations of metals at Port of Auckland with and without scrubbers. 88
Figure 5-11: Predicted pH in marine waters before and after discharge of scrubber washwaters at each location after considering buffering by seawater carbonates. 89
Figure 5-12: Predicted concentrations of copper in sediment at each location modelled under the 2020 scenario. 90

Figure 5-13: Predicted concentrations of metals in sediment in ports under three modelled scenarios. 91
Figure 5-14: Predicted concentrations of additional contaminants in sediments of Port of Lyttelton under two upper modelled scenarios. 92

8
Executive summary
Exhaust gas cleaning systems (EGCS, also known as scrubbers) can be used to comply with limits on
the emissions of sulfur dioxide to air from shipping, as regulated under the International Maritime
Organization (IMO) convention on the Prevention of Marine Pollution (MARPOL) Annex VI:
Regulations for the Prevention of Air Pollution from Ships. Most of the scrubbers in use operate by
washing the exhaust gas with alkaline water, thereby generating an acidic washwater (from the
sulfuric and sulphurous acids produced) containing elevated concentrations of particulates, nitrogen
(from gaseous nitrogen oxides), hydrocarbons, and metals. Discharges of the scrubber washwaters
into marine waters therefore represent a potential risk for marine environments.
The Ministry for the Environment (MfE) engaged NIWA to assist in a risk assessment of the potential
environmental effects from these scrubber discharges in marine waters of Aotearoa New Zealand. A
two-stage process was adopted to firstly review literature and identify approaches that could be
used to assess the environmental impacts of scrubbers in New Zealand (Phase 1, see Gadd 2020) and
subsequently to undertake that risk assessment (Phase 2, this report). This Phase 2 risk assessment
was based on existing data only, with no new data acquired. Eleven site-specific risk assessments
were undertaken for 4 ports, 5 shipping lanes and 2 cruise ship areas, representing locations with a
range of vessel numbers and types, hydrodynamic conditions and ecological receptors.
Iwi Environmental Management Plans (IEMPs) relevant to the 11 locations of interest were reviewed
to provide MfE with an overview of the potential concerns and interests held by various iwi and hapū
around issues associated with environmental effects of ship exhaust and scrubber washwater
discharges. Several reoccurring themes were identified across IEMPs that were relevant to the scope
and risk assessment areas of interest including kaitiakitanga, mātauranga, water, air,
kaimoana/fisheries, climate change and taniwha. Of high relevance was the discussion in some IEMPs
regarding the impacts of contaminant discharges entering the coastal/marine environment via
various pathways (e.g., untreated discharges) and the impacts of pollution on kaimoana and mahinga
kai. Ship scrubbers, the use of alternate technologies and/or associated discharge quality was not
specifically mentioned in any of the IEMPs reviewed. MfE may need to provide some more
information to iwi and hapū on these specific issues prior to engaging with them on the implications
of this risk assessment and the potential options for future management and policy improvements.
The risk assessment process included two key steps:
1. Estimation of contaminant emission rates for each of the 11 locations based on the
number of vessels in each location with scrubbers, the discharge quality, the discharge
rate (which depends on the engine power usage), and the duration of discharges into
each location. Time series data for vessel arrivals in ports (2012-2017 data) were
obtained from the Ministry for Primary Industries (MPI) and used to estimate the
number of vessels in each port, cruise ship areas and the number of vessels passing
through each shipping lane of interest. The type of vessel, its engine size and the likely
engine loading rate either in transit or at berth were used to estimate the maximum
total daily discharge rate. Discharge quality data were obtained from a literature
compilation supplemented with data from additional studies reviewed.
2. Modelling of predicted environmental concentrations used a simplified hydrodynamic
and chemical fate model (MAMPEC-BW). Hydrodynamic and water quality conditions

9
for the ports were obtained from a previous study using this model, and for the other
locations, from a range of sources including bathymetric maps, the NIWA
hydrodynamic tide model and water quality data reviews. Characteristics for each
compound of interest were obtained from published information with values that
represent low biodegradation adopted.
Two different time-periods were included in the assessment: 2020 - to represent the current state of
scrubber use and 2030 to represent possible future uptake. The risk assessment was restricted to five
key contaminants (copper, chromium, nickel, zinc and anthracene), selected due to their presence in
scrubber discharges at concentrations that exceed water quality guidelines. Four additional
contaminants (lead, mercury, vanadium and phenanthrene) were assessed for a single location only
that represented the worst-case conditions.
The predicted concentrations of the five key contaminants ranged over many orders of magnitude,
from negligible concentrations in all shipping lanes, through to concentrations that would exceed
water quality guidelines for all contaminants in the Port of Lyttelton, under the upper modelled
scenario. With open-loop scrubbers, copper and chromium concentrations are of most concern, with
concentrations predicted to exceed guidelines in the ports of Lyttelton, Tauranga and Auckland and
in the Akaroa cruise ship area, with predicted concentrations in that order (largest to smallest). None
of the four additional contaminants (lead, mercury, vanadium and phenanthrene) were predicted to
exceed water quality guidelines in the Port of Lyttelton (location with highest concentrations). As
there were a large number of assumptions in the calculated emission rates and in the MAMPEC
model inputs, sensitivity testing was undertaken which indicated that the three main scenarios
modelled (2020, 2030 and 2030 with a higher contaminant concentration in the discharge)
encompassed the upper end of predictions based on the differing input variables. Lower
environmental concentrations were predicted with the use of closed-loop scrubbers. The predicted
changes in seawater pH were negligible at all sites except Lyttelton and Tauranga (pH change of 0.12
and 0.06 respectively), after accounting for the buffering provided by bicarbonate and carbonate
ions.
Contaminants will accumulate in the sediments over time and concentrations of copper, nickel,
mercury, zinc and phenanthrene have potential to reach sediment quality guidelines in the ports of
Lyttelton and Tauranga (nickel only) even in the absence of natural concentrations and/or existing
sources. Some contaminants have potential to accumulate in biota, such as fish and shellfish;
however, none are expected to reach guideline values derived to protect the health of those
consuming fish or shellfish.
Overall, the risk assessment has identified that scrubber washwater discharges do not pose any
potential risks to marine biota in shipping lanes. However, there is potential for adverse effects in
some ports from open-loop scrubbers, particularly those with low flushing rates and/or a greater
volume of discharges due to the number and type of vessels. Management of scrubber usage around
Aotearoa New Zealand should therefore focus on their use in ports and any other areas (not
identified in this assessment) with high numbers of large vessels at berth for long durations (i.e.,
close to 24 hours). Discharges from scrubbers operating in closed-loop mode were not predicted to
exceed water quality guidelines, and based on the modelling undertaken, these discharges are not
expected to result in adverse effects on marine biota.

10
1 Introduction
1.1 Background
The combustion of fuel oil in shipping results in the release of sulfur oxides (SO2 and SO3, collectively
known as SOX), which can affect human health by harming respiratory systems, affect visibility,
causing haze and contribute to acid rain. Sulfur dioxide emissions are regulated under the
International Maritime Organization (IMO) convention on the Prevention of Marine Pollution
(MARPOL) Annex VI: Regulations for the Prevention of Air Pollution from Ships. The primary method
for reducing these emissions is through the use of low sulfur fuels; however an alternative method is
to remove the SOx from the exhaust gases using an exhaust gas cleaning system (EGCS, also known as
a scrubber1). These systems typically work by spraying the exhaust gas with alkaline seawater, which
dissolves the SOx, removing >98% from the gas. This process also removes particulate matter and
heavy metals that were also in the exhaust gas. The washwater created then contains particulates,
metals and sulfur, as well as being acidic, with pH regularly <6. Discharges from the system,
therefore, have potential to affect the marine waters and ecosystems into which they are discharged.
The Ministry for the Environment (MfE) engaged NIWA to assist in a risk assessment of the potential
environmental effects related to the scrubber discharges in marine waters of Aotearoa New Zealand.
In Phase 1, a literature review was undertaken to identify approaches that could be used to assess
the environmental impacts of exhaust gas cleaning systems (scrubbers) in New Zealand. This report
represents Phase 2: the undertaking of that risk assessment based on the process and options
outlined in the Phase 1 report and as agreed with MfE.
1.2 Scope of this assessment
The risk assessment undertaken and described in this report considers a number of spatial and
temporal considerations. The assessment includes 11 site-specific risk assessments based on 4 ports,
5 shipping lanes and 2 cruise ship areas. The locations included were intended to cover a range of
vessel numbers and types, hydrodynamic conditions and ecological receptors. However, there may
be additional locations that are of high risk and were not considered in this assessment. The risk
assessment considers two different time-periods, 2020 and 2030, to represent the current state of
scrubber use and expected future uptake. Emission rates are based on the maximum number of
vessels expected in each location.
There are a large number of contaminants that may be emitted in the scrubber discharges, including
a range of heavy metals, Polycyclic Aromatic Hydrocarbons (PAHs; including alkylated PAHs which
have similar or higher levels of toxicity (or photoxicity) to parent PAHs), other hydrocarbons and
nutrients. This risk assessment is restricted largely to five key contaminants, based on their presence
in the discharges at concentrations well in excess of water quality guideline concentrations. The
contaminants included are the four metals: copper, chromium, nickel, zinc; and anthracene (a PAH).
Four additional contaminants (lead, mercury, vanadium and phenanthrene) were also at a single
location (worst-case site) only to increase the range of contaminants included in the assessment.
1 There are also treatment systems that remove other gases from exhaust gases, including nitrogen oxides (NOx) using selective catalytic reduction. These are not in common use (Gregory 2012) and are not within the scope of this report.

11
No new data were acquired for this risk assessment – it relies on existing information for all aspects,
including scrubber usage and discharge quality. This means there are many assumptions that were
made in the calculations, particularly in calculating the likely emissions in each location of interest.
The risk assessment described in this report can be considered a preliminary risk assessment. Where
risks are determined to be unacceptably high, then more detailed options may be required to assess
risks more accurately, for example, undertaking hydrodynamic modelling using calibrated models.
1.3 Locations included in this risk assessment
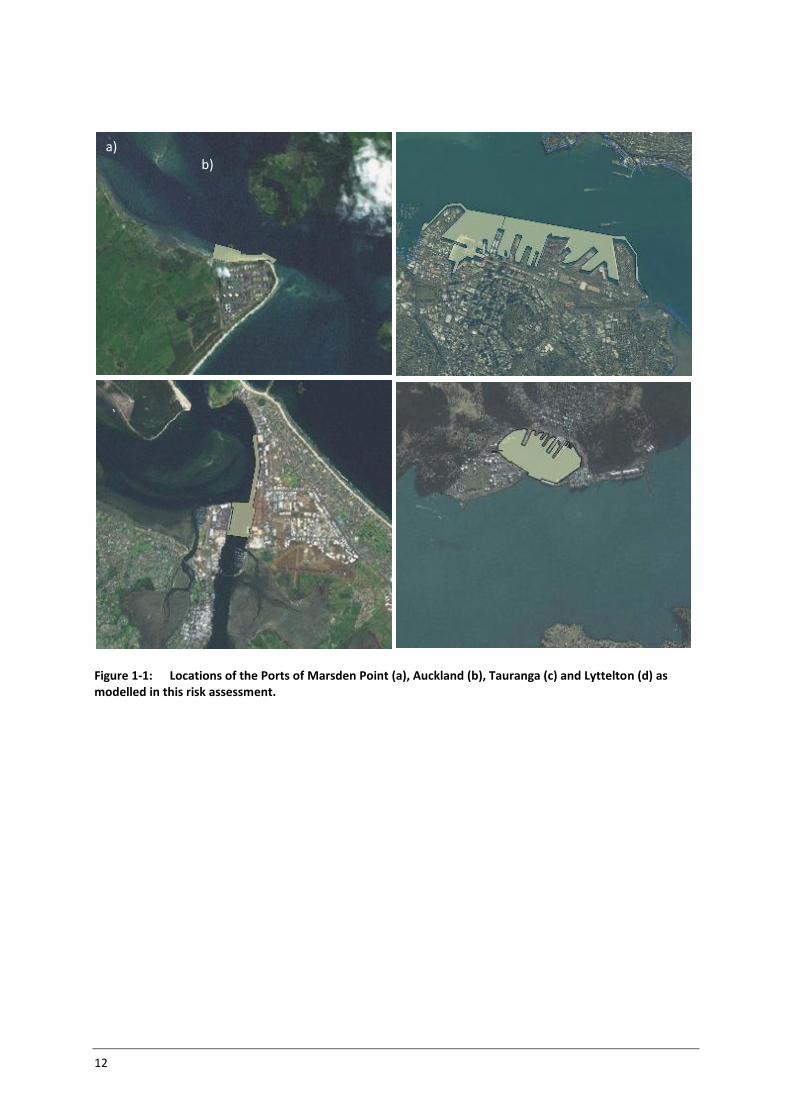
Eleven locations of interest were identified for inclusion in this risk assessment, representing four
ports, five shipping lanes and two cruise ship areas (Table 1-1). These locations were selected on the
basis of shipping activity and proximity to high sensitivity ecological areas including marine protected
areas, areas used for aquaculture and areas subject to multiple cumulative effects. The Cook Strait
shipping lane was selected as a deep water shipping lane, with high water velocity through the lane.
The locations are shown in Figure 1-1 to Figure 1-5 for ports, shipping lanes and cruise ship areas.
Table 1-1: Locations for assessing risks of scrubber discharges.
Locations Justification
Ports
Auckland Major NZ port (high vessel numbers), multiple cumulative effects
Tauranga Major NZ port (high vessel numbers), multiple cumulative effects
Marsden Point Major NZ port, proximity to commercial shellfish beds and areas of ecological significance
Lyttelton Major NZ port; low hydrodynamic flushing compared to other NZ ports
Shipping lanes
Mayor Island Marine reserve
Poor Knights Islands Marine reserve
Rangitoto Channel in Hauraki Gulf
Marine park, area under pressure from multiple threats, also includes aquaculture and commercial fishing areas
Cook Strait Deep water shipping lane, high velocity
Marlborough Sounds Aquaculture area (current and future)
Cruise ship areas
Akaroa Cruise ship visits, within a marine mammal sanctuary, distant from other stressors
Milford Sound Cruise ship visits, within a marine protected area; pristine environment; distinctive physical environment (freshwater overlying seawater)
12
Figure 1-1: Locations of the Ports of Marsden Point (a), Auckland (b), Tauranga (c) and Lyttelton (d) as modelled in this risk assessment.
a) b) c) d)

13
Figure 1-2: Approximate location of the Poor Knights Islands and Rangitoto Channel shipping lanes as modelled in this risk assessment. Red rectangle approximately indicates the location modelled. The white squares indicate location of ships based on ship tracking data from 2012, image downloaded from https://www.shipmap.org/

14
Figure 1-3: Approximate location of the Mayor Island and Cook Strait shipping lanes as modelled in this risk assessment. Red rectangle approximately indicates the location modelled. The white squares indicate location of ships based on ship tracking data from 2012, image downloaded from https://www.shipmap.org/

15
Figure 1-4: Approximate location of the Marlborough Sounds shipping lane as modelled in this risk assessment. Red rectangle approximately indicates the location modelled. The white squares indicate location of ships based on ship tracking data from 2012, image downloaded from https://www.shipmap.org/

16
Figure 1-5: Location of the Akaroa Harbour cruise ship area as modelled in this risk assessment. Red rectangle approximately indicates the location modelled.
Figure 1-6: Location of the Milford Sound cruise ship area as modelled in this risk assessment. Red rectangle approximately indicates the location modelled.

17
1.4 Overview of this report
This report is set out in 5 sections following this introduction:
▪ Section 2 outlines some of the relevant hapū and iwi values associated with the 11 locations of
interest, and in marine waters more generally, based on a review of Iwi Environmental
Management Plans.
▪ Section 3 describes how the contaminant emission rates from vessels were calculated for each
location, based on the number, type and size (engine power) of vessels, estimates of scrubber
use, discharge quality and discharge rates.
▪ Section 4 describes the methods used in the modelling of environmental concentrations of
contaminants. This includes descriptions of input data for the hydrodynamic and chemical fate
model MAMPEC-BW, used for modelling concentrations in water and sediment and the
sensitivity testing undertaken. The methods used to estimate seawater pH (accounting for the
buffering due to the presence of carbonate ions) and contaminant concentrations in biota are
also described, as are the guidelines used in the assessment of risk.
▪ Section 5 presents the environmental concentrations of contaminants in water, sediment and
biota, and the predicted pH. Results are presented for several key scenarios (2020 and 2030
scrubber use, upper estimate of contaminant concentrations), for additional contaminants (Port
of Lyttelton only), and in the presence of additional contaminants from existing stressors.
▪ Section 6 discusses the implications of the risk assessment and outlines options for further risk
assessment, investigations and management.
A glossary of Te Reo Māori is included at the end of the report.

18
2 Iwi Environmental Management Plans
2.1 Introduction
Many indigenous peoples recognise the environment as an extension of themselves, which is often
expressed through song, stories and customs (Durie 2004). The relationship between indigenous
peoples and the environment has allowed the development of dynamic intergenerational knowledge
and practices over time (Wehi et al. 2019). Iwi and hapū maintain their relationship with the
environment through the practice of guardianship, also known as kaitiakitanga (Walker et al. 2019).
When Māori knowledge is disregarded in approaches to environmental research, management and
policy, potential disruption to the mana and wellbeing of iwi and hapū can occur (Walker et al.,
2019).
An overview of iwi and hapū viewpoints have been included in this risk assessment report. The
purpose of the following section is to provide MfE with some background into the potential concerns
and interests held by various iwi and hapū around the issues associated with the environmental
effects of ship exhaust/scrubber discharges in marine waters. We understand that MfE will use this
information to inform their communications and engagement with mana whenua associated with
ports, shipping lanes and cruise ship areas around Aotearoa New Zealand. For those unfamiliar with
Te Reo Māori words and phrases, a glossary of words used in this section is included at the back of
this report.
2.2 Methods The information contained in this section was compiled largely through a review of IEMPs and other
readily available/publicly accessible information. For clarity, we did not complete this overview in
consultation with the iwi or hapū identified in this report. Generally, IEMPs are documents
developed by hāpu or iwi that identify environmental kaupapa of significance and details around how
they expect to engage in environmental planning and decision-making processes. These IEMPs can
vary in style, content, spatial and temporal specificity – and can include outcomes sought, concerns,
issues, objectives, methods and/or policies in relation to various environmental kaupapa.
In October 2020, MfE provided NIWA with a list of iwi in areas potentially most likely impacted by
larger international ships using scrubbers, as well as those areas likely to have existing interests and
concerns over marine pollution/degradation (Appendix A). This list was then cross checked with the
areas of interest for iwi authorities, hapū and other Māori organisations recorded in Te Kahui
Mangai2. We then searched regional council websites for an indication of the IEMPs that have been
lodged with councils for each area of interest. A website search for each iwi/hapū identified was then
completed to access further relevant information. From this list, iwi associated with each area of
interest were identified and their IEMPs sought, where they were publicly accessible. The IEMPs that
informed this literature review are listed in Table 2-1.
2 www.tkm.govt.nz

19
Table 2-1: IEMPs that informed this literature review.
Name of IEMP Date Iwi/hapū represented
Author/s Website link
Te Iwi o Ngātiwai Iwi Environmental Policy Document
2007 Ngātiwai Ngātiwai Trust Board http://old.wdc.govt.nz/PlansPoliciesandBylaws/Plans/DistrictPlan/Documents/Iwi-Management-Plan-Te-Iwi-o-Ngatiwai-Iwi-Environmental-Policy-Document-2007.pdf
Ngā Tikanga mo te Taiao o Ngāti Hine
2008 Ngāti Hine Tui Shortland, Peter Nutall and Ngāti Hine advisors
http://old.wdc.govt.nz/PlansPoliciesandBylaws/Plans/DistrictPlan/Documents/Iwi-Management-Plan-Ngati-Hine-Iwi-Environmental-Management-Plan-2008.pdf
Patuharakeke Hapū Environmental Management Plan
2014 Ngāti Manaia, Ngāi Tahuhu, Ngāti Wharepaia, Ngāti Ruangaio, Te Parawhau and Ngāti Tu
Juliane Chetham, Ani Pitman and Patuharakeke Te Iwi Trust Board Working Party
https://patuharakeke.s3.ap-southeast-2.amazonaws.com/public/website-downloads/Patuharakeke-Hapu-Environmental-Management-Plan-December-2014.pdf?vid=3
Te Pou o Kāhu Pōkere Iwi Management Plan Ngāti Whātua Ōrākei
2018 Ngāti Whātua Ōrakei Ngāti Whātua Ōrakei and Auckland Council
http://ngatiwhatuaorakei.com/wp-content/uploads/2019/08/58087_Ngati_Whatua_Orakei_Iwi_Management_Plan_FINAL.pdf
Whaia te Mahere Taiao a Hauraki: Hauraki Iwi Environmental Plan
2004 Hauraki Iwi Hauraki Iwi https://www.waikatoregion.govt.nz/assets/WRC/Community/Iwi/Hauraki-Iwi-EMP-March-2004.pdf
Tauranga Moana Iwi Management Plan 2016-2026: A Joint Environmental Plan for Ngāti Ranginui, Ngāi Te Rangi and Ngāti Pūkenga
2016 Ngāti Ranginui, Ngāi Te Rangi and Ngāti Pūkenga
Elva Conroy & Malc Donald, Conroy & Donald Consultants Ltd, Kiamaia Ellis, Te Rūnanga o Ngāi Te Rangi Iwi Trust
https://www.boprc.govt.nz/media/554748/tauranga-moana-imp-2016_final.pdf
Te Atiawa o Te-Waka-a-Māui Iwi Environmental Management Plan
2014 Te Atiawa o Te-Waka-A-Māui
Te Atiawa o Te-Waka-A-Māui
https://www.teatiawatrust.co.nz/assets/Uploads/Te-Atiawa-Iwi-Environmental-Management-Plan.pdf
Ngāti Koata no Rangitoto ki Te Tonga Trust Iwi Management Plan
2002 Ngāti Koata No Rangitoto Ki Te Tonga
Ngāti Koata No Rangitoto Ki Te Tonga Trust
https://www.nelson.govt.nz/assets/Our-council/Downloads/Iwi-Management-Plans/Ngati-Koata-Trust-IMP-Iwi-Management-Plan-24May2002-A1133068.pdf
Mahaanui Iwi Management Plan
2013 Ngāi Tūāhuriri Rūnanga, Te Hapū o Ngāti Wheke (Rāpaki), Te Rūnanga o Koukourārata, Ōnuku Rūnanga, Wairewa Rūnanga, Te Taumutu Rūnanga
Dyanna Jolly and Ngā Papatipu Rūnanga Working Group
https://mahaanuikurataiao.co.nz/wp-content/uploads/2019/08/Full-Plan.pdf
20
Name of IEMP Date Iwi/hapū represented
Author/s Website link
Te Tangi a Tauira – The Cry of the People: Ngāi Tahu ki Murihiku Natural Resource and Environmental Iwi Management Plan
2008 Rūnanga Papatipu o Murihiku – Awarua, Hokonui, Oraka/Aparima and Waihōpai.
Ilana Batchelor, Dyanna Jolly, Don Mowat (Waihōpai), Rewi Anglem (Hokonui), Stewart Bull (Oraka Aparima), George Ryan (Awarua) and Michael Skerrett (Te Ao Mārama Inc./Waihōpai).
https://www.es.govt.nz/repository/libraries/id:26gi9ayo517q9stt81sd/hierarchy/about-us/plans-and-strategies/regional-plans/iwi-management-plan/documents/Te%20Tangi%20a%20Tauira%20-%20The%20Cry%20of%20the%20People.pdf
2.2.1 Data Collation and Analysis
IEMP Search Criteria
In October 2020 MfE provided NIWA with an initial list of key words, values and themes that formed
the basis of an initial search of the accessible literature. These key themes included Te Tiriti,
kaitiakitanga, mātauranga Māori, taonga, Te ao turoa, wairua, Tangaroa, and manaaki whenua. The
IEMP data were collated and analysed for themes that were commonly used across IEMPs. Our next
tier of data collation involved searching the IEMPs for any narratives that were directly related to the
project scope, e.g., port or shipping lane specific and/or the environmental effects of ship
exhaust/scrubber discharges. These narratives were then collated into tables under the key themes,
presented by port and by shipping lane. The IEMP wording reflected in the resulting tables is virtually
unchanged so that any potential for misinterpretation is avoided.
Limitations of the Approach
Our approach recognises that not all iwi and hāpu who may be affected by ship exhaust/scrubber
discharges may know about this issue or have publicly available IEMPs. For example, the rohe of
Makaawhio also extends to Milford Sound, but they do not have an IEMP available. Further, Treaty
settlement processes are still underway which will continue to increase the number of groups who
are recognised to have rights and interests in the ports and shipping lanes included in this review.
This is important to acknowledge as there is not “one Māori world view”. Perspectives will vary
between iwi, hāpu, whānau and marae which have been developed over time through their
interactions with their marine environment. While many similarities exist between different IEMPs,
assumptions should not be made that all values and perspectives will be the same across the
affected parties. MfE have also directly contacted iwi in North and South Island regions where large
vessels visit and this will be particularly important for iwi who may not have publicly available
resources that communicate their interests and concerns in relation to the marine environment.
The IEMPs accessed were published over a range of timeframes. The timeframes in which the plans
were published affects the data collated from them. For example, many plans have not been updated
since they were first published and so do not include information regarding environmental issues
that have manifested in more recent times. Ship exhaust/scrubbing is quite a new and niche subject
so may not be well known by iwi/hapū to, in turn, express their positions on it.
With regards to the shipping lanes, specific areas of interest for this review were identified in Section
1.3. It is understood that the shipping lanes extend over many rohe moana but for this project only
specific areas within these lanes were assessed. The specific areas were selected to provide a range

21
of different environments including those that could be the most affected by scrubbing. As
mentioned previously (Section 1.2) there may be additional locations along these shipping lanes that
are of high risk from an iwi and hapū perspective that were not considered in this assessment.
2.3 Results
2.3.1 Ports
Marsden Point Port
Three IEMPs relevant to Whangārei Harbour were collated to inform this review: Te Iwi o Ngatiwai
Iwi Environmental Policy Document (2007), Ngā Tikanga mo te Taiao o Ngāti Hine (2008), and the
Patuharakeke Hapū Environmental Management Plan (2014). The following section introduces their
rohe boundaries, as expressed by each iwi, and summarises any relevant narratives from their IEMPs
(Table 2-2).
Te Iwi o Ngatiwai Iwi Environmental Policy Document I te tangi o Tukaiaia i te moana Kei te moana a Ngatiwai e haere ana Ina tangi a Tukaiaia ki uta Kei te whenua a Ngatiwai e haere ana Te Iwi o Ngatiwai extends from Tapeka Point in the Bay of Islands to Takatu Point, south Omaha and encompasses the eastern seaboard and all off-shore islands, including Tawhiti Rahi and Aorangi (Poor Knights), Taranga and Marotere (Hen and Chickens Islands), Aotea (Great Barrier Island) and Hauturu (Little Barrier Island) Source: Te Iwi o Ngatiwai Iwi Environmental Policy Document (2007)
Ngā Tikanga mo te Taiao o Ngāti Hine Ko Hineamaru te tupuna Ko Taumarere te awa Ko Ngāti Hine te lwi Ngāti Hine Pukepukerau Source: Ngā Tikanga mo te Taiao o Ngāti Hine (2008)

22
Patuharakeke Hapū Environmental Management Plan Ko Manaia te Maunga Ko Whangārei Terenga Paraoa te Moana Ko Takahiwai te Marae Ko Rangiora te Whare Hui Ko Patuharakeke te Hapū Tihei mauri ora! We acknowledge that in various areas we share mana whenua with other hapū. However… our wider rohe… includes: "...all the lands beginning at Otaika then west to Tangihua ranges. This includes Ruarangi. Then south through Waikiekie and on to Taipuha and then across to Wakatarariki (Bream Tail) ... onwards to the northern point of Mangawhai harbour, then out to Te Hauturu o Toi to Aotea and up through the Mokohinau's to Tawhitirahi and Aorangi (the Poor Knights) and encompassing Marotiri, Ngatuturu and Taranga (the Hen and Chickens). This shared mana whenua and mana moana to these islands is acknowledged through Oneho the daughter of Te Taotahi, son of Motatau, and their ancient Ngāti Manaia whakapapa… At the North-eastern side of the entrance to Whangarei Harbour, at Home Point, sits the pa of Hikurangi, then at Whangarei Heads (Te Whara) the pa of Te Whakaariki and at Tamaterau the small sentinel pa of Te Pirihi is situated. The boundary runs across the harbour to the south side up through Toetoe to Otaika (the point of commencement) and back down the harbour to take in Kopuawaiwaha, Mangapai, Totara, Springfield, Mata, Mangawhati, Ngatiti, Takahiwai, One Tree Point, Poupouwhenua, Ruakaka, Waipu and Langs Beach to Wakatarariki (Bream Tail)”. Source: Patuharakeke Hapū Environmental Management Plan (2014)

23
Table 2-2: Issues, objectives, policies and methods identified in IEMPs relevant to Whangārei Harbour.
Key themes Te Iwi o Ngatiwai Iwi Environmental Policy Document Ngā Tikanga mo te Taiao o Ngāti Hine Patuharakeke Hapū Environmental Management Plan
Kaitiakitanga Issues >The lack of direct and effective Ngatiwai involvement, as the kaitiaki, in the sustainable management of their ancestral taonga, including water and air.
Issues >The lack of direct and effective involvement, as the kaitiaki for Ngāti Hine in the sustainable management of our ancestral taonga. This includes water, soil, minerals, air, indigenous flora and fauna and our heritage Objectives >The relationship of Ngāti Hine and our culture and traditions with our ancestral taonga is recognised and provided for as a matter of national importance by councils and other statutory agencies.
Issues >Current relationships are limited in their provision for the full participation of Patuharakeke as equal partners in decision making processes affecting natural and physical resources in our rohe Objectives >Patuharakeke will strengthen and establish ongoing meaningful relationships with our neighbours, community, developers and agencies to ensure we are appropriately acknowledged as kaitiaki of our rohe.
Mātauranga Issues >The misappropriation or misuse of Ngatiwai indigenous knowledge and the cultural, genetic or biological resources and practices to which that knowledge relates, without the prior informed consent of Ngatiwai Objectives >Any information about Ngatiwai mātauranga, and the cultural, genetic or biological resources and practices to which that knowledge relates, obtained from Ngatiwai by councils, government departments, other organisations and private individuals is an intellectual property right of Ngatiwai, and must in no circumstances be alienated from them.
Issue >The misappropriation or misuse of Ngāti Hine indigenous knowledge and the cultural, genetic or biological resources and practices to which that knowledge relates, without the prior informed consent of Ngāti Hine. Policies >Information obtained from Ngāti Hine by councils, government departments and other organisations is an intellectual property right of Ngāti Hine and must in no circumstances be alienated from Ngāti Hine. >No organisation/individual may access, use or retain the Ngāti Hine knowledge without the express permission of Te Roopu Kaumatua me nga Kuia o Ngāti Hine i raro i Te Tiriti o Waitangi, or their nominated kaumatua as the kaitiaki of that knowledge.

24
Table continued: Issues, objectives, policies and methods identified in IEMPs relevant to Whangārei Harbour.
Key themes Te Iwi o Ngatiwai Iwi Environmental Policy Document Ngā Tikanga mo te Taiao o Ngāti Hine Patuharakeke Hapū Environmental Management Plan
Water Issues >The mauri of water (creeks, streams, water bodies, wet areas, wetlands, swamps, springs, dune lakes, aquifers, thermal waters, estuarine waters and coastal waters) and soil and their associated ecosystems within the rohe of Ngātiwai is being destroyed or lost through ignorance, oversight, misuse, exploitation, contamination and abuse. >Impacts on the mauri of a resource create negative flow-on impacts on other resources, and cause opportunity losses for Ngātiwai people. Objectives >The sustainable management of water, soil and air in a collaborative manner considering all flow on effects.
Issues >Water is of special significance to Ngāti Hine. It is a living entity. Everything emerges from water. Wetlands are of particular importance to us. >Water, soils, minerals and air must be seen in the context of the whole environment not as separate elements.
Issues >The cultural health of Whangārei Terenga Paraoa, Bream Bay and our estuaries is adversely affected by: i. Direct discharges of contaminants, including wastewater and stormwater; ii. Sedimentation; iii. Diffuse pollution from rural, urban and industrial land use; iv. Reclamation, drainage and degradation of coastal wetlands; and v. The cumulative effects of activities. Objectives >Whangārei Terenga Paraoa, Bream Bay and our estuaries are precious taonga and the home of myriad species and are respected for their taonga value above all else. >Patuharakeke have a leading role in managing, monitoring and enhancing coastal water quality in our rohe.
Air Issues >The mauri of air within the territory of Ngātiwai is being destroyed or lost through ignorance, oversight, misuse, exploitation, contamination and abuse and the lack of direct and effective Ngātiwai involvement, as the kaitiaki, in the sustainable management of their ancestral taonga, air. Objective >The mauri of air is protected and enhanced in ways which enable Tāngata Whenua to provide for their social, economic and cultural wellbeing; and that of generations as yet unborn.
Issues >The mauri of air within the rohe of Ngāti Hine is being destroyed or lost through ignorance, oversight, misuse, exploitation, contamination and abuse. Objectives >The life supporting capacity of air enables optimum health and wellbeing for all Ngāti Hine, those we host within our rohe; our plants, animals and other whanaunga, and our water bodies and moana. Policy >The discharge of contaminants into the air will be progressively reduced by the active promotion and adoption of environmentally friendly methods.
Issues >The discharge of contaminants-to-air can have adverse effects on Patuharakeke values such as mauri, mahinga kai, waahi tapu, and marae, and the health of our people and communities. Objectives >Protecting the mauri of air from adverse effects related to the discharge of contaminants to air. >Patuharakeke are involved in regional decision-making on air quality issues.
Climate change Policy >A collaborative approach is required by all decision-makers in central Northland as to how best to take advantage of any beneficial aspects of climate change and how to ensure that we are prepared for the negative impacts of climate change
Issues >Climate Change will impact the cultural, economic, social, and environmental wellbeing of Patuharakeke, and the magnitude, nature and timing of these effects on Patuharakeke and our taonga tuku iho have not been assessed. Objective >Patuharakeke hapū and whanau community have sufficient information to allow us to plan for the effects of climate change

25
Table continued: Issues, objectives, policies and/or methods identified in IEMPs relevant to Whangārei Harbour.
Key themes Te Iwi o Ngatiwai Iwi Environmental Policy Document Ngā Tikanga mo te Taiao o Ngāti Hine Patuharakeke Hapū Environmental Management Plan
Kaimoana / fisheries
Issues >The ability to put kaimoana on the table for manuhiri and whanau at tangi, hui and other events on Ngātiwai marae, and to feed Ngātiwai whānau and hapū on a regular, sustained basis, is being increasingly compromised by damage to the mauri of water.
Issues >The ability to put kaimoana on the table for manuhiri and whanau at tangi, hui and other events on Ngāti Hine marae, and to feed Ngāti Hine whanau and hapū on a regular, sustained basis, is being increasingly compromised by damage to the mauri of water. The mixing of different mauri by human intervention is offensive to Ngāti Hine.
Issues >Increasing pressure on the kaimoana resources in our rohe as a result of: i. Discharges to the coastal marine area and harbour, and impacts on coastal water quality; ii. Harvesting pressure; iii. Lack of awareness among visitors of the importance of our harbour, bays and estuaries as mahinga kai; iv. industrial activities; and v. Biosecurity risks. >There is a need to implement appropriate tikanga-based management tools for protecting and enhancing the marine environment and customary fisheries Objective >There is diversity and abundance of mahinga kai in our rohe moana, the resources are uncontaminated and healthy, and Patuharakeke have unimpeded access to them. >Role of Patuharakeke as kaitiaki of the coastal environment/sea is recognised and provided for in coastal/marine management.
Whangārei Harbour
Issues >An example of the damage to the mauri of water within the rohe of Ngatiwai is Whangārei Terenga Paraoa Harbour. Prior to European contact the harbour boasted numerous annual visits of marine mammals. Now it has been turned into a dumping ground for fertilizer run-off, stock wastes and sediment coming from farming operations; sediment from forestry activities and subdivision development; city storm water runoff; and raw sewage from non-functioning pumping stations and broken down and out of date pipelines. The Whangārei Town Basin - within the central city area of the harbour - requires regular dredging to maintain depth for visiting yachts. The dredged spoil then requires disposal. This is another concern to Tāngata Whenua
Issues >The location of the oil refinery, Northport and busy shipping routes in our rohe moana and coastal waters places our marine environment at risk of oil spill >There is a need to work closely with NRC, NPC, Northport and Refining NZ to manage effects of industrial activities on the mauri and cultural health of the harbour and the relationship of tangata whenua to it. Objectives > Patuharakeke are informed and able to participate in any oil spill response and the mauri and cultural health of Whangārei Terenga Paraoa and cultural landscapes and seascapes are not further compromised by industrial activities at Poupouwhenua.

26
Table continued: Issues, objectives, policies and methods identified in IEMPs relevant to Whangārei Harbour.
Key themes Te Iwi o Ngatiwai Iwi Environmental Policy Document Ngā Tikanga mo te Taiao o Ngāti Hine Patuharakeke Hapū Environmental Management Plan
Ship/vessel discharges
Method >All vessels (regardless of size or carrying capacity) within the Ngatiwai territory, from the land to Hawaiki, are banned from discharging ballast water and engine cooling water or other possible contaminated substances directly into the sea.
Issues >Increasingly the seas are subject to pollution - from the bilge waters and contaminated hulls of passing ships, effluent and litter discharges by boat owners and, in particular, the discharges and sedimentation of poor land use practices and pollutants and contaminants flushed into the seas from our waterways. >Movement of people and vessels between water bodies can spread pests and disease. Method >All vessels (regardless of size or carrying capacity) within the Ngāti Hine rohe, from the land to Hawaiki, are banned from discharging ballast water or other possible contaminated substances directly into the sea.
27
Ports of Auckland
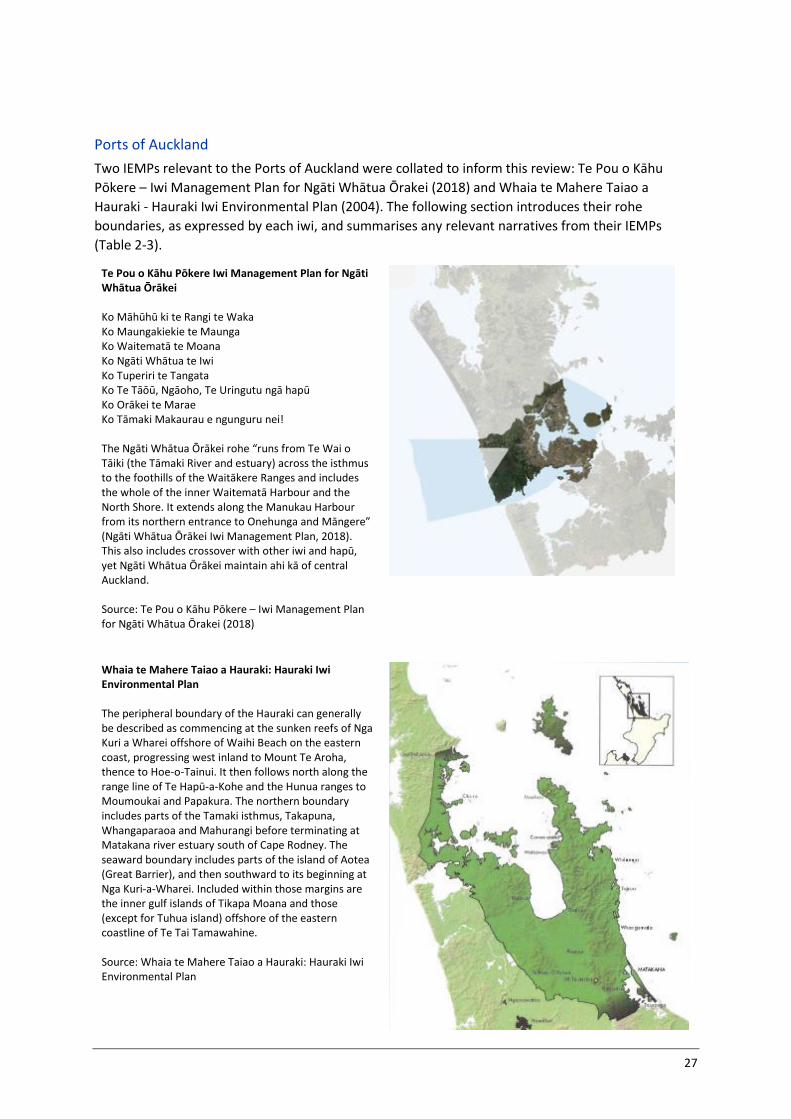
Two IEMPs relevant to the Ports of Auckland were collated to inform this review: Te Pou o Kāhu
Pōkere – Iwi Management Plan for Ngāti Whātua Ōrakei (2018) and Whaia te Mahere Taiao a
Hauraki - Hauraki Iwi Environmental Plan (2004). The following section introduces their rohe
boundaries, as expressed by each iwi, and summarises any relevant narratives from their IEMPs
(Table 2-3).
Te Pou o Kāhu Pōkere Iwi Management Plan for Ngāti Whātua Ōrākei Ko Māhūhū ki te Rangi te Waka Ko Maungakiekie te Maunga Ko Waitematā te Moana Ko Ngāti Whātua te Iwi Ko Tuperiri te Tangata Ko Te Tāōū, Ngāoho, Te Uringutu ngā hapū Ko Orākei te Marae Ko Tāmaki Makaurau e ngunguru nei! The Ngāti Whātua Ōrākei rohe “runs from Te Wai o Tāiki (the Tāmaki River and estuary) across the isthmus to the foothills of the Waitākere Ranges and includes the whole of the inner Waitematā Harbour and the North Shore. It extends along the Manukau Harbour from its northern entrance to Onehunga and Māngere” (Ngāti Whātua Ōrākei Iwi Management Plan, 2018). This also includes crossover with other iwi and hapū, yet Ngāti Whātua Ōrākei maintain ahi kā of central Auckland. Source: Te Pou o Kāhu Pōkere – Iwi Management Plan for Ngāti Whātua Ōrakei (2018)
Whaia te Mahere Taiao a Hauraki: Hauraki Iwi Environmental Plan The peripheral boundary of the Hauraki can generally be described as commencing at the sunken reefs of Nga Kuri a Wharei offshore of Waihi Beach on the eastern coast, progressing west inland to Mount Te Aroha, thence to Hoe-o-Tainui. It then follows north along the range line of Te Hapū-a-Kohe and the Hunua ranges to Moumoukai and Papakura. The northern boundary includes parts of the Tamaki isthmus, Takapuna, Whangaparaoa and Mahurangi before terminating at Matakana river estuary south of Cape Rodney. The seaward boundary includes parts of the island of Aotea (Great Barrier), and then southward to its beginning at Nga Kuri-a-Wharei. Included within those margins are the inner gulf islands of Tikapa Moana and those (except for Tuhua island) offshore of the eastern coastline of Te Tai Tamawahine. Source: Whaia te Mahere Taiao a Hauraki: Hauraki Iwi Environmental Plan

28
Table 2-3: Desired outcomes, issues, objectives and methods identified in IEMPs relevant to Ports of Auckland.
Key themes Te Pou o Kāhu Pōkere Iwi Management Plan for Ngāti Whātua Ōrākei Whaia te Mahere Taiao a Hauraki: Hauraki Iwi Environmental Plan
Kaitiakitanga Desired outcomes >Increased acknowledgement of and support for Ngāti Whātua Ōrākei values and our active exercise of kaitiakitanga. Improved strength of Ngāti Whātua Ōrākei relationships with other parties in developing and implementing initiatives to sustain cultural resources in the rohe. >Customary activities are protected and recognised, for example the sustainable harvesting of kaimoana, waka launching and marae activities.
Methods >Each one of us fulfilling our ancestral obligations to taonga. >Hauraki Whānui, like most iwi, regard themselves as the owners and kaitiaki of customary resources and the inventors of traditional knowledge and practice.
Mātauranga Desired outcome >Incorporation of Mātauranga Māori values and active exercise of kaitiakitanga in ecological reporting and in the development and implementation of initiatives for environments in the rohe.
Issues >Hauraki Whānui are concerned that native plants and animals under their care, and the traditional knowledge associated to them could be exploited for commercial purposes without their consent. Methods >Traditional and contemporary environmental management practice of Hauraki Whānui is based on tikanga and the accumulated knowledge, experience and practice of successive generations.
Water Issues >The coastlines of Tāmaki Makaurau have been significantly modified through reclamations, infrastructure and urban development. Discharges from roading, private dwellings, industries - even coastal landfill, have caused significant pollution of our waterways, coasts and harbours. Desired outcome >Water should be managed, and where necessary restored, to maintain or enhance mauri and to protect ecosystem, amenity, and mana whenua values.
Issues >Coastal pollution, ballast water, coastal habitat loss, fish and shellfish depletion, loss of productive capacity, whales, dolphins and seals and coastal management.
Air Issues >By international standards, Auckland is blessed with relatively high general air quality standards. This is partly owing to the coastal geography, and partly to the relative absence of heavy industrial activities. The most significant air quality problems relate to emissions from transport and the burning of wood for domestic heating.
Issues >Air is central to our survival. Industrial, domestic and outdoor fire and vehicle emissions, particularly around Tamaki Makaurau are polluting the air. Emissions from vehicles include carbon monoxide, nitrous oxides, and particulate and hazardous air pollutants such as benzene.
Climate change Issues >In Auckland, the main sources of greenhouse emissions are the land transport system and electricity generation. Together, these sectors account for around two thirds of Auckland’s emissions.
Objectives >Hauraki Whānui are informed about and are participating in discussion between indigenous peoples internationally and the government domestically on the impacts of climate change and ozone depletion.

29
Table continued: Desired outcomes, issues, objectives and methods identified in IEMPs relevant to Ports of Auckland.
Key themes Te Pou o Kāhu Pōkere Iwi Management Plan for Ngāti Whātua Ōrākei Whaia te Mahere Taiao a Hauraki: Hauraki Iwi Environmental Plan
Kaimoana / fisheries
Objectives >Ngāti Whātua shares interests in the fisheries of the Waitematā and Manukau Harbours with several other tribes, and will work collectively to ensure sustainable practice
Issues >The extent and abundance of seafoods in our moana has been progressively affected by sediment and contaminants coming from the land in addition to commercial and recreational harvesting.
Waitematā Harbour
Issues >Okahu Bay was the location of the Ngāti Whātua Ōrākei papakāinga into the 1950s, when the community was forcibly transplanted by the Government into an inadequate number of state houses on the hill above, and the village razed. Okahu Bay is the central locus of our rohe. >Even well before the 1950’s evictions, the bay had become emblematic of poor environmental practice and disregard for the culture and wellbeing of our community. The construction of a sewer pipe across the foreshore in the early 1900’s physically separated the kāinga from the bay and made it prone to flooding. The discharge of untreated waste directly into the sea poisoned local marine life and had a consequently deadly impact on the health of Ngāti Whātua Ōrākei, for whom kaimoana from the bay was a resource on which we depended. The bay’s ecological health and public usability have suffered from historic pollution events (e.g. sewer overflows), the piping of streams, ongoing contamination from boat maintenance practices and roading runoff - resulting in the diminishment of a harvestable shellfish resource. Increased private / commercial occupation (e.g. moorings) of the coastal marine area restrict use by the general public, and notably by our people who paddle and fish. The beach and Okahu Domain remain disconnected by Tāmaki Drive (built on the sewer pipe), which has further contributed to hapū obscurity.
Ship/vessel discharges
Issues >The Waitematā in particular is subject to intensive recreational boating activities as well as commercial shipping. Vessels are sources of direct contamination whether from direct leaching of materials (e.g., copper), or on-board activities (such as cleaning, or waste disposal).
Issues >The northern area of Tikapa Moana is traversed by oil tankers moving to Whangārei, and a large volume of container and other traffic entering the Waitemata bound for Auckland. >Ships discharging ballast water in Hauraki coastal waters have seen an increase in foreign invasions of plant and animal pests that can compete against and impact on native species.
30
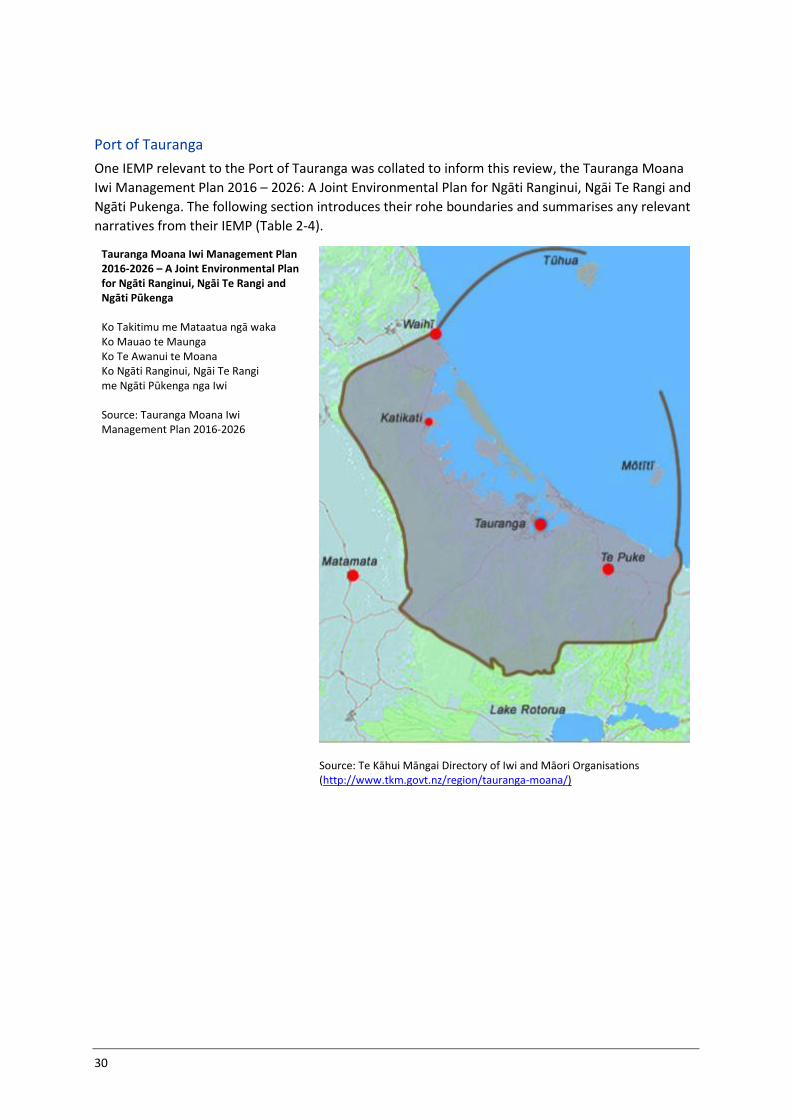
Port of Tauranga
One IEMP relevant to the Port of Tauranga was collated to inform this review, the Tauranga Moana
Iwi Management Plan 2016 – 2026: A Joint Environmental Plan for Ngāti Ranginui, Ngāi Te Rangi and
Ngāti Pukenga. The following section introduces their rohe boundaries and summarises any relevant
narratives from their IEMP (Table 2-4).
Tauranga Moana Iwi Management Plan 2016-2026 – A Joint Environmental Plan for Ngāti Ranginui, Ngāi Te Rangi and Ngāti Pūkenga Ko Takitimu me Mataatua ngā waka Ko Mauao te Maunga Ko Te Awanui te Moana Ko Ngāti Ranginui, Ngāi Te Rangi me Ngāti Pūkenga nga Iwi Source: Tauranga Moana Iwi Management Plan 2016-2026
Source: Te Kāhui Māngai Directory of Iwi and Māori Organisations (http://www.tkm.govt.nz/region/tauranga-moana/)

31
Table 2-4: Issues, objectives and policies identified in IEMP relevant to Tauranga Harbour.
Key themes Tauranga Moana Iwi Management Plan
Kaitiakitanga Policy >Enable Tauranga Moana Iwi to exercise tino rangatiratanga through active involvement in resource management processes and decisions. Councils and central government to recognise and provide for mātauranga and the practical expression of kaitiakitanga.
Mātauranga Objective >Effective dual processes are in place to allow for appropriate sharing of mātauranga Māori by tangata whenua.
Water Issues >The mauri of Te Awanui (Tauranga Harbour) and coastal areas are at risk of further degradation as a result of: a) Contaminant discharges such as wastewater, stormwater and ballast water; b) Inflow from streams carrying nutrients from agricultural and horticultural runoff as well as sediment from land and streambank erosion; c) Coastal use and development, including port activities, marina development dredging, reclamation, structures as well as recreational activities. >There are multiple uses, interests and values within Tauranga Moana. In some areas, this creates conflict between: Cultural values and interest, natural and ecological values (e.g. ecosystem, landscape, amenity), commercial use and development (including Port, marinas and tourism), recreational activities (e.g. swimming, fishing) and existing use and aspirations for further development.
Air Issue >The mauri of air within Tauranga Moana is protected and where possible enhanced. This means that the air we breathe is clean and our wellbeing is not impacted by the discharge of contaminants to air. Policy >Manage the effects of rural and urban air discharges on the health and wellbeing of our people.
Climate change
Kaimoana / fisheries
Issues >The health and wellbeing of our mahinga kai areas (coastal and freshwater) within Tauranga Moana has been adversely affected as a result of: a) Commercial fishing within the inner harbour of Tauranga Moana; b) Overfishing and shellfish harvesting; c) Development within Te Awanui (e.g. Port, marina) and along the coast; d) Pest plant and animal species; e) Poor water quality, bed disturbance activities and sedimentation; f) Hazardous substances e.g. oil, diesel. >There is a fragmented approach to coastal and fisheries management due to the involvement and jurisdiction of multiple agencies.
Tauranga Harbour
Objective >Te Awanui Tauranga Harbour, is regarded as one of the significant areas of traditional history and identity for the three Tauranga Moana iwi.
Ship/vessel discharges
Objective >Tauranga Moana Iwi and hapū to continue working closely with Port of Tauranga to manage the effects of port activities on the cultural health of the harbour. >Emergency Response (including Oil Spills): The Tauranga Moana Iwi Response Framework (see Tauranga Moana IEMP) was initially developed as a result of the Rena oil spill in Tauranga in 2011. This was also applied following the Mobil oil spill in 2015. Tangata whenua found that this framework was most effective during the initial containment phase. During the recovery phase, hapū groups preferred to work directly with the liable company.

32
Lyttleton Port
One IEMP relevant to the Lyttleton Port were collated to inform this review, the Mahaanui Iwi
Management Plan 2013. The following section introduces their rohe boundaries and summarises any
relevant narratives from their IEMP (Table 2-5).
Mahaanui Iwi Management Plan 2013 The Ngāi Tahu Mahaanui IMP was prepared through a collaboration of six Papatipu Rūnanga, representing the hapū identified as having manawhenua rights over the area from the Hurunui River to the Hakatere River and inland to Kā Tiriti o Te Moana. The name Mahaanui was given to this plan as it represents the six Hapū being connected and sharing a commitment as kaitiaki to protect and restore the health of the environment within the area. Source: Mahaanui Iwi Management Plan 2013
2.3.2 Shipping Lanes
Poor Knights Islands
One IEMP relevant to the Poor Knights Islands shipping lane area identified in Figure 1-2 was collated
to inform this review, Te Iwi o Ngātiwai Iwi Environmental Policy Document. Please see Table 2-2 for
information relevant to Ngātiwai which is not repeated here.
Mayor Island and Rangitoto Channel in Hauraki Gulf
One IEMP relevant to the Mayor Island and Rangitoto Channel shipping lane areas (as identified in
Figure 1-3 and Figure 1-2) was collated to inform this review, the Whaia te Mahere Taiao a Hauraki:
Hauraki Iwi Environmental Plan. Please see Table 2-3 for information relevant to Pare Hauraki Iwi
which is not repeated here.
Cook Strait
Two IEMPs relevant to the Cook Strait shipping lane area identified in Figure 1-3 were collated to
inform this review: Ngāti Koata no Rangitoto ki Te Tonga Trust Iwi Management Plan and Te Atiawa o
te waka o Maui Iwi Environmental Management Plan. The following section introduces their rohe
boundaries, as expressed by each iwi, and summarises any relevant narratives from their IEMPs
(Table 2-6).
Marlborough Sounds
One IEMP relevant to the Marlborough Sounds shipping lane area identified in Figure 1-4 was
collated to inform this review, Ngāti Koata no Rangitoto ki Te Tonga Trust Iwi Management Plan.
Information for Cook Strait (Table 2-6) is also relevant to Marlborough Sounds and therefore not
repeated here.

33
Table 2-5: Issues, objectives and policies identified in IEMP relevant to Lyttleton Port.
Key themes Mahaanui Iwi Management Plan 2013
Kaitiakitanga Issue >Effective recognition of kaitiakitanga in natural resource management and governance processes. >Working together with agencies, communities and people with responsibilities and interests in the protection of natural resources and the environment Objectives >Ngāi Tahu are involved in regional decision-making on air quality issues. >The role of tāngata whenua as kaitiaki of the coastal environment and sea is recognised and provided for in coastal and marine management. Policies >Local authorities should ensure that they have the institutional capability to appropriately recognise and provide for the principle of kaitiakitanga. >To enhance the exercise of kaitiakitanga through establishing relationships and recognising collaborative opportunities with external agencies (e.g. local government, Historic Places Trust, Crown Research Institutes) and the wider community, including but not limited to: (a) Collaborative management opportunities for areas of particular cultural significance; and (b) Research partnerships.
Mātauranga Policy >Researchers and bio prospectors cannot use mātauranga Ngāi Tahu without consent of Ngāi Tahu.
Water Issues >Tikanga based management tools for protecting and enhancing the marine environment and customary fisheries. >Coastal water quality in some areas of the takiwā is degraded or at risk as a result of: (a) Direct discharges contaminants, including wastewater and stormwater; (b) Diffuse pollution from rural and urban land use; (c) Drainage and degradation of coastal wetlands; and (d) The cumulative effects of activities. Objectives >Discharges to the coastal marine area and the sea are eliminated, and the land practices that contribute to diffuse (non-point source) pollution of the coast and sea are discontinued or altered. Policies >To require that coastal water quality is consistent with protecting and enhancing customary fisheries, and with enabling tāngata whenua to exercise customary rights to safely harvest kaimoana.
Air Issue >The discharge of contaminants into air can have adverse effects on Ngāi Tahu values such as mauri, mahinga kai, wāhi tapu, wāhi taonga and marae. Objectives >To protect the mauri of air from adverse effects related to the discharge of contaminants to air. Policies >To protect the mauri of air from adverse effects associated with discharge to air activities. >To require that the regional council recognise and provide for the relationship of Ngāi Tahu with air, and the specific cultural considerations for air quality, including the effects of discharge to air activities on sites and resources of significance to tāngata whenua and the protection of cultural amenity values

34
Table continued: Issues, objectives and policies identified in IEMP relevant to Lyttleton Port.
Key themes Mahaanui Iwi Management Plan 2013
Climate change Issues >Climate change could have significant impacts on the relationship of Ngāi Tahu and their culture and traditions with their ancestral land, water, sites, wāhi tapu and other taonga. Policies >To support the reduction of emissions as a response to climate change, including but not limited to: (a) Urban planning to reduce transport emissions; (b) Use of solar water heating and similar measures to reduce energy use; and (c) Improved farming practices to reduce emissions.
Kaimoana / fisheries
Issues >Tikanga-based management tools for protecting and enhancing the marine environment and customary fisheries. Policies >The most appropriate tools to protect and enhance the coastal and marine environment are tikanga based customary fisheries management tools, supported by mātauranga Māori and western science, including: (a) Taiāpure; (b) Mātaitai; (c) Rāhui; and (d) Tāngata tiaki/kaitiaki.
Lyttleton Harbour
Issues >The cultural health of the harbour is at risk as a result of the discharge of wastewater, sedimentation and inappropriate land use. >The protection and enhancement of waterways and waipuna is essential to improving the cultural health of the catchment. >The need to work closely with LPC to manage effects of port activities on the cultural health of the harbour and the relationship of tāngata whenua to it, in particular: (a) Inner harbour activities, and expansion of these activities; (b) Changes to tidal flows, ebbs and flushes as a result of structures and/or landfill in the harbour (e.g. breakwaters); (c) Disposal of dredge spoil; Objectives >Restoration of the cultural health of Whakaraupō, including elimination of wastewater discharges, reducing sedimentation and achieving a water quality standard consistent with the Harbour as mahinga kai. >Tāngata whenua continue to contribute to, and influence, community issues and projects within the catchment. >Kaimoana is managed according to Ngāi Tahu values and tikanga, enabling the sustainable customary harvest of these resources in Whakaraupō. Policies >To require that Whakaraupō is managed for mahinga kai first and foremost. This means: (a) All proposed activities for the lands and waters of Whakaraupō are assessed for consistency with the objective of managing the harbour for mahinga kai. We should be asking, “How does this activity affect the harbour?” and adjust accordingly; and (b) Water quality in Whakaraupō is consistent with the protecting mahinga kai habitat and enabling customary use (whole of harbour not just designated areas). >To adopt a holistic approach to restoring the cultural health of Whakaraupō. This means: (a) Recognising the cumulative effects of all activities on the cultural health of the harbour; (b) Recognising and providing for the relationship between land use and the cultural health of the harbour; and (c) Collaboration and integration of efforts between local authorities, Ngāi Tahu, the community, and other agencies and organisations. >To continue to maintain a good working relationship between tāngata whenua and the LPC to address cultural issues and achieve positive cultural, environmental and economic outcomes. >To require that water quality in the harbour is such that tāngata whenua can exercise customary rights to safely harvest kaimoana.
Ship/vessel discharges
Policies >To require the elimination of all direct wastewater, industrial, stormwater and agricultural discharges into the coastal waters as a matter of priority in the takiwā. >To oppose the granting of any new consents enabling the direct discharge of contaminants to coastal water, or where contaminants may enter coastal waters. >To require stringent controls restricting the ability of boats to discharge sewage, bilge water and rubbish in our coastal waters and harbours. >To recognise Whakaraupō as a working port and harbour, and to build relationships and develop clear strategies that enable these activities to occur alongside managing the Harbour for mahinga kai

35
Ngāti Koata ki Rangitoto Iwi Management Plan Ko te akaaka o te rangi ki a rātou mā, kei a tātou ngā purapura ora, ko te akaaka o te whenua. Tihei Mauriora! Ko Maungatapu te Maunga Ko Maitahi te Awa Ko Aorere te Tai Ko Tainui te Waka Ko Ngāti Koata te Iwi Ko Whakatū te Marae Nō reira tēnā kōutou katoa. Source: Ngāti Koata Ki Rangitoto Iwi Management Plan
Image Source: http://www.tkm.govt.nz/iwi/ngati-koata/
Te Atiawa o Te-Waka-A-Māui Iwi Environmental Management Plan Te Ātiawa settlement of Te Tau Ihu, the region at the top of the South Island, occurred over a number of years. Land was first settled through migration from the North Island in 1832, and by 1840 Te Ātiawa occupied land from Totaranui (Queen Charlotte Sound) to Mohua (Golden Bay). Today, the mana whenua status of Te Ātiawa is recognised within the four Marae across Te Tau Ihu: Waikawa, Whakatu, Te Awhina and Onetahua. Source: Te Atiawa o Te Waka-A-Māui Iwi Environmental Management Plan

36
Table 2-6: Issues, objectives, policies and methods identified in IEMPs relevant to Cook Strait.
Key themes Ngāti Koata no Rangitoto ki Te Tonga Trust Iwi Management Plan Te Atiawa o Te Waka o Maui Iwi Environmental Management Plan
Kaitiakitanga Issues >Combined efforts of iwi authorities, local authorities and government authorities should be used to enhance the purification of the waterways and prevent pollutants. >Ngāti Koata have a complex set of customs and lore to conserve, manage and protect their water, land, air, forests, flora and fauna.
Methods >Work with the Marlborough District Council to develop processes to support iwi participation in all aspects of management for the coastal / marine resources of the rohe
Mātauranga Issues >The coastal marine area is encompassed within the definition of waahi tapu. Under section 6 of the RMA the council must recognise and provide for the relationship of Māori and their culture and traditions within their ancestral lands, water, sites, waahi tapu and other taonga
Methods >Develop a database of mātauranga – traditional and local ecological knowledge – in partnership with statutory agencies, covering the distribution of indigenous species and their habitat needs, seasonal indicators of health and productivity, and other values and information relevant to improving the understanding of the cultural and natural ecology of the land resources of the rohe.
Water Issues >Further despoliation of coastal waters is unacceptable by Ngāti Koata. Restoration and enhancement of water quality is needed >Tangaroa ana Moana Kiwa are Kaitiaki of the waterways. Any discharge of raw sewerage and other pollutants will be seen as an affront to Māoridom and contrary to the principles of the Treaty of Waitangi, including the kaupapa of Ngāti Koata of leaving for oncoming generation a rohe to be proud of. >The coastal marine area is encompassed within the definition of waahi tapu. Under section 6 of the Resource Management Act 1991 the Council must recognise and provide for the relationship of Maori and their culture and traditions within their ancestral lands, water, sites, waahi tapu, and other taonga.
Focus >Coastal / marine water quality >Habitat integrity >Provision for customary practices, including access Objectives >The quality of coastal / marine water throughout the rohe will be a priority outcome for all managers. >The integrity of the coastal / marine habitat, inclusive of saltwater wetlands and the coastal riparian habitat, which forms the coastal / marine ecosystem throughout the rohe, will be a priority outcome for the community and all the managers of the rohe. >Te Ātiawa Iwi will be able to freely participate in both traditional and contemporary cultural practices, in engaging the coastal marine resources of the rohe. Policies >Vigorously oppose all unauthorised discharges of contaminants to coastal/marine water and intertidal areas, throughout the rohe. >Raise the understanding and awareness of tikanga and kaitiakitanga in relation to coastal / marine water quality. >Work with co-managers of the rohe to maintain the mauri of the coastal /marine ecosystems, including the saltwater wetlands and coastal riparian ecosystems.

37
Table continued: Issues, objectives, policies and/or methods identified in IEMPs relevant to Cook Strait.
Key themes Ngāti Koata no Rangitoto ki Te Tonga Trust Iwi Management Plan Te Atiawa o Te Waka o Maui Iwi Environmental Management Plan
Air Issues >Careful management is required to ensure that air quality is maintained and improved to provide a healthy environment. >To manage the air resource, we need to know what the state of our air quality is and how it is changing. >Guidelines should not be seen as a permissive limit to pollution. They are minimum requirements for air quality. Objective >The adverse effects of discharging contaminants into air be avoided, remedied or mitigated, including adverse effects on local ambient air quality, community wellbeing, amenity values, resources or values of significance to Tangata Whenua, ecosystems, water and soil. >Ensure that all persons discharging contaminants into air, avoid, remedy or mitigate any adverse effect arising from that discharge. This includes all effects likely to be noxious, dangerous, offensive, or objectionable to such an extent that there is an adverse effect on the environment. >Reduction of discharges into air of ozone depleting substances and greenhouse gases to a level which is consistent with central government initiatives and directives.
.
Climate change
Kaimoana / fisheries
Issues >Water purity is Ngāti Koata’s first goal for enhancing the restoration of fish life >Avoid, remedy or mitigate adverse effects on ecological systems including natural movement and productivity of biota, natural biodiversity and adverse effects on: >Shellfish areas >Fish spawning and nursery areas >Habitats important to the continuous survival of native species >Wildlife and marine biota Objectives >Maintenance or enhancement of water quality in the coastal marine area at a level that enables the gathering or cultivating of shellfish for human consumption (Class SG).
Policies >Protect and enhance, in conjunction with the co-managers of the rohe, those cultural and spiritual values of significance to Te Ātiawa Iwi associated with coastal / marine resources, through the protection of taonga, waahi tapu, and other cultural sites, along with mahinga kai and kai moana, and including tangible landscape / seascape features, such as small bays, headlands and beaches.
Cook Strait
Ship/Vessel Discharge

38
2.3.3 Cruise Ship Areas
Akaroa Harbour
One IEMP relevant to the Akaroa Harbour cruise ship area identified in Figure 1-5 was collated to
inform this review, the Mahaanui Iwi Management Plan. Please see Table 2-5 for relevant
information which is not repeated here. The specific issues and policies in the Mahaanui Iwi
Management Plan for Akaroa Harbour includes the following:
Issues: Appropriate tools for protecting and enhancing the marine environment and customary
fisheries; and
The discharge of wastewater into the harbour is culturally offensive and incompatible with the
harbour as mahinga kai.
Policies: To require that water quality in Akaroa Harbour is consistent with protecting and
enhancing customary fisheries, and with enabling tāngata whenua to engage in mahinga kai
activities; and
The Akaroa Taiāpure is a significant mechanism to protect the Akaroa Harbour marine
environment and mahinga kai values.
Milford Sound
One IEMP relevant to Milford Sound as used to inform this review: Ngāi Tahu ki Murihiku Natural
Resource and Environmental Iwi Management Plan. The following section introduces their rohe
boundaries, as expressed by Ngāi Tahu ki Murihiku, and summarises any relevant narratives from
their IEMP (Table 2-7).
Ngāi Tahu ki Murihiku Natural Resource and Environmental Iwi Management Plan The Ngāi Tahu ki Murihiku is a collaboration between the four Rūnanga Papatipu o Murihiku who are collectively involved in protecting and promoting the areas natural and physical resources in the Murihiku area. Source: Ngāi Tahu ki Murihiku Natural Resource and Environmental Iwi Management Plan.

39
Table 2-7: Issues, objectives, policies and/or methods identified in IEMP relevant to Milford Sound.
Key themes Ngāi Tahu ki Murihiku Natural Resource and Environmental Iwi Management Plan
Kaitiakitanga Policies >Actively engage and work with Te Rūnanga o Ngāi Tahu by contributing local rūnanga principles and views toward the formation of tribal policy in respect to climate change. >Ngāi Tahu ki Murihiku shall actively participate in interagency and cross boundary decision making in respect to development, design and placement of structures and where appropriate may provide qualified recommendations for the protection of amenity values. >Promote communication and collaboration between groups with an interest in or have links with the coastal environment and its management.
Mātauranga Issues >The importance of customary use to Ngāi Tahu identity and history. Policies >Encourage collaborative research and monitoring projects between tangata whenua and scientists that address customary use issues using both mātauranga Māori, or traditional knowledge, and mainstream science.
Water Issues >Protection of the mauri of all water. >Impacts on coastal water quality: discharge of sewage from boat (currently 500 m offshore), and grey water containing contaminants (e.g. cleaners, soap). >Point source discharges into the ocean in the form of agricultural chemicals and pesticides, sewage and industrial waste. >Impacts on coastal water quality as a result of discharges (sewage, grey and ballast water) from commercial and recreational vessels. >Impacts of discharges of contaminants on water resources and the relationship of Ngāi Tahu ki Murihiku to such resources. Policies >Encourage protection and enhancement of the mauri of coastal waters, to ensure the ability to support cultural and customary usage. >Avoid the use of coastal waters and the ocean as a receiving environment for the direct discharge of contaminants.
Air Issues >The effect of discharges of contaminants into air on the air’s quality, the health of people and communities and the environment; >The effect of discharges of contaminants to the air which can be noxious, dangerous, offensive and objectionable (i.e. odour, smoke or dust) on the environment or amenity values. >Discharges to air from industrial and trade premises impact on mahinga kai, taonga species, e.g., tītī, biodiversity and wāhi tapu, wāhi taonga. >Impacts on cultural well-being from poor air quality and airborne diseases. >There is a lack of understanding of effects on cultural well-being, hinengaro (mind), wairua (spirit), mauri (life force), tinana (body) from increased levels of air pollution. Policies >That the life supporting capacity, mauri, of the global atmosphere will be understood and protected through the principle of kaitiakitanga. >Increase awareness of Mātauranga Māori about the interconnectedness of the environment and the impacts of cumulative effects on air quality.
Climate change Issues >Activities within Murihiku are contributing to the cumulative effects of greenhouse gas emission. >Effective solutions to address greenhouse emissions need to be managed at all levels. Policies >Actively support the promotion of appropriate disposal of toxic emissions and discharge methods through improved technology.

40
Table 2-7 continued: Issues, objectives, policies and/or methods identified in IEMP relevant to Milford Sound.
Key themes Ngāi Tahu ki Murihiku Natural Resource and Environmental Iwi Management Plan
Kaimoana / fisheries
Issues >Impacts on kaimoana, kaimātaitai and mahinga kai as a result of discharge activities. >Restoration of key mahinga kai areas and species.
Milford Sound Policies >Carefully monitor the nature and number of concession applications for commercial recreation and tourism operations in the Piopiotahi area, to ensure that human activities are not compromising the natural character, beauty or ecology of the region.
Ship/vessel discharges
Issues >Cumulative effects on the remoteness, wilderness, intrinsic values, natural character and amenity values of the Fiordland coast arising from the increase in numbers of vessels (increased surface water activities) operating in Fiordland. >Discharge of effluent from vessels within management areas. Policies >Strongly discourage discharges of human sewage and ballast water into coastal waters from commercial vessels and ships. >Advocate for removal of contaminated effluent to designated land-based sewage and grey water discharge facilities in all areas where commercial vessels operate (e.g. Patea), or where appropriate, the use of technology that avoids discharge of effluent to water. >Encourage all vessel operators to invest in the overall health of coastal Fiordland, through using only environmentally friendly products on board (e.g. soaps and detergents). >Encourage operators to take advantage of new technologies to better manage the effects of commercial tourism development on the environment (e.g. waste discharge from boats). >Ensure that commercial and recreational vessels recognise for impacts of discharge on coastal water quality. Policies 1-4 under provision 3.6.7 above should also be recognised by all coastal water commercial and recreational vessel users within Southland. >Ensure that there is no sewage or grey water discharged directly into our oceans from coastal activities or vessels/ structures. Any removal of sewage or grey water should be undertaken where appropriate discharges facilities are located to avoid any unwarranted discharge into coastal waters. >Advocate for the adoption of improved treatment systems for the discharge of water and contaminants to reduce the likelihood of effects on the coastal environment from both upstream and coastal water activities. This includes investigations and improvements to existing coastal sewage infrastructure and management and treatment of ballast water.

41
2.4 Discussion
IEMPs for the identified areas of interest were used as the primary literature source to collate data
on Māori values that could be affected by ship exhaust/scrubber discharges for various ports and
shipping lanes around Aotearoa New Zealand. Several reoccurring themes were identified across
IEMPs that were relevant to scope and risk assessment areas of interest of this report. These themes
included kaitiakitanga, mātauranga, water, air, kaimoana/fisheries, climate change and taniwha.
All IEMPs highlighted the importance of practicing and enacting kaitiakitanga as mana whenua. A key
concern identified in the IEMPs is the lack of recognition and effective involvement of mana whenua,
as kaitiaki, in decision making and marine management. The IEMPs state the need for councils and
other statutory agencies to recognise their status as kaitiaki. For example, Te Ātiawa o Te Waka-A-
Māui Iwi Environmental Management Plan (2014) exemplifies the value and practice of kaitiakitanga
as: “Te Ātiawa ki Te Tau Ihu is kaitiaki in its Te Tau Ihu rohe. Te Tau Ihu is their unique place and it is
the essence of identity and as kaitiaki Te Ātiawa is obligated to ensure that the environment is
sustainably used and managed”. This example shows how Te Ātiawa ki Te Tau Ihu understand
kaitiakitanga and their role as kaitiaki of their rohe. This is important to acknowledge as it helps to
express the specificities of space and place for mana whenua.
A further theme identified across IEMPs is mātauranga. Most IEMPs stated the need for further
protection of iwi and hapū mātauranga. The “extraction” of mātauranga is a key concern expressed
across IEMPs. Councils and other statutory agencies need to recognise the intellectual property rights
associated with mātauranga Māori that is shared. For example, Te Iwi o Ngatiwai Iwi Environmental
Policy Document highlights the importance of consent and the appropriate use of mātauranga as:
”The misappropriation or misuse of Ngatiwai indigenous knowledge and the cultural, genetic or
biological resources and practices to which that knowledge relates, without the prior informed
consent of Ngatiwai. Consent from mana whenua is key to ensuring effective and continued
relationships.”
All IEMPs discussed the importance of water as a taonga and raised concerns about degrading the
mauri of water. Water was further defined in some plans as referring to: creeks, streams, water
bodies, wet areas, wetlands, swamps, springs, dune lakes, aquifers, thermal waters, estuarine waters
and coastal waters. The degradation of mauri has had significant impacts on relationships of some
iwi and hapū with water. The IEMPs highlighted the need for protecting and enhancing the mauri as
means of enhancing the wellbeing of the environment and people. Furthermore, some plans made
note of the diverse uses and users of the waterscapes in their rohe. For example, Tauranga Moana
Iwi Management Plan states “There are multiple uses, interests and values within Tauranga Moana.
In some areas, this creates conflict between: Cultural values and interest, natural and ecological
values (e.g. ecosystem, landscape, amenity), commercial use and development (including Port,
marinas and tourism), recreational activities (e.g. swimming, fishing) and existing use and aspirations
for further development”. This statement acknowledges the realities associated with addressing
diverse values and perspectives related to the marine environment.
In addition most IEMPs stated the need for enhancing the mauri of the air. Some IEMPs reflected on
air as a taonga and a means of survival. IEMPs that relate to the urban environment discussed the
continued degradation of air quality within cities. Those IEMPs situated in rural environments also
discussed the need for managing rural air discharges. Mahaanui Iwi Management Plan (2013)
discusses the impacts of air discharge in relation to sites that are important to them as: “The
discharge of contaminants into air can have adverse effects on Ngāi Tahu values such as mauri,

42
mahinga kai, wāhi tapu, wāhi taonga and marae”. This statement highlights the holistic nature of iwi
and hapū relationships to air and air quality. Air is not only seen as something that affects self but
also place.
Kaimoana/fisheries was a key concern raised across IEMPs. Some IEMPs discussed the impacts of
contaminant discharges and pollution on kaimoana and mahinga kai. It is clear from the IEMPs
reviewed that there is increasing pressure on kaimoana resources affecting the ability of mana
whenua to provide for both themselves and others. Iwi/hapū have suffered spiritually and physically
as a result of loss and/or decrease in kaimoana. For example, Ngāti Koata no Rangitoto ki Te Tonga
Trust Iwi Management Plan (2002) highlight the relationship between water quality and kaimoana as:
“Maintenance or enhancement of water quality in the coastal marine area at a level that enables the
gathering or cultivating of shellfish for human consumption”. This statement reflects iwi and hapū
aspirations and the need for water quality and the surrounding ecosystem to be at a level safe
enough to gather and consume kaimoana.
Although not prominent in all the IEMPs reviewed, climate change was a theme that also reoccurred.
IEMPs that discussed climate change acknowledged the impacts that this has on their relationships
with the environment. For example, Patuharakeke Hapū Environmental Management Plan expressed
the cumulative impacts of climate change as: “Climate change will impact the cultural, economic,
social, and environmental wellbeing of Patuharakeke, and the magnitude, nature and timing of these
effects on Patuharakeke and our taonga tuku iho have not been assessed”. This statement highlights
the impacts that climate change has already had on iwi/hapū – but also that there are uncertainties
associated with the future under a changing climate.
Further concerns raised within the IEMPs, but not prominent across all of the documents reviewed,
were discussions about taniwhā and customary fisheries management approaches such as taiapure
and mātaitai. These themes are important as they indicate where there may also be spatial
restrictions on environmental management activities. Misperceptions associated with taniwhā have
resulted in the mismanagement of environments where taniwhā are known to reside. Ngā Tikanga
mo te Taiao o Ngāti Hine (2008) states there is a need for “legislative requirements in regard to
Tāngata Whenua tangible and intangible beliefs including Taniwhā to be reviewed”. This ensures that
changes to environments where taniwhā reside are firstly considered. Furthermore, customary
fisheries management provide iwi/hapū with frameworks to support the protection and
enhancement the marine ecosystem, for the benefit of mana whenua. For some iwi and hapū,
customary fisheries management mechanisms have provided them with a means of enhancing the
mauri of their marine environment. For example, the Mahaanui Iwi Management Plan (2013) states
“The Akaroa Taiāpure is a significant mechanism to protect the Akaroa Harbour marine environment
and mahinga kai values”. However, not all iwi and hapū have had similar experiences with this
customary fisheries management approach.
Several IEMPs listed their issues and policies pertaining to ship/vessel discharges and/or a specific
port or harbour (summarised in Table 2-8 and Table 2-9). A key reoccurring concern is related to
contaminants or possible contaminants entering the coastal/marine environment via various
pathways (e.g., untreated discharges). IEMPs that specifically discussed ship discharges as a concern
also made clear the need for banning such practices. Those areas where significant marine impacts
have been experienced previously have developed frameworks to address and manage situations
that may reoccur, for example oil spills in the Tauranga Harbour.

43
All IEMPs that addressed port/harbour/shipping lane specificities noted their concern for the
activities that are practiced at these locations (Table 2-8 and Table 2-9). These included the effects of
recreational boating, container and oil tankers and other traffic at sea. This has not only affected
water quality in these areas but also the wellbeing of people within these areas. Furthermore, due to
the nature of continued port and recreational activities, the wellbeing of the environment (including
kaimoana) and the people who live within affected areas continues to be negatively impacted.
However, ship scrubber usage, alternate technologies and/or associated discharge quality was not
specifically mentioned in any of the IEMPs reviewed. MfE have directly contacted iwi in North and
South Island regions where large vessels visit to provide some background information on scrubbers
and to test the levels of interest in engaging at a more localised scale. MfE may need to provide some
more information to iwi and hapū on these specific issues prior to engaging with them on the
implications of this risk assessment and the potential options for future management and policy
improvements

44
Table 2-8: Summary of North Island ship discharge and location-specific issues, objectives, methods and policies referred to in IEMPs.
Whangārei Auckland Tauranga/Mayor Island Poor Knights Islands Rangitoto Channel
Ship discharges
Issues raised include: >The lack of direct and effective involvement of kaitiaki in decision making >Damage to the mauri of water, air and soil and resulting negative flow-on/cumulative effects due to contamination (e.g., oil spills) >Ability to supply kaimoana to whānau and manuhiri >Mismanagement of places over which taniwhā reside Policies/methods/objectives include: >Mana whenua relationships with their taonga are recognised and provided for by councils and other statutory agencies >All vessels (regardless of size or carrying capacity) are banned from discharging ballast water and engine cooling water or other possible contaminated substances directly into the sea
Issues raised include: >Lack of acknowledgement and support for exercising kaitiakitanga >Mauri of water, air and soil to be restored, maintained and enhanced >Discharges and contaminants causing significant pollution to waterways and seafood Policies/methods/objectives include: >Customary activities, practices and resources to be protected and recognised >Collective approaches to ensure sustainable practices
Issues raised include: > Mauri of air and water at risk of further degradation as a result of contaminant discharges and development > Health and wellbeing of mahinga kai areas affected by commercial fishing, over harvesting, development of harbour and coast, poor water quality and hazardous substances. > Fragmented approaches to coastal and fisheries management Policies/methods/objectives include: > Manage effects of rural and urban air and water discharges > Enable the exercising of tino rangatiratanga through active involvement in decision-making processes
Issues raised include: > The lack of direct and effective involvement of kaitiaki in decision making >Impacts on the mauri of a resource create negative flow-on impacts on other resources >Ability to supply kaimoana to whānau and manuhiri Policies/methods/objectives include: >Ban on all vessels from discharging contaminants or possible contaminants directly into sea >Changes to environment where taniwhā reside is prohibitied
Issues raised include: >Traditional and contemporary environmental management practices acknowledged and enacted >Coastal pollution, ballast water, coastal habitat loss, fish and shellfish depletion, loss of productive capacity, whales, dolphins and seals and coastal management Policies/methods/objectives include: >Hauraki Whānui informed about and participate in discussions that affect their people and rohe
Port, harbour or shipping lane
Policies/methods/objectives include: >Cultural health of Whangarei Terenga Paraoa and cultural landscapes and seascapes are not further compromised by industrial activities >Manage effects of industrial activities on the mauri and cultural health of the harbour and the relationship of tangata whenua to it >In the event of a spill need to work closely with NRC, NPC, Northport and Refining NZ to manage effects
Policies/methods/objectives include: >Harbour subject to intensive recreational boating and shipping activities
Policies/methods/objectives include: > In the event of an oil spill, The Tauranga Iwi Response Framework will be applied > Effects of port activities on the cultural health of the harbour managed by Tauranga Moana Iwi and Port of Tauranga
Policies/methods/objectives include: >Cultural health of Whangarei Terenga Paraoa and cultural landscapes and seascapes are not further compromised >All vessels (regardless of size) banned from discharging contaminants or possible contaminants directly into sea
Policies/methods/objectives include: >Tikapa Moana traversed by oil tankers and large volumes of container and other traffic entering the Waitemata bound for Auckland
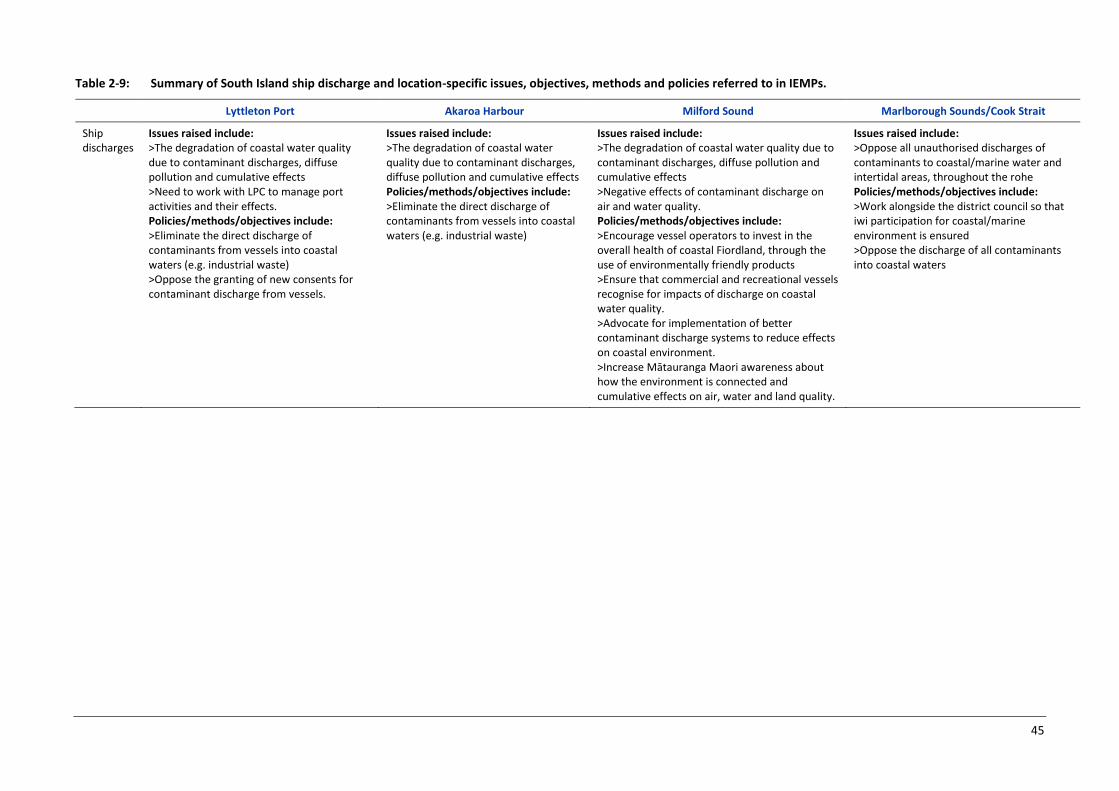
45
Table 2-9: Summary of South Island ship discharge and location-specific issues, objectives, methods and policies referred to in IEMPs.
Lyttleton Port Akaroa Harbour Milford Sound Marlborough Sounds/Cook Strait
Ship discharges
Issues raised include: >The degradation of coastal water quality due to contaminant discharges, diffuse pollution and cumulative effects >Need to work with LPC to manage port activities and their effects. Policies/methods/objectives include: >Eliminate the direct discharge of contaminants from vessels into coastal waters (e.g. industrial waste) >Oppose the granting of new consents for contaminant discharge from vessels.
Issues raised include: >The degradation of coastal water quality due to contaminant discharges, diffuse pollution and cumulative effects Policies/methods/objectives include: >Eliminate the direct discharge of contaminants from vessels into coastal waters (e.g. industrial waste)
Issues raised include: >The degradation of coastal water quality due to contaminant discharges, diffuse pollution and cumulative effects >Negative effects of contaminant discharge on air and water quality. Policies/methods/objectives include: >Encourage vessel operators to invest in the overall health of coastal Fiordland, through the use of environmentally friendly products >Ensure that commercial and recreational vessels recognise for impacts of discharge on coastal water quality. >Advocate for implementation of better contaminant discharge systems to reduce effects on coastal environment. >Increase Mātauranga Maori awareness about how the environment is connected and cumulative effects on air, water and land quality.
Issues raised include: >Oppose all unauthorised discharges of contaminants to coastal/marine water and intertidal areas, throughout the rohe Policies/methods/objectives include: >Work alongside the district council so that iwi participation for coastal/marine environment is ensured >Oppose the discharge of all contaminants into coastal waters

46
Lyttleton Port Akaroa Harbour Milford Sound Marlborough Sounds/Cook Strait
Port, harbour or shipping lane
Issues raised include: >Contaminant discharge negative effects on the land, air and water quality. Policies/methods/objectives include: >Involvement of tāngata whenua in decision-making and continue to contribute to, and influence, community issues and projects within the catchment >Ensure the harbour is managed as a mahinga kai and the water quality is raised to a level where mana whenua can safely harvest kaimoana >Tikanga based customary fishery tools supported by mātauranga māori and western science combined are the most appropriate for enhancing the coastal marine environment (e.g. Taiāpure, Mātaitai, Rahui, Tāngata tiaki/kaitiaki) >Maintain a good relationship with LPC to address cultural issues and achieve positive outcomes
Issues raised include: >Contaminant discharge negative effects on the land, air and water quality. Policies/methods/objectives include: >Involvement of tāngata whenua in decision-making. > The use of appropriate tools for protecting and enhancing the marine environment and customary fisheries. > To require that water quality in Akaroa Harbour is consistent with protecting and enhancing customary fisheries, and with enabling tāngata whenua to engage in mahinga kai activities. > The Akaroa Taiāpure is a significant mechanism to protect the Akaroa Harbour marine environment and mahinga kai values.
Issues raised include: >Protection of the mauri of all water. >Contaminant discharge negative effects on the land, air and water quality. Policies/methods/objectives include: >Encourage that the mauri of the coastal waters is enhanced and protected to allow customary usage (e.g. harvesting kaimoana) >Monitoring the number of concession applications for commercial, recreation and tourism operations so that these activities do not negatively affect Piopiotahi (Milford Sound) >Carefully monitor vessel concession applications.
Issues raised include: >The Coastal marine area is a Waahi tapu. >Prioritise the marine water quality >Contaminant discharge negative effects on the land, air and water quality. Policies/methods/objectives include: >Those who discharge contaminants to the air need to avoid, remedy or mitigate any adverse effects from this. >Work alongside go-managers of the rohe to maintain the mauri of the moana. >Encourage that the mauri of the coastal waters is enhanced and protected to allow customary usage (e.g. harvesting kaimoana)
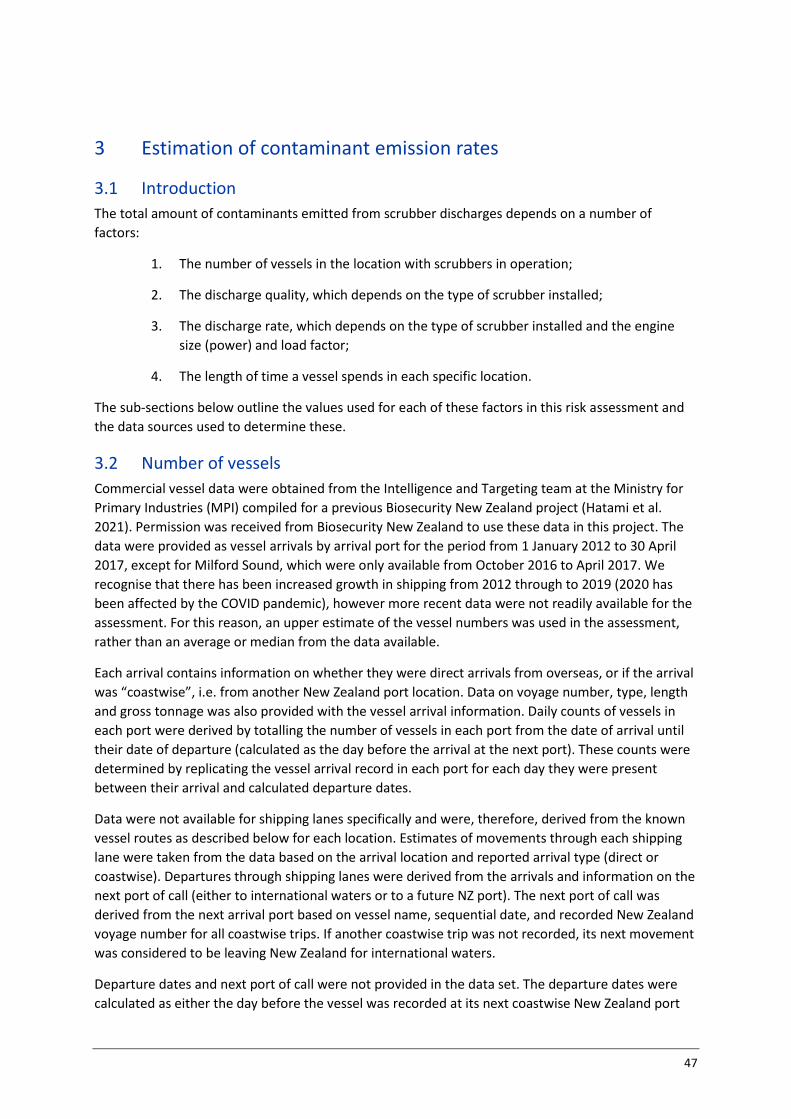
47
3 Estimation of contaminant emission rates
3.1 Introduction
The total amount of contaminants emitted from scrubber discharges depends on a number of
factors:
1. The number of vessels in the location with scrubbers in operation;
2. The discharge quality, which depends on the type of scrubber installed;
3. The discharge rate, which depends on the type of scrubber installed and the engine
size (power) and load factor;
4. The length of time a vessel spends in each specific location.
The sub-sections below outline the values used for each of these factors in this risk assessment and
the data sources used to determine these.
3.2 Number of vessels
Commercial vessel data were obtained from the Intelligence and Targeting team at the Ministry for
Primary Industries (MPI) compiled for a previous Biosecurity New Zealand project (Hatami et al.
2021). Permission was received from Biosecurity New Zealand to use these data in this project. The
data were provided as vessel arrivals by arrival port for the period from 1 January 2012 to 30 April
2017, except for Milford Sound, which were only available from October 2016 to April 2017. We
recognise that there has been increased growth in shipping from 2012 through to 2019 (2020 has
been affected by the COVID pandemic), however more recent data were not readily available for the
assessment. For this reason, an upper estimate of the vessel numbers was used in the assessment,
rather than an average or median from the data available.
Each arrival contains information on whether they were direct arrivals from overseas, or if the arrival
was “coastwise”, i.e. from another New Zealand port location. Data on voyage number, type, length
and gross tonnage was also provided with the vessel arrival information. Daily counts of vessels in
each port were derived by totalling the number of vessels in each port from the date of arrival until
their date of departure (calculated as the day before the arrival at the next port). These counts were
determined by replicating the vessel arrival record in each port for each day they were present
between their arrival and calculated departure dates.
Data were not available for shipping lanes specifically and were, therefore, derived from the known
vessel routes as described below for each location. Estimates of movements through each shipping
lane were taken from the data based on the arrival location and reported arrival type (direct or
coastwise). Departures through shipping lanes were derived from the arrivals and information on the
next port of call (either to international waters or to a future NZ port). The next port of call was
derived from the next arrival port based on vessel name, sequential date, and recorded New Zealand
voyage number for all coastwise trips. If another coastwise trip was not recorded, its next movement
was considered to be leaving New Zealand for international waters.
Departure dates and next port of call were not provided in the data set. The departure dates were
calculated as either the day before the vessel was recorded at its next coastwise New Zealand port

48
location as part of the same reported voyage number or as the day after arrival if there was no next
coastwise movement recorded as part of its New Zealand voyage.
This was implemented as follows for the five shipping lanes:
▪ Movement through the Poor Knights Islands shipping lane (north of Whangārei) considered all
vessels travelling to Auckland, Tauranga and Marsden Point from international waters as well as
those vessels travelling from these three ports for international waters. It also includes vessels
travelling from the Port of Onehunga3 and the Bay of Islands to these locations (the latter being
mostly cruise ships). Movements from north to south were taken from arrivals data for those
ports, where vessels arrived from international waters, and movements south to north were
vessels at those ports and leaving for international waters.
▪ Movement through the Rangitoto Channel shipping lane considered all vessels travelling to
Auckland from any location (international or coastwise) as well as those vessels travelling from
the port again for any location. Movements from north to south were determined from arrivals
data for port of Auckland while the departures were duplicate entries, based on an estimated
date of departure (as described above).
▪ The only vessels considered moving through the Mayor Island shipping channel were those that
travelled to Tauranga from international waters or travelled from Tauranga directly to
international waters. Arrivals were determined from arrivals data for Tauranga direct from
international waters, and the departures were all entries where the next port of call was
international waters. Vessels moving from other locations around the east coast of the North
Island travel a route further out to sea.
▪ The Cook Strait shipping lane covers vessels travelling to the west of Wellington. This includes
vessels travelling to Wellington from international waters, and those travelling from Wellington
to international waters. It also includes those vessels travelling between Wellington and New
Plymouth, Nelson and Picton; and between Nelson or Picton and Lyttelton. Movements from
north to south were determined from vessels arriving directly into Wellington from overseas,
those vessels that arrived into New Plymouth, Nelson and Picton and then went to Wellington,
and vessels travelling from Nelson or Picton to Lyttelton. The movements south to north were
calculated from vessels in Wellington and travelling to international waters or to those same
three ports, and those from Lyttelton travelling to Nelson or Picton, with a movement date
based on the estimated departure date. Cook Strait is also used for passage by international
ships that do not stop in New Zealand (pers. comm. Maritime NZ) however there are no data
available regarding the number of such vessels taking this route. The total number of vessels
using Cook Strait therefore may be significantly higher than estimated.
▪ Movements into and out of the Marlborough Sounds were counted as those arriving into Picton,
both directly as well as coastwise, and then were counted again on their calculated date of
departure, regardless of the next port of call as they will have to move through the Marlborough
Sounds to reach any new location.
3 There is no longer a commercial port at Onehunga, though it continues to be used by fishing vessels. The data used in this assessment does include a period where vessels were using this port and therefore the vessel numbers may be a slight over-estimate.

49
We assumed that only cruise ships visit Akaroa and Milford Sound, as although there were infrequent
reports of container ships into Akaroa (1 per year) this is not normal practice as there is no container
port there.
The median, 95th percentile and maximum number of vessels per day in each location are
summarised in Table 3-1. Note that these numbers were not directly used in the assessment but
provide an indication of the range of vessel counts in each location and between locations.
Table 3-1: Statistical summary of daily vessel counts in each location.
Location Median 95th percentile Maximum
Ports
Auckland 6 10 17
Tauranga 5 9 16
Lyttelton 2 5 9
Marsden Point 1 3 6
Shipping lane
Poor Knights 10 16 21
Rangitoto Channel 7 11 17
Mayor Island 4 8 12
Cook Strait 1 3 5
Marlborough Sounds
0 2 4
Cruise ship locations
Akaroa 0 1 2
Milford Sound 0 2 4
3.3 Scrubber usage and type
Estimates of scrubber usage in the world fleet were published by IMO Secretariat (2020) and an
update was provided by DNV GL for some vessel types (Table 3-2). Usage is greatest for bulk carriers
and container ships, however given the large number of these vessels in the global fleet, the
proportion is relatively low. By contrast, although the absolute numbers are lower, a much larger
proportion of cruise ships have scrubbers compared to tankers, container ships and bulk carriers. In
the absence of other information, we assumed that the vessels visiting New Zealand are
representative of the global fleet and therefore used these percentages with no adjustment.
For the 2030 scenario, we assumed that scrubber usage would increase 3-fold based on projections
by Bank of America and reported by shipping industry4. For cruise ships, this assumes that all cruise
vessels will have scrubbers, which is consistent with discussions with shipping operators. It is also
noted that a growing number of new cruise ships are being built to use liquefied natural gas (a
compliant fuel), however as it will take time for new builds to replace existing vessels, high scrubber
use is consistent with the timeframe of 2030.
4 https://safety4sea.com/cm-scrubbers-risk-and-opportunities/

50
Table 3-2: Estimates of number of scrubbers fitted and pending worldwide. Source DNV-GL (2019), HIS (2018) and DNV-GL updated 30 November 2020.
Vessel type Total number of scrubbers fitted and pending at
November 2020
2020 estimates for scrubber usage (as percentage of
global fleet)
2030 estimates for scrubber usage (as percentage of global
fleet) a
Bulk carriers 1596 13% 40%
Chemical tanker No information 5% 15%
Container ships 944 18% 53%
Cruise 220 48% 100%
General Cargo 103 0.7% 2%
Tankers 629 30% 89%
Roll on/ roll off No information 26% 78%
Vehicle carrier No information 4% 12%
Other No information 14% b 41%
Note: a Scrubber usage estimated to increase up to 3-fold. b No estimates were available for ships of type “Other”. A percentage was calculated from the mean of all vessels types except for cruise ships.
The information on scrubber type suggests most scrubbers being installed are either hybrid or open
loop systems. We calculated the daily discharge loads assuming all scrubbers were open loop (with
associated discharge volumes and quality) or all were operating in closed loop mode with associated
discharge volumes and quality.
Scrubbers can be attached to either the main engine, or auxiliary engines or both. Information we
reviewed indicated that about 1/3 of scrubbers described on the IMO GISIS system were attached to
both the main and auxiliary, approximately 1/3 on the main only and 1/3 on the auxiliary engines
only. We conservatively assumed that all scrubbers were attached to both the main engine and
auxiliary engines and that the scrubbers were therefore in operation in transit and at port, regardless
of which engines were running.
3.4 Discharge quality
The washwater discharges have low pH and contain a number of metals, PAHs and other
hydrocarbons. The washwater pH is low (acidic) due to the dissolution of sulfur dioxide, forming
sulfuric acid. The metals vanadium and nickel are the metals typically at highest concentrations in
washwaters due to their presence in heavy fuel oil. The presence of other metals (such as copper,
zinc and chromium) is generally attributed to corrosion of metal components used in the engines or
treatment systems (due in part to the low pH of the washwater). Other sources of metals include
anti-fouling and anti-corrosion (electrochemical protection) components, lubricants and taps (and
their fittings). PAHs and other hydrocarbons are present from the fuel oil and residues.
The quality of scrubber discharges has been assessed in numerous studies, generally focussing on the
pH and concentrations of metals and, in some cases, PAHs or other petroleum hydrocarbons.
Discharge quality data were collated from these studies (see Gadd 2020) to assess how the quality
differs between scrubber types and vessels (Figure 3-1 to Figure 3-10). The discharge quality is also
compared to the IMO guidelines for scrubber discharges where available and to water quality
guidelines for marine waters (ANZG 2018, see section 4.5 for further details). Note that the ANZ

51
guidelines are not designed to be compared to discharges, but to receiving waters, and are provided
only to indicate where there is potential for risk.
There is considerable variation in the discharge quality between the scrubber modes (open-loop
versus closed-loop). Contaminant concentrations are, in most cases, generally higher when operating
in closed-loop mode and this is particularly apparent for nickel and vanadium. The pH of closed-loop
scrubbers is closer to neutral than that of open-loop scrubbers due to the greater buffering available
in closed-loop scrubbers (e.g., neutralising with sodium hydroxide). The variability is very large
between vessels (and where available, even between individual samples from a single vessel) and
there are currently insufficient data to demonstrate clear differences in quality between vessel type.
Although there appears to be more variation in the discharge quality from RoRo/RoPax data
compared to other vessel types, this is most likely due to the greater number of data points for this
type (25-37 measurements compared to 1-6 for other vessel types) in studies published to date.
Variations in contaminant concentrations due to engine loading were also examined for those (few)
data where this was provided (Figure 3-11). Higher contaminant concentrations were measured
under conditions with higher loading, however there were also more data for higher loading rates,
and these concentrations may simply reflect the high variation in measured concentrations. There
were two vessels where discharge quality was examined under conditions of high and low engine
loading (Kjølholt et al. 2012, Koyama et al. 2018) and these did not show any relationship between
engine loading and discharge quality.
There are numerous other reasons for differences in quality between samples and vessels, including
differences in the engines and scrubbers (different designs, different manufacturers), timing of
samples collected (e.g., at engine start-up versus running) differences in sources of metals (e.g., use
of antifouling paints).
Figure 3-1: Levels of pH by vessel type for open and closed loop scrubber modes. Dashed line at 6.5 is the minimum allowable in the IMO guidelines, either as measured at the overboard discharge or 4 m from the discharge point when the ship is stationary (IMO Secretariat 2015).

52
Figure 3-2: Concentration of copper by vessel type for open and closed loop scrubber modes. White circles indicate where reported concentrations were below the detection limit. Circle shown at the detection limit. Dashed line is the ANZ guideline value for copper in marine waters, provided for illustrative purposes only as these guidelines are intended for use in receiving environments (i.e., after dilution).
Figure 3-3: Concentration of chromium by vessel type for open and closed loop scrubber modes. Reported concentrations below the detection limit are shown at the detection limit as white circles. Dashed line is the ANZ guideline value for chromium (VI) in marine waters, provided for illustrative purposes only as these guidelines are intended for use in receiving environments (i.e., after dilution).

53
Figure 3-4: Concentration of nickel by vessel type for open and closed loop scrubber modes. Reported concentrations below the detection limit are shown at the detection limit as white circles. Dashed line is the ANZ guideline value for nickel in marine waters, provided for illustrative purposes only as these guidelines are intended for use in receiving environments (i.e., after dilution).
Figure 3-5: Concentration of zinc by vessel type for open and closed loop scrubber modes. Reported concentrations below the detection limit are shown at the detection limit as white circles. Dashed line is the ANZ guideline value for zinc in marine waters, provided for illustrative purposes only as these guidelines are intended for use in receiving environments (i.e., after dilution).

54
Figure 3-6: Concentration of lead by vessel type for open and closed loop scrubber modes. Reported concentrations below the detection limit are shown at the detection limit as white circles. Dashed line is the ANZ guideline value for lead in marine waters, provided for illustrative purposes only as these guidelines are intended for use in receiving environments (i.e., after dilution).
Figure 3-7: Concentration of vanadium by vessel type for open and closed loop scrubber modes. Dashed line is the ANZ guideline value for vanadium in marine waters, provided for illustrative purposes only as these guidelines are intended for use in receiving environments (i.e., after dilution).

55
Figure 3-8: Concentration of mercury by vessel type for open and closed loop scrubber modes. Reported concentrations below the detection limit are shown at the detection limit as white circles. Dashed line is the ANZ guideline value for mercury in marine waters, provided for illustrative purposes only as these guidelines are intended for use in receiving environments (i.e., after dilution).
Figure 3-9: Concentration of anthracene by vessel type for open and closed loop scrubber modes. Reported concentrations below the detection limit are shown at the detection limit as white circles. Dashed line is the ANZ guideline value for anthracene in marine waters, provided for illustrative purposes only as these guidelines are intended for use in receiving environments (i.e., after dilution).
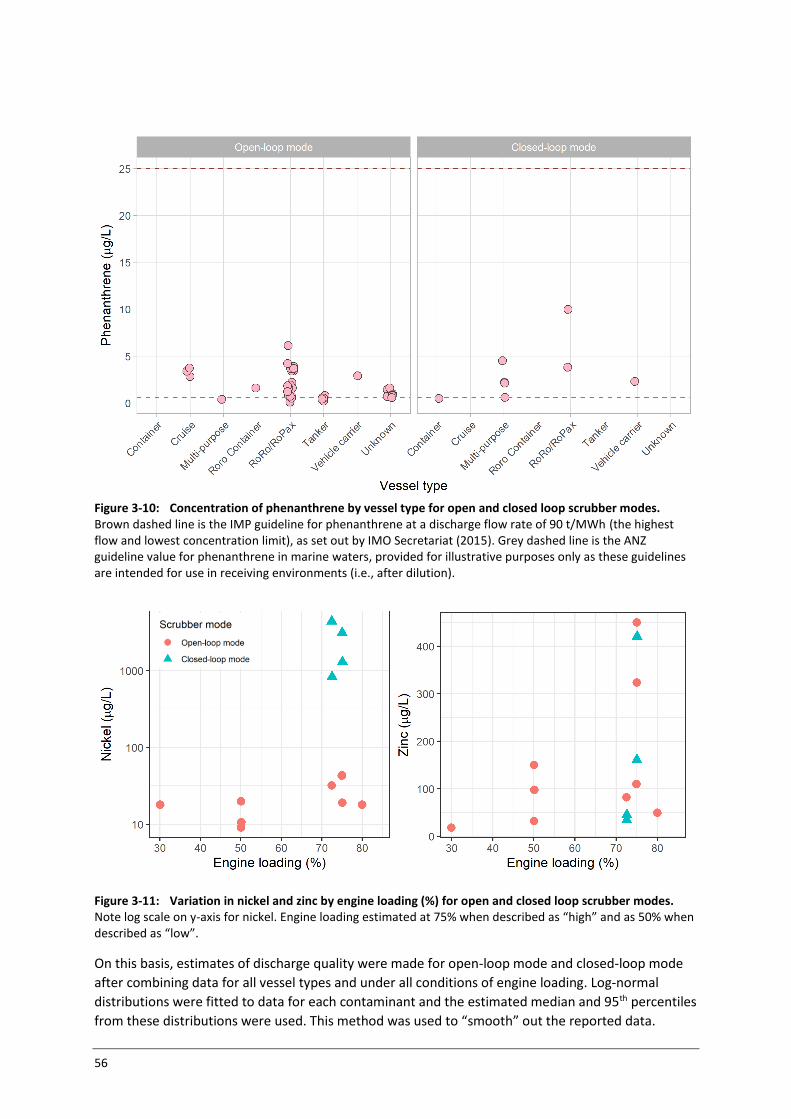
56
Figure 3-10: Concentration of phenanthrene by vessel type for open and closed loop scrubber modes. Brown dashed line is the IMP guideline for phenanthrene at a discharge flow rate of 90 t/MWh (the highest flow and lowest concentration limit), as set out by IMO Secretariat (2015). Grey dashed line is the ANZ guideline value for phenanthrene in marine waters, provided for illustrative purposes only as these guidelines are intended for use in receiving environments (i.e., after dilution).
Figure 3-11: Variation in nickel and zinc by engine loading (%) for open and closed loop scrubber modes. Note log scale on y-axis for nickel. Engine loading estimated at 75% when described as “high” and as 50% when described as “low”.
On this basis, estimates of discharge quality were made for open-loop mode and closed-loop mode
after combining data for all vessel types and under all conditions of engine loading. Log-normal
distributions were fitted to data for each contaminant and the estimated median and 95th percentiles
from these distributions were used. This method was used to “smooth” out the reported data.

57
Table 3-3: Summary statistics for the quality of scrubber discharges operating in open-loop and closed-loop modes. All data are µg/L unless stated.
Estimate pH (no units)
Chromium Copper Mercury Lead Nickel Vanadium Zinc Anthracene Phenanthrene
Open-loop mode
Number of data points 25 49 61 24 58 59 59 61 43 46
Measured median 5.2 5.0 10 0.10 5.0 33 120 30 0.02 1.3
Measured mean 4.8 17 39 0.09 9.0 50 189 106 0.10 1.7
Measured 95th percentile 3.0 a 56 150 0.10 22 141 556 324 0.34 3.9
Measured maximum 2.7 b 160 260 0.10 120 240 970 2000 1.2 6.1
Log-normal median 8.7 17 0.08 4.0 34 117 33 0.032 1.2
Log-normal mean 17 38 0.09 8.9 51 196 97 0.08 1.8
Log-normal 95th percentile 57 136 0.21 32 147 623 368 0.31 5.5
Closed-loop mode
Number of data points 9 9 14 7 14 14 15 14 8 8
Measured median 7.0 22 63.1 0.025 3.9 2900 10636 179 0.03 2.3
Measured mean 6.9 2078 152 0.051 3.3 3028 11662 425 0.08 3.3
Measured 95th percentile 6.3 a 10120 554.5 0.10 5.0 6398.5 25000 1451 0.30 8.1
Measured maximum 6.3 b 14000 860 0.10 5.0 6600 25000 2400 0.40 10.0
Log-normal median 86 66 0.024 2.5 1834 9234 180 0.03 2.2
Log-normal mean 3235 164 0.078 4.0 3733 11949 451 0.09 3.4
Log-normal 95th percentile 7221 605 0.30 13 13037 30077 1675 0.33 10.2
Notes: a 5th percentile presented as low pH is of more concern than high pH in this assessment. b Minimum presented as low pH is of more concern than high pH in this assessment.
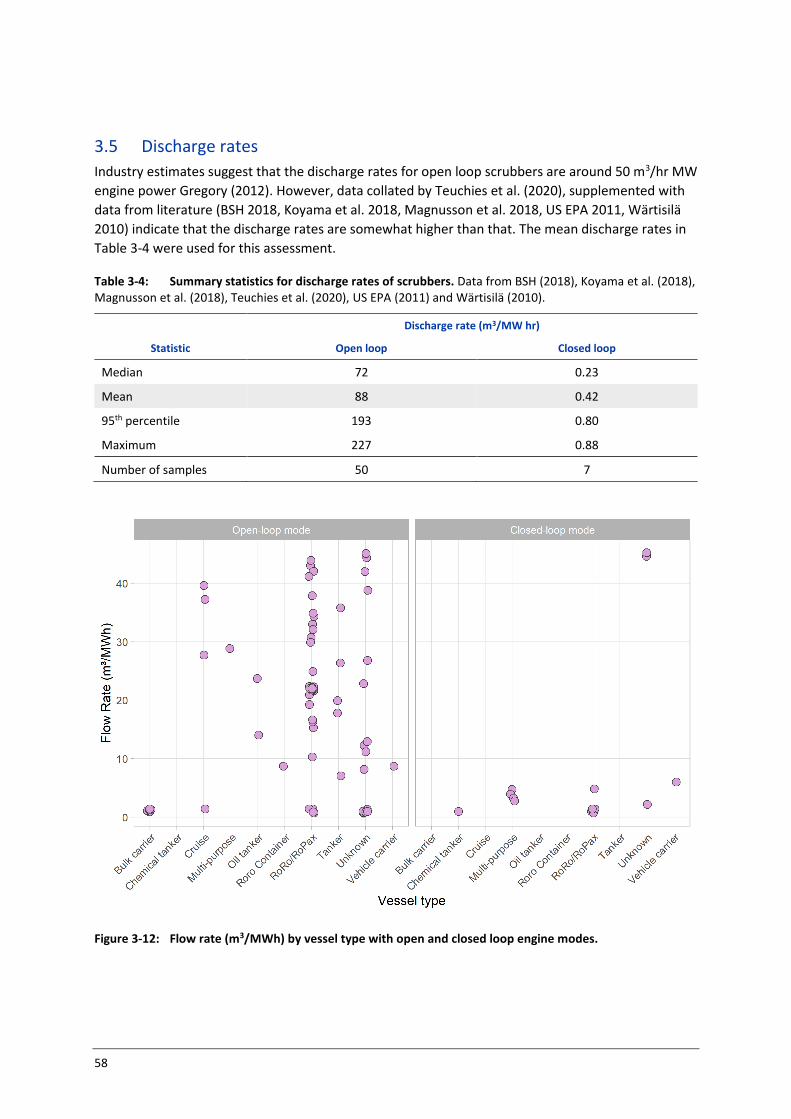
58
3.5 Discharge rates
Industry estimates suggest that the discharge rates for open loop scrubbers are around 50 m3/hr MW
engine power Gregory (2012). However, data collated by Teuchies et al. (2020), supplemented with
data from literature (BSH 2018, Koyama et al. 2018, Magnusson et al. 2018, US EPA 2011, Wärtisilä
2010) indicate that the discharge rates are somewhat higher than that. The mean discharge rates in
Table 3-4 were used for this assessment.
Table 3-4: Summary statistics for discharge rates of scrubbers. Data from BSH (2018), Koyama et al. (2018), Magnusson et al. (2018), Teuchies et al. (2020), US EPA (2011) and Wärtisilä (2010).
Discharge rate (m3/MW hr)
Statistic Open loop Closed loop
Median 72 0.23
Mean 88 0.42
95th percentile 193 0.80
Maximum 227 0.88
Number of samples 50 7
Figure 3-12: Flow rate (m3/MWh) by vessel type with open and closed loop engine modes.

59
3.6 Total daily power usage
The maximum number of vessels present in a modelled location may not represent the worst-case
scenario for scrubber discharges, if those vessels are either small (with low engine size) or of vessel
types that have low scrubber usage. To produce a realistic worst-case scenario, we therefore opted
to calculate a maximum daily power usage for each location and used that to calculate daily
emissions. This daily power usage depends on the number of vessels, their engine size, load factors
for that vessel type and location and the presence of a scrubber. The sub-sections below outline the
values used for each of these factors in this risk assessment and the data sources used to determine
these; and finally, the methods used to calculate the total daily power.
3.6.1 Engine size
The size of the engine dictates the scrubber discharge rate and therefore is an important factor in
calculating the likely emissions. For each vessel in the database, we estimated the power of the main
and auxiliary engines, based on the vessel type and size (gross tonnage). We used data from Aulinger
et al. (2016), who supplied data for cargo ships, bulk carriers, tankers, cruise ships, ferries, tugs and
other vessels5. The vessel type categories in the New Zealand vessel data were matched to those in
the Aulinger et al. (2016) data set, with the exceptions of container ships and Roll-on/Roll-off vessels
which were not provided by Aulinger et al. (2016). For these vessel types, we used estimates for
cruise ships. Data from Kjølholt et al. (2012) indicated the engine size of container and Roll-on/Roll-
off ships is similar or lower than cruise ships (whereas bulk cargo vessels typically have lower power
for any given size class).
In some cases, there were vessels in our database that were of lower gross tonnage than the lower
range of data provided by Aulinger et al. (2016) and in that case we conservatively used data for the
next largest size class.
Table 3-5: Vessel types in MOT data, matched to vessel types from Aulinger et al. (2016).
Vessel type (MoT) Vessel type (Aulinger et al. 2019)
Cruise Liner Cruise ship
Container Cruise ship
Roll On/Roll Off Cruise ship
General Cargo Cargo ship
Bulk Carrier Bulk carrier
Tanker Tanker
Ferry (all types) Ferries
Tug Tugs
Other Other
5 Described by Aulinger et al. (2016) as those where no type specification could be found.
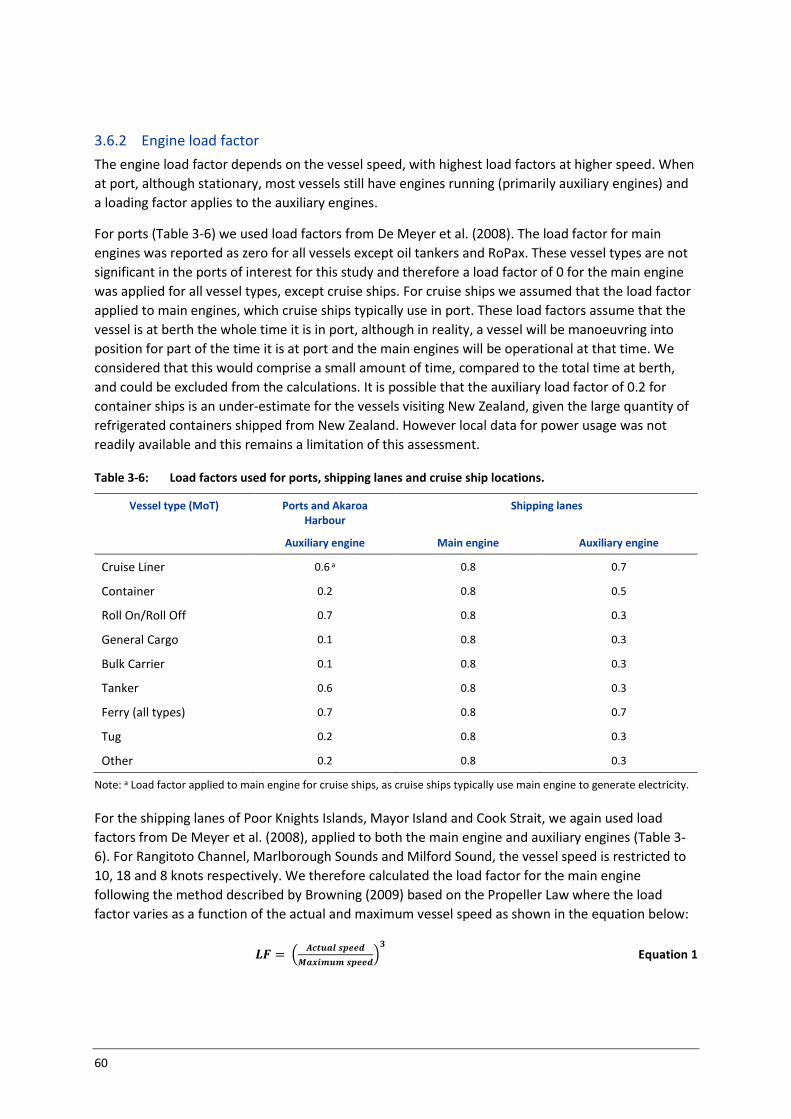
60
3.6.2 Engine load factor
The engine load factor depends on the vessel speed, with highest load factors at higher speed. When
at port, although stationary, most vessels still have engines running (primarily auxiliary engines) and
a loading factor applies to the auxiliary engines.
For ports (Table 3-6) we used load factors from De Meyer et al. (2008). The load factor for main
engines was reported as zero for all vessels except oil tankers and RoPax. These vessel types are not
significant in the ports of interest for this study and therefore a load factor of 0 for the main engine
was applied for all vessel types, except cruise ships. For cruise ships we assumed that the load factor
applied to main engines, which cruise ships typically use in port. These load factors assume that the
vessel is at berth the whole time it is in port, although in reality, a vessel will be manoeuvring into
position for part of the time it is at port and the main engines will be operational at that time. We
considered that this would comprise a small amount of time, compared to the total time at berth,
and could be excluded from the calculations. It is possible that the auxiliary load factor of 0.2 for
container ships is an under-estimate for the vessels visiting New Zealand, given the large quantity of
refrigerated containers shipped from New Zealand. However local data for power usage was not
readily available and this remains a limitation of this assessment.
Table 3-6: Load factors used for ports, shipping lanes and cruise ship locations.
Vessel type (MoT) Ports and Akaroa Harbour
Shipping lanes
Auxiliary engine Main engine Auxiliary engine
Cruise Liner 0.6 a 0.8 0.7
Container 0.2 0.8 0.5
Roll On/Roll Off 0.7 0.8 0.3
General Cargo 0.1 0.8 0.3
Bulk Carrier 0.1 0.8 0.3
Tanker 0.6 0.8 0.3
Ferry (all types) 0.7 0.8 0.7
Tug 0.2 0.8 0.3
Other 0.2 0.8 0.3
Note: a Load factor applied to main engine for cruise ships, as cruise ships typically use main engine to generate electricity.
For the shipping lanes of Poor Knights Islands, Mayor Island and Cook Strait, we again used load
factors from De Meyer et al. (2008), applied to both the main engine and auxiliary engines (Table 3-
6). For Rangitoto Channel, Marlborough Sounds and Milford Sound, the vessel speed is restricted to
10, 18 and 8 knots respectively. We therefore calculated the load factor for the main engine
following the method described by Browning (2009) based on the Propeller Law where the load
factor varies as a function of the actual and maximum vessel speed as shown in the equation below:
𝑳𝑭 = (𝑨𝒄𝒕𝒖𝒂𝒍 𝒔𝒑𝒆𝒆𝒅
𝑴𝒂𝒙𝒊𝒎𝒖𝒎 𝒔𝒑𝒆𝒆𝒅)
𝟑
Equation 1

61
The maximum speed was based on the vessel type and size, using the information from Aulinger et
al. (2016) as described in section 3.6.1. We used the maximum allowable speed in that location for
the actual speed. Where that actual speed was greater than the maximum speed for a given vessel
type and size, we assumed a load factor of 1. Load factors less than 0.25 were set at 0.25 (Aulinger et
al. 2016).
3.6.3 Calculation of total daily power
We calculated the engine power (MWh) for each vessel present on a given day, based on the load
factor relevant for each vessel type. We then randomly assigned the presence of a scrubber to each
vessel, using @RISK with a Bernoulli distribution, with a mean equal to the estimates of the
proportion of vessels with scrubbers for each vessel type in 2020 and 2030. This distribution assigns a
value of either 1 (has a scrubber) or 0 (no scrubber). The power usage associated with those
scrubbers was calculated and a total daily power usage was then calculated for 2020 and 2030, based
on the number of vessels using scrubbers in each location on any given day (Equation 2).
𝑻𝑷 = ∑ (𝑽𝑷 × 𝑳𝑭 × 𝑺)𝒏𝒊=𝟎 Equation 2
Where TP = Total daily power usage for all vessels with scrubbers (MW/hr)
VP = Maximum engine power for each vessel (MW/hr)
LF = Load factor for each vessel
S = Presence of scrubber
The maximums of the total daily power usage for 2020 and 2030 were selected for further
calculation of emissions.
3.7 Discharge duration
The total daily emissions to a specific location depend on the time that a vessel spends in that
location. The discharge durations were estimated for each location assuming that all vessels
remained in ports for 24 hours (Table 3-7). For shipping lanes, the duration depends on the length of
the shipping lane and the speed of the vessel. Vessels were assumed to be travelling at 10 knots in all
locations. The shipping lane lengths were assumed to be 20 km, except the near-shore locations
which were only 1-2 km in length (see also section 4.2.1). Cruise ships are typically in port in Akaroa
for a single day during daylight hours, however there is potential for them to stay overnight
(Johnston 2019). A duration of 24 hours was therefore used for modelling the discharges into Akaroa
Harbour. In Milford Sound the maximum speed in the section of the sound modelled is 8 knots
(Environment Southland 2019) and this was confirmed by cruise ship operators (D. McCredie pers.
comm.). At this speed, the cruise ships are expected to be within the modelled area for a duration of
0.13 hours. However, there are times when cruise ships temporarily berth in Milford Sound to unload
passengers and they may remain stationary for approximately 45 minutes during this process. A
discharge duration of 45 minutes was therefore used in the modelling as a conservative (upper)
estimate.

62
Table 3-7: Duration of discharge in each location.
Location Estimated speed (knots) Shipping lane length (km) Time spent in location (hours)
Ports
Auckland 0 - 24
Tauranga 0 - 24
Lyttelton 0 - 24
Marsden Point 0 - 24
Shipping lane
Poor Knights 10 a 20 1.1
Rangitoto Channel 10 2 0.11
Mayor Island 10 a 20 1.1
Cook Strait 10 a 20 1.1
Marlborough Sounds 10 2 0.11
Cruise ship locations
Akaroa 0 b - 24 c
Milford Sound 0 2 0.75
Note: a Vessels may travel faster than this however a lower speed represents a worse-case condition. b Vessels are assumed to be at berth in Akaroa Harbour. c This is expected to be an over-estimate as vessels typically only present during daylight hours (Johnston 2019).
3.8 Calculation of emission rates
As outlined in section 3.1, the total emissions per day depends on the number of vessels with
scrubbers, the discharge quality, and the discharge rate, which depends on the total daily power
usage. The daily emissions rates were determined using the following equation:
𝑬 = 𝑪𝒊 × 𝑸 × 𝑻𝑷 × 𝒕 Equation 3
Where E = Emissions (g/day)
Ci = Concentration of contaminant 𝑖 in the discharge (g/m3)
Q = Discharge rate (m3/MW/hr)
TP = Total daily power usage for all vessels with scrubbers (MW/hr)
t = Time spent in location (hr per day)
The discharge rates are highest for the ports of Auckland and Tauranga, followed by the Akaroa
cruise ship area (Table 3-8). The high discharge rates for the latter are due to the high scrubber usage
currently and in the future for cruise ships, compared to container ships, bulk carriers and roll-on
roll-off vessels that dominate visits to these two ports. Discharge rates for the Poor Knights Islands
shipping lane are the highest of all five shipping lanes as most vessels arriving in New Zealand come
through this lane, including many cruise ships. Although a large number of vessels also use the
Rangitoto Channel shipping lane, the lane modelled is only 2 km in length (compared to 20 km for

63
Poor Knights Islands) so the discharge occurs over a shorter duration6. Far fewer vessels use the Cook
Strait shipping lane or enter Marlborough Sounds.
Table 3-8: Comparison of daily discharges under different scrubber mode and year scenarios.
Location
Scenario Year
Maximum of total daily
power usage (MW)
Assumed scrubber type
Time of discharge (hr)
Daily discharge rate
(m3/d)
Ports
Marsden Point 2020 8 Open loop 24 15984
Marsden Point 2020 8 Closed loop 24 76
Marsden Point 2030 17 Open loop 24 35020
Marsden Point 2030 17 Closed loop 24 167
Auckland 2020 62 Open loop 24 130331
Auckland 2020 62 Closed loop 24 622
Auckland 2030 136 Open loop 24 286319
Auckland 2030 136 Closed loop 24 1367
Tauranga 2020 58 Open loop 24 122234
Tauranga 2020 58 Closed loop 24 583
Tauranga 2030 121 Open loop 24 256544
Tauranga 2030 121 Closed loop 24 1224
Lyttelton 2020 17 Open loop 24 36374
Lyttelton 2020 17 Closed loop 24 174
Lyttelton 2030 37 Open loop 24 77498
Lyttelton 2030 37 Closed loop 24 370
Shipping lanes
PoorKnights 2020 152 Open loop 1.08 14409
PoorKnights 2020 152 Closed loop 1.08 69
PoorKnights 2030 361 Open loop 1.08 34337
PoorKnights 2030 361 Closed loop 1.08 164
Rangitoto Channel 2020 80 Open loop 0.11 760
Rangitoto Channel 2020 80 Closed loop 0.11 4
Rangitoto Channel 2030 176 Open loop 0.11 1670
Rangitoto Channel 2030 176 Closed loop 0.11 8
Mayor Island 2020 98 Open loop 1.08 9348
Mayor Island 2020 98 Closed loop 1.08 45
Mayor Island 2030 229 Open loop 1.08 21801
Mayor Island 2030 229 Closed loop 1.08 104
6 Note that the discharge will also be dispersed through a smaller volume of water when modelled due to the smaller shipping lane size.

64
Location
Scenario Year
Maximum of total daily
power usage (MW)
Assumed scrubber type
Time of discharge (hr)
Daily discharge rate
(m3/d)
Cook Strait 2020 88 Open loop 1.08 8383
Cook Strait 2020 88 Closed loop 1.08 40
Cook Strait 2030 198 Open loop 1.08 18787
Cook Strait 2030 198 Closed loop 1.08 90
Marlborough Sounds 2020 58 Open loop 0.11 553
Marlborough Sounds 2020 58 Closed loop 0.11 3
Marlborough Sounds 2030 122 Open loop 0.11 1158
Marlborough Sounds 2030 122 Closed loop 0.11 6
Cruise ship locations
Akaroa 2020 41 Open loop 24 86497
Akaroa 2020 41 Closed loop 24 413
Akaroa 2030 86 Open loop 24 180956
Akaroa 2030 86 Closed loop 24 864
Milford Sound 2020 50 Open loop 0.75 3330
Milford Sound 2020 50 Closed loop 0.75 16
Milford Sound 2030 106 Open loop 0.75 6967
Milford Sound 2030 106 Closed loop 0.75 33
The number of cruise ships entering Milford Sound daily is about half of that entering Akaroa
Harbour. However, the discharge duration is substantially lower, as cruise ships are modelled as
berthing for 24 hours in Akaroa and only 45 minutes in Milford Sound.
The emission rates for key contaminants in the Port of Auckland are shown in Table 3-9 for open- and
closed- loop scrubbers. Despite contaminant concentrations being higher for closed-loop scrubbers
(section 3.4), because the discharge rates are so much lower than for open-loop scrubbers, the total
contaminant load discharged is less.
Table 3-9: Emission rates for Port of Auckland from open loop scrubbers versus closed-loop scrubbers. All data g/day.
Contaminant Open loop scrubber Closed-loop scrubber
Chromium 1,134 53
Copper 2,209 41
Lead 525 1.5
Mercury 10 0.015
Nickel 4,484 1,141
Vanadium 15,313 5,744
Zinc 4,347 112
Anthracene 4.2 0.020
Phenanthrene 153 1.4

65
Emission rates for the same contaminants in all ports, shipping lanes and cruise ship areas are shown
in Table 3-10 for only open-loop scrubbers, for both the 2020 and 2030 scenarios. For most locations,
the emission rates in 2030 are approximately double the rates in 2020.
Table 3-10: Emission rates for 2020 and 2030 discharges under open loop mode. All data g/day.
Location Scenario Year Chromium Copper Nickel Zinc Anthracene
Ports
Marsden Point 2020 139 271 550 533 0.5
2030 305 594 1,205 1,168 1.1
Auckland 2020 1,134 2,209 4,484 4,347 4.2
2030 2,492 4,854 9,850 9,549 9.1
Tauranga 2020 1,064 2,072 4,205 4,077 3.9
2030 2,233 4,349 8,826 8,556 8.2
Lyttelton 2020 317 617 1,251 1,213 1.2
2030 674 1,314 2,666 2,585 2.5
Shipping lane
Poor Knights 2020 125 244 496 481 0.5
2030 299 582 1,181 1,145 1.1
Rangitoto Channel 2020 7 13 26 25 0.0
2030 15 28 57 56 0.1
Mayor Island 2020 81 158 322 312 0.3
2030 190 370 750 727 0.7
Cook Strait 2020 73 143 228 280 0.27
2030 163 319 646 627 0.60
Marlborough Sounds 2020 5 9 19 18 0.0
2030 10 20 40 39 0.0
Cruise ship locations
Akaroa 2020 753 1,466 2,976 2,885 2.8
2030 1,575 3,068 6,225 6,035 5.8
Milford Sound 2020 29 56 115 111 0.11
2030 61 118 240 232 0.22
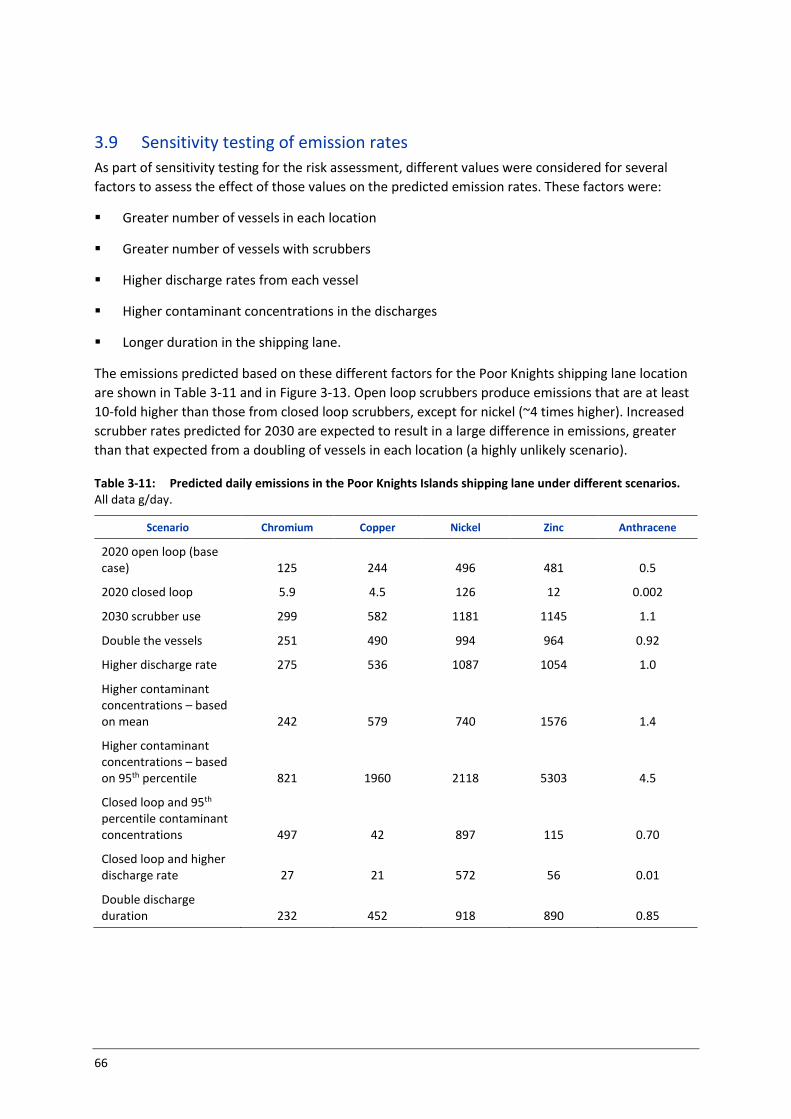
66
3.9 Sensitivity testing of emission rates
As part of sensitivity testing for the risk assessment, different values were considered for several
factors to assess the effect of those values on the predicted emission rates. These factors were:
▪ Greater number of vessels in each location
▪ Greater number of vessels with scrubbers
▪ Higher discharge rates from each vessel
▪ Higher contaminant concentrations in the discharges
▪ Longer duration in the shipping lane.
The emissions predicted based on these different factors for the Poor Knights shipping lane location
are shown in Table 3-11 and in Figure 3-13. Open loop scrubbers produce emissions that are at least
10-fold higher than those from closed loop scrubbers, except for nickel (~4 times higher). Increased
scrubber rates predicted for 2030 are expected to result in a large difference in emissions, greater
than that expected from a doubling of vessels in each location (a highly unlikely scenario).
Table 3-11: Predicted daily emissions in the Poor Knights Islands shipping lane under different scenarios. All data g/day.
Scenario Chromium Copper Nickel Zinc Anthracene
2020 open loop (base case) 125 244 496 481 0.5
2020 closed loop 5.9 4.5 126 12 0.002
2030 scrubber use 299 582 1181 1145 1.1
Double the vessels 251 490 994 964 0.92
Higher discharge rate 275 536 1087 1054 1.0
Higher contaminant concentrations – based on mean 242 579 740 1576 1.4
Higher contaminant concentrations – based on 95th percentile 821 1960 2118 5303 4.5
Closed loop and 95th percentile contaminant concentrations 497 42 897 115 0.70
Closed loop and higher discharge rate 27 21 572 56 0.01
Double discharge duration 232 452 918 890 0.85
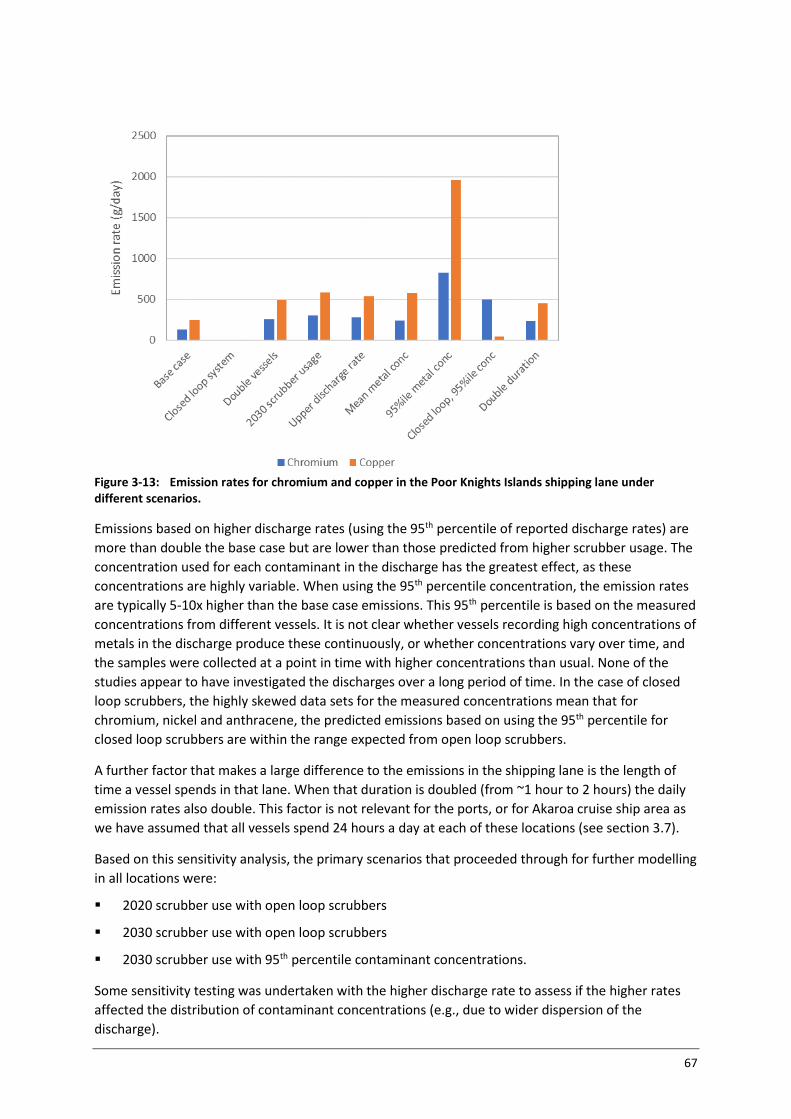
67
Figure 3-13: Emission rates for chromium and copper in the Poor Knights Islands shipping lane under different scenarios.
Emissions based on higher discharge rates (using the 95th percentile of reported discharge rates) are
more than double the base case but are lower than those predicted from higher scrubber usage. The
concentration used for each contaminant in the discharge has the greatest effect, as these
concentrations are highly variable. When using the 95th percentile concentration, the emission rates
are typically 5-10x higher than the base case emissions. This 95th percentile is based on the measured
concentrations from different vessels. It is not clear whether vessels recording high concentrations of
metals in the discharge produce these continuously, or whether concentrations vary over time, and
the samples were collected at a point in time with higher concentrations than usual. None of the
studies appear to have investigated the discharges over a long period of time. In the case of closed
loop scrubbers, the highly skewed data sets for the measured concentrations mean that for
chromium, nickel and anthracene, the predicted emissions based on using the 95th percentile for
closed loop scrubbers are within the range expected from open loop scrubbers.
A further factor that makes a large difference to the emissions in the shipping lane is the length of
time a vessel spends in that lane. When that duration is doubled (from ~1 hour to 2 hours) the daily
emission rates also double. This factor is not relevant for the ports, or for Akaroa cruise ship area as
we have assumed that all vessels spend 24 hours a day at each of these locations (see section 3.7).
Based on this sensitivity analysis, the primary scenarios that proceeded through for further modelling
in all locations were:
▪ 2020 scrubber use with open loop scrubbers
▪ 2030 scrubber use with open loop scrubbers
▪ 2030 scrubber use with 95th percentile contaminant concentrations.
Some sensitivity testing was undertaken with the higher discharge rate to assess if the higher rates
affected the distribution of contaminant concentrations (e.g., due to wider dispersion of the
discharge).

68
4 Modelling of predicted environmental concentrations
4.1 Overview of MAMPEC-BW model
MAMPEC is a steady-state 2D integrated hydrodynamic and chemical fate model, originally designed
for predicting environmental concentrations (PECs) of compounds used in antifouling paints, and
further developed for predicting concentrations of compounds used in ballast water treatment
(MAMPEC-BW).
The model predicts concentrations of contaminants in generalised ‘typical’ marine environments
(Figure 4-1, open sea, shipping lane, estuary, commercial harbour, yachting marina, open harbour),
using dimensions of those ports and harbours simplified to a 2D “box” (Hattum et al. 2016). Users
also specify hydrodynamic and water quality conditions for each environment (e.g. water depth,
currents, tidal range, salinity, DOC, suspended matter load). MAMPEC incorporates the main
hydrodynamic exchange processes in more complex 3D models including tidal exchange, horizontal
mixing, density differences, flushing flows (e.g., rivers) and wind driven exchange, to solve the mass
balance equation (also known as advection-diffusion equation) for the modelled compound (Hattum
et al. 2016).
Figure 4-1: MAMPEC Model environment types and dimensions. Open Sea (Shipping Lanes) and Commercial Harbour (Ports) were used in this modelling.
Input information is required for each chemical or compound to be modelled as MAMPEC models the
chemical fate processes of sorption and sedimentation, volatilisation, degradation (photolysis,
hydrolysis and biodegradation). Only sorption and sedimentation are relevant for metals, and these
processes will determine the accumulation of metals in benthic sediments. The other processes are
relevant for PAHs.
The emissions must also be specified in the model for each chemical of interest as a daily load
(discharge rate and concentration).
MAMPEC then calculates equilibrium concentrations in the water column (total and dissolved) based
on these inputs and presents statistical summaries of these (minimum, maximum, median, mean,
and 95th percentile). Sediment concentrations are also predicted after 1, 2, 5 and 10 years of
accumulation.

69
4.2 Inputs for the MAMPEC-BW model
4.2.1 Layout
Two types of model environments were used to predict concentrations at the target locations. Ports
were modelled based on the “Commercial estuarine harbour” set up and shipping lanes were
modelled with the “Open sea shipping lane” set up. Cruise ship locations were defined as “shipping
Lanes” for the purpose of modelling as this most closely reflected the unbounded nature of the areas
being modelled. The primary difference is that harbours are bounded by land margins whereas
shipping lanes have open boundaries on all four sides of the bounding box. Different input
parameters are required for these two cases.
The dimensions for the four ports of interest (Table 4-1) were adopted from Gadd et al. (2011). These
were obtained by calculating the area of each port, and then ascribing dimensions that approximated
the actual layout and surface area (Gadd et al. 2011).
Table 4-1: Dimensions used in MAMPEC modelling of Port sites.
Model input variable Marsden Point Auckland Tauranga Lyttelton
Latitude -35.83676 -36.83936 -37.66192 -43.60688
Longitude 174.4929 174.7726 176.1784 172.7175
x2 1300.00 2030.00 540.00 870.00
x1 1950.00 3045.00 810.00 1305.00
y1 220.00 520.00 1300.00 410.00
y2 220.00 520.00 1300.00 410.00
Depth (m) 4.50 12.00 14.00 12.30
mouth width (m) 1300.00 2030.00 540.00 170.00
Depth in harbour entrance (m)
4.5 10 14 13.7
The sizes and dimensions of the shipping lanes and cruise ship areas were obtained using a
combination of satellite imagery and GIS mapping. The x dimension is along the direction of travel
and is typically longer than the y dimension. The y dimensions of the Rangitoto Channel and
Marlborough Sounds shipping lanes were restricted by the adjacent land to 1000 m. A length of
2000 m was used to retain the same ratio of x to y as used for the off-shore shipping lanes of Poor
Knights Islands, Mayor Island and Cook Strait. The Akaroa cruise ship area is a square area based on
the area occupied by cruise ships in Akaroa Harbour. The dimensions of the Milford Sound area were
based on the dimensions in a selected part of the sound. Water depth was based on the NIWA
Hydrodynamic model for ocean tides by Goring and Walters (2002). For Milford Sound, which is >
200 m deep in some locations, a shallow depth of 5 m was used. This was to represent a worst-case
scenario where the discharge goes into over-lying freshwater, and does not mix with the deep saline
waters below. In reality, it is likely that the discharge will go to waters that are at least partly saline,
particularly as cruise ship visits are more common in summer when the rainfall is lower and the
depth of the freshwater layer is smaller.

70
Table 4-2: Dimensions used in MAMPEC modelling of Shipping Lanes and cruise ship areas.
Shipping lanes Cruise ship areas
Locations/
Parameter
Poor Knights Rangitoto Channel
Mayor Island Cook Strait Marlborough Sounds
Akaroa Milford Sound
Longitude 174.7790 174.8093 176.1950 174.5272 174.0837 172.9180 167.8900
Latitude -35.46427 -36.79497 -37.28343 -41.24583 -41.23022 -43.81940 -44.63267
x (m) 20000 2000 20000 20000 2000 1000 2000
y (m) 10000 1000 10000 10000 1000 1000 1000
Depth (m) 150 8 110 250 40 8 5*
Note: this depth of 5 m is to represent the overlying freshwater in the case that it does not mix vertically with the saline water below.
4.2.2 Hydrodynamic characteristics
MAMPEC requires basic information on tidal differences and flow velocity for the hydrodynamic
modelling (Table 4-3). Tidal differences were adopted from Gadd et al. (2011) which were based on
Coastal Explorer (Hume et al. 2004). It has been noted that there are some slight differences
between these values, and those in the updated classification of New Zealand’s coastal hydrosystems
(Hume et al. 2016). These are not expected to result in significant differences in the concentrations
predicted in this risk assessment. Parameters for flow velocity were based on the NIWA
Hydrodynamic model for ocean tides (Goring & Walters 2002, Walters et al. 2001). Tidal constituents
(U and V) at each location were combined to calculate the flow velocity (see example in Appendix A).
Table 4-3: Hydrodynamic parameters and dimensions used in MAMPEC modelling of Port sites.
Locations Tidal Difference Depth in harbour
entrance (m) Flow Velocity (m/s)
Exchange Volume (m3/tide)
Daily refresh (%)
Ports
Marsden Point 1.7 14 1.0183 5.68E+06 854
Auckland 2.3 10 0.7862 3.11E+07 476
Tauranga 1.5 14 0.8342 1.15E+07 225
Lyttelton 1.8 13.7 0.2093 2.77E+06 122
Shipping lanes
Poor Knights - - 0.0721 - 31
Rangitoto Channel - - 0.9679 - 4,181
Mayor Island - - 0.0267 - 12
Cook Strait - - 1.3956 - 603
Marlborough Sounds
- - 0.0497 - 215
Cruise ship areas
Akaroa - - 0.131 - 1,132
Milford Sound - - 0.0049 - 2
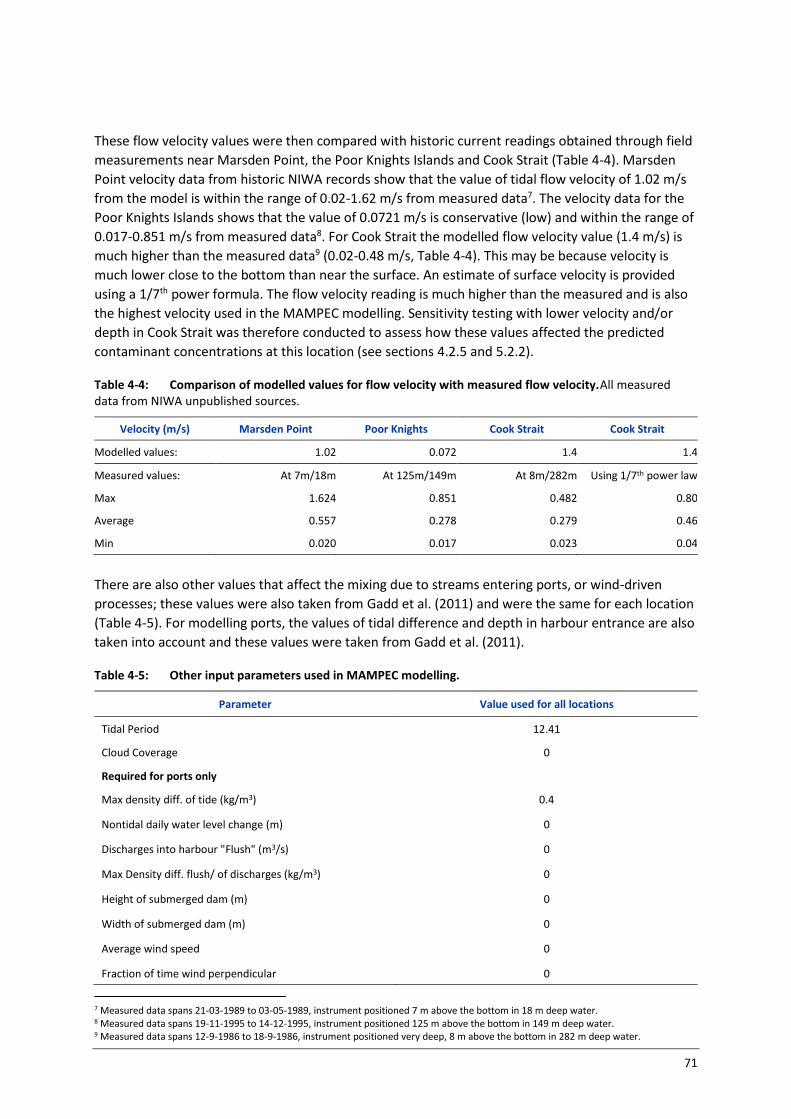
71
These flow velocity values were then compared with historic current readings obtained through field
measurements near Marsden Point, the Poor Knights Islands and Cook Strait (Table 4-4). Marsden
Point velocity data from historic NIWA records show that the value of tidal flow velocity of 1.02 m/s
from the model is within the range of 0.02-1.62 m/s from measured data7. The velocity data for the
Poor Knights Islands shows that the value of 0.0721 m/s is conservative (low) and within the range of
0.017-0.851 m/s from measured data8. For Cook Strait the modelled flow velocity value (1.4 m/s) is
much higher than the measured data9 (0.02-0.48 m/s, Table 4-4). This may be because velocity is
much lower close to the bottom than near the surface. An estimate of surface velocity is provided
using a 1/7th power formula. The flow velocity reading is much higher than the measured and is also
the highest velocity used in the MAMPEC modelling. Sensitivity testing with lower velocity and/or
depth in Cook Strait was therefore conducted to assess how these values affected the predicted
contaminant concentrations at this location (see sections 4.2.5 and 5.2.2).
Table 4-4: Comparison of modelled values for flow velocity with measured flow velocity.All measured data from NIWA unpublished sources.
Velocity (m/s) Marsden Point Poor Knights Cook Strait Cook Strait
Modelled values: 1.02 0.072 1.4 1.4
Measured values: At 7m/18m At 125m/149m At 8m/282m Using 1/7th power law
Max 1.624 0.851 0.482 0.80
Average 0.557 0.278 0.279 0.46
Min 0.020 0.017 0.023 0.04
There are also other values that affect the mixing due to streams entering ports, or wind-driven
processes; these values were also taken from Gadd et al. (2011) and were the same for each location
(Table 4-5). For modelling ports, the values of tidal difference and depth in harbour entrance are also
taken into account and these values were taken from Gadd et al. (2011).
Table 4-5: Other input parameters used in MAMPEC modelling.
Parameter Value used for all locations
Tidal Period 12.41
Cloud Coverage 0
Required for ports only
Max density diff. of tide (kg/m3) 0.4
Nontidal daily water level change (m) 0
Discharges into harbour "Flush" (m3/s) 0
Max Density diff. flush/ of discharges (kg/m3) 0
Height of submerged dam (m) 0
Width of submerged dam (m) 0
Average wind speed 0
Fraction of time wind perpendicular 0
7 Measured data spans 21-03-1989 to 03-05-1989, instrument positioned 7 m above the bottom in 18 m deep water. 8 Measured data spans 19-11-1995 to 14-12-1995, instrument positioned 125 m above the bottom in 149 m deep water. 9 Measured data spans 12-9-1986 to 18-9-1986, instrument positioned very deep, 8 m above the bottom in 282 m deep water.
72
The MAMPEC model calculates the amount of water exchanged in each location based on the input
data, reported as a, daily refresh percentage for shipping lanes, and an exchange volume for
harbours (m3/tide and percentage/tide, converted to a daily percentage in Table 4-3). Of the ports,
Marsden Point has the highest flow velocity and exchange volume and Lyttelton has the smallest
flow velocity and exchange volume. This is likely due to the higher flow velocities at Marsden Point
and the lowest at Lyttelton.
Daily refresh in the shipping lanes range from 12% per day at Mayor Island to 4,181% per day at
Rangitoto Channel. The much greater refresh rate in Rangitoto Channel is due to the greater flow
velocity (0.97 vs 0.03 m/s), and the smaller size of the shipping lane modelled, which is 10x smaller
than the Mayor Island and Poor Knights Islands locations. The Akaroa cruise ship area also has a
relatively high refresh rate, due to the combination of high flow velocity and small size.
4.2.3 Water and sediment characteristics
Water quality information is used in MAMPEC to model the partitioning of contaminants onto
suspended sediment, and the deposition of those particles into benthic sediment. Regular regional
council monitoring data (as collated by Dudley and Jones-Todd (2018)) for sites nearby each of the
modelled locations were used to provide estimates for water quality (suspended solids, chlorophyll,
salinity, temperature and pH). In most cases, the median data for the latest 5-years (2013-2017)
were used to take account of potential changes in sea temperature, salinity and pH; however if these
were not available, median data from 2008-2017 were used. For most model locations, values were
averaged across several nearby sites. Where data was unavailable for a location, values were used
from previous modelling or calculated from the nearest locations from that modelling (Gadd et al.
2011).
Some pH data were also obtained from the NZ Ocean Acidification Observing Network (NZOA-ON10)
for locations near to ports and shipping lanes.
Particulate organic carbon (POC) and dissolved organic carbon (DOC) values are not regularly
measured and are rarely reported. POC values were taken from Gadd et al. (2011) for the ports and
Milford Sound, or averaged from nearest locations (shipping lanes and Akaroa). DOC was taken as 1.4
for all locations as used by Gadd et al. (2011). However, a value of 1.1 mg/L has been reported for
the Waitemata Harbour (Gadd & Cameron 2012) since that modelling and both values were used in
sensitivity testing for Rangitoto Channel.
10 https://marinedata.niwa.co.nz/nzoa-on/

73
Table 4-6: Input data for water quality for ports, shipping lanes and cruise ship areas. Data for ports was largely adopted from previous modelling with MAMPEC (Gadd et al. 2011); italicised values indicates where data was updated from those values.
Locations SPM1 conc (mg/L)
POC2 conc (mg/L)
DOC3 conc (mg/L)
Chlorophyll (µg/L)
Salinity (psu)4
Temperature (°C)
pH
Ports
Marsden Point 4.0 0.6 1.4 1.50 35.0 17.0 8.20
Auckland 6.6 0.94 1.4 2.30 33.0 18.2 7.95
Tauranga 10 1.4 1.4 0.90 32.0 16.0 8.00
Lyttelton 17 2.4 1.4 2.60 32.2 14.0 8.00
Shipping Lanes
Poor Knights 4.0 0.6 1.4 1.50 35.0 17.0 8.2
Rangitoto Channel 7.5 0.94 1.4 1.93 33.0 17.2 8.07
Mayor Island 12.1 0.82 1.4 0.81 35.0 16.2 7.74
Cook Strait 2.8 2.8 1.4 0.83 34.8 14.3 8.05
Marlborough Sounds 2.4 3.8 1.4 1.11 34.5 14.7 8.02
Cruise Ships
Akaroa 7.9 2.4 1.4 1.45 33.9 12.75 8.10
Milford Sound 15 2.1 1.4 0.38 0.5 13.0 5.60
Notes: 1 Suspended particulate matter (equivalent to suspended solids concentration). 2. Particulate organic carbon. 3. Dissolved organic carbon. 4. Practical Salinity Unit, equivalent to parts per thousand (‰).
Data required to model the deposition of sediment and accumulation of contaminants in sediment
was adopted from Gadd et al. (2011) and was the same for all modelled locations (Table 4-7).
Table 4-7: Input data related to sediment accumulation used for all ports, shipping lanes and cruise ship areas. All data adopted from (Gadd et al. 2011).
Factor Value used
Depth mixed sediment layer 0.1
Sediment Density 1000
Degradation rate of organic carbon in sediment 0
Nett sedimentation velocity 1
4.2.4 Compound characteristics
The MAMPEC model requires data on chemical and biological processes for each compound of
interest. None of the compounds included in this risk assessment were already present by default in
MAMPEC. The important factors for metals are the solubility and the sediment partitioning
coefficient, which controls how much each metal partitions to sediment and accumulates in the
benthic sediment (Table 4-8). We assumed that all metals would be in forms that are highly soluble,
consistent with their presence in acidic washwater. For this assessment we adopted the partitioning
coefficients used by Faber et al. (2019) that were obtained from a comprehensive review by Allison
and Allison (2005).
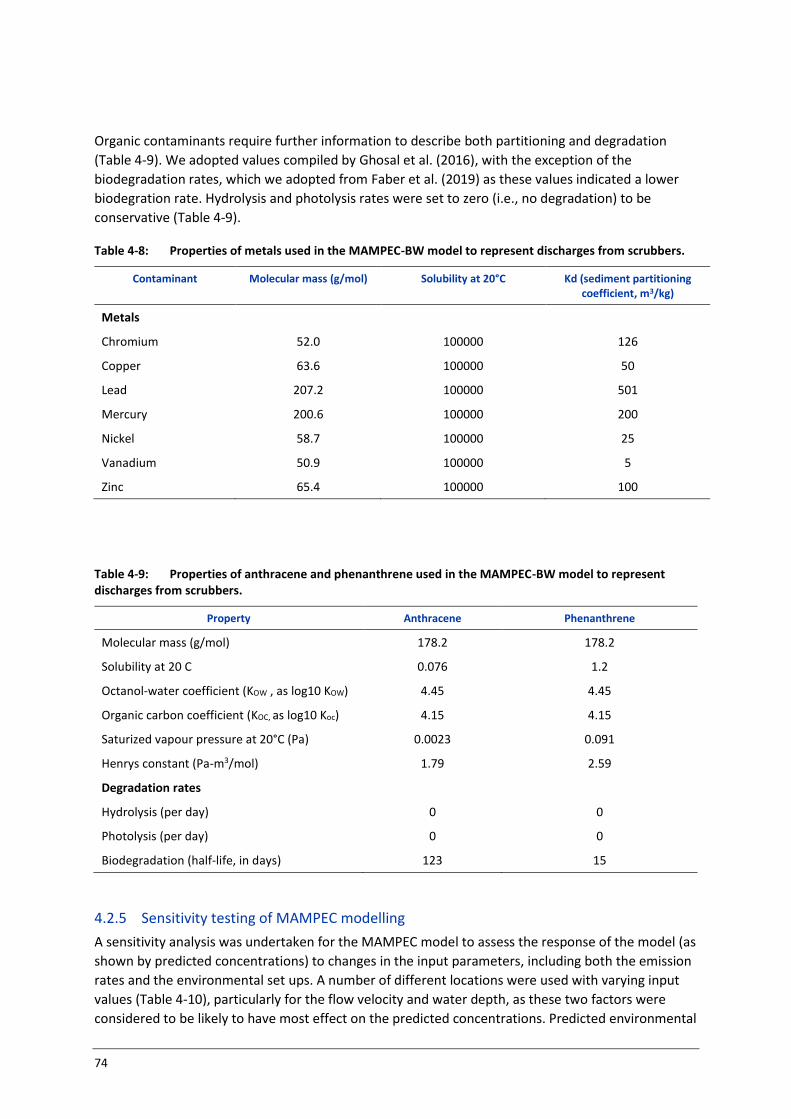
74
Organic contaminants require further information to describe both partitioning and degradation
(Table 4-9). We adopted values compiled by Ghosal et al. (2016), with the exception of the
biodegradation rates, which we adopted from Faber et al. (2019) as these values indicated a lower
biodegration rate. Hydrolysis and photolysis rates were set to zero (i.e., no degradation) to be
conservative (Table 4-9).
Table 4-8: Properties of metals used in the MAMPEC-BW model to represent discharges from scrubbers.
Contaminant Molecular mass (g/mol) Solubility at 20°C Kd (sediment partitioning coefficient, m3/kg)
Metals
Chromium 52.0 100000 126
Copper 63.6 100000 50
Lead 207.2 100000 501
Mercury 200.6 100000 200
Nickel 58.7 100000 25
Vanadium 50.9 100000 5
Zinc 65.4 100000 100
Table 4-9: Properties of anthracene and phenanthrene used in the MAMPEC-BW model to represent discharges from scrubbers.
Property Anthracene Phenanthrene
Molecular mass (g/mol) 178.2 178.2
Solubility at 20 C 0.076 1.2
Octanol-water coefficient (KOW , as log10 KOW) 4.45 4.45
Organic carbon coefficient (KOC, as log10 Koc) 4.15 4.15
Saturized vapour pressure at 20°C (Pa) 0.0023 0.091
Henrys constant (Pa-m3/mol) 1.79 2.59
Degradation rates
Hydrolysis (per day) 0 0
Photolysis (per day) 0 0
Biodegradation (half-life, in days) 123 15
4.2.5 Sensitivity testing of MAMPEC modelling
A sensitivity analysis was undertaken for the MAMPEC model to assess the response of the model (as
shown by predicted concentrations) to changes in the input parameters, including both the emission
rates and the environmental set ups. A number of different locations were used with varying input
values (Table 4-10), particularly for the flow velocity and water depth, as these two factors were
considered to be likely to have most effect on the predicted concentrations. Predicted environmental

75
concentrations based on higher emissions (due to either increased discharge rates or contaminant
concentrations) were also modelled for all locations.
Table 4-10: Differing speed and depth values used in sensitivity testing of various locations.Copper emissions based on 2030 scrubber usage was used for all scenarios.
Location Reason Scenario Values in base case
Values in sensitivity option
Ports
Marsden Point Shallowest Half Depth 4.5 2.25
Marsden Point Second fastest Half Speed 1.0183 0.50915
Marsden Point Shallowest & Second Fastest Half Depth & Half Speed 2.25 & 0.50915
Shipping lanes
Rangitoto Channel Third fastest Half Speed 0.9679 0.48395
Mayor Island Fourth deepest Half Depth 110 55
Mayor Island Second slowest Half Speed 0.0267 0.01335
Mayor Island Fourth deepest & Second slowest
Half Depth & Half Speed 55 & 0.01335
Cook Strait Deepest Half Depth 250 125
Cook Strait Fastest velocity Half Speed 1.3956 0.6978
Cook Strait Deepest & fastest Half Depth & Half Speed 125 & 0.6978
Cruise ship areas
Akaroa Second Shallowest Half Depth 8 4
Akaroa Highest results for Shipping lane
Half Speed 0.131 0.0655
Akaroa Second Shallowest & highest results
Half Depth & Half Speed 4 & 0.0655
Further sensitivity analysis based on differing emission rates was undertaken using Lyttelton Harbour
as a case study, as previous studies suggested this port would have the highest risks due to the low
flushing rates in this port.
Table 4-11: Concentrations of additional contaminants used in modelling for Port of Lyttelton. Maximum values (µg/L) from each study presented.
Emission rate (g/d)
Contaminant 2020 case 1 2030 case 2 Sensitivity testing 3
Chromium 317 674 5088 4
Copper 617 1314 10540
Nickel 1251 2666 11392
Zinc 1213 2585 28519
Anthracene 1.2 2.5 24
Note: 1Based on 17 MW power output, open-loop scrubbers with discharge rate of 88 m3/MWh and median contaminant concentrations.2 Based on 37 MW power output, open-loop scrubbers with discharge rate of 88 m3/MWh and median contaminant concentrations. 3 Based on 37 MW power output, open-loop scrubbers with discharge rate of 88 m3/MWh
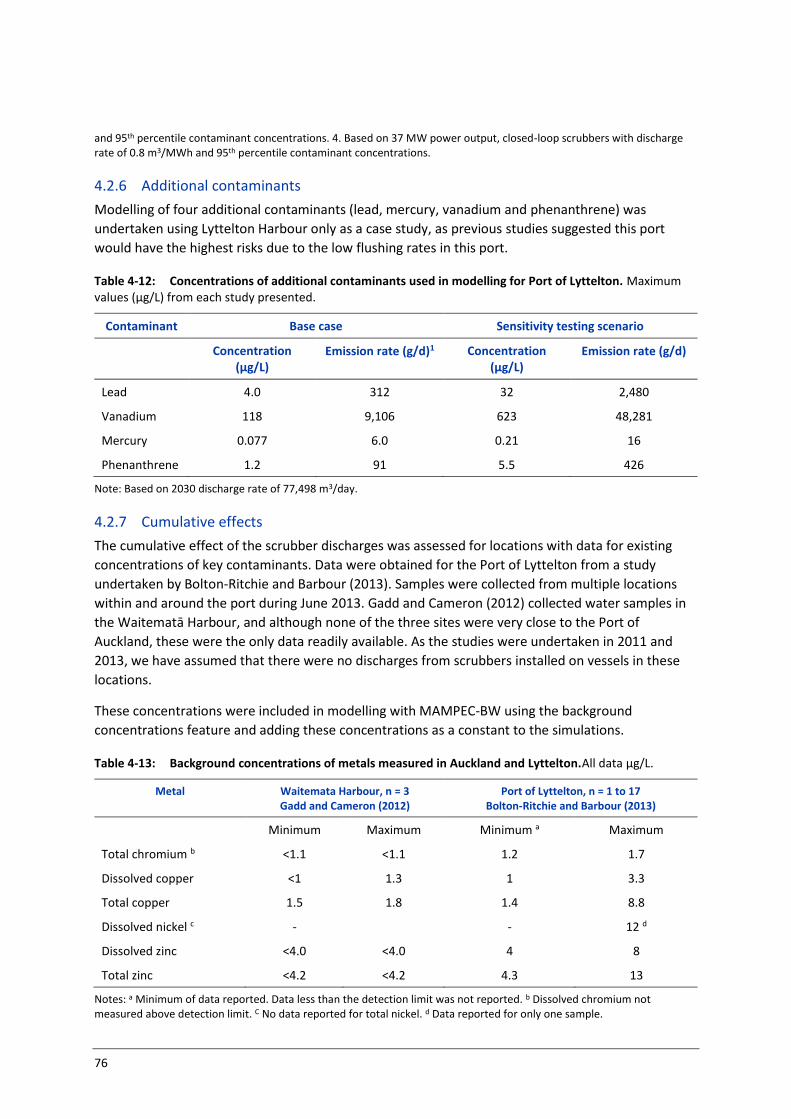
76
and 95th percentile contaminant concentrations. 4. Based on 37 MW power output, closed-loop scrubbers with discharge rate of 0.8 m3/MWh and 95th percentile contaminant concentrations.
4.2.6 Additional contaminants
Modelling of four additional contaminants (lead, mercury, vanadium and phenanthrene) was
undertaken using Lyttelton Harbour only as a case study, as previous studies suggested this port
would have the highest risks due to the low flushing rates in this port.
Table 4-12: Concentrations of additional contaminants used in modelling for Port of Lyttelton. Maximum values (µg/L) from each study presented.
Contaminant Base case Sensitivity testing scenario
Concentration (µg/L)
Emission rate (g/d)1 Concentration (µg/L)
Emission rate (g/d)
Lead 4.0 312 32 2,480
Vanadium 118 9,106 623 48,281
Mercury 0.077 6.0 0.21 16
Phenanthrene 1.2 91 5.5 426
Note: Based on 2030 discharge rate of 77,498 m3/day.
4.2.7 Cumulative effects
The cumulative effect of the scrubber discharges was assessed for locations with data for existing
concentrations of key contaminants. Data were obtained for the Port of Lyttelton from a study
undertaken by Bolton-Ritchie and Barbour (2013). Samples were collected from multiple locations
within and around the port during June 2013. Gadd and Cameron (2012) collected water samples in
the Waitematā Harbour, and although none of the three sites were very close to the Port of
Auckland, these were the only data readily available. As the studies were undertaken in 2011 and
2013, we have assumed that there were no discharges from scrubbers installed on vessels in these
locations.
These concentrations were included in modelling with MAMPEC-BW using the background
concentrations feature and adding these concentrations as a constant to the simulations.
Table 4-13: Background concentrations of metals measured in Auckland and Lyttelton.All data µg/L.
Metal Waitemata Harbour, n = 3 Gadd and Cameron (2012)
Port of Lyttelton, n = 1 to 17 Bolton-Ritchie and Barbour (2013)
Minimum Maximum Minimum a Maximum
Total chromium b <1.1 <1.1 1.2 1.7
Dissolved copper <1 1.3 1 3.3
Total copper 1.5 1.8 1.4 8.8
Dissolved nickel c - - 12 d
Dissolved zinc <4.0 <4.0 4 8
Total zinc <4.2 <4.2 4.3 13
Notes: a Minimum of data reported. Data less than the detection limit was not reported. b Dissolved chromium not measured above detection limit. C No data reported for total nickel. d Data reported for only one sample.

77
4.3 Methods for pH modelling
The pH of seawater is buffered by the presence of bicarbonate and carbonate ions in seawater. As
acidic substances are added to the seawater, some of these will be taken up by carbonate
transforming to bicarbonate, and the pH of the seawater will remain steady. The effect of the
scrubber discharges on pH therefore cannot be easily modelled without considering the acid-base
chemistry of seawater. The effect of the scrubber discharges on seawater pH was therefore modelled
in a two-step process, firstly using MAMPEC to model the concentration of hydrogen ions at each
location after dilution and dispersion and then using those predicted hydrogen ion concentrations to
adjust the seawater alkalinity and then calculate the pH.
Information related to acid-base chemistry (alkalinity (carbonate + bicarbonate) and dissolved
inorganic carbon (DIC)) was obtained from NZOA-ON monitoring data (Vance et al. 2020). Alkalinity
at each location was estimated from the average alkalinity at a nearby NZOA-ON site, or, if there was
no site nearby, the average of all sites was used. For Milford Sound, where the salinity is much lower
than normal seawater (due to the freshwater layer), alkalinity data from the NZOA-ON site at Jackson
Bay (off the West Coast of the South Island, which also demonstrates the effect of high rainfall) were
used from dates when the salinity was < 20 psu. The dissolved inorganic carbon concentration at
each site was estimated from the concentrations of alkalinity and the seawater pH at the specified
salinity and temperature (Table 4-6), using the Mehrbach constants as refitted by Dickson and
Millero (1987) and the software package “swco2” (Orr et al. 2015).
The concentrations of hydrogen ions in each location were modelled in MAMPEC based on the
predicted pH of the discharge (4.8 for typical scenarios) and the daily discharge rate. Hydrogen ion
was included in the MAMPEC-BW model by setting up a new “compound”, as a conservative ion -
this was assumed to be highly soluble (100 g/L) and not partitioned to sediment (Kd of 0 m3/kg).
Background concentrations of hydrogen ions were included, based on the estimated seawater pH for
each location (Table 4-6). Predicted hydrogen ion concentrations after mixing suggested pH values as
low as 6 could be reached without considering the effect of carbonate buffering.
The predicted hydrogen ion concentrations after mixing were then used to adjust the alkalinity of the
seawater (each mole of hydrogen ion reduces the alkalinity by one mole). The added hydrogen ions
do not affect the DIC of seawater so this value does not change. The new pH was then calculated
from the adjusted alkalinity and the DIC (Dickson & Millero 1987, Orr et al. 2015).
The calculations were repeated with different input alkalinity and DIC to assess the sensitivity of
these calculations to the input data by reducing the average alkalinity by 2 standard deviations of the
NZOA-ON data.
4.4 Methods for modelling biota uptake
Shellfish and fish can accumulate some contaminants within their flesh, with the amount of
contaminant dependent on the concentrations in water and their tendency to bioaccumulate.
Bioaccumulation factors that describe the uptake from water into flesh (Table 4-14) were obtained
from literature sources. For metals, bioaccumulation factors were obtained from databases provided
by ATSDR (2019) and NIH (2019). Bioaccumulation factors for anthracene and phenanthrene were
obtained from comprehensive review of bioaccumulation factors from peer-reviewed field-measured
data, used in updating the US EPA’s human health criteria (US EPA 2016).

78
These bioaccumulation factors were used to calculate likely concentrations in biota based on the
predicted concentrations in water.
Table 4-14: Bioaccumulation factors used to assess potential for effects on biota.
Bioaccumulation factor (L/kg tissue)
Source
Chromium 400 ATSDR (2019)
Copper 700 ATSDR (2019)
Lead 300 ATSDR (2019), NIH (2019)
Mercury 2000 ATSDR (2019), NIH (2019)
Nickel 500 ATSDR (2019)
Vanadium 12-400 (ECHA undated, Karlsson et al. 2012)
Zinc 2000 ATSDR (2019)
Anthracene 16667 US EPA (2016)
Phenanthrene 2480 US EPA (2016)
4.5 Assessing potential for adverse effects
Guidelines for contaminant concentrations in water, sediment and biota (Table 4-15) were used to
assess the potential for adverse effects on the environment. There are no guidelines for pH in marine
waters of New Zealand so the guideline of 0.2 unit pH change as recommended by US EPA and CCME
(CCME 1999b, US EPA 1986) is used in this assessment.
Default guidelines published by Australia and New Zealand Guidelines for Fresh and Marine Water
Quality (ANZG 2018) are used where available, including for water and sediment. Guidelines in water
are provided for two different forms (oxidation states) of chromium – chromium III and chromium VI.
The guidelines for chromium VI were used for this assessment as this is the form expected to
dominate in marine environments and is also the most toxic form (Pettine 2000).
The guidelines for water are provided at various levels of protection – from 99% to 80%. The
guidelines for protection of 99% species are considered most appropriate for the off-shore areas of
shipping lanes and the relatively pristine locations of the two cruise ship areas. A lower level of
protection (e.g., 95%) could be used for the port locations as these are highly modified
environments. However, for mercury, anthracene and phenanthrene, the highest level of protection
is recommended to account for the bioaccumulating nature of the toxicant; and guidelines for nickel
and zinc at 95% level of protection may not protect key species from toxicity. For these reasons, the
99% level of protection guidelines (Table 4-15) were used for all contaminants and all environments
modelled in this risk assessment.

79
Table 4-15: Guidelines used to assess potential for environmental effects. Guidelines typically from ANZG (2018), ANZG (2021) and ANZFSC (2017). Shaded values are used in this assessment. Values in bold are those recommended for use in slightly- to moderately disturbed environments.
Contaminant ANZ guidelines for marine waters for
Sediment Food standards for:
99% species protection
95% species protection
DGV GV-high Fish Shellfish
Source ANZG (2018) unless specified ANZG (2018) unless specified ANZFSC (2017) unless specified
pH 0.2 change a - - - -
Metals µg/L µg/L mg/kg mg/kg mg/kg mg/kg
Chromium b 0.14 4.4 80 370 No limit
Copper (2000) 0.3 1.3 c 65 270 No limit No limit
Copper (2016) d 0.1 0.6
- - -
Lead 2.2 4.4 c 50 220 0.5 2
Mercury 0.1 e 0.4 0.15 1.0 1 1
Nickel 7 c 70 21 52 No limit No limit
Vanadium 50 100 c 130k - No limit No limit
Zinc (2000) 7 15 c,f 200 410 No limit No limit
Zinc (2020) g 1.8 5.2 f - - -
PAHs
Anthracene 0.01 c 0.4 0.085 h 1.1 h 18 i 18 i
Phenanthrene 0.6 c 2.0 0.24 h 1.5 h 2.4 j 2.4 j
Notes: a From CCME (1999b) and US EPA (1996). b Guidelines for chromium VI. c Recommended for slightly-moderately disturbed environments. d Draft DGV (Gadd & Hickey 2016), not recommended for use as changes are likely. e To account for the bioaccumulating nature of this toxicant, it is recommended that the 99% species protection level DGV is used for slightly to moderately disturbed systems. f DGV may not protect key test species from chronic toxicity. g Draft DGV released for public submission in July 2020. h Guidelines from ANZECC (2000) used, values should be normalised to 1% organic carbon in sediment. i Calculated from oral reference dose of 0.3 mg/kg body weight/day, following same method as for phenanthrene (average body weight of 70 kg, and 0.115 kg daily consumption of fishery products, (Verbruggen & Herwijnen 2011)). jAdopted from Verbruggen and Herwijnen (2011). k No sediment guidelines provided by ANZG or international agencies, soil guideline from CCME (CCME 1999a) used.
The guidelines for vanadium, and the two PAHs anthracene and phenanthrene (Table 4-15) are of
moderate and low reliability respectively. The vanadium guideline is based on limited marine chronic
toxicity tests – six species only11 and covering only four different taxonomic groups (crustaceans,
molluscs, annelids and algae). Both PAH guidelines are of low reliability as they are based on
Quantitative Structure Activity Relationship (QSAR) data rather than data for the specific compounds.
Comparisons to these guidelines are therefore only indicative of the likelihood for potential effects.
The copper and zinc marine water quality guidelines are in the process of being updated. The most
recently released version of the draft zinc guideline (July 2020, published as a draft for public
comment) recommended a 99% protection value of 1.8 µg/L, somewhat lower than the current
default guideline value of 7 µg/L. A draft copper guideline was published in 2016 and a guideline
11 High reliability guidelines are based on at least 8 different species (Warne et al. 2018).
80
value of 0.1 µg/L was recommended for 99% species protection (Gadd & Hickey 2016). This draft
guideline has not yet been released for public submission. Although both guidelines are drafts only,
they are included in the plots for comparison as it is likely that the future guideline values will be
lower than those derived previously and published in 2000. The draft updated guidelines for copper
and zinc are derived from a greater number of species covering a broader range of taxonomic
groups, including corals (several species for copper, one for zinc), which were not included in the
2000 derivations. It is therefore expected that these guidelines (for 99% protection) will be
protective of corals, whereas the 2000 guidelines may not be.
Sediment quality guidelines are also provided by ANZG (2018) and the DGVs (default guideline
values, Table 4-15) indicate the concentrations below which there is a low risk of unacceptable
effects occurring. The updated ANZG for sediment quality do not include guideline values for
individual PAHs, but use an approach where concentrations are summed to provide toxic units
(Simpson et al. 2013). This approach is not suited for this risk assessment where only individual PAH
compounds are considered. Therefore, the ANZECC (2000) guidelines have been used in this
assessment. The sediment concentrations should be normalised to 1% organic carbon before
comparison to the guideline values. For this assessment, we have assumed that all sediments contain
1% organic carbon.
The Australia and New Zealand Food Standards Code provides maximum levels of contaminants in
fish and shellfish (and other food) to prevent human health effects. There are maximum levels for
lead and mercury, but not for the other metals included in this assessment as they pose much lower
risks for health. No standards are provided for PAHs, either as total or individual compounds.
Internationally, there are no standards for the two individual PAHs included in this assessment. A
guideline of 2.4 mg/kg for phenanthrene was calculated by Verbruggen and Herwijnen (2011) from
the tolerable daily intake of 0.04 mg/kg body weight/day, assuming a body weight of 70 kg and an
average daily consumption of 0.115 kg of fish products. This method of calculation was used to
calculate a guideline for anthracene, based on an oral reference dose of 0.3 mg/kg body weight/day
(US EPA 2019), to provide a guideline to prevent effects from chronic (long-term) exposure.
81
5 Risk Assessment Results
5.1 Introduction
In this section, all results of the risk assessment are presented. Predicted contaminant
concentrations in water, sediment and biota are presented for each site, and compared to quality
guidelines where relevant. Results of additional scenarios modelled (sensitivity testing, additional
contaminants and including background concentrations) are also included in this section.
5.2 Predicted water concentrations
5.2.1 Predicted concentrations of key contaminants
The contaminant concentrations in this section were all calculated assuming no background
concentrations. In reality there will be at the least very low concentrations of metals in all
environments. Background concentrations are expected to be higher in ports than in shipping lanes
due to their proximity to the land and other sources of contaminants such as stormwater and port
activities. The combined effect of the existing concentrations and the predicted increase from
scrubber discharges is considered in section 5.2.4.
The predicted additional contaminant concentrations in marine water range over several orders of
magnitude, both within each location, between locations of a given type (e.g., between ports) and
between location types (port, shipping lane or cruise ship site, Figure 5-1 to Figure 5-5). The several
orders of magnitude range (from minimum to maximum) in predicted concentrations within each
location is expected as contaminants will not be completely mixed throughout. Contaminant
concentrations can be expected to be higher close to the point of discharge (as represented by the
95th percentile and maximum values), and much lower away from it, for example near the seabed (as
represented by the minimum values).
Predicted additional concentrations (Figure 5-1 to Figure 5-5) are lowest for the 2020 scrubber usage
scenario, higher for the 2030 usage scenario and highest (generally by an order of magnitude) for the
scenario based on 95th percentile contaminant concentrations in the discharge (the sensitivity
scenario).
The highest predicted additional concentrations for all contaminants are in the Ports of Lyttelton and
Tauranga, followed by the Port of Auckland, then Port of Marsden Point and the Akaroa cruise ship
area with similar predictions. The predicted concentrations in the ports of Auckland and Marsden
Point are 5- to 20- times lower than at Tauranga. The port of Marsden Point has the highest flushing
rates of the four ports and the lowest emissions. The port of Auckland has the highest emissions
(slightly greater than Tauranga) and slightly lower flow velocities than Tauranga, but occupies a
larger area and the contaminants are therefore dispersed through a greater volume of water,
resulting in the lower predicted concentrations. For all contaminants, the maximum predicted
additional concentrations in the shipping lanes are at least 10 times lower than the minimum
additional concentrations predicted in the ports. This is expected as, compared to the shipping lanes,
the ports and Akaroa have higher emission rates (though emission rates for the Poor Knights Islands
shipping lane are similar to Port of Marsden Point) and are smaller areas for the contaminants to
disperse in. Cook Strait shipping lane has the lowest predicted concentration of all locations. This is
likely due to a combination of the high water velocity (1.4 m/s) and depth (250 m) in this location,
and a relatively low emission rate due to fewer vessels using this route compared to other shipping
lanes.

82
Figure 5-1: Predicted concentrations of copper in water at each location modelled. Circle marker indicates mean predicted concentration, line marker indicates 95th percentile and vertical bars extend from minimum to maximum concentrations. Dashed line represents ANZ water quality guideline, dotted line represents draft guideline (see section 4.5). Note log10 scale on the y-axis to ensure all sites are visible.
Figure 5-2: Predicted concentrations of chromium in water at each location modelled. Circle marker indicates mean predicted concentration, line marker indicates 95th percentile and vertical bars extend from minimum to maximum concentrations. Dashed line represents ANZ water quality guideline (see section 4.5). Note log10 scale on the y-axis to ensure all sites are visible.

83
Figure 5-3: Predicted concentrations of nickel in water at each location modelled. Circle marker indicates mean predicted concentration, line marker indicates 95th percentile and vertical bars extend from minimum to maximum concentrations. Dashed line represents ANZ water quality guideline (see section 4.5). Note log10 scale on the y-axis to ensure all sites are visible.
Figure 5-4: Predicted concentrations of zinc in water at each location modelled. Circle marker indicates mean predicted concentration, line marker indicates 95th percentile and vertical bars extend from minimum to maximum concentrations. Dashed line represents ANZ water quality guideline (see section 4.5). Note log10 scale on the y-axis to ensure all sites are visible.

84
Figure 5-5: Predicted concentrations of anthracene in water at each location modelled. Circle marker indicates mean predicted concentration, line marker indicates 95th percentile and vertical bars extend from minimum to maximum concentrations. Dashed line represents ANZ water quality guideline (see section 4.5). Note log10 scale on the y-axis to ensure all sites are visible.
The predicted additional concentrations in the Akaroa cruise ship area are much higher than in the
Milford Sound area. The daily emissions for Akaroa are much larger (~25x higher) as vessels are
assumed to berth overnight in Akaroa and discharge over a period of 24 hours each day (compared
to only 45 mins of discharge in Milford Sound).
Under the 2020 and 2030 scenarios, predicted additional concentrations of copper and chromium
exceed their respective water quality guidelines in the Ports of Lyttelton and Tauranga, when
comparing the 95th percentile prediction. In the upper scenario, the predicted additional
concentrations of all contaminants exceed the water quality guidelines in at least one location. Based
on that upper scenario, 95th percentile copper concentrations in Tauranga and both 95th percentile
and median concentrations in Lyttelton are predicted to exceed not only the guideline for protection
of 99% of species, but also guidelines for protection of 95% (1.3 µg/L) and 90% (3 µg/L) of species.
Concentrations are not predicted to exceed the guideline for protection of 80% of species (8 µg/L).
These exceedances indicate the potential for ecological harm (ANZG 2018), suggestive of potential
for effects on around 10% or more species.

85
5.2.2 Sensitivity testing
For the shipping lanes, different model inputs such as higher discharge rates, lower flow rates,
shallower water depth, and a combination of the two and resulted in higher predicted copper
concentrations compared to the 2020 and 2030 scenarios (Figure 5-6). However, the highest
predicted concentrations were those based on 2030 scrubber usage and a higher concentration in
the discharge (i.e., as already presented in Figure 5-1). In all cases, the copper concentrations in the
shipping lanes remain well below the ANZG value of 0.3 µg/L and the draft guideline value of
0.1 µg/L.
Figure 5-6: Effect of different model input conditions on the predicted copper concentrations in water in four shipping lanes. Circle marker indicates mean predicted concentration, line marker indicates 95th percentile and vertical bars extend from minimum to maximum concentrations. Guideline values not shown in this figure as are above the maximum of y-axis scale.
Similar results were observed for two ports and the Akaroa cruise ship area using different input data
(Figure 5-7). Again, the highest concentrations were predicted when using the 95th percentile
contaminant concentrations in the discharge, but when using higher discharge rates, shallower depth
or lower flow rates, the predicted concentrations were higher than the initial predictions for 2020
and 2030. For the Port of Marsden Point, no scenarios resulted in predicted concentrations above
the guideline value of 0.3 µg/L, whereas at the Port of Lyttelton, most scenarios resulted in
concentrations above that guideline (Figure 5-7). In Akaroa, concentrations were predicted to exceed
that guideline under scenarios with higher contaminant concentrations and with half the depth and
flow rate. Predicted concentrations with discharges from scrubbers operating in closed-loop mode
were substantially lower than the other scenarios, even when based on an upper end (worst-case)
discharge rate. It is worth noting that with closed-loop scrubbers, the copper concentrations in the
Port of Lyttelton are not expected to exceed water quality guidelines, including the lower draft
guideline.

86
This sensitivity testing demonstrates that although there is considerable uncertainty in the input data
for this modelling (including in the number of vessels with scrubbers, the contaminant
concentrations in discharges and the hydrodynamics of each location), the scenarios presented in
section 5.2.1 can be expected to encompass the upper end of possible outcomes for those five key
contaminants.
Figure 5-7: Effect of different model input conditions on the predicted copper concentrations in water at Ports of Marsden Point and Lyttelton and the Akaroa cruise ship area . Circle marker indicates mean predicted concentration, line marker indicates 95th percentile and vertical bars extend from minimum to maximum concentrations. Dashed line represents ANZG (2018) guideline and dotted line represents draft copper guideline (2016).
5.2.3 Additional contaminants
Four additional contaminants, lead, mercury, vanadium and phenanthrene were modelled at the
Port of Lyttelton (Figure 5-8) for the 2030 scrubber usage scenario and for a sensitivity case based on
2030 scrubber usage and 95th percentile concentrations in the discharge. Predicted additional
concentrations are below the water quality guidelines for these contaminants (ANZG 2018, see
section 4.5), even under the scenario of 95th percentile contaminant concentrations in the discharge.
This indicates low potential for ecological harm due to the presence of these contaminants.

87
Figure 5-8: Predicted concentrations in water of additional contaminants at Port of Lyttelton. Circle marker indicates mean predicted concentration, line marker indicates 95th percentile and vertical bars extend from minimum to maximum concentrations. Dashed line represents water quality guidelines (see section 4.5).
5.2.4 Cumulative effects on water quality
The scrubber discharges will enter marine waters already affected by other stressors, including
stormwater discharges (containing copper and zinc), antifouling paints (copper and zinc) from vessels
at berth, in some locations from dry dock or associated hard stand areas, and in some cases historical
contamination from a diverse range of sources. The existing concentrations of chromium, copper,
nickel and zinc in Lyttelton Port already exceed water quality guidelines in some samples and
locations (Bolton-Ritchie & Barbour 2013). The addition of the discharges from the use of scrubbers
in the port will add to these background concentrations (Figure 5-9). Zinc concentrations only
exceeded the guideline value in some samples, and it is possible that the addition of scrubber
discharges results in a greater exceedance of the zinc guideline.
For Auckland, the copper concentrations are likely to be above the guidelines without the scrubbers,
whereas zinc concentrations are likely to be below (Gadd and Cameron (2012), Figure 5-10). The
additional contaminants from the scrubber discharges are not expected to result in any change to
those exceedances.

88
Figure 5-9: Predicted concentrations of metals at Port of Lyttelton with and without scrubbers. Bars indicate maximum concentration in the port without and with the contaminants discharged from scrubbers.
Figure 5-10: Predicted concentrations of metals at Port of Auckland with and without scrubbers. Bars indicate maximum concentration in the port without and with the contaminants discharged from scrubbers.

89
5.3 Changes in seawater pH
In the absence of scrubber discharges, each port, shipping lane and cruise ship area has a slightly
different pH, due to the different salinities and temperatures and the presence of photosynthesising
algae. The effect of the scrubber discharges is shown below, represented as a change in pH from the
original pH in each location (Figure 5-11).
The scrubber washwaters have a negligible to minor effect on the pH when the buffering provided by
carbonates is taken into account. There is a negligible change in pH within the shipping lanes and
ports (<0.02 pH units), except for in the Ports of Lyttelton and Tauranga under the scenario with a pH
of 3 in the discharge. In these two locations, the pH is expected to decrease by 0.12 and 0.06
respectively. In contrast, ocean acidification associated with increased carbon dioxide levels in the
atmosphere is expected to result in a decline in pH of 0.33 by 2100 (Law et al. 2018). In no case is the
change in pH greater than the guideline of 0.2 pH units.
There was little information on the existing pH in Milford Sound though it is expected to be lower
than 8 in the overlying freshwater layer. Based on a pH of 5.6 (assuming the freshwaters are as acidic
as pure rainwater) there was no predicted decrease in pH for any of the three scenarios. This is
despite the lower buffering provided by the freshwater layer in this environment compared to the
saline waters in all other environments. Calculations repeated with lower input alkalinity and DIC
resulted in the same predicted pH values and are therefore not shown here.
Figure 5-11: Predicted pH in marine waters before and after discharge of scrubber washwaters at each location after considering buffering by seawater carbonates. Three scenarios are shown: 2020 scrubber use, 2030 scrubber use and 2030 scrubber use with discharge of pH 3. Milford Sound pH not shown on the graph for reasons of scale.

90
5.4 Predicted sediment concentrations
This section presents the results from modelling on contaminant concentrations in sediment, based
on contaminants from the discharges only. Contaminants are expected to attach to suspended
sediments which deposit on the seabed over time, resulting in the accumulation in benthic
sediments. This modelling does not include other contaminant sources or the low-level natural
concentrations of metals already present in sediment.
Contaminant concentrations are predicted to accumulate over time (Figure 5-12) in the benthic
sediment of ports, and to some extent in Akaroa Harbour. However, for the shipping lanes and
Milford Sound the predicted accumulation is negligible (< 0.1 mg/kg of metals). Further discussion in
this section will focus on the modelled results for ports.
After 20 years of accumulation, the metal and anthracene concentrations remain well below
sediment quality guidelines for the 2020 and 2030 scenarios (Figure 5-13). Under the sensitivity
scenario (based on 95th percentile contaminant concentrations in the discharges) the sediment may
accumulate to concentrations that exceed guidelines in some locations within the Port of Lyttelton
(copper, nickel and zinc) and Tauranga (nickel only). All port sediments will already contain each of
these metals due to their natural presence in soils and sediment, and most locations can be expected
to have higher than natural concentrations due to port activities and additional sources. Natural
concentrations of copper and zinc are around 5-10 mg/kg and 20-50 mg/kg respectively. If these
concentrations are added to the predicted concentrations from scrubber washwater discharges, it is
likely that the predicted average zinc concentrations in the Port of Lyttelton will exceed the
guideline, as well as the predicted maximum concentration.
Figure 5-12: Predicted concentrations of copper in sediment at each location modelled under the 2020 scenario. Bars indicates mean predicted concentration. Note many sites are not visible due to low predicted concentrations.

91
Figure 5-13: Predicted concentrations of metals in sediment in ports under three modelled scenarios. Bars indicates mean predicted concentration, error bars extend from minimum to maximum concentrations. Dashed lines represent guideline values (see section 4.5).
For the four additional contaminants modelled in the Port of Lyttelton (Figure 5-14), there is
potential for mercury concentrations to exceed the sediment quality guideline based on the scenario
of 2030 scrubber usage and 95th percentile contaminant concentrations in the discharge. Under this
scenario, average concentrations are predicted to be below the guideline, however maximum
concentrations are expected to exceed the guideline. For this scenario, maximum concentrations of
phenanthrene are expected to be at the guideline value. Lead and vanadium concentrations are not
expected to reach guideline values. Lead concentrations are usually <5-10 mg/kg in uncontaminated
sediments and if this is added to the predictions from the scrubber washwater discharges, the total
concentrations would be expected to remain below the guideline value of 50 mg/kg.

92
Figure 5-14: Predicted concentrations of additional contaminants in sediments of Port of Lyttelton under two upper modelled scenarios. Bars indicates mean predicted concentration, error bars extend from minimum to maximum concentrations. Dashed line represents ANZ water quality guideline (see section 4.5).
5.5 Predicted biota concentrations
Contaminant concentrations in marine biota were calculated for the Port of Lyttelton (Table 5-1), as
this site had the highest predicted concentrations in water (see section 5.2.1). In all cases, the
predicted concentrations in marine biota are below the guideline values. The predicted
concentrations of lead in fish could be up to 50% of the standard for fish (0.5 mg/kg). This suggests
there is little risk to consumers of fish and shellfish from the scrubber discharges in the port.
Although only modelled for Port of Lyttelton, concentrations in biota can be expected to be lower at
the other ports, and substantially lower in the cruise ship areas and shipping lanes, where predicted
concentrations in water were 1 to 6 orders of magnitude lower than in Lyttelton. There is likely to be
negligible risk to consumers of fish and shellfish in the vicinity of scrubber discharges.
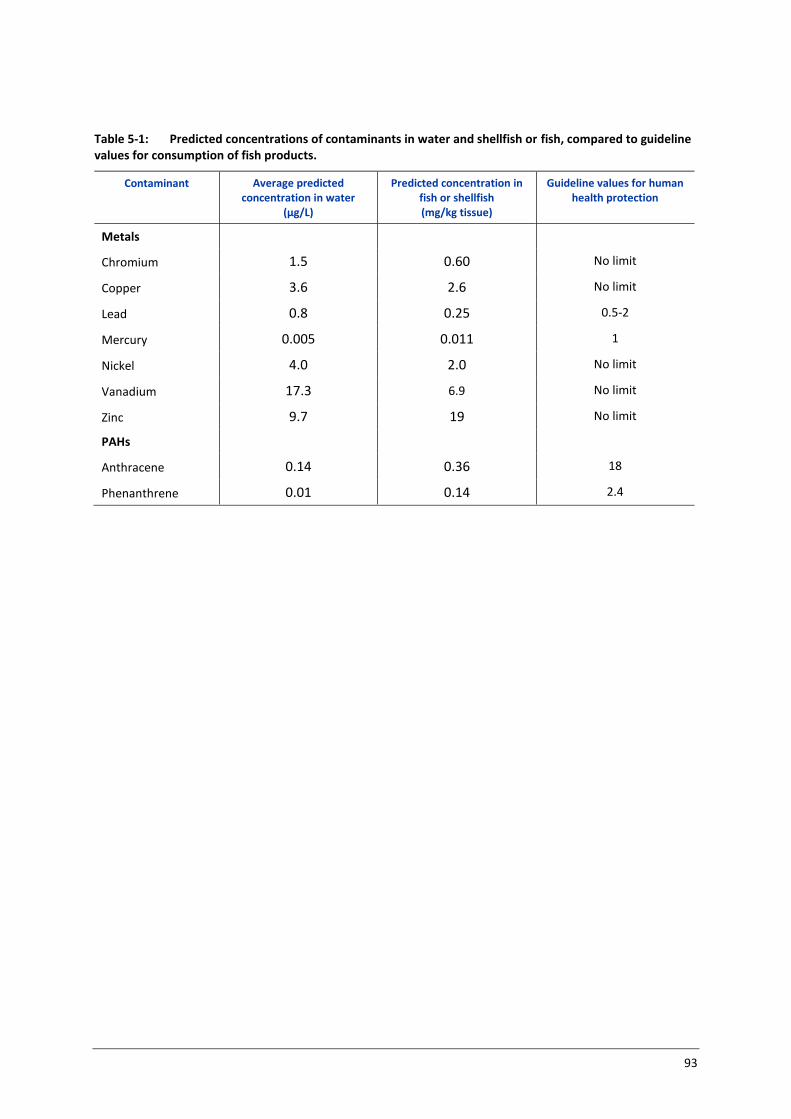
93
Table 5-1: Predicted concentrations of contaminants in water and shellfish or fish, compared to guideline values for consumption of fish products.
Contaminant Average predicted concentration in water
(µg/L)
Predicted concentration in fish or shellfish (mg/kg tissue)
Guideline values for human health protection
Metals
Chromium 1.5 0.60 No limit
Copper 3.6 2.6 No limit
Lead 0.8 0.25 0.5-2
Mercury 0.005 0.011 1
Nickel 4.0 2.0 No limit
Vanadium 17.3 6.9 No limit
Zinc 9.7 19 No limit
PAHs
Anthracene 0.14 0.36 18
Phenanthrene 0.01 0.14 2.4

94
6 Implications and recommendations for further investigations and management
As presented in section 5, the concentrations of contaminants in marine water and benthic
sediments are predicted to be very low in the four shipping lanes and low in Milford Sound under all
modelled scenarios of scrubber use and contaminant concentrations. There is very low potential for
these contaminant concentrations to exceed water or sediment quality guidelines and therefore
negligible risk to marine biota in shipping lanes or in nearby areas, such as those used for
aquaculture, fishing or shellfish harvesting.
The risk assessment has identified that open-loop scrubber washwater discharges may pose potential
risks to marine biota in some ports, based on exceedance of either water or sediment quality
guidelines. Risks are higher in those ports with low flushing rates and/or a greater volume of
discharges due to the number and type of vessels. The highest concentrations in water and sediment
were predicted to occur in the Port of Lyttelton exceeding water and sediment quality guidelines for
several contaminants and scenarios; and the largest predicted change in pH was at this location.
Guideline exceedance was also predicted for the Ports of Tauranga and Auckland and the Akaroa
cruise ship area for at least one contaminant in the upper scenario (2030 with 95th percentile
discharge concentrations). Exceedance of copper guidelines can be expected at all four ports if the
draft guideline is adopted as this is lower than the current (2018) guideline. The predicted
concentrations of contaminants in biota are not expected to result in adverse effects to people
consuming marine biota in the Port of Lyttelton, based on the concentrations from scrubber
discharges alone. Additional contaminant sources were not considered in the assessment of effects
on biota, thus higher concentrations of some contaminants can be expected where there are
significant additional sources.
These results for the Port of Lyttelton are somewhat conservative (erring on the side of caution); as
the MAMPEC model set up for the port includes only the area confined by land (the oil terminal to
the west) and the south-eastern breakwater. In reality, many of the vessels berthing at the Port of
Lyttelton, particularly container ships, berth outside this area at the container terminal and coal
areas of Cashin Quay. Dispersion can be expected to be higher here than within the confined zone of
the inner port. This location could be remodelled excluding container ships, if all of these berth
outside the area, however for bulk carriers it appears that these can berth either within or outside
the inner port. Discussions with the Lyttelton Port Company may yield more realistic vessel numbers
for the confined port area. However, given that the predicted concentrations are expected to exceed
water quality guidelines under all three key scenarios, with a 17x range in concentration between
scenarios, it is highly likely there would be exceedance of at least the copper guideline even with
fewer vessels modelled as discharging into the confined port area, particularly when existing
concentrations in the inner port are included.
Modelled predictions for the Akaroa cruise ship area are also conservative, being based on a 24-hour
discharge duration (whereas cruise ships rarely stay longer than daylight hours) and with 100% of
cruise ships using scrubbers in 2030. Predictions for a shorter duration may result in concentrations
being below the guidelines, which were exceeded only for some scenarios and by a small magnitude.
Greater certainty in predicted concentrations could be obtained through further discussion with
cruise ship operators to understand whether the scenarios modelled are realistic.
Two of the largest sources of uncertainty in the modelling are around the number of vessels using
scrubbers, and the quality of the washwater discharges. At the time of this assessment, there was no
95
requirement for vessels entering New Zealand waters to notify whether they were using scrubbers –
though it is requested. However, this is likely to change in the future through changes to the required
documentation, and Maritime NZ and MPI should be able to collect reliable data on scrubber usage.
This could be used to compare to the estimates of scrubber usage used in this report to understand
whether predictions in this risk assessment are over- or under-estimated. Where possible, data on
washwater quality could also be collected by Maritime NZ and MPI to build a more robust database
of the quality and giving greater certainty to any future predictions. An additional step, not included
in the scope of this study, is to undertake further exploratory statistical analyses on the discharge
quality data (such as correlation matrices, multi-dimensional scaling and principal components
analysis) to investigate differences and similarities in the discharge quality between vessels.
In summary, the scrubber discharges are expected to have negligible effects in shipping lanes and in
Milford Sound, and low to moderate risks of potential effects in ports (highest risks in Port of
Lyttelton) from open-loop scrubbers. Management of scrubber usage around Aotearoa New Zealand
should focus on their use in ports and any other areas (not identified in this assessment) with high
numbers of large vessel at berth for long durations (i.e., close to 24 hours). The discharges from
scrubbers operating in closed-loop mode were not predicted to exceed copper water quality
guidelines in the Port of Lyttelton, and based on this result and the relative emission rates from
open-loop and closed-loop scrubbers (see Table 3-9 and section 3.8, emission rates 21 to 193x higher
from open-loop scrubbers), it is highly likely that no other guidelines would be exceeded. Further
modelling based on emissions from closed-loop scrubbers may be warranted to assess whether there
are conditions that represent more than a negligible risk from their use. This could be undertaken
following the same methods as in this report, but including additional scenarios, including those
based on 95th percentile contaminant concentrations in the discharge.
This risk assessment indicates negligible effects are expected in Milford Sound, however further
investigation and modelling may be warranted for this area due to its pristine nature, national park
and marine reserve status, and unusual characteristics with a freshwater layer with high tannin
content overlying the seawater. The simplistic model used in this assessment is not expected to
account for these conditions, although every effort was made to modify it for a conservative
(precautionary) assessment by assuming discharge into the freshwater layer only.
The risks in specific ports, including Lyttelton, Tauranga and Auckland could be further investigated
through use of calibrated hydrodynamic models, and inclusion of other contaminant sources such as
stormwater and antifouling paints, and historical contamination. However, it is likely that such
modelling will also be subjective to relatively high uncertainty, given the uncertainty in the number
of scrubbers in use, the quality of the discharges, and the concentrations / loads of contaminants
expected from other sources.
Despite the low risks based on comparison to water and sediment quality guidelines, and guidelines
for consumption of fish and shellfish, the discharges may still be inconsistent with iwi viewpoints, as
described in IEMPs. Several plans of relevance to both ports and shipping lanes include policies,
methods or objectives to eliminate discharges to water from vessels. Discharges do not need to
exceed water quality guidelines to affect the mauri of the marine waters and kaimoana. The role of
iwi as kaitiaki of the coastal environment needs to be recognised in management of scrubbers and
their washwater discharges.
96
7 Acknowledgements The authors acknowledge the advice received via Dimity McCredie of Cruise Lines International
Association from the cruise ship operators Royal Caribbean and Carnival Australia. We also
acknowledge the assistance of several NIWA staff in pulling together information for the modelling
including Drs David Plew (for hydrodynamic assistance), Bruce Dudley (for water quality) and John
Zeldis (for advice on chlorophyll a measurements).
97
8 Glossary of Te Reo Māori Note with the exception of key words that are indicated with an asterix*, the following definitions
are largely sourced from Māori Dictionary online (Moorfield).
Hapū (noun) kinship group, clan, tribe, subtribe
Hinengaro (noun) mind, thought, intellect, consciousness, awareness
Iwi (noun) extended kinship group, tribe, nation, people, nationality, race - often
refers to a large group of people descended from a common ancestor and
associated with a distinct territory.
Kai Moana (noun) seafood, shellfish
Kaitiakitanga (noun) guardianship, stewardship, trusteeship, trustee
Kaupapa (noun) topic, policy, matter for discussion, plan, purpose, scheme, proposal,
agenda, subject, programme, theme, issue, initiative.
Ki Uta Ki Tai* From mountains to sea (MFE 2017)
Mahinga Kai (noun) garden, cultivation, food-gathering place
Mana (noun) prestige, authority, control, power, influence, status, spiritual power,
charisma - mana is a supernatural force in a person, place or object.
Mana Whenua (noun) territorial rights, power from the land, authority over land or territory,
jurisdiction over land or territory - power associated with possession and
occupation of tribal land.
Marae (noun) courtyard - the open area in front of the wharenui, where formal
greetings and discussions take place. Often also used to include the complex of
buildings around the marae.
Mātauranga (noun) knowledge, wisdom, understanding, skill
Mātaitai / mātaitai
reserves *
(noun) areas where the tangata whenua manage all non-commercial fishing by
making bylaws pursuant to the provisions of the Fisheries (Kaimoana Customary
Fishing) Regulations 1998 and the Fisheries (South Island Customary Fishing)
Regulations 1999.
Mauri (noun) life principle, life force, vital essence, special nature, a material symbol
of a life principle, source of emotions - the essential quality and vitality of a
being or entity. Also used for a physical object, individual, ecosystem or social
group in which this essence is located
Moana (noun) sea, ocean, large lake.
Papatūanuku (personal name) Earth, Earth mother and wife of Rangi-nui - all living things
originate from them.
Ranginui (personal name) atua of the sky and husband of Papa-tū-ā-nuku, from which
union originate all living things
Rohe (noun) boundary, district, region, territory, area, border (of land).

98
Rūnanga (noun) council, tribal council, assembly, board, boardroom, iwi authority -
assemblies called to discuss issues of concern to iwi or the community.
Taiao (noun) world, Earth, natural world, environment, nature, country
Taiāpure (noun) a stretch of coast, reef or fishing ground set aside as a reserve for inland
kinship groups to gather shellfish or to fish.
Tangaroa (personal name) atua of the sea and fish, he was one of the offspring of Rangi-
nui and Papa-tū-ā-nuku and fled to the sea when his parents were separated.
Sometimes known as Tangaroa-whaiariki
Tangata Whenua (noun) local people, hosts, indigenous people - people born of the whenua, i.e.
of the placenta and of the land where the people's ancestors have lived and
where their placenta are buried
Tawhirimatea (personal name) god of weather
Te ao turoa* Sustaining resources/taonga at rate and in an acceptable condition that ensures
the same options and opportunities for each generation, principle of
sustainability
Tinana (noun) body, trunk (of a tree), the main part of anything
Wāhi Taonga* (noun) areas, places or sites that are significant to Māori.
Wāhi tapu (noun) sacred place, sacred site - a place subject to long-term ritual restrictions
on access or use
Wai (noun) water, stream, creek, river
Wairua (noun) spirit, soul - spirit of a person which exists beyond death. It is the non-
physical spirit, distinct from the body and the mauri.
Whānau (noun) extended family, family group, a familiar term of address to a number of
people

99
9 References
Allison, J.; Allison, T. (2005). Partitioning coefficients for metals in surface water, soils and waste. US
Environmental Protection Agency - Office of Research and Development. Washington, DC.
ANZECC (2000). Australian and New Zealand guidelines for fresh and marine water quality.
Australian and New Zealand Environment and Conservation Council and Agriculture and
Resource Management Council of Australia and New Zealand Volume 1: The guidelines.
ANZFSC (2017). Australia New Zealand Food Standards Code – Schedule 19 – Maximum levels of
contaminants and natural toxicants. Food Standards as amended, taking into account
amendments up to Food Standards (Proposal P1043 – Code Revision (2016)) Variation.
ANZG. (2018). Australian and New Zealand guidelines for fresh and marine water quality. from
https://www.waterquality.gov.au/anz-guidelines/
ANZG (2021). Toxicant default guideline values for aquatic ecosystem protection. Zinc in marine
water. Technical brief. Australian and New Zealand Guidelines for Fresh and Marine Water
Quality. CC BY 4.0. Australian and New Zealand Governments and Australian state and
territory governments. January 2021. Canberra, ACT, Australia.
ATSDR (2019). ATSDR Toxic Substances Portal. Agency for Toxic Substances and Disease Registry,
U.S. Department of Health and Human Services.
Aulinger, A.; Matthias, V.; Zeretzke, M.; Bieser, J.; Quante, M.; Backes, A. (2016). The impact of
shipping emissions on air pollution in the greater North Sea region – Part 1: Current
emissions and concentrations. Atmos. Chem. Phys. 16(2): 739-758.
Bolton-Ritchie, L.; Barbour, S. (2013). Dissolved metal concentrations in the Port of Lyttelton.
Browning, L. (2009). Current methodologies in preparing mobile source port-related emission
inventories. Final report. ICF International, Prepared for U.S. Environmental Protection
Agency. April 2009. Virginia, USA.
BSH (2018). Chemical characterization of discharge water from exhaust gas cleaning systems (EGCS)
and a first estimate of total discharges to the North Sea, the Baltic Sea and the English
Channel. IMO IMO Sub-Committee On Pollution Prevention And Response 6th session Agenda
item 11. Review of the 2015 guidelines for exhaust gas cleaning systems (resolution
MEPC.259(68)). Results from a German project on washwater from exhaust gas cleaning
systems. Submitted by Germany. PPR6 / INF.20. 14 December 2018.
CCME. (1999a). Canadian soil quality guidelines for the protection of environmental and human
health: Vanadium (1997). In: Canadian environmental quality guidelines, 1999, pp. Canadian
Council of Ministers of the Environment, Winnipeg, Canada.
CCME. (1999b). Canadian water quality guidelines for the protection of aquatic life: pH (marine). In:
Canadian environmental quality guidelines, 1999, pp. 3. Canadian Council of Ministers of the
Environment, Winnipeg, Canada.

100
De Meyer, P.; Maes, F.; Volckaert, A. (2008). Emissions from international shipping in the Belgian
part of the North Sea and the Belgian seaports. Atmospheric Environment 42(1): 196-206.
Dickson, A.G.; Millero, F.J. (1987). A comparison of the equilibrium constants for the dissociation of
carbonic acid in seawater media. Deep Sea Research Part A. Oceanographic Research Papers
34(10): 1733-1743.
Dudley, B.; Jones-Todd, C. (2018). New Zealand Coastal Water Quality Assessment Update. Ministry
for the Environment NIWA Client Report 2018096CH. May 2018. Ministry for the
Environment,
Durie, M. (2004). Exploring the Interface Between. Massey University. Palmerston North.
ECHA. (undated). Vanadium. European Chemicals Agency. from
https://echa.europa.eu/registration-dossier/-/registered-dossier/15421/5/4/2
Environment Southland (2019). Fiordland and Stewart Island passage plans.
Faber, J.; Hattum, B.v.; Kleissen, F. (2019). The impacts of EGCS washwater discharges on port
water and sediment. CE Delft Publication code: 19.4I09.141. October 2019. Delft, the
Netherlands.
Gadd, J.; Cameron, M. (2012). Antifouling biocides in marinas: measurement of copper
concentrations and comparison to model predictions for eight Auckland sites. Auckland
Council Technical Report TR2012/033. AKL2012-041. October 2012. Auckland.
Gadd, J.; Depree, C.; Hickey, C.W. (2011). Relevance to New Zealand of the OECD emission scenario
document for antifouling products: Phase 2 report. NIWA Client Report HAM2011-005.
August 2011. Hamilton.
Gadd, J.; Hickey, C.W. (2016). Guidelines for the protection of aquatic ecosystems, toxicant trigger
values: Copper – Marine - Draft. NIWA Draft guidelines for submission to Australian and New
Zealand guidelines for fresh and marine water quality. Hamilton, New Zealand.
Ghosal, D.; Ghosh, S.; Dutta, T.K.; Ahn, Y. (2016). Current State of Knowledge in Microbial
Degradation of Polycyclic Aromatic Hydrocarbons (PAHs): A Review. Frontiers in microbiology
7: 1369-1369.
Goring, D.G.; Walters, R.A. (2002). Ocean-tide loading and Earth tides around new Zealand. New
Zealand Journal of Marine and Freshwater Research 36(2): 299-309.
Gregory, D. (2012). A practical guide to exhaust gas cleaning systems for the maritime industry.
EGCSA Handbook 2012. Sustainable Maritime Solutions Ltd. United Kingdom.
Hatami, R.; Lane, S.; Robinson, A.; Inglis, G.; Todd-Jones, C.; Seaward, K. (2021) Improving New
Zealand’s marine biosecurity surveillance programme: A statistical review of biosecurity
vectors. Biosecurity New Zealand Technical Report No: 2021/01: 93.
Hattum, B.v.; Gils, J.v.; Markus, A.; Elzinga, H.; Jansen, M.; Baart, A. (2016). MAMPEC 3.1 Handbook.
Technical Documentation. Integrated hydrodynamic and chemical fate model. Edition
October 2016. Deltares. Delft, The Netherlands.

101
Hume, T.; Haskew, R.; Liefting, R. (2004). Definitions and computation of depth, volume and tidal
prism variables for New Zealand's estuaries. NIWA internal data archive No. 2004/06. 11 p.
Hume, T.; Gerbeaux, P.; Hart, D.; Kettles, H.; Neale, D. (2016). A classificiation of New Zealand’s
coastal hydrosystems. Prepared for Ministry for the Environment. NIWA Client report
HAM2016-062.
IMO Secretariat. (2015). Resolution MEPC.259(68) – 2015 Guidelines For Exhaust Gas Cleaning
Systems. Committee, Session, May 2015. Document Number, Marine Environment
Protection Committee, IMO, 25 p.
IMO Secretariat. (2020). Air Pollution Prevention. Preliminary overview of data on fuel oil quality
and availability currently in the MARPOL Annex VI module in GISIS. Committee, Session, July
2020. Document Number, Marine Environment Protection Committee, IMO, 10 p.
Johnston, O. (2019). Akaroa Harbour cruise ship visits: Preliminary ecological risk assessment.
Prepared for Environment Canterbury. Cawthron Report No. 3387. Cawthron Institute.
Nelson.
Karlsson, S.; Meili, M.; Bergström, U. (2012). Bioaccumulation factors in aquatic ecosystems. A
critical review. Studsvik Eco & Safety AB. Stockholm, Sweden.
Kjølholt, J.; Aakre, S.; Jurgensen, C.; Lauridsen, J. (2012). Assessment of possible impacts of scrubber
water discharges on the marine environment. Environmental Protection Agency, Danish
Ministry of the Environment Environmental Project No. 1431 Environmental Project No.
1431. Lyngby, Denmark.
Koyama, J.; Ishimaru, T.; Takasaki, K.; Takahashi, C.; Matsumoto, T.; Michio, Y.; Yamaji, K. (2018).
Report by the expert board for the environmental impact assessment of discharge water
from scrubbers (Japan). July 2018.
Law, C.S.; Bell, J.J.; Bostock, H.C.; Cornwall, C.E.; Cummings, V.J.; Currie, K.; Davy, S.K.; Gammon, M.;
Hepburn, C.D.; Hurd, C.L.; Lamare, M.; Mikaloff-Fletcher, S.E.; Nelson, W.A.; Parsons, D.M.;
Ragg, N.L.C.; Sewell, M.A.; Smith, A.M.; Tracey, D.M. (2018). Ocean acidification in New
Zealand waters: trends and impacts. New Zealand Journal of Marine and Freshwater
Research 52(2): 155-195.
Magnusson, K.; Thor, P.; Granberg, M. (2018). Scrubbers: Closing the loop. Activity 3: Task 2. Risk
assessment of marine exhaust gas scrubber water. IVL Swedish Environmental Research
Institute Ltd. No. B 2319. December 2018. Stockholm, Sweden.
MFE (2017). Ki Uta Ki Tai - From mountains to sea. Ministry for the Environment.
Moorfield, J.C. Te Aka Māori - English. Māori Dicitonary.
NIH. (2019). Hazardous Substances Data Bank (HSDB). U.S. National Library of Medicine. TOXNET
Toxicology Data Network., from https://www.ars.usda.gov/northeast-area/beltsville-md-
barc/beltsville-agricultural-research-center/adaptive-cropping-systems-
laboratory/docs/ppd/pesticide-properties-database/
Orr, J.C.; Epitalon, J.M.; Gattuso, J.P. (2015). Comparison of ten packages that compute ocean
carbonate chemistry. Biogeosciences 12(5): 1483-1510.

102
Pettine, M. (2000). Redox Processes of Chromium in Sea Water. In: Gianguzza, A.; Pelizetti, E.;
Sammartano, S. (eds). Chemical Processes in Marine Environments, pp. 281-296. Springer
Berlin Heidelberg, Berlin, Heidelberg.
Simpson, S.; Batley, G.; Chariton, A. (2013). Revision of the ANZECC/ARMCANZ Sediment Quality
Guidelines. CSIRO Land and Water Report 8/07. CSIRO Land and Water, Australia.
Teuchies, J.; Cox, T.J.S.; Van Itterbeeck, K.; Meysman, F.J.R.; Blust, R. (2020). The impact of scrubber
discharge on the water quality in estuaries and ports. Environmental Sciences Europe 32(1):
103.
US EPA (1986). Quality criteria for water (gold book). United States Environmental Protection
Agency, Criteria and Standards Division. EPA 440/5-86-001. US EPA, Washington D.C.
US EPA (1996). 1995 Updates: Water quality criteria documents for the protection of aquatic life in
ambient water. United States Environmental Protection Agency, Office of Water. EPA 820-B
96-001. September 1996. Washington D.C.
US EPA (2011). Exhaust Gas Scrubber Washwater Effluent. United States Environmental Protection
Agency Office of Wastewater Management. EPA‐800‐R‐11‐006. November 2011.
Washington, DC.
US EPA (2016). Development of National Bioaccumulation Factors: Supplemental Information for
EPA’s 2015 Human Health Criteria Update. U.S. Environmental Protection Agency, Office of
Water and Office of Science and Technology EPA 822-R-16-001. Washington, DC.
US EPA. (2019). IRIS Assessments. United States Environmental Protection Agency, Integrated Risk
Information System.
Vance, J.M.; Currie, K.I.; Law, C.S.; Murdoch, J.; Zeldis, J. (2020). NZOA-ON: the New Zealand Ocean
Acidification Observing Network. Marine and Freshwater Research 71(3): 281-299.
Verbruggen, E.M.J.; Herwijnen, R.v. (2011). Environmental risk limits for phenanthrene. National
Institute for Public Health and the Environment RIVM Letter Report 601357007/2011 The
Netherlands.
Walker, E.T.; Wehi, P.M.; Nelson, N.J.; Beggs, J.R.; Whaanga, H. (2019). Kaitiakitanga, place and the
urban restoration agenda. New Zealand Journal of Ecology 43(3).
Walters, R.A.; Goring, D.G.; Bell, R.G. (2001). Ocean tides around New Zealand. New Zealand
Journal of Marine and Freshwater Research 35(3): 567-579.
Warne, M.S.; Batley, G.E.; van Dam, R.A.; Chapman, J.C.; Fox, D.R.; Hickey, C.W.; Stauber, J.L.
(2018). Revised method for deriving Australian and New Zealand water quality guideline
values for toxicants - update of 2015 version. Prepared for the Australian and New Zealand
Guidelines for Fresh and Marine Water Quality. Australian and New Zealand Governments
and Australian state and territory governments. August 2015 - updated October 2018.
Canberra.
Wärtisilä (2010). Exhaust gas scrubber installed onboard MT "SUULA" : public test report.
Wehi, P.M.; Beggs, J.R.; McAllister, T.G. (2019). Ka mua, ka muri: the inclusion of matauranga Maori
in New Zealand ecology. New Zealand Journal of Ecology 43(3).

103
Appendix A List of iwi potentially affected List of iwi in areas potentially most likely impacted by larger international ships using scrubbers, as well as those areas likely to have existing interests and concerns over marine pollution/degradation. List provided by MfE October 2020.
Region/port Iwi groups/rohe moana IMPs in place?
Lytletton Port
Ngāi Tahu
Te Taumutu Runanga (Akaroa rohe moana)
Yes
Dunedin-Port Otago Ngāi Tahu
Ngai Tahu Rohe Moana
Murihiku Runanga (part of Ngai Tahu Rohe Moana)
Yes
PrimePort – Timaru
Ngāi Tahu
Te Runanga o Waihao rohe moana
Yes
Environment Southland
Ngāi Tahu
Ngai Tahu Rohe Moana
Yes
Port Nelson
Te Atiawa o Te Waka-a-Māui
Rangitāne o Wairau
Ngāti Kōata
Ngāti Toa Rangatira
Ngāti Kuia
For some
Port Marlborough (Picton Port)
Ngāti Kōata
Rangitāne o Wairau
Te Atiawa o Te Waka-a-Māui
Ngāti Kuia
Ngāti Toa Rangatira
For some
Wellington Port Te Ātiawa/Taranaki ki Te Upoko o Te Ika None lodged
Whanganui Port and lower Taranaki region
Ngāti Apa
Whanganui Iwi/Te Atihaunui a Pāpārangi
Ngā Rauru Kītahi
Ngāti Ruanui
Te Atiawa Taranaki
Te Atihaunui a Paparangi and Nga Rauru rohe moana
Some
Napier Port Ahuriri Hapū
Rohe moana:
Ngāti Hinepare and Ngāti Maahu me Ngai Tawhao Incorporated
Rohe moana: Ngai Te Ruruku o Te Rangi
Some

104
Region/port Iwi groups/rohe moana IMPs in place?
Eastland Port, Gisborne
Ngāti Porou
Rohe moana:
Ngāi Tamanuhiri as represented by the Ngäi Tämanuhiri Whänui Charitable Trust
None

105
Appendix B Data obtained from NIWA tidal model Velocity calculated from M2 S2 – U and V components taken from the NIWA tidal model (Goring &
Walters 2002). Below is an example calculation for the Port of Tauranga.

106
Tauranga
M2U 0.1733403
S2U 0.01899937
M2V 0.757331
S2V 0.054387
SpeedM = sqrt(M2U2+ M2V2) 0.77691512
SpeedS = sqrt(S2U2+ S2V2) 0.057610084
SpeedM&S = sqrt((M2U + S2U)2+( M2V + S2V)2) 0.834194618
Flow Velocity Used for MAMPEC 0.8342