environmental productivity indices for crop growth and ...spar.msstate.edu/class/epp-2008/chapter...
TRANSCRIPT
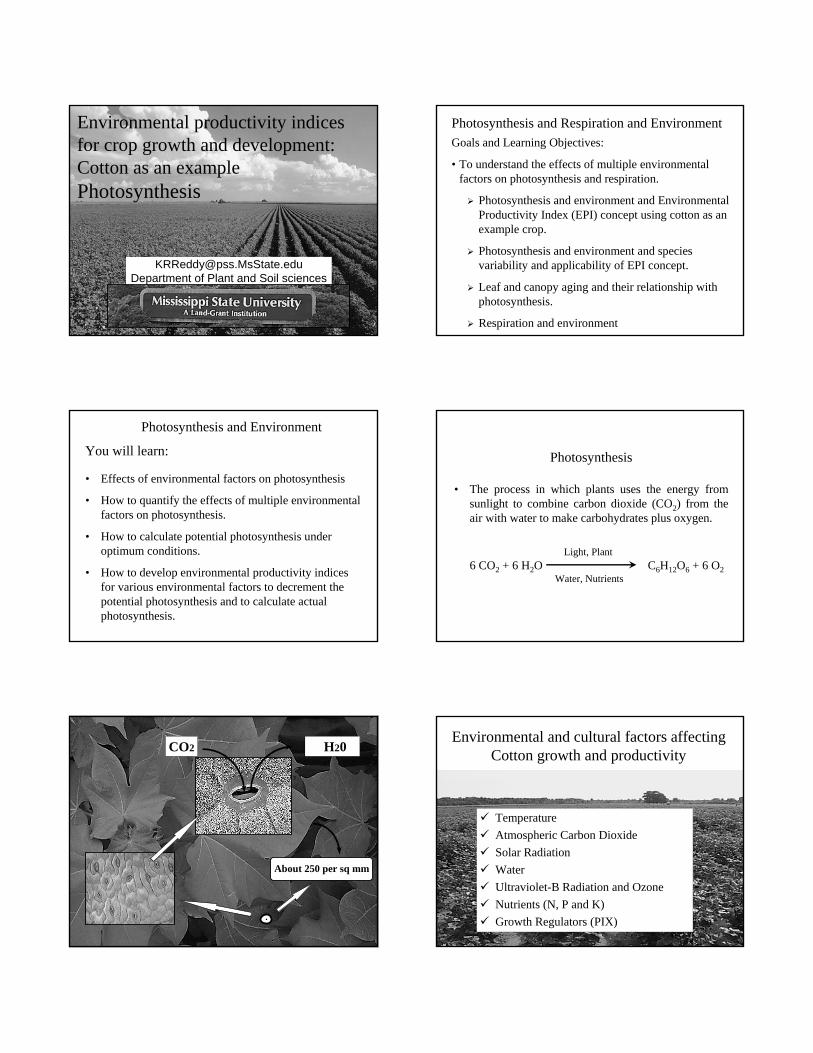
Environmental productivity indices for crop growth and development:Cotton as an examplePhotosynthesis
[email protected] of Plant and Soil sciences
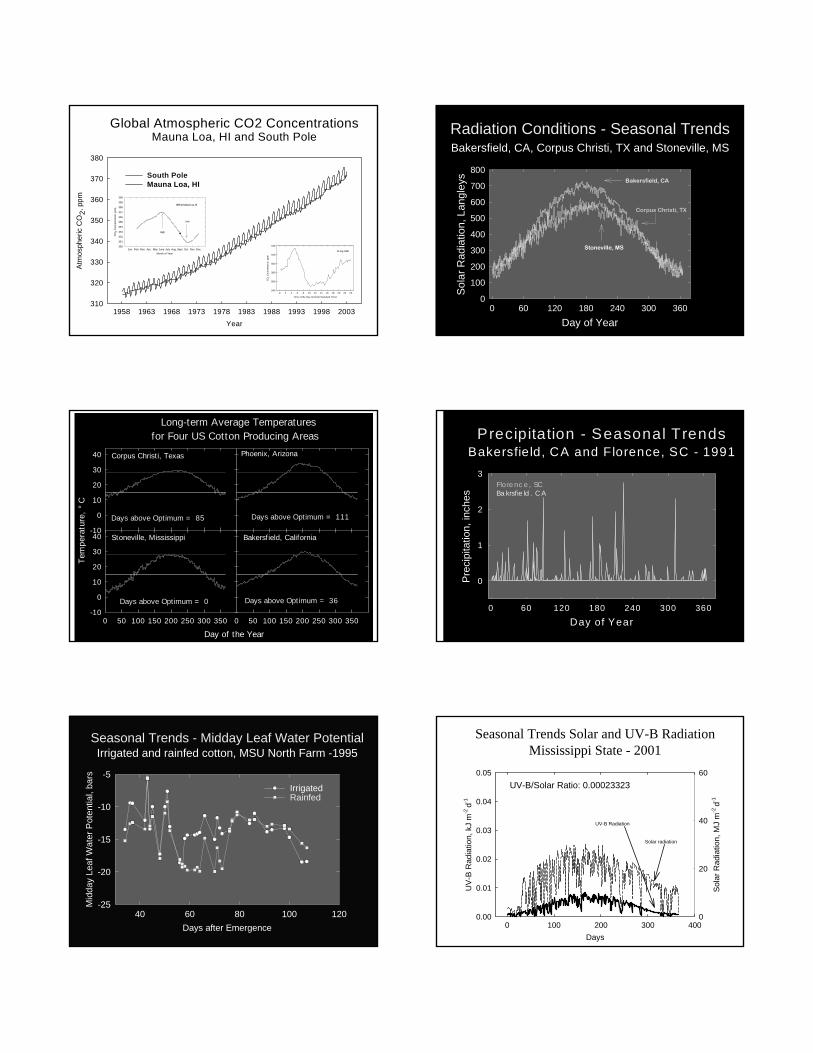
Photosynthesis and Respiration and EnvironmentGoals and Learning Objectives:
• To understand the effects of multiple environmental factors on photosynthesis and respiration.
Photosynthesis and environment and Environmental Productivity Index (EPI) concept using cotton as an example crop.
Photosynthesis and environment and species variability and applicability of EPI concept.
Leaf and canopy aging and their relationship with photosynthesis.
Respiration and environment
Photosynthesis and Environment
You will learn:
• Effects of environmental factors on photosynthesis
• How to quantify the effects of multiple environmental factors on photosynthesis.
• How to calculate potential photosynthesis under optimum conditions.
• How to develop environmental productivity indices for various environmental factors to decrement the potential photosynthesis and to calculate actual photosynthesis.
Photosynthesis
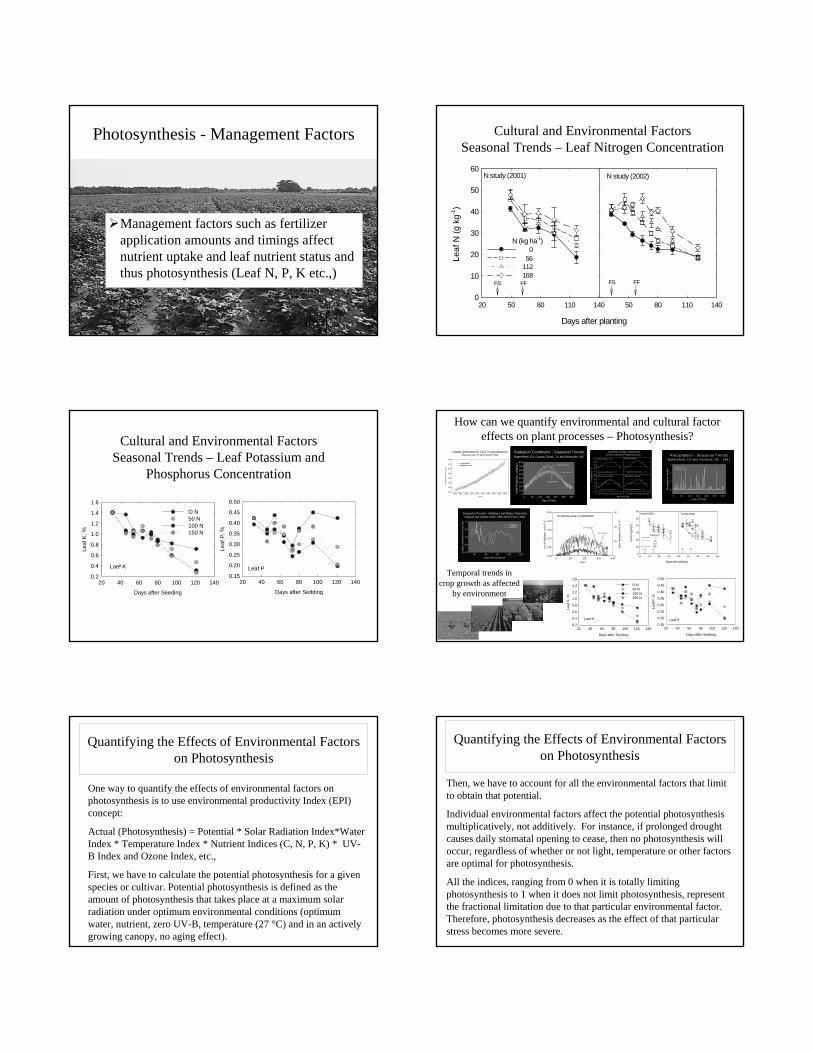
• The process in which plants uses the energy from sunlight to combine carbon dioxide (CO2) from the air with water to make carbohydrates plus oxygen.
Light, Plant6 CO2 + 6 H2O C6H12O6 + 6 O2
Water, Nutrients
H20 CO2
About 250 per sq mm
.
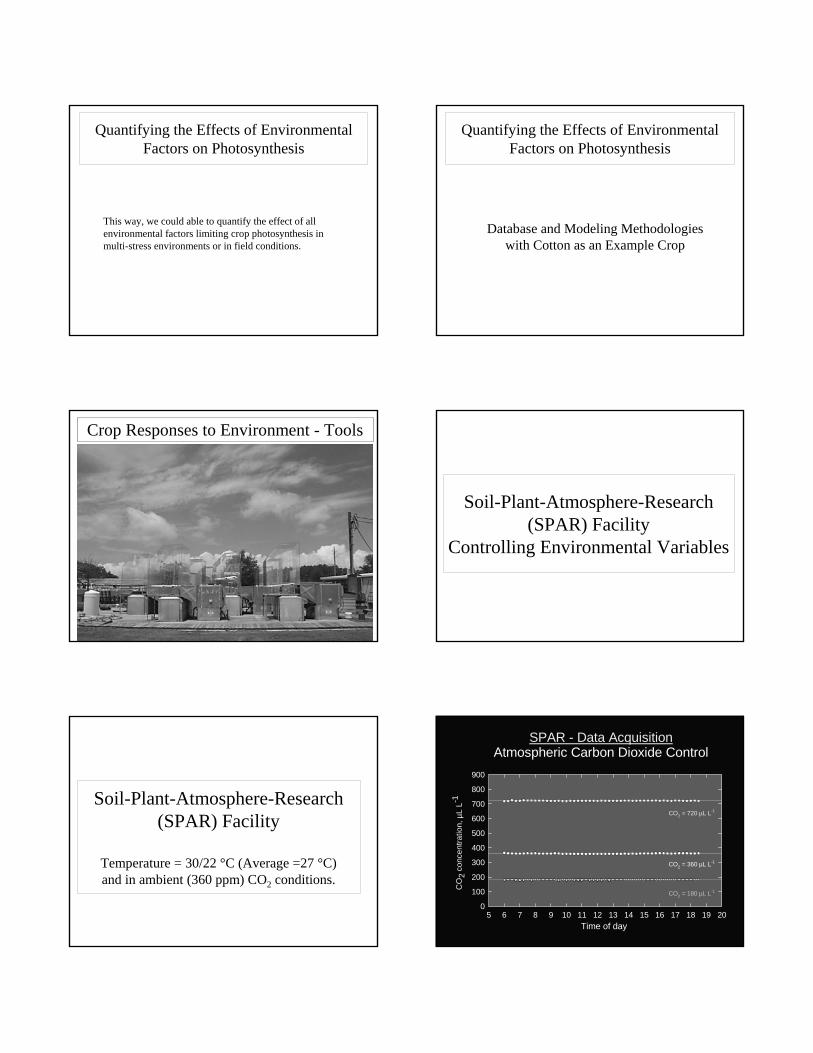
Environmental and cultural factors affecting Cotton growth and productivity
Temperature Atmospheric Carbon DioxideSolar RadiationWaterUltraviolet-B Radiation and OzoneNutrients (N, P and K)Growth Regulators (PIX)
Global Atmospheric CO2 ConcentrationsMauna Loa, HI and South Pole
Year1958 1963 1968 1973 1978 1983 1988 1993 1998 2003
Atm
osph
eric
CO
2, p
pm
310
320
330
340
350
360
370
380
South PoleMauna Loa, HI
Time of the Day (Central Standard Time)
0 2 4 6 8 10 12 14 16 18 20 22 24
CO
2 Con
cent
ratio
n, p
pm
340
360
380
400
420
440
23 July 1999Month of Year
Jan. Feb. Mar. Apr. May June July Aug. Sept. Oct. Nov. Dec.
CO
2 C
once
ntra
tion,
ppm
350
351
352
353
354
355
356
357
358
359
360
1990 at Mauna Loa, HI
High
Low
Radiation Conditions - Seasonal TrendsBakersfield, CA, Corpus Christi, TX and Stoneville, MS
Day of Year0 60 120 180 240 300 360
Sola
r Rad
iatio
n, L
angl
eys
0
100
200
300
400
500
600
700
800Bakersfield, CA
Corpus Christi, TX
Stoneville, MS
for Four US Cotton Producing Areas
Tem
pera
ture
, °C
Day of the Year0 50 100 150 200 250 300 350
-10
0
10
20
30
40-10
0
10
20
30
40
Days above Optimum = 0
Days above Optimum = 85
Stoneville, Mississippi
Corpus Christi, Texas
Long-term Average Temperatures
0 50 100 150 200 250 300 350
Days above Optimum = 36
Bakersfield, California
Days above Optimum = 111
Phoenix, Arizona
Precipitation - Seasonal TrendsBakersfield, CA and Florence, SC - 1991
Day of Year0 60 120 180 240 300 360
Pre
cipi
tatio
n, in
ches
0
1
2
3Flo re nc e , SCBa krsfie ld . C A
Seasonal Trends - Midday Leaf Water PotentialIrrigated and rainfed cotton, MSU North Farm -1995
Days after Emergence40 60 80 100 120
Mid
day
Leaf
Wat
er P
oten
tial,
bars
-25
-20
-15
-10
-5IrrigatedRainfed
Seasonal Trends Solar and UV-B RadiationMississippi State - 2001
Days0 100 200 300 400
UV
-B R
adia
tion,
kJ
m-2
d-1
0.00
0.01
0.02
0.03
0.04
0.05
Sol
ar R
adia
tion,
MJ
m-2
d-1
0
20
40
60
Solar radiation
UV-B Radiation
UV-UV-B/Solar Ratio: 0.00023323
Photosynthesis - Management Factors
Management factors such as fertilizer application amounts and timings affect nutrient uptake and leaf nutrient status and thus photosynthesis (Leaf N, P, K etc.,)
20 50 80 110 140
Leaf
N (g
kg-1
)
0
10
20
30
40
50
60
0 56112168
Days after planting
50 80 110 140
N (kg ha-1)
N study (2001) N study (2002)
FS FF FS FF
Cultural and Environmental FactorsSeasonal Trends – Leaf Nitrogen Concentration
Cultural and Environmental FactorsSeasonal Trends – Leaf Potassium and
Phosphorus Concentration
Leaf P
Days after Sedding
20 40 60 80 100 120 140
Leaf
P, %
0.15
0.20
0.25
0.30
0.35
0.40
0.45
0.50
Laef K
Days after Seeding
20 40 60 80 100 120 140
Leaf
K, %
0.2
0.4
0.6
0.8
1.0
1.2
1.4
1.6O N 50 N100 N150 N
How can we quantify environmental and cultural factor effects on plant processes – Photosynthesis?
Global Atmospheric CO2 ConcentrationsMauna Loa, HI and South Pole
Year1958 1963 1968 1973 1978 1983 1988 1993 1998 2003
Atm
osph
eric
CO
2, p
pm
310
320
330
340
350
360
370
380
South PoleMauna Loa, HI
Radiation Conditions - Seasonal TrendsBakersfield, CA, Corpus Christi, TX and Stoneville, MS
Day of Year0 60 120 180 240 300 360
Sola
r Rad
iatio
n, L
angl
eys
0
100
200
300
400
500
600
700
800Bakersfield, CA
Corpus Christi, TX
Stoneville, MS
for Four US Cotton Producing Areas
Tem
pera
ture
, °C
Day of the Year0 50 100 150 200 250 300 350
-10
0
10
20
30
40-10
0
10
20
30
40
Days above Optimum = 0
Days above Optimum = 85
Stoneville, Mississippi
Corpus Christi, Texas
Long-term Average Temperatures
0 50 100 150 200 250 300 350
Days above Optimum = 36
Bakersfield, California
Days above Optimum = 111
Phoenix, ArizonaPrecipitation - Seasonal Trends
Bakersfield, CA and Florence, SC - 1991
Day of Year0 60 120 180 240 300 360
Pre
cipi
tatio
n, in
ches
0
1
2
3Flo re nc e , SCBa krsfie ld . C A
Seasonal Trends - Midday Leaf Water PotentialIrrigated and rainfed cotton, MSU North Farm -1995
Days after Emergence40 60 80 100 120
Mid
day
Leaf
Wat
er P
oten
tial,
bars
-25
-20
-15
-10
-5IrrigatedRainfed
Days0 100 200 300 400
UV-
B R
adia
tion,
MJ
m-2
d-1
0.00
0.01
0.02
0.03
0.04
0.05
Sola
r Rad
iatio
n, M
J m
-2 d-1
0
20
40
60
Solar radiation
UV-B Radiation
UV-UV-B/Solar Ratio: 0.00023323
20 50 80 110 140
Leaf
N (g
kg-1
)
0
10
20
30
40
50
60
0 56112168
Days after planting
50 80 110 140
N (kg ha-1)
N study (2001) N study (2002)
FS FF FS FF
Leaf P
Days after Sedding
20 40 60 80 100 120 140
Leaf
P, %
0.15
0.20
0.25
0.30
0.35
0.40
0.45
0.50
Laef K
Days after Seeding
20 40 60 80 100 120 140
Leaf
K, %
0.2
0.4
0.6
0.8
1.0
1.2
1.4
1.6O N 50 N100 N150 N
Temporal trends in crop growth as affected
by environment
Quantifying the Effects of Environmental Factors on Photosynthesis
One way to quantify the effects of environmental factors on photosynthesis is to use environmental productivity Index (EPI) concept:
Actual (Photosynthesis) = Potential * Solar Radiation Index*Water Index * Temperature Index * Nutrient Indices (C, N, P, K) * UV-B Index and Ozone Index, etc.,
First, we have to calculate the potential photosynthesis for a given species or cultivar. Potential photosynthesis is defined as the amount of photosynthesis that takes place at a maximum solar radiation under optimum environmental conditions (optimum water, nutrient, zero UV-B, temperature (27 °C) and in an actively growing canopy, no aging effect).
Quantifying the Effects of Environmental Factors on Photosynthesis
Then, we have to account for all the environmental factors that limit to obtain that potential.
Individual environmental factors affect the potential photosynthesis multiplicatively, not additively. For instance, if prolonged drought causes daily stomatal opening to cease, then no photosynthesis will occur, regardless of whether or not light, temperature or other factors are optimal for photosynthesis.
All the indices, ranging from 0 when it is totally limiting photosynthesis to 1 when it does not limit photosynthesis, represent the fractional limitation due to that particular environmental factor. Therefore, photosynthesis decreases as the effect of that particular stress becomes more severe.
Quantifying the Effects of Environmental Factors on Photosynthesis
This way, we could able to quantify the effect of all environmental factors limiting crop photosynthesis in multi-stress environments or in field conditions.
Quantifying the Effects of Environmental Factors on Photosynthesis
Database and Modeling Methodologies with Cotton as an Example Crop
Crop Responses to Environment - Tools
Naturally-lit Plant Growth Chambers
Soil-Plant-Atmosphere-Research (SPAR) Facility
Controlling Environmental Variables
Soil-Plant-Atmosphere-Research (SPAR) Facility
Temperature = 30/22 °C (Average =27 °C)and in ambient (360 ppm) CO2 conditions.
SPAR - Data AcquisitionAtmospheric Carbon Dioxide Control
Time of day5 6 7 8 9 10 11 12 13 14 15 16 17 18 19 20
CO
2 co
ncen
tratio
n, µ
L L-1
0
100
200
300
400
500
600
700
800
900
CO2 = 180 µL L-1
CO2 = 720 µL L-1
CO2 = 360 µL L-1
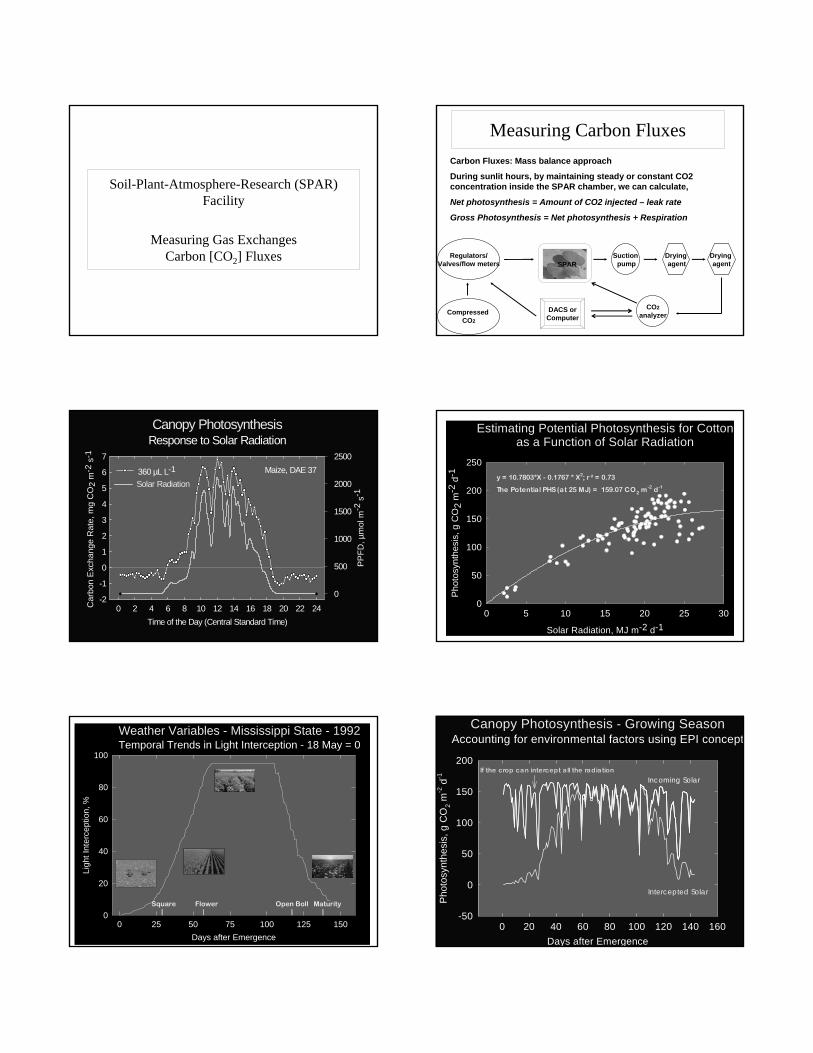
Soil-Plant-Atmosphere-Research (SPAR) Facility
Measuring Gas Exchanges Carbon [CO2] Fluxes
Measuring Carbon FluxesCarbon Fluxes: Mass balance approach
During sunlit hours, by maintaining steady or constant CO2 concentration inside the SPAR chamber, we can calculate,
Net photosynthesis = Amount of CO2 injected – leak rate
Gross Photosynthesis = Net photosynthesis + Respiration
Suctionpump
Dryingagent
Drying agent
CO2analyzer
DACS orComputer
Compressed CO2
Regulators/Valves/flow meters SPAR
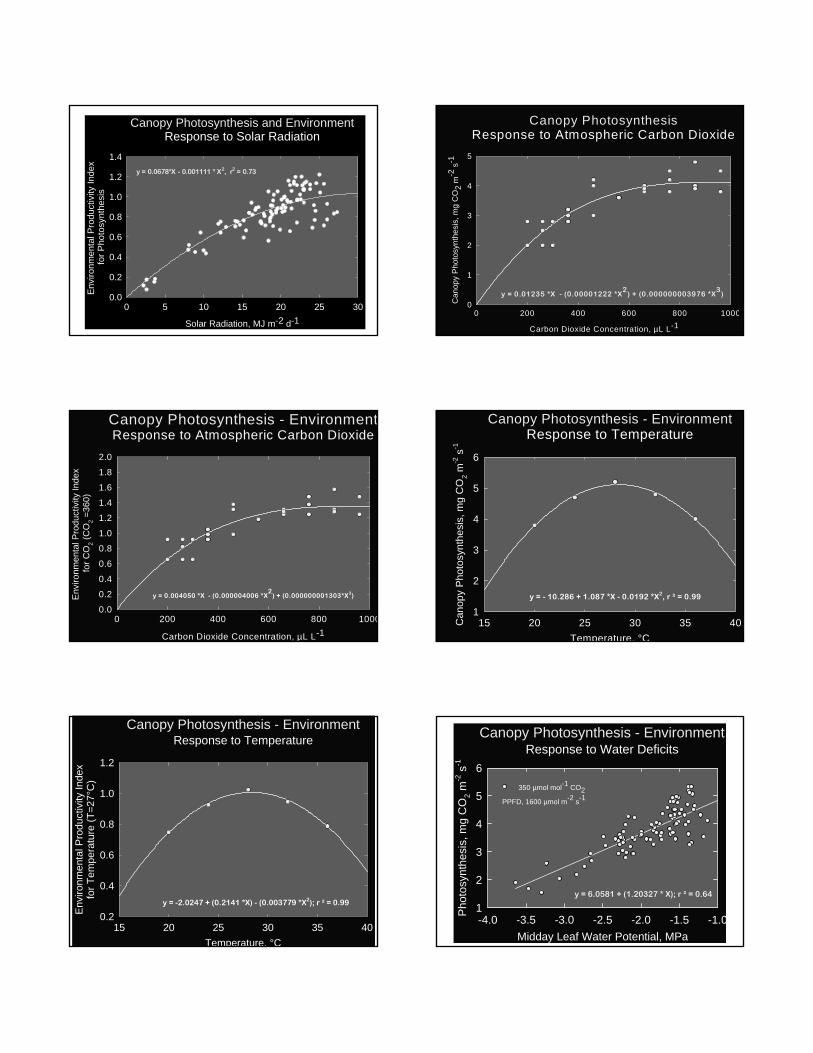
Canopy PhotosynthesisResponse to Solar Radiation
Time of the Day (Central Standard Time)0 2 4 6 8 10 12 14 16 18 20 22 24
PPFD
, µm
ol m
-2 s
-1
0
500
1000
1500
2000
2500
Car
bon
Exc
hang
e R
ate,
mg
CO
2 m
-2 s
-1
-2
-1
0
1
2
3
4
5
6
7
360 µL L-1
Solar RadiationMaize, DAE 37
Estimating Potential Photosynthesis for Cottonas a Function of Solar Radiation
Solar Radiation, MJ m-2 d-10 5 10 15 20 25 30
Phot
osyn
thes
is, g
CO
2 m
-2 d
-1
0
50
100
150
200
250y = 10.7803*X - 0.1767 * X2; r ² = 0.73
The Potential PHS (at 25 MJ) = 159.07 CO2 m-2 d-1
Weather Variables - Mississippi State - 1992Temporal Trends in Light Interception - 18 May = 0
Days after Emergence0 25 50 75 100 125 150
Ligh
t Int
erce
ptio
n, %
0
20
40
60
80
100
Square Flower Open Boll Maturity
Canopy Photosynthesis - Growing SeasonAccounting for environmental factors using EPI concept
Days after Emergence0 20 40 60 80 100 120 140 160
Pho
tosy
nthe
sis,
g C
O2 m
-2 d
-1
-50
0
50
100
150
200If the crop can intercept all the radiation
Intercepted Solar
Incoming Solar
Canopy Photosynthesis and EnvironmentResponse to Solar Radiation
Solar Radiation, MJ m-2 d-10 5 10 15 20 25 30
Envi
ronm
enta
l Pro
duct
ivity
Inde
x fo
r Pho
tosy
nthe
sis
0.0
0.2
0.4
0.6
0.8
1.0
1.2
1.4y = 0.0678*X - 0.001111 * X2, r2 = 0.73
Canopy PhotosynthesisResponse to Atmospheric Carbon Dioxide
Carbon Dioxide Concentration, µL L-10 200 400 600 800 1000
Can
opy
Pho
tosy
nthe
sis,
mg
CO
2 m
-2 s
-1
0
1
2
3
4
5
y = 0.01235 *X - (0.00001222 *X2
) + (0.000000003976 *X3
)
Canopy Photosynthesis - EnvironmentResponse to Atmospheric Carbon Dioxide
Carbon Dioxide Concentration, µL L-10 200 400 600 800 1000
Env
ironm
enta
l Pro
duct
ivity
Inde
x fo
r CO
2 (C
O2 =
360)
0.0
0.2
0.4
0.6
0.8
1.0
1.2
1.4
1.6
1.8
2.0
y = 0.004050 *X - (0.000004006 *X2
) + (0.000000001303*X3)
Canopy Photosynthesis - EnvironmentResponse to Temperature
Temperature, °C15 20 25 30 35 40C
anop
y P
hoto
synt
hesi
s, m
g C
O2 m
-2 s
-1
1
2
3
4
5
6
y = - 10.286 + 1.087 *X - 0.0192 *X2, r ² = 0.99
Canopy Photosynthesis - EnvironmentResponse to Temperature
Temperature, °C15 20 25 30 35 40
Env
ironm
enta
l Pro
duct
ivity
Inde
xfo
r Tem
pera
ture
(T=2
7°C
)
0.2
0.4
0.6
0.8
1.0
1.2
y = -2.0247 + (0.2141 *X) - (0.003779 *X2); r ² = 0.99
Canopy Photosynthesis - EnvironmentResponse to Water Deficits
Midday Leaf Water Potential, MPa-4.0 -3.5 -3.0 -2.5 -2.0 -1.5 -1.0P
hoto
synt
hesi
s, m
g C
O2 m
-2 s
-1
1
2
3
4
5
6
PPFD, 1600 µmol m-2 s-1 350 µmol mol-1 CO2
y = 6.0581 + (1.20327 * X); r ² = 0.64
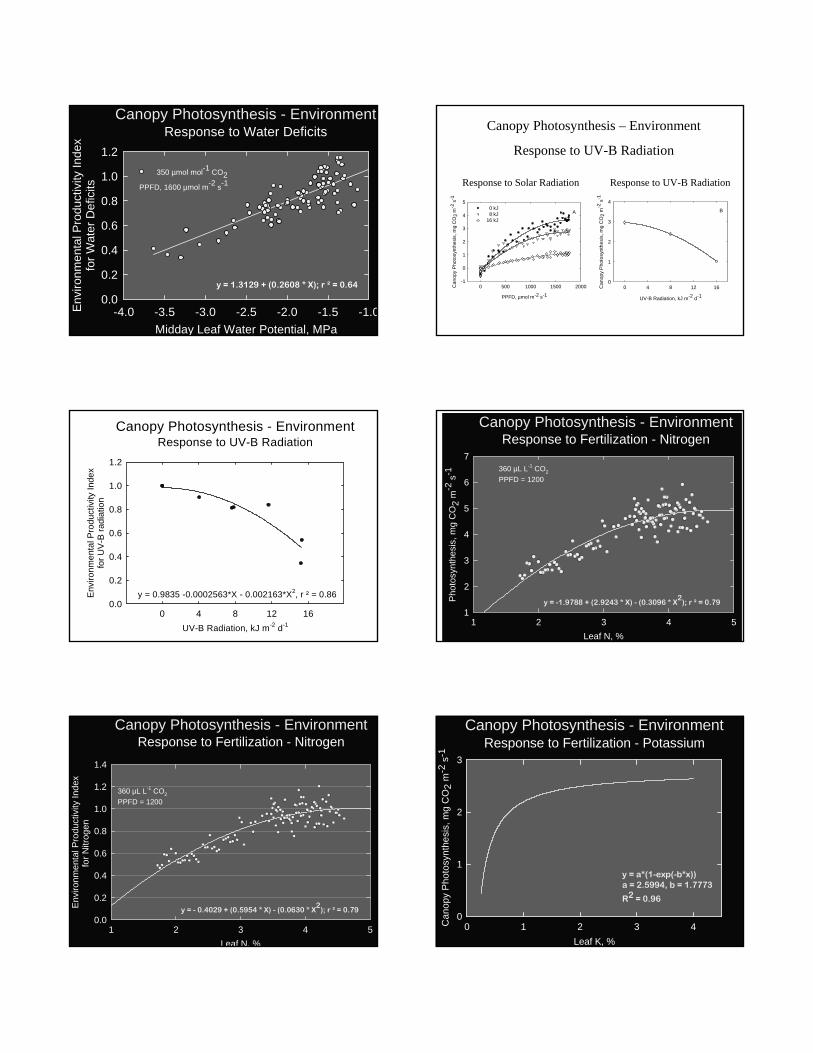
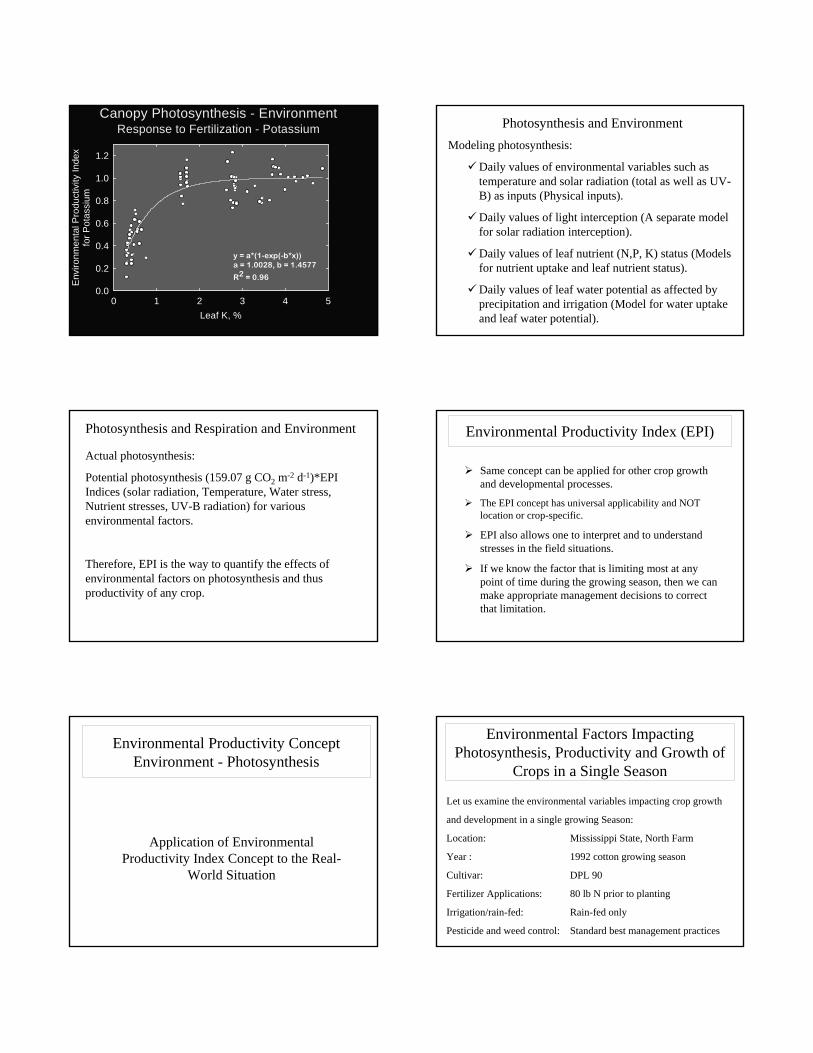
Canopy Photosynthesis - EnvironmentResponse to Water Deficits
Midday Leaf Water Potential, MPa-4.0 -3.5 -3.0 -2.5 -2.0 -1.5 -1.0E
nviro
nmen
tal P
rodu
ctiv
ity In
dex
for W
ater
Def
icits
0.0
0.2
0.4
0.6
0.8
1.0
1.2
PPFD, 1600 µmol m-2 s-1 350 µmol mol-1 CO2
y = 1.3129 + (0.2608 * X); r ² = 0.64PPFD, µmol m-2 s-1
0 500 1000 1500 2000Can
opy
Pho
tosy
nthe
sis,
mg
CO
2 m
-2 s
-1
-1
0
1
2
3
4
5 0 kJ 8 kJ16 kJ
A
UV-B Radiation, kJ m-2 d-1
0 4 8 12 16Can
opy
Pho
tosy
nthe
sis,
mg
CO
2 m
-2 s
-1
0
1
2
3
4
B
Canopy Photosynthesis – Environment
Response to UV-B Radiation
Response to Solar Radiation Response to UV-B Radiation
Canopy Photosynthesis - EnvironmentResponse to UV-B Radiation
UV-B Radiation, kJ m-2 d-10 4 8 12 16
Env
ironm
enta
l Pro
duct
ivity
Inde
xfo
r UV
-B ra
diat
ion
0.0
0.2
0.4
0.6
0.8
1.0
1.2
y = 0.9835 -0.0002563*X - 0.002163*X2, r ² = 0.86
Canopy Photosynthesis - EnvironmentResponse to Fertilization - Nitrogen
Leaf N, %1 2 3 4 5
Pho
tosy
nthe
sis,
mg
CO
2 m
-2 s
-1
1
2
3
4
5
6
7360 µL L-1 CO2
PPFD = 1200
y = -1.9788 + (2.9243 * X) - (0.3096 * X2
); r ² = 0.79
Canopy Photosynthesis - EnvironmentResponse to Fertilization - Nitrogen
Leaf N, %1 2 3 4 5
Envi
ronm
enta
l Pro
duct
ivity
Inde
xfo
r Nitr
ogen
0.0
0.2
0.4
0.6
0.8
1.0
1.2
1.4
360 µL L-1 CO2
PPFD = 1200
y = - 0.4029 + (0.5954 * X) - (0.0630 * X2
); r ² = 0.79
Canopy Photosynthesis - EnvironmentResponse to Fertilization - Potassium
Leaf K, %0 1 2 3 4C
anop
y P
hoto
synt
hesi
s, m
g C
O2
m-2
s-1
0
1
2
3
y = a*(1-exp(-b*x))a = 2.5994, b = 1.7773
R2 = 0.96
Canopy Photosynthesis - EnvironmentResponse to Fertilization - Potassium
Leaf K, %0 1 2 3 4 5
Env
ironm
enta
l Pro
duct
ivity
Inde
xfo
r Pot
assi
um
0.0
0.2
0.4
0.6
0.8
1.0
1.2
y = a*(1-exp(-b*x))a = 1.0028, b = 1.4577
R2 = 0.96
Photosynthesis and EnvironmentModeling photosynthesis:
Daily values of environmental variables such as temperature and solar radiation (total as well as UV-B) as inputs (Physical inputs).
Daily values of light interception (A separate model for solar radiation interception).
Daily values of leaf nutrient (N,P, K) status (Models for nutrient uptake and leaf nutrient status).
Daily values of leaf water potential as affected by precipitation and irrigation (Model for water uptake and leaf water potential).
Photosynthesis and Respiration and Environment
Actual photosynthesis:
Potential photosynthesis (159.07 g CO2 m-2 d-1)*EPI Indices (solar radiation, Temperature, Water stress, Nutrient stresses, UV-B radiation) for various environmental factors.
Therefore, EPI is the way to quantify the effects of environmental factors on photosynthesis and thusproductivity of any crop.
Environmental Productivity Index (EPI)
Same concept can be applied for other crop growth and developmental processes.
The EPI concept has universal applicability and NOT location or crop-specific.
EPI also allows one to interpret and to understand stresses in the field situations.
If we know the factor that is limiting most at any point of time during the growing season, then we can make appropriate management decisions to correct that limitation.
Environmental Productivity ConceptEnvironment - Photosynthesis
Application of Environmental Productivity Index Concept to the Real-
World Situation
Environmental Factors Impacting Photosynthesis, Productivity and Growth of
Crops in a Single Season
Let us examine the environmental variables impacting crop growth
and development in a single growing Season:
Location: Mississippi State, North Farm
Year : 1992 cotton growing season
Cultivar: DPL 90
Fertilizer Applications: 80 lb N prior to planting
Irrigation/rain-fed: Rain-fed only
Pesticide and weed control: Standard best management practices
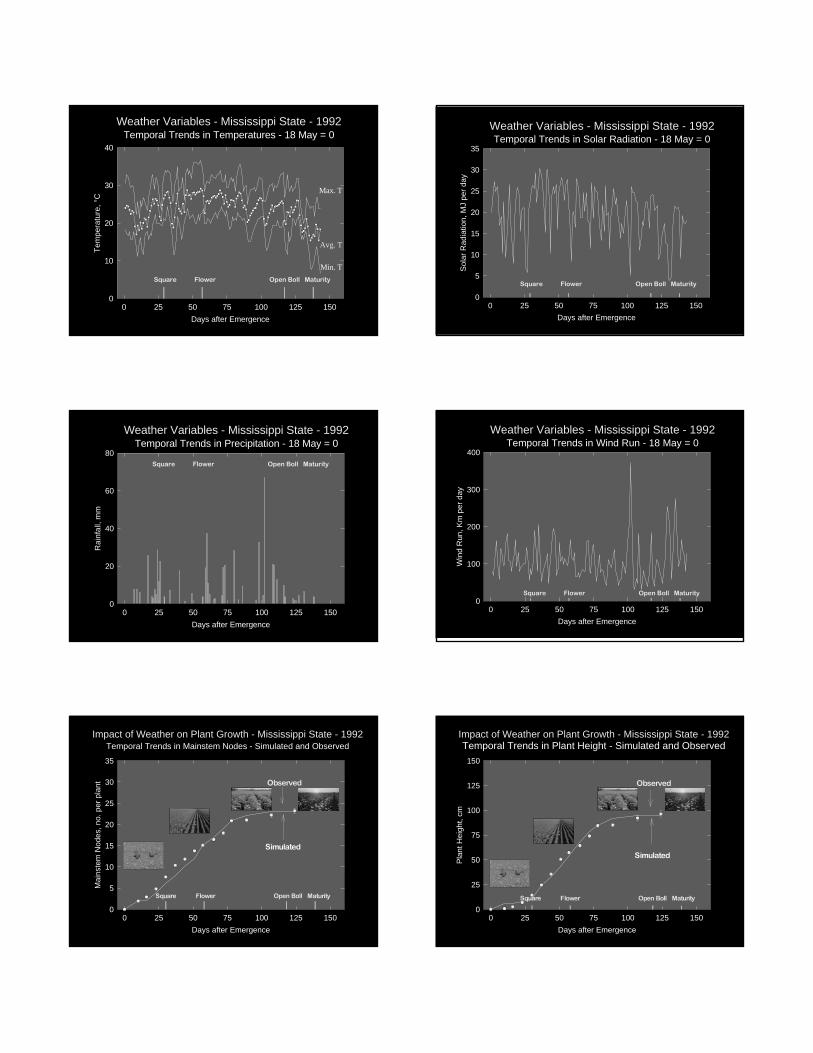
Weather Variables - Mississippi State - 1992Temporal Trends in Temperatures - 18 May = 0
Days after Emergence0 25 50 75 100 125 150
Tem
pera
ture
, °C
0
10
20
30
40
Square Flower Open Boll Maturity
Max. T
Avg. T
Min. T
Weather Variables - Mississippi State - 1992Temporal Trends in Solar Radiation - 18 May = 0
Days after Emergence0 25 50 75 100 125 150
Sol
ar R
adia
tion,
MJ
per d
ay
0
5
10
15
20
25
30
35
Square Flower Open Boll Maturity
Weather Variables - Mississippi State - 1992Temporal Trends in Precipitation - 18 May = 0
Days after Emergence0 25 50 75 100 125 150
Rai
nfal
l, m
m
0
20
40
60
80Square Flower Open Boll Maturity
Weather Variables - Mississippi State - 1992Temporal Trends in Wind Run - 18 May = 0
Days after Emergence0 25 50 75 100 125 150
Win
d R
un, K
m p
er d
ay
0
100
200
300
400
Square Flower Open Boll Maturity
Impact of Weather on Plant Growth - Mississippi State - 1992Temporal Trends in Mainstem Nodes - Simulated and Observed
Days after Emergence0 25 50 75 100 125 150
Mai
nste
m N
odes
, no.
per
pla
nt
0
5
10
15
20
25
30
35
Square Flower Open Boll Maturity
Simulated
Observed
Impact of Weather on Plant Growth - Mississippi State - 1992Temporal Trends in Plant Height - Simulated and Observed
Days after Emergence0 25 50 75 100 125 150
Plan
t Hei
ght,
cm
0
25
50
75
100
125
150
Square Flower Open Boll Maturity
Simulated
Observed
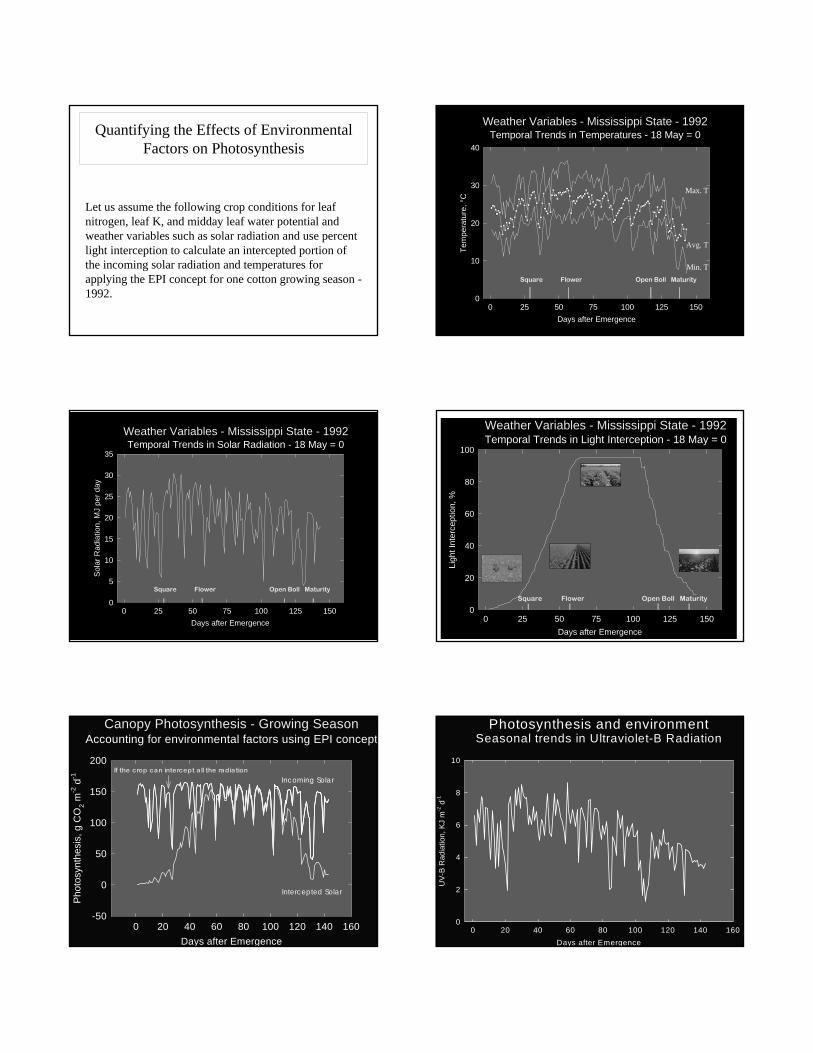
Quantifying the Effects of Environmental Factors on Photosynthesis
Let us assume the following crop conditions for leaf nitrogen, leaf K, and midday leaf water potential and weather variables such as solar radiation and use percent light interception to calculate an intercepted portion of the incoming solar radiation and temperatures for applying the EPI concept for one cotton growing season -1992.
Weather Variables - Mississippi State - 1992Temporal Trends in Temperatures - 18 May = 0
Days after Emergence0 25 50 75 100 125 150
Tem
pera
ture
, °C
0
10
20
30
40
Square Flower Open Boll Maturity
Max. T
Avg. T
Min. T
Weather Variables - Mississippi State - 1992Temporal Trends in Solar Radiation - 18 May = 0
Days after Emergence0 25 50 75 100 125 150
Sol
ar R
adia
tion,
MJ
per d
ay
0
5
10
15
20
25
30
35
Square Flower Open Boll Maturity
Weather Variables - Mississippi State - 1992Temporal Trends in Light Interception - 18 May = 0
Days after Emergence0 25 50 75 100 125 150
Ligh
t Int
erce
ptio
n, %
0
20
40
60
80
100
Square Flower Open Boll Maturity
Canopy Photosynthesis - Growing SeasonAccounting for environmental factors using EPI concept
Days after Emergence0 20 40 60 80 100 120 140 160
Pho
tosy
nthe
sis,
g C
O2 m
-2 d
-1
-50
0
50
100
150
200If the crop can intercept all the radiation
Intercepted Solar
Incoming Solar
Photosynthesis and environmentSeasonal trends in Ultraviolet-B Radiation
Days after Emergence0 20 40 60 80 100 120 140 160
UV-
B R
adia
tion,
KJ
m-2
d-1
0
2
4
6
8
10
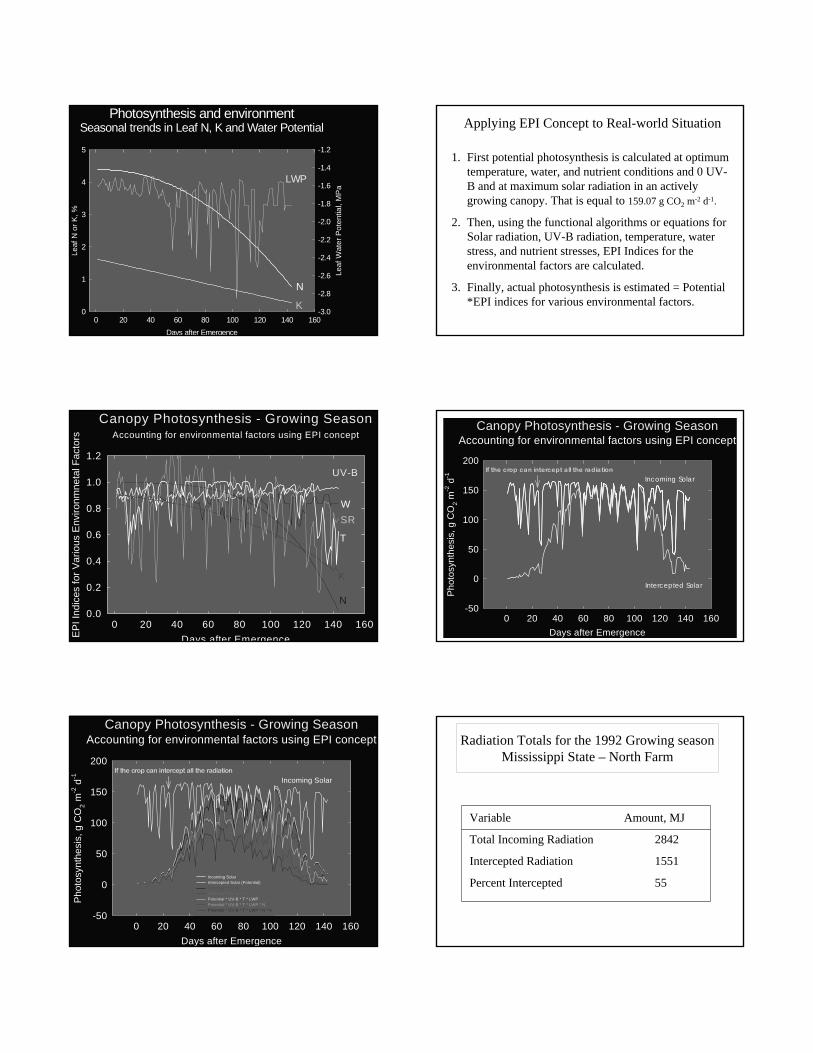
Photosynthesis and environmentSeasonal trends in Leaf N, K and Water Potential
Days after Emergence0 20 40 60 80 100 120 140 160
Leaf
N o
r K, %
0
1
2
3
4
5
Leaf
Wat
er P
oten
tial,
MP
a
-3.0
-2.8
-2.6
-2.4
-2.2
-2.0
-1.8
-1.6
-1.4
-1.2
N
LWP
K
Applying EPI Concept to Real-world Situation
1. First potential photosynthesis is calculated at optimum temperature, water, and nutrient conditions and 0 UV-B and at maximum solar radiation in an actively growing canopy. That is equal to 159.07 g CO2 m-2 d-1.
2. Then, using the functional algorithms or equations for Solar radiation, UV-B radiation, temperature, water stress, and nutrient stresses, EPI Indices for the environmental factors are calculated.
3. Finally, actual photosynthesis is estimated = Potential *EPI indices for various environmental factors.
Canopy Photosynthesis - Growing SeasonAccounting for environmental factors using EPI concept
Days after Emergence0 20 40 60 80 100 120 140 160
EP
I Ind
ices
for V
ario
us E
nviro
nmne
tal F
acto
rs
0.0
0.2
0.4
0.6
0.8
1.0
1.2
N
T
W
UV-B
SR
K
Canopy Photosynthesis - Growing SeasonAccounting for environmental factors using EPI concept
Days after Emergence0 20 40 60 80 100 120 140 160
Phot
osyn
thes
is, g
CO
2 m-2
d-1
-50
0
50
100
150
200If the crop can intercept all the radiation
Intercepted Solar
Incoming Solar
Canopy Photosynthesis - Growing SeasonAccounting for environmental factors using EPI concept
Days after Emergence0 20 40 60 80 100 120 140 160
Phot
osyn
thes
is, g
CO
2 m-2
d-1
-50
0
50
100
150
200If the crop can intercept all the radiation
Incoming Solar
Incoming Solar Intercepted Solar (Potential) Potential * UV-BPotential * UV-B * TPotential * UV-B * T * LWP Potential * UV-B * T * LWP * NPotential * UV-B * T * LWP * N * K
Variable Amount, MJ
Total Incoming Radiation 2842
Intercepted Radiation 1551
Percent Intercepted 55
Radiation Totals for the 1992 Growing seasonMississippi State – North Farm
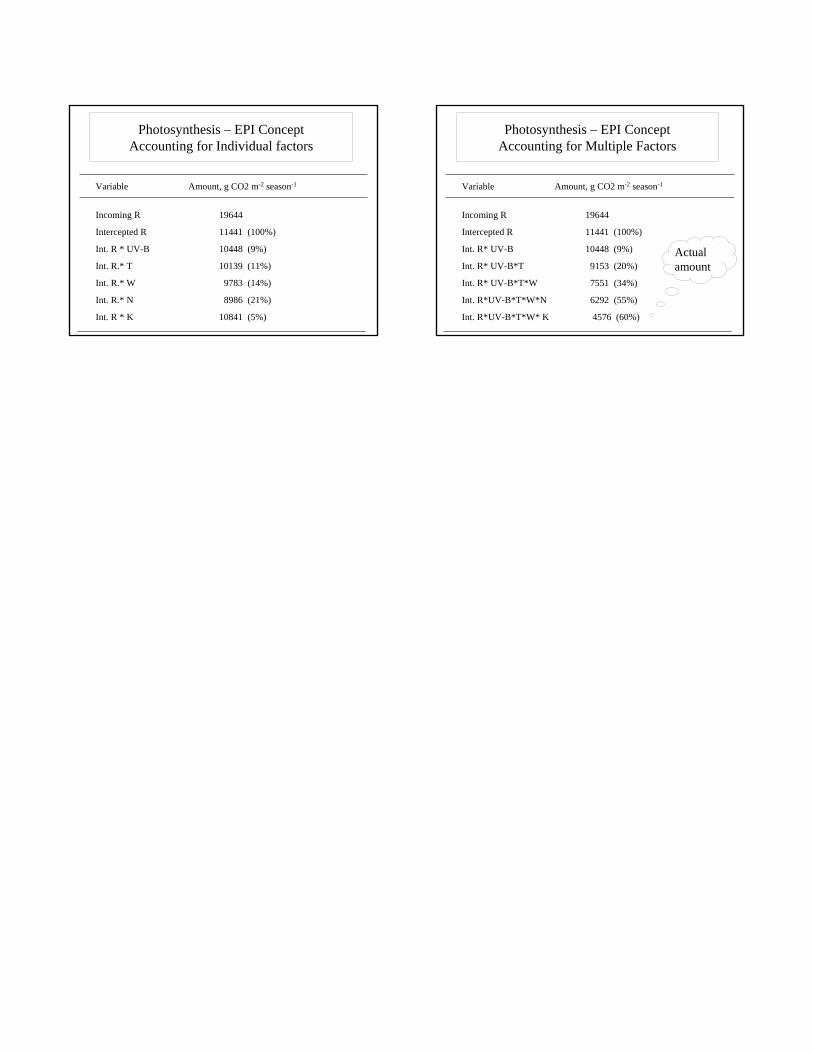
Variable Amount, g CO2 m-2 season-1
Incoming R 19644
Intercepted R 11441 (100%)
Int. R * UV-B 10448 (9%)
Int. R.* T 10139 (11%)
Int. R.* W 9783 (14%)
Int. R.* N 8986 (21%)
Int. R * K 10841 (5%)
Photosynthesis – EPI ConceptAccounting for Individual factors
Photosynthesis – EPI ConceptAccounting for Multiple Factors
Actual amount
Variable Amount, g CO2 m-2 season-1
Incoming R 19644
Intercepted R 11441 (100%)
Int. R* UV-B 10448 (9%)
Int. R* UV-B*T 9153 (20%)
Int. R* UV-B*T*W 7551 (34%)
Int. R*UV-B*T*W*N 6292 (55%)
Int. R*UV-B*T*W* K 4576 (60%)