environmental performance assessment - cresp · •what do we mean by environmental performance...
TRANSCRIPT

Environmental Performance Assessment
James H. Clarke, Ph.D. Professor of the Practice Civil & Environmental Engineering Professor, Earth & Environmental Sciences Kevin G. Brown Ph.D. Senior Research Scientist Department of Civil and Environmental Engineering Vanderbilt University Consortium for Risk Evaluation with Stakeholder Participation (CRESP) Nashville, TN
1

Introductory Comments
•What do we mean by environmental performance assessment?
•Importance of and reliance upon performance assessment with respect to decision-making for waste management and environmental restoration.
•Challenge associated with forecasting performance over time periods that exceed our experience by several orders of magnitude.
•Importance of the conceptual model(s)
•Uncertainty?
2

NCRP 152 (2006)
Source: Seitz (2009) 3

4
NCRP Report 152(2006), Performance Assessment of Near Surface Facilities for the Disposal of Low Level Waste defines performance assessment as an: Iterative process involving site-specific, prospective modeling evaluations of the postclosure time phase of a waste disposal system for the purpose of
•determining whether reasonable assurance of compliance with regulatory performance objectives can be demonstrated, and •identifying critical data, facility design, and model development needs for defensible and cost-effective licensing decisions and developing operating limits (waste decision criteria) for specific disposal facilities. (boldface added)

Regulatory Framework Department of Energy
•DOE O 435.1 Radioactive Waste Management
•DOE M 435.1-1 Radioactive Waste Management Manual
Nuclear Regulatory Commission •Licensing Requirements for Land Disposal of Radioactive Waste (10CFR61)
Environmental Protection Agency •CERCLA (Comprehensive Environmental Response Compensation and Liability Act – “Superfund”)
•RCRA (Resource Conservation and Recovery Act)
•NEPA (National Environmental Policy Act)
Ronald Reagan NDAA Section 3116
5

Compliance Periods
•RCRA 30 years of post-closure monitoring and maintenance
•CERCLA 5 year reviews
•Uranium Mill Tailings Closures 200 to 1000 years design life
•Low Level Waste Disposal Facilities – 10,000 years recommended (NUREG 1573)
(may be revised to 20,000 years)
•HLW Geologic Repository 1,000,000 years
6

Dose Limits 100,000 mrem – Dose leading to ~5% chance of
Fatal Cancer (UNSCEAR)
10,000 mrem/yr – IAEA mandatory intervention
5,000 mrem/yr – Worker dose standard
1,000 mrem/yr – IAEA reference level for
intervention for cleanup
situations
360 mrem/yr – US Average dose all sources
(NCRP)
100 mrem/yr – All sources limit (IAEA practices,
DOE)
25 mrem/yr – NRC and DOE LLW
15 mrem/yr – EPA Radiation (40 CFR 191)
10 mrem/yr – Air (atmospheric) (40 CFR 61)
4 mrem/yr – Drinking Water (40 CFR 141)
1 mrem/yr – IAEA Exemption/Clearance
Source: Letourneau (2009)
One transcontinental round-trip
Flight – 5 mrem (NCRP 1987)
Air crew average – 300 mrem/yr
(UNSCEAR 2000)
Hall and Giaccia (2006)
7

The Performance Evaluation Process
Performance Objectives
Performance Assessment
Performance Confirmation
8

Example EM PA and PA-like Analysis Applications
Source: Letourneau (2009) 9

10
Historical Disposal Practices
Generic cross-sections (SDA)
Source: Sykes (2002)

11
Definitions Appropriate to Performance Assessment Model Calibration – tuning model parameter values so that predictions match measured data Model Verification – assuring that the resulting codes are correct and error free Model Validation - ??? – difficult with compliance periods in the 100s to 1000s of years; maybe best approach is performance confirmation approaches to build confidence in the models and the overall performance assessment)
Modeling Approaches
Temporal
•Time independent (steady state)
•Dynamic
Spatial
•1, 2, 3-dimensional
Level of complexity
•Simple (analytical)
•Complex (numerical)
12

Albert Einstein
Everything should be a simple as possible but no simpler.
13

The Performance Evaluation Process
Performance Objectives
Performance Assessment
Performance Confirmation
14

Performance Assessment Components
15

Conceptual Model and Scenario Issues for PA Model Components
•Cover Performance
•Hydraulic Barrier Degradation and Increased Hydraulic Conductivity
•Erosion and Biointrusion
•Waste Form
•Preferred Pathways and Fracture Development
•Radionuclide Release Processes and Scenarios
•Subsurface Fluid Flow and Radionuclide Transport
•Fracture Flow
•Equivalent Continuum, Discrete Fracture Networks, Stochastic Approaches
•Radionuclide Attenuation (sorption, matrix diffusion, chemical reaction)
•Water Chemistry and Radionuclide Mobility 16

Major Steps in a
Performance
Assessment
• Select (and screen) Features,
Events, and Processes (FEPs)
and develop scenario classes
• Develop process models (and, perhaps, abstractions or
reduced-order models) along with
their scientific basis
• Evaluate parameter and model
uncertainty
• Construct integrated system
model with a consistent treatment
of uncertainty
• Evaluate system model
results, including the effects of
uncertainty (conduct
uncertainty/sensitivity analyses)
• Iterate Source: Sevougian (2009) 17

Niels Bohr
Prediction is very difficult, especially if it's about the future.
18

George E.P. Box Professor Emeritus of Statistics University of Wisconsin
“All models are wrong, but some are useful.”
Box, George E. P. and Norman R. Draper, Empirical Model-Building and Response Surfaces, p. 424, Wiley, 1987.
19

Conceptual Site Models for Contaminated Sites
The American Society for Testing and Materials (ASTM) defines a conceptual site model as
“… a written or pictorial representation of an environmental system and the biological, physical, and chemical processes that determine the transport of contaminants from sources through environmental media to environmental receptors within the system.”
20

21
In their report on Conceptual Models of Flow and Transport in the Fractured Vadose Zone (NRC, 2001) the National Academies Committee on Fracture Characterization and Fluid Flow developed the following definition of a conceptual model for the purposes of their study: “A conceptual model is an evolving hypothesis identifying the important features, events and processes (boldface added) controlling fluid flow and contaminant transport of consequence at a specific field site in the context of a recognized problem.” The Committee goes on to say that “ A conceptual model is an hypothesis because it must be tested for internal consistency and for its ability to represent the real system in a meaningful way. The hypothesis evolves (is revised and refined) during testing and as new information is gathered (boldface added).”

Conceptual Site Models (CSM)
• Conceptual site models link sources of contamination to potential receptors, both human and ecological, through environmental transport pathways and exposure routes.
• Conceptual site models are powerful tools for site characterization, risk assessment and the evaluation of different remediation technologies and strategies
• Conceptual site models are depicted in different ways, using flow charts and environmental cross sections.
22

Source Environmental
Transport Pathways
Exposure Routes
Receptor
A conceptual site model links sources to receptors through environmental transport pathways and exposure routes
Conceptual Site Model (CSM)
23

24

The Hydrologic Cycle
25

Inter-Bedded Silts and Sands in NJ Coastal Sediments 26

27

28

RCRA Subtitle ‘C’ Profile
29
Source: Mattson et al. (2004)

Current Approach To Cover System Design Emphasizes Prevention of Infiltration Into The Waste/Contaminated Medium

Total Systems View of a Contaminant Isolation Facility
32


34

35
Conceptual Burial Site Model Source: Brown (2008)

36
Novel CSM – Remedial Actions
Source: Brown (2008)

31
Improved Conceptual Site Model (CSM)
Source: Brown, et al. (2005)

Conceptual Site Models (CSM)
• Conceptual site models link sources of contamination to potential receptors, both human and ecological, through environmental transport pathways and exposure routes.
• Conceptual site models are powerful tools for site characterization, risk assessment and the evaluation of different remediation technologies and strategies
• Conceptual site models are depicted in different ways, using flow charts and environmental cross sections.
38

Elvin Jones world class jazz drummer
(John Coltrane and others)
If you can’t find the 1 …… forget it! (or if the conceptual model is wrong …)
39

Precipitation (P)
L
“Sponge”
(S)
Infiltration (I)
Percolation if I > S
Evapotranspiration
Factors Affecting Storage &
Percolation
Water retention characteristics of soils
(loam vs. sand)
Meteorological conditions
- amount of precipitation
- distribution of precipitation
- form of precipitation
Type of vegetation
Layering of soils
40

41
RCRA Subtitle ‘C’ Profile
Source: Mattson et al. (2004)


Preferred Pathways – Fast Flow Paths
• Features of a subsurface environment that
enable faster transport and reduced travel times than would otherwise be anticipated
• E.g., fractures in and zones of higher hydraulic conductivity in consolidated soils and porous media
• Preferred pathways are a typical feature in heterogeneous environments.
44

Photo Showing the Fractured Rock Subsurface at the Idaho National Laboratory
Transport through the subsurface invariably occurs through preferred pathways resulting in much faster travel times than would be expected in a uniform, homogeneous medium
45
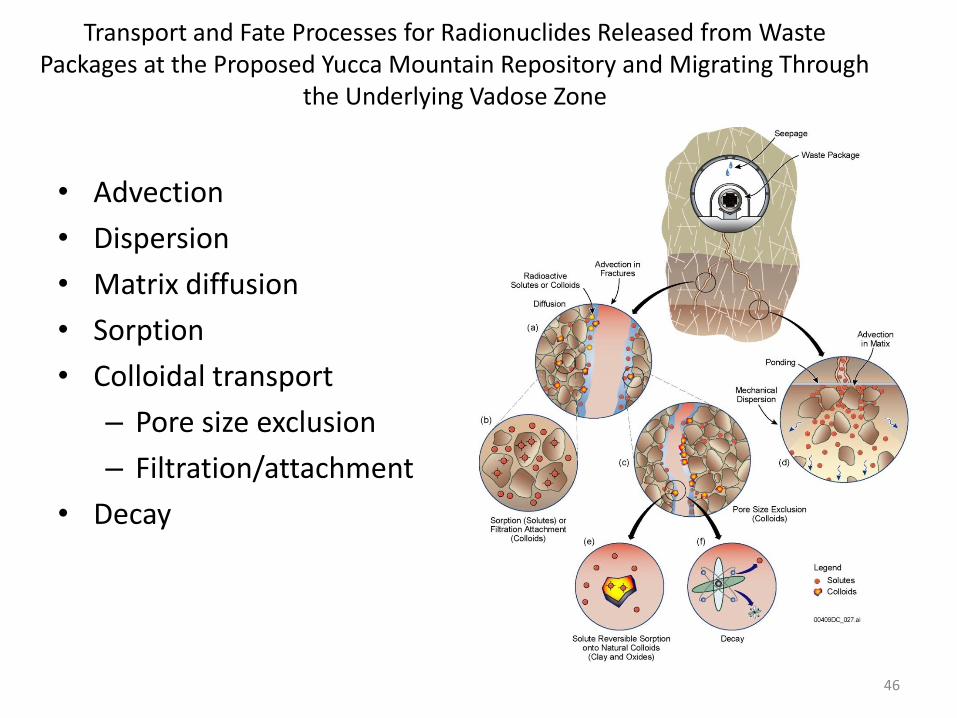
Transport and Fate Processes for Radionuclides Released from Waste Packages at the Proposed Yucca Mountain Repository and Migrating Through
the Underlying Vadose Zone
• Advection
• Dispersion
• Matrix diffusion
• Sorption
• Colloidal transport
– Pore size exclusion
– Filtration/attachment
• Decay
46

47

How do we get the Kd values?
In order of increasing confidence:
• from the literature
• from empirical correlations
• from laboratory tests
• from field studies
48

What About the Importance of the Presence of Other Chemicals?
Need to include other chemicals in the analysis especially if they have to potential to affect the mobility of the radionuclides of interest
• Complexing agents (e.g., EDTA)
• Solvents (e.g., TCE)
• Oxidizing and reducing agents
49
52

Fundamental Definitions
Uncertainty
“Lack of knowledge about specific variables, parameters, models, or other factors. Examples include limited data regarding the concentration of a contaminant in an environmental medium and lack of information on local fish consumption practices. Uncertainty may be reduced through further study.”
USEPA, 2001
51

Fundamental Definitions
Variability
“True heterogeneity or diversity that characterizes an exposure variable or response in a population. Further study (e.g., increasing sample size, n) will not reduce variability, but it can provide greater confidence (e.g., lower uncertainty) in quantitative characterizations of variability.”
USEPA, 2001
52

Areas of Uncertainty
• Scenario uncertainty
• Conceptual model uncertainty
• Parameter uncertainty
• Modeler uncertainty (Linkov and Burmistrov)
53

Approaches to Assessing Uncertainty
• Bounding analysis with perhaps a range of upper limit deterministic estimates (downside – often very conservative and unrealistic assumptions are made)
• More realistic deterministic estimates but with accompanying multiparameter sensitivity analysis
• Probabilistic analysis to yield a distribution of results
• “Hybrid” approach
54

Evolution of PAs
55 Source: Letourneau
(2009)

Realism and Conservative-Bias in PAs
Source: Letourneau (2009) 56

57
Thank You!

Backup Slides
58

Where:
C = solute concentration [M L-3];
t = time [T];
x = distance [L];
v = average groundwater velocity [L T-1];
D = dispersion coefficient [L2 T-1];
= first-order decay coefficient [T-1];
1-D Advection Dispersion Reaction Equation
59
t
CC
x
C
x
CD
2
2

Fundamental Processes
Advection
• Transport by which a material moves with a flowing medium (air, surface water, groundwater) at the average velocity of the medium
60

Dissolved Constituent Transport in The Saturated Zone
Darcy’s Law
v= ik/n where v = avg. gw velocity (cm/sec) i = hydraulic gradient (dimensionless) k = hydraulic conductivity (cm/sec) n = effective porosity (dimensionless)
61

Subsurface Exploration
•Soil borings, lithology
•Ground water monitoring well installation
•Pump tests and aquifer tests
•Tracer tests
(Photos courtesy of
AquAeTer, Inc.,
Brentwood, TN)
62

Fundamental Processes
Diffusion
• Transport that results from a concentration gradient—material moves in the direction of decreasing concentration.
• In fractured rock, contaminants are transported from flow in fractures to the rock matrix through matrix diffusion.
• A similar diffusive process transports contaminants from zones of relatively high mobility to zones of lower mobility in subsurface soils.
63

Fundamental Processes Dispersion
• Diffusive transport plus that transport that results from velocity gradients within the flowing medium
• Diffusion can be neglected in regions of high velocity
• When velocities are low, diffusion becomes a very important transport process
64

Gaussian Atmospheric Plume Dispersion Model
65
2
2
2
2
2
)(exp
2exp
2),,,(
zyzy
Hzy
u
QHzyxC

Atmospheric Monitoring and Modeling
Meteorological Stations for wind speed and direction data acquisition
(Photos courtesy of
AquAeTer, Inc.,
Brentwood, TN)
66

Fundamental Processes
Sorption
• A reactive process by which a dissolved constituent interacts with a solid surface resulting in a retardation effect when the movement is through a solid matrix (subsurface transport).
• In atmospheric and surface water transport, sorption results in a partitioning of the material from the flowing medium to solids suspended in the medium
67

Definition of the Retardation Factor, R
R = 1 + (ρ/η)Kd
where ρ = bulk solids density (g/ml)
η = effective porosity
and Kd, the soil water partition coefficient, is greater than or equal to zero
With this definition,
R = avg. groundwater velocity /avg. velocity of the dissolved chemical
So when Kd is greater than zero, the average velocity of the dissolved chemical is less that the average groundwater velocity, i.e., its transport is “retarded”.
68

Fundamental Processes
Decay
• The transformation of a constituent into another species either through changes in the nucleus or chemical or biological transformations
69

Fundamental Processes
Colloidal Transport
• The movement of contaminants in the form of very small particles or attached to very small particles.
• Colloids are typically taken to be on the order of a 0.1 to 0.001 microns (micrometers).
• Colloidal transport can result in higher transport velocities and corresponding lower travel times than would be predicted otherwise.
70