environmental life cycle assessment (lca) of ready meals - sik
TRANSCRIPT

SIK-Report No 804 2010
Environmental Life Cycle Assessment (LCA) of ready meals
LCA of two meals; pork and chicken
&
Screening assessments of six ready meals
Johanna Berlin
Veronica Sund

2

3
SIK-Report No 804 2010
Environmental Life Cycle Assessment (LCA) of ready meals
LCA of two meals; pork and chicken
&
Screening assessments of six ready meals
Johanna Berlin
Veronica Sund
SR 804 ISBN 978-91-7290-294-7

4
Double Fresh
Towards a new generation of healthier and tastier ready-to-eat meals with fresh ingredients
D7.8 Scientific publication on environmental impact of the new RTE meal
concepts in comparison to the existing offerings. Organisation name of lead contractor for this deliverable: SIK –the Swedish Institute for Food and Biotechnology AB
Double FreshDouble Fresh
Double FreshDouble Fresh

5
Project Information
Project start January 2009
Project leader PhD Johanna Berlin
Project group PhD Johanna Berlin
BSc Veronica Sund
Project group
The project is supported by the European Commission
Keywords
Environment, Life cycle assessment, LCA, meal, chicken, pork, climate effect, global
warming, GWP , eutrophication, acidification, primary energy.

6
Abstract
The wastage of food along the food chain is a large negative environmental contributor in a
system perspective. For vegetables the wastage can be as high as 45% at the UK households
(Ventour, 2008). The wastage of ready meals is also high; in the Netherlands the wastage at
the retailer can be as high as 20% depending on the dish. Due to that all foods and ingredients
that ends up as wastage has been produced, the environmental burden already occurred has
been made for nothing.
The aim of these environmental assessments was to quantify the environmental improvement
potential possible by decreasing the wastage of ready meals at the retailers from 20% to 5%.
Two in depth LCA assessments were fulfilled and six screening assessments. For the in depth
assessment one ready-to-eat meal were chosen; Hunter‟s meal which consisted of pork,
mashed potatoes mushroom sauce and carrots. The Hunter‟s meal was produced in Finland. A
ready-to-eat meal just needs heating before consumption. For the other in depth assessment a
freshly cooked meal was chosen; Chicken meal. The Chicken meal consisted of chicken, rice,
carrots, broccoli, cauliflower and a paprika sauce. The Chicken meal was produced in
Norway. A freshly cooked meal is just pre-treated at the industry and requires cooking
preferably in the microwave before consumption. The six meals that were assessed by a
screening methodology were: Meal 1 pasta, vegetables and tomato sauce, Meal 2 lamb, rice,
and vegetables, Meal 3 smoked sausage and bacon, mashed potatoes and kale, Dish 4 coated
chicken fillets, Dish 5 souvlaki (chicken fillets) and Dish 6 pasta, cheese and vegetables. The
functional units were one packed and consumed meal at the household. The whole life cycle
was included in all assessments (i.e. agriculture, production, retailer, household, packaging
production, waste management as well as all transports involved). The environmental
categories assessed were for the in depth assessments; eutrophication, acidification, global
warming potential and primary energy consumption and for the screening assessment the
result was given in global warming potential.
The decrease in wastage from 20% to 5% at the retailer gave a large decrease in
environmental impact. For example for the Hunter‟s meal the primary energy requirements
decreased with 13% and for the Chicken meal the contribution to eutrophication and
acidification decreased with 12%.
The result from all meals showed that the production of the ingredients was the step which
contributed most to the environmental impact independent of impact category. It was the
animal originated ingredients that made up the largest contribution.

7
Contents
PROJECT INFORMATION ............................................................................................................................... 5
ABSTRACT ........................................................................................................................................................... 6
1. BACKGROUND ............................................................................................................................................... 9
2. BRIEF LIFE CYCLE ASSESSMENT METHODOLOGY ........................................................................ 10
3. GOAL AND SCOPE FOR THE IN-DEPTH ASSESSMENTS; HUNTER’S MEAL AND CHICKEN
MEAL................................................................................................................................................................... 11
GOALS............................................................................................................................................................... 11 DESCRIPTION OF PRODUCTS .............................................................................................................................. 11 FUNCTIONAL UNIT ............................................................................................................................................. 11 SYSTEM BOUNDARIES ....................................................................................................................................... 11 ENVIRONMENTAL IMPACT CATEGORIES ............................................................................................................ 11 DATA SOURCES AND QUALITY OF DATA ............................................................................................................ 15 ALLOCATION AND SYSTEM EXPANSION ............................................................................................................. 15 LIMITS OF THE STUDY ....................................................................................................................................... 15
4. HUNTER’S MEAL ......................................................................................................................................... 17
INVENTORY OF DATA ........................................................................................................................................ 17 Energy ......................................................................................................................................................... 17 Ingredients ................................................................................................................................................... 17 Packaging .................................................................................................................................................... 21 Ready meal industry .................................................................................................................................... 22 Transports ................................................................................................................................................... 22 Wholesaler ................................................................................................................................................... 22 Retail ........................................................................................................................................................... 23 Household .................................................................................................................................................... 23
RESULTS HUNTER‟S MEAL ................................................................................................................................ 24 DISCUSSION HUNTER‟S MEAL ........................................................................................................................... 32
5. CHICKEN MEAL ........................................................................................................................................... 34
INVENTORY OF DATA ........................................................................................................................................ 34 Energy ......................................................................................................................................................... 34 Ingredients Chicken Meal ............................................................................................................................ 34 Packaging material ..................................................................................................................................... 36 Transports ................................................................................................................................................... 36 Ready meal industry .................................................................................................................................... 36 Wholesale .................................................................................................................................................... 37 Retail ........................................................................................................................................................... 37 Household .................................................................................................................................................... 37
RESULTS CHICKEN MEAL .................................................................................................................................. 38 DISCUSSION CHICKEN MEAL ............................................................................................................................. 46
6. SCREENING ASSESSMENT OF SIX MEALS .......................................................................................... 48
GOAL AND SCOPE ............................................................................................................................................. 48 INVENTORY OF DATA ........................................................................................................................................ 48
Assembly manufacturer ............................................................................................................................... 49 Retail, wholesale and household ................................................................................................................. 49 Packaging .................................................................................................................................................... 50 Transport of meals ....................................................................................................................................... 50
INVENTORY DATA FOR INGREDIENTS AND PACKAGING ..................................................................................... 50 Pasta meal ................................................................................................................................................... 50 Culidish lamb meal ...................................................................................................................................... 51 Sausage meal ............................................................................................................................................... 51 Chicken fillet meals (Coated chicken fillets and Souvlaki) .......................................................................... 51 Tortelloni meal ............................................................................................................................................ 52
RESULTS ........................................................................................................................................................... 52 DISCUSSION ...................................................................................................................................................... 58

8
7. OVERALL DISCUSSION .............................................................................................................................. 60
8. CONCLUSIONS ............................................................................................................................................. 62
9. REFERENCES ................................................................................................................................................ 63

9
1. Background This delivery (D7.8) forms part of Workpackage 7: Final assessment of the newly developed
meals within the EU-project Double Fresh. Double Fresh is the acronym for the project titled:
'Towards a new generation of healthier and tastier ready-to-eat meals with fresh ingredients'.
The overall aims for Double Fresh are to raise the quality of ready-to-eat meals. Such meals
could:
- be fresher, tastier and more appealing
- be healthier and safe
- have a longer shelf life for more viable food business
The name Double Fresh comes from that two concepts of meals were developed within the
project. The first one is a ready-to-eat meal with fresh food that is precooked/pretreated. The
consumer just needs to heat it up. The other concept is named freshly cooked. These types of
meals are not precooked. The meal is cooked in the microwave by the consumer just before
eating.
This delivery is part of the final assessment of the new meals and it consists of an
environmental assessment of the meals developed within Double Fresh. The overall aim
connected with the environmental assessment is the time of shelf life. A longer shelf life often
means less wastage of product. The goal of Double Fresh is to extend the shelf life of the
meals from 5 to 9-14 days then the waste at the retailer would decrease to around five percent.
In the Netherlands today the wastage of ready meals can be as high as 20% depending on the
dish. To find out the environmental improvements by this decrease of wastage of the product
at the retailer, environmental assessments of the meals in a life cycle perspective was
required.
The work was conducted in three parts. Two in-depth life cycle assessment, one double fresh
meal and one freshly cooked meal, as well as screening assessments of the other six meals
developed and evaluated within the Double Fresh project. The outline of the report is: first,
the goal and scope of the two in-depth life cycle assessment are presented. Then the case
study of the Hunter‟s meal is presented including inventory, results and discussion. This is
followed by the case study of the Chicken meal including inventory, results and discussion.
After that follows the screening assessment of the six meals, including goal and scope,
inventory, results and discussion. Finally, an overall discussion and conclusions ends this
report. But, next follows a brief description of the environmental life cycle assessment
methodology.

10
2. Brief Life Cycle Assessment methodology The performance of a Life Cycle Assessment (LCA) is divided into four main parts: Goal and
scope definition, Inventory analysis, Impact assessment and Interpretation of results. In the
goal and scope definition, the system to be studied and the purpose of the study is defined.
System boundaries are chosen, preferably reflecting the boundary between the natural and the
technical system under study, that is, normally starting with extraction of raw materials and
ending with some sort of waste treatment. The inventory analysis consists of gathering of data
about the resource use, energy consumption, emissions and products resulting from each
activity in the production chain. All in- and outflows are then calculated on the basis of a unit
of the product called the functional unit. The choice of this unit should represent the function
of the product. From some activities, more than one product may be the outcome. In such
cases, the total environmental impact is often divided between the main product and by-
products, a procedure known as allocation in LCA methodology. Allocation is based on the
most relevant relationship between the main product and by- products in each case, e.g. mass,
energy content or economic value. Another approach is to include the by-products in the
system and separately assess another production system for this product, which can then be
subtracted from the original system in order to obtain results for the main product. This latter
approach is called system expansion and is recommended by ISO.
The first result of an LCA is a matrix of inventory results, where the calculated values for
each phase of the life cycle and also the total values are presented for a number of categories
of substances like resources from ground, resources from water, emissions to air, emissions to
water and products. In order to simplify this table and to get an idea of what kind of
environmental impact the emissions cause, characterisation methods are used which weight
together all emissions causing for example global warming, acidification, toxicity,
eutrophication, photochemical ozone formation and stratospheric ozone depletion.
Characterisation together with qualitative assessment of types of environmental impact that
cannot be characterised is called impact assessment. Qualitative assessment means that when
no reliable method to quantify a category of environmental impact exists or data is lacking, it
can be assessed qualitatively. Normalisation and Weighting are optional steps aiming at
relating the environmental impact of the studied activity to other activities in society and
comparing the different types of environmental impact to each other, respectively. Whether
these steps are performed or not depends on the goal and scope of the study. After impact
assessment and eventually normalisation and weighting is completed, the interpretation of
results and identification of key figures and initial assumption and a sensitivity analysis
follows to finalise the LCA. In the sensitivity analysis, key figures are varied and the
dependence of the results on certain data is analysed in relation to the quality of those data.
There are many good handbooks explaining step-by-step how to perform an LCA (Baumann
& Tillman 2004, Berlin 2003, Hauschild & Wenzel 1997, Wenzel et al.1997). The software
used for the LCA calculations was SimaPro 7 (Pré Consultants bv., 2008).

11
3. Goal and Scope for the in-depth assessments; Hunter’s meal and Chicken meal.
Goals
The overall aim of the in-depth assessments is to quantify the environmental improvement
potential possible by decreasing the wastage of ready meals at the retailers from 20% to 5%.
Specific objectives related to the overall aim are:
- to assess the environmental impact of one ready-to-eat meal.
- to assess the environmental impact of one freshly cooked meal.
Description of products
The ready-to-eat meal chosen for the assessment was Hunter‟s meal. The Hunter‟s meal
consists of pork, mashed potatoes, mushroom sauce and carrots. It is a meal produced by
Snellman Kokkikartano Oy in Jacobstad in Finland.
The freshly cooked meal chosen for the assessment was a Chicken meal. The chicken meal
consists of chicken, rice, carrots, broccoli, cauliflower and a paprika sauce. The meal has no
producer today but was developed for the Norwegian market by Nofima in cooperation with
the companies Nortura BA and Fjordland AS.
Functional unit
In a life cycle assessment a unit is chosen to which all the environmental calculations are
related to. The functional units chosen for these two studies were:
one packed Hunter‟s meal consumed at a household in Finland and
one packed Chicken meal consumed at a household in Norway.
System boundaries
The studies include the life cycle steps (illustrated in figure 1 and 2). The first step is the
production of the raw materials (the agricultural phase) required for the ingredients‟
production. The data used for the agricultural step includes all farming activities and its inputs
of feed, fertilisers and energy sources in a life cycle perspective. This step is followed by the
production of the ingredients. After that the meal is composed and pre-treated at the ready
meal manufacturing. Then the meal is transported to the wholesaler grocery which is followed
by the retailer, which is illustrated by the retailer box in figure 1 and 2. Finally the meal
reaches the consumer. All transports required for raw materials, ingredients and meal are also
included. Production of packaging as well as the waste management of the packaging material
is included as well.
Environmental impact categories
The environment can be assessed in a number of ways. Including in life cycle assessment
methodology the impact categories to choose among are for example; energy, water, land use,
global warming, photo oxidant ozone formation, ozone depletion, acidification, eutrophication
and toxicity. It is rather unusual to include all impacts. In fact, today many clients are just
interested in global warming. But, to get a better picture of the environmental impact it is

12
preferable to include some more impacts. The hard thing is to select the ones giving the most
information to get an environmental picture of the product under study. The categories chosen
for the quantitative assessment in this study are; climate change, energy use, acidification and
eutrophication. The categories specified include the key parameters for the environmental
impact of food production identified by Mattsson (1999). The key inventory parameters are
nitrous oxide, methane, ammonia and energy-related emissions. The water use is a category
that has been put forward the last years within the LCA community. Nevertheless, it is not
included in this study as the countries Finland and Norway do not have a water problem. The
category of land use is also an important issue when it comes to food production but for
Norway and Finland this is not a problem. Both countries are sparsely populated with large
areas of wilderness. Therefore, the area of land is not a problem. To exclude the impacts of
water- and land use was a decision made although, we were aware of that the imported
ingredients may comes from areas where these impacts are of importance. Another fact is that
it would have been unrealistic to include water and land use of all the ingredients within the
budget of the project. The references of the equivalence factors for the chosen environmental
categories used in the calculations were; IPCC (2007) for climate change, EDIP/UMIP 97
(1997) for acidification and EDIP/UMIP 97 (1997) for eutrophication. For the calculations of
primary energy production no equivalence factors were required.

13
Figure 1. The system under study for Hunter’s meal. T is an abbreviation for Transport. For steps illustrated
with boxes with dotted lines no specific data inventory has been fulfilled instead the data is based on literature
data or data found in a databases

14
Figure 2. The system under study for the Chicken meal. T is an abbreviation for Transport. For steps
illustrated with boxes with dotted lines, no specific data inventory has been fulfilled instead the data is
based on literature data or data found in a databases

15
Data sources and quality of data
Data used in the study comes from inventory by personal visits, personal contacts by
telephone and email, studies performed by SIK, data collected from databases as well as
literature data. The specific method chosen for the each data set is described in the Inventory
section.
For a meal there are plenty of data that has to be gathered as there are several ingredients. It
was not feasible to make inventories for all ingredients by personal visits which would have
been the best for the quality of data. Therefore, our strategy for those ingredients was to use
data sets as similar as possible to the ingredients used in the meal. For example when data for
the specific country from where the ingredients were imported was missing in literature or
databases the energy mix for that country was used with the data set that was available. We
used data sets from studies performed by SIK and other sources with good data history before
literature data and data base data with a scarce description of the data.
Allocation and system expansion
When there is more than one product produced in the same production step or activity an
allocation is required to share the environmental impact between the products. According to
the ISO standard (ISO 2006a and ISO 2006b) for LCA, system expansion is the preferred
method to avoid allocation. System expansion means that the system boundary of the product
will be expanded to include both of the products. This is not always feasible due to the
projects limits in time and costs. In some cases allocation is required. According to the ISO
standard a physical allocation is preferable before an economical allocation. When it comes to
foods a physical allocation is not always achievable due to that sometimes the by-products is
produced in larger quantities as for example whey in cheese production. The economical
allocation can be a solution. In fact economical allocation is the most common method used
within the food sector. But, when possible system expansion is the preferable method.
This study of meals consists of several ingredients and therefore also consists of data from
several sources. The data sets included mostly economical allocation but also system
expansion and physical allocation.
Limits of the study
The limits of the study are dependent of the projects aim and limits in time and costs. Limits
according to time, machinery, buildings and infrastructure, personnel as well as waste of
ingredients and products are described below.
Time
This study was supposed to be a study of the environmental impacts by the life cycle of the
meal today. Therefore, the data used for the study represents the most updated data sets as
possible. However, as data from different sources where used the age of data varies.
Machinery, buildings and infrastructure
The infrastructure is included in the background data of the data sets originated from the
databases of Ecoinvent (2007) including packaging material, energy and transports. Machines,
buildings and infrastructure were not included in the other data sets used in the study.

16
Personnel
The commuting, lunches and working clothes for the personnel where not included in the
calculations.
Waste of products and ingredients
Waste of products and ingredients at the household was not included in the study. Due to that
the aim of the study was to find out the decrease in environmental impact by the waste
decrease at the retail sector.
Ingredients
The production of mushrooms, paprika, spices (except for salt), antioxidants, aroma,
fatpowder, yeast extract, modified starch glucose and colour were not included in the study
because of lack of data. Those ingredients are used in small quantities and are therefore not
considered to make large contributions to the environmental impact.

17
4. Hunter’s meal Hunter‟s meal consists of pork, mashed potatoes, mushroom sauce and carrots. The goal and
scope of the environmental assessment was described in the section above. On top of that
Snellman Kokkikartano Oy wanted us to find out the consequences of the environmental
impact of the meal if the carrots were replaced with broccoli. This section describes the
inventory of data, the result of the environmental assessment as well as a result discussion.
Inventory of data
Inventory of data regarding every phase in the life cycle includes use of raw material, energy,
spoilage, emissions and waste management. In this chapter inventoried data regarding the life
cycle of the Hunter‟s meal is described quantitatively alternatively referred to literature and
other data sources.
Energy
For electricity use in Finland data for Finland‟s electricity mix including imports has been
used (based on data from Ecoinvent, 2007), since no specific electricity production has been
stated. For the fossil fuels emissions from the whole life cycle are included. Data of emissions
from production and use of energy has been gathered from the database Ecoinvent (2007).
Ingredients
The ingredients and the amount of each used in the Hunter‟s meal is listed in table 1. This is
followed by a description of each ingredient.

18
Table 1. Ingredient composition of the Hunter’s meal
Ingredient g ingredients g in meal (prepared)
Meat patty 100
Pork fillet 80
Bread crumbs 16
Rapeseed oil 11
Egg 2
Water 2
Mashed potatoes 175
Potatoes 138
Water 37
Cream 11
Whole milk powder 4
Butter 3
Salt 1
White pepper* 0,02
Mushroom sauce 45
Water 22
Vegetable fat and dairy product blend 17
Mushrooms* 13
Seasoning for mushroom sauce 5
Butter 2
Onion 1
Modified potato starch 1
Meat stock 0.3
Salt 0.0
Vegetables 30
Carrots 30
OR
Broccoli 30
Whole meal 350
*data not included in calculations
Meat patty
Pork meat
Fat and bone free pork meat is approximated as the pork portion of the Hunter‟s meal. The pig
farms from where the data is extracted are located in Sweden and a report from 2002 is used
for the in-data (LRF, 2002).
Bread crumbs
The bread crumbs are assumed to consist of 95% wheat flour and 5% salt (NaCl).

19
Data on wheat flour is from a study previously performed by SIK regarding production in
Western Sweden (Cederberg et al., 2008). Sodium chloride (salt) data used is an average of
European production (Ecoinvent, 2007).
Rapeseed oil
Data from a Swedish production of rape seed oil from a previously performed project at SIK
has been used for this fraction of the Hunter‟s meal (SIK, 2009).
Egg
Data from Swedish egg production representing two farms has been used for the egg portion
in the pork product (Sonesson et al., 2008).
Water
Ecoinvent data on tap water has been used, representing a European average (Ecoinvent,
2007).
Mashed potatoes
Potatoes
Data regarding the potatoes used in the mashed potatoes comes from a study previously
performed by SIK (SIK, 2009) representing four potato farms in the south-east province
Östergötland in Sweden. The production years studied was 2000 and 2001.
Water
Ecoinvent data on tap water has been used, representing a European average (Ecoinvent,
2007).
Cream
The data for cream used in the mashed potatoes is approximated with an average from two
dairies. Cream produced in a dairy of whole milk powder production and in a skim milk
powder production. Both dairies are located in Sweden. Data on milk production at the farm
level comes from a previously performed LCA study at SIK regarding milk production in
Norrland, the north region of Sweden (Cederberg et al., 2007). The agriculture practise for
milk production in the Norrland region was assumed to be a good estimate of Finnish milk
production depending on the similarities in climate between Norrland and the area around
Jacobstad.
Whole milk powder
Data on the whole milk powder comes from a Swedish dairy. It is one of the dairies the cream
is allocated from as previously mentioned. Data from the same study as for cream regarding
milk production at the farm level was used for whole milk production as well (Cederberg et
al., 2007).
Butter
An average data set of Western Europe butter production has been used for the butter. Data
comes from a project previously performed by SIK, and represents production between the
years 1998 and 2005 (SIK, 2009).
Salt
Salt data used is from European average production (Ecoinvent, 2007).

20
White pepper
White pepper is left out of the study due to lack of data regarding this spice.
Mushroom sauce
Water
Database data on tap water has been used, representing a European average (Ecoinvent,
2007).
Vegetable fat and dairy products-blend
A blend of vegetable fat, lactose reduced cream and buttermilk were used as components in
the mushroom sauce. Exact data on composition has not been obtained. Therefore, an
assumption has been made with 85% dairy products and 15 % vegetable fat. Data of vegetable
fat was approximated with rape seed oil. The dairy products were approximated with 50%
cream and 50% milk. Data on cream from milk powder production used, was based on
Swedish dairies producing whole milk powder and skim milk powder. Milk data at the farm
level is also the same as for the cream and whole milk powder (Cederberg et al., 2007).
Mushrooms
Mushrooms have been left out due to lack of information regarding this ingredient.
Seasoning for mushroom sauce
The seasoning contains of modified starch (E1422/corn), milk powder, fat powder, spices
(black pepper and onion), aroma (mushroom and cream), yeast extract, salt glucose and
colour (E 150c). Data of modified starch was approximated with maize starch from an
Ecoinvent process with the same name, produced in Germany, data for production year 1998
(Ecoinvent, 2007). The milk powder was assumed being whole milk powder and hence the
same data as for the whole milk powder in the mashed potatoes was used. Data of milk
production at the farm level was also the same as in the whole milk powder used in the
mashed potatoes (Cederberg et al., 2007). Fatpowder was left out due to lack of data. Data on
black pepper was also absent, and hence onion has been used for the whole spice portion. Due
to lack of data on mushroom the cream represented the aroma in the seasoning. Data on yeast
extract, glucose and color was lacking and are hence treated as data gaps. Data of salt
originated from an European average of salt extraction and refining (Ecoinvent, 2007).
Butter
The same data set for butter as in the mashed potatoes has been used (SIK, 2009).
Onion
Data of Swedish production of onion from a previously performed project at SIK has been
used for the onion in the mushroom sauce (SIK, 2009).
Modified potato starch
Data of the potato starch used in calculations is of German origin and was found in the
Ecoinvent database (Ecoinvent, 2007)

21
Meat stock
The meat stock was approximated with 50% potato starch and 50 % salt. The same potato
starch as mentioned above has been used as data source (Ecoinvent, 2007). Data of salt came
also from Ecoinvent (Ecoinvent, 2007).
Salt
The salt data used originated from the European average production (Ecoinvent, 2007).
Vegetables
Carrots
The baby-carrots in the meal come from Belgium and are transported to Jakobstad by truck
and boat. Due to lack of Belgian data of carrots production data from an ongoing study at SIK
of Swedish carrots (Davis et al., 2009) were used. 30 % of the carrots were assumed to be
farmed in peat and 70% in mineral soil. Phosphorous and pesticide use were left out in the
study due to lack of data. But, the transportation from Belgium to Jakobstad was included.
Broccoli
Broccoli is not used in the current production but is evaluated as an alternative to the carrots
used in the meal. The broccoli was assumed to be produced in Spain and data used for the
broccoli comes from a study previously performed at SIK (Angervall et al., 2006).
Packaging
Packaging material
22 grams of CPET plastic is used for each Hunter‟s meal container. The plastic used in the
calculations was polyethylene terephthalate, granulate, bottle grade and an injection moulding
(Ecoinvent, 2007). In this data the previous steps in the production of plastic granulate are
included. A plastic film on top of the container is also part of the packaging. This plastic is
approximated with the same PET plastic due to the small amount used; 4.2 grams per
packaging unit. 10 grams of carton is used as a secondary packaging. For this a solid
unbleached board was used. All data was found in Ecoinvent (2007).
Waste management of packaging According to Swedish recycling statistics 30.5 % of all plastic is material recycled, and this
fraction was used in the waste management here as well. Hence 69.5% of the plastic is
incinerated. For the solid unbleached board solely incineration (no recycling) was assumed.
Heat production for the district heating system in incineration was assumed to replace
production of district heating (except for waste incineration) and electricity production. This
replacement contributes to avoided production of other fuels in the district heating system.
Emissions of environmentally harmful substances from incineration was taken into account,
and hence it is not self-evident that the incineration causes an ‟environmental gain‟. Data from
Ecoinvent (2007) and SIK‟s environmental database (2009) has been used for these
calculations. Material recycling of plastics was treated as avoided production of average PP-
plastic (the same plastic used as input in the packaging).

22
Ready meal industry
The electric energy use at the factory was approximated to 800 000 kWh for the year 2009.
An approximation of 30 % of the electric energy used at the processing facility attributed to
the production of ready meals was used. The total production of ready meals in 2009 was
approximated to 550 tonnes. Hence the electric energy consumption used in the calculations
was per kg meal 0.44 kWh, and per 350 gram meal 0.15 kWh.
The fuel oil used at the factory was assumed to be light fuel oil, EO1, with the specific heat
value of 9950 kWh/m3 (ÅF, 2009). 35 000 litres of oil was used at the factory. Hence 0.064
litres of fuel oil was used per kg produced ready meal. The density of the fuel oil is 0.840
kg/litre (ÅF, 2009), consequently 0.05 kg fuel oil was consumed per kg ready meal produced.
As a consequence 0.019 kg (0.022 liter) oil was needed for production of one 350 gram ready
meal. This corresponds to 0.22 kWh per 350 gram meal (0.022*9.950).
The estimated spoilage of ingredients and ready meals at the factory was 1 %.
Transports
For all transports a truck with maximum load 40 tonnes and load factor 50 % has been used,
based on Ecoinvent data (Ecoinvent, 2003). The same truck with refrigeration or freezing
equipment has been used where appropriate, freezing equipment adds 22% operation on the
truck and refrigeration adds 11%.
Incoming transports
The pork is slaughtered at Granholmen, 5 km away from the processing unit and is
transported to the industry by truck. Bread crumbs and eggs are from Oulu (Uleåborg) which
is located 300 km from Jakobstad. Rapeseed oil is bought from Åbo and transported by truck,
450 km. The mashed potatoes are produced at a processing unit located 1 km from the ready
meal factory. Incoming transports of ingredients to this location is inventoried and potatoes
are from Jeppo, located 40 km from the industry, transported by truck. Cream, whole milk
powder and butter used in the mashed potatoes are from Oulu (Åbo) and hence transported
300 km by truck. Salt is from Jakobstad and transported 2 km by truck.
The carrots are from Belgium and the distance from farm to processing in Jakobstad is
assumed 2064 km (distance calculated between Brussels and Jakobstad, from
www.viamichelin.com).
Since broccoli is not currently used in the production no transport distance was obtained. The
transportation used was instead based on data from the broccoli study used as data source for
this ingredient. The transport was assumed to be from Spain to Finland by truck and the
distance used was 3867 km (Murcia-Jakobstad) according to www.viamichelin.com. The
vegetable fat and dairy products-blend, the modified potato starch and meat stock are all from
Helsinki, the transport distance to Jakobstad is 500 km. The salt is from Jakobstad and the
transport is 2 km. Butter is transported from Oulu (Uleåborg) (300 km) and the onions are
from Turku (Åbo) (450 km).
Wholesaler
The meal is stored approximately three days at wholesale and Finnish electricity mix is
assumed being the energy source used. 0.05 MJ electricity is used per kg product for
refrigerated storage for less than a week according to SIK Food database (SIK, 2009).

23
Retail
The ready meal is assumed to be stored at the retailer for approximately six days. Energy
consumption for refrigerators at the retailer is rather high due to open refrigerators. Data used
comes from a study performed by SIK of energy consumption in retail stores; “short storage”
is approximated to consume 0.2 MJ/kg chilled product (Carlsson & Sonesson 2000).
Household
Assumed distance for transport from the retailer to the household is 7.81 km, and 59 % of all
customers go by car when grocery shopping, the rest go by bus or walk, based on Orremo et
al. (1999). The car used is a passenger car based on Ecoinvent (2007). No climate burden has
been ascribed to walking or going by bus.
Energy consumption in the household is modelled with Finnish electricity mix with electricity
import based on an Ecoinvent process from 2007. Heating in microwave oven and chilling in
fridge is driven by electricity. Microwaving the meal for 3 minutes in 800 W was calculated
to consume 0.04 kWh. The microwave power value used in the calculations was based upon a
simplified assumption where the energy efficiency of the microwave oven as well as the
energy required for cooling of the magnetrons are not included. However, the corresponding
influence on the resulting response values is negligible as compared to the order of magnitude
of the total energy consumption of the LCA result. Refrigerant storage for three days is
approximated with a function derived from a study performed by SIK (Sonesson et al. 2003)
where the average energy use for the refrigerators studied was 2.84 MJ/litre*year. This
function is accommodated by multiplying the volume occupied by the ready meal in the
fridge (1150 ml) by three (to make up for the empty space in the fridge, which is thought to be
2/3 of the cabinet‟s volume). This number is multiplied by 2.84 MJ (which is the average
energy consumption of a refrigerator per litre and year, as previously mentioned) and later
multiplied by the days stored in refrigerator (expressed as fraction of a year).

24
Results Hunter’s meal
The environmental assessment results for the Hunter meal‟s in-depth LCA are presented
below. A summary of result from the different impact categories with 5 % respectively 20 %
spoilage at the retailer is presented in Table 2. After the overall results a more detailed picture
of the different impact categories‟ results are presented in pie charts, with the percental
environmental burdens presented per life cycle phase. In the pie charts the percental spoilage
at the retailer was 5 %. The environmental burden caused by the ingredient production is
presented per ingredient in the bar charts following. By reducing the retail spoilage the
environmental performance of the meal can be lowered by up to 13%, which is shown in the
table below for the category primary energy.
Table 2. Summary of the overall results for the Hunter’s meal regarding the impact categories studied.
Results for the Hunter’s meal per environmental impact category
5 % spoilage at retail
20 % spoilage at retail
kg CO2e/product kg CO2e/product
Greenhouse gas emissions 0.9 1.0 g NO3e/product g NO3e/product Eutrophication 39 45 g SO2e/product g SO2e/product Acidification 7 8 MJe/product MJe/product Primary energy 13 15
The following pie charts illustrate the different life cycle steps of the Hunter‟s meal‟s
contribution to the environmental impact. Figure 3 illustrates the global warming potential,
figure 4 the contribution to eutrophication, figure 5 the category of acidification and figure 6
the consumption of primary energy.

25
Pork meal: GWP Life cycle contribution 5% spoilage 0.9 kg CO2e/FU
Consumer
10%Retail
1%Wholesale
0%
Outgoing transports
3%
Packaging
14%
Factory
14%
Incoming transports
2%
Ingredients
56%
Ingredients
Incoming transports
Factory
Packaging
Outgoing transports
Wholesale
Retail
Consumer
Figure 3. Greenhouse gas emissions for the life cycle of the Hunter’s meal.
The ingredients in the Hunter‟s meal stand for more than half of the climate gas emissions
caused by the meal‟s life cycle activities. The packaging contributes with 14 %, these
emissions are primarily caused by the plastic production for the polypropylene container that
the meal is packed in. The factory, i.e. the meal assembly, plays an important role in the
Hunter‟s meal‟s life cycle; with a figure of 14%. Transports to and from the meal assembly
contribute with 5% of the life cycle emissions, and this figure would be higher if two-way
distances instead of one-way distances for the transports were used. The consumer phase
contributes with 10 %. The dominating factor in the consumer phase is the car transport from
retail to household.

26
Pork meal: Eutrophication Life cycle contribution 5 % spoilage at retail
39.2 g NO3e/FU
Ingredients
96%
Consumer
1%
Wholesale
0% Retail
0%
Outgoing transports
1%
Incoming transports
0%
Factory
1%
Packaging
1%
Ingredients
Incoming transports
Factory
Packaging
Outgoing transports
Wholesale
Retail
Consumer
Figure 4. Eutrophication potential for the Hunter’s meal’s lifecycle
As eutrophication is an impact category closely related to the farming stage
it is no surprise that it is the steps of ingredient production that contributes with 96%.
Eutrophication is caused by nutrient leakage (nitrogen and phosphorous) that ends up in lakes
and seas contributing to excessive algal blooms often followed by oxygen deficiency (because
of all the extra biological material that has to be biodegraded) which in turn affects the whole
water ecosystem by for instance fish death. An important source for the nutrients is the
fertilisers (both production and spreading) as well as the manure spread on the fields. Burning
of fossil fuels also emits nitrogen oxides, which have an eutrophication effect and this is the
primary source for eutrophication in the other life cycle phases.

27
Pork meal: Acidification Life cycle contribution 5 % spoilage at retail
7.4 g SO2e/FU
Wholesale
0%Retail
0%Outgoing transports
2%
Packaging
4%
Factory
5%
Incoming transports
2%
Consumer
4%
Ingredients
83%
Ingredients
Incoming transports
Factory
Packaging
Outgoing transports
Wholesale
Retail
Consumer
Figure 5. Acidification potential for the Hunter’s meal’s life cycle
Acidification is to a large extent caused by burning of fossil fuels, especially coal. The
nitrogen oxides and sulphur oxides formed from combustion of the fossil fuels are the
chemical compounds primarily responsible for this environmental impact. Considering diesel
versus gasoline more acids are formed from combustion of diesel, because the nitrogen oxides
from diesel combustion are harder to break down in the catalyst in a car. Another input into
the acidification category is agriculture. The main part of the acidification related to
agriculture comes from handling of manure. The storage and spreading of pig manure cause
emissions of ammonia to air. This ammonia starts a nitrification process in the soil which is
acidifying (LRF, 2002).
As can be seen in the chart a major part of the acidified compounds are attributed to the
ingredient production for the Hunter‟s meal; 83% of the total acidification from the Hunter‟s
meal‟s life cycle. Combustion of fossil fuels is an activity present in all life cycle phases, but
for the agriculture it is biological processes that cause most of the acidification. Acidification
from ingredient production is derived both from the vegetables and meat.

28
Pork meal: Energy Life cycle contribution 5% spoilage at retail
13.1 MJe/FU
Wholesale
0%
Outgoing transports
3%
Retail
2%
Consumer
13%
Ingredients
39%
Incoming transports
3%Factory
22%
Packaging
18%
Ingredients
Incoming transports
Factory
Packaging
Outgoing transports
Wholesale
Retail
Consumer
Figure 6. Primary energy use for the Hunter’s meal’s lifecycle
The primary energy use in the life cycle is shared quite equal between the ingredient phase
and the packaging and factory phases together. The energy use is somewhat coupled to the
climate gas emissions, with the difference that the stages requiring only electric energy (not
necessarily based on fossil fuels) as for example the meal assembly, become more visible
when assessing energy use (since this electricity does not cause climate gas emissions in the
same extent as burning of fossil fuels).

29
Ingredient results For all the environmental categories considered was the production of ingredients the main
contributor of the steps in the life cycle, see figure 3, 4, 5 and 6. Therefore, in this part of the
result presentation we have chosen to concentrate on the ingredients. Figure 7, 8, 9 and 10
illustrates how much each of the ingredients contributes to respectively environmental impact.
The ingredients are presented in weight order in each figure, the ingredient with largest
proportion in the meal is presented to the left, and the amounts are descending to the right.
Pork meal ingredients contribution to GWP
0
50
100
150
200
250
300
Mashed potatoes Pork fillet Mushroom sauce Carrot Broccoli
g C
O2e
/ m
ea
l
Figure 7. Greenhouse gas emissions for production of ingredients for the Hunter’s meal
The main part of the GWP assigned to the ingredients comes from the pork production. The
reason is the large amount of feed the pigs requiring. The high figures for the mashed potato
and mushroom sauce were caused by cream, butter and whole milk powder used in both the
mashed potatoes and the mushroom sauce. All these ingredients are animal originated. The
cow cause extensive emissions of methane from digestion of feed and also dinitrogen
monoxide from the feed production system itself make a large contribution.
The Swedish carrot causes somewhat less climate gas emissions than the broccoli, which is
transported from Spain by truck, which increases the climate gas emissions from this
ingredient. The carrot‟s farming phase also causes less negative environmental impact than
the Spanish broccoli farming. However, replacing carrots with broccoli, in our judgement is
OK due to that the difference in result between the two is minor.

30
Pork meal ingredients contribution to eutrophication
0
5
10
15
20
25
30
35
Mashed potatoes Pork fillet Mushroom sauce Carrot Broccoli
g N
O3e
/ m
ea
l
Figure 8. Eutrophication potential caused by the ingredients in the Hunter’s meal
As previously mentioned the eutrophication is mainly caused by farming practise. Animal
production has a higher impact compared to vegetables since the animals require large
amounts of feed when reared. The farming of feed cause eutrophication through the fertilising
compounds nitrogen and phosphorous that are spread on the fields and not thoroughly
absorbed by the soil, but rinsed away to nearby waters by rainfall. Vegetable ingredients do
not require as much farming activity as do animal products and hence these ingredients have
less contribution to the eutrophication.
To change from carrots to broccolis equal to the environmental category of eutrophication.

31
Pork meal ingredients contribution to acidification
0
1
2
3
4
5
6
Mashed potatoes Pork fillet Mushroom sauce Carrot Broccoli
g S
O2e
/ m
ea
l
Figure 9. Acidification potential caused by the ingredients in the Hunter’s meal
For the acidification the same relationship as for the GWP and eutrophication is true; animal
products cause more acidification than do vegetable products. The sulphur oxides emitted are
primarily caused by combustion of fossil fuels and the pork production overshadows the other
ingredients since there are many underlying chains for this ingredient.
Changing carrots for broccoli is similar for the environmental category of acidification.

32
Pork meal ingredients energy use
0
0,5
1
1,5
2
2,5
3
3,5
4
Mashed potatoes Pork fillet Mushroom sauce Carrot Broccoli
MJ
e /
me
al
Figure 10. Primary energy use for production of the ingredients in the Hunter’s meal
The primary energy use is largest for the pork fillet, because of the big inputs required in this
farming system. Energy use for carrot production is the lowest of these ingredients depending
on a very efficient farming system in Sweden.
Broccoli got a higher consumption of primary energy than the carrots. It is due to the truck
transportation of broccoli from Spain and also a higher energy consumption in broccoli
farming compared to the carrot farming. Nevertheless, in our judgement it is OK to change
the carrots for broccoli in the meal as the difference between the two were not that high.
Discussion Hunter’s meal
The ingredient production is the dominating lifecycle phase for the Hunter‟s meal. This is true
for all impact categories but not as apparent in the primary energy use results. Here the
packaging and factory are also important phases. Looking at the environmental impact of the
ingredient production, regarding all impact categories evaluated it is clear that it is the pork
that causes the main emissions/influence. Animal production systems need more input than
vegetable systems, since the animals need feed to grow to slaughter size and the conversion of
vegetable feeds to meat involves losses, i.e. significantly more energy protein in feeds are
needed to produce a certain amount of energy and protein in meat.
The feed production requires large areas of arable land, and from this land the soil leakage of
e.g. dinitrogen monoxide (N2O) impacts the climate extensively. Furthermore production of
inorganic fertiliser is an energy intense process that contributes both in the production (CO2-
emissions and N2O-emissions) phase and in the farming phase (as the nitrogen fertilisers
amplify the leakage of N2O from the fields, and also by CO2-emissions from the fertiliser
spreading where diesel is used for the tractors). The animals‟ feed digestion also causes large

33
emissions of methane (except for rearing of chickens and pigs). Manure from pig production
also causes methane emissions, since methane is formed during the storage of manure.
The Hunter‟s meal‟s assembly plant‟s climate gas emissions (14% of the life cycle emissions)
are high in comparison with the Chicken meal (next section), where less than 1% is related to
the meal assembly. The figures are however not entirely comparable since the energy use for
the Hunter‟s meal is an inventoried number and the figure for the chicken meal is based on
another study regarding ready meal production, and is hence not specifically inventoried.
The reason for the climate burden associated to the assembly factory is the large amount of oil
used and the electricity consumption. To decrease the environmental burden from the energy
is a suggestion to replace the fossil oil with some kind of bio fuel or gas generated from
household wastage incineration. For the electricity a suggestion is to change to green labelled
electricity mix. By choosing more cellulose products or biopolymers instead of fossil plastics
as packaging material the climate gas emissions related to the packaging would be
significantly lowered.

34
5. Chicken Meal The Chicken meal consists of chicken, rice, carrots, broccoli, cauliflower and a paprika sauce.
The goal and scope of the environmental assessment was described above. This section
describes the inventory of data, the result of the environmental assessment as well as a result
discussion.
Inventory of data
Inventory of data regarding each phase in the life cycle includes use of raw material, energy,
spoilage, emissions and waste management. In this chapter inventoried data regarding the life
cycle of the chicken meal is described quantitatively alternatively referred to literature and
other data sources.
Energy
For energy use in Norway data for Norwegian electricity mix (mainly hydro power) including
imports has been used (based on data from Ecoinvent, 2007), since no specific electricity
production has been stated.
For the fossil fuels emissions from the whole life cycle are included. Data for emissions from
production and use of energy has been gathered from the database Ecoinvent (2007).
Ingredients Chicken Meal
The ingredients and the amount of each used in the Chicken meal is listed in table 3. This is
followed by a description of each ingredient.
Table 3. Ingredient composition of the chicken meal
Ingredient g ingredients g in meal (prepared)
Chicken fillet marinated in lingonberry juice 130
Rice 100
Paprika sauce 100
Cream
Milk
Paprika
Rape seed oil
Leek
etc. (Ingredients are confidential)
Vegetables 140
Broccoli florets 50
Cauliflower florets 50
Carrot slices 40
Spices 1
Black pepper* 1
Whole meal 470 *data not included in calculations

35
Chicken Data on farming of the chickens for the chicken fillets is based on an LCA on Swedish
chicken production in 2005 performed by SIK (Cederberg et al., 2009). Nitrogen use and
leakage is added to make results in various impact categories possible to achieve. The farming
takes place near Rakkestad in Østfold in Norway, the city location is used to calculate
distances, but the data on farming is solely taken from the study on Swedish chicken
production. Chickens are transported by truck from the farm to Rakkestad and Elverum,
where slaughtering occurs. Data on slaughtering comes from LRF (2002). Processing to
chicken fillets is based on data from the processing plant in Haerland, located 25 km from the
slaughtering in Rakkestad and 200 km from Elverum (Personal communication with Tore
Næss, Nortura, 2009). The processed chicken fillets are then further transported by truck to
the ready-to-heat meal industry in Oslo (70 km).
Rice Parboiled white milled rice farmed in Italy was used in the meal. An LCA on Italian rice is the
data source for this ingredient (Blengini et al., 2009). Energy consumption for cooking the
rice is based on a processing plant in Ardooie, Belgium. The transports distance included are
from farm to processing (boiling), Vercelli (Italy) to Ardooie (Belgium) 1040 km, and from
processing to ready meal industry in Norway: Ardooie (Belgium) to Oslo (Norway) 1230 km.
Vegetables Broccoli
The broccoli in the meal is from Murcia, Spain. Previously assessed broccoli with the same
origin is used as a data source of information for the farming stage (Angervall et al., 2006).
Cauliflower
The cauliflower florets are also from Murcia in Spain, data for this ingredient is from a British
study on vegetable farming (Lillywhite et al., 2007).
Carrots
Carrots are of Norwegian origin, but due to lack of Norwegian data, data on Swedish carrots
from an ongoing study at SIK regarding garden products (Davis et al., 2009) are used to
approximate the carrots. 30 % of the carrots are assumed to be farmed in peat and 70% in
mineral soil. Phosphorous and pesticide use are left out in this study due to lack of data.
Paprika sauce The paprika sauce approximated to be used in this study is a product at the market today;
hence the ingredient composition can not be presented, due to confidentiality. Main
ingredients are cream, milk, paprika, rape seed oil and leek.
Cream
The data for cream used in the paprika sauce is approximated with an average from two
dairies. Cream produced in a dairy of whole milk powder production and cream produced
during skim milk powder production. Both dairies are located in Sweden. Data on milk
production at the farm level comes from a previously performed LCA study at SIK regarding
milk production in Norrland, the north region of Sweden (Cederberg et al., 2007). The

36
agriculture practise for milk production in the Norrland region was assumed to be a good
estimate of Norwegian production depending on agricultural practice.
Milk
Data on milk production at the dairy comes from a Swedish dairy (LRF 2002). At the farm
level data comes from the same study as the above described cream (Cederberg et al., 2007).
Paprika
Paprika is left out of the study due to lack of data. Paprika is treated as a data gap in the
calculations.
Rape seed oil
Data of rape seed oil has been assessed in previously performed projects at SIK. Data is from
SIK‟s internal food database (SIK, 2009).
Leek
Data on onions has been used for approximating leek. Onion data is from SIK‟s internal food
database (SIK 2009).
Packaging material
Two types of plastic materials are used for packing the ready meal; one plastic container made
of mono-extruded polypropylene that weighs 22.9 grams, and low density polyethylene
(LDPE) packaging film on top of the plastic container (4.2 grams). The plastic container is
manufactured by Færch in Holstebro, Denmark, and the packaging film is from Amcor in
Ledbury, England. Data of packaging material and transportation comes from Ecoinvent‟s
database (Ecoinvent, 2007).
Transports
Transport distances have been inventoried as far as possible, but since the product chain is
somewhat hypothetical in some steps, assumptions have also been made. For the incoming
transports of ingredients and packaging material a 40 ton lorry with 50% used weight load has
been used (Ecoinvent 2005). For the road transports of the ready meal a chilled lorry, EURO
3, including infrastructure with 50 % load has been used. Fuel production is from Ecoinvent
2007. Incoming transport to the ready meal industry includes transport of all ingredients and
the packaging material. The distance between the ready meal industry and the wholesaler is
assumed to be 20 km, the same distance is used from the wholesaler to retail, since all the
facilities (i.e. ready meal industry, wholesale and retail) are assumed to be localized in the
Oslo region.
Ready meal industry
Energy consumption in the ready meal industry was based on a previously performed study
on a ready-to-eat dish performed by SIK (Sonesson & Davis 2005). The type of electricity
used is Norwegian electricity mix (Ecoinvent: Electricity, medium voltage, at grid/NO S)
where electricity import is included.

37
Wholesale
Data on storage at wholesaler was from a SIK-project where salmon was stored “less than a
week”. This is approximated to consume 0.05 MJ of energy, which is used here as well (SIK,
2009).
Retail
The Chicken meal was stored at the retailer for approximately six days. Energy consumption
for refrigerators at the retailer is rather high due to open refrigerators. Data from a study
performed by SIK is the foundation for energy consumption in retail stores; “short storage” is
approximated to consume 0.2 MJ/kg chilled product (Carlsson & Sonesson 2000).
Household
Assumed distance for transport from retail to household is 7.81 km, and 59 % of all customers
go by car when grocery shopping, the rest go by bus or walk, based on Orremo et al. (1999).
The car used is a passenger car based on Ecoinvent (2007). No climate burden has been
ascribed to walking or going by bus.
Energy consumption in the household is modelled with Norwegian electricity mix (mainly
hydro power) and electricity import based on an Ecoinvent process from 2007. Heating in
microwave oven and chilling in fridge is driven by electricity. Microwaving the meal for 7
minutes in 800 W is calculated to consume 0.09 kWh. The microwave power value used in
the calculations was based upon a simplified assumption where the energy efficiency of the
microwave oven as well as the energy required for cooling of the magnetrons are not
included. However, the corresponding influence on the resulting response values is negligible
as compared to the order of magnitude of the total energy consumption of the LCA result.
Electricity for refrigerant storage for three days is approximated with a function derived from
a study performed by SIK (Sonesson et al. 2003). The average energy use for the refrigerators
studied was 2.84 MJ/litre*year. This function is accommodated by multiplying the volume
occupied by the ready meal in the fridge (1150 ml) by three (to make up for the empty space
in the fridge, which is thought to be 2/3 of the cabinet‟s volume). This number is multiplied
by 2.84 MJ (which is the average energy consumption of a refrigerator per litre and year, as
previously mentioned) and later multiplied by the days stored in refrigerator (expressed as
fraction of a year).

38
Results Chicken meal
The environmental assessment results for the Chicken meal‟s in-depth LCA are presented
below. A summary of the different impact categories results with 5 % respectively 20 %
spoilage at the retailer is presented in Table 4. After the overall results a more detailed picture
of the different impact categories‟ results are presented in pie charts, with the percental
environmental burdens presented per life cycle phase. In the pie charts the percental spoilage
at retail was 5 %. The environmental burden caused by the ingredient production is presented
per ingredient in the bar charts following. By reducing the retail spoilage the environmental
performance of the meal can be lowered by up to 12%, which is shown in the table below
where both the eutrophication and acidification is lowered by 12%.
Table 4. Summary of the overall results for the Chicken meal regarding the impact categories studied.
Results for chicken meal per environmental impact category
5 % spoilage at retail
20 % spoilage at retail
kg CO2e/product kg CO2e/product
Greenhouse gas emissions 0.9 1.0 g NO3e/product g NO3e/product Eutrophication 50 57 g SO2e/product g SO2e/product Acidification 14 16 MJe/ product MJe/product Primary energy 12 13
The following pie charts illustrate the different life cycle steps of the Chicken meal‟s
contribution to the environmental impact. Figure 11 illustrates the global warming potential,
figure 12 the contribution to eutrophication, figure 13 the category of acidification and figure
14 the consumption of primary energy.
39
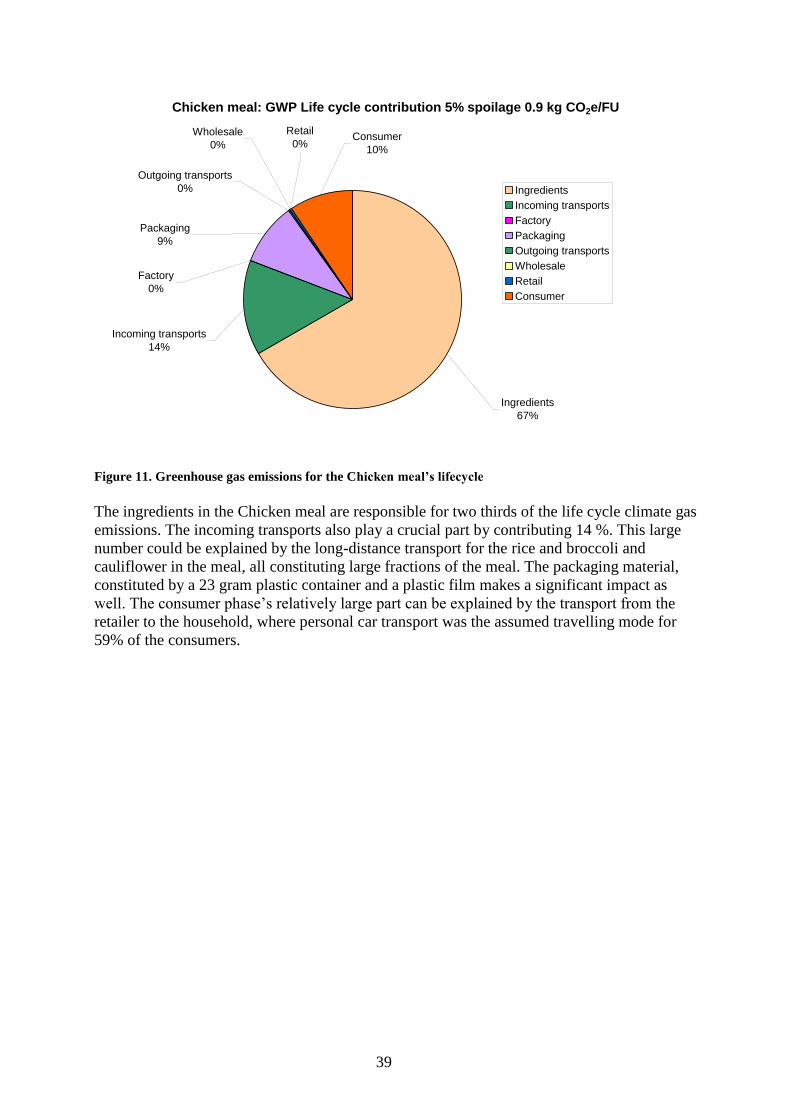
Chicken meal: GWP Life cycle contribution 5% spoilage 0.9 kg CO2e/FU
Consumer
10%
Retail
0%Wholesale
0%
Outgoing transports
0%
Packaging
9%
Factory
0%
Incoming transports
14%
Ingredients
67%
Ingredients
Incoming transports
Factory
Packaging
Outgoing transports
Wholesale
Retail
Consumer
Figure 11. Greenhouse gas emissions for the Chicken meal’s lifecycle
The ingredients in the Chicken meal are responsible for two thirds of the life cycle climate gas
emissions. The incoming transports also play a crucial part by contributing 14 %. This large
number could be explained by the long-distance transport for the rice and broccoli and
cauliflower in the meal, all constituting large fractions of the meal. The packaging material,
constituted by a 23 gram plastic container and a plastic film makes a significant impact as
well. The consumer phase‟s relatively large part can be explained by the transport from the
retailer to the household, where personal car transport was the assumed travelling mode for
59% of the consumers.

40
Chicken meal: Eutrophication Life cycle contribution 5 % spoilage at retail
50 g NO3e/FU
Consumer
1%
Retail
0%
Wholesale
0%
Outgoing transports
0%
Packaging
0%
Factory
0%
Incoming transports
3%
Ingredients
96%
Ingredients
Incoming transports
Factory
Packaging
Outgoing transports
Wholesale
Retail
Consumer
Figure 12. Eutrophication potential for the Chicken meal’s lifecycle
Almost all of the chicken meal‟s eutrophication comes from the agriculture activities, which
is explained by the use of inorganic fertilisers and manure. The leakage of nitrogen and
phosphorous from the fields end up in nearby and distant waters where they cause increased
levels of nutrients which in turn intensify the algal bloom level, causing oxygen deficiency
when algae are degraded.

41
Chicken meal: Acidification Life cycle contribution 5 % spoilage at retail
14 g SO2e/FU
Consumer
2%
Retail
0%
Wholesale
0%
Outgoing transports
0%Packaging
1%
Factory
0%
Incoming transports
6%
Ingredients
91%
Ingredients
Incoming transports
Factory
Packaging
Outgoing transports
Wholesale
Retail
Consumer
Figure 13. Acidification potential for the Chicken meal’s lifecycle
The ingredient phase is dominating the acidification potential of the meal, because the major
part of the acidifying activities take place in the agriculture. Production of inorganic fertilisers
cause emissions of N2O and when the fertiliser is spread it also causes emissions of N2O. This
nitrogen oxide forms acids in the atmosphere which fall down with precipitation. The
acidification attributed to transports is caused by combustion of fossil fuels (to a large extend
from diesel). See Hunter‟s meal discussion, for more details regarding acidification.

42
Chicken meal: Energy Life cycle contribution 5% spoilage at retail
12 MJe/FU
Consumer
17%Retail
1%
Wholesale
0%
Outgoing transports
0%
Packaging
10%
Factory
1%
Incoming transports
18%
Ingredients
53%
Ingredients
Incoming transports
Factory
Packaging
Outgoing transports
Wholesale
Retail
Consumer
Figure 14. Primary energy use for the Chicken meal’s life cycle
The primary energy use is somewhat coupled to the climate gas emissions, with the difference
that the stages requiring only electric energy as for example the step of meal assembly,
become more visible when assessing energy use (since this electricity does not cause climate
gas emissions in the same extent as burning of fossil fuels).
For all the environmental categories considered was the production of ingredients the main
contributor of the steps in the life cycle, see figure 11, 12, 13 and 14. Therefore, in this part of
the result presentation we have chosen to concentrate on the ingredients. Figure 15, 16, 17 and
18 illustrates how much each of the ingredients contributes to respectively environmental
impact. The ingredients are presented in weight order in each figure, the ingredient with
largest proportion in the meal is presented to the left, and the amounts are descending to the
right.

43
Chicken meal ingredients contribution to GWP
0
50
100
150
200
250
300
350
400
Chicken Rice Paprika sauce Broccoli florets Cauliflower
florets
Carrot slices
g C
O2e
/ m
ea
l
Figure 15. Greenhouse gas emissions for production of ingredients for the Chicken meal
Chicken fillets contribute with the highest fraction, 51% of the ingredients‟ climate burden.
Paprika sauce is the second largest contributor (14%); broccoli and rice contribute with
approximately 12% each and cauliflower 10%. 1% is ascribed to the carrots, which is the
ingredient that contributes the least to potential climate impact. The main part of the GWP
assigned to the ingredients comes from the chicken production, since this is an animal
ingredient requiring large amounts of feed. The relatively high figure for the paprika sauce is
mainly caused by the cream and whole milk. These animal originated products cause
extensive emissions of methane from the cows‟ feed digestion and dinitrogen monoxide from
the feed production systems. Rice contributes to a relatively high climate gas emissions due to
the methane emitted from the anaerobic processes in the farming fields. The Swedish carrot
causes less climate gas emissions than the broccoli. It is both the farming and the
transportation that gave this result. The Swedish carrot‟s farming phase causes less emission
than the Spanish broccoli farming and the transportation of the broccoli from Spain to
Norway gave a higher impact as well for the broccoli compared to the carrots.

44
Chicken meal ingredients contribution to eutrophication
0
5
10
15
20
25
30
35
40
45
Chicken Rice Red bell pepper
sauce
Broccoli florets Cauliflower
florets
Carrot slices
g N
O3e
/ m
ea
l
Figure 16. Eutrophication potential caused by the ingredients in the Chicken meal
As previously mentioned the eutrophication is mainly caused by agricultural practise. Animal
originated products has a higher impact compared to vegetables since the animals require
large amounts of feed when reared. The farming of feed cause eutrophication through the
fertilising compounds nitrogen and phosphorous that are spread on the fields and not
thoroughly absorbed by the soil, but rinsed away to nearby waters by rainfall. Vegetable
ingredients do not require as much farming activity as do animal products and hence these
ingredients have less contribution to the eutrophication.

45
Chicken meal ingredients contribution to acidification
0
2
4
6
8
10
12
14
Chicken Rice Red bell pepper
sauce
Broccoli florets Cauliflower
florets
Carrot slices
g S
O2e
/ m
ea
l
Figure 17. Acidification potential caused by the ingredients in the Chicken meal
For the acidification the same relationship as for the eutrophication is true; animal products
cause more acidification than do vegetable products. The sulphur oxides emitted are primarily
caused by combustion of fossil fuels and the chicken production overshadows the other
ingredients since there are many underlying chains for this ingredient.

46
Chicken meal ingredients energy use
0
0,5
1
1,5
2
2,5
3
3,5
4
4,5
Chicken Rice Red bell pepper
sauce
Broccoli florets Cauliflower
florets
Carrot slices
MJ
e /
me
al
Figure 18. Primary energy use for production of the ingredients in the Chicken meal
The primary energy use is largest for the chicken fillet, because of the large inputs of energy
required in this farming system. A rather high energy demand is ascribed to the broccoli
florets as well, caused by both farming and transport of the vegetable. Energy use for carrot
production is the lowest of these ingredients depending on a very efficient farming system in
Sweden.
Discussion Chicken meal
The ingredient production is the dominating lifecycle phase for the studied chicken meal.
Most of the climate burden is attributed to the rearing of poultry. Meat products commonly
cause a higher environmental impact than vegetable products, partially because of all the feed
needed when rearing animals. For the ingredients in the paprika sauce the cream and whole
milk were the main contributors to the environmental impact. Animal originated products are
ascribed partial burden from the meat rearing system; i.e. not all the environmental burden is
ascribed to the meat produced but also for instance milk-products (from the cow). The rice
production system causes substantial emissions of methane from anaerobic microbiological
processes that take place in the watery fields where the rice is grown.
The only impact category where the ingredient production is not totally dominating is the
energy use. As appose to the climate impact category, the energy use shows numbers telling
where the actual energy consumption takes place. The CO2-equivalents emissions are not
always coupled to energy use (for instance when the emissions stem from biological
processes), and that is the reason that the influence from ingredient production on energy
consumption is lower than the influence the ingredient production has on the climate gas
emissions.

47
Since the ingredients play a crucial role in the meal‟s environmental performance, the choice
of ingredients is of great importance. Choosing another carbohydrate source than rice is also
an alternative that may lower the climate gas emissions of the meal, potatoes for instance, are
known to cause small green house gas emissions. For vegetables the transport distance is
important for the category of global warming by choosing more near-farmed vegetables in the
meal, the burden from long-distance transports would decrease. Regarding the packaging, the
material used is of great importance when it comes to climate gas emissions and energy use.
By choosing more cellulose products or biopolymers instead of fossil plastics as packaging
material, emissions related to the packaging would be significantly lowered.

48
6. Screening assessment of six meals There is no general methodology for an environmental screening assessment. The
methodology chosen for the screening LCA in this study is based on the results and
experience from the two in-depth LCAs (Hunter‟s meal and Chicken meal) together with the
performers‟ 10 years of experience within the area of LCA in foods. The results from the two
in-depth LCAs clearly show that it is the choice of ingredients that makes up most of the
environmental impact independent of environmental impact category. It is also important to
take the energy sources into account for the post-ingredients activities. The material used for
the package and the amount of each packaging material may differ between the meals, which
cause differences in environmental impact for the meals. Below, the working procedure used
for the screening LCAs is presented. The working procedure used is based on the ISO-
standard for LCA.
Goal and Scope
The goal of the screening LCAs is to assess the global warming potential of six meals. The
results will give an indication of which phase in the lifecycle contributes the most to the
global warming potential, and also show which order of magnitude numerical results from a
full carbon footprint analysis would have. To get a better quantitative result an in-depth LCA
is required.
The system includes the production of the ingredients (ingredients that contribute with more
than 5% to the total weight of the meal), the assembly manufacturing, the packaging, the
retailer, the household as well as all transports involved. For production of the ingredients the
included activities were the agricultural phase, the transportation of the raw material to the
industry and the industrial refinement or treatment of the ingredients. One of the six meals
(the lamb, rice and vegetable meal) does not pass the retailer since it is transported directly
from the assembly manufacturer to the consumer.
The functional units used are:
1. One consumed meal of pasta, vegetables and tomato sauce at the household.
2. One consumed meal of lamb, rice and vegetables at the household
3. One consumed meal of mashed potatoes and kale with smoked sausage and bacon at
the household.
4. One consumed meal of coated chicken fillets at the household.
5. One consumed meal of souvlaki i.e. chicken fillets with bell pepper at the household.
6. One consumed meal of pasta, cheese and vegetables at the household.
Inventory of data
The information regarding the different dishes is retrieved from the other research groups
within the Double Fresh project. The groups have either composed their meal or assessed it
form other points of view than the environmental. Only ingredients that had a weight of at
least 5% of the total meal were included in this screening LCA, except for cheese and egg
which are considered to contribute a lot to the global warming potential. The environmental
data for each ingredient was taken from literature data from LCA studies performed mainly
by SIK but also from other sources. For all the data used a quality judgement has been
performed and only data that fulfilled the goal of this screening study was used. The data
sources for the assembly manufacturer, retailer and household are the same as the ones used

49
in the in-depth LCA of the Chicken meal. Data that is distinguished from the full LCA is the
only data presented in this part. For more information please see the section of the Chicken
meal. The ingredients and their respective weights in the meals are presented in Appendix 1.
Assembly manufacturer
The energy used in the assembly factories are based on the industrial consumption of electric
energy and the dominating energy source in the production countries, based on data from the
International Energy Agency. The ready meals are produced in three European countries, see
table 5.
Table 5. Location of assembly manufacturer.
Data is gathered from IEA‟s website regarding energy mixes in the Netherlands, Greece and
Switzerland (representing Liechtenstein). Numbers representing the “Industry sector” have
been used for distribution between electricity and the primary energy sources except for
electricity. Data on the website is for 2006 (IEA, 2009). For the Netherlands an energy mix of
39 % electricity (Dutch production mix) and 61 % natural gas was used in the calculations
and the electricity and gas data is from Ecoinvent (2007). The assumed Greek energy mix
consisted of 39 % electricity (Greek production mix) and 61 % petroleum products. Data for
the “petroleum products” used in the Greek energy mix was assumed being a mixture of
„heavy fuel oil‟ and „light fuel oil‟ from the Ecoinvent database (Ecoinvent, 2007). Data for
Liechtenstein was absent, and hence Swiss data has been used. The Swiss energy mix
composition used was 49 % electricity (Swiss production mix), 26 % natural gas and 25 %
petroleum products (same oil used here as in the Greek energy). The natural gas used in the
processes is a European average from the Ecoinvent database (2007). The energy mixes are
also presented in Table 6.
Table 6. The energy mixes for the different countries.
Country Energy mix
The Netherlands 39 % electricity, 61 % natural gas
Greece 39 % electricity, 61 % petroleum products
Liechtenstein
(Switzerland)
49 % electricity, 26 % natural gas, 25 % petroleum products
The amount of energy used is an average value of the energy used in the assembly
manufacturing in the two in depth-LCAs.
Retail, wholesale and household
The retail, wholesale and household were assumed to be situated in the same country as the
assembly manufacturing. Data used for the wholesaler, retailer as well as the household
activities are the same as in the two in depth LCAs with the exception that the energy mix
Meal Location of assembly
Pasta, vegetables and tomato sauce The Netherlands
Lamb, rice and vegetable The Netherlands
Mashed potatoes, kale, smoked sausage and bacon The Netherlands
Coated chicken fillets Greece
Souvlaki i.e. chicken fillets with bell pepper Greece
Tortellini: Pasta, cheese and vegetables Liechtenstein

50
used is country specific. In the household a national electricity mix including imports is used
for each meal (Data comes from Ecoinvent, 2007). Electricity used for heating the meals has
been assumed to be the same as in the LCA of the Chicken meal. Hence 0.09 kWh is used for
heating and 0.02 kWh is used for refrigeration (3 days). The waste figure at the retailer was
assumed to be 5% as that is one of the goals of the technique development in the project
Double Fresh. The waste figures today in the Netherlands of ready to eat and heat meals at the
retail sector are approximately 20%.
Packaging
The material type and amount used in the packaging are meal-specific, packaging data is
presented in Table 7. The source of the environmental data for the packaging is Ecoinvent
(2007). Except for the material an injection moulding is also included for the plastic
packaging containers. The waste management of the packages was considered the same as in
the in-depth LCAs. The transport distances for the packaging materials to the assembly
factory was assumed to be the same as the distances for the plastic packaging material in the
Norwegian ready meal dish, see section of LCA of the Chicken meal.
Table 7. Material used for the packaging of the meals and the amount of each material.
Meal Packaging material
Pasta, vegetables and tomato sauce PP 27g, Cardboard 9g
Lamb, rice and vegetable PP 49g, Aluminium 3g
Mashed potatoes, kale, smoked sausage and bacon PP 27g, PA 2g, Cardboard 9g
Coated chicken fillets PA 5g, LDPE 5g
Souvlaki i.e. chicken fillets with bell pepper PA 5g, LDPE 5g
Tortellini: Pasta, cheese and vegetables PET 28 g, LDPE 4g
Transport of meals
The transport distance for the ingredients from processing to the assembly industry was
assumed to be 300 km two ways. A 40 tonne truck was used with a 50% load based on Swiss
transport data. For the transport between the assembling manufacturer and the wholesaler 100
km distance (two ways) was assumed, and the distance from wholesaler to retailer was also
assumed 100 km (two ways). A 40 ton truck was used with a 50% load. For the consumer
transport the same data as in the in-depth LCAs was used. Data for transportation was found
in Ecoinvent (2007).
Inventory data for ingredients and packaging
For more detailed information regarding recipes of the meals, see Appendix 1.
Pasta meal
The ingredients included in the environmental assessment are pasta, zucchini and tomato
sauce. The sauce content is restricted to tomato pulp and water, which together represents
86% of the sauce by mass. The pasta used in the calculations represents Italian pasta made
from durum wheat, data is from an Italian study performed in 2001 (Notarnicola & Nicoletti,
2001). The weight gain of the pasta due to water absorption during cooking has been assumed
120 %.The zucchini data used is for Swedish production and the source for information is SIK
Food Database (2009). Unpublished data for tomatoes from an ongoing SIK-project in SIK

51
food database (SIK, 2009) has been used for the tomato sauce. Tap water from Ecoinvent
(2007) has been used.
Packaging material pasta meal
The packaging consists of 26.8g polypropylene and 9.1g cardboard.
Culidish lamb meal
As no climate emission data on lamb was available, data regarding sheep from an English
study has been used for the meat portion in the meal (Williams et al., 2006).
The rice in the dish is the same rice as used in the full LCA of the chicken meal, and 1 kg of
parboiled rice gives approximately 3 kg of cooked rice. Onions are from SIK Food database
and represents Swedish production (SIK, 2009). The onions are the same as used in the
paprika sauce in the chicken meal. Squash is from a confidential project performed by SIK
and is extracted from SIK Food Database (SIK, 2009). The cream used in the Culidish lamb
meal is the same cream as used in the Hunter‟s meal‟s mushroom sauce, based on milk from
the Norrland region in Sweden.
Packaging material culidish lamb meal
Polypropylene and aluminium are the materials used for packaging, for one ready meal 49 g
polypropylene and 3 g aluminium is required. The weight of the top lid is 1.1 g and is
included in the total number for the polypropylene.
Sausage meal
For the pork meat used in the sausage and bacon, data representing a Swedish average
production in 2005 was used (Cederberg et al., 2009). The cream used in the sausage meal is
the same cream as used in the Hunter‟s meal‟s mushroom sauce, based on milk from the
Norrland region in Sweden. The kale in the sausage meal has been modelled with white
cabbage, due to lack of data on kale. White cabbage (Brassica oleracea) belongs to the same
species as kale, and was regarded as a good approximation. Data on white cabbage is from
SIK food database (SIK, 2009).
Peeled potatoes are approximated to require 200 g potatoes for 100 g peeled potatoes; hence
50 % peel spoilage is used. Conventional potato farming in Sweden from SIK food database
(SIK, 2009) was used.
Packaging material sausage meal
Three types of packaging materials were used in the sausage meal packaging: polypropylene,
CPP-OPA (represented by nylon (PA)) and paper board (represented by cardboard). 27.2
grams of PP, 2.2 grams of PA, and 8.7 grams of paper board are used in the environmental
calculation of the meal. Data was found in Ecoinvent‟s database (2007).
Chicken fillet meals (Coated chicken fillets and Souvlaki)
Data on chicken production is a Swedish average value from 2005, based on a study
performed by SIK (Cederberg et al., 2009). Since no data on pepper is present only the
chicken fillet has been assessed for the souvlaki meal. For the coated chicken fillet meal only

52
the chicken has been assessed as well. 120 grams chicken was required for the souvlaki meal
and 130 grams for the coated chicken fillet meal.
Packaging material chicken fillet meals
Both chicken meals are packed in the same type of packaging containing LDPE and PA. 10
grams of packaging is used per meal and 50% of each material is assumed, i.e. 5 grams LDPE
and 5 grams PA.
Tortelloni meal
For the tortelloni meal data for the pasta part of the tortelloni is from the same data source as
the pasta in the pasta meal, representing Italian conventional farming (Notarnicola &
Nicoletti, 2001). The same weight gain due to water absorption during cooking as in the pasta
meal has been used (120%). Unpublished data for tomatoes from an ongoing SIK-project has
been used for the fresh tomatoes and the tomato sauce (SIK, 2009). The tomato farming data
represents Spanish production. Another ingredient in the pasta sauce is tomato purée, which is
modelled with fresh tomatoes. Even though the weight limit for included ingredients in the
calculations was set to 5 % the cheese is still included as it is a product with animal origin,
which are known to cause large climate emissions. The cheese used to represent the ricotta
and mozzarella is semi-hard cheese, data is from Berlin (2001 and 2002). Eggs, an ingredient
in the tortelloni, is also included, although this ingredient represents only approximately 1%
of the ingredients, due to the fact that this ingredient is of animal origin. Data used came from
a SIK project regarding animal production (Cederberg et al., 2009) representing Swedish egg
production in 2005.
Packaging material tortelloni meal
For the tortelloni ready meal 27.6 grams of C-PET is used. The lid film on top of the
packaging is made of PET and PP and 4.2 grams material is needed for the 2.1 gram lid, due
to loss in packaging machine. A secondary packaging of cardboard with the weight of 20
grams was also used.
Results
The calculated screening assessment results in a life cycle perspective for the six meals are
presented below (see figures 19, 20, 21, 22, 23 and 24). The charts illustrate the climate
impact potential and the partial contribution from the different life cycle phases of the meals.
The incoming transports are transports of ingredients and packaging material to the assembly
plant. The factory compartment shows the energy used at the assembly plant. Packaging
represents the production of packaging materials as well as the waste management of the
packaging. The outgoing transports are transport from the assembly plant to the wholesaler,
and wholesaler to retailer, while the transport from the retailer to the household is included in
the consumer phase. The meal spoilage at retail (5%) is presented under the previously
assessed steps: ingredients, incoming transports, factory, packaging, outgoing transports and
wholesale; since the spoilage creates an increased demand for meals, which increases the
climate burden of these previous activities. The quantitative results are also presented in a
table to facilitate comparison between the meals, see Table 8. The meals‟ results are presented
in the same order as they are presented in the charts below.

53
Table 8. Climate gas emissions from the six studied ready meals.
Meal 1 Meal 2 Meal 3 Meal 4 Meal 5 Meal 6
CO2e/meal 0.6 3.9 1.0 0.7 0.6 0.5
Pasta ready meal life cycle contribution
0.6 kg CO2e/560 g meal
Retail
4%
Wholesale
1%
Outgoing transports
4%
Packaging
22%
Factory
10%
Incoming transports
3%
Ingredients
27%Consumer
29%
Ingredients
Incoming transports
Factory
Packaging
Outgoing transports
Wholesale
Retail
Consumer
Figure 19. Greenhouse gas emissions for the pasta meal’s life cycle
Since the pasta meal contains no ingredients with animal origin the ingredients part was not
dominating as in the LCAs of Hunter‟s meal and Chicken meal. The consumer phase even
overshadows the ingredient production, which is a rare case when it comes to a life cycle of a
food. 417 grams of the total of 560 grams ingredients have been assessed in the calculations,
the rest fall out due to the 5% rule (see goal and scope for the screening assessments) or lack
of data. If more ingredients were included the climate burden of the meal would rise, but it is
hard to say how much. Though, it is safe to say that the results would not grow to become as
high as they would be if products or ingredients with animal origin would have been included
in the meal. The large fraction for packaging could be explained by the polypropylene
packaging fraction, since polypropylene is of fossil origin and causes emissions of greenhouse
gases when incinerated. Another climate contribution from the packaging is the energy
intense production. If using electricity from renewable resources like wind and solar in
processing, the climate burden of packaging material may be decreased.

54
Lamb ready meal life cycle contribution
3.9 kg CO2e/490 g meal
Wholesale
0%
Outgoing transports
0%Packaging
6%
Factory
1%
Incoming transports
0%
Ingredients
89%
Consumer
4%
Ingredients
Incoming transports
Factory
Packaging
Outgoing transports
Wholesale
Consumer
Figure 20. Greenhouse gas emissions for the lamb meal’s life cycle
The lamb meal result shows the other extreme of climate emissions from meal production,
compared to the Pasta meal, with almost 90% of the climate burden ascribed to the ingredient
production. This is due to the high climate burden from sheep production (which is the meat
used to represent the lamb).
The reason for the high climate emissions from the sheep meat production is mainly the feed
production where dinitrogen monoxide and carbon dioxide are emitted. The sheep‟s feed
digestion causes emissions of methane which is a potent climate gas. 353 out of 490 grams of
the ingredients in the meal are assessed in the calculations.
As oppose to the vegetarian pasta meal here the consumer phase is not contributing in any
large extent, only 4% of the life cycle‟s emissions are attributed to the consumer phase. All
other phases are overshadowed by the ingredient production phase.

55
Sausage ready meal life cycle contribution
1.0 kg CO2e/500 g meal
Retail
2%
Wholesale
1%
Outgoing transports
2%
Packaging
15%
Factory
5%
Incoming transports
4%
Ingredients
54%
Consumer
17%
Ingredients
Incoming transports
Factory
Packaging
Outgoing transports
Wholesale
Retail
Consumer
Figure 21. Greenhouse gas emissions for the sausage meal’s life cycle
For the sausage meal the ingredient production is responsible for more than half of the life
cycle climate emissions for the meal. The consumer phase and the packaging are on the same
level when it comes to climate impact, and for the consumer phase it is the transport from
retail to household that makes the largest impact.

56
Coated chicken ready meal life cycle contribution
0.7 kg CO2e/130 g meal
Retail
1%
Wholesale
0%
Outgoing transports
1%
Packaging
10%
Factory
3%Incoming transports
1%
Ingredients
55%
Consumer
29%
Ingredients
Incoming transports
Factory
Packaging
Outgoing transports
Wholesale
Retail
Consumer
Figure 22. Greenhouse gas emissions for the coated chicken meal’s life cycle
The coated chicken meal is not actually a whole meal, but a one-ingredient “meal”. Hence,
130 grams of chicken fillet is assessed in the calculations. The climate burden of chicken is
relatively low in comparison with other types of meat; for instance lamb, as in the meal
presented above. The reason that the pasta meal still is in the same order of magnitude as the
chicken is that the weight of the ingredients assessed in the pasta meal is almost three times
that of the coated chicken fillet. The small amount of packaging material used (10g/meal)
gives the packaging phase a low climate burden in comparison with the other meals.

57
Souvlaki chicken ready meal life cycle contribution
0.6 kg CO2e/140 g meal
Retail
1%
Wholesale
0%
Outgoing transports
1%
Packaging
10%Factory
3%
Incoming transports
1%
Ingredients
53%
Consumer
31%
Ingredients
Incoming transports
Factory
Packaging
Outgoing transports
Wholesale
Retail
Consumer
Figure 23. Greenhouse gas emissions for the souvlaki meal’s life cycle
Since the chicken meals do only differentiate from one another in terms of weight, where the
souvlaki meal contains 120 g chicken and the coated chicken meal consists of 130 gram
chicken, these meals are almost identical in climate burden, with a higher burden for the
heavier meal.

58
Tortelloni ready meal life cycle contribution
0.5 kg CO2e/380 g meal
Retail
1%
Wholesale
0%
Outgoing transports
3%
Packaging
17%
Factory
6% Incoming transports
2%
Ingredients
52%
Consumer
19%
Ingredients
Incoming transports
Factory
Packaging
Outgoing transports
Wholesale
Retail
Consumer
Figure 24. Greenhouse gas emissions for the tortelloni meal’s life cycle
The result for the tortelloni meal is somewhat higher than the pasta meal, if the weight is
taken into account when looking at the climate gas emissions. Here the ingredients play a
more crucial part, contributing to about half of the life cycle emissions. No meat is included in
the meal, but both eggs and cheese are products of animal origin, which gives them a higher
climate load than vegetables (since the climate burden of animal farming is shared among the
meat and other eatable products from the animal). The large impact of the packaging is due to
the PET plastic and LDPE used, which have been included in the assessment.
Discussion
It is obvious that the ingredients play a crucial part in determining the meal‟s climate gas
emissions, the more animal products included, the higher the climate load. The reasons that
animal derived products cause larger climate gas emissions are the feed production needed to
sustain the animals and the animal digestion. For more information about the animal rearing,
see discussion section in the Hunter‟s meal life cycle assessment.
Since this is only a screening LCA with no specifically inventoried productions, only
reasoning regarding ingredient production and other phases in the life cycle is possible.
As the same transport distances have been used for all ingredients no comments can be made
about that. Other phases that could make contributions to the climate were the consumer and
packaging phase. For reduction of the emissions caused by the household it is important to not
go grocery shopping by car, since most of the consumer-related emissions are ascribed to the
home transport. Even though other errands run at the same time are taken into account when
determining the transport distance. The packaging is the other dominating phase, besides
ingredient production and household. Here it is an advantage to use as small amount of fossil
plastic material as possible, as the fossil nature of the material contribute to a higher level of

59
greenhouse gasses in the atmosphere when the material is incinerated. To use a renewable
energy resource in packaging production may also reduce the climate gas emissions from
packaging production, since it is a very energy intense process.
The transports used in this study do not correctly reflect the real transport situation since only
a one-way distance has been assessed here. If the analysis was to be updated, two-way
transport distances should be used as that is a more accurate picture when looking at
transports in general (trucks are seldom loaded when they have discharged their cargo). The
transport contribution would hence probably be higher if assessed with accurate loads. Data
for wholesale and retail is the same as for the two full LCAs, and make a small contribution to
the life cycle emissions. Here the energy source is the most important contributor. The energy
sources are most often electricity, which makes the low impact reasonable. The ready meal
assembly plant has a small contribution when looking at the life cycle contribution as a whole.
The energy mixes from the countries where the ready meal assembly factories were situated
were used. A suggestion would be to use green labelled electricity mix from renewable energy
sources.
60
7. Overall discussion Environmental life cycle assessment can be considered as a new subject within academia.
Between 1969 and 1972 the method of LCA began to be used. The area of assessment was
packaging and waste management. After that the method was more commonly used for
energy assessments during the oil crises (emerged in 1972) (Baumann and Tillman, 2004). In
1990s LCA entered the area of food products. Examples of early works are Weidema et al‟s
(1995) Life Cycle Screening of Food Products and Karin Andersson‟s PhD thesis of Life
Cycle Assessments (LCA) of Food Products and Production Systems in 1998. Karin
Andersson fulfilled her PhD work at SIK. The work of LCA within the food sector at SIK has
been going on since then and today with 16 years of experience SIK has fulfilled many LCA
studies of foods, both studies in the area of research but also many studies performed as
consultancy work for food companies. This experience of LCA in foods and the access to
many data sets of our earlier studies made it possible for us to perform this project of LCAs of
ready meals within the EU project Double Fresh. Within literature there are few LCA studies
of ready meals. The reason is probably the high number of data sets required for all the
ingredients both at the farm level and production level.
The quality of data and data sets varies for the different ingredients in the studies. To be able
to keep as high quality of data as possible we have used data sets from reliable sources and
data sets with documented data history. We also used data as new as possible as the goal was
to make an assessment of the environmental impact of today. Nevertheless, it would have
been an improvement for the data quality if it would have been possible to make personal
visits at each ingredients company and make the data inventory at site. This has not been done
in this study and is in fact rare for LCA studies in general. The common custom is to make
personal visits to the actor or actors regarded to have an important role (either for decision
making or environmental contributor) of the chain. The other data and data sets required for
the assessment originates often from literature or data bases. For the LCAs included in this
study we made personal visits at some ingredients companies for the chicken study but for the
Hunter‟s meal and the screening assessments, data from literature and data bases were used.
Although, there are few studies performed of LCAs of ready meals, fortunately two studies
were found which could be used to verify our results. For the Hunter‟s meal we found a meal
study of meatballs and potatoes performed by Sonesson et al. (2005). They made
environmental assessments of three types of meatball meals; home cooked, semi-prepared and
ready meal. It was the ready meal which was most similar to our Hunter‟s meal. The meatball
ready meal got a global warming potential result of 1,6 kg CO2-eq/meal. The Hunter‟s meal
got 0,9 kg CO2-eq/meal. The two meals do not consists of exactly the same ingredients and
not the same amount of each which is the reason for the difference. The higher number of the
meatball dish depends to a high extent of the content of beef meat within the meat ball dish.
There is no beef meat at all in the Hunter‟s meal. Beef contribute to a very high extent to the
global warming potential with 20 CO2-eq per kg carcass weight (from farm to retailer)
compared to pork that contribute with 3,5 CO2-eq per kg carcass weight (from farm to
retailer) (Cederberg et al. 2009). To conclude, the results of the two dishes are within the
same area of magnitude which gives us a verification of the correctness of the result of
Hunter‟s meal.
To be able to verify our Chicken meal we used a study of Davis and Sonesson (2008). They
performed a study of two chicken meals; one home made and one semi-prepared in industry
before it was finalised at home. They also made scenarios of improvements for the two meals.

61
The result of the global warming potential of the meals is illustrated in figure 25. It is the
Semi-prepared chicken meal at present in figure 25 which is the meal most similar to our
Chicken meal with a result of ca. 0,7 kg CO2-eq/meal. The result of our Chicken meal was 0,9
kg CO2-eq/meal. The two meals do not consists of exactly the same ingredients and not the
same amount of each which is the reason for the difference. For example our chicken meal
included a higher weight of chicken. Nevertheless, the quantitative results of the two meals
are in the same area which gives us a verification of the correctness of our result.
Figure 25. The contribution to global warming from two chicken meals; home-made and semi-prepared.
A study made of Davis and Sonesson (2008).
The result of the screening assessments fulfilled in this study cannot be compared to the
results of the in depth life cycle assessments of the Hunter‟s meal and the Chicken meal. A
screening assessment is very much a screening both in the methodology used and how the
result can be used. The methodology is described in the section about the screening
assessment. The goal of the result in a screening assessment is not to find exact figures or
percentage, it is to find out what makes a large contribution to in this case the global warming
potential and what is less important for the meal under study. An overall conclusion is that the
meals containing animal originated products get a higher contribution to the global warming
potential than vegetarian dishes.
The overall aim of the in-depth assessments was to quantify the environmental improvement
potential possible by decreasing the wastage of ready meals at the retailers from 20% to 5%.
When the waste figures was decreased from 20% to 5% at the retailers the environmental
impact improved the most was the category of primary energy by 14% for the Hunter‟s meal
and for the Chicken meal it was eutrophication and acidification with a 12% improvement.
This means that a decrease of wastage of products makes significant improvements of the
environmental impact from ready to eat meals as well as freshly cooked meals.
-0,1
0,0
0,1
0,2
0,3
0,4
0,5
0,6
0,7
0,8
Present Improved Present Improved
kg C
O2
-eq
uiv
./m
ea
l
Packaging production
Heat production
Consumer transport
Electricity and waterproduction
Industry
Truck transport
Veg., fruit & wheatfarming
Chicken farming
Dairy farming
Resisues and wastemanagement
Home-made Semi-prepared

62
8. Conclusions
The overall aim of the in-depth assessments was to quantify the environmental improvement
potential possible by decreasing the wastage of ready meals at the retailers from 20% to 5%.
The specific objectives related to the overall aim were to assess the environmental impact of
one ready-to-eat meal and one freshly cooked meal. On top of that six meals were assessed by
a screening LCA methodology. The most important findings from this work are listed below.
The environmental impact decrease when the wastage of products is decreased from
20% to 5%. For the environmental category of primary energy the Hunter‟s meal
improved by 13% and for the category of acidification and eutrophication the
improvement was 12% for the Chicken meal.
The quantitative result from the assessment of the Hunter‟s meal were with a spoilage
of 5% at the retailer: global warming potential 0,9 kg CO2 eq., eutrophication 39 kg
NO3 eq., acidification 7 kg SO2 eq. and primary energy 13 MJ.
The quantitative result from the assessment of the Chicken meal were: global warming
potential 0,9 kg CO2 eq., eutrophication 50 kg NO3 eq., acidification 14 kg SO2 eq.
and primary energy 12 MJ.
For both the Hunter‟s meal and the Chicken meal it was the production of ingredients
including agriculture that was the step in the life cycle that gave the largest
contribution to the environmental impact.
Also the screening LCAs showed that the ingredients production was the step that
contributed most to the global warming potential for five of the six meals.
Among the ingredients it is the animal originated products that contributed most to the
environmental impact.

63
9. References Andersson K. 1998, Life Cycle Assessment (LCA) of Food Products and Productions
Systems. PhD thesis from School of Environmental Sciences Department of Food Science,
Chalmers University of Technology, Göthenburg, Sweden.
Angervall, T., Florén, B., Ziegler, F. Vilken bukett broccoli väljer du? (in Swedish) 2006.
SIK – The Swedish Institute for Food and Biotechnology, Gothenburg, and
Konsumentföreningen Stockholm, Stockholm, Sweden.
Baumann H. and Tillman A.-M. 2004, The Hitch Hiker‟s Guide to LCA. An orientation in life
cycle assessment methodology and application, Studentlitteratur, Lund, Sweden.
Berlin J. 2003. Life cycle assessment (LCA): an introduction. In Environmentally-friendly
food processing edited by Mattsson B. and Sonesson U. Woodhead Publishing Limited,
Cambridge, England.
Berlin J. 2002. Environmental life cycle assessment (LCA) of Swedish semi-hard cheese.
International Dairy Journal 12 (2002) 939-953.
Berlin J. 2001. Life Cycle Inventory (LCI) of Semi-Hard Cheese. SIK-Report No 692, SIK –
The Swedish Institute for Food and Biotechnology, Sweden
Blengini, G.A., Busto, M. 2009. The life cycle of rice: LCA of alternative agri-food chain
management systems in Vercelli (Italy). Journal of Environmental Management 90: 1512-
1522.
Carlsson, K. & Sonesson, U. 2000, Livscykelinventering av butiker – data och metoder att
beräkna butikens roll vid LCA av livsmedel (Life Cycle Inventory of Grocery Stores – Data
and methods to calculate the retailer‟s part in LCA of foods, in Swedish), SIK-Report 676,
SIK – The Swedish Institute for Food and Biotechnology, Gothenburg, Sweden.
Cederberg, C., Berlin, J., Henriksson M., and Davis, J. 2008. Utsläpp av
växthusgaser i ett livscykelperspektiv för verksamheten vid livsmedelsföretaget Berte
Qvarn (‟Greenhouse gas emissions in a life cycle perspective for the activites at the food
company Berte Qvarn‟, (in Swedish)). SIK-report 777, SIK -The Swedish Institute for Food
and Biotechnology, Göteborg, Sweden.
Cederberg, C., Sonesson, U., Henriksson, M., Sund, V., Davis, J. 2009. Greenhouse gas
emissions from production of meat, milk and eggs in Sweden 1990 and 2005. SIK report
793, SIK – The Swedish Institute for Food and Biotechnology, Gothenburg, Sweden
Cederberg, Flysjö and Ericson 2007. Livscykelanalys (LCA) av norrländsk mjölkproduktion.
(„Life Cycle Assessment of Norrland milk production‟, (in Swedish)) Report no 761, SIK
The Swedish Institute for food and biotechnology, Göteborg, Sweden.
Cederberg C., Flysjö A., Sonesson U., Sund V. and Davis J. 2009, Greenhouse gas emissions
from Swedish consumption of meat, milk and eggs 1990 and 2005. SIK Report No 794. SIK
the Swedish Institute for Food and Biotechnology, Gothenburg.

64
Davis, J. et al., SIK, 2009. Ongoing project at SIK: How can greenhouse gases emissions
from production of fresh horticultural products consumed in Sweden be reduced? Analysis
of around 20 significant horticultural products that can be grown in Sweden and
identification of improvement actions, Ongoing study at SIK. Report to be published in
2010. For more information contact [email protected]
Davis, J. & Sonesson, U. 2008, Life Cycle Assessment of Integrated Food Chains – a Swedish
case study of two chicken meals. Int. Journal of LCA, Online First (DOI 10.1007/s11367-
008-0031-y)
Ecoinvent 2003. Ecoinvent data entered by Michael Spielmann, Telephone: 0041 44 632 49
83; E-mail: [email protected], Life cycle inventory data, CD-rom.
www.ecoinvent.org
Ecoinvent, 2007. Final report ecoinvent data v2.0. Swiss Centre for LCI, Empa - TSL.
Dübendorf, CH.
EDIP/UMIP 97 (1997) (with updates 2 GWP) V2.03 /EDIP World Dk.
Hauschild, M. and Wenzel H. 1997. Environmental Assessment of products. Chapman &
Hall, London.
International Energy Agency (IEA), 2009. Energy data from website:
http://iea.org/stats/balancetable.asp?COUNTRY_CODE=NL
http://iea.org/stats/balancetable.asp?COUNTRY_CODE=CH
http://iea.org/stats/balancetable.asp?COUNTRY_CODE=GR
IPCC, 2007. Climate Change 2007. Intergovernmental Panel for Climate Change (IPCC)
Fourth Assessment Report. The Physical Science
Basis http://www.ipcc.ch/ipccreports/ar4-wg1.htm
ISO 2006a: Environmental management – Life cycle assessment – Principles and
framework. ISO 14040:2006(E). International Organization for Standardization. Geneva.
Switzerland
ISO 2006b: Environmental management – Life cycle assessment – Requirements and
guidelines. ISO 14044:2006(E). International Organization for Standardization. Geneva.
Switzerland.
LRF 2002. Maten och miljön, Livscykelanalys av sju livsmedel (‟The food and the
Environment, Life Cycle Assessment of 7 foods‟, (in Swedish)). Skövde, Sweden.
Lillywhite, R., Chandler, D., Grant, W., Lewis, K., Firth, C., Schmutz, U., Halpin, D. 2007.
Environmental Footprint and Sustainability of Horticulture (including Potatoes) – A
Comparison with other Agricultural Sectors. Department for Environment, Food and Rural
Affairs, University of Warwick.
Lantbrukarnas Riksförbund (LRF), 2002. Maten och miljön, Livscykelanalys av sju livsmedel
(„Life Cycle Assessment of seven foods‟, in Swedish). Skövde, Sweden.

65
Mattsson, B. (1999). Environmental life cycle assessment (LCA) of agricultural food
production. PhD. thesis. Swedish University of Agricultural Sciences, Alnarp, Sweden.
Notarnicola, B., and Nicoletti, G.M., 2001. Analisi del ciclo di vita della pasta e del cuscus (in
Italian). Serial Title: Tecnica Molitoria (Italy), Serial ID - ISSN 0040-1862. For document
availability, please contact: ISMEA (Italy), Via Cornelio Celso 6, I-00161 Rome, Italy.
Næss, T., 2009. Personal communication, Nortura Hærland AS, Sloraveien 60, 1878 Hærland,
Norway.
Orremo, F., Wallin, C., Jönson, G., Ringsberg, K. 1999. IT, mat och miljö, (IT, food and the
environment, in Swedish) Report 5038, Naturvårdsverkets Förlag, Stockholm, Sweden.
Pré Consultants bv. 2008. Amersfoort, Holland. www.pre.nl
SIK, 2009. SIK‟s internal Food Database: Database including data sets of foods originating
from research projects as well as consultancy project. The data sets are confidential. SIK –
The Swedish Institute for Food and Biotechnology, Gothenburg, Sweden.
Sonesson, U., Davis, J. 2005. Environmental System Analysis of Meals – Model description
and Data Used for Two Different Meals. SIK report 735, SIK – The Swedish Institute for
Food and Biotechnology, Gothenburg, Sweden
Sonesson, U., Cederberg, C., Flysjö, A., Carlsson, B. 2008. Livscykelanalys (LCA) av
svenska ägg (Life Cycle Assessment of Swedish egg production). SIK-report 783, SIK -
The Swedish Institute for Food and Biotechnology, Göteborg, Sweden.
Sonesson, U., Janestad, H., Raaholt, B. 2003. Energy for Preparation and Storing of Food –
Models for calculation of energy use for cooking and cold storage in households. SIK
report 709, SIK – The Swedish Institute for Food and Biotechnology, Gothenburg, Sweden
Sonesson, U., Mattsson, B., Nybrant, T. & Ohlsson, T., 2005, Industrial Processing
versus Home Cooking – An Environmental Comparison between three ways to
prepare a Meal, Ambio vol.34, issue 4-5, pp. 411-418
Ventour, L., 2008, The food we waste, WRAP, Banbury UK, ISBN: 1-84405-383-0
(http://www.wrap.org.uk/)
Weidema B.P., Pedersen R. L and Drivsholm T. S. 1995, Life Cycle Screening of Food
Products –Two Examples and some Methodological proposals, Group of Cleaner
Technology, I. Krüger Consult A/S, Danish Academy of Technical Sciences, ATV,
Denmark.
Wenzel H., Hauschild M. and Alting L., 1997. Environmental Assessment of Products,
Chapman & Hall, London.
Williams, Audsley and Sanders, 2006. Determining the environmental burden and resource
use in the production of agricultural and horticultural commodities. Main Report. Defra
Research Project ISO205. Bedford: Cranfield University and Defra. Available on
www.silsoe.cranfield.ac.uk and www.defra.gov.uk.

66
ÅF, 2009. (Ångpanneföreningen), Energiinnehåll och densitet för bränslen (in Swedish).
Available at http://www.energiochmiljo.se/abonnemang.asp?cat=abo_mall&sid=652

Appendix 1. The ingredients and their respective weights for the six meals. The ingredients in italics are not included in the assessment as their weight is less than
5% of the total meal. Ingredients with animal origin are sometimes included despite small weight percentage. The ingredients in red are not included due to data
deficiency.
Pasta, vegetables
and tomato sauce,
560 g
Lamb, rice and
vegetables,
490g
Mashed potatoes and kale
with smoked sausage and
baked bacon, 500 g
Coated
chicken
fillets, 130 g
Souvlaki, i.e. chicken
fillets with bell
pepper, 140 g
Tortelloni, i.e. Pasta,
cheese and vegetables,
380 g
Pasta, 225g Lamb fillet,
125g Smoked sausage, 75g:
Chicken meat,
130 g
Chicken meat, 100±20
g
Tortelloni with spinach-
ricotta filling, 180g:
Vegetables, 200g: Rice, 150g
Pork, 55g
Blanched Bell pepper,
15±5 g Wheat flour, 72g
Egg plant, 50g
Pasteurized
pesto, 15g Pork rind, 6.9g
Water, 64.8g
Zucchini, 50g
Olive oil, 20g
Bacon, 4.8g
Spinach, chopped, frozen,
10.8g
Pre-cooked
mushroom, 50g
Vegetable mix
150g:
Pork protein, salt, stabilizers
E450, E452…etc., 7.8g
Ricotta cheese, 7.2
Red bell pepper, 50g
Egg plant, 28g
Bacon, 31.6g:
Mozzarella pasta cheese,
ground, 7.2g
Tomato sauce, 165g: Zucchini, 28g Pork, 27.6g Breadcrumbs, 7.2g
Tomato pulp, 71g Mushrooms, 28g Salt, 1.1g Whole egg, 5.4
Water, 71g Bell pepper, 28g Dextrose, smoke, preservatives
E250, E252…etc., 2.85g
Salt, iodised, 1.8
Tomato purée, 7g Onion, 38g
Potatoes, 174g
Dry spice mixture
(without MSG)
Onion, 3.5g Red wine sauce,
30g: Vegetables and spices, 219g:
Rapeseed oil, refined
Sun-dried tomatoes,
3.5g
Red wine, 15g
Kale, 142.1g
Tapioka starch
Black olives, 3g Sour cream,
11.5g Onion, 15.8g
Parmesan cheese aroma
Sugar, 2g Rosemary, 2g Cream, 31.6 Garlic powder

68
Modified starch, 1g Garlic, 1g Phase (sunflower oil, turnip oil
hardened, saltetc.), 19g
Onions
Salt, 1g Salt Salt, 1.3g Nutmeg, ground
Olive oil, 1g Pepper Nutmeg, 0.2g Ground pepper, black
Basilica Purity 68
(E1414) Corn starch, 4.1g
Tomato sauce with basil,
100g:
Oregano
White pepper, 0.2g
Tomato, peeled, cut in
cubes, aseptic, 47g
Pepper Chicken glace (chicken, yeast
extract, sugar etc.), 5.7g
Water, 25g
Onions, fine cut,
blanched, frozen, 13g
Tomato puree 36/38%, 9g
Rapeseed oil, refined, 1g
Corn starch, 1g
Salt, jodised, 1g
Vegetable bouillon
Sugar
Garlic powder
Parsley, cut, dried
Basil, rubbed, dried
Ground pepper, white
Fresh tomato, 75g
Fresh spinach leaves, 4g
Mozzarella pearls, 10g
Chips of hard cheese, 6g
Pine nuts, 2g
Coating(1% agar+1%
maltodextrin solution), 3g

69