environmental impacts of applying manure, fertilizer, …
TRANSCRIPT

ABSTRACT: Farms that once spread only manures are now alsoapplying sewage biosolids (sludge) and/or other wastes such asthose from food processing. The objective of this study was to moni-tor environmental impacts at a dairy farm applying these materi-als. Fields were selected representing recent waste applications ofmanure (M1, M2), sewage biosolids (B1, B2), or fertilizer only con-trol (F1, F2), although most fields had historical biosolids applica-tions. Fields representing each treatment were not experimentalreplicates because of varying applications and soil characteristics.Septage and food processing wastes were also applied. Soil perco-lates were collected with wick lysimeters. Runoff was sampled atseven stream sites. Test field soils and alfalfa (Medicago sativa)were analyzed for trace elements. Cumulative trace metal loadingswere low, at most only 1 percent of USEPA Part 503 limits. Surfacesoil enrichment was most evident for Mo, P, and S. Alfalfa tissueshowed no trends of concern. The B2 site had the greatest percolateconcentrations for 6 of 13 elements. Percolate Cu was somewhatelevated at Sites M1, M2, B2, and F1. Percolate sodium was elevat-ed on all M and B fields and sulfur was greatest at M2, B1, and B2.Soluble orthophosphate correlated with stream discharge duringintensive monitoring of Stream Sites S1 (fertilizer) and S2(biosolids). Peaks in S2 streamwater Mo lagged large runoff eventsby five days. Total streamwater export of Cu, Na, Mo, and soluble Pwere greater from the S2 biosolids subwatershed than from the S1fertilizer subwatershed. Percolate concentrations exceeded corre-sponding streamwater concentrations in most cases.(KEY TERMS: nonpoint source pollution; sludge; waste/sewagetreatment; runoff; percolate; farm management.)
Richards, Brian K., Brendan M. Schulte, Arik Heilig, Tammo S. Steenhuis, Mur-ray B. McBride, Ellen Z. Harrison, and Philip Dickson, 2004. EnvironmentalImpacts of Applying Manure, Fertilizer, and Sewage Biosolids on a Dairy Farm.Journal of the American Water Resources Association (JAWRA) 40(4):1025-1042.
INTRODUCTION
With increased emphasis on recycling and reuse oforganic wastes, farms that once dealt solely with ani-mal manures are also land applying waste streamssuch as food processing wastes and sewage biosolids(sludge). A concurrent trend in agriculture is the con-centration of more animal units per area of cropland.Taken together, the increased organic waste loadingson croplands can result in greater environmentalimpacts, affecting both on-site soil quality (via accu-mulation of contaminants) and increased concentra-tions of nutrients and contaminants in runoff and/orsoil percolate. Historic overapplication of P throughfertilizers and organic wastes has contributed to thepotential for off-site impacts by surface runoff and,more recently recognized, by subsurface transport(Sims et al,. 1998).
On a watershed scale, McFarland and Hauck(1999) were able to show a strong correlation betweeninstream storm event N and P concentrations andseveral indices of agricultural use in the watershed,including percent area in intensive agriculture, per-cent of area applied with dairy wastes, and dairy cowdensity. Similarly, Hunter et al. (2000) found a corre-lation between agricultural land uses (sheep stockingdensities and application of manures and sewagebiosolids) and surface water fecal coliforms. Randallet al. (2000) concluded that application of dairy
1Paper No. 03082 of the Journal of the American Water Resources Association (JAWRA) (Copyright © 2004). Discussions are open untilFebruary 1, 2005.
2Respectively, Senior Research Associate, Graduate Student, Post-Doctoral Associate, and Professor, Department of Biological and Envi-ronmental Engineering, Cornell University, Riley-Robb Hall, Ithaca, New York 14853-5701; Professor, Department of Crop and Soil Sciences,Cornell University, Bradfield Hall, Ithaca, New York 14850; Director, Cornell Waste Management Institute, Cornell University, Rice Hall,Ithaca, New York 14853; and Co-Owner, Leo Dickson and Sons Farm, 5226 Bonny Hill Road, Bath, New York 14810 (E-Mail/Richards:[email protected]).
JOURNAL OF THE AMERICAN WATER RESOURCES ASSOCIATION 1025 JAWRA
JOURNAL OF THE AMERICAN WATER RESOURCES ASSOCIATIONAUGUST AMERICAN WATER RESOURCES ASSOCIATION 2004
ENVIRONMENTAL IMPACTS OF APPLYING MANURE, FERTILIZER,AND SEWAGE BIOSOLIDS ON A DAIRY FARM1
Brian K. Richards, Brendan M. Schulte, Arik Heilig, Tammo S. Steenhuis,Murray B. McBride, Ellen Z. Harrison, and Philip Dickson2

manure on a clay loam soil did not lead to greater N and P leaching if it was applied at optimal rates andimmediately incorporated.
In terms of sewage biosolids contribution to nutri-ent cycling and potential losses, the primary focus ofresearch has been on N, with some attention given toP (see reviews of Krogmann et al., 1997, 1998, 1999).Recent studies by Elliott et al. (2002) and Penn andSims (2002) found that P leaching from laboratorysoil/amendment mixtures was lower for sewagebiosolids than from fertilizer or poultry waste. Sid-dique et al. (2000) likewise found greater P leachabili-ty from fertilizer versus sewage biosolids amendedcolumns. Maguire et al. (2000) found that meanoxalate-extractable P levels in soils from 11 field siteswere doubled by biosolids application, but observedthat oxalate-extractable Al and/or Fe often increased,mitigating potential P release.
At the small watershed scale, Grey and Henry(2002) noted that a single 13.5 tons per hectare(tons/ha) application of sewage biosolids to 40 percentof a forested watershed had little observable impacton runoff P, but resulted in an increase in runoff NO3-N after nine months (with concentrations up to 1 mg/l correlating with runoff events). Hart andNguyen (1994) reported that application of 10 tons/haof liquid digested sludge to aspen saplings resulted insignificant increases in NO3-N, with ground watermonitoring wells peaking at 4.3 mg/l.
In addition to desirable nutrients and organic mat-ter, sewage biosolids contain potentially toxic traceelements and synthetic organic chemicals (Hale andLaGuardia, 2002; National Research Council, 2002).While substantial progress has been made in reducingthese levels (National Research Council, 2002; Ste-houwer et al., 2002), trace element concentrations insewage biosolids remain greater than those in mostfertilizers or manures (Raven and Loeppert, 1997;McBride and Spiers, 2001). Even comparable concen-trations in sewage biosolids and fertilizers wouldresult in far greater contaminant loadings fromsewage biosolids due to greater bulk application rates(tons/ha magnitudes compared to kg/ha for fertiliz-ers). The long term fate of trace elements in sewagebiosolids has been the subject of multiple studies(Alloway and Jackson, 1991; Dowdy et al., 1991;Barbarick et al., 1998; Richards et al., 1998; Sloan etal., 1998; Baveye et al., 1999; McBride et al., 1999),with many reporting immobility but others observingloss and/or leachability of at least a portion of appliedtrace elements.
The objective of the present study was to monitorenvironmental impacts (percolate and streamwaterconcentrations, soil enrichment, and crop uptake oftrace elements and nutrients) associated with the use
of soil amendments including fertilizer, manure, andbiosolids on a commercial dairy farm.
SITE HISTORY AND MONITORING APPROACH
Overview
The study was performed on the Leo Dickson andSons farm (Bath, New York) a large (850 head) com-mercial dairy farm in the central southern tier of NewYork State. This farm has a consistent record of landapplication of sewage biosolids since 1978. The farmhas somewhat distinct areas of fields where recentprimary waste applications are manure (closest to themain barn), sewage biosolids, or no wastes (fertilizeronly) on the fields farthest from the farm center. Itshould be noted that working farms are economicenterprises and that maintaining equivalent treat-ments on fields so that they can serve as experimen-tal replicates is not a realistic priority. Most fieldshave had some history of sewage biosolids applica-tions. Nevertheless, two fields each were selected forwhich the recent primary management pattern hasbeen manure application, sewage biosolids applica-tion, or fertilizer application.
Soil percolate was sampled using passive wicklysimeters (Boll et al., 1992), which are able to pas-sively extract percolate from unsaturated soil. Theiruse also avoided the potential problem of adsorptionof trace metals by ceramic porous cup lysimeters(McGuire et al., 1992; Wenzel et al., 1997): in priorwork excellent agreement in percolate trace metalconcentrations between in-field wick lysimeters andsoil columns from the same site was observed(Richards et al., 1998, 2000). Stream sites were sam-pled to determine element mobility in runoff. The pre-sent distribution of trace metals within the soil wasexamined in vertical profiles, and alfalfa growing ontest fields was sampled.
Site History and Soil Types
All corn (Zea mays) grown on the Dickson and Sonsfarm is used for silage. Alfalfa is grown as well. Farmwide average lime application rates are 0.4 tons/haper year. Starter fertilizer is used on all corn fields ata rate of 196 kg/ha of 15-15-15, resulting in elementalapplications of 29 kg/ha N, 13 kg/ha P, and 24 kg/haK. Fields not receiving organic wastes are appliedwith an average of 336 kg/ha of 15-15-15 (50 kg/ha N,22 kg/ha P, and 42 kg/ha K); actual application ratesare based on commercial soil testing.
JAWRA 1026 JOURNAL OF THE AMERICAN WATER RESOURCES ASSOCIATION
RICHARDS, SCHULTE, HEILIG, STEENHUIS, MCBRIDE, HARRISON, AND DICKSON

Two fields from each of the three soil managementpatterns (primarily manure, primarily sewagebiosolids, and primarily fertilizer) were selected anddesignated M1/M2, B1/B2, and F1/F2 respectively.Note that these two fields cannot be regarded asexperimental replicates of each management patternbecause of differences in soil characteristics and histo-ry. Soil characteristics and taxonomic information aresummarized in Table 1. Existing commercial soil test-ing results (Spectrum Analytic Inc.; samples pro-cessed in mid to late fall) for soil characteristics andMehlich 3-extractable nutrients are summarized inTable 2 (italics indicate calculations). As is typical oflong term dairy farms in the Northeast U.S., availableP already exceeded maximum recommended levels for
all M and B treatments, while K levels were adequatefor half the plots.
Land Application Practices
Manure from the dairy barn is scraped frequentlyduring the day and includes sawdust used as freestallbedding. Manure is stored in a lagoon along withmilkhouse wastewater, and is subsequently land-applied at 8 to 10 percent total solids at a rate of65,000 to 75,000 l/ha. Beginning in 1998, cheese pro-cessing waste (whey) was added to the lagoon on adaily basis so that it comprised two-thirds of the vol-ume spread (1/3 manure, 2/3 whey; 6 to 8 percent TS).
JOURNAL OF THE AMERICAN WATER RESOURCES ASSOCIATION 1027 JAWRA
ENVIRONMENTAL IMPACTS OF APPLYING MANURE, FERTILIZER, AND SEWAGE BIOSOLIDS ON A DAIRY FARM
TABLE 1. Soil Series Information for Sampled Fields (USDA-SCS, 1978)and Taxonomic Classifications (USDA-NRCS, 2001).
Depth, inchesField Soil Series and Slope Soil Taxonomy (cm) Comments
M1 Lordstown Channery Silt Loam Coarse loamy, mixed, active, > 36 (91) to bedrock Glacial till, moderate(12 to 20 percent) mesic Typic Dystrudepts permeability
M2, B1 Fremont Silt Loam, (2 to 8 percent) Fine loamy, mixed, semiactive, 32 (81) to fragipan Strongly acid glacial till,acid, mesic Aeric Endoaquepts somewhat poorly drained
B2, F1 Volusia Channery Silt Loam Fine loamy, mixed, active, mesic 15 (38) to fragipan Strongly acid glacial till,(8 to 15 percent) Aeric Fragiaquepts somewhat poorly drained
F2 Mardin Channery Silt Loam Coarse loamy, mixed, active, 19 (48) to fragipan Strongly acid glacial till,(8 to 15 percent) mesic, Typic Fragiudepts moderate permeability
TABLE 2. Commercial Soil Testing Results: Soil Characteristics and Mehlich3-Extractable Nutrients (mean of fall 1995 and 1997 samplings).
FieldM-1 M-2 B-1 B-2 F-1 F-2
CEC (cmol/kg) 13 18 13 11 11 12Soil pH 6.3 5.4 7.0 6.6 6.9 6.2Organic Matter (percent) 4.0 3.8 3.3 3.7 3.4 3.4
Available P (kg/ha) 473 223 380 161 41 66Ratio 3.5 2.0 3.0 1.2 0.3 0.5
Available K (kg/ha) 897 715 620 227 237 163K Saturation (percent) 8.2 4.7 5.3 2.4 2.5 1.6Ratio 1.6 1.2 1.1 0.5 0.5 0.3
SO4-S (mg/kg) 30 40 32 27 24 17Zn (mg/kg) 9 9 10 5 3 4B (mg/kg) 0.2 0.2 0.4 0.2 0.2 0.1
Note: “Ratio” (italicized to signify calculated) indicates the ratio of actual available nutrients to the maximum optimum level recommended for the field. A ratio > 1.0 indicates excess nutrients.

The reported 70,000 l/ha land application rate andsolids contents resulted in dry matter loading rates of8 tons/ha/y for manure (relevant to years prior toaddition of processing wastes) and 3.5 tons/ha/y forthe mixed manure/food processing wastes. While mostspreading precedes planting, some manure wasspread in winter.
Land application of sewage biosolids, first used in1978 to improve fallow fields, takes place fromapproximately April 1 until the end of May on fieldsbeing planted for corn. Application then shifts tofields being prepared for forage seeding in Augustand, following that, to fallow land. Both liquid anddewatered sewage biosolids are collected from varioustreatment plants throughout the region of the state.Stabilization processes used vary widely by plant,with some lime stabilization of liquid biosolids per-formed at the farm. Of the wastes land applied on thisfarm, sewage biosolids are by far the best document-ed, with annual analysis and application summaryreports filed in compliance with state regulations.Mean application rates in 1999 (LaBella Associates,1999, unpublished report number 20084) were 3.8tons/ha on 76 ha for dewatered sludge, and 4.6tons/ha on 107 ha for liquid wastes. These loadingsaccount for 31 percent (dewatered sludge) or 70 per-cent (liquid biosolids and other wastes) of corn Nrequirements.
Table 3 summarizes the known cumulative applica-tion history through the 2000 cropping season. Testfields were selected on the basis of recent total massloadings. However, cumulative biosolids metals load-ings indicate widely varying application histories,presumably due to application of higher concentrationwastes at some point. Note that only the M2 field was entirely free of historical biosolids applications.Overall rates are low, with maximum (B2) levels only
on the order of 1 percent of USEPA Part 503 cumula-tive limits (USEPA, 1993). Actual trace element appli-cation rates from manure can be estimated fromvalues shown later. While Raven and Loeppert (1997)found that rock phosphates (along with sewagebiosolids) had the greatest trace element concentra-tions, research at Cornell University (McBride andSpiers, 2001) has indicated that fertilizers used inNew York have relatively low levels of trace contami-nants. This, in combination with the fact that fertiliz-er mass loadings are an order of magnitude lowerthan biosolids or manures, suggests that trace ele-ment loadings from fertilizers were negligible.
The most recent sewage biosolids sources andimported masses for the entire farm are shown inTable 4. Liquid biosolids and other liquid wastesapplied to fields more distant from the main dairybarn are a mixture of liquid biosolids, liquid food pro-cessing waste, liquid manure from a heifer barn andseptage. These wastes are mixed and lime-stabilizedprior to application. Table 4 shows the recent relativecontributions from various sources.
Recent mean sewage biosolids analyses from inde-pendent certified laboratories are shown in Table 5.All biosolids applied on this farm are classified underNew York state standards as class B biosolids. Con-centrations for regulated trace elements were all wellbelow the Part 503 “Exceptional Quality” levels. Alsoshown are composite grab sample results for dairymanure (January 2001 sampling) and mixed dairymanure/cheese processing waste lagoon (30 percentanimal manure and 70 percent processing wastes;mean of 1998 and 2001 samplings). The cheese pro-cessing waste was reported to have a pH levelbetween 4.5 and 5.7 and solids content of 6.5 to 7.5percent TS. Cow manure analysis is included to showthe impact of the processing waste, particularly onelevating Na and Cu and diluting Zn.
JAWRA 1028 JOURNAL OF THE AMERICAN WATER RESOURCES ASSOCIATION
RICHARDS, SCHULTE, HEILIG, STEENHUIS, MCBRIDE, HARRISON, AND DICKSON
TABLE 3. Cumulative Historical Test Field Sewage Biosolids Loadings: Number of AnnualLoadings (as of 2000) and Cumulative Trace Metal Loadings as of the End of 1999 (kg/ha).
Cd Cr Cu Pb Ni ZnField Loadings cumulative kg/ha
B1 15 0.06 0.28 5.52 0.56 0.54 7.45B2 11 0.35 2.71 20.42 3.79 1.80 28.29M1 4 0.15 1.00 5.44 1.72 0.86 6.28M2 0 0 0 0 0 0 0F1 4 0.07 0.92 5.03 1.15 0.93 10.66F2 6 0.16 1.58 8.53 1.61 1.24 15.29USEPA Part 503 39 3,000 1,500 300 420 2,800Cumulative Limit
Source: LaBella Associates (1999, unpublished Report No. 20084) and USEPA (1993).

ANALYTICAL MATERIALS AND METHODS
Soil Water Sampling
The locations of the selected test fields (two foreach waste application scenario: M1/M2, B1/B2, andF1/F2) are shown in Figure 1. On each test field a 10 m by 10 m sampling plot was delineated for theinstallation of two passive wick lysimeters (Boll etal., 1992; Richards et al., 1998). Installation was facil-itated by backhoe excavation of a 2 m deep trench justdownhill from the sampling plot. Samplers consistedof an enclosed box (34 by 34 cm square, 1 m tall), with25 fiberglass braided wicks (0.9 m long) (PepperrellBraiding Co., Pepperrell Massachusetts) suspendedvertically from the upper surface. Samplers wereinstalled 0.6 to 0.7 m below the soil surface in 0.7 mlong horizontal tunnels excavated laterally from the
JOURNAL OF THE AMERICAN WATER RESOURCES ASSOCIATION 1029 JAWRA
ENVIRONMENTAL IMPACTS OF APPLYING MANURE, FERTILIZER, AND SEWAGE BIOSOLIDS ON A DAIRY FARM
TABLE 4. Recent Farm Wide Cumulative Importsand Sources of Sewage Biosolids.
1997 1998 1999
Dewatered Sewage BiosolidsWet Mass (metric tons) 2,289 2,072 2,248Dry Mass (metric tons) 434 434 550
Liquid Biosolids and Other Wastes*Volume (m3) 12,491 10,977 9,841Dry Mass (metric tons) 467 394 293Contributing Sources(percent of volume)
Municipal Sewage Biosolids 48 60 26Food Processing Waste 28 9 34Heifer Manure 13 21 31Septage 11 10 9
*Liquid wastes also include food processing, heifer barn, and sep-*tage inputs (LaBella Associates, 1997, 1998, 1999, unpublished *Report Nos. 98052, 99090, and 20084, respectively).
TABLE 5. Recent Sewage Biosolids Analyses and Composite GrabSample Results of Dairy Manure and Mixed Lagoon.
EPA Part 503 Liquid Dewatered Dairy MixedParameter* EQ Limits Biosolids/Wastes Biosolids Manure Lagoon**
pH 6.1 7.1 8.4 4.3TS Percent 3.6 25.2 12.4 4.8
mg/kg (dry weight basis)
As 41 13.1 7.5 0.34 0.50B – – 21.9 11.72Ca – – 18,600 17,800Cd 39 4.4 2.9 0.23 0.29Cr 1,200 17.9 23.9 2.95 2.82Cu 1,500 368 521 92 592Hg 17 2.1 2.1 – –K 6,919 2,408 31,000 31,700Mg – – 6,220 4,550Mn – – 213 74.6Mo 13.2 13.0 2.68 2.12Na – – 11,360 27,300Ni 420 17.7 20.1 10.3 11.8P 11,454 24,665 6,380 9,960Pb 300 39.8 62.3 1.19 1.56S – – 5,530 3,777Sr – – 44.9 39.6Zn 2,800 388 816 210 94.7TAN 7,738 1,748 – –TKN 40,036 23,927 – –Total PCB 4.0 1.1 – –
**TAN = total ammoniacal N; TKN = total Kjeldahl N; Total PCB = total polychlorinated biphenyls.**Dairy manure/cheese processing waste lagoon (30 percent manure and 70 percent processing wastes).Notes: Sewage biosolids analyses are the means of 1997 to 1999 annual mass weighted mean values from LaBella (1997, 1998, 1999, unpub-
lished Report Nos. 98052, 99090, and 20084, respectively). USEPA Part 503 EQ limits included for comparison.

trench. The samplers were installed approximately1.5 m apart and were pressed upward against theexposed face of undisturbed subsoil. The bottom of theundisturbed soil profile was leveled and carefullyhandpicked to reopen flow paths disturbed by excava-tion.
Plexiglas plates supported by springs pressed theupper end of the wicks against the soil. Each suspend-ed wick was encased in 13 mm (i.d.) clear PVC tubing.The vertical suspension enables the wicks to exert amatric potential (suction) on the soil in contact withthe tops of the wicks, extracting soil water at mois-ture contents below saturation. The bottoms of thewicks were grouped into four discrete two-liter HDPEcollection bottles at the base of the sampler. Thesebottles were evacuated periodically by HDPE sam-pling lines that ran to the surface. A drain installedat the bottom of the box served to drain both anyoverflow from the collection bottles as well as anywater that infiltrated into the box. A tile line wasextended from the installation area to ensure the
samplers were not flooded with water percolatingfrom the uphill gradient. After adding a layer of grav-el to ensure proper drainage to the tile line, the exca-vated pits were backfilled.
Percolation typically occurs predominantly fromlate fall until late spring or early summer, dependingon annual precipitation patterns. Samplers wereinstalled during 1998, but many experienced floodingduring the 1998 and 1999 sampling season, so datafrom that time period are not shown. Samplerdrainage was improved by deepening and extendingpit area drains during 1999, and sampling resumedonce percolate flow resumed. Thirteen samplingswere collected during the period of percolate flow,which, due to dry conditions in the fall of 1999, didnot commence until January 2000 and ended in June2000. During each field visit the wick lysimeters weresampled by extracting water from the collection bot-tles using a portable vacuum pump and a four-literglass vacuum flask. Percolate volumes were recorded.Grab samples from tile lines were also taken duringeach field visit.
Surface Water Sampling
Runoff, the primary contaminant vector from dairyfarms to streams, is difficult to isolate for repetitivesampling due its nonpoint nature. Thereforestreamwater samples were collected at various pointson the farm to estimate effects of surface runoff (Fig-ure 1). Stream Site 1 was located at the mouth of asubwatershed applied with commercial fertilizer andthat contained fields with F1 and F2 plots. StreamSites 2 and 3 drained a primarily biosolids subwater-shed containing sites B1 and B2, Site 3 beingupstream closest to the B plots. Stream Site 4 draineda watershed that is applied with both manure andbiosolids. Stream Sites 5 and 7 are located on thesame stream and drain areas of the watershed wheremanure was the primary application and contains theM1 site. The subwatershed also contains a silagebunker just upstream of Site 7 that was subsequentlyfound to be draining into the stream. Stream Site 6drains areas that have manure and biosolids appliedto the fields. Grab samples were taken repetitivelyfrom these sampling points during the first sixmonths of 2000.
Intensive stream sampling was conducted in thewatersheds primarily applied with fertilizer (StreamSite 1) and biosolids (Stream Site 2). Stream stagewas recorded daily at these sites using a pressuretransducer calibrated to determine water depth(Model 10/D, Druck Inc., Fairfield, Connecticut) (0 to1 psi range x 0.01 resolution). A 45-day capacity datalogger was attached to the pressure transducer to
JAWRA 1030 JOURNAL OF THE AMERICAN WATER RESOURCES ASSOCIATION
RICHARDS, SCHULTE, HEILIG, STEENHUIS, MCBRIDE, HARRISON, AND DICKSON
Figure 1. Contour and Location Map of Test Fields (sewagebiosolids B1, B2; fertilizer F1, F2; and manure M1, M2),
Farm Facilities and Surface Stream Sampling Sites.

allow constant monitoring of streams. The pressuretransducer was protected from silt and rocks with aPVC pipe housing (10 cm diameter, 1.1 m tall) with1.25 cm holes to allow proper water flow. The trans-ducer was installed in the deepest part of streams,attached to permanent stakes to keep the transducerposition constant. Stream cross sectional survey andtransducer calibrations were performed upon installa-tion. Five stream velocity surveys were conductedduring April 2000 when the stream was at differentstages to establish a regression between transducerreadings and stream discharge. The discharge ofthese two streams was then calculated at 10-minuteintervals throughout the month of April 2000. Inaddition to grab samples gathered during each sitevisit, intensive automated sampling was conducteddaily during April 2000, during which 500 ml wassampled from Streams Sites 1 and 2 every four hours.
Soil and Crop Sampling
Soil samples were taken by depth (0 to 50 cm, 50 to100 cm, etc.) across the exposed face of each pit exca-vated to facilitate wick sampler installation. Samplerinstallation depths of 0.6 to 0.7 m were below the sur-face of fragipan horizons observed at depths of 0.3 to0.6m. Plow (Ap) layer depths were typically 0.18 to0.21 m.
In 2000, all test fields were used for growing alfal-fa. Ten grab samples of alfalfa hay were collected fromeach field site along a 500 m transect and were com-posited into one sample per field. The plant tissuesamples were dried, ground, and analyzed for totalelemental content using ICP (inductively coupledplasma) spectroscopy.
Analytical
Soils were tested for pH by mixing 1:1 v/v with dis-tilled water and measuring with a calibrated meterafter one hour. Soil elemental analysis was conductedusing nitric acid microwave digestion, with 0.5 g soilplaced in a capped fluorocarbon microwave vessel anddigested in 10 ml 4M HNO3 for 10 minutes usingmicrowave heating. After cooling, the vessel contentswere filtered, centrifuged, or allowed to settle andthen diluted to volume and analyzed.
Percolate collected from wick lysimeters (each ofwhich held four collection bottles) was composited atthe laboratory in proportion to the volume collected in the field, resulting in one sample per wick lysime-ter for analysis. This composite was then filtered(0.45 µm nominal porosity) to remove particulates.
Streamwater samples were likewise filtered, and 100ml of each sample was then archived and refrigeratedat 4˚C. Selected subsamples were subsequently ana-lyzed for trace elements using ICP spectroscopy.
Samples from the April 2000 intensive sampling ofStream Sites 1 and 2 were frozen and subsequentlyanalyzed colorimetrically for soluble reactive P usingthe ascorbic acid method (APHA/AWWA/WEF, 1999).A subset of the streamwater samples was selected forelemental analysis, including total P. Fifty ml of eachsample was pipetted into a 250 ml beaker, brought todryness, and then boiled for 30 minutes with 5 ml ofacid solution (25 percent HNO3, 25 percent HCl).After cooling, the solution was transferred andbrought to 10 ml volume in a 15 ml plastic centrifugetube for storage. The net five-fold concentration of thesample ensured low level detection by the graphitefurnace atomic absorption (GFAA) spectrometer(Perkin-Elmer Model 5100 with Zeeman module).
RESULTS AND DISCUSSION
As noted earlier, the wide range of initial soil char-acteristics, cropping history, and waste applicationrates means that it is not meaningful to regard thetwo fields sampled for each management pattern asexperimental replicates, nor to average the data fromthem. This precludes standard statistical treatments,so the results are framed in terms of observabletrends and comparisons with relevant water qualitystandards.
As noted earlier, it was found that sewage biosolidscumulative metals loadings were disparate from therecent biosolids application history, resulting in a rel-ative ranking of reported elemental loadings (Table 3)of B2>>F2>F1≈M1>B1>>M2. Of currently appliedmaterials (Table 5), the dairy manure and mixeddairy/cheese waste had much lower concentrations ofmost trace elements of concern (As, Cd, Cr, Mo, Ni,Pb, and Zn) than did the solid or mixed liquidbiosolids; only Cu had comparable concentrations.
Soil and Plant Analysis
Soil pH data in Table 6 include mean historicalsoil pH data from Table 2, which correspond well withthis study’s results. Soil pH levels in the plow layer(upper 20 cm) were greater in the sludge plots than inmost other field sites, likely due to calcareous addi-tions at the wastewater treatment plants as well ason-farm lime stabilization of the liquid sludge andother wastes. Soil pH generally became more acidic
JOURNAL OF THE AMERICAN WATER RESOURCES ASSOCIATION 1031 JAWRA
ENVIRONMENTAL IMPACTS OF APPLYING MANURE, FERTILIZER, AND SEWAGE BIOSOLIDS ON A DAIRY FARM
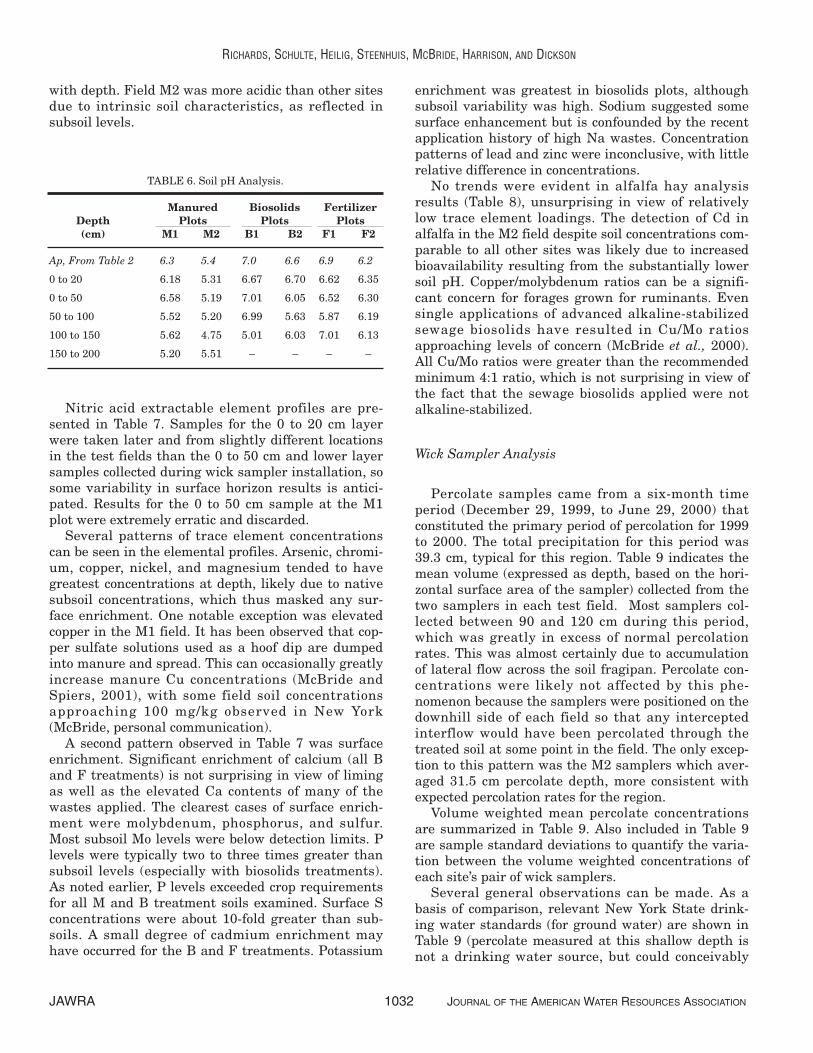
with depth. Field M2 was more acidic than other sitesdue to intrinsic soil characteristics, as reflected insubsoil levels.
Nitric acid extractable element profiles are pre-sented in Table 7. Samples for the 0 to 20 cm layerwere taken later and from slightly different locationsin the test fields than the 0 to 50 cm and lower layersamples collected during wick sampler installation, sosome variability in surface horizon results is antici-pated. Results for the 0 to 50 cm sample at the M1plot were extremely erratic and discarded.
Several patterns of trace element concentrationscan be seen in the elemental profiles. Arsenic, chromi-um, copper, nickel, and magnesium tended to havegreatest concentrations at depth, likely due to nativesubsoil concentrations, which thus masked any sur-face enrichment. One notable exception was elevatedcopper in the M1 field. It has been observed that cop-per sulfate solutions used as a hoof dip are dumpedinto manure and spread. This can occasionally greatlyincrease manure Cu concentrations (McBride andSpiers, 2001), with some field soil concentrationsapproaching 100 mg/kg observed in New York(McBride, personal communication).
A second pattern observed in Table 7 was surfaceenrichment. Significant enrichment of calcium (all Band F treatments) is not surprising in view of limingas well as the elevated Ca contents of many of thewastes applied. The clearest cases of surface enrich-ment were molybdenum, phosphorus, and sulfur.Most subsoil Mo levels were below detection limits. Plevels were typically two to three times greater thansubsoil levels (especially with biosolids treatments).As noted earlier, P levels exceeded crop requirementsfor all M and B treatment soils examined. Surface Sconcentrations were about 10-fold greater than sub-soils. A small degree of cadmium enrichment mayhave occurred for the B and F treatments. Potassium
enrichment was greatest in biosolids plots, althoughsubsoil variability was high. Sodium suggested somesurface enhancement but is confounded by the recentapplication history of high Na wastes. Concentrationpatterns of lead and zinc were inconclusive, with littlerelative difference in concentrations.
No trends were evident in alfalfa hay analysisresults (Table 8), unsurprising in view of relativelylow trace element loadings. The detection of Cd inalfalfa in the M2 field despite soil concentrations com-parable to all other sites was likely due to increasedbioavailability resulting from the substantially lowersoil pH. Copper/molybdenum ratios can be a signifi-cant concern for forages grown for ruminants. Evensingle applications of advanced alkaline-stabilizedsewage biosolids have resulted in Cu/Mo ratiosapproaching levels of concern (McBride et al., 2000).All Cu/Mo ratios were greater than the recommendedminimum 4:1 ratio, which is not surprising in view ofthe fact that the sewage biosolids applied were notalkaline-stabilized.
Wick Sampler Analysis
Percolate samples came from a six-month timeperiod (December 29, 1999, to June 29, 2000) thatconstituted the primary period of percolation for 1999to 2000. The total precipitation for this period was39.3 cm, typical for this region. Table 9 indicates themean volume (expressed as depth, based on the hori-zontal surface area of the sampler) collected from thetwo samplers in each test field. Most samplers col-lected between 90 and 120 cm during this period,which was greatly in excess of normal percolationrates. This was almost certainly due to accumulationof lateral flow across the soil fragipan. Percolate con-centrations were likely not affected by this phe-nomenon because the samplers were positioned on thedownhill side of each field so that any interceptedinterflow would have been percolated through thetreated soil at some point in the field. The only excep-tion to this pattern was the M2 samplers which aver-aged 31.5 cm percolate depth, more consistent withexpected percolation rates for the region.
Volume weighted mean percolate concentrationsare summarized in Table 9. Also included in Table 9are sample standard deviations to quantify the varia-tion between the volume weighted concentrations ofeach site’s pair of wick samplers.
Several general observations can be made. As abasis of comparison, relevant New York State drink-ing water standards (for ground water) are shown inTable 9 (percolate measured at this shallow depth isnot a drinking water source, but could conceivably
JAWRA 1032 JOURNAL OF THE AMERICAN WATER RESOURCES ASSOCIATION
RICHARDS, SCHULTE, HEILIG, STEENHUIS, MCBRIDE, HARRISON, AND DICKSON
TABLE 6. Soil pH Analysis.
Manured Biosolids FertilizerDepth Plots Plots Plots(cm) M1 M2 B1 B2 F1 F2
Ap, From Table 2 6.30 5.40 7.00 6.60 6.90 6.20
0 to 20 6.18 5.31 6.67 6.70 6.62 6.35
0 to 50 6.58 5.19 7.01 6.05 6.52 6.30
50 to 100 5.52 5.20 6.99 5.63 5.87 6.19
100 to 150 5.62 4.75 5.01 6.03 7.01 6.13
150 to 200 5.20 5.51 – – – –

JOURNAL OF THE AMERICAN WATER RESOURCES ASSOCIATION 1033 JAWRA
ENVIRONMENTAL IMPACTS OF APPLYING MANURE, FERTILIZER, AND SEWAGE BIOSOLIDS ON A DAIRY FARM
TABLE 7. Soil Profile: 4M Hot Nitric Acid Extractable Elements in mg/kg.
Manured Plots Biosolids Plots Fertilizer PlotsElement Depth (cm) M1 M2 B1 B2 F1 F2
As 0 to 20 1.98 2.76 3.30 4.07 3.72 3.010 to 50 - 3.71 3.88 2.66 5.27 3.0750 to 100 2.91 3.43 8.81 5.72 9.01 9.44100 to 150 4.56 7.58 9.74 8.00 9.67 8.64150 to 200 5.75 9.17
Ca 0 to 20 1904 1208 3364 3320 2762 26250 to 50 – 1657 4581 2168 3036 206150 to 100 2584 1334 2228 941 1163 1655100 to 150 648 375 1089 1859 2091 1158150 to 200 752 1123
Cd 0 to 20 0.176 0.468 0.490 0.593 0.501 0.5030 to 50 – 0.405 0.442 0.373 0.437 0.40150 to 100 0.289 0.397 0.389 0.301 0.372 0.439100 to 150 0.275 0.355 0.520 0.340 0.460 0.355150 to 200 0.288 0.430
Cr 0 to 20 11.67 13.39 14.22 16.26 13.24 13.070 to 50 – 13.02 13.72 14.62 15.29 9.1350 to 100 11.85 13.25 14.79 14.12 15.35 16.15100 to 150 12.19 16.26 17.42 16.35 16.96 15.74150 to 200 13.46 17.92
Cu 0 to 20 34.48 17.12 18.77 16.7 12.55 15.720 to 50 – 13.19 16.09 7.768 12.03 12.6950 to 100 10.17 12.92 26.2 16.71 22.23 24.98100 to 150 11.98 21.5 31.67 20.46 22.87 22.8150-200 14.92 26.52
K 0 to 20 1181 1180 1473 1917 2011 10270 to 50 – 1308 1103 919 1979 51550 to 100 740 1246 968 848 1360 1506100 to 150 441 762 1124 1555 1750 1660150 to 200 565 723
Mg 0 to 20 2348 2484 2505 2658 2651 23320 to 50 – 3004 3030 2943 3368 189850 to 100 3182 2903 3612 3209 3713 3870100 to 150 3294 4091 3765 3727 3947 3710150 to 200 3622 4534
Mn 0 to 20 245.5 419.4 487.1 610 348 481.50 to 50 – 529.9 551.9 557.6 443 608.150 to 100 230.4 828.8 322.8 270 402.2 434100 to 150 237.5 324.9 335.1 370.4 421.9 370.8150-200 305.7 538.3
Mo 0 to 20 0.653 0.617 0.731 0.731 0.443 0.5230 to 50 – 0.177 0.122 <0.0004 <0.0004 0.19950 to 100 <0.0004 0.082 <0.0004 <0.0004 <0.0004 <0.0004100 to 150 <0.0004 <0.0004 <0.0004 <0.0004 <0.0004 <0.0004150 to 200 <0.0004 <0.0004
Na* 0 to 20 148.8 29.82 112.2 184.1 2.213 10.770 to 50 - 61.54 115.6 94.12 66.53 36.0450 to 100 99.83 56.81 60.94 55.17 23.98 51.69100 to 150 89.47 55.49 72.32 33.87 57.3 50.56150 to 200 49.57 52.93
*Data influenced by food waste.

JAWRA 1034 JOURNAL OF THE AMERICAN WATER RESOURCES ASSOCIATION
RICHARDS, SCHULTE, HEILIG, STEENHUIS, MCBRIDE, HARRISON, AND DICKSON
TABLE 7. Soil Profile: 4M Hot Nitric Acid Extractable Elements in mg/kg (cont’d.)
Manured Plots Biosolids Plots Fertilizer PlotsElement Depth (cm) M1 M2 B1 B2 F1 F2
Ni 0 to 20 17.83 17 16.48 19.49 17.89 16.160 to 50 – 16.47 16.7 15.2 18.64 10.6750 to 100 16.87 16.69 25.81 19.61 25.18 28.57100 to 150 18.76 24.64 61.62 26.98 28.2 25.02150 to 200 20.94 31.54
P 0 to 20 1013 954.5 1098 1298 686.9 712.10 to 50 – 1229 1248 461.4 762.5 386.750 to 100 785.5 960.1 350.3 314.6 353.6 346.9100 to 150 330.4 306.4 300.6 371.4 387.1 352.3150 to 200 379.8 419
Pb 0 to 20 13.58 13.23 13.02 15.31 13.98 13.950 to 50 – 13.40 15.65 15.64 18.57 13.3050 to 100 10.97 13.63 13.11 11.25 12.78 16.58100 to 150 11.07 12.72 14.62 13.4 16.05 12.74150 to 200 11.23 17.24
S 0 to 20 349.3 293.4 266.6 398.9 341.8 345.80 to 50 – 414.6 306.7 272.3 381.5 190.550 to 100 283.4 360.8 27.75 29.72 55.23 20.74100 to 150 33.38 55.02 83.8 26.67 20.49 52.87150 to 200 34.91 18.22
Zn 0 to 20 76.12 74.62 72.72 84.42 72.3 73.710 to 50 – 80.64 76.46 72.14 84.24 52.5550 to 100 60.94 88.53 57.43 50.65 64.56 76.93100 to 150 45.57 63.1 57.93 66.28 73.8 63.71150 to 200 51.36 80.93
TABLE 8. Plant Tissue Trace Element Concentrations (mg/kg) and Copper/Molybdenum Ratio.
Element M1 M2 B1 B2 F1 F2
Al 56.6 52.3 106.0 140.0 73.3 94.9
Ca 12,600 12,980 12,970 14,270 14,230 16,110
Cd nd 0.0174 nd nd nd nd
Cr 1.58 1.09 0.381 0.466 0.338 1.05
Cu 10.2 11.3 11.0 11.7 11.9 12.6
Fe 105 103 203 179 117 170
K 24,220 36,910 33,600 28,450 37,250 21,170
Mg 2,823 2,619 2,274 2,605 2,290 2,701
Mn 40.7 52.9 34.7 55.7 30.6 38.7
Mo 1.1 0.82 1.93 0.96 0.74 1.04
Na 286 279 269 316 102 519
Ni 0.57 0.74 0.54 0.86 0.27 0.70
P 3,617 3,259 3,434 2,965 3,266 2,778
Pb 0.059 nd nd nd 0.012 nd
S 1,448 2,546 2,274 2,128 2,502 2,941
Zn 26.5 22.9 28.5 28.9 31.0 25.3
Cu/Mo Ratio 9.3 13.7 5.7 12.2 16.0 12.1
*nd indicates ‘not detected.’

contribute to recharge). The B2 site had the greatest measured concentrations for six of the 13 analytesreported in the table, followed by M2 with five maxi-mum analyte concentrations. In only four cases (As,Cr, Na, and Ni) did the peak percolate concentrationcoincide with greatest topsoil concentrations, all ofwhich occurred with B2 site. Values shown in boldtype in Table 9 exceed New York drinking water stan-dards. Percolate Cu exceeded the 8 µg/l standard atfour sites: M1, M2, B2, and F1. Sodium showed thegreatest exceedence of any analyte, exceeding the20,000 µg/l standard on all M and B fields, mostnotably at M2 and B2 with levels over 124,000 and133,000 µg/l, respectively. Three sites – M1, M2 andF2 – had Pb levels that slightly exceeded standards,but these levels were close to the lower detection limit(LDL) for Pb. Cadmium slightly exceeded standardsin the M2 percolate, with the increased mobility againa function of substantially more acidic soil throughoutthe profile. While not exceeding drinking water stan-dards, sulfur levels in M2, B1, and B2 were substan-tially greater than other fields. Molybdenum had thegreatest relative variability (coefficient of variation),suggesting that transport was extremely flow pathdependent and thus subject to spatial variation inflow paths, as reflected in the between sampler vari-ability.
Stream Analysis
Surface streams were monitored for the first sixmonths of 2000, with mean grab sample soluble ele-mental concentrations shown in Table 10. Many NewYork State surface water quality standards are afunction of the individual water sample's hardness,thus the quality standard levels shown in Table 10were calculated from measured hardness data. Stan-dards are flagged to indicate whether the standard isbased on human (H) or aquatic (A) health. Excee-dence of those standards are indicated in the table.As noted earlier, Stream Site 1 was located at themouth of the fertilizer subwatershed containing fieldswith F1 and F2 plots. Stream Sites 2 and 3 drained aprimarily biosolids subwatershed containing sites B1and B2, with Site 3 being upstream closest to theplots. Watersheds for Sites 4 and 6 were applied withboth manure and biosolids. Stream Sites 5 and 7drain a primarily manure applied watershed contain-ing the M1 site.
The data for Sites 5 and 7 were most strongly influ-enced by the silage bunker just upstream of Site 7that was subsequently found to be draining into thestream. As a result, almost all elements at StreamSites 5 and 7 were substantially elevated. Mostnotably, Ca, Cd, Fe, K, Mg, Mn, Mo, and Ni concentra-tions were at least five-fold greater than otherstreamflow sites, with Mn and Na substantially
JOURNAL OF THE AMERICAN WATER RESOURCES ASSOCIATION 1035 JAWRA
ENVIRONMENTAL IMPACTS OF APPLYING MANURE, FERTILIZER, AND SEWAGE BIOSOLIDS ON A DAIRY FARM
TABLE 9. Wick Lysimeter Results: Total Sample Depth Collected (cm), Volume-weighted Mean Percolate Concentrations(µ g/l), and Sample Standard Deviations Between Mean Concentrations from Each Pair of Wick Samplers.
M1 M2 B1 B2 F1 F2 NYAnalyte Mean SD Mean SD Mean SD Mean SD Mean SD Mean SD Std.
Depth (cm) 129.9 31.5 91.2 100.8 101.5 120.6
Concentration µg/l
As 3.5 1.9 3.8 3.0 1.7 0.3 6.1 3.5 1.4 0.1 1.7 0.3 50
Ca 24,610 2,520 90,460 1,840 88,920 13,280 140,910 27,860 38,060 1,199 20,570 3,490 –
Cd 0.14 0.06 1.11 0.32 0.26 0.03 0.22 0.01 0.09 0.02 0.33 0.37 0.9
Cr 2.1 0.3 2.8 2.3 1.3 0.1 5.7 1.3 1.8 0.2 1.9 0.3 160
Cu 11.5 0.9 12.6 6.1 7.1 0.9 11.5 8.6 10.1 0.4 5.4 2.2 8
K 9,440 1,640 83,510 10,490 5,410 395 8,210 7,860 13,010 1,670 801 452 –
Mg 8,590 1,000 25,360 3,060 13,830 1,370 28,460 2,720 9,810 622 5,820 1,120 35,000
Mo 10.2 11.6 54.8 49.2 10.4 15.4 4.6 4.5 6.9 7.9 7.5 7.3 –
Na 40,120 1,940 124,160 7,860 36,185 6,090 133,680 8,700 7,840 544 8,220 451 20,000
Ni 5.1 0.2 22.1 1.5 16.4 0.8 23.5 0.6 5.5 0.1 3.7 0.5 70
Pb 2.6 1.1 2.1 0.1 1.8 0.2 1.6 0.4 1.7 0.1 2.1 0.1 2
S 5,767 540 16,004 527 26,253 3,303 24,766 10,447 9,385 171 4,242 35 250,000
Zn 15.7 3.6 42.2 10.7 8.4 0.6 12.3 3.8 6.4 1.3 6.7 5.6 59
Note: Bold indicates values exceeding New York State ground water quality standards.

exceeding the surface water standards. This situationhas been corrected by installing a drain from thebunker silo to the recently-installed manure process-ing system. Because of this bunker silo impact, effectsfrom the “primarily manure” treatment that Sites 5and 7 were designated to represent could not be sepa-rated.
Of the remaining Stream Sites (1 through 4 and 6),measured levels of As, Cd, and Pb were all close to theLDL of the ICP instrument (Table 10). Site 6, repre-senting biosolids plus manure application, tended tohave the greatest measured concentrations of allother elements, exceeding Na and, to a lesser extent,Cu limits. Biosolids treatment Sites 2 and 3 alsoexceeded the Na standard. The exceedence of the Pbstandard at Sites 1 through 4 is likely not significantdue to the proximity of the results to the lower detec-tion limit.
Time series results of streamflow grab sampleresults are shown for several representative elementsfrom watershed Sites 1 through 4 and 6 in Figure 2.Also shown are sewage biosolids applications (cumu-lative mass per field) and meteorological data. Notethat sewage biosolids applications during the moni-toring period were significant only in the watershedfor Sites 2 and 3. Na and Ni declined following thesnowmelt and precipitation events in late February.All sites showed a steady increase in apparentresponse to the early April precipitation events. Therewas no clear correlation of stream concentrations withsewage biosolids loadings.
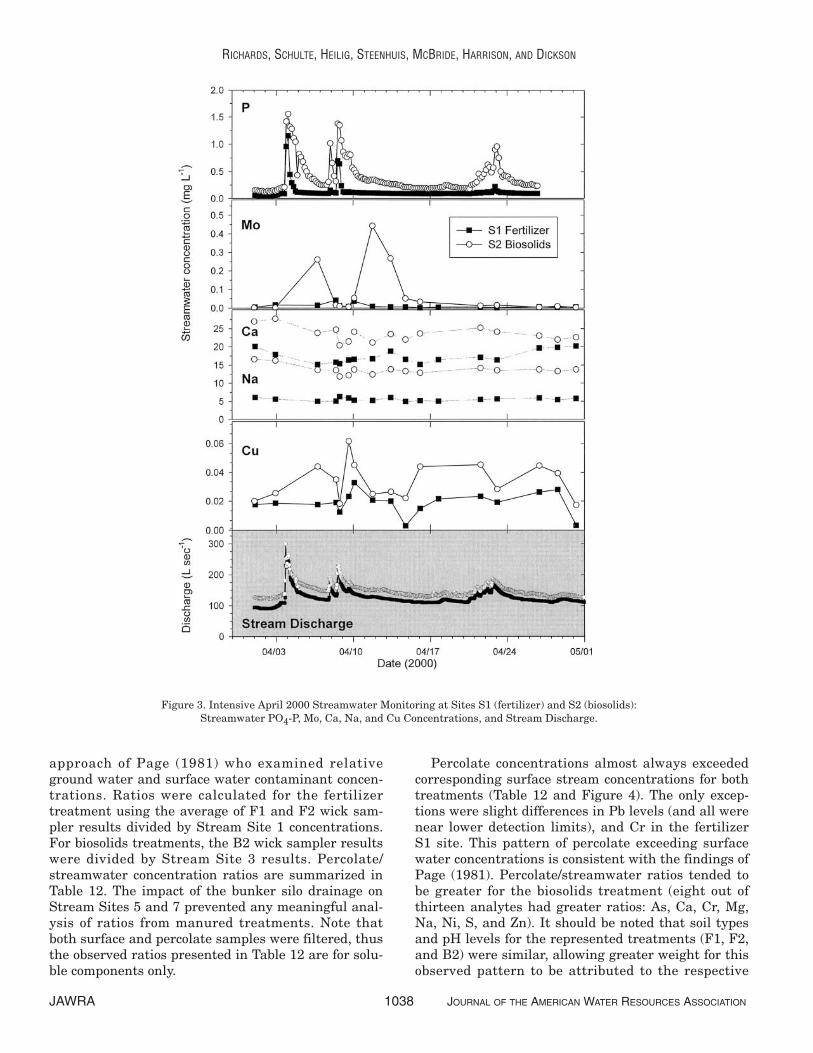
Intensive sampling allows detection of signalsmissed by random grab sampling. Total elementalconcentrations for Stream Sites 1 (fertilizer water-shed) and 2 (sewage biosolids) are shown in Figure 3,along with stream discharge results. Only a few ele-ments had concentration changes that clearly corre-lated with the runoff events noted by the intensivemonitoring in April. Soluble phosphorus strongly cor-related with stream discharge (Figure 3), with a highcorrespondence of P peaks with increases in dischargefor both watersheds, although the biosolids watershedpeaks were notably greater and more persistent.
Analyses aside from P were less frequent due tocost considerations. Substantial increases in Mo con-centrations from the Site 2 biosolids treatment laggedlarge runoff events by about five days (Figure 3). Sim-ilar delays in Mo transport have been observed in col-umn leaching studies (Richards et al., 2000). Patternsfor Cu were less clear, with an increase from bothsites lagging the second runoff event of April,although overall levels were greater from the sewagebiosolids Site 2 treatment. Both Ca and Na showed noreal correlation with runoff events, other than per-haps a slight dilution effect.
Total elemental exports (kg/ha/month) were calcu-lated for April using the mean discharge multipliedby the mean daily concentration of each element(Table 11). While many elements were similar in totalexport, exports of Cu, Mo, Na, and soluble P (bothortho soluble and total soluble) were two to nearlyeight times greater from the S2 watershed. Although
JAWRA 1036 JOURNAL OF THE AMERICAN WATER RESOURCES ASSOCIATION
RICHARDS, SCHULTE, HEILIG, STEENHUIS, MCBRIDE, HARRISON, AND DICKSON
TABLE 10. Mean Streamwater Grab Sample Concentrations (µg/l).
Biosolids and Manure/Food NYSFertilizer Biosolids Manure Waste/Bunker Quality
Element S1 S2 S3 S4 S6 S5 S7 Standard
As 1.1 1.1 1.0 1.0 1.0 1.3 1.3 50 HCa 22,390 28,790 39,960 20,070 38,070 106,320 103,650 –Cd 0.16 0.16 0.19 0.34 0.21 1.35 1.13 0.90 A*Cr 2.0 1.8 2.5 2.4 2.8 3.3 5.8 50 HCu 3.9 3.5 5.1 3.5 8.3 5.1 6.3 8 A*Fe 9.7 4.3 3.2 1.7 4.6 100.3 116.1 300 HAK 623 1,440 2,690 602 9,990 80,210 114,600 –Mg 4,390 5,460 8,290 4,220 9,630 25,060 27,580 35,000 HMn 1.24 0.27 0.50 0.70 1.69 3,320 3,020 300 HMo 0.74 0.91 1.22 1.19 1.00 4.64 12.06 –Na 6,780 20,220 26,120 5,167 52,130 175,800 245,680 20,000 HNi 4.3 5.2 7.2 3.3 6.8 25.2 25.1 70 A*Pb 2.7 2.1 2.4 2.8 1.6 1.9 1.9 2 A*S 5,570 5,530 6,490 6,790 7,680 6,640 15,840 250,000 HZn 5.1 5.7 4.7 5.9 10.2 11.6 72.4 59 A*
*Standard based on measured stream water hardness.Notes: Bold type indicates values exceeding New York State surface water quality standards. Standards are coded H for human health or
A for aquatic health.

watershed areas were only 2 percent different, themean discharge for the S2 biosolids watershed was 18percent greater. Normalizing for equal discharge(dividing the W2/W1 ratio by 1.18), the S2 watershedexports for these four analytes were still 1.7 to 6.5greater than the S1 fertilizer watershed, with thegreatest difference being Mo.
Comparing Percolate and Surface StreamConcentrations
In order to assess the relative impacts on percolateand surface streamwater, concentration ratios werecalculated by dividing wick sampler percolate concen-trations (Table 9) by the concentrations of correspond-ing surface stream samples (Table 10), similar to the
JOURNAL OF THE AMERICAN WATER RESOURCES ASSOCIATION 1037 JAWRA
ENVIRONMENTAL IMPACTS OF APPLYING MANURE, FERTILIZER, AND SEWAGE BIOSOLIDS ON A DAIRY FARM
Figure 2. Streamwater Monitoring January to June 2000: Streamwater Grab Sample Na and Ni Concentrations;Biosolids Loadings on Subwatersheds; and Daily Precipitation and Snowpack Depth. Stream monitoring Site S1
(fertilizer treatment), Sites S2 through S4 (biosolids), and S6 (mixed biosolids/manure).
approach of Page (1981) who examined relativeground water and surface water contaminant concen-trations. Ratios were calculated for the fertilizertreatment using the average of F1 and F2 wick sam-pler results divided by Stream Site 1 concentrations.For biosolids treatments, the B2 wick sampler resultswere divided by Stream Site 3 results. Percolate/streamwater concentration ratios are summarized inTable 12. The impact of the bunker silo drainage onStream Sites 5 and 7 prevented any meaningful anal-ysis of ratios from manured treatments. Note thatboth surface and percolate samples were filtered, thusthe observed ratios presented in Table 12 are for solu-ble components only.
Percolate concentrations almost always exceededcorresponding surface stream concentrations for bothtreatments (Table 12 and Figure 4). The only excep-tions were slight differences in Pb levels (and all werenear lower detection limits), and Cr in the fertilizerS1 site. This pattern of percolate exceeding surfacewater concentrations is consistent with the findings ofPage (1981). Percolate/streamwater ratios tended tobe greater for the biosolids treatment (eight out ofthirteen analytes had greater ratios: As, Ca, Cr, Mg,Na, Ni, S, and Zn). It should be noted that soil typesand pH levels for the represented treatments (F1, F2,and B2) were similar, allowing greater weight for thisobserved pattern to be attributed to the respective
JAWRA 1038 JOURNAL OF THE AMERICAN WATER RESOURCES ASSOCIATION
RICHARDS, SCHULTE, HEILIG, STEENHUIS, MCBRIDE, HARRISON, AND DICKSON
Figure 3. Intensive April 2000 Streamwater Monitoring at Sites S1 (fertilizer) and S2 (biosolids):Streamwater PO4-P, Mo, Ca, Na, and Cu Concentrations, and Stream Discharge.

land application treatments. Based on these ratios, itappears that the biosolids treatment impacted solublepercolate concentrations proportionally more thancorresponding soluble streamwater concentrations.This observation is consistent with the fact thatbiosolids are spread with machinery that immediatelycultivates the soil applied with biosolids, making theapplied material more “available” to percolate than tosurface runoff.
CONCLUSIONS
Waste Loadings
Recent application patterns differed from historicalsewage biosolids loadings, with all but the M2 fieldhaving had biosolids applied at some point in time.The ranking of cumulative trace metal loadings wasB2>>F2>F1=M1>B1>>M2. Because of this and thewide range of soil characteristics, it was not meaning-ful to regard the two fields representing each manage-ment pattern as experimental replicates. Overallloading rates were low, with maximum rates (FieldB2) only approximately 1 percent of USEPA Part 503cumulative limits. Of currently applied waste materi-als, dairy manure, and mixed dairy/ cheese waste hadlower concentrations of most analytes of concern (As,Cd, Cr, Mo, Ni, Pb, and Zn) than did the solid ormixed liquid biosolids.
Soil and Crop Analysis
Surface enrichment of soil trace elements due towaste applications was most evident for Mo, P (two tothree times greater than subsoil levels), and S (anorder of magnitude greater than subsoils). Significantsurface enrichment of calcium (all B and F treat-ments) was attributed to liming as well as elevatedCa contents of many wastes. No trends of concernwere evident in alfalfa hay analysis results, unsur-prising in view of relatively low trace element load-ings. All Cu/Mo ratios were greater than therecommended minimum 4:1 ratio.
Percolate Analysis
Most wick samplers collected greater than normalpercolation depths due to accumulation of waterresulting from lateral flow across the soil fragipan.The only exception was the M2 site where samplersaveraged 31.5 cm percolate depth, consistent withexpected percolation rates.
The B2 biosolids site had the greatest observedconcentrations for six of 13 analytes, followed by M2with five maximum concentrations. The greater soilacidity at site M2 contributed to the observed mobilityin percolate despite low to moderate soil concentra-tions. Percolate Cu exceeded the 8 µg/l ground waterstandard at four sites: M1, M2, B2, and F1. Sodiumexceeded the 20,000 µg/l standard on all M and Bfields, with concentrations up to 133,000 µg/l. Slightexceedences were observed for Pb (M1, M2, and F2) and Cd (M2). While not exceeding standards,
JOURNAL OF THE AMERICAN WATER RESOURCES ASSOCIATION 1039 JAWRA
ENVIRONMENTAL IMPACTS OF APPLYING MANURE, FERTILIZER, AND SEWAGE BIOSOLIDS ON A DAIRY FARM
TABLE 11. Total and Relative Element ExportFrom Watersheds 1 and 2 in April 2000.
WatershedComparisons
Stream Stream Q-NormedS1 S2 W2/W1 W2/W1
Fertilizer Biosolids Ratio Ratio
Area (ha) 253.0 248.4 0.98 –Mean Q (l/sec) 125.3 147.5 1.18 1.00
kg/ha/mo
Ca 22.17 34.00 1.53 1.30Cu 0.024 0.049 2.02 1.72Fe 0.306 0.290 0.95 0.81K 1.85 2.85 1.54 1.31Mg 4.09 5.83 1.43 1.21Mn 0.006 0.011 1.85 1.57Mo 0.014 0.108 7.65 6.50Na 7.07 19.78 2.80 2.38PO4-P 0.175 0.564 3.23 2.74Total P 0.337 0.705 2.09 1.77S 0.056 0.075 1.34 1.14Zn 0.036 0.052 1.46 1.24
TABLE 12. Percolate/Streamflow Concentration Ratiosfor Fertilizer (mean F1 and F2/Stream Site 1)
and Biosolids (B2/Stream Site 3).
Fertilizer BiosolidsElement (F1 and F2)/S1 B2/S3
As 1.6 5.8Ca 1.5 3.5Cd 1.6 1.1Cr 1.1 2.3Cu 2.2 2.2K 11.9 3.1Mg 2.0 3.4Mo 11.8 3.8Na 1.4 5.1Ni 1.2 3.3Pb 0.8 0.7S 1.4 3.8Zn 1.5 2.6

S levels in M2, B1, and B2 were substantially greaterthan other fields. In only four cases (As, Cr, Na, andNi) did the peak percolate concentration coincide withgreatest topsoil concentrations, all of which occurredwith the B2 site.
Surface Streamwater
Elements at manure only treatment Stream Sites 5and 7 were substantially elevated due to upstreambunker silo drainage, which was the most significantimpact noted in the study. However, this precludedevaluation of the streamwater from the manuredwatershed. For the other stream sites (1 through 4and 6), soluble As, Cd, and Pb were all close to theLDL. Site 6, representing biosolids plus manureapplication, tended to have the greatest measured sol-uble concentrations of all other elements, with sub-stantial exceedences for Na and P, and a slightexceedence for Cu.
All stream sites showed a steady increase in appar-ent response to the early April precipitation events.
There was no clear correlation of stream concentra-tions with biosolids applications. Intensive monitoringof Stream Sites S1 (fertilizer) and S2 (biosolids) inApril showed soluble ortho-P strongly correlated withstream discharge. Increases in Mo concentrationsfrom Site S2 treatment lagged large runoff events byabout five days.
Total exports of Cu, Na, soluble P (both ortho andtotal), and especially Mo were greater from the S2(biosolids) watershed than from the S1 (fertilizer)watershed; even when normalizing for equal dis-charge the S2 watershed exports for these analyteswere 1.7 to 6.5 times greater than S1.
Comparing Percolate and Surface StreamConcentrations
Percolate concentrations generally exceeded corre-sponding surface stream concentrations for the two treatments (fertilizer F1 and F2 wick samplersversus Stream Site 1, and sewage biosolids treatment B2 wick samplers versus Stream Site 3). Eight
JAWRA 1040 JOURNAL OF THE AMERICAN WATER RESOURCES ASSOCIATION
RICHARDS, SCHULTE, HEILIG, STEENHUIS, MCBRIDE, HARRISON, AND DICKSON
Figure 4. Mean Wick Sampler Percolate Concentrations Versus Corresponding Mean Grab Sample StreamflowConcentrations for Fertilizer Subwatershed (F1 and F2 versus Stream Site S1) and Biosolids Subwatershed
(B2 versus Stream Site S3). The error bars represent standard deviations of concentrations amongindividual wick samplers (vertical bars) and among streamwater grab samples (horizontal bars).

elements (As, Ca, Cr, Mg, Na, Ni, S, and Zn) hadgreater percolate/streamwater ratios for the biosolidstreatment than the fertilizer treatment.
General
This study documented some detectable waterquality impacts correlating with waste applicationpractices, but few were severe, nor were they limitedto one type of waste application. Some significantimpacts – such as sodium concentrations in runoffand percolate – were traceable to less documentedfood waste applications. The strongest signal notedwas the impact of bunker silo drainage on surfacestreamwater at several sites, which has been correct-ed by the farm.
It should be remembered that test fields had beenmanured for many years prior to the initiation ofbiosolids or food waste applications in the past twodecades. As with the biosolids fields, all manuredsites had available P in excess of crop requirements,with enrichment of other elements noted as well.
The most heavily loaded biosolids treatment site(B2) had the greatest number of maximum percolateand soil concentrations, as well as greater relativemobilization of elements to percolate when comparedto the fertilizer site. Nutrient export via streamwaterand percolate/streamwater concentration ratiosappeared to be greater. It is important to rememberthat the farm has used low loadings of clean sludges,resulting in maximum cumulative loadings on theorder of 1 percent of USEPA Part 503 cumulative lim-its. Observed results reported here cannot be extrapo-lated to the effects of greater cumulative loadings.
Percolate concentrations at manure Site M2 – withrelatively low overall trace element loadings – high-lighted the important role of soil pH on trace metalmobility. It is anticipated that mitigation of the soilacidity would reduce the observed percolate concen-trations. Ongoing changes in manure management atthe farm are intended to further reduce potentialwater quality impacts.
ACKNOWLEDGMENTS
The authors particularly acknowledge Phil Dickson, co-ownerand director of waste management operations at the study farm, forhis enthusiastic cooperation and active participation in this study,and we are grateful for the cooperation and assistance of manyother individuals at the farm.
This research was carried out by Arik Heilig and BrendanSchulte under the direction of principal investigators Steenhuis,McBride and Harrison. This research was funded by USDA GrantNo. 97-36200-5245.
LITERATURE CITED
Alloway, B.J. and A.P. Jackson, 1991. The Behaviour of Heavy Met-als in Sewage Sludge-Amended Soils. Sci. Tot. Env. 100:151-176.
APHA/AWWA/WEF, 1999. Standard Methods for the Examinationof Water and Wastewater (20th Edition). American PublicHealth Association, Washington D.C.
Barbarick, K.A., J.A. Ippolito, and D.G. Westfall, 1998. ExtractableTrace Elements in the Soil Profile After Years of Biosolids Appli-cation. J. Environ. Qual. 27:801-805.
Baveye, P., M.B. McBride, D.R. Bouldin, T.D. Hinesly, M.S.A. Dah-doh, and M.F. Abdel-Sabour, 1999. Mass Balance and Distribu-tion of Sludge-Borne Trace Elements in a Silt Loam FollowingLong-Term Applications of Sewage Sludge. Sci. Total Environ.227(1):13-28.
Boll, J., T.S. Steenhuis, and J.S. Selker, 1992. Fiberglass Wicks forSampling of Water and Solutes in the Vadose Zone. Soil Sci. Soc.Am. J. 56(3):701-707.
Dowdy, R.H., J.J. Latterell, T.D. Hinesly, R.B. Grussman, and D.L.Sullivan, 1991. Trace Metal Movement in an Aeric OchraqualfFollowing 14 Years of Annual Sludge Applications. J. Environ.Qual. 20:119-123.
Elliott, H.A., G.A. O’Connor, and S. Brinton, 2002. PhosphorusLeaching From Biosolids-Amended Soils. J. Environ. Qual.31:681-689.
Grey, M. and C. Henry, 2002. Phosphorus and Nitrogen RunoffFrom a Forested Watershed Fertilized With Biosolids. J. Envi-ron. Qual. 31:926-936.
Hale, R.C. and M.J. LaGuardia, 2002. Synthetic Organic Pollutantsin Land-Applied Sewage Sludges. Directions in Science 1:10-13.
Hart, J.B. Jr. and P.V. Nguyen, 1994. Soil, Groundwater and PlantResources in Sludge-Treated Bigtooth Aspen Sapling Ecosys-tems. J. Environ. Qual. 23:1257-1264.
Hunter, C., J. Perkins, J. Tranter, and P. Hardwick, 2000. FecalBacteria in the Waters of an Upland Area in Derbyshire, Eng-land: The Influence of Agricultural Land Use. J. Environ. Qual.29:1253-1261.
Krogmann, U., L.S. Boyles, W.J. Bamka, S. Chaipraprat, and C.J.Martel, 1999. Biosolids and Sludge Management. Water Envi-ron. Res. 71:692-714.
Krogmann, U., L.S. Boyles, C.J. Martel, and K.C. McComas, 1997.Biosolids and Sludge Management. Water Env. Res. 69(4):534-550.
Krogmann, U., M. Qu, L.S. Boyles, and C.J. Martel, 1998. Biosolidsand Sludge Management. Water Env. Res. 70(4):557-580.
Maguire, R.O., J.T. Sims, and F.J. Coale, 2000. Phosphorus Solubil-ity in Biosolids-Amended Farm Soils in the Mid-Atlantic Regionof the USA. J. Environ. Qual. 29:1225-1233.
McBride, M.B., B.K. Richards, T.S. Steenhuis, and G. Spiers, 1999.Long-Term Leaching of Trace Elements in a Heavily Sludge-Amended Silty Clay Loam Soil. Soil Science 164:612-613.
McBride, M.B., B.K. Richards, T.S. Steenhuis, and G. Spiers, 2000.Molybdenum Uptake by Forage Crops Grown on SewageSludge-Amended Soils in the Field and Greenhouse. Journal ofEnvironmental Quality 29:848-854.
McBride, M.B. and G. Spiers, 2001. Trace Element Content ofSelected Fertilizers and Dairy Manures as Determined by ICP-MS. Communications in Soil Science and Plant Analysis 32:139-156.
McFarland, A.M.S. and L.M. Hauck, 1999. Relating AgriculturalLand Uses to In-Stream Stormwater Quality. J. Environ. Qual.28:836-844.
McGuire, P.E., B. Lowery, and P.A. Helmke, 1992. Potential Sam-pling Error: Trace Metal Adsorption on Vacuum Porous CupSamplers. Soil Sci. Am. J. 56(1):74-82.
JOURNAL OF THE AMERICAN WATER RESOURCES ASSOCIATION 1041 JAWRA
ENVIRONMENTAL IMPACTS OF APPLYING MANURE, FERTILIZER, AND SEWAGE BIOSOLIDS ON A DAIRY FARM

National Research Council, 2002. Biosolids Applied to Land:Advancing Standards and Practices. National Academy Press,Washington D.C.
Page, G.W., 1981. Comparison of Groundwater and Surface Waterfor Patterns and Levels of Contamination by Toxic Substances.Environ. Sci. Tech. 15(12):1475-1481.
Penn, C.J. and J.T. Sims, 2002. Phosphorus Forms in Biosolids-Amended Soils and Losses in Runoff. J. Environ. Qual. 31:1349-1361.
Randall, G.W., T.K. Iragavapuru, and M.A. Schmitt, 2000. NutrientLosses in Subsurface Drainage Water From Dairy Manure andUrea Applied for Corn. J. Environ. Qual. 29:1244-1252
Raven, K.P. and R.H. Loeppert, 1997. Trace Element Compositionof Fertilizers and Soil Amendments. J. Environ. Qual. 26:551-557.
Richards, B.K., T.S. Steenhuis, J.H. Peverly, and M.B. McBride,1998. Metal Mobility at an Old, Heavily-Loaded Sludge Applica-tion Site. Environmental Pollution 99:365-377.
Richards, B.K., T.S. Steenhuis, J.H. Peverly, and M.B. McBride,2000. Effect of Sludge Processing Mode, Soil Texture and SoilpH on Metal Mobility in Undisturbed Soil Columns UnderAccelerated Loading. Environmental Pollution 109:327-346.
Siddique, M.T., J.S. Robinson, and B.J. Alloway, 2000. PhosphorusReactions and Leaching Potential in Soils Amended WithSewage Sludge. J. Environ. Qual. 29:1931-1938.
Sims, J.T., R.R. Simard, and B.C. Joern, 1998. Phosphorus Loss inAgricultural Drainage: Historical Perspective and CurrentResearch. J. Environ. Qual. 27:277-293.
Sloan, J.J., R.H. Dowdy, and M.S. Dolan, 1998. Recovery ofBiosolids-Applied Heavy Metals Sixteen Years After Applica-tion. J. Environ. Qual. 27:1312-1317.
Stehouwer, R.C., A.M. Wolf, and W.T. Doty, 2000. Chemical Moni-toring of Sewage Sludge in Pennsylvania: Variability and Appli-cation Uncertainty. J. Environ. Qual. 29:1686-1695.
USDA-NRCS (U.S. Department of Agriculture-Natural ResourcesConservation Service), 2001. Official Soil Series Descriptions.U.S. Department of Agriculture, Natural Resources Conserva-tion Service, Soil Survey Division. Available at: http://soils.usda.gov/technical/classification/osd/index.html. Accessed in March2001.
USDA-SCS (U.S. Department of Agriculture-Soil Conservation Ser-vice), 1978. Soil Survey of Steuben County, New York. NationalCooperative Soil Survey, U.S. Department of Agriculture-SoilConservation Service, Washington, D.C.
USEPA (U.S. Environmental Protection Agency), 1993. CleanWater Act. Section 503. Vol. 58, No. 32 (40 CFR Part 503).USEPA, Washington, D.C.
Wenzel, W.W., R. S. Sletten, A. Brandstetter, G. Wieshammer, andG. Stingeder. 1997. Adsorption of Trace Metals by TensionLysimeters: Nylon Membrane vs. Porous Ceramic Cup. J. Envi-ron. Qual. 26:1430-1434.
JAWRA 1042 JOURNAL OF THE AMERICAN WATER RESOURCES ASSOCIATION
RICHARDS, SCHULTE, HEILIG, STEENHUIS, MCBRIDE, HARRISON, AND DICKSON