environmental health survey - ndsu (see appendix at the back of the report for the survey...
TRANSCRIPT
Environmental Health Surveyfor Central and Western Minnesota:June 2007 Survey Results
Detailed results of the 2007 Collaborative Assessment for Eight Central and Western Minnesota Counties presenting attitudes and perceptions regarding environmental health and emergency preparedness issues.
Issued September 2007
Prepared for:Eight Central and Western Counties in Minnesota:ClayDouglasGrantOtter TailPopeStevensTraverseWilkin
Prepared by: North Dakota State Data Centerat North Dakota State University, an Equal Opportunity Institution
Jordyn NikleKay SchwarzwalterRamona DanielsonKendra EricksonRichard Rathge, Director
Available online at:http://www.ndsu.edu/sdc/publications.htm
North Dakota State Data CenterNorth Dakota State UniversityIACC Building, Room 424PO Box 5636Fargo, ND 58105

Environmental Health Survey for Central and Western Minnesota: June 2007 Survey Results 2
Environmental Health Survey for Central and Western Minnesota: June 2007 Survey Results
3
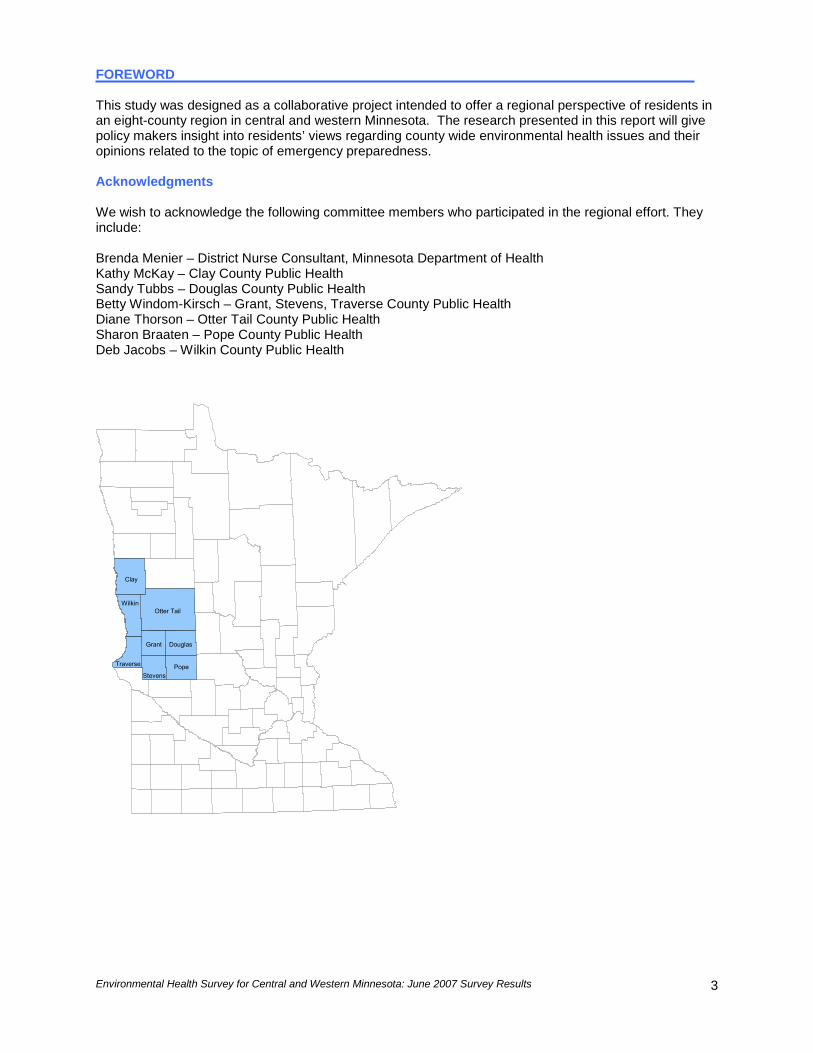
FOREWORD This study was designed as a collaborative project intended to offer a regional perspective of residents in an eight-county region in central and western Minnesota. The research presented in this report will give policy makers insight into residents’ views regarding county wide environmental health issues and their opinions related to the topic of emergency preparedness. Acknowledgments We wish to acknowledge the following committee members who participated in the regional effort. They include: Brenda Menier – District Nurse Consultant, Minnesota Department of Health Kathy McKay – Clay County Public Health Sandy Tubbs – Douglas County Public Health Betty Windom-Kirsch – Grant, Stevens, Traverse County Public Health Diane Thorson – Otter Tail County Public Health Sharon Braaten – Pope County Public Health Deb Jacobs – Wilkin County Public Health
����������
��
�� �
������
����� �������
���������������
Environmental Health Survey for Central and Western Minnesota: June 2007 Survey Results 4
TABLE OF CONTENTS Foreword .......................................................................................................................................................3 Acknowledgments...................................................................................................................................3 Introduction....................................................................................................................................................7 Study Objectives .....................................................................................................................................7 Methodology............................................................................................................................................7 Executive Summary..................................................................................................................................8-11 SURVEY RESULTS ...............................................................................................................................12-49 Outdoor Air Quality .................................................................................................................................13-15 Figure 1. Degree that environmental health factors relating to OUTDOOR AIR QUALITY are considered a problem..................................................................................................13 Figure 2. Of respondents who said there are OUTDOOR AIR QUALITY factors they consider a problem, level of priority in addressing each problem .....................................14 Figure 3. Of respondents who said there are OUTDOOR AIR QUALITY factors they consider a problem, extent that factors have affected a household member’s health.................................................................................................................................15 Indoor Environmental Quality .................................................................................................................16-18 Figure 4. Degree that environmental health factors relating to INDOOR ENVIRONMENTAL QUALITY are considered a problem .................................................16 Figure 5. Of respondents who said there are INDOOR ENVIRONMENTAL QUALITY factors they consider a problem, level of priority in addressing each problem .................17 Figure 6. Of respondents who said there are INDOOR ENVIRONMENTAL QUALITY factors they consider a problem, extent that factors have affected a household member’s health ................................................................................................................18 Public Health Nuisances.........................................................................................................................19-23 Figure 7. Degree that environmental health factors relating to PUBLIC HEALTH NUISANCES are considered a problem ...........................................................................19 Figure 8. Of respondents who said there are PUBLIC HEALTH NUISANCES they consider a problem, level of priority in addressing each problem .....................................20 Figure 9. Of respondents who said there are PUBLIC HEALTH NUISANCES they consider a problem, extent that factors have affected a household member’s health .................................................................................................................................21 Figure 10. Whether respondent’s community has a collection site for household hazardous waste ...............................................................................................................22 Figure 11. Of respondents who said their community has a collection site for household hazardous waste, whether the hours are convenient........................................................22 Figure 12. Of respondents who said their community has a collection site for household hazardous waste, how often respondent disposes of household hazardous waste at the collection site ...........................................................................................................23
Environmental Health Survey for Central and Western Minnesota: June 2007 Survey Results
5
TABLE OF CONTENTS (Continued) Recreational Water.................................................................................................................................24-26 Figure 13. Degree that environmental health factors relating to RECREATIONAL WATER are
considered a problem ........................................................................................................24 Figure 14. Of respondents who said there are RECREATIONAL WATER issues they consider a problem, level of priority in addressing each problem....................................................25 Figure 15. Of respondents who said there are RECREATIONAL WATER issues they consider a problem, extent that issues have affected a household member’s health .....................26 Drinking Water........................................................................................................................................27-29 Figure 16. Degree that environmental health factors relating to DRINKING WATER are considered a problem ........................................................................................................27 Figure 17. Of respondents who said there are DRINKING WATER issues they consider a problem, level of priority in addressing each problem....................................................28 Figure 18. Of respondents who said there are DRINKING WATER issues they consider a problem, extent that issues have affected a household member’s health .....................29 Food Protection ......................................................................................................................................30-32 Figure 19. Degree that FOOD HEALTH AND SAFETY STANDARDS are addressed......................30 Figure 20. Of respondents who said FOOD HEALTH AND SAFETY STANDARDS are not well addressed, level of priority in addressing poor health and safety standards.............31 Figure 21. Of respondents who said FOOD HEALTH AND SAFETY STANDARDS are not well addressed, extent that poor health and safety standards have affected a household member’s health ..............................................................................................32 Comparison of Environmental Health Issues .........................................................................................33-35 Table 1. Degree that all environmental health issues are considered a problem ...........................33 Table 2. Degree that food protection areas are addressed.............................................................33 Table 3. Of respondents who said there are environmental health issues they consider a problem (or that are not well addressed), percent of respondents who see each problem as a HIGH priority................................................................................................34 Table 4. Of respondents who said there are environmental health issues they consider a problem (or that are not well addressed), extent that issues have affected a household member’s health ..............................................................................................35 Emergency Preparedness......................................................................................................................36-44 Figure 22. Degree that respondent is worried about various THREATENING EMERGENCIES OR DISASTERS................................................................................................................36 Figure 23. In the event of a threatening emergency or disaster, ways respondent would be alerted to, or get information about, the emergency or disaster .......................................37 Figure 24. Respondent’s degree of confidence that their community or area can respond to a large-scale disaster or emergency .................................................................................38 Figure 25. Level of preparedness of respondent’s household in the event of an emergency or disaster..........................................................................................................................39 Figure 26. Of respondents who are not well prepared for an emergency or disaster, likelihood of respondent taking necessary steps, within the next three months, to prepare for an emergency or disaster..................................................................................................40 Figure 27. Of respondents who are not well prepared and not likely to prepare for an emergency or disaster within the next three months, barriers preventing respondent from taking the necessary steps to do so..........................................................................41
Environmental Health Survey for Central and Western Minnesota: June 2007 Survey Results 6
TABLE OF CONTENTS (Continued)
Figure 28. Of respondents who are not well prepared and not likely to prepare for an emergency or disaster within the next three months, likelihood of overcoming barriers to preparing for an emergency or disaster ...........................................................42 Figure 29. Extent that opinions of family members or friends, emergency personnel, and information from the media influence respondent’s decision about emergency preparedness.....................................................................................................................43 Figure 30. Respondent’s opinion regarding the likelihood that an emergency or natural disaster will occur in respondent’s community................................................................................44 Demographics ........................................................................................................................................45-49 Figure 31. Age of respondent .............................................................................................................45 Figure 32. Education of respondent ...................................................................................................45 Figure 33. Annual household income of respondent before taxes.....................................................46 Figure 34. Whether respondent lives inside or outside city limits.......................................................46 Figure 35. Household size of respondent...........................................................................................47 Figure 36. Whether there are children younger than 18 living in respondent’s household ................47 Figure 37. Gender of respondent .......................................................................................................48 Figure 38. Ways that organizations can provide respondent with educational material and information about environmental health problems and disaster preparedness ................49 APPENDIX TABLES...............................................................................................................................50-93 SURVEY INSTRUMENT ......................................................................................................................94-109

Environmental Health Survey for Central and Western Minnesota: June 2007 Survey Results
7
INTRODUCTION Study Objectives The objective of this study was to gather information from residents in an eight-county region in Minnesota regarding environmental health issues and emergency preparedness in the event of a threatening emergency or disaster. Additional objectives include determining which environmental factor poses the greatest risk, how this perceived risk should be addressed, and finding the best way to provide environmental risk information to the public. Methodology A generalizable survey was conducted in June 2007 of residents in the following eight Minnesota counties: Clay, Douglas, Grant, Otter Tail, Pope, Stevens, Traverse, and Wilkin. The survey was developed in cooperation with county public health representatives from the eight counties and the North Dakota State Data Center. The survey contained 26 questions and took, on average, 15 minutes to complete (see Appendix at the back of the report for the survey instrument). A telephone survey of 606 randomly selected households was conducted in the eight Minnesota counties of Clay, Douglas, Grant, Otter Tail, Pope, Stevens, Traverse, and Wilkin in June of 2007. A random sampling design was used to ensure a representative sample of respondents within the overall region with an error rate of 4 percent and a confidence level of 95 percent. The sample also was designed to allow for independent analysis for each of the eight counties. However, in order to keep the costs of data collection manageable, a sample size of approximately 75 respondents from each county was used resulting in an error rate below 10 percent and a confidence level of 90 percent. The overall response rate for the survey was 56 percent. Response rates for telephone interviewing typically range from 50 to 60 percent given the proliferation of telemarketing in recent years, and the advent of answering machines, caller identification systems, and other screening devices. Bad or disconnected numbers and hang-ups were not factored into the calculations. Interviewers came from a pool of trained surveyors and were supervised by Data Center staff. Approval from the Institutional Review Board (IRB) at North Dakota State University was obtained to ensure that proper protocol was used and the rights of human subjects maintained. The survey consisted of questions that focus on five broad areas of environmental health issues: 1) air quality, 2) public health nuisances, 3) household hazardous waste, 4) water, and 5) food protection. In addition, a series of questions focused on resident’s opinions about emergency preparedness. The number of respondents (N) who answered each question is provided for each figure and appendix table. “DNK” refers to situations in which the respondent answered a question as “do not know.”

Environmental Health Survey for Central and Western Minnesota: June 2007 Survey Results 8
EXECUTIVE SUMMARY Outdoor Air Quality • Overall, respondents indicated that the various outdoor air quality factors (i.e., agricultural dust and
burning, transportation emissions or exhaust, industry fumes, lagoon odor, livestock and feedlot odor, stoves and fireplaces, and outdoor fire pits, campfires, and fireplaces) are not very problematic. Agricultural dust and burning, transportation emissions or exhaust, and industry fumes are rated the most problematic, on average, followed by lagoon odor and livestock and feedlot odor.
• Of respondents who indicated various outdoor air quality factors are problematic:
o Half of respondents indicated that industry fumes, lagoon odor, transportation emissions or exhaust, and livestock or feedlot odor are high priorities.
o Respondents indicated that agricultural dust and burning have affected a household member’s
health the most, followed by stoves and fireplaces. Indoor Environmental Quality • Overall, respondents indicated that the various indoor environmental quality factors (i.e.,
environmental tobacco smoke, mold, asbestos, carbon monoxide, radon, and lead) are not very problematic. Environmental tobacco smoke and mold are considered more problematic than the other factors.
• Of respondents who indicated environmental quality factors are problematic:
o The majority of respondents indicated all indoor issues (i.e., environmental tobacco smoke, carbon monoxide, lead, asbestos, mold, and radon) are a high priority.
o Respondents indicated that environmental tobacco smoke and mold have affected a household
member’s health the most. Public Health Nuisances • Among the various public health nuisances (i.e., mosquitoes and other insects, meth labs,
garbage/junk houses, improper disposal of waste, animals/rodents, and illegal/open dumps), mosquitoes and meth labs are considered the most problematic.
• Of respondents who indicated various public health nuisances are problematic:
o The majority of respondents indicated that meth labs, improper disposal of hazardous waste, illegal/open dumps, mosquitoes and other insects, and garbage/junk houses are a high priority.
o Respondents indicated public health nuisances have not had much of an impact on a household
member’s health. • Overall, the vast majority of respondents indicated their community has a collection site for household
hazardous waste.
• Of respondents who indicated their community has a collection site for household hazardous waste:
o The vast majority indicated the hours are convenient. o Half of respondents dispose of household hazardous waste at that site at least some of the time,
while four in 10 respondents dispose of waste at that site all of the time.

Environmental Health Survey for Central and Western Minnesota: June 2007 Survey Results
9
EXECUTIVE SUMMARY (Continued) Recreational Water • Overall, respondents indicated that the various recreational water issues (i.e., agricultural runoff,
fertilizer runoff, industry runoff, improper sewage disposal, overuse of recreational water by campers and boaters, lakes and swimming beaches, and public pools and spas) are not very problematic. Agricultural runoff and fertilizer runoff are considered the most problematic.
• Of respondents who indicated various recreational water issues are problematic:
o The majority of respondents indicated agricultural runoff, lakes and swimming beaches, industry runoff, improper sewage disposal, and fertilizer runoff are a high priority.
o Respondents indicated recreational water issues have not had much of an impact on a household
member’s health.
Drinking Water • Overall, respondents indicated that the various drinking water issues (i.e., abandoned wells that are
not sealed, contaminated PUBLIC drinking water, and contaminated PRIVATE drinking water) are not very problematic.
• Of respondents who indicated various drinking water issues are problematic:
o The majority of respondents indicated all drinking water issues are a high priority. o Respondents indicated drinking water issues have not had much of an impact on a household
member’s health. Food Protection • Overall, respondents indicated that food and safety standards for grocery and convenience stores,
delis, and meat markets; food in restaurants and bars; and community events are well addressed. • Of respondents who indicated various food and safety standards are NOT well addressed:
o Half of respondents indicated food in grocery and convenience stores, delis, and meat markets and in restaurants and bars is a high priority. Four in 10 respondents indicated food prepared for and served at community events is a high priority.
o Respondents indicated that poor food and safety standards have not had much of an impact on a
household member’s health; poor standards for restaurants and bars have had a larger impact on a household member’s health than poor standards for grocery stores and community events.
Comparison of Environmental Health Issues • On average, mosquitoes and other insects are considered the most problematic environmental health
issue, followed by meth labs. Agricultural runoff and environmental tobacco smoke are considered the next most problematic overall.

Environmental Health Survey for Central and Western Minnesota: June 2007 Survey Results 10
EXECUTIVE SUMMARY (Continued) • Of respondents who said that various environmental health issues are problematic:
o Meth labs are considered problematic, on average, and they are rated as a high priority by the vast majority of respondents who see them as a problem. Though contaminated PUBLIC drinking water and contaminated PRIVATE drinking water do not rate as big problems, on average, more than three-fourths of respondents who see them as problematic said they are a high priority. Environmental tobacco smoke is also considered a high priority by three-fourths of respondents who see it as a problem.
o On average, environmental tobacco smoke, which is considered problematic and is considered a
high priority, has affected the health of a household member the most out of all the environmental health issues. Mold and agricultural dust and burning have had the next greatest effects on the health of a household member. Food in restaurants and bars is considered to be fairly well addressed and less than half of respondents who said it is not well addressed rate it as a high priority. However, it has had the next greatest effect on the health of a household member. Meth labs, which are considered to be among the most problematic and among the highest priority of the environmental health issues, have not had much of an effect on a household member’s health.
Emergency Preparedness • Overall, respondents indicated that they are not very worried about the various threatening
emergencies or disasters (i.e., natural disasters, disease outbreak, terrorism, household emergencies, and chemical spills).
• The majority of respondents indicated that in the event of a threatening emergency or disaster, they
would be alerted to, or get information about, the emergency or disaster mostly through television, followed by battery-operated radio, word of mouth by neighbors, and sirens.
• On average, respondents are confident that their community or area can respond to a large-scale
disaster or emergency; one-fourth are very confident. • On average, respondents indicated that their household is moderately prepared in the event of an
emergency or disaster; one in 10 respondents indicated they are very prepared, while a similar proportion indicated they are not at all prepared.
• Of respondents who are NOT well prepared for an emergency or disaster:
o On average, they are not very likely to take necessary steps to prepare in the next three months; however, one in 10 indicated they are very likely to take the necessary steps.
• Of respondents who are NOT well prepared for an emergency or disaster and are NOT likely to
prepare for an emergency or disaster within the next three months:
o Three in 10 indicated that they have not had time to prepare and that they do not think it is important; two in 10 indicated they do not know how to put an emergency plan and supplies together.
o One-third indicated there are other barriers to preparing for an emergency or disaster, including
respondents who just didn’t think about it or who aren’t worried/scared enough about it.
o On average, they are moderately likely to overcome the barriers. One in 10 is very likely, while two in 10 are not at all likely to overcome the barriers.
• While the opinions of others (i.e., emergency personnel, media, and family members or friends)
moderately influence the respondent’s decision about emergency preparedness, emergency personnel are most influential overall.

Environmental Health Survey for Central and Western Minnesota: June 2007 Survey Results
11
EXECUTIVE SUMMARY (Continued) • On average, respondents indicated that an emergency or natural disaster occurring in their
community is unlikely; one-fourth indicated it is not at all likely. Demographics • Overall, one-third of respondents are 65 years of age or older; one in 10 are under the age of 35. • Overall, one-third of respondents are, at most, a high school graduate (or have a GED); one-third
have a college degree or additional education. • Overall, more than half of respondents have an annual household income of less than $50,000 before
taxes; four in 10 respondents have an income of $50,000 or more. • The majority of respondents live inside the city limits. • Half of respondents live in a two-person household, while one-third live in a household with three or
more people. • Overall, the majority of respondents do not have children younger than 18 living in their household. • The majority of respondents indicated television is the best way that organizations can provide
educational material and information about environmental health problems and disaster preparedness, followed by regular mail, local newspaper, radio, personal contact, community events, Internet, and email.
• Two-thirds of respondents are female.

Environmental Health Survey for Central and Western Minnesota: June 2007 Survey Results 12
SURVEY RESULTS
Environmental Health Survey for Central and Western Minnesota: June 2007 Survey Results
13
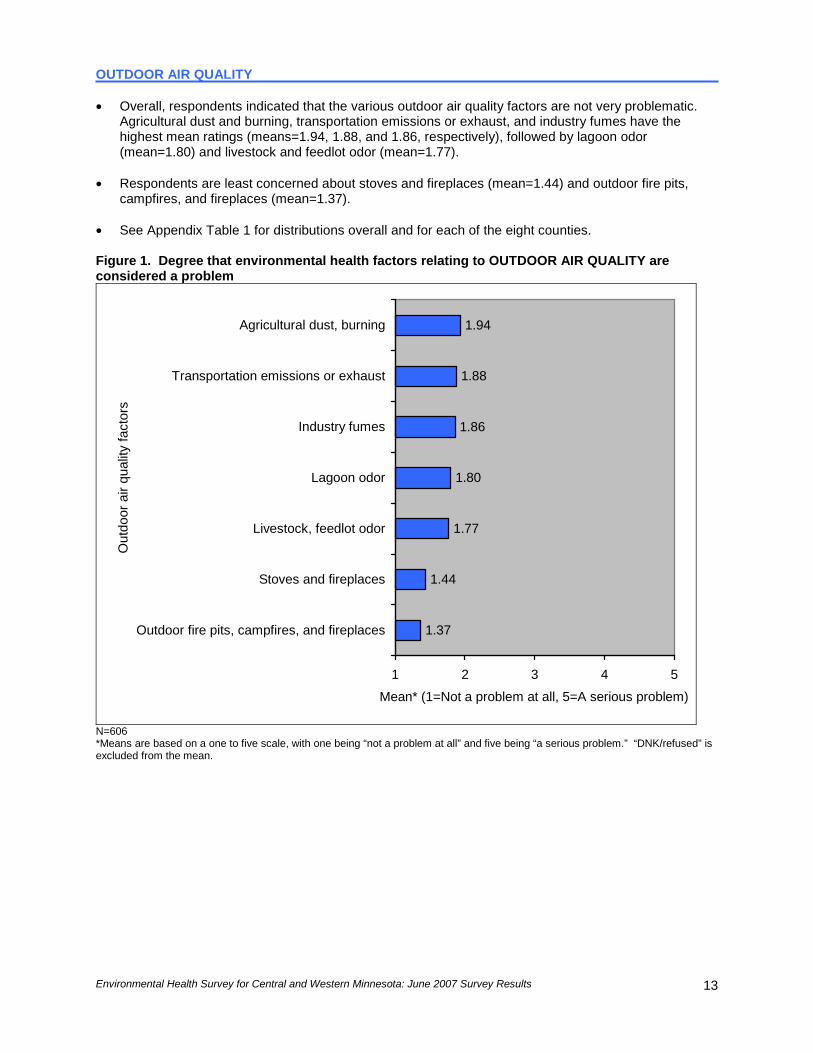
OUTDOOR AIR QUALITY • Overall, respondents indicated that the various outdoor air quality factors are not very problematic.
Agricultural dust and burning, transportation emissions or exhaust, and industry fumes have the highest mean ratings (means=1.94, 1.88, and 1.86, respectively), followed by lagoon odor (mean=1.80) and livestock and feedlot odor (mean=1.77).
• Respondents are least concerned about stoves and fireplaces (mean=1.44) and outdoor fire pits,
campfires, and fireplaces (mean=1.37). • See Appendix Table 1 for distributions overall and for each of the eight counties. Figure 1. Degree that environmental health factors relating to OUTDOOR AIR QUALITY are considered a problem
1.37
1.44
1.77
1.86
1.88
1.94
1.80
1 2 3 4 5
Outdoor fire pits, campfires, and fireplaces
Stoves and fireplaces
Livestock, feedlot odor
Lagoon odor
Industry fumes
Transportation emissions or exhaust
Agricultural dust, burning
Out
door
air
qual
ity fa
ctor
s
Mean* (1=Not a problem at all, 5=A serious problem)
N=606 *Means are based on a one to five scale, with one being “not a problem at all” and five being “a serious problem.” “DNK/refused” is excluded from the mean.
Environmental Health Survey for Central and Western Minnesota: June 2007 Survey Results 14
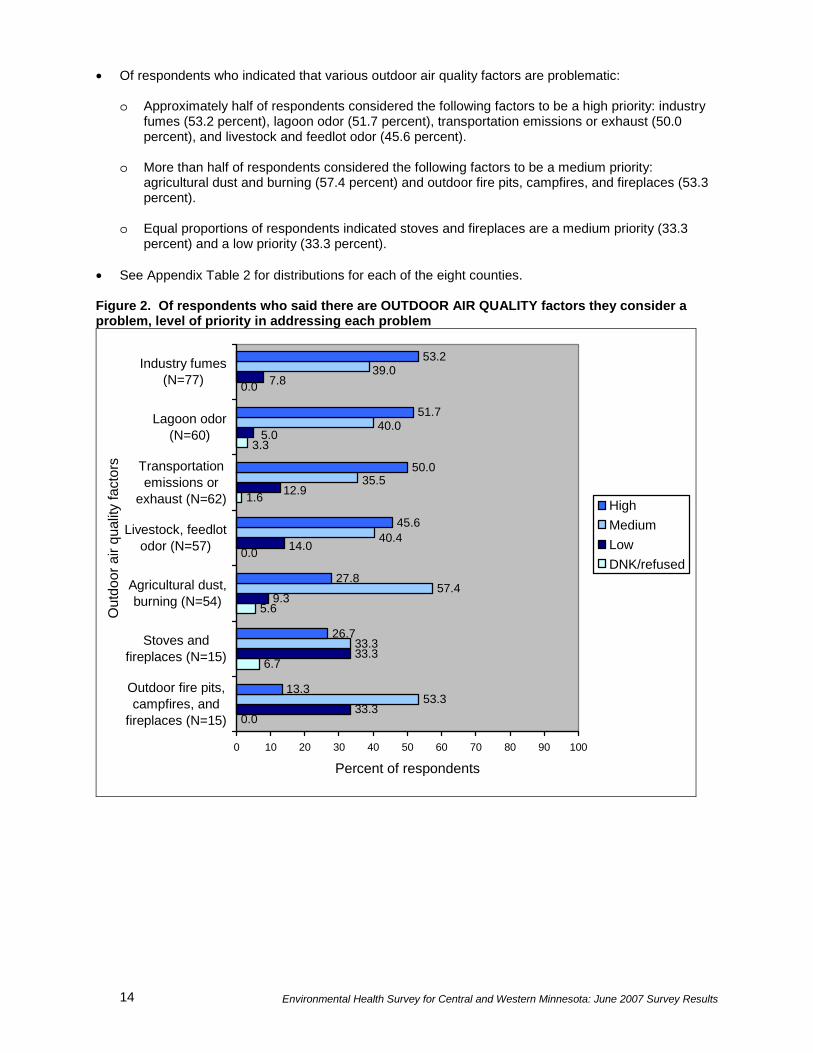
• Of respondents who indicated that various outdoor air quality factors are problematic:
o Approximately half of respondents considered the following factors to be a high priority: industry fumes (53.2 percent), lagoon odor (51.7 percent), transportation emissions or exhaust (50.0 percent), and livestock and feedlot odor (45.6 percent).
o More than half of respondents considered the following factors to be a medium priority:
agricultural dust and burning (57.4 percent) and outdoor fire pits, campfires, and fireplaces (53.3 percent).
o Equal proportions of respondents indicated stoves and fireplaces are a medium priority (33.3
percent) and a low priority (33.3 percent).
• See Appendix Table 2 for distributions for each of the eight counties. Figure 2. Of respondents who said there are OUTDOOR AIR QUALITY factors they consider a problem, level of priority in addressing each problem
0.0
6.7
5.6
0.0
1.6
0.0
33.3
33.3
9.3
53.3
33.3
57.4
13.3
26.7
27.8
51.7
53.2
3.3
14.0
12.9
5.0
7.8
40.4
35.5
40.0
39.0
45.6
50.0
0 10 20 30 40 50 60 70 80 90 100
Outdoor fire pits,campfires, and
fireplaces (N=15)
Stoves andfireplaces (N=15)
Agricultural dust,burning (N=54)
Livestock, feedlotodor (N=57)
Transportationemissions or
exhaust (N=62)
Lagoon odor(N=60)
Industry fumes(N=77)
Out
door
air
qual
ity fa
ctor
s
Percent of respondents
HighMediumLowDNK/refused
Environmental Health Survey for Central and Western Minnesota: June 2007 Survey Results
15
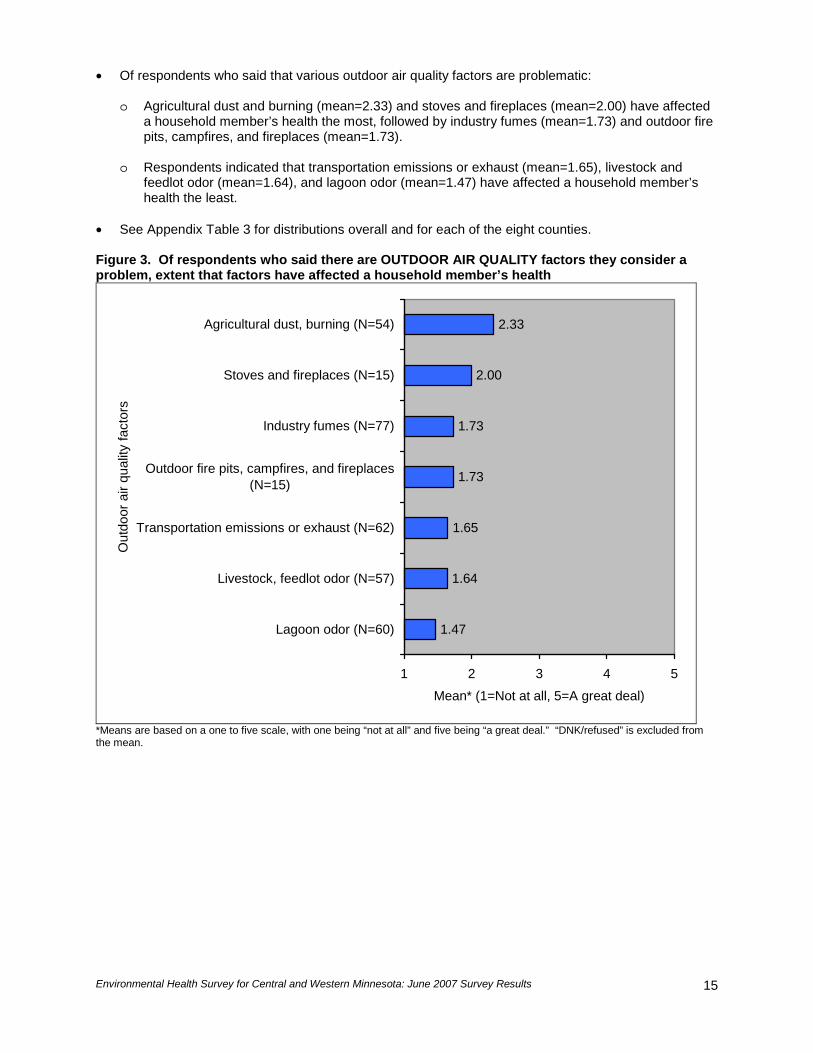
• Of respondents who said that various outdoor air quality factors are problematic: o Agricultural dust and burning (mean=2.33) and stoves and fireplaces (mean=2.00) have affected
a household member’s health the most, followed by industry fumes (mean=1.73) and outdoor fire pits, campfires, and fireplaces (mean=1.73).
o Respondents indicated that transportation emissions or exhaust (mean=1.65), livestock and
feedlot odor (mean=1.64), and lagoon odor (mean=1.47) have affected a household member’s health the least.
• See Appendix Table 3 for distributions overall and for each of the eight counties. Figure 3. Of respondents who said there are OUTDOOR AIR QUALITY factors they consider a problem, extent that factors have affected a household member’s health
1.47
1.64
1.65
1.73
1.73
2.33
2.00
1 2 3 4 5
Lagoon odor (N=60)
Livestock, feedlot odor (N=57)
Transportation emissions or exhaust (N=62)
Outdoor fire pits, campfires, and fireplaces(N=15)
Industry fumes (N=77)
Stoves and fireplaces (N=15)
Agricultural dust, burning (N=54)
Out
door
air
qual
ity fa
ctor
s
Mean* (1=Not at all, 5=A great deal)
*Means are based on a one to five scale, with one being “not at all” and five being “a great deal.” “DNK/refused” is excluded from the mean.
Environmental Health Survey for Central and Western Minnesota: June 2007 Survey Results 16
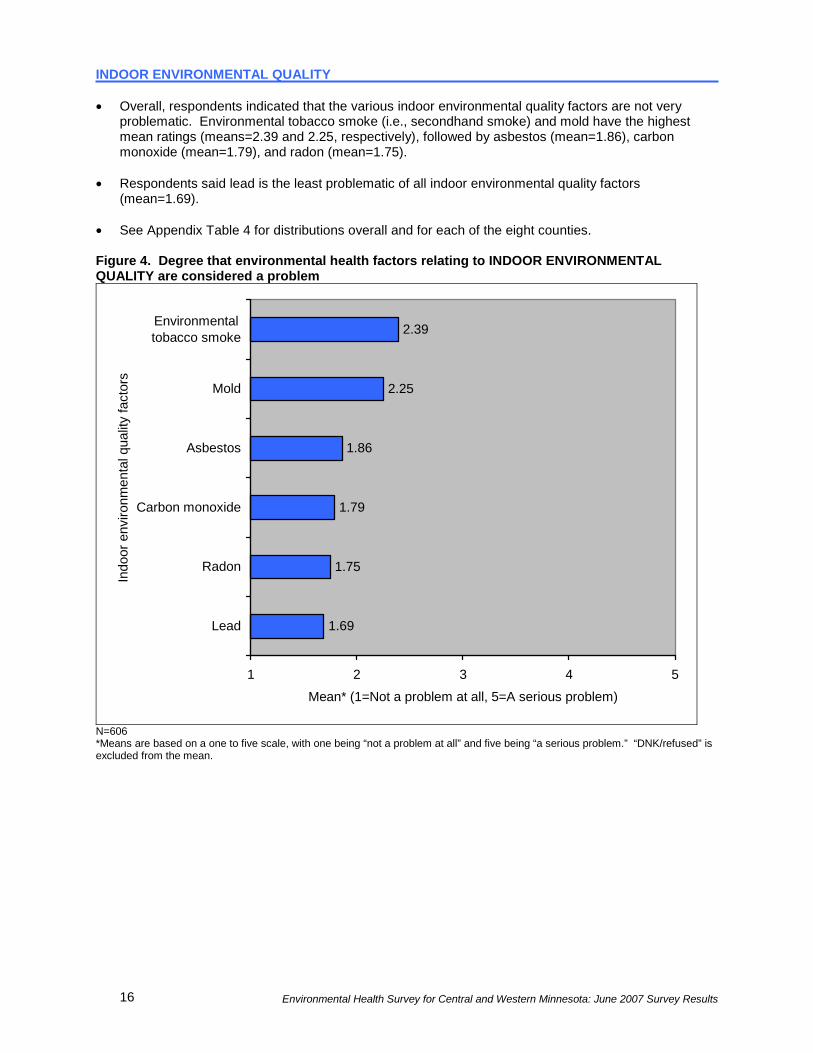
INDOOR ENVIRONMENTAL QUALITY • Overall, respondents indicated that the various indoor environmental quality factors are not very
problematic. Environmental tobacco smoke (i.e., secondhand smoke) and mold have the highest mean ratings (means=2.39 and 2.25, respectively), followed by asbestos (mean=1.86), carbon monoxide (mean=1.79), and radon (mean=1.75).
• Respondents said lead is the least problematic of all indoor environmental quality factors
(mean=1.69). • See Appendix Table 4 for distributions overall and for each of the eight counties. Figure 4. Degree that environmental health factors relating to INDOOR ENVIRONMENTAL QUALITY are considered a problem
1.69
1.75
1.79
1.86
2.25
2.39
1 2 3 4 5
Lead
Radon
Carbon monoxide
Asbestos
Mold
Environmentaltobacco smoke
Indo
or e
nviro
nmen
tal q
ualit
y fa
ctor
s
Mean* (1=Not a problem at all, 5=A serious problem)
N=606 *Means are based on a one to five scale, with one being “not a problem at all” and five being “a serious problem.” “DNK/refused” is excluded from the mean.
Environmental Health Survey for Central and Western Minnesota: June 2007 Survey Results
17
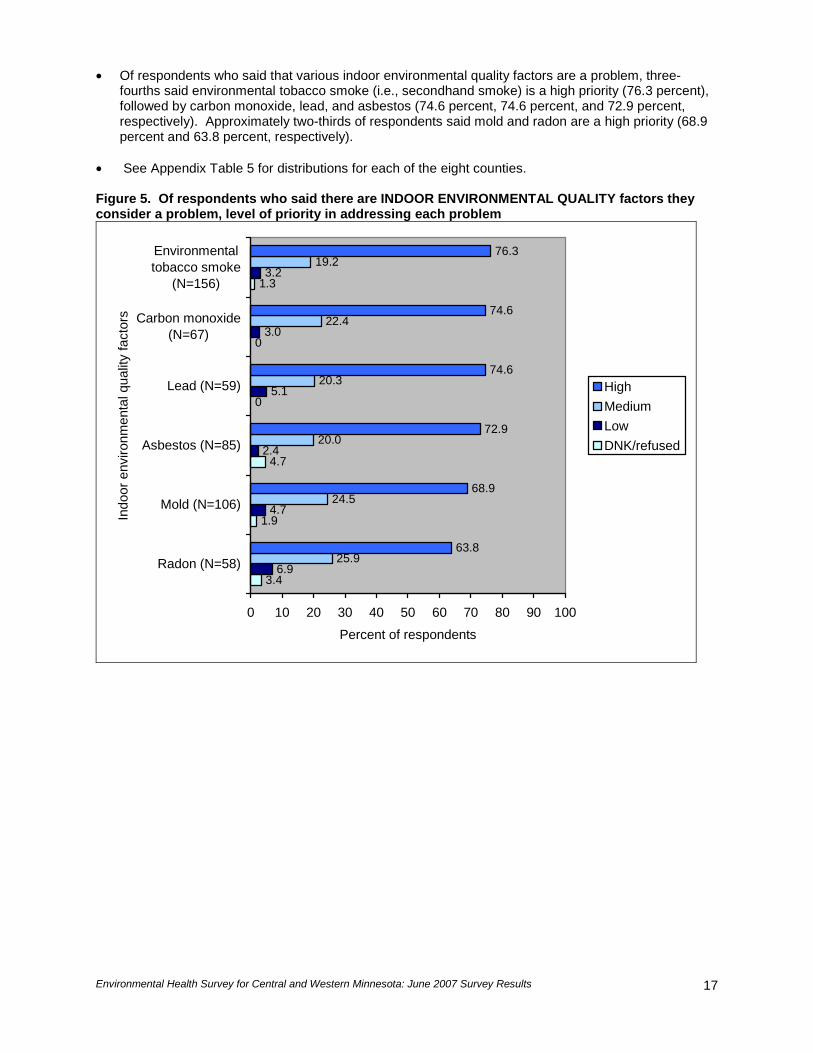
• Of respondents who said that various indoor environmental quality factors are a problem, three-fourths said environmental tobacco smoke (i.e., secondhand smoke) is a high priority (76.3 percent), followed by carbon monoxide, lead, and asbestos (74.6 percent, 74.6 percent, and 72.9 percent, respectively). Approximately two-thirds of respondents said mold and radon are a high priority (68.9 percent and 63.8 percent, respectively).
• See Appendix Table 5 for distributions for each of the eight counties. Figure 5. Of respondents who said there are INDOOR ENVIRONMENTAL QUALITY factors they consider a problem, level of priority in addressing each problem
3.4
1.9
4.7
0
0
1.3
6.9
4.7
2.4
5.1
3.2
25.9
24.5
20.3
22.4
19.2
63.8
68.9
72.9
74.6
74.6
76.3
3.0
20.0
0 10 20 30 40 50 60 70 80 90 100
Radon (N=58)
Mold (N=106)
Asbestos (N=85)
Lead (N=59)
Carbon monoxide(N=67)
Environmentaltobacco smoke
(N=156)
Indo
or e
nviro
nmen
tal q
ualit
y fa
ctor
s
Percent of respondents
HighMediumLowDNK/refused

Environmental Health Survey for Central and Western Minnesota: June 2007 Survey Results 18
• Of respondents who said that various indoor environmental quality factors are a problem: o Environmental tobacco smoke (i.e., secondhand smoke) and mold have affected a household
member’s health the most (means=2.45 and 2.34, respectively) followed by carbon monoxide (mean=1.57) and asbestos (mean=1.49).
o Respondents indicated that radon and lead have affected a household member’s health the least
(means=1.26 and 1.20, respectively). • See Appendix Table 6 for distributions overall and for each of the eight counties. Figure 6. Of respondents who said there are INDOOR ENVIRONMENTAL QUALITY factors they consider a problem, extent that factors have affected a household member’s health
1.26
1.49
1.57
2.34
2.45
1.20
1 2 3 4 5
Lead (N=59)
Radon (N=58)
Asbestos (N=85)
Carbon monoxide(N=67)
Mold (N=106)
Environmentaltobacco smoke
(N=156)
Indo
or e
nviro
nmen
tal q
ualit
y fa
ctor
s
Mean* (1=Not at all, 5=A great deal)
*Means are based on a one to five scale, with one being “not at all” and five being “a great deal.” “DNK/refused” is excluded from the mean.

Environmental Health Survey for Central and Western Minnesota: June 2007 Survey Results
19
PUBLIC HEALTH NUISANCES • Overall, respondents indicated that mosquitoes and other insects are the most problematic of the
public health nuisances (mean=3.35); 22.9 percent said they are a serious problem. Respondents also indicated that meth labs are somewhat problematic (mean=2.94); 23.3 percent indicated they are a serious problem.
• Respondents indicated that illegal/open dumps are the least problematic of the public health
nuisances (mean=1.57). • See Appendix Table 7 for distributions overall and for each of the eight counties. Figure 7. Degree that environmental health factors relating to PUBLIC HEALTH NUISANCES are considered a problem
1.57
1.77
1.91
1.96
2.94
3.35
1 2 3 4 5
Illegal/open dumps
Animals/rodents
Improper disposal ofhazardous waste
Garbage/junk houses
Meth labs
Mosquitoes and otherinsects
Publ
ic h
ealth
nui
sanc
es
Mean* (1=Not a problem at all, 5=A serious problem)
N=606 *Means are based on a one to five scale, with one being “not a problem at all” and five being “a serious problem.” “DNK/refused” is excluded from the mean.

Environmental Health Survey for Central and Western Minnesota: June 2007 Survey Results 20
• Of respondents who said that various public health nuisances are problematic, the vast majority indicated that meth labs are a high priority (90.7 percent), followed by improper disposal of hazardous waste (74.0 percent), illegal/open dumps (65.9 percent), mosquitoes and other insects (61.9 percent), and garbage/junk houses (61.2 percent). Equal proportions of respondents indicated that animals/rodents are a high priority (45.9 percent) and a medium priority (45.9 percent).
• See Appendix Table 8 for distributions for each of the eight counties. Figure 8. Of respondents who said there are PUBLIC HEALTH NUISANCES they consider a problem, level of priority in addressing each problem
2.7
1.5
1.1
4.9
1.3
0.5
5.4
10.4
7.5
9.8
5.2
1.9
45.9
26.9
29.4
19.5
19.5
45.9
61.2
61.9
65.9
90.77.0
74.0
0 10 20 30 40 50 60 70 80 90 100
Animals/rodents(N=37)
Garbage/junkhouses (N=67)
Mosquitoes andother insects
(N=265)
Illegal/open dumps(N=41)
Improper disposalof hazardouswaste (N=77)
Meth labs (N=214)
Publ
ic h
ealth
nui
sanc
es
Percent of respondents
HighMediumLowDNK/refused
Environmental Health Survey for Central and Western Minnesota: June 2007 Survey Results
21
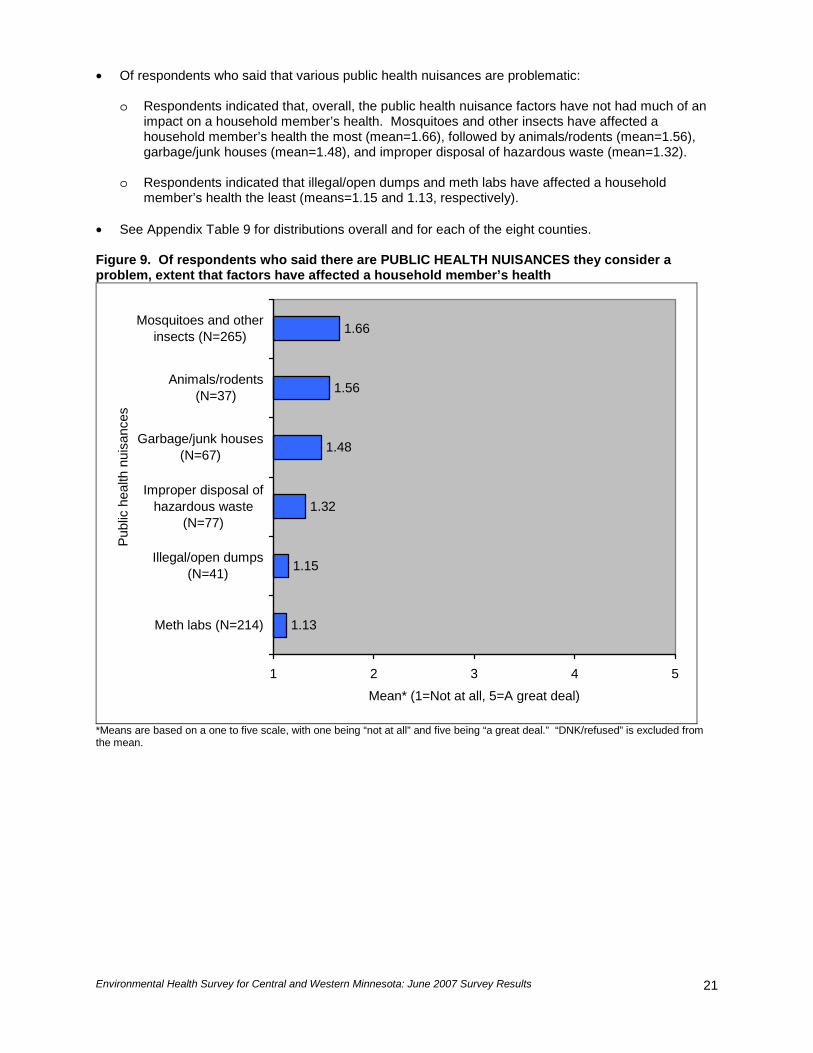
• Of respondents who said that various public health nuisances are problematic:
o Respondents indicated that, overall, the public health nuisance factors have not had much of an impact on a household member’s health. Mosquitoes and other insects have affected a household member’s health the most (mean=1.66), followed by animals/rodents (mean=1.56), garbage/junk houses (mean=1.48), and improper disposal of hazardous waste (mean=1.32).
o Respondents indicated that illegal/open dumps and meth labs have affected a household
member’s health the least (means=1.15 and 1.13, respectively). • See Appendix Table 9 for distributions overall and for each of the eight counties. Figure 9. Of respondents who said there are PUBLIC HEALTH NUISANCES they consider a problem, extent that factors have affected a household member’s health
1.13
1.15
1.32
1.48
1.56
1.66
1 2 3 4 5
Meth labs (N=214)
Illegal/open dumps(N=41)
Improper disposal ofhazardous waste
(N=77)
Garbage/junk houses(N=67)
Animals/rodents(N=37)
Mosquitoes and otherinsects (N=265)
Publ
ic h
ealth
nui
sanc
es
Mean* (1=Not at all, 5=A great deal)
*Means are based on a one to five scale, with one being “not at all” and five being “a great deal.” “DNK/refused” is excluded from the mean.
Environmental Health Survey for Central and Western Minnesota: June 2007 Survey Results 22
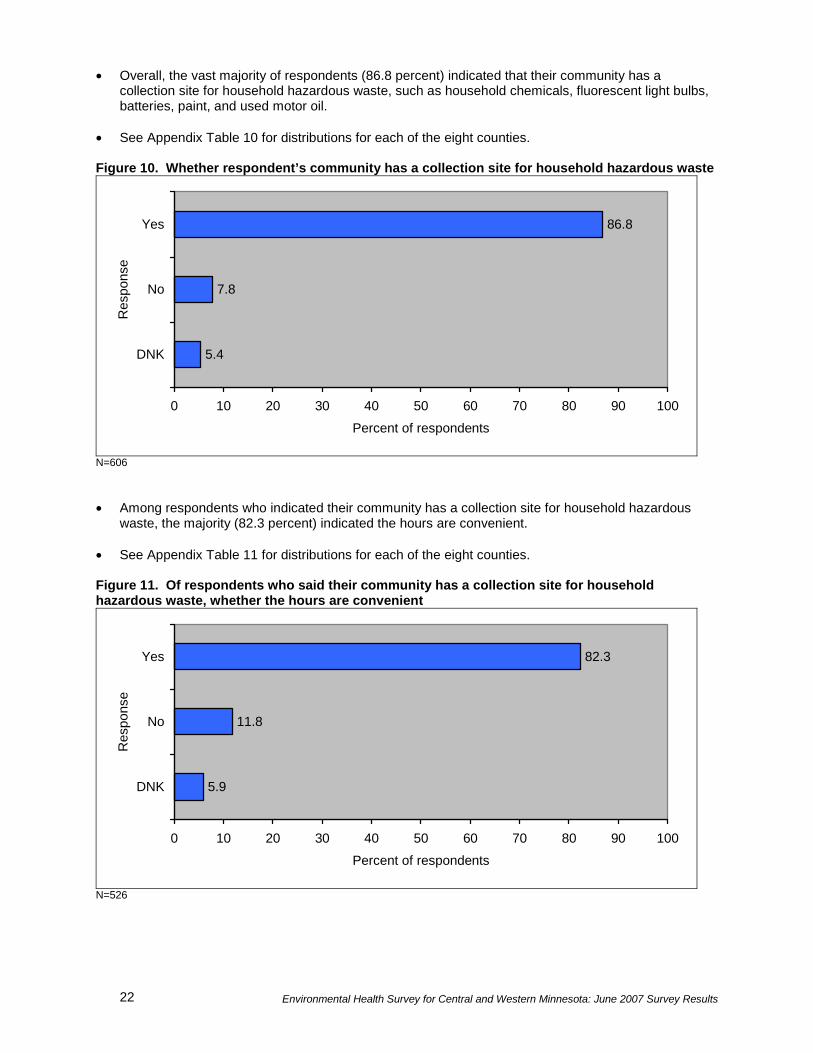
• Overall, the vast majority of respondents (86.8 percent) indicated that their community has a collection site for household hazardous waste, such as household chemicals, fluorescent light bulbs, batteries, paint, and used motor oil.
• See Appendix Table 10 for distributions for each of the eight counties. Figure 10. Whether respondent’s community has a collection site for household hazardous waste
5.4
7.8
86.8
0 10 20 30 40 50 60 70 80 90 100
DNK
No
Yes
Res
pons
e
Percent of respondents
N=606 • Among respondents who indicated their community has a collection site for household hazardous
waste, the majority (82.3 percent) indicated the hours are convenient. • See Appendix Table 11 for distributions for each of the eight counties. Figure 11. Of respondents who said their community has a collection site for household hazardous waste, whether the hours are convenient
5.9
11.8
82.3
0 10 20 30 40 50 60 70 80 90 100
DNK
No
Yes
Res
pons
e
Percent of respondents
N=526
Environmental Health Survey for Central and Western Minnesota: June 2007 Survey Results
23
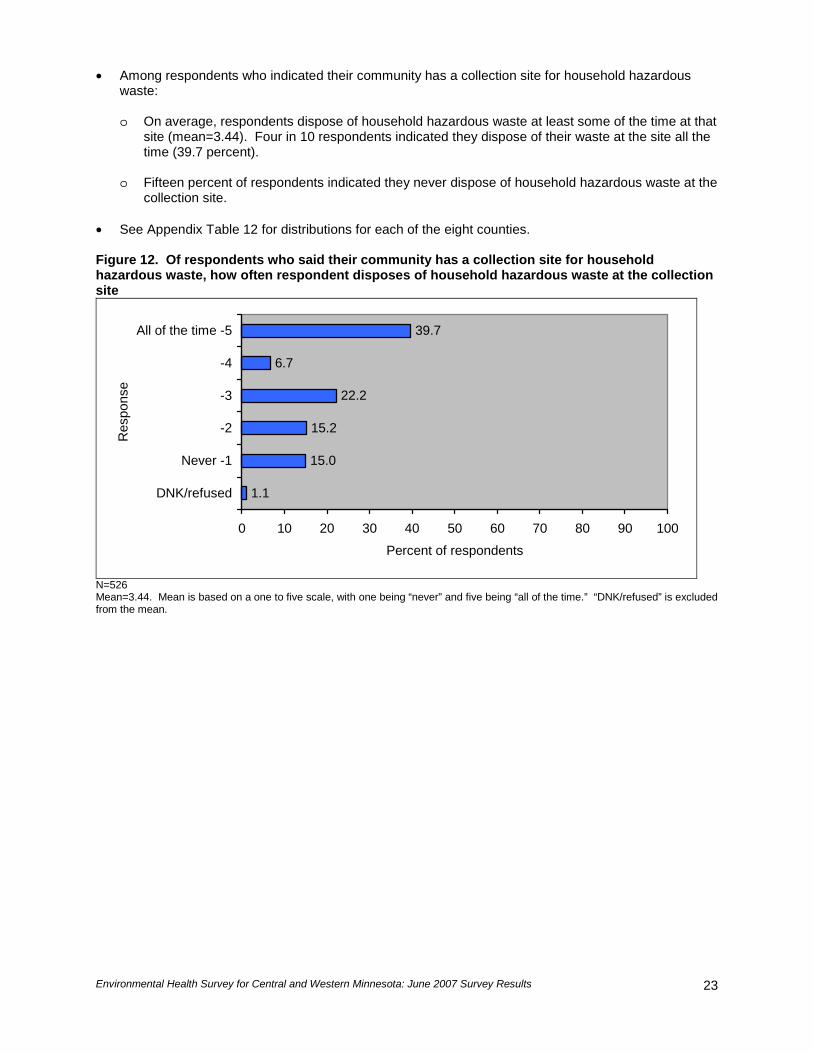
• Among respondents who indicated their community has a collection site for household hazardous waste:
o On average, respondents dispose of household hazardous waste at least some of the time at that
site (mean=3.44). Four in 10 respondents indicated they dispose of their waste at the site all the time (39.7 percent).
o Fifteen percent of respondents indicated they never dispose of household hazardous waste at the
collection site. • See Appendix Table 12 for distributions for each of the eight counties. Figure 12. Of respondents who said their community has a collection site for household hazardous waste, how often respondent disposes of household hazardous waste at the collection site
1.1
15.2
22.2
6.7
39.7
15.0
0 10 20 30 40 50 60 70 80 90 100
DNK/refused
Never -1
-2
-3
-4
All of the time -5
Res
pons
e
Percent of respondents
N=526 Mean=3.44. Mean is based on a one to five scale, with one being “never” and five being “all of the time.” “DNK/refused” is excluded from the mean.
Environmental Health Survey for Central and Western Minnesota: June 2007 Survey Results 24
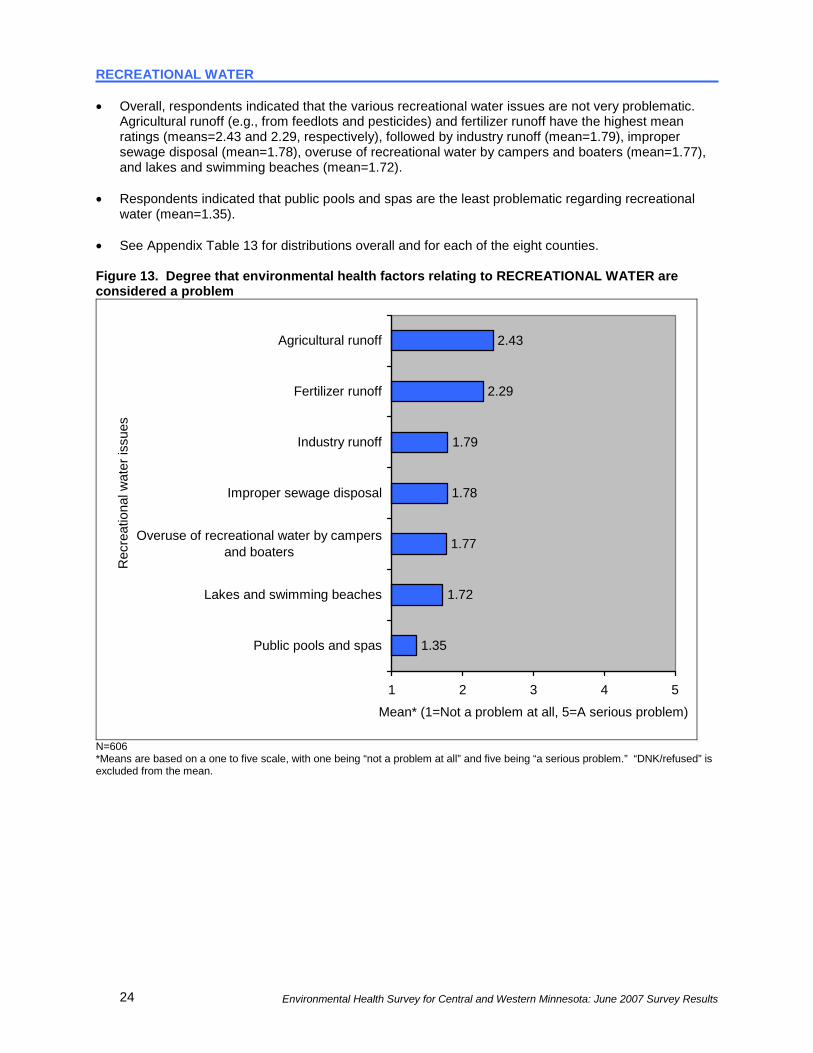
RECREATIONAL WATER • Overall, respondents indicated that the various recreational water issues are not very problematic.
Agricultural runoff (e.g., from feedlots and pesticides) and fertilizer runoff have the highest mean ratings (means=2.43 and 2.29, respectively), followed by industry runoff (mean=1.79), improper sewage disposal (mean=1.78), overuse of recreational water by campers and boaters (mean=1.77), and lakes and swimming beaches (mean=1.72).
• Respondents indicated that public pools and spas are the least problematic regarding recreational
water (mean=1.35). • See Appendix Table 13 for distributions overall and for each of the eight counties. Figure 13. Degree that environmental health factors relating to RECREATIONAL WATER are considered a problem
1.35
1.72
1.77
1.78
1.79
2.29
2.43
1 2 3 4 5
Public pools and spas
Lakes and swimming beaches
Overuse of recreational water by campersand boaters
Improper sewage disposal
Industry runoff
Fertilizer runoff
Agricultural runoff
Rec
reat
iona
l wat
er is
sues
Mean* (1=Not a problem at all, 5=A serious problem)
N=606 *Means are based on a one to five scale, with one being “not a problem at all” and five being “a serious problem.” “DNK/refused” is excluded from the mean.

Environmental Health Survey for Central and Western Minnesota: June 2007 Survey Results
25
• Of respondents who said that various recreational water issues are problematic:
o Nearly three-fourths indicated that agricultural runoff (e.g., from feedlots and pesticides) and lakes and swimming beaches are a high priority (72.4 percent and 72.2 percent, respectively), followed by industry runoff (70.0 percent), improper sewage disposal (67.2 percent), fertilizer runoff (64.9 percent), and overuse of recreational water by campers and boaters (48.7 percent).
o Nearly half of respondents (47.1 percent) indicated that public pools and spas are a medium
priority. • See Appendix Table 14 for distributions for each of the eight counties. Figure 14. Of respondents who said there are RECREATIONAL WATER issues they consider a problem, level of priority in addressing each problem
0.0
2.6
2.1
5.2
3.3
0.0
2.4
11.8
10.3
4.3
6.9
8.3
13.9
7.3
47.1
38.5
28.7
20.7
18.3
13.9
17.9
41.2
48.7
64.9
67.2
70.0
72.2
72.4
0 10 20 30 40 50 60 70 80 90 100
Public pools and spas (N=17)
Overuse of recreational water bycampers and boaters (N=39)
Fertilizer runoff (N=94)
Improper sewage disposal (N=58)
Industry runoff (N=60)
Lakes and swimming beaches (N=36)
Agricultural runoff (N=123)
Rec
reat
iona
l wat
er is
sues
Percent of respondents
HighMediumLowDNK/refused

Environmental Health Survey for Central and Western Minnesota: June 2007 Survey Results 26
• Of respondents who said that various recreational water issues are problematic:
o Respondents indicated that, overall, the recreational water issues have not had much of an impact on a household member’s health. Public pools and spas have affected a household member’s health the most (mean=2.00), followed by lakes and swimming beaches (mean=1.86), agricultural runoff (e.g., from feedlots and pesticides) (mean=1.51), fertilizer runoff (mean=1.41), and improper sewage disposal (mean=1.41).
o Respondents indicated that overuse of recreational water by campers and boaters (mean=1.28)
and industry runoff (mean=1.27) have affected a household member’s health the least. • See Appendix Table 15 for distributions overall and for each of the eight counties. Figure 15. Of respondents who said there are RECREATIONAL WATER issues they consider a problem, extent that issues have affected a household member’s health
1.27
1.28
1.41
1.41
1.51
1.86
2.00
1 2 3 4 5
Industry runoff (N=60)
Overuse of recreational water by campersand boaters (N=39)
Improper sewage disposal (N=58)
Fertilizer runoff (N=94)
Agricultural runoff (N=123)
Lakes and swimming beaches (N=36)
Public pools and spas (N=17)
Rec
reat
iona
l wat
er is
sues
Mean* (1=Not at all, 5=A great deal)
*Means are based on a one to five scale, with one being “not at all” and five being “a great deal.” “DNK/refused” is excluded from the mean.
Environmental Health Survey for Central and Western Minnesota: June 2007 Survey Results
27
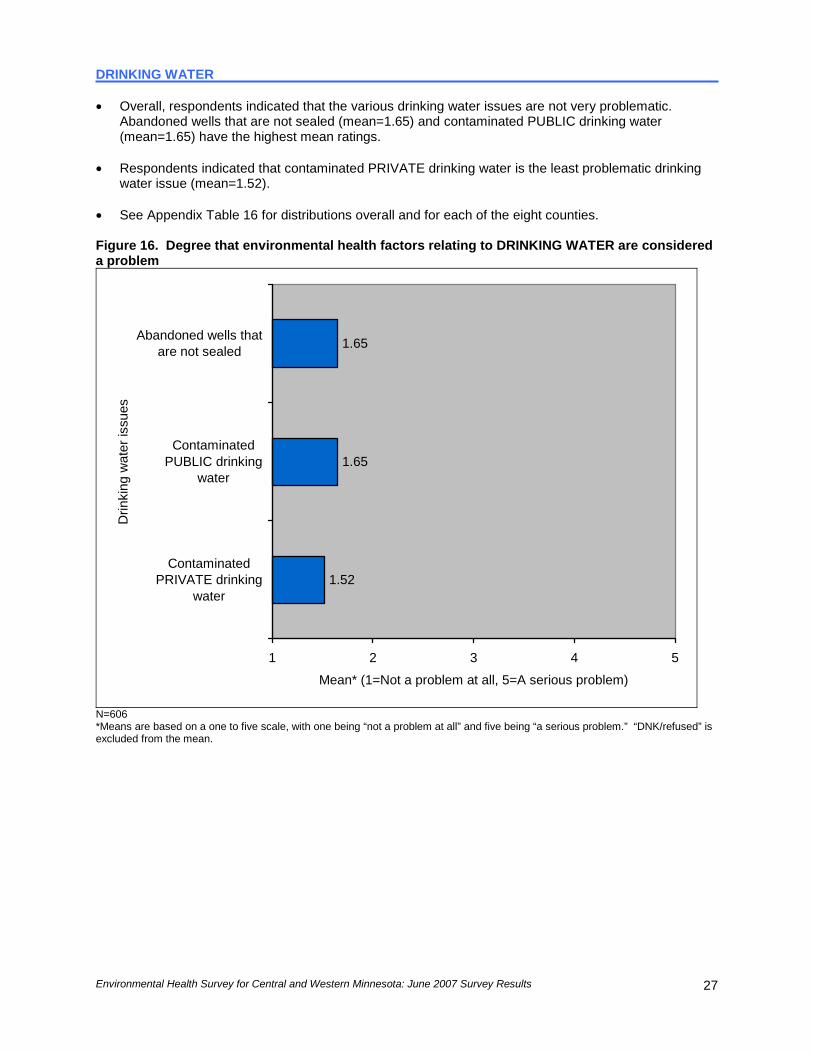
DRINKING WATER • Overall, respondents indicated that the various drinking water issues are not very problematic.
Abandoned wells that are not sealed (mean=1.65) and contaminated PUBLIC drinking water (mean=1.65) have the highest mean ratings.
• Respondents indicated that contaminated PRIVATE drinking water is the least problematic drinking
water issue (mean=1.52). • See Appendix Table 16 for distributions overall and for each of the eight counties. Figure 16. Degree that environmental health factors relating to DRINKING WATER are considered a problem
1.52
1.65
1.65
1 2 3 4 5
ContaminatedPRIVATE drinking
water
ContaminatedPUBLIC drinking
water
Abandoned wells thatare not sealed
Drin
king
wat
er is
sues
Mean* (1=Not a problem at all, 5=A serious problem)
N=606 *Means are based on a one to five scale, with one being “not a problem at all” and five being “a serious problem.” “DNK/refused” is excluded from the mean.

Environmental Health Survey for Central and Western Minnesota: June 2007 Survey Results 28
• Of respondents who said that various drinking water issues are problematic, the vast majority indicated that contaminated PUBLIC drinking water is a high priority (82.1 percent), followed by contaminated PRIVATE drinking water (77.4 percent) and abandoned wells that are not sealed (62.2 percent).
• See Appendix Table 17 for distributions for each of the eight counties. Figure 17. Of respondents who said there are DRINKING WATER issues they consider a problem, level of priority in addressing each problem
2.2
0.0
1.5
4.4
3.2
31.1
19.4
13.4
62.2
77.4
82.1
3.0
0 10 20 30 40 50 60 70 80 90 100
Abandoned wellsthat are not
sealed (N=45)
ContaminatedPRIVATE drinking
water (N=31)
ContaminatedPUBLIC drinking
water (N=67)
Drin
king
wat
er is
sues
Percent of respondents
HighMediumLowDNK/refused

Environmental Health Survey for Central and Western Minnesota: June 2007 Survey Results
29
• Of respondents who said that various drinking water issues are problematic:
o Respondents indicated that, overall, the drinking water issues have not had much of an impact on a household member’s health. Contaminated PUBLIC drinking water has affected a household member’s health the most (mean=1.48), followed by contaminated PRIVATE drinking water (mean=1.45).
o Respondents indicated that abandoned wells that are not sealed have affected a household
member’s health the least (mean=1.27). • See Appendix Table 18 for distributions overall and for each of the eight counties. Figure 18. Of respondents who said there are DRINKING WATER issues they consider a problem, extent that issues have affected a household member’s health
1.27
1.45
1.48
1 2 3 4 5
Abandoned wells thatare not sealed (N=45)
ContaminatedPRIVATE drinking
water (N=31)
ContaminatedPUBLIC drinking
water (N=67)
Drin
king
wat
er is
sues
Mean* (1=Not at all, 5=A great deal)
*Means are based on a one to five scale, with one being “not at all” and five being “a great deal.” “DNK/refused” is excluded from the mean.
Environmental Health Survey for Central and Western Minnesota: June 2007 Survey Results 30
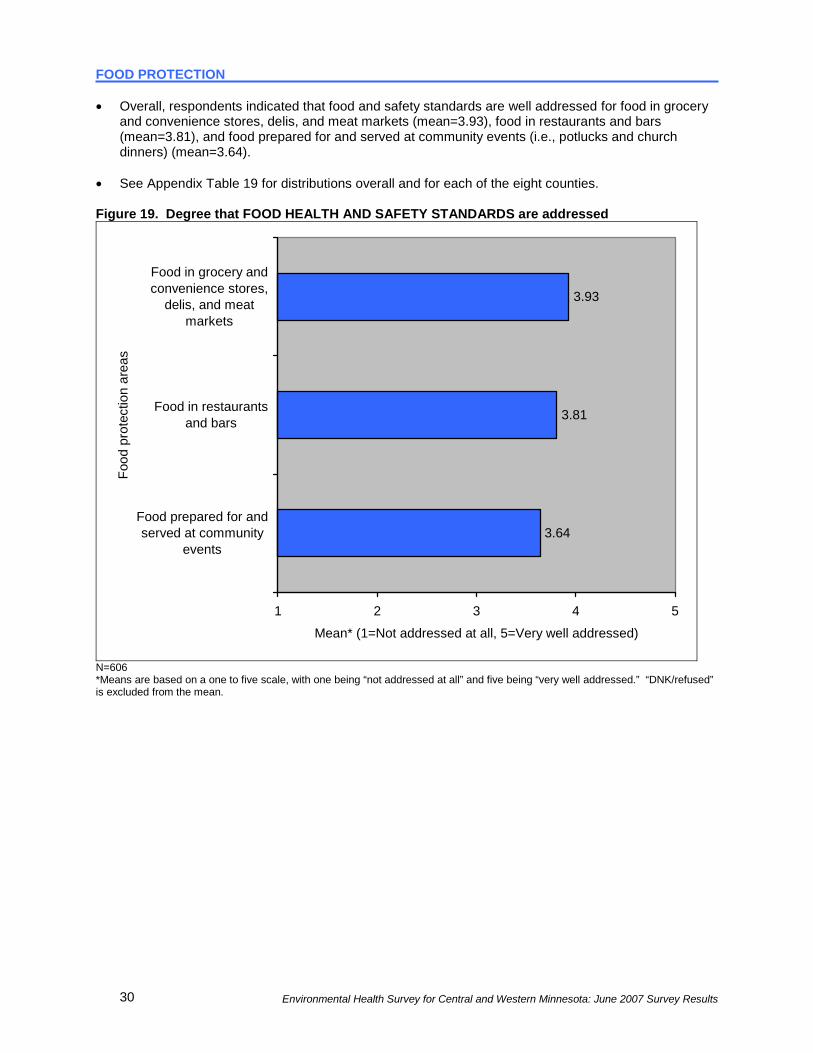
FOOD PROTECTION • Overall, respondents indicated that food and safety standards are well addressed for food in grocery
and convenience stores, delis, and meat markets (mean=3.93), food in restaurants and bars (mean=3.81), and food prepared for and served at community events (i.e., potlucks and church dinners) (mean=3.64).
• See Appendix Table 19 for distributions overall and for each of the eight counties. Figure 19. Degree that FOOD HEALTH AND SAFETY STANDARDS are addressed
3.64
3.81
3.93
1 2 3 4 5
Food prepared for andserved at community
events
Food in restaurantsand bars
Food in grocery andconvenience stores,
delis, and meatmarkets
Food
pro
tect
ion
area
s
Mean* (1=Not addressed at all, 5=Very well addressed)
N=606 *Means are based on a one to five scale, with one being “not addressed at all” and five being “very well addressed.” “DNK/refused” is excluded from the mean.
Environmental Health Survey for Central and Western Minnesota: June 2007 Survey Results
31
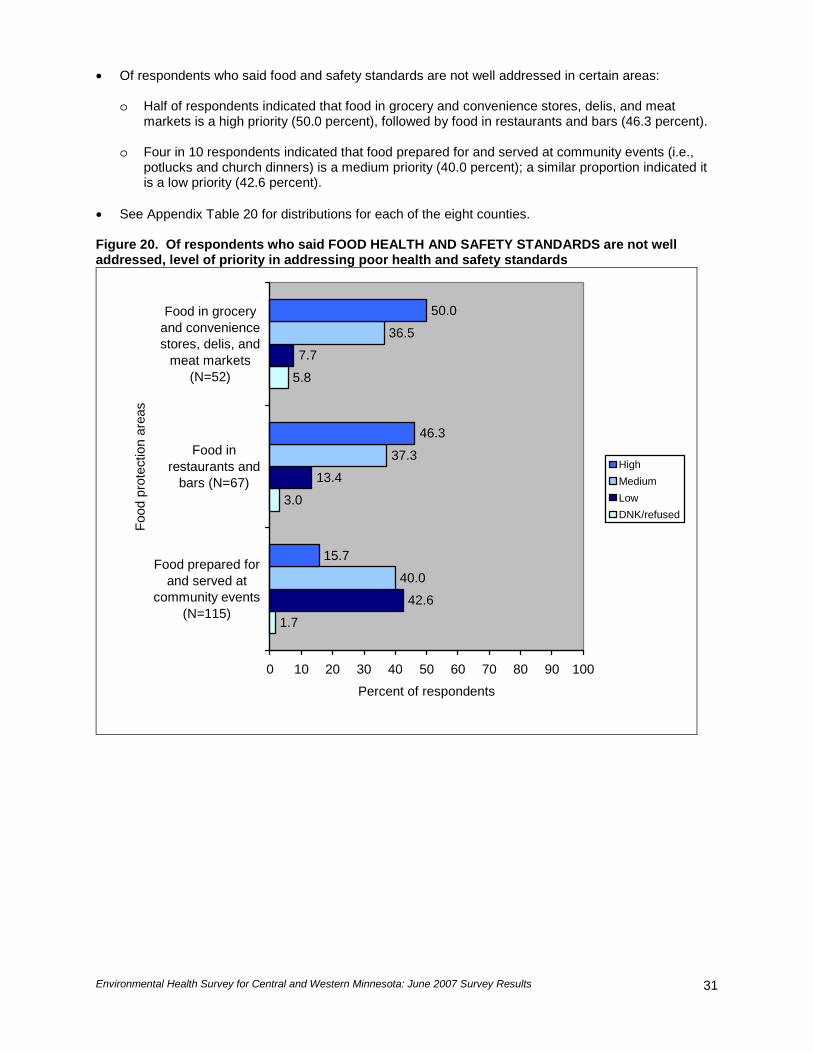
• Of respondents who said food and safety standards are not well addressed in certain areas:
o Half of respondents indicated that food in grocery and convenience stores, delis, and meat markets is a high priority (50.0 percent), followed by food in restaurants and bars (46.3 percent).
o Four in 10 respondents indicated that food prepared for and served at community events (i.e.,
potlucks and church dinners) is a medium priority (40.0 percent); a similar proportion indicated it is a low priority (42.6 percent).
• See Appendix Table 20 for distributions for each of the eight counties. Figure 20. Of respondents who said FOOD HEALTH AND SAFETY STANDARDS are not well addressed, level of priority in addressing poor health and safety standards
1.7
5.8
42.6
13.4
7.7
37.3
36.5
15.7
46.3
3.0
40.0
50.0
0 10 20 30 40 50 60 70 80 90 100
Food prepared forand served at
community events(N=115)
Food inrestaurants and
bars (N=67)
Food in groceryand conveniencestores, delis, and
meat markets(N=52)
Food
pro
tect
ion
area
s
Percent of respondents
HighMediumLowDNK/refused
Environmental Health Survey for Central and Western Minnesota: June 2007 Survey Results 32
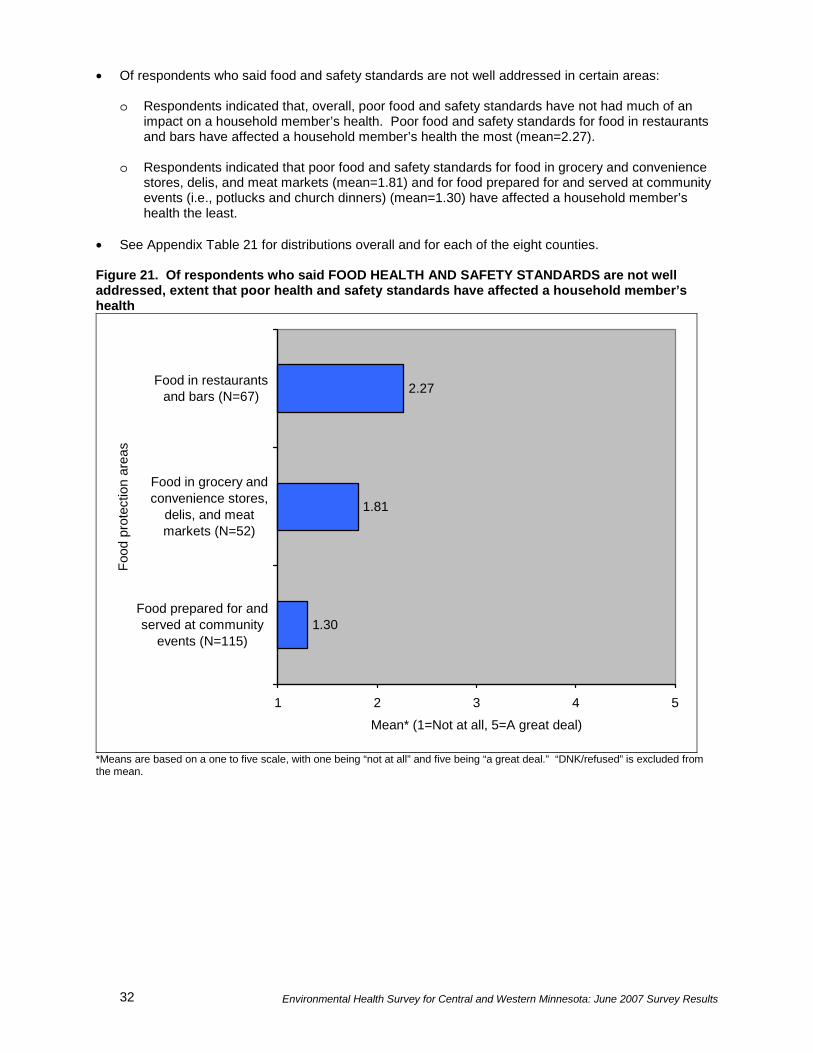
• Of respondents who said food and safety standards are not well addressed in certain areas:
o Respondents indicated that, overall, poor food and safety standards have not had much of an impact on a household member’s health. Poor food and safety standards for food in restaurants and bars have affected a household member’s health the most (mean=2.27).
o Respondents indicated that poor food and safety standards for food in grocery and convenience
stores, delis, and meat markets (mean=1.81) and for food prepared for and served at community events (i.e., potlucks and church dinners) (mean=1.30) have affected a household member’s health the least.
• See Appendix Table 21 for distributions overall and for each of the eight counties. Figure 21. Of respondents who said FOOD HEALTH AND SAFETY STANDARDS are not well addressed, extent that poor health and safety standards have affected a household member’s health
1.30
1.81
2.27
1 2 3 4 5
Food prepared for andserved at community
events (N=115)
Food in grocery andconvenience stores,
delis, and meatmarkets (N=52)
Food in restaurantsand bars (N=67)
Food
pro
tect
ion
area
s
Mean* (1=Not at all, 5=A great deal)
*Means are based on a one to five scale, with one being “not at all” and five being “a great deal.” “DNK/refused” is excluded from the mean.
Environmental Health Survey for Central and Western Minnesota: June 2007 Survey Results
33
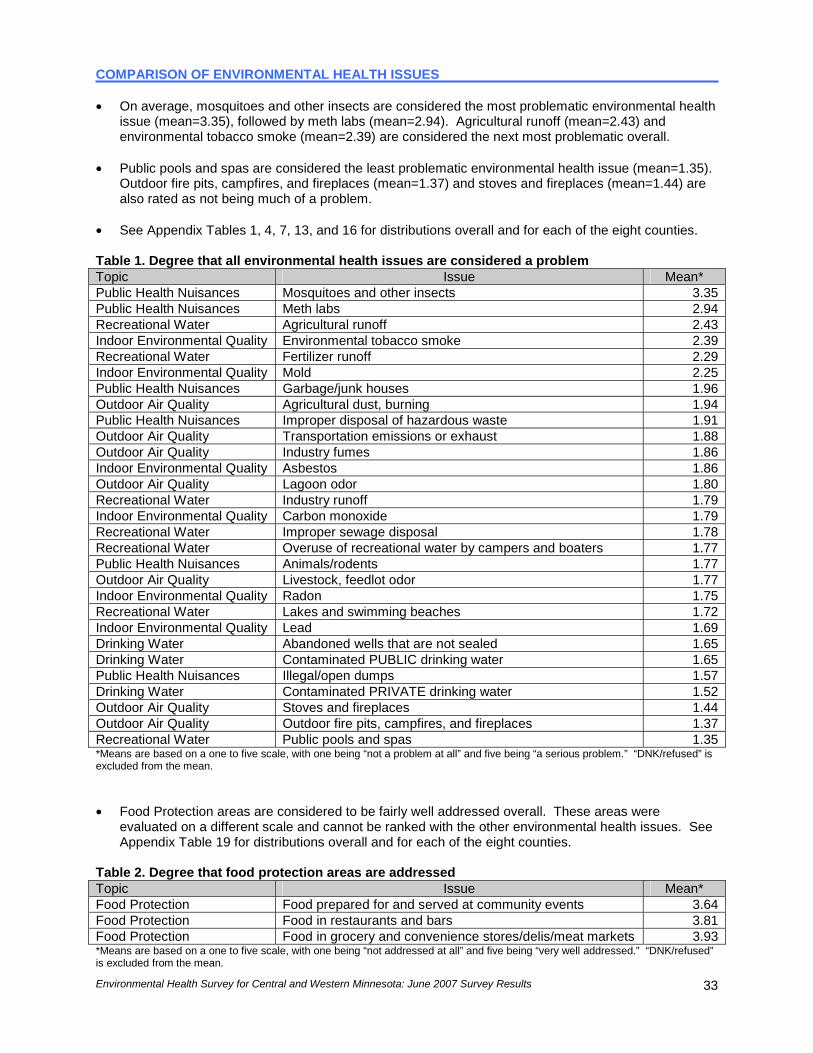
COMPARISON OF ENVIRONMENTAL HEALTH ISSUES • On average, mosquitoes and other insects are considered the most problematic environmental health
issue (mean=3.35), followed by meth labs (mean=2.94). Agricultural runoff (mean=2.43) and environmental tobacco smoke (mean=2.39) are considered the next most problematic overall.
• Public pools and spas are considered the least problematic environmental health issue (mean=1.35).
Outdoor fire pits, campfires, and fireplaces (mean=1.37) and stoves and fireplaces (mean=1.44) are also rated as not being much of a problem.
• See Appendix Tables 1, 4, 7, 13, and 16 for distributions overall and for each of the eight counties. Table 1. Degree that all environmental health issues are considered a problem Topic Issue Mean* Public Health Nuisances Mosquitoes and other insects 3.35Public Health Nuisances Meth labs 2.94Recreational Water Agricultural runoff 2.43Indoor Environmental Quality Environmental tobacco smoke 2.39Recreational Water Fertilizer runoff 2.29Indoor Environmental Quality Mold 2.25Public Health Nuisances Garbage/junk houses 1.96Outdoor Air Quality Agricultural dust, burning 1.94Public Health Nuisances Improper disposal of hazardous waste 1.91Outdoor Air Quality Transportation emissions or exhaust 1.88Outdoor Air Quality Industry fumes 1.86Indoor Environmental Quality Asbestos 1.86Outdoor Air Quality Lagoon odor 1.80Recreational Water Industry runoff 1.79Indoor Environmental Quality Carbon monoxide 1.79Recreational Water Improper sewage disposal 1.78Recreational Water Overuse of recreational water by campers and boaters 1.77Public Health Nuisances Animals/rodents 1.77Outdoor Air Quality Livestock, feedlot odor 1.77Indoor Environmental Quality Radon 1.75Recreational Water Lakes and swimming beaches 1.72Indoor Environmental Quality Lead 1.69Drinking Water Abandoned wells that are not sealed 1.65Drinking Water Contaminated PUBLIC drinking water 1.65Public Health Nuisances Illegal/open dumps 1.57Drinking Water Contaminated PRIVATE drinking water 1.52Outdoor Air Quality Stoves and fireplaces 1.44Outdoor Air Quality Outdoor fire pits, campfires, and fireplaces 1.37Recreational Water Public pools and spas 1.35*Means are based on a one to five scale, with one being “not a problem at all” and five being “a serious problem.” “DNK/refused” is excluded from the mean. • Food Protection areas are considered to be fairly well addressed overall. These areas were
evaluated on a different scale and cannot be ranked with the other environmental health issues. See Appendix Table 19 for distributions overall and for each of the eight counties.
Table 2. Degree that food protection areas are addressed Topic Issue Mean* Food Protection Food prepared for and served at community events 3.64Food Protection Food in restaurants and bars 3.81Food Protection Food in grocery and convenience stores/delis/meat markets 3.93*Means are based on a one to five scale, with one being “not addressed at all” and five being “very well addressed.” “DNK/refused” is excluded from the mean.

Environmental Health Survey for Central and Western Minnesota: June 2007 Survey Results 34
• Of respondents who said that various environmental health issues are problematic:
o Meth labs are considered problematic, on average, and they are rated as a high priority by the vast majority of respondents who see them as a problem (90.7 percent).
o Though contaminated PUBLIC drinking water and contaminated PRIVATE drinking water do not
rate as big problems, on average, respondents who see them as problematic said they are a high priority (82.1 percent and 77.4 percent, respectively). Environmental tobacco smoke is considered a high priority by 76.3 percent of respondents who see it as a problem.
o Outdoor fire pits, campfires, and fireplaces are not considered problematic, on average, and only
a small proportion of respondents who see them as a problemat consider them a high priority (13.3 percent).
• See Appendix Tables 2, 5, 8, 14, 17, and 20 for distributions overall and for each of the eight
counties. Table 3. Of respondents who said there are environmental health issues they consider a problem (or not well addressed), percent of respondents who see each problem as a HIGH priority
Topic Issue
Percent HIGH priority
Public Health Nuisances Meth labs 90.7Drinking Water Contaminated PUBLIC drinking water 82.1Drinking Water Contaminated PRIVATE drinking water 77.4Indoor Environmental Quality Environmental tobacco smoke 76.3Indoor Environmental Quality Carbon monoxide 74.6Indoor Environmental Quality Lead 74.6Public Health Nuisances Improper disposal of hazardous waste 74.0Indoor Environmental Quality Asbestos 72.9Recreational Water Agricultural runoff 72.4Recreational Water Lakes and swimming beaches 72.2Recreational Water Industry runoff 70.0Indoor Environmental Quality Mold 68.9Recreational Water Improper sewage disposal 67.2Public Health Nuisances Illegal/open dumps 65.9Recreational Water Fertilizer runoff 64.9Indoor Environmental Quality Radon 63.8Drinking Water Abandoned wells that are not sealed 62.2Public Health Nuisances Mosquitoes and other insects 61.9Public Health Nuisances Garbage/junk houses 61.2Outdoor Air Quality Industry fumes 53.2Outdoor Air Quality Lagoon odor 51.7Food Protection Food in grocery and convenience stores/delis/meat markets 50.0Outdoor Air Quality Transportation emissions or exhaust 50.0Recreational Water Overuse of recreational water by campers and boaters 48.7Food Protection Food in restaurants and bars 46.3Public Health Nuisances Animals/rodents 45.9Outdoor Air Quality Livestock, feedlot odor 45.6Recreational Water Public pools and spas 41.2Outdoor Air Quality Agricultural dust, burning 27.8Outdoor Air Quality Stoves and fireplaces 26.7Food Protection Food prepared for and served at community events 15.7Outdoor Air Quality Outdoor fire pits, campfires, and fireplaces 13.3

Environmental Health Survey for Central and Western Minnesota: June 2007 Survey Results
35
• Of respondents who said that various environmental health issues are problematic:
o On average, environmental tobacco smoke, which is considered problematic and is considered a high priority, has affected the health of a household member the most out of all the environmental health issues (mean=2.45).
o Mold (mean=2.34) and agricultural dust and burning (mean=2.33) have had the next greatest
effects on the health of a household member.
o Food in restaurants and bars is considered to be fairly well addressed and less than half of respondents who said it is not well addressed rate it as a high priority. However, it has had the next greatest effect on the health of a household member (mean=2.27).
o Meth labs, which are considered to be among the most problematic and among the highest
priority of the environmental health issues, have not had much of an effect on a household member’s health (mean=1.13).
• See Appendix Tables 3, 6, 9, 15, 18, and 21 for distributions overall and for each of the eight
counties. Table 4. Of respondents who said there are environmental health issues they consider a problem, extent that issues have affected a household member’s health Topic Issue Mean* Indoor Environmental Quality Environmental tobacco smoke 2.45Indoor Environmental Quality Mold 2.34Outdoor Air Quality Agricultural dust, burning 2.33Food Protection Food in restaurants and bars 2.27Recreational Water Public pools and spas 2.00Outdoor Air Quality Stoves and fireplaces 2.00Recreational Water Lakes and swimming beaches 1.86Food Protection Food in grocery and convenience stores/delis/meat markets 1.81Outdoor Air Quality Industry fumes 1.73Outdoor Air Quality Outdoor fire pits, campfires, and fireplaces 1.73Public Health Nuisances Mosquitoes and other insects 1.66Outdoor Air Quality Transportation emissions or exhaust 1.65Outdoor Air Quality Livestock, feedlot odor 1.64Indoor Environmental Quality Carbon monoxide 1.57Public Health Nuisances Animals/rodents 1.56Recreational Water Agricultural runoff 1.51Indoor Environmental Quality Asbestos 1.49Drinking Water Contaminated PUBLIC drinking water 1.48Public Health Nuisances Garbage/junk houses 1.48Outdoor Air Quality Lagoon odor 1.47Drinking Water Contaminated PRIVATE drinking water 1.45Recreational Water Fertilizer runoff 1.41Recreational Water Improper sewage disposal 1.41Public Health Nuisances Improper disposal of hazardous waste 1.32Food Protection Food prepared for and served at community events 1.30Recreational Water Overuse of recreational water by campers and boaters 1.28Drinking Water Abandoned wells that are not sealed 1.27Recreational Water Industry runoff 1.27Indoor Environmental Quality Radon 1.26Indoor Environmental Quality Lead 1.20Public Health Nuisances Illegal/open dumps 1.15Public Health Nuisances Meth labs 1.13*Means are based on a one to five scale, with one being “not at all” and five being “a great deal.” “DNK/refused” is excluded from the mean.

Environmental Health Survey for Central and Western Minnesota: June 2007 Survey Results 36
EMERGENCY PREPAREDNESS • Overall, respondents indicated that they are not very worried about various threatening emergencies
or disasters. Natural disasters (e.g., violent storms, tornados, winter ice storms, and floods, etc.) have the highest mean rating (mean=2.31), followed by disease outbreak (e.g., the flu) (mean=2.28) and terrorism (mean=2.24).
• Respondents indicated that they are least worried about household emergencies (e.g., fire, gas leaks,
etc.) (mean=1.94) and chemical spills (mean=1.78). • See Appendix Table 22 for distributions overall and for each of the eight counties. Figure 22. Degree that respondent is worried about various THREATENING EMERGENCIES OR DISASTERS
1.78
1.94
2.24
2.28
2.31
1 2 3 4 5
Chemical spills
Householdemergencies
Terrorism
Disease outbreak
Natural disasters
Em
erge
ncy
or d
isas
ter
Mean* (1=Not at all worried, 5=Very worried)
N=606 *Means are based on a one to five scale, with one being “not at all worried” and five being “very worried.” “DNK/refused” is excluded from the mean.

Environmental Health Survey for Central and Western Minnesota: June 2007 Survey Results
37
• The vast majority of respondents indicated that in the event of a threatening emergency or disaster, they would be alerted to, or get information about, the emergency or disaster through television (83.5 percent), followed by battery-operated radio (65.0 percent), word of mouth by neighbors (64.9 percent), and sirens (60.1 percent).
• Less than one-fifth of respondents indicated they would be alerted to, or get information about, the
emergency or disaster through the use of a scanner (15.3 percent). • Nearly one-fourth of respondents indicated there are other ways they would be alerted to, or get
information about, the emergency or disaster (23.1 percent). See Appendix Table 23-A for a list of other ways, including by phone, computer/Internet, radio, and through authorities.
• See Appendix Table 23 for distributions for each of the eight counties. Figure 23. In the event of a threatening emergency or disaster, ways respondent would be alerted to, or get information about, the emergency or disaster
23.1
15.3
60.1
64.9
83.5
65.0
0 10 20 30 40 50 60 70 80 90 100
Other**
Scanner
Sirens
Word of mouth byneighbors
Battery-operated radio
Television
Sour
ce o
f inf
orm
atio
n
Percent of respondents*
N=606 *Percentages do not add to 100.0 due to multiple responses. **See Appendix Table 23-A for a list of other ways respondent would be alerted to, or get information about, the emergency or disaster.
Environmental Health Survey for Central and Western Minnesota: June 2007 Survey Results 38
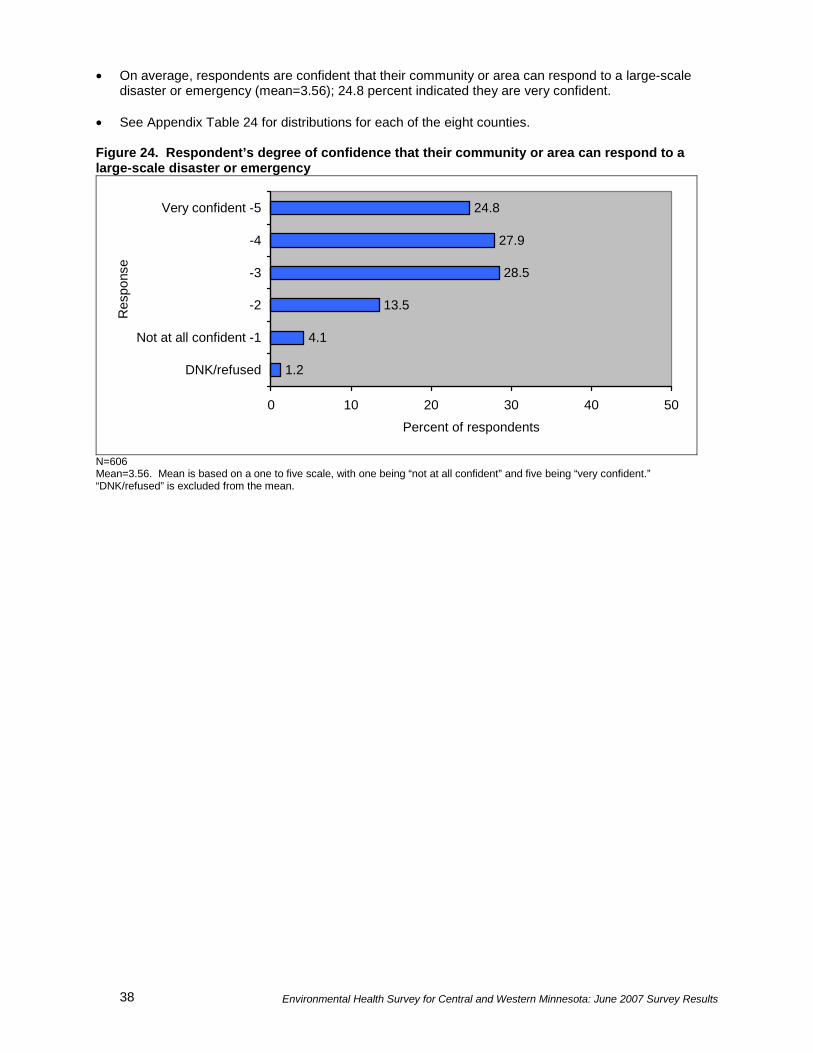
• On average, respondents are confident that their community or area can respond to a large-scale disaster or emergency (mean=3.56); 24.8 percent indicated they are very confident.
• See Appendix Table 24 for distributions for each of the eight counties. Figure 24. Respondent’s degree of confidence that their community or area can respond to a large-scale disaster or emergency
1.2
4.1
13.5
28.5
27.9
24.8
0 10 20 30 40 50
DNK/refused
Not at all confident -1
-2
-3
-4
Very confident -5
Res
pons
e
Percent of respondents
N=606 Mean=3.56. Mean is based on a one to five scale, with one being “not at all confident” and five being “very confident.” “DNK/refused” is excluded from the mean.

Environmental Health Survey for Central and Western Minnesota: June 2007 Survey Results
39
• On average, respondents indicated that their household is moderately prepared in the event of an emergency or disaster (mean=3.17); 14.0 percent said they are very prepared.
• One in 10 respondents indicated they are not at all prepared (10.4 percent). • See Appendix Table 25 for distributions overall and for each of the eight counties. Figure 25. Level of preparedness of respondent’s household in the event of an emergency or disaster
0.3
10.4
16.7
32.2
26.4
14.0
0 10 20 30 40 50
DNK/refused
Not at all prepared -1
-2
-3
-4
Very prepared -5
Res
pons
e
Percent of respondents
N=606 Mean=3.17. Mean is based on a one to five scale, with one being “not at all prepared” and five being “very prepared.” “DNK/refused” is excluded from the mean.
Environmental Health Survey for Central and Western Minnesota: June 2007 Survey Results 40
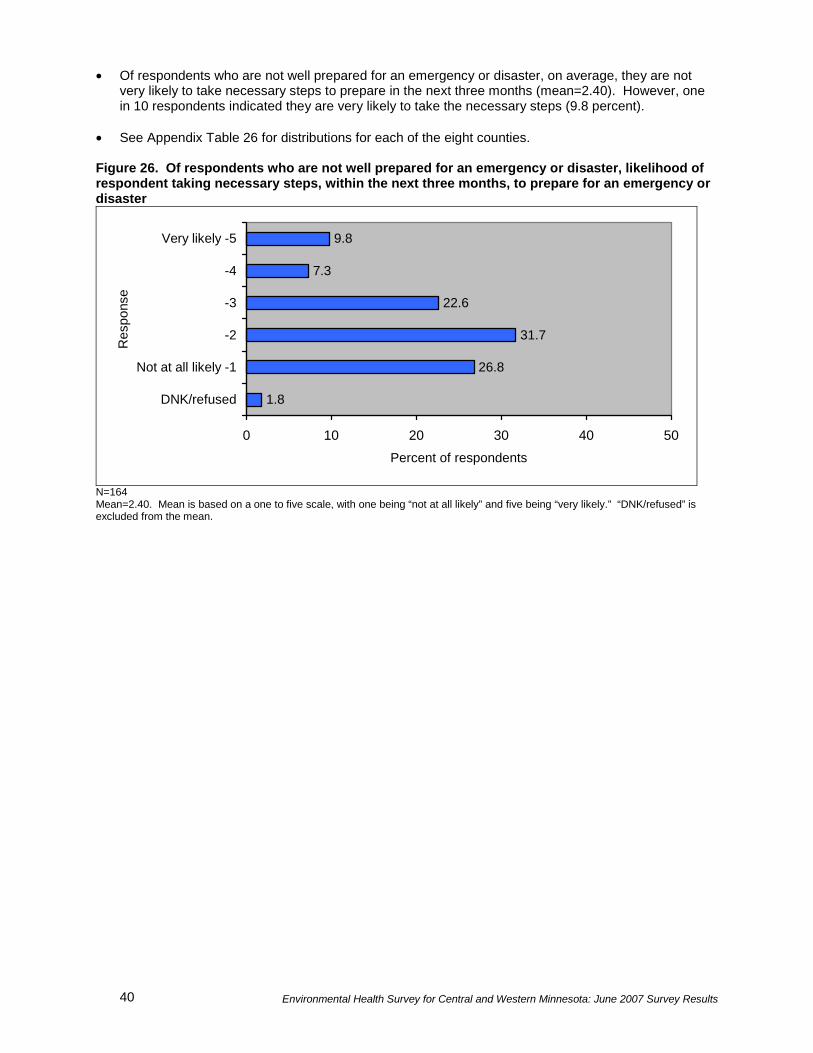
• Of respondents who are not well prepared for an emergency or disaster, on average, they are not very likely to take necessary steps to prepare in the next three months (mean=2.40). However, one in 10 respondents indicated they are very likely to take the necessary steps (9.8 percent).
• See Appendix Table 26 for distributions for each of the eight counties. Figure 26. Of respondents who are not well prepared for an emergency or disaster, likelihood of respondent taking necessary steps, within the next three months, to prepare for an emergency or disaster
1.8
26.8
31.7
22.6
7.3
9.8
0 10 20 30 40 50
DNK/refused
Not at all likely -1
-2
-3
-4
Very likely -5
Res
pons
e
Percent of respondents
N=164 Mean=2.40. Mean is based on a one to five scale, with one being “not at all likely” and five being “very likely.” “DNK/refused” is excluded from the mean.

Environmental Health Survey for Central and Western Minnesota: June 2007 Survey Results
41
• Of respondents who are not well prepared for an emergency or disaster and are not likely to prepare:
o Nearly three in 10 respondents indicated they have not had time to prepare (29.2 percent) and that they do not think it is important (28.1 percent). One-fifth indicated that they do not know how to put an emergency plan and supplies together (20.8 percent)
o Less than one-tenth indicated that it is too expensive (8.3 percent).
• One-third of respondents indicated there are other barriers (33.3 percent). See Appendix Table 27-A
for a list of other barriers. Examples include respondents who do not think about it, who are unsure what to prepare for, and who plan to “wing it.”
• See Appendix Table 27 for distributions for each of the eight counties. Figure 27. Of respondents who are not well prepared and not likely to prepare for an emergency or disaster within the next three months, barriers preventing respondent from taking the necessary steps to do so
3.1
33.3
8.3
20.8
28.1
29.2
0 10 20 30 40 50
Refused
Other**
Think it is tooexpensive
Don't how to put anemergency plan and
supplies together
Do not think it isimportant
Have not had time
Barr
iers
Percent of respondents*
N=96 *Percentages do not add to 100.0 due to multiple responses. **See Appendix Table 27-A for a list of other barriers preventing respondents from preparing for an emergency or disaster.
Environmental Health Survey for Central and Western Minnesota: June 2007 Survey Results 42
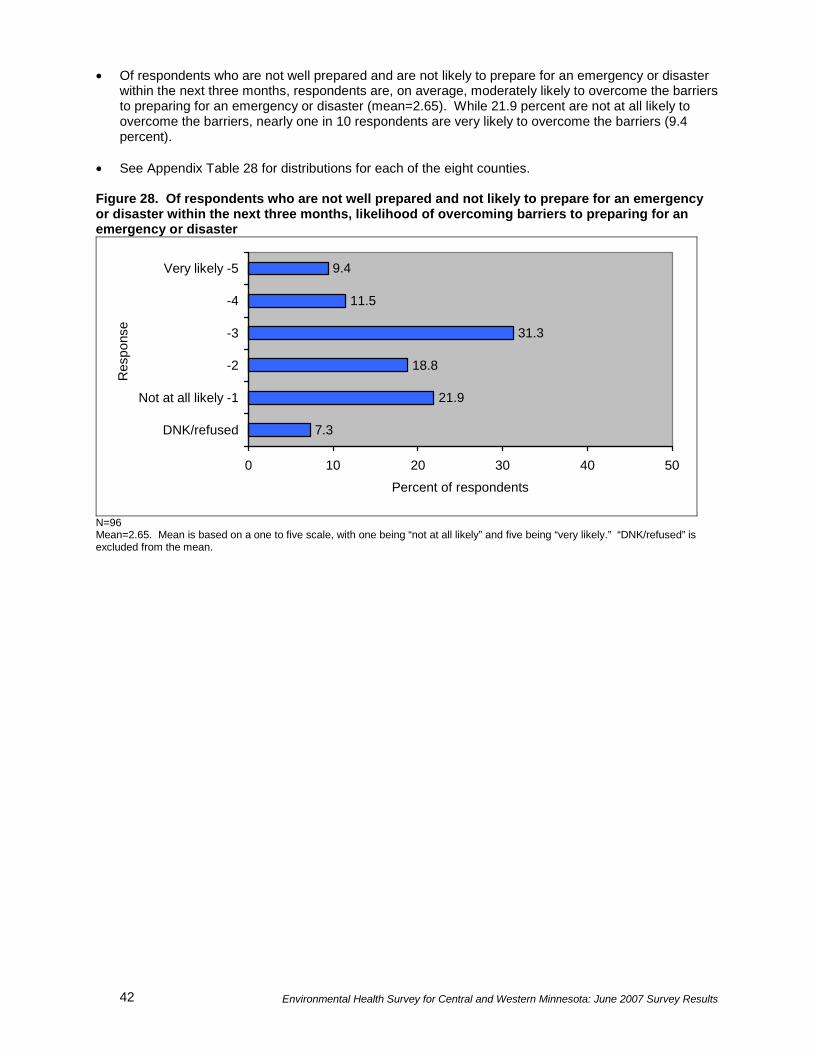
• Of respondents who are not well prepared and are not likely to prepare for an emergency or disaster within the next three months, respondents are, on average, moderately likely to overcome the barriers to preparing for an emergency or disaster (mean=2.65). While 21.9 percent are not at all likely to overcome the barriers, nearly one in 10 respondents are very likely to overcome the barriers (9.4 percent).
• See Appendix Table 28 for distributions for each of the eight counties. Figure 28. Of respondents who are not well prepared and not likely to prepare for an emergency or disaster within the next three months, likelihood of overcoming barriers to preparing for an emergency or disaster
7.3
21.9
18.8
31.3
11.5
9.4
0 10 20 30 40 50
DNK/refused
Not at all likely -1
-2
-3
-4
Very likely -5
Res
pons
e
Percent of respondents
N=96 Mean=2.65. Mean is based on a one to five scale, with one being “not at all likely” and five being “very likely.” “DNK/refused” is excluded from the mean.
Environmental Health Survey for Central and Western Minnesota: June 2007 Survey Results
43
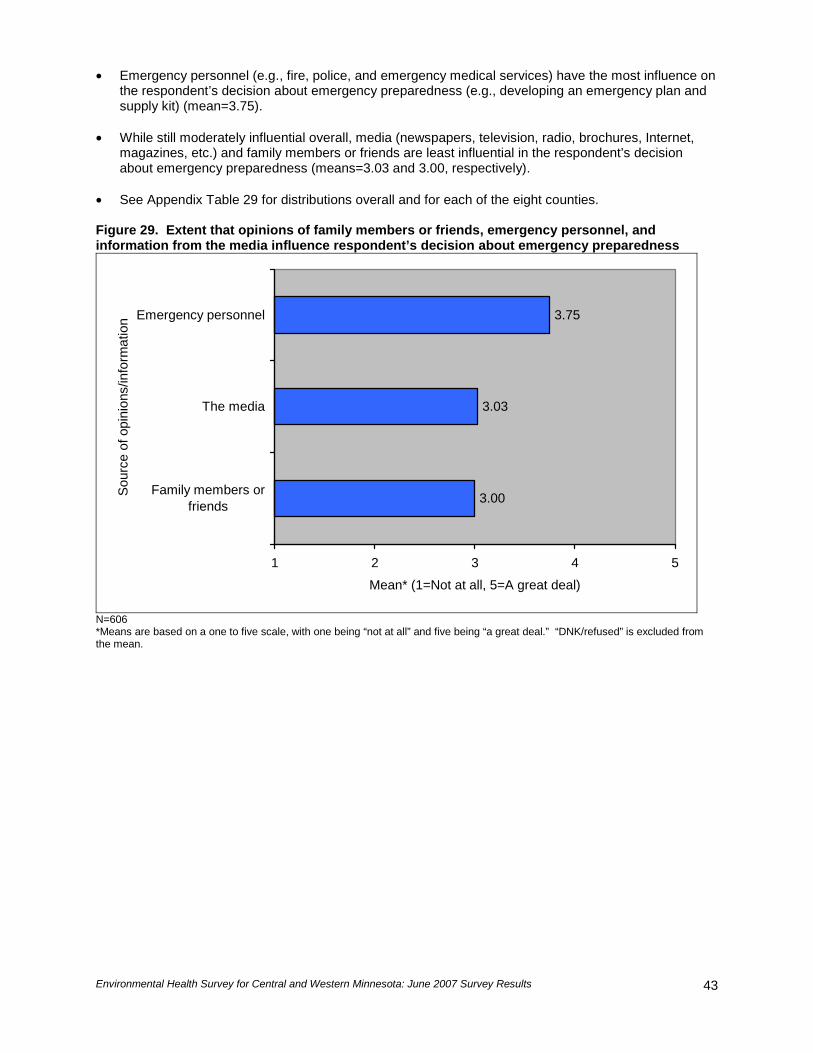
• Emergency personnel (e.g., fire, police, and emergency medical services) have the most influence on the respondent’s decision about emergency preparedness (e.g., developing an emergency plan and supply kit) (mean=3.75).
• While still moderately influential overall, media (newspapers, television, radio, brochures, Internet,
magazines, etc.) and family members or friends are least influential in the respondent’s decision about emergency preparedness (means=3.03 and 3.00, respectively).
• See Appendix Table 29 for distributions overall and for each of the eight counties. Figure 29. Extent that opinions of family members or friends, emergency personnel, and information from the media influence respondent’s decision about emergency preparedness
3.03
3.75
3.00
1 2 3 4 5
Family members orfriends
The media
Emergency personnel
Sou
rce
of o
pini
ons/
info
rmat
ion
Mean* (1=Not at all, 5=A great deal)
N=606 *Means are based on a one to five scale, with one being “not at all” and five being “a great deal.” “DNK/refused” is excluded from the mean.

Environmental Health Survey for Central and Western Minnesota: June 2007 Survey Results 44
• On average, respondents indicated that an emergency or natural disaster occurring in their community is unlikely (mean=2.39); 24.4 percent of respondents indicated it is not at all likely.
• See Appendix Table 30 for distributions for each of the eight counties. Figure 30. Respondent’s opinion regarding the likelihood that an emergency or natural disaster will occur in respondent’s community
3.5
24.4
27.4
32.2
7.4
5.1
0 10 20 30 40 50
DNK/refused
Not at all likely -1
-2
-3
-4
Very likely -5
Res
pons
e
Percent of respondents
N=606 Mean=2.39. Mean is based on a one to five scale, with one being “not at all likely” and five being “very likely.” “DNK/refused” is excluded from the mean.

Environmental Health Survey for Central and Western Minnesota: June 2007 Survey Results
45
DEMOGRAPHICS • One-third of respondents are 65 years of age or older (33.2 percent). One in 10 respondents is under
the age of 35 (10.5 percent). • See Appendix Table 31 for distributions for each of the eight counties. Figure 31. Age of respondent
0.5
33.2
22.1
19.5
14.2
8.9
0.8
0.8
0 10 20 30 40 50
Refused
65 or older
55 to 64
45 to 54
35 to 44
25 to 34
21 to 24
Less than 21
Yea
rs o
f age
Percent of respondents
N=606 • Nearly one-third of respondents have, at most, completed high school or received their GED (31.7
percent). One-third of respondents have, at least, a college degree (33.8 percent). • See Appendix Table 32 for distributions for each of the eight counties. Figure 32. Education of respondent
0.5
9.2
24.6
12.9
15.3
5.8
26.7
5.0
0 10 20 30 40 50
Refused
Graduate school or professional degree
College degree
Some college, but no degree
Vocational/tech degree
Some vocational/tech, but no degree
High school graduate or GED
Less than high school
Leve
l of e
duca
tion
Percent of respondents
N=606
Environmental Health Survey for Central and Western Minnesota: June 2007 Survey Results 46
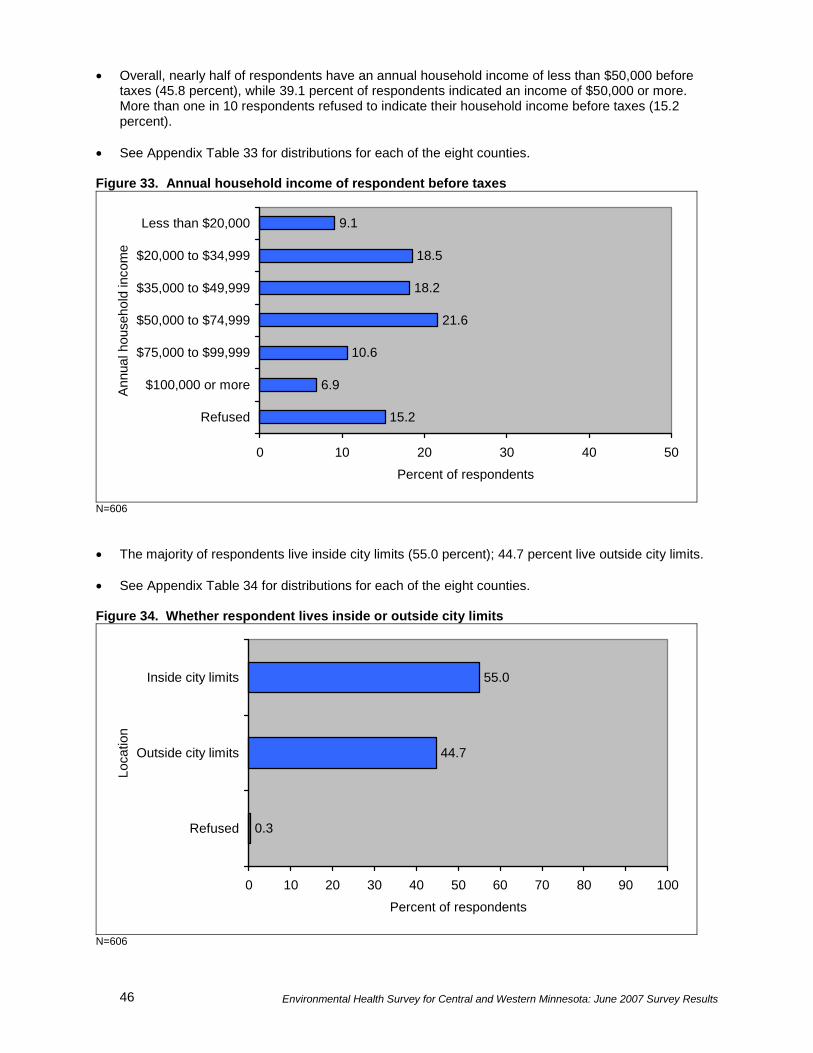
• Overall, nearly half of respondents have an annual household income of less than $50,000 before taxes (45.8 percent), while 39.1 percent of respondents indicated an income of $50,000 or more. More than one in 10 respondents refused to indicate their household income before taxes (15.2 percent).
• See Appendix Table 33 for distributions for each of the eight counties. Figure 33. Annual household income of respondent before taxes
15.2
6.9
10.6
21.6
18.2
18.5
9.1
0 10 20 30 40 50
Refused
$100,000 or more
$75,000 to $99,999
$50,000 to $74,999
$35,000 to $49,999
$20,000 to $34,999
Less than $20,000
Ann
ual h
ouse
hold
inco
me
Percent of respondents
N=606 • The majority of respondents live inside city limits (55.0 percent); 44.7 percent live outside city limits. • See Appendix Table 34 for distributions for each of the eight counties. Figure 34. Whether respondent lives inside or outside city limits
0.3
44.7
55.0
0 10 20 30 40 50 60 70 80 90 100
Refused
Outside city limits
Inside city limits
Loca
tion
Percent of respondents
N=606

Environmental Health Survey for Central and Western Minnesota: June 2007 Survey Results
47
• Nearly half of respondents live in a two-person household (48.5 percent), and one-third live in a household with three or more people (34.2 percent).
• See Appendix Table 35 for distributions for each of the eight counties. Figure 35. Household size of respondent
0.5
34.2
48.5
16.8
0 10 20 30 40 50 60 70 80 90 100
Refused
Three or more
Two
One
Num
ber o
f peo
ple
Percent of respondents
N=606 • The majority of respondents do not have children younger than 18 living in their household (71.1
percent). • See Appendix Table 36 for distributions for each of the eight counties. Figure 36. Whether there are children younger than 18 living in respondent’s household
0.3
71.1
28.5
0 10 20 30 40 50 60 70 80 90 100
Refused
No
Yes
Res
pons
e
Percent of respondents
N=606
Environmental Health Survey for Central and Western Minnesota: June 2007 Survey Results 48
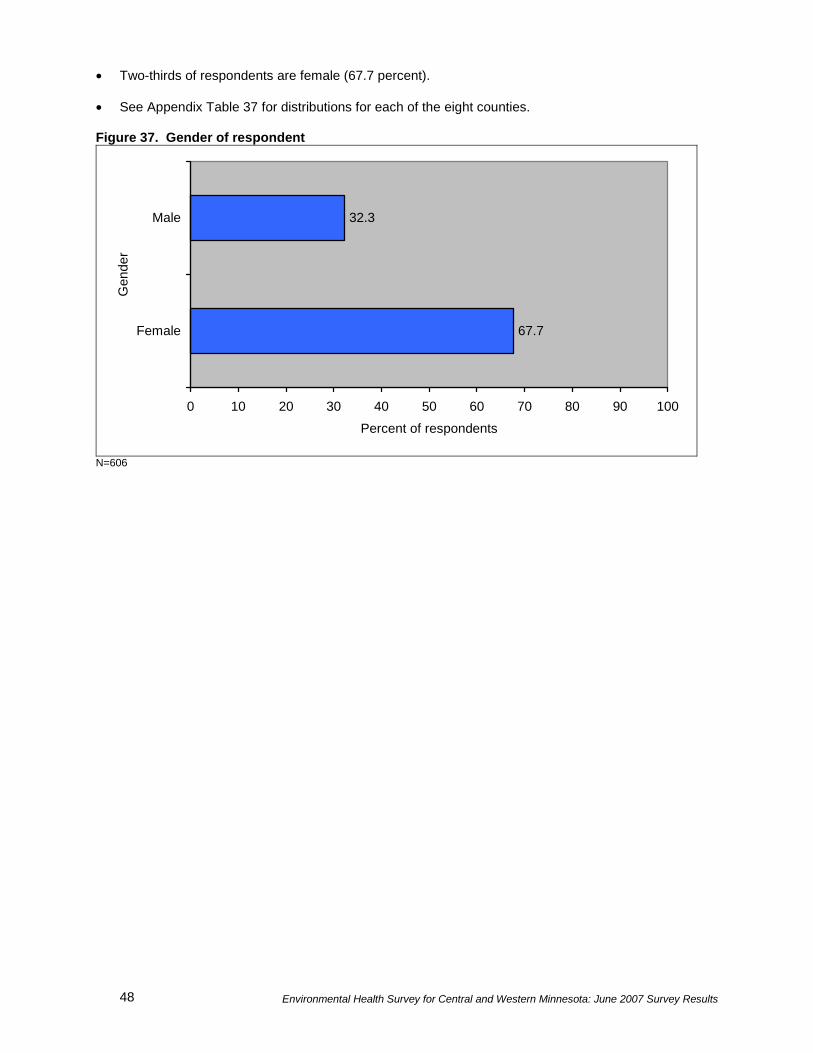
• Two-thirds of respondents are female (67.7 percent). • See Appendix Table 37 for distributions for each of the eight counties. Figure 37. Gender of respondent
67.7
32.3
0 10 20 30 40 50 60 70 80 90 100
Female
Male
Gen
der
Percent of respondents
N=606

Environmental Health Survey for Central and Western Minnesota: June 2007 Survey Results
49
• The majority of respondents indicated television as the best way that organizations can provide educational material and information about environmental health problems and disaster preparedness (71.0 percent), followed by regular mail (68.6 percent), local newspaper (64.2 percent), radio (58.6 percent), and personal contact (50.7 percent). Additionally, more than one-third of respondents indicated community events (44.7 percent), Internet (37.1 percent), and email (34.5 percent) as ways in which organizations can provide educational material and information.
• See Appendix Table 38-A for a list of other ways that organizations can provide respondent with educational material and information, including by phone, through school and educational programs, and through their employment.
• See Appendix Table 38 for distributions for each of the eight counties. Figure 38. Ways that organizations can provide respondent with educational material and information about environmental health problems and disaster preparedness
0.7
6.9
34.5
37.1
44.7
50.7
58.6
64.2
68.6
71.0
0 10 20 30 40 50 60 70 80 90 100
Refused
Other**
Internet
Community events
Personal contact
Radio
Local newspaper
Regular mail
Television
Sour
ces
of d
eliv
ery
Percent of respondents*
N=606 *Percentages do not add to 100.0 due to multiple responses. **See Appendix Table 38-A for a list of other ways that organizations can provide respondent with educational material and information. • See Appendix Table 39 for a list of additional comments from respondents. Examples include:
o “I think we’re doing a relatively good job but we could improve; we need to be more prepared as
first responders, regarding what each person’s job is; we’re just starting to do this now in the community and it will take some time to develop.”
o “Rural areas need to have a stronger understanding of what it is going to take; our church council has discussed the issue but hasn’t done anything.”
o “The over-publicity turns people off rather than making them more prepared; be cautious to not
over-publicize or set off panic; God is in control and we will be fine.”

Environmental Health Survey for Central and Western Minnesota: June 2007 Survey Results 50
APPENDIX TABLES

Environmental Health Survey for Central and Western Minnesota: June 2007 Survey Results
51
Appendix Table 1. Degree that environmental health factors relating to OUTDOOR AIR QUALITY are considered a problem
Percent of respondents by Response
Outdoor air quality factors by County
Not a problem
at all (1) (2) (3) (4)
A
serious problem
(5) DNK/
refused Total Agricultural dust, burning Overall region (N=606) (mean=1.94) 47.5 22.4 20.1 5.8 3.1 1.0 99.9Clay (N=75) (mean=2.14) 38.7 21.3 22.7 6.7 5.3 5.3 100.0Douglas (N=75) (mean=2.04) 46.7 18.7 22.7 8.0 4.0 0.0 100.1Grant (N=75) (mean=2.01) 46.7 22.7 18.7 6.7 5.3 0.0 100.1Otter Tail (N=75) (mean=1.91) 46.7 25.3 21.3 4.0 2.7 0.0 100.0Pope (N=78) (mean=1.83) 52.6 15.4 24.4 3.8 1.3 2.6 100.1Stevens (N=75) (mean=1.87) 46.7 26.7 20.0 6.7 0.0 0.0 100.1Traverse (N=76) (mean=1.87) 43.4 34.2 18.4 0.0 3.9 0.0 99.9Wilkin (N=77) (mean=1.83) 58.4 15.6 13.0 10.4 2.6 0.0 100.0Transportation emissions or exhaust Overall region (N=606) (mean=1.88) 50.8 23.4 15.0 6.8 3.5 0.5 100.0Clay (N=75) (mean=2.33) 29.3 25.3 30.7 5.3 6.7 2.7 100.0Douglas (N=75) (mean=2.00) 41.3 30.7 17.3 8.0 2.7 0.0 100.0Grant (N=75) (mean=1.72) 58.7 22.7 12.0 1.3 5.3 0.0 100.0Otter Tail (N=75) (mean=1.83) 48.0 32.0 10.7 8.0 1.3 0.0 100.0Pope (N=78) (mean=1.88) 56.4 16.7 12.8 10.3 3.8 0.0 100.0Stevens (N=75) (mean=1.72) 56.0 22.7 16.0 4.0 1.3 0.0 100.0Traverse (N=76) (mean=1.84) 55.3 21.1 10.5 6.6 5.3 1.3 100.1Wilkin (N=77) (mean=1.74) 61.0 16.9 10.4 10.4 1.3 0.0 100.0Industry Fumes Overall region (N=606) (mean=1.86) 56.3 19.0 11.6 7.1 5.6 0.5 100.1Clay (N=75) (mean=2.28) 38.7 20.0 24.0 9.3 8.0 0.0 100.0Douglas (N=75) (mean=1.81) 49.3 30.7 10.7 4.0 4.0 1.3 100.0Grant (N=75) (mean=1.73) 68.0 9.3 8.0 6.7 6.7 1.3 100.0Otter Tail (N=75) (mean=1.69) 60.0 21.3 10.7 5.3 2.7 0.0 100.0Pope (N=78) (mean=1.64) 69.2 11.5 7.7 5.1 5.1 1.3 99.9Stevens (N=75) (mean=1.85) 48.0 33.3 8.0 6.7 4.0 0.0 100.0Traverse (N=76) (mean=1.71) 67.1 10.5 10.5 7.9 3.9 0.0 99.9Wilkin (N=77) (mean=2.18) 49.4 15.6 13.0 11.7 10.4 0.0 100.1NOTE: Means are based on a one to five scale, with one being “not a problem at all” and five being “a serious problem.” “DNK/refused” is excluded from the mean.
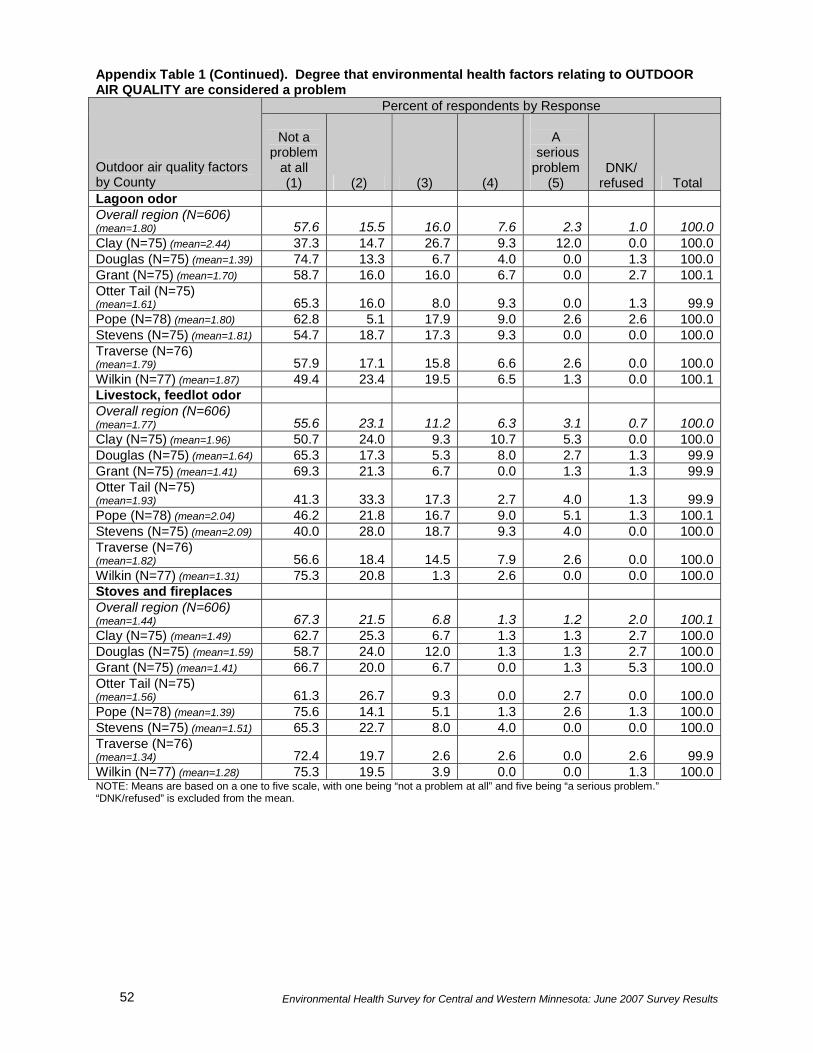
Environmental Health Survey for Central and Western Minnesota: June 2007 Survey Results 52
Appendix Table 1 (Continued). Degree that environmental health factors relating to OUTDOOR AIR QUALITY are considered a problem
Percent of respondents by Response
Outdoor air quality factors by County
Not a problem
at all (1) (2) (3) (4)
A
serious problem
(5) DNK/
refused Total Lagoon odor Overall region (N=606) (mean=1.80) 57.6 15.5 16.0 7.6 2.3 1.0 100.0Clay (N=75) (mean=2.44) 37.3 14.7 26.7 9.3 12.0 0.0 100.0Douglas (N=75) (mean=1.39) 74.7 13.3 6.7 4.0 0.0 1.3 100.0Grant (N=75) (mean=1.70) 58.7 16.0 16.0 6.7 0.0 2.7 100.1Otter Tail (N=75) (mean=1.61) 65.3 16.0 8.0 9.3 0.0 1.3 99.9Pope (N=78) (mean=1.80) 62.8 5.1 17.9 9.0 2.6 2.6 100.0Stevens (N=75) (mean=1.81) 54.7 18.7 17.3 9.3 0.0 0.0 100.0Traverse (N=76) (mean=1.79) 57.9 17.1 15.8 6.6 2.6 0.0 100.0Wilkin (N=77) (mean=1.87) 49.4 23.4 19.5 6.5 1.3 0.0 100.1Livestock, feedlot odor Overall region (N=606) (mean=1.77) 55.6 23.1 11.2 6.3 3.1 0.7 100.0Clay (N=75) (mean=1.96) 50.7 24.0 9.3 10.7 5.3 0.0 100.0Douglas (N=75) (mean=1.64) 65.3 17.3 5.3 8.0 2.7 1.3 99.9Grant (N=75) (mean=1.41) 69.3 21.3 6.7 0.0 1.3 1.3 99.9Otter Tail (N=75) (mean=1.93) 41.3 33.3 17.3 2.7 4.0 1.3 99.9Pope (N=78) (mean=2.04) 46.2 21.8 16.7 9.0 5.1 1.3 100.1Stevens (N=75) (mean=2.09) 40.0 28.0 18.7 9.3 4.0 0.0 100.0Traverse (N=76) (mean=1.82) 56.6 18.4 14.5 7.9 2.6 0.0 100.0Wilkin (N=77) (mean=1.31) 75.3 20.8 1.3 2.6 0.0 0.0 100.0Stoves and fireplaces Overall region (N=606) (mean=1.44) 67.3 21.5 6.8 1.3 1.2 2.0 100.1Clay (N=75) (mean=1.49) 62.7 25.3 6.7 1.3 1.3 2.7 100.0Douglas (N=75) (mean=1.59) 58.7 24.0 12.0 1.3 1.3 2.7 100.0Grant (N=75) (mean=1.41) 66.7 20.0 6.7 0.0 1.3 5.3 100.0Otter Tail (N=75) (mean=1.56) 61.3 26.7 9.3 0.0 2.7 0.0 100.0Pope (N=78) (mean=1.39) 75.6 14.1 5.1 1.3 2.6 1.3 100.0Stevens (N=75) (mean=1.51) 65.3 22.7 8.0 4.0 0.0 0.0 100.0Traverse (N=76) (mean=1.34) 72.4 19.7 2.6 2.6 0.0 2.6 99.9Wilkin (N=77) (mean=1.28) 75.3 19.5 3.9 0.0 0.0 1.3 100.0NOTE: Means are based on a one to five scale, with one being “not a problem at all” and five being “a serious problem.” “DNK/refused” is excluded from the mean.
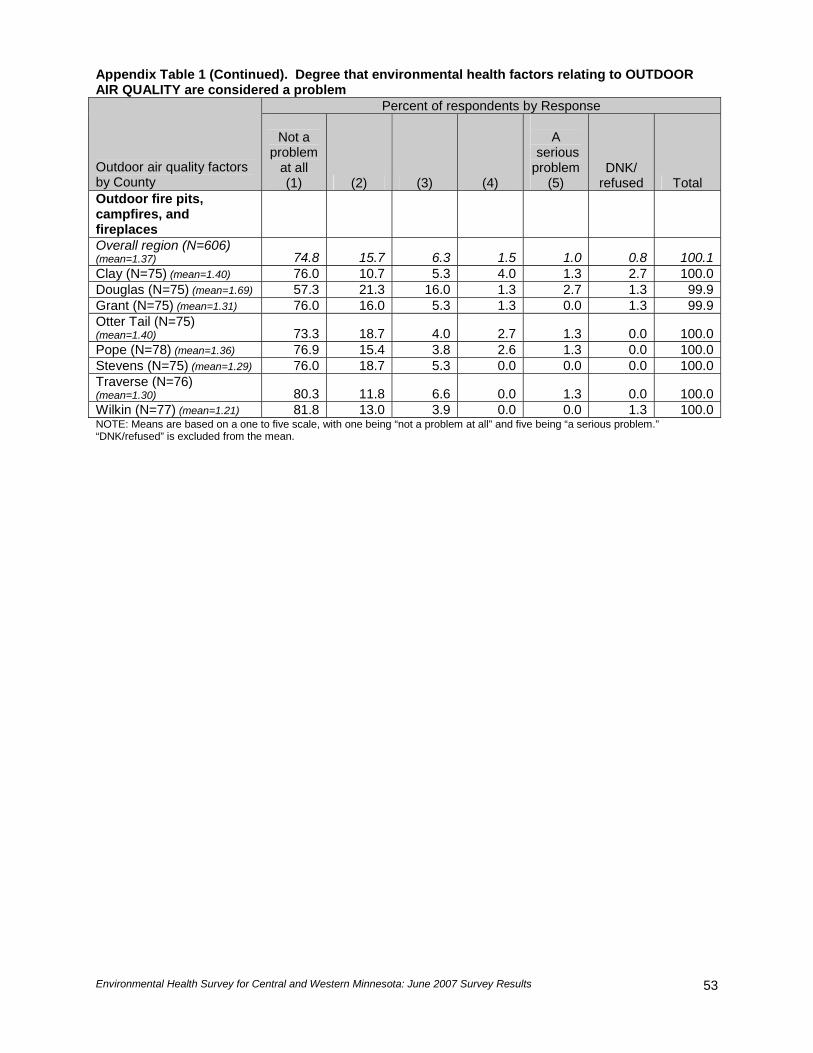
Environmental Health Survey for Central and Western Minnesota: June 2007 Survey Results
53
Appendix Table 1 (Continued). Degree that environmental health factors relating to OUTDOOR AIR QUALITY are considered a problem
Percent of respondents by Response
Outdoor air quality factors by County
Not a problem
at all (1) (2) (3) (4)
A
serious problem
(5) DNK/
refused Total Outdoor fire pits, campfires, and fireplaces Overall region (N=606) (mean=1.37) 74.8 15.7 6.3 1.5 1.0 0.8 100.1Clay (N=75) (mean=1.40) 76.0 10.7 5.3 4.0 1.3 2.7 100.0Douglas (N=75) (mean=1.69) 57.3 21.3 16.0 1.3 2.7 1.3 99.9Grant (N=75) (mean=1.31) 76.0 16.0 5.3 1.3 0.0 1.3 99.9Otter Tail (N=75) (mean=1.40) 73.3 18.7 4.0 2.7 1.3 0.0 100.0Pope (N=78) (mean=1.36) 76.9 15.4 3.8 2.6 1.3 0.0 100.0Stevens (N=75) (mean=1.29) 76.0 18.7 5.3 0.0 0.0 0.0 100.0Traverse (N=76) (mean=1.30) 80.3 11.8 6.6 0.0 1.3 0.0 100.0Wilkin (N=77) (mean=1.21) 81.8 13.0 3.9 0.0 0.0 1.3 100.0NOTE: Means are based on a one to five scale, with one being “not a problem at all” and five being “a serious problem.” “DNK/refused” is excluded from the mean.
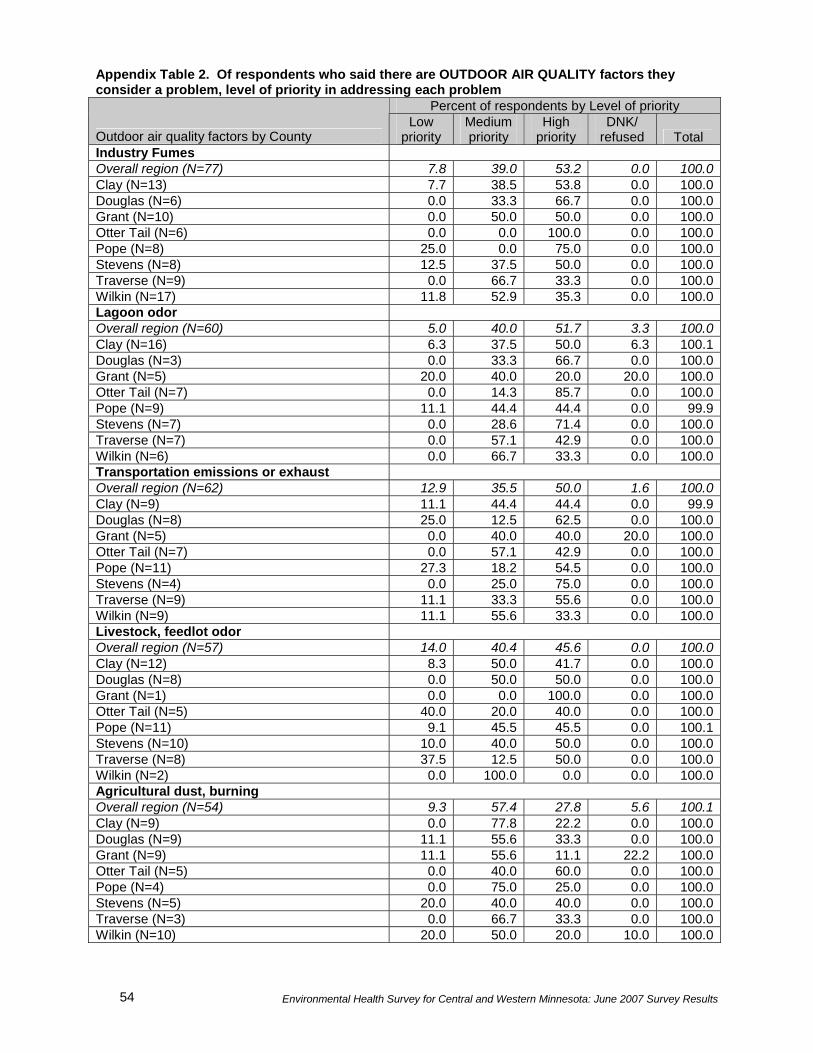
Environmental Health Survey for Central and Western Minnesota: June 2007 Survey Results 54
Appendix Table 2. Of respondents who said there are OUTDOOR AIR QUALITY factors they consider a problem, level of priority in addressing each problem
Percent of respondents by Level of priority
Outdoor air quality factors by County Low
priority Medium priority
High priority
DNK/ refused Total
Industry Fumes Overall region (N=77) 7.8 39.0 53.2 0.0 100.0Clay (N=13) 7.7 38.5 53.8 0.0 100.0Douglas (N=6) 0.0 33.3 66.7 0.0 100.0Grant (N=10) 0.0 50.0 50.0 0.0 100.0Otter Tail (N=6) 0.0 0.0 100.0 0.0 100.0Pope (N=8) 25.0 0.0 75.0 0.0 100.0Stevens (N=8) 12.5 37.5 50.0 0.0 100.0Traverse (N=9) 0.0 66.7 33.3 0.0 100.0Wilkin (N=17) 11.8 52.9 35.3 0.0 100.0Lagoon odor Overall region (N=60) 5.0 40.0 51.7 3.3 100.0Clay (N=16) 6.3 37.5 50.0 6.3 100.1Douglas (N=3) 0.0 33.3 66.7 0.0 100.0Grant (N=5) 20.0 40.0 20.0 20.0 100.0Otter Tail (N=7) 0.0 14.3 85.7 0.0 100.0Pope (N=9) 11.1 44.4 44.4 0.0 99.9Stevens (N=7) 0.0 28.6 71.4 0.0 100.0Traverse (N=7) 0.0 57.1 42.9 0.0 100.0Wilkin (N=6) 0.0 66.7 33.3 0.0 100.0Transportation emissions or exhaust Overall region (N=62) 12.9 35.5 50.0 1.6 100.0Clay (N=9) 11.1 44.4 44.4 0.0 99.9Douglas (N=8) 25.0 12.5 62.5 0.0 100.0Grant (N=5) 0.0 40.0 40.0 20.0 100.0Otter Tail (N=7) 0.0 57.1 42.9 0.0 100.0Pope (N=11) 27.3 18.2 54.5 0.0 100.0Stevens (N=4) 0.0 25.0 75.0 0.0 100.0Traverse (N=9) 11.1 33.3 55.6 0.0 100.0Wilkin (N=9) 11.1 55.6 33.3 0.0 100.0Livestock, feedlot odor Overall region (N=57) 14.0 40.4 45.6 0.0 100.0Clay (N=12) 8.3 50.0 41.7 0.0 100.0Douglas (N=8) 0.0 50.0 50.0 0.0 100.0Grant (N=1) 0.0 0.0 100.0 0.0 100.0Otter Tail (N=5) 40.0 20.0 40.0 0.0 100.0Pope (N=11) 9.1 45.5 45.5 0.0 100.1Stevens (N=10) 10.0 40.0 50.0 0.0 100.0Traverse (N=8) 37.5 12.5 50.0 0.0 100.0Wilkin (N=2) 0.0 100.0 0.0 0.0 100.0Agricultural dust, burning Overall region (N=54) 9.3 57.4 27.8 5.6 100.1Clay (N=9) 0.0 77.8 22.2 0.0 100.0Douglas (N=9) 11.1 55.6 33.3 0.0 100.0Grant (N=9) 11.1 55.6 11.1 22.2 100.0Otter Tail (N=5) 0.0 40.0 60.0 0.0 100.0Pope (N=4) 0.0 75.0 25.0 0.0 100.0Stevens (N=5) 20.0 40.0 40.0 0.0 100.0Traverse (N=3) 0.0 66.7 33.3 0.0 100.0Wilkin (N=10) 20.0 50.0 20.0 10.0 100.0

Environmental Health Survey for Central and Western Minnesota: June 2007 Survey Results
55
Appendix Table 2 (Continued). Of respondents who said there are OUTDOOR AIR QUALITY factors they consider a problem, level of priority in addressing each problem
Percent of respondents by Level of priority
Outdoor air quality factors by County Low
priority Medium priority
High priority
DNK/ refused Total
Stoves and fireplaces Overall region (N=15) 33.3 33.3 26.7 6.7 100.0Clay (N=2) 50.0 0.0 50.0 0.0 100.0Douglas (N=2) 0.0 50.0 50.0 0.0 100.0Grant (N=1) 0.0 0.0 100.0 0.0 100.0Otter Tail (N=2) 50.0 50.0 0.0 0.0 100.0Pope (N=3) 66.7 33.3 0.0 0.0 100.0Stevens (N=3) 33.3 33.3 33.3 0.0 99.9Traverse (N=2) 0.0 50.0 0.0 50.0 100.0Wilkin (N=0) NA NA NA NA NAOutdoor fire pits, campfires, and fireplaces Overall region (N=15) 33.3 53.3 13.3 0.0 99.9Clay (N=4) 50.0 25.0 25.0 0.0 100.0Douglas (N=3) 33.3 66.7 0.0 0.0 100.0Grant (N=1) 0.0 100.0 0.0 0.0 100.0Otter Tail (N=3) 0.0 100.0 0.0 0.0 100.0Pope (N=3) 66.7 33.3 0.0 0.0 100.0Stevens (N=0) NA NA NA NA NATraverse (N=1) 0.0 0.0 100.0 0.0 100.0Wilkin (N=0) NA NA NA NA NANOTE: NA = not applicable.
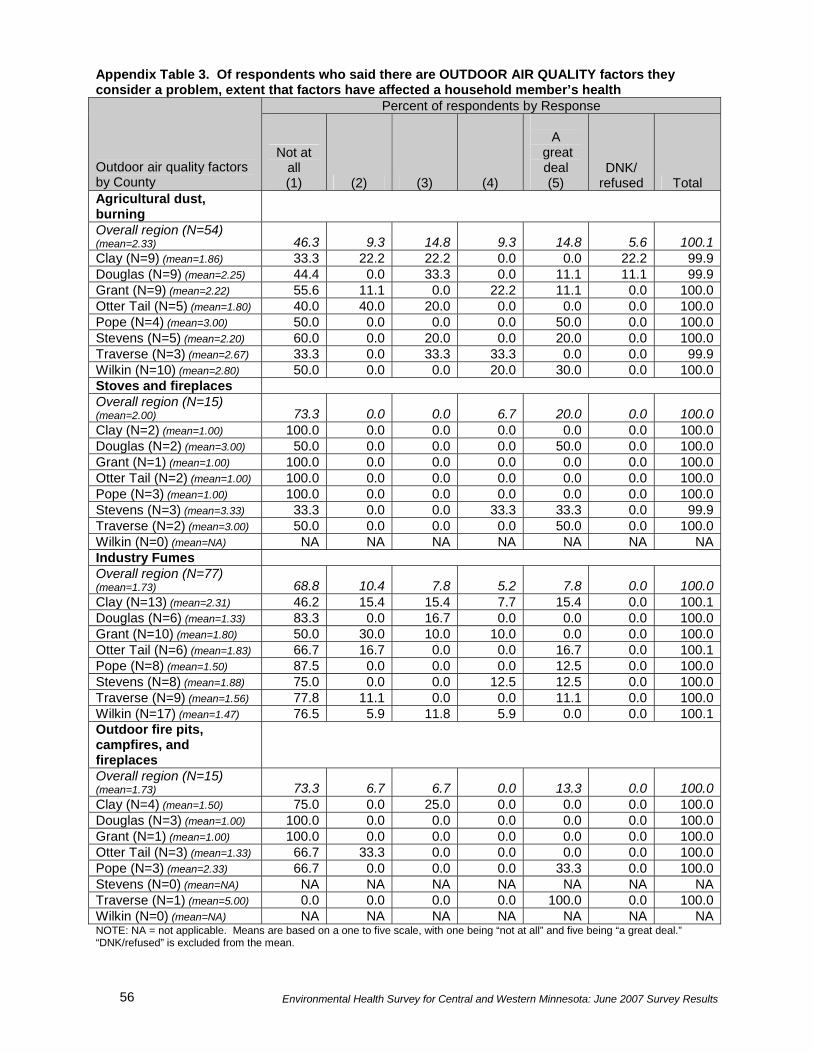
Environmental Health Survey for Central and Western Minnesota: June 2007 Survey Results 56
Appendix Table 3. Of respondents who said there are OUTDOOR AIR QUALITY factors they consider a problem, extent that factors have affected a household member’s health
Percent of respondents by Response
Outdoor air quality factors by County
Not at all (1) (2) (3) (4)
A
great deal (5)
DNK/ refused Total
Agricultural dust, burning Overall region (N=54) (mean=2.33) 46.3 9.3 14.8 9.3 14.8 5.6 100.1Clay (N=9) (mean=1.86) 33.3 22.2 22.2 0.0 0.0 22.2 99.9Douglas (N=9) (mean=2.25) 44.4 0.0 33.3 0.0 11.1 11.1 99.9Grant (N=9) (mean=2.22) 55.6 11.1 0.0 22.2 11.1 0.0 100.0Otter Tail (N=5) (mean=1.80) 40.0 40.0 20.0 0.0 0.0 0.0 100.0Pope (N=4) (mean=3.00) 50.0 0.0 0.0 0.0 50.0 0.0 100.0Stevens (N=5) (mean=2.20) 60.0 0.0 20.0 0.0 20.0 0.0 100.0Traverse (N=3) (mean=2.67) 33.3 0.0 33.3 33.3 0.0 0.0 99.9Wilkin (N=10) (mean=2.80) 50.0 0.0 0.0 20.0 30.0 0.0 100.0Stoves and fireplaces Overall region (N=15) (mean=2.00) 73.3 0.0 0.0 6.7 20.0 0.0 100.0Clay (N=2) (mean=1.00) 100.0 0.0 0.0 0.0 0.0 0.0 100.0Douglas (N=2) (mean=3.00) 50.0 0.0 0.0 0.0 50.0 0.0 100.0Grant (N=1) (mean=1.00) 100.0 0.0 0.0 0.0 0.0 0.0 100.0Otter Tail (N=2) (mean=1.00) 100.0 0.0 0.0 0.0 0.0 0.0 100.0Pope (N=3) (mean=1.00) 100.0 0.0 0.0 0.0 0.0 0.0 100.0Stevens (N=3) (mean=3.33) 33.3 0.0 0.0 33.3 33.3 0.0 99.9Traverse (N=2) (mean=3.00) 50.0 0.0 0.0 0.0 50.0 0.0 100.0Wilkin (N=0) (mean=NA) NA NA NA NA NA NA NA Industry Fumes Overall region (N=77) (mean=1.73) 68.8 10.4 7.8 5.2 7.8 0.0 100.0Clay (N=13) (mean=2.31) 46.2 15.4 15.4 7.7 15.4 0.0 100.1Douglas (N=6) (mean=1.33) 83.3 0.0 16.7 0.0 0.0 0.0 100.0Grant (N=10) (mean=1.80) 50.0 30.0 10.0 10.0 0.0 0.0 100.0Otter Tail (N=6) (mean=1.83) 66.7 16.7 0.0 0.0 16.7 0.0 100.1Pope (N=8) (mean=1.50) 87.5 0.0 0.0 0.0 12.5 0.0 100.0Stevens (N=8) (mean=1.88) 75.0 0.0 0.0 12.5 12.5 0.0 100.0Traverse (N=9) (mean=1.56) 77.8 11.1 0.0 0.0 11.1 0.0 100.0Wilkin (N=17) (mean=1.47) 76.5 5.9 11.8 5.9 0.0 0.0 100.1Outdoor fire pits, campfires, and fireplaces Overall region (N=15) (mean=1.73) 73.3 6.7 6.7 0.0 13.3 0.0 100.0Clay (N=4) (mean=1.50) 75.0 0.0 25.0 0.0 0.0 0.0 100.0Douglas (N=3) (mean=1.00) 100.0 0.0 0.0 0.0 0.0 0.0 100.0Grant (N=1) (mean=1.00) 100.0 0.0 0.0 0.0 0.0 0.0 100.0Otter Tail (N=3) (mean=1.33) 66.7 33.3 0.0 0.0 0.0 0.0 100.0Pope (N=3) (mean=2.33) 66.7 0.0 0.0 0.0 33.3 0.0 100.0Stevens (N=0) (mean=NA) NA NA NA NA NA NA NATraverse (N=1) (mean=5.00) 0.0 0.0 0.0 0.0 100.0 0.0 100.0Wilkin (N=0) (mean=NA) NA NA NA NA NA NA NANOTE: NA = not applicable. Means are based on a one to five scale, with one being “not at all” and five being “a great deal.” “DNK/refused” is excluded from the mean.
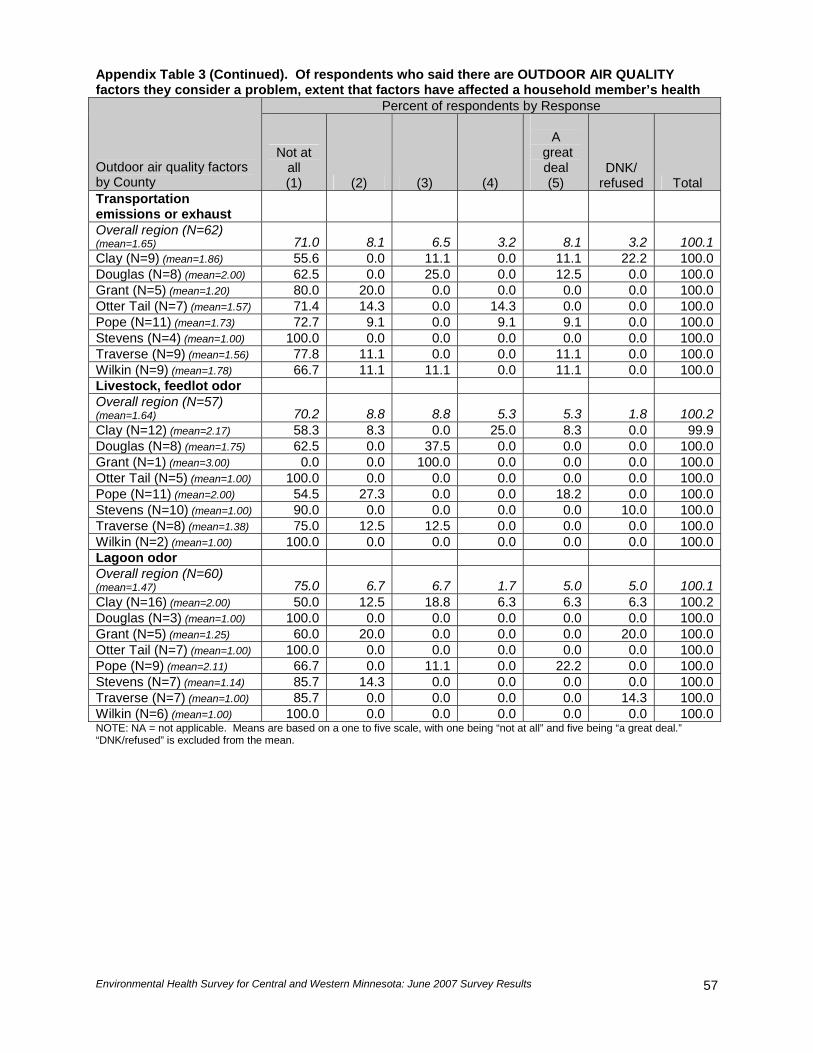
Environmental Health Survey for Central and Western Minnesota: June 2007 Survey Results
57
Appendix Table 3 (Continued). Of respondents who said there are OUTDOOR AIR QUALITY factors they consider a problem, extent that factors have affected a household member’s health
Percent of respondents by Response
Outdoor air quality factors by County
Not at all (1) (2) (3) (4)
A
great deal (5)
DNK/ refused Total
Transportation emissions or exhaust Overall region (N=62) (mean=1.65) 71.0 8.1 6.5 3.2 8.1 3.2 100.1Clay (N=9) (mean=1.86) 55.6 0.0 11.1 0.0 11.1 22.2 100.0Douglas (N=8) (mean=2.00) 62.5 0.0 25.0 0.0 12.5 0.0 100.0Grant (N=5) (mean=1.20) 80.0 20.0 0.0 0.0 0.0 0.0 100.0Otter Tail (N=7) (mean=1.57) 71.4 14.3 0.0 14.3 0.0 0.0 100.0Pope (N=11) (mean=1.73) 72.7 9.1 0.0 9.1 9.1 0.0 100.0Stevens (N=4) (mean=1.00) 100.0 0.0 0.0 0.0 0.0 0.0 100.0Traverse (N=9) (mean=1.56) 77.8 11.1 0.0 0.0 11.1 0.0 100.0Wilkin (N=9) (mean=1.78) 66.7 11.1 11.1 0.0 11.1 0.0 100.0Livestock, feedlot odor Overall region (N=57) (mean=1.64) 70.2 8.8 8.8 5.3 5.3 1.8 100.2Clay (N=12) (mean=2.17) 58.3 8.3 0.0 25.0 8.3 0.0 99.9Douglas (N=8) (mean=1.75) 62.5 0.0 37.5 0.0 0.0 0.0 100.0Grant (N=1) (mean=3.00) 0.0 0.0 100.0 0.0 0.0 0.0 100.0Otter Tail (N=5) (mean=1.00) 100.0 0.0 0.0 0.0 0.0 0.0 100.0Pope (N=11) (mean=2.00) 54.5 27.3 0.0 0.0 18.2 0.0 100.0Stevens (N=10) (mean=1.00) 90.0 0.0 0.0 0.0 0.0 10.0 100.0Traverse (N=8) (mean=1.38) 75.0 12.5 12.5 0.0 0.0 0.0 100.0Wilkin (N=2) (mean=1.00) 100.0 0.0 0.0 0.0 0.0 0.0 100.0Lagoon odor Overall region (N=60) (mean=1.47) 75.0 6.7 6.7 1.7 5.0 5.0 100.1Clay (N=16) (mean=2.00) 50.0 12.5 18.8 6.3 6.3 6.3 100.2Douglas (N=3) (mean=1.00) 100.0 0.0 0.0 0.0 0.0 0.0 100.0Grant (N=5) (mean=1.25) 60.0 20.0 0.0 0.0 0.0 20.0 100.0Otter Tail (N=7) (mean=1.00) 100.0 0.0 0.0 0.0 0.0 0.0 100.0Pope (N=9) (mean=2.11) 66.7 0.0 11.1 0.0 22.2 0.0 100.0Stevens (N=7) (mean=1.14) 85.7 14.3 0.0 0.0 0.0 0.0 100.0Traverse (N=7) (mean=1.00) 85.7 0.0 0.0 0.0 0.0 14.3 100.0Wilkin (N=6) (mean=1.00) 100.0 0.0 0.0 0.0 0.0 0.0 100.0NOTE: NA = not applicable. Means are based on a one to five scale, with one being “not at all” and five being “a great deal.” “DNK/refused” is excluded from the mean.
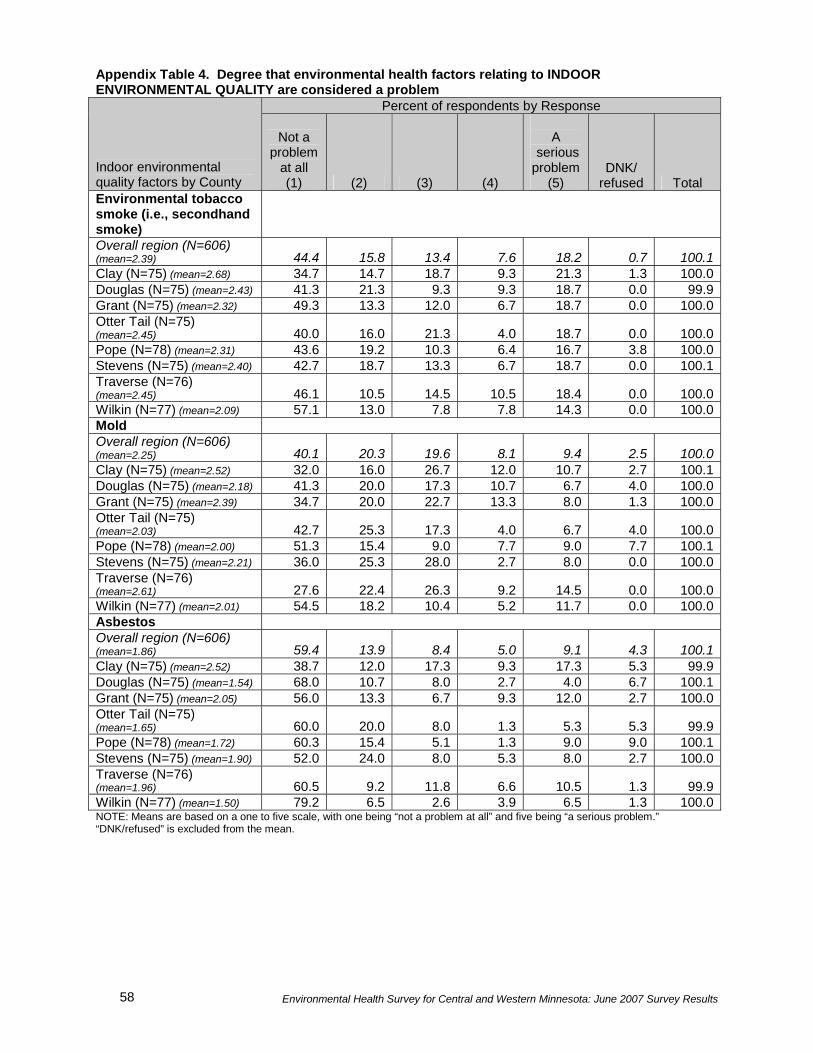
Environmental Health Survey for Central and Western Minnesota: June 2007 Survey Results 58
Appendix Table 4. Degree that environmental health factors relating to INDOOR ENVIRONMENTAL QUALITY are considered a problem
Percent of respondents by Response
Indoor environmental quality factors by County
Not a problem
at all (1) (2) (3) (4)
A
serious problem
(5) DNK/
refused Total Environmental tobacco smoke (i.e., secondhand smoke) Overall region (N=606) (mean=2.39) 44.4 15.8 13.4 7.6 18.2 0.7 100.1Clay (N=75) (mean=2.68) 34.7 14.7 18.7 9.3 21.3 1.3 100.0Douglas (N=75) (mean=2.43) 41.3 21.3 9.3 9.3 18.7 0.0 99.9Grant (N=75) (mean=2.32) 49.3 13.3 12.0 6.7 18.7 0.0 100.0Otter Tail (N=75) (mean=2.45) 40.0 16.0 21.3 4.0 18.7 0.0 100.0Pope (N=78) (mean=2.31) 43.6 19.2 10.3 6.4 16.7 3.8 100.0Stevens (N=75) (mean=2.40) 42.7 18.7 13.3 6.7 18.7 0.0 100.1Traverse (N=76) (mean=2.45) 46.1 10.5 14.5 10.5 18.4 0.0 100.0Wilkin (N=77) (mean=2.09) 57.1 13.0 7.8 7.8 14.3 0.0 100.0Mold Overall region (N=606) (mean=2.25) 40.1 20.3 19.6 8.1 9.4 2.5 100.0Clay (N=75) (mean=2.52) 32.0 16.0 26.7 12.0 10.7 2.7 100.1Douglas (N=75) (mean=2.18) 41.3 20.0 17.3 10.7 6.7 4.0 100.0Grant (N=75) (mean=2.39) 34.7 20.0 22.7 13.3 8.0 1.3 100.0Otter Tail (N=75) (mean=2.03) 42.7 25.3 17.3 4.0 6.7 4.0 100.0Pope (N=78) (mean=2.00) 51.3 15.4 9.0 7.7 9.0 7.7 100.1Stevens (N=75) (mean=2.21) 36.0 25.3 28.0 2.7 8.0 0.0 100.0Traverse (N=76) (mean=2.61) 27.6 22.4 26.3 9.2 14.5 0.0 100.0Wilkin (N=77) (mean=2.01) 54.5 18.2 10.4 5.2 11.7 0.0 100.0Asbestos Overall region (N=606) (mean=1.86) 59.4 13.9 8.4 5.0 9.1 4.3 100.1Clay (N=75) (mean=2.52) 38.7 12.0 17.3 9.3 17.3 5.3 99.9Douglas (N=75) (mean=1.54) 68.0 10.7 8.0 2.7 4.0 6.7 100.1Grant (N=75) (mean=2.05) 56.0 13.3 6.7 9.3 12.0 2.7 100.0Otter Tail (N=75) (mean=1.65) 60.0 20.0 8.0 1.3 5.3 5.3 99.9Pope (N=78) (mean=1.72) 60.3 15.4 5.1 1.3 9.0 9.0 100.1Stevens (N=75) (mean=1.90) 52.0 24.0 8.0 5.3 8.0 2.7 100.0Traverse (N=76) (mean=1.96) 60.5 9.2 11.8 6.6 10.5 1.3 99.9Wilkin (N=77) (mean=1.50) 79.2 6.5 2.6 3.9 6.5 1.3 100.0NOTE: Means are based on a one to five scale, with one being “not a problem at all” and five being “a serious problem.” “DNK/refused” is excluded from the mean.
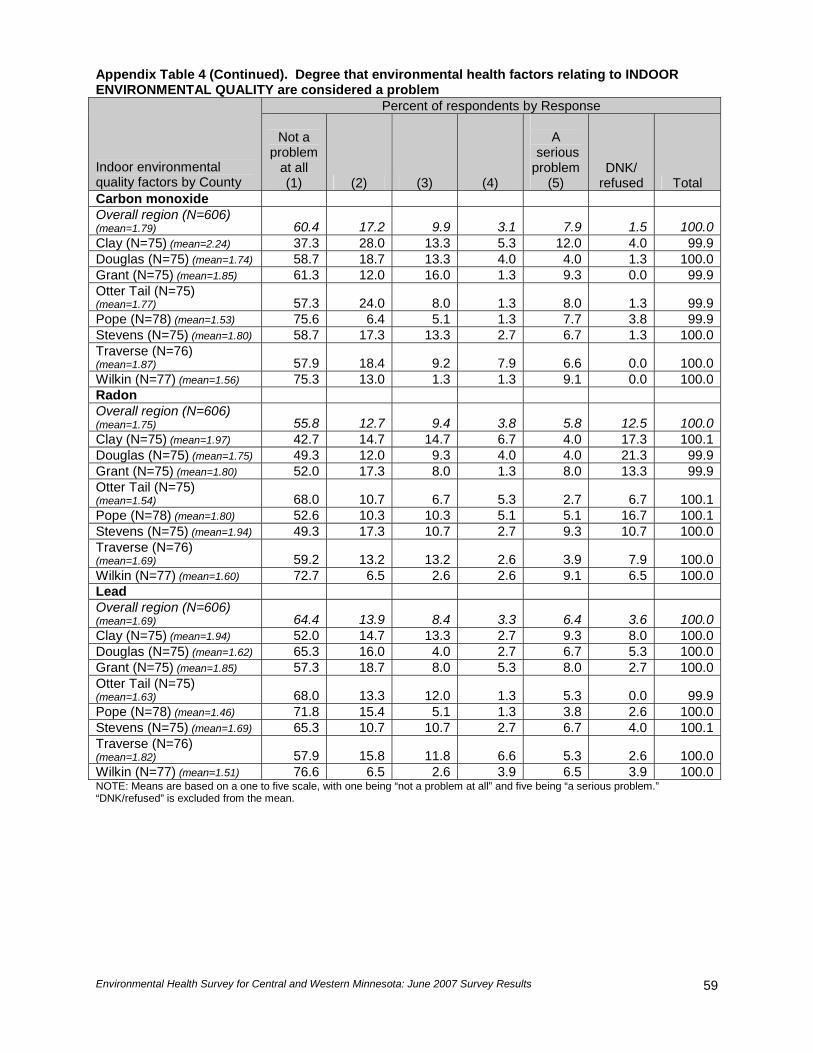
Environmental Health Survey for Central and Western Minnesota: June 2007 Survey Results
59
Appendix Table 4 (Continued). Degree that environmental health factors relating to INDOOR ENVIRONMENTAL QUALITY are considered a problem
Percent of respondents by Response
Indoor environmental quality factors by County
Not a problem
at all (1) (2) (3) (4)
A
serious problem
(5) DNK/
refused Total Carbon monoxide Overall region (N=606) (mean=1.79) 60.4 17.2 9.9 3.1 7.9 1.5 100.0Clay (N=75) (mean=2.24) 37.3 28.0 13.3 5.3 12.0 4.0 99.9Douglas (N=75) (mean=1.74) 58.7 18.7 13.3 4.0 4.0 1.3 100.0Grant (N=75) (mean=1.85) 61.3 12.0 16.0 1.3 9.3 0.0 99.9Otter Tail (N=75) (mean=1.77) 57.3 24.0 8.0 1.3 8.0 1.3 99.9Pope (N=78) (mean=1.53) 75.6 6.4 5.1 1.3 7.7 3.8 99.9Stevens (N=75) (mean=1.80) 58.7 17.3 13.3 2.7 6.7 1.3 100.0Traverse (N=76) (mean=1.87) 57.9 18.4 9.2 7.9 6.6 0.0 100.0Wilkin (N=77) (mean=1.56) 75.3 13.0 1.3 1.3 9.1 0.0 100.0Radon Overall region (N=606) (mean=1.75) 55.8 12.7 9.4 3.8 5.8 12.5 100.0Clay (N=75) (mean=1.97) 42.7 14.7 14.7 6.7 4.0 17.3 100.1Douglas (N=75) (mean=1.75) 49.3 12.0 9.3 4.0 4.0 21.3 99.9Grant (N=75) (mean=1.80) 52.0 17.3 8.0 1.3 8.0 13.3 99.9Otter Tail (N=75) (mean=1.54) 68.0 10.7 6.7 5.3 2.7 6.7 100.1Pope (N=78) (mean=1.80) 52.6 10.3 10.3 5.1 5.1 16.7 100.1Stevens (N=75) (mean=1.94) 49.3 17.3 10.7 2.7 9.3 10.7 100.0Traverse (N=76) (mean=1.69) 59.2 13.2 13.2 2.6 3.9 7.9 100.0Wilkin (N=77) (mean=1.60) 72.7 6.5 2.6 2.6 9.1 6.5 100.0Lead Overall region (N=606) (mean=1.69) 64.4 13.9 8.4 3.3 6.4 3.6 100.0Clay (N=75) (mean=1.94) 52.0 14.7 13.3 2.7 9.3 8.0 100.0Douglas (N=75) (mean=1.62) 65.3 16.0 4.0 2.7 6.7 5.3 100.0Grant (N=75) (mean=1.85) 57.3 18.7 8.0 5.3 8.0 2.7 100.0Otter Tail (N=75) (mean=1.63) 68.0 13.3 12.0 1.3 5.3 0.0 99.9Pope (N=78) (mean=1.46) 71.8 15.4 5.1 1.3 3.8 2.6 100.0Stevens (N=75) (mean=1.69) 65.3 10.7 10.7 2.7 6.7 4.0 100.1Traverse (N=76) (mean=1.82) 57.9 15.8 11.8 6.6 5.3 2.6 100.0Wilkin (N=77) (mean=1.51) 76.6 6.5 2.6 3.9 6.5 3.9 100.0NOTE: Means are based on a one to five scale, with one being “not a problem at all” and five being “a serious problem.” “DNK/refused” is excluded from the mean.
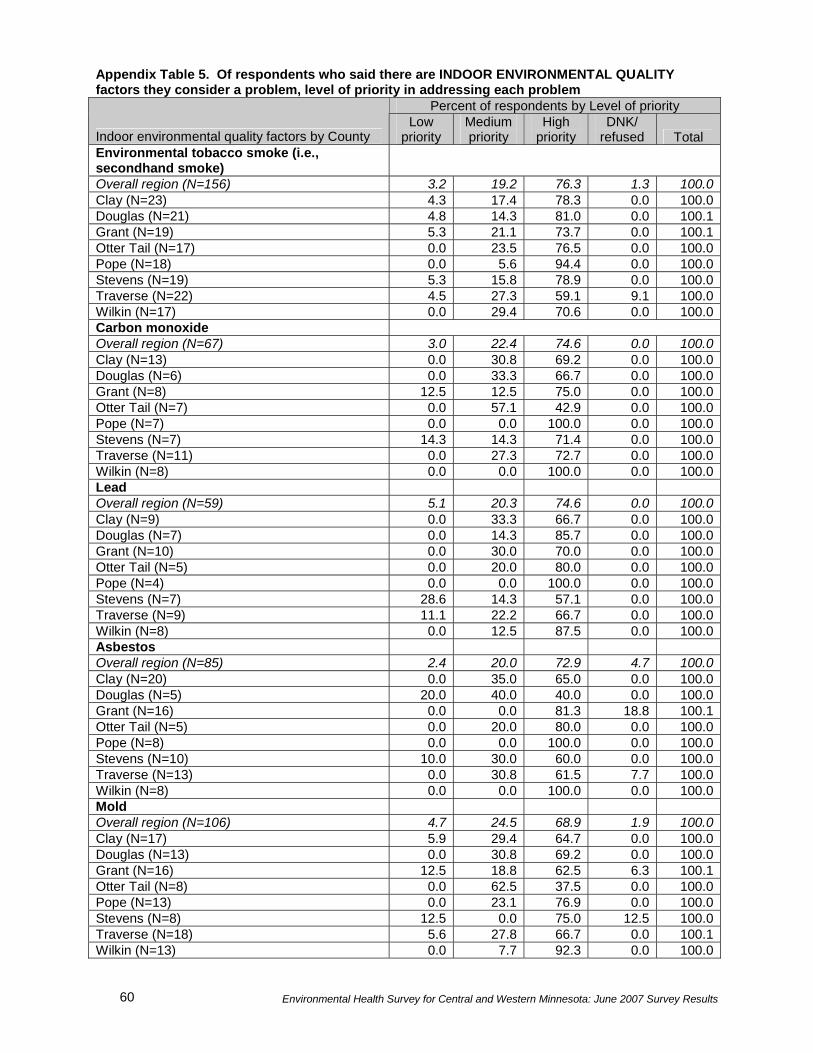
Environmental Health Survey for Central and Western Minnesota: June 2007 Survey Results 60
Appendix Table 5. Of respondents who said there are INDOOR ENVIRONMENTAL QUALITY factors they consider a problem, level of priority in addressing each problem
Percent of respondents by Level of priority
Indoor environmental quality factors by County Low
priority Medium priority
High priority
DNK/ refused Total
Environmental tobacco smoke (i.e., secondhand smoke) Overall region (N=156) 3.2 19.2 76.3 1.3 100.0Clay (N=23) 4.3 17.4 78.3 0.0 100.0Douglas (N=21) 4.8 14.3 81.0 0.0 100.1Grant (N=19) 5.3 21.1 73.7 0.0 100.1Otter Tail (N=17) 0.0 23.5 76.5 0.0 100.0Pope (N=18) 0.0 5.6 94.4 0.0 100.0Stevens (N=19) 5.3 15.8 78.9 0.0 100.0Traverse (N=22) 4.5 27.3 59.1 9.1 100.0Wilkin (N=17) 0.0 29.4 70.6 0.0 100.0Carbon monoxide Overall region (N=67) 3.0 22.4 74.6 0.0 100.0Clay (N=13) 0.0 30.8 69.2 0.0 100.0Douglas (N=6) 0.0 33.3 66.7 0.0 100.0Grant (N=8) 12.5 12.5 75.0 0.0 100.0Otter Tail (N=7) 0.0 57.1 42.9 0.0 100.0Pope (N=7) 0.0 0.0 100.0 0.0 100.0Stevens (N=7) 14.3 14.3 71.4 0.0 100.0Traverse (N=11) 0.0 27.3 72.7 0.0 100.0Wilkin (N=8) 0.0 0.0 100.0 0.0 100.0Lead Overall region (N=59) 5.1 20.3 74.6 0.0 100.0Clay (N=9) 0.0 33.3 66.7 0.0 100.0Douglas (N=7) 0.0 14.3 85.7 0.0 100.0Grant (N=10) 0.0 30.0 70.0 0.0 100.0Otter Tail (N=5) 0.0 20.0 80.0 0.0 100.0Pope (N=4) 0.0 0.0 100.0 0.0 100.0Stevens (N=7) 28.6 14.3 57.1 0.0 100.0Traverse (N=9) 11.1 22.2 66.7 0.0 100.0Wilkin (N=8) 0.0 12.5 87.5 0.0 100.0Asbestos Overall region (N=85) 2.4 20.0 72.9 4.7 100.0Clay (N=20) 0.0 35.0 65.0 0.0 100.0Douglas (N=5) 20.0 40.0 40.0 0.0 100.0Grant (N=16) 0.0 0.0 81.3 18.8 100.1Otter Tail (N=5) 0.0 20.0 80.0 0.0 100.0Pope (N=8) 0.0 0.0 100.0 0.0 100.0Stevens (N=10) 10.0 30.0 60.0 0.0 100.0Traverse (N=13) 0.0 30.8 61.5 7.7 100.0Wilkin (N=8) 0.0 0.0 100.0 0.0 100.0Mold Overall region (N=106) 4.7 24.5 68.9 1.9 100.0Clay (N=17) 5.9 29.4 64.7 0.0 100.0Douglas (N=13) 0.0 30.8 69.2 0.0 100.0Grant (N=16) 12.5 18.8 62.5 6.3 100.1Otter Tail (N=8) 0.0 62.5 37.5 0.0 100.0Pope (N=13) 0.0 23.1 76.9 0.0 100.0Stevens (N=8) 12.5 0.0 75.0 12.5 100.0Traverse (N=18) 5.6 27.8 66.7 0.0 100.1Wilkin (N=13) 0.0 7.7 92.3 0.0 100.0

Environmental Health Survey for Central and Western Minnesota: June 2007 Survey Results
61
Appendix Table 5 (Continued). Of respondents who said there are INDOOR ENVIRONMENTAL QUALITY factors they consider a problem, level of priority in addressing each problem
Percent of respondents by Level of priority
Indoor environmental quality factors by County Low
priority Medium priority
High priority
DNK/ refused Total
Radon Overall region (N=58) 6.9 25.9 63.8 3.4 100.0Clay (N=8) 12.5 25.0 50.0 12.5 100.0Douglas (N=6) 0.0 16.7 83.3 0.0 100.0Grant (N=7) 0.0 42.9 42.9 14.3 100.1Otter Tail (N=6) 33.3 33.3 33.3 0.0 99.9Pope (N=8) 0.0 25.0 75.0 0.0 100.0Stevens (N=9) 0.0 11.1 88.9 0.0 100.0Traverse (N=5) 0.0 20.0 80.0 0.0 100.0Wilkin (N=9) 11.1 33.3 55.6 0.0 100.0 Appendix Table 6. Of respondents who said there are INDOOR ENVIRONMENTAL QUALITY factors they consider a problem, extent that factors have affected a household member’s health
Percent of respondents by Response
Indoor environmental quality factors by County
Not at all (1) (2) (3) (4)
A
great deal (5)
DNK/ refused Total
Environmental tobacco smoke (i.e., secondhand smoke) Overall region (N=156) (mean=2.45) 53.2 5.8 7.7 7.7 25.0 0.6 100.0Clay (N=23) (mean=2.65) 43.5 4.3 17.4 13.0 21.7 0.0 99.9Douglas (N=21) (mean=2.62) 52.4 9.5 0.0 0.0 38.1 0.0 100.0Grant (N=19) (mean=1.63) 78.9 0.0 10.5 0.0 10.5 0.0 99.9Otter Tail (N=17) (mean=3.00) 47.1 0.0 5.9 0.0 47.1 0.0 100.1Pope (N=18) (mean=2.39) 61.1 0.0 5.6 5.6 27.8 0.0 100.1Stevens (N=19) (mean=2.37) 52.6 5.3 10.5 15.8 15.8 0.0 100.0Traverse (N=22) (mean=2.29) 54.5 4.5 4.5 18.2 13.6 4.5 99.8Wilkin (N=17) (mean=2.71) 35.3 23.5 5.9 5.9 29.4 0.0 100.0Mold Overall region (N=106) (mean=2.34) 58.5 3.8 5.7 9.4 22.6 0.0 100.0Clay (N=17) (mean=2.47) 58.8 5.9 0.0 0.0 35.3 0.0 100.0Douglas (N=13) (mean=2.85) 46.2 0.0 7.7 15.4 30.8 0.0 100.1Grant (N=16) (mean=1.94) 68.8 0.0 12.5 6.3 12.5 0.0 100.1Otter Tail (N=8) (mean=1.38) 75.0 12.5 12.5 0.0 0.0 0.0 100.0Pope (N=13) (mean=2.77) 46.2 0.0 7.7 23.1 23.1 0.0 100.1Stevens (N=8) (mean=2.13) 62.5 12.5 0.0 0.0 25.0 0.0 100.0Traverse (N=18) (mean=2.22) 61.1 5.6 0.0 16.7 16.7 0.0 100.1Wilkin (N=13) (mean=2.62) 53.8 0.0 7.7 7.7 30.8 0.0 100.0NOTE: Means are based on a one to five scale, with one being “not at all” and five being “a great deal.” “DNK/refused” is excluded from the mean.

Environmental Health Survey for Central and Western Minnesota: June 2007 Survey Results 62
Appendix Table 6 (Continued). Of respondents who said there re INDOOR ENVIRONMENTAL QUALITY factors they consider a problem, extent that factors have affected a household member’s health
Percent of respondents by Response
Indoor environmental quality factors by County
Not at all (1) (2) (3) (4)
A
great deal (5)
DNK/ refused Total
Carbon monoxide Overall region (N=67) (mean=1.57) 77.6 3.0 4.5 4.5 7.5 3.0 100.1Clay (N=13) (mean=1.42) 76.9 0.0 7.7 7.7 0.0 7.7 100.0Douglas (N=6) (mean=1.00) 100.0 0.0 0.0 0.0 0.0 0.0 100.0Grant (N=8) (mean=1.50) 87.5 0.0 0.0 0.0 12.5 0.0 100.0Otter Tail (N=7) (mean=1.71) 71.4 14.3 0.0 0.0 14.3 0.0 100.0Pope (N=7) (mean=2.86) 42.9 0.0 14.3 14.3 28.6 0.0 100.1Stevens (N=7) (mean=1.00) 100.0 0.0 0.0 0.0 0.0 0.0 100.0Traverse (N=11) (mean=1.60) 63.6 9.1 9.1 9.1 0.0 9.1 100.0Wilkin (N=8) (mean=1.50) 87.5 0.0 0.0 0.0 12.5 0.0 100.0Asbestos Overall region (N=85) (mean=1.49) 80.0 1.2 5.9 3.5 5.9 3.5 100.0Clay (N=20) (mean=1.16) 90.0 0.0 0.0 5.0 0.0 5.0 100.0Douglas (N=5) (mean=1.00) 100.0 0.0 0.0 0.0 0.0 0.0 100.0Grant (N=16) (mean=1.38) 81.3 6.3 6.3 6.3 0.0 0.0 100.2Otter Tail (N=5) (mean=1.40) 80.0 0.0 20.0 0.0 0.0 0.0 100.0Pope (N=8) (mean=2.71) 37.5 0.0 25.0 0.0 25.0 12.5 100.0Stevens (N=10) (mean=1.44) 80.0 0.0 0.0 0.0 10.0 10.0 100.0Traverse (N=13) (mean=1.46) 84.6 0.0 7.7 0.0 7.7 0.0 100.0Wilkin (N=8) (mean=1.88) 75.0 0.0 0.0 12.5 12.5 0.0 100.0Radon Overall region (N=58) (mean=1.26) 91.4 1.7 1.7 0.0 5.2 0.0 100.0Clay (N=8) (mean=1.00) 100.0 0.0 0.0 0.0 0.0 0.0 100.0Douglas (N=6) (mean=2.00) 66.7 0.0 16.7 0.0 16.7 0.0 100.1Grant (N=7) (mean=1.00) 100.0 0.0 0.0 0.0 0.0 0.0 100.0Otter Tail (N=6) (mean=1.00) 100.0 0.0 0.0 0.0 0.0 0.0 100.0Pope (N=8) (mean=1.50) 87.5 0.0 0.0 0.0 12.5 0.0 100.0Stevens (N=9) (mean=1.44) 88.9 0.0 0.0 0.0 11.1 0.0 100.0Traverse (N=5) (mean=1.20) 80.0 20.0 0.0 0.0 0.0 0.0 100.0Wilkin (N=9) (mean=1.00) 100.0 0.0 0.0 0.0 0.0 0.0 100.0Lead Overall region (N=59) (mean=1.20) 86.4 1.7 3.4 3.4 0.0 5.1 100.0Clay (N=9) (mean=1.00) 77.8 0.0 0.0 0.0 0.0 22.2 100.0Douglas (N=7) (mean=1.00) 100.0 0.0 0.0 0.0 0.0 0.0 100.0Grant (N=10) (mean=1.00) 100.0 0.0 0.0 0.0 0.0 0.0 100.0Otter Tail (N=5) (mean=1.00) 100.0 0.0 0.0 0.0 0.0 0.0 100.0Pope (N=4) (mean=1.75) 75.0 0.0 0.0 25.0 0.0 0.0 100.0Stevens (N=7) (mean=1.00) 85.7 0.0 0.0 0.0 0.0 14.3 100.0Traverse (N=9) (mean=1.56) 66.7 11.1 22.2 0.0 0.0 0.0 100.0Wilkin (N=8) (mean=1.38) 87.5 0.0 0.0 12.5 0.0 0.0 100.0NOTE: Means are based on a one to five scale, with one being “not at all” and five being “a great deal.” “DNK/refused” is excluded from the mean.
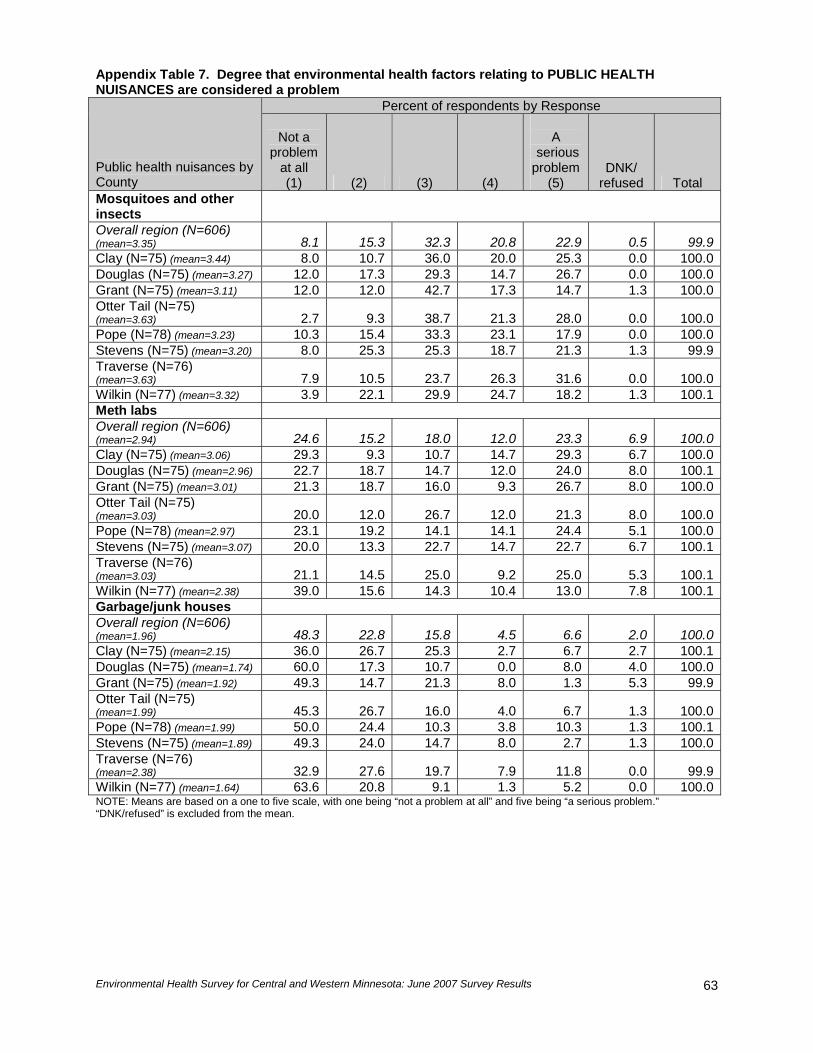
Environmental Health Survey for Central and Western Minnesota: June 2007 Survey Results
63
Appendix Table 7. Degree that environmental health factors relating to PUBLIC HEALTH NUISANCES are considered a problem
Percent of respondents by Response
Public health nuisances by County
Not a problem
at all (1) (2) (3) (4)
A
serious problem
(5) DNK/
refused Total Mosquitoes and other insects Overall region (N=606) (mean=3.35) 8.1 15.3 32.3 20.8 22.9 0.5 99.9Clay (N=75) (mean=3.44) 8.0 10.7 36.0 20.0 25.3 0.0 100.0Douglas (N=75) (mean=3.27) 12.0 17.3 29.3 14.7 26.7 0.0 100.0Grant (N=75) (mean=3.11) 12.0 12.0 42.7 17.3 14.7 1.3 100.0Otter Tail (N=75) (mean=3.63) 2.7 9.3 38.7 21.3 28.0 0.0 100.0Pope (N=78) (mean=3.23) 10.3 15.4 33.3 23.1 17.9 0.0 100.0Stevens (N=75) (mean=3.20) 8.0 25.3 25.3 18.7 21.3 1.3 99.9Traverse (N=76) (mean=3.63) 7.9 10.5 23.7 26.3 31.6 0.0 100.0Wilkin (N=77) (mean=3.32) 3.9 22.1 29.9 24.7 18.2 1.3 100.1Meth labs Overall region (N=606) (mean=2.94) 24.6 15.2 18.0 12.0 23.3 6.9 100.0Clay (N=75) (mean=3.06) 29.3 9.3 10.7 14.7 29.3 6.7 100.0Douglas (N=75) (mean=2.96) 22.7 18.7 14.7 12.0 24.0 8.0 100.1Grant (N=75) (mean=3.01) 21.3 18.7 16.0 9.3 26.7 8.0 100.0Otter Tail (N=75) (mean=3.03) 20.0 12.0 26.7 12.0 21.3 8.0 100.0Pope (N=78) (mean=2.97) 23.1 19.2 14.1 14.1 24.4 5.1 100.0Stevens (N=75) (mean=3.07) 20.0 13.3 22.7 14.7 22.7 6.7 100.1Traverse (N=76) (mean=3.03) 21.1 14.5 25.0 9.2 25.0 5.3 100.1Wilkin (N=77) (mean=2.38) 39.0 15.6 14.3 10.4 13.0 7.8 100.1Garbage/junk houses Overall region (N=606) (mean=1.96) 48.3 22.8 15.8 4.5 6.6 2.0 100.0Clay (N=75) (mean=2.15) 36.0 26.7 25.3 2.7 6.7 2.7 100.1Douglas (N=75) (mean=1.74) 60.0 17.3 10.7 0.0 8.0 4.0 100.0Grant (N=75) (mean=1.92) 49.3 14.7 21.3 8.0 1.3 5.3 99.9Otter Tail (N=75) (mean=1.99) 45.3 26.7 16.0 4.0 6.7 1.3 100.0Pope (N=78) (mean=1.99) 50.0 24.4 10.3 3.8 10.3 1.3 100.1Stevens (N=75) (mean=1.89) 49.3 24.0 14.7 8.0 2.7 1.3 100.0Traverse (N=76) (mean=2.38) 32.9 27.6 19.7 7.9 11.8 0.0 99.9Wilkin (N=77) (mean=1.64) 63.6 20.8 9.1 1.3 5.2 0.0 100.0NOTE: Means are based on a one to five scale, with one being “not a problem at all” and five being “a serious problem.” “DNK/refused” is excluded from the mean.

Environmental Health Survey for Central and Western Minnesota: June 2007 Survey Results 64
Appendix Table 7 (Continued). Degree that environmental health factors relating to PUBLIC HEALTH NUISANCES are considered a problem
Percent of respondents by Response
Public health nuisances by County
Not a problem
at all (1) (2) (3) (4)
A
serious problem
(5) DNK/
refused Total Improper disposal of hazardous waste Overall region (N=606) (mean=1.91) 54.6 17.5 12.0 4.1 8.6 3.1 99.9Clay (N=75) (mean=2.38) 42.7 18.7 10.7 10.7 16.0 1.3 100.1Douglas (N=75) (mean=1.85) 50.7 20.0 10.7 1.3 8.0 9.3 100.0Grant (N=75) (mean=1.94) 56.0 13.3 13.3 2.7 10.7 4.0 100.0Otter Tail (N=75) (mean=1.92) 44.0 26.7 21.3 1.3 4.0 2.7 100.0Pope (N=78) (mean=1.87) 62.8 12.8 6.4 2.6 12.8 2.6 100.0Stevens (N=75) (mean=2.01) 48.0 17.3 18.7 5.3 6.7 4.0 100.0Traverse (N=76) (mean=1.85) 59.2 15.8 9.2 7.9 6.6 1.3 100.0Wilkin (N=77) (mean=1.48) 72.7 15.6 6.5 1.3 3.9 0.0 100.0Animals/rodents Overall region (N=606) (mean=1.77) 52.5 27.6 13.7 3.0 3.1 0.2 100.1Clay (N=75) (mean=1.84) 45.3 32.0 16.0 2.7 2.7 1.3 100.0Douglas (N=75) (mean=1.80) 53.3 22.7 16.0 6.7 1.3 0.0 100.0Grant (N=75) (mean=1.79) 50.7 29.3 13.3 4.0 2.7 0.0 100.0Otter Tail (N=75) (mean=1.85) 48.0 28.0 18.7 1.3 4.0 0.0 100.0Pope (N=78) (mean=1.60) 61.5 24.4 9.0 2.6 2.6 0.0 100.1Stevens (N=75) (mean=1.72) 53.3 28.0 13.3 4.0 1.3 0.0 99.9Traverse (N=76) (mean=1.88) 48.7 30.3 11.8 2.6 6.6 0.0 100.0Wilkin (N=77) (mean=1.65) 58.4 26.0 11.7 0.0 3.9 0.0 100.0Illegal/open dumps Overall region (N=606) (mean=1.57) 67.7 13.0 8.6 2.6 4.1 4.0 100.0Clay (N=75) (mean=1.81) 53.3 18.7 9.3 5.3 5.3 8.0 99.9Douglas (N=75) (mean=1.47) 69.3 17.3 4.0 1.3 4.0 4.0 99.9Grant (N=75) (mean=1.60) 66.7 9.3 14.7 2.7 2.7 4.0 100.1Otter Tail (N=75) (mean=1.68) 61.3 17.3 10.7 4.0 4.0 2.7 100.0Pope (N=78) (mean=1.68) 69.2 7.7 9.0 1.3 9.0 3.8 100.0Stevens (N=75) (mean=1.40) 74.7 12.0 5.3 0.0 4.0 4.0 100.0Traverse (N=76) (mean=1.58) 65.8 14.5 10.5 5.3 1.3 2.6 100.0Wilkin (N=77) (mean=1.33) 80.5 7.8 5.2 1.3 2.6 2.6 100.0NOTE: Means are based on a one to five scale, with one being “not a problem at all” and five being “a serious problem.” “DNK/refused” is excluded from the mean.

Environmental Health Survey for Central and Western Minnesota: June 2007 Survey Results
65
Appendix Table 8. Of respondents who said there are PUBLIC HEALTH NUISANCES they consider a problem, level of priority in addressing each problem
Percent of respondents by Level of priority
Public health nuisances by County Low
priority Medium priority
High priority
DNK/ refused Total
Meth labs Overall region (N=214) 1.9 7.0 90.7 0.5 100.1Clay (N=33) 0.0 12.1 87.9 0.0 100.0Douglas (N=27) 3.7 7.4 88.9 0.0 100.0Grant (N=27) 0.0 3.7 92.6 3.7 100.0Otter Tail (N=25) 0.0 8.0 92.0 0.0 100.0Pope (N=30) 0.0 0.0 100.0 0.0 100.0Stevens (N=28) 3.6 14.3 82.1 0.0 100.0Traverse (N=26) 7.7 7.7 84.6 0.0 100.0Wilkin (N=18) 0.0 0.0 100.0 0.0 100.0Improper disposal of hazardous waste Overall region (N=77) 5.2 19.5 74.0 1.3 100.0Clay (N=20) 5.0 30.0 60.0 5.0 100.0Douglas (N=7) 14.3 14.3 71.4 0.0 100.0Grant (N=10) 0.0 10.0 90.0 0.0 100.0Otter Tail (N=4) 0.0 25.0 75.0 0.0 100.0Pope (N=12) 0.0 8.3 91.7 0.0 100.0Stevens (N=9) 22.2 22.2 55.6 0.0 100.0Traverse (N=11) 0.0 27.3 72.7 0.0 100.0Wilkin (N=4) 0.0 0.0 100.0 0.0 100.0Illegal/open dumps Overall region (N=41) 9.8 19.5 65.9 4.9 100.1Clay (N=8) 12.5 12.5 75.0 0.0 100.0Douglas (N=4) 0.0 50.0 50.0 0.0 100.0Grant (N=4) 50.0 0.0 50.0 0.0 100.0Otter Tail (N=6) 16.7 33.3 50.0 0.0 100.0Pope (N=8) 0.0 12.5 87.5 0.0 100.0Stevens (N=3) 0.0 0.0 66.7 33.3 100.0Traverse (N=5) 0.0 40.0 40.0 20.0 100.0Wilkin (N=3) 0.0 0.0 100.0 0.0 100.0Mosquitoes and other insects Overall region (N=265) 7.5 29.4 61.9 1.1 99.9Clay (N=34) 2.9 29.4 67.6 0.0 99.9Douglas (N=31) 9.7 32.3 58.1 0.0 100.1Grant (N=24) 4.2 33.3 58.3 4.2 100.0Otter Tail (N=37) 13.5 35.1 51.4 0.0 100.0Pope (N=32) 9.4 28.1 62.5 0.0 100.0Stevens (N=30) 16.7 26.7 50.0 6.7 100.1Traverse (N=44) 2.3 25.0 72.7 0.0 100.0Wilkin (N=33) 3.0 27.3 69.7 0.0 100.0Garbage/junk houses Overall region (N=67) 10.4 26.9 61.2 1.5 100.0Clay (N=7) 0.0 42.9 57.1 0.0 100.0Douglas (N=6) 0.0 33.3 66.7 0.0 100.0Grant (N=7) 14.3 42.9 28.6 14.3 100.1Otter Tail (N=8) 12.5 25.0 62.5 0.0 100.0Pope (N=11) 0.0 27.3 72.7 0.0 100.0Stevens (N=8) 25.0 25.0 50.0 0.0 100.0Traverse (N=15) 13.3 13.3 73.3 0.0 99.9Wilkin (N=5) 20.0 20.0 60.0 0.0 100.0

Environmental Health Survey for Central and Western Minnesota: June 2007 Survey Results 66
Appendix Table 8 (Continued). Of respondents who said there are PUBLIC HEALTH NUISANCES they consider a problem, level of priority in addressing each problem
Percent of respondents by Level of priority
Public health nuisances by County Low
priority Medium priority
High priority
DNK/ refused Total
Animals/rodents Overall region (N=37) 5.4 45.9 45.9 2.7 99.9Clay (N=4) 0.0 50.0 50.0 0.0 100.0Douglas (N=6) 0.0 50.0 50.0 0.0 100.0Grant (N=5) 0.0 60.0 20.0 20.0 100.0Otter Tail (N=4) 25.0 25.0 50.0 0.0 100.0Pope (N=4) 0.0 50.0 50.0 0.0 100.0Stevens (N=4) 0.0 100.0 0.0 0.0 100.0Traverse (N=7) 14.3 28.6 57.1 0.0 100.0Wilkin (N=3) 0.0 0.0 100.0 0.0 100.0 Appendix Table 9. Of respondents who said there are PUBLIC HEALTH NUISANCES they consider a problem, extent that factors have affected a household member’s health
Percent of respondents by Response
Public health nuisances by County
Not at all (1) (2) (3) (4)
A
great deal (5)
DNK/ refused Total
Mosquitoes and other insects Overall region (N=265) (mean=1.66) 69.8 8.3 9.8 6.0 4.9 1.1 99.9Clay (N=34) (mean=1.73) 61.8 11.8 14.7 5.9 2.9 2.9 100.0Douglas (N=31) (mean=1.94) 67.7 6.5 3.2 9.7 12.9 0.0 100.0Grant (N=24) (mean=1.25) 87.5 0.0 12.5 0.0 0.0 0.0 100.0Otter Tail (N=37) (mean=2.14) 45.9 18.9 16.2 13.5 5.4 0.0 99.9Pope (N=32) (mean=2.09) 59.4 6.3 12.5 9.4 12.5 0.0 100.1Stevens (N=30) (mean=1.54) 73.3 3.3 6.7 6.7 3.3 6.7 100.0Traverse (N=44) (mean=1.34) 79.5 11.4 6.8 0.0 2.3 0.0 100.0Wilkin (N=33) (mean=1.24) 87.9 3.0 6.1 3.0 0.0 0.0 100.0Animals/rodents Overall region (N=37) (mean=1.56) 70.3 10.8 10.8 0.0 5.4 2.7 100.0Clay (N=4) (mean=2.00) 75.0 0.0 0.0 0.0 25.0 0.0 100.0Douglas (N=6) (mean=1.17) 83.3 16.7 0.0 0.0 0.0 0.0 100.0Grant (N=5) (mean=1.40) 80.0 0.0 20.0 0.0 0.0 0.0 100.0Otter Tail (N=4) (mean=2.25) 50.0 25.0 0.0 0.0 25.0 0.0 100.0Pope (N=4) (mean=2.00) 50.0 0.0 50.0 0.0 0.0 0.0 100.0Stevens (N=4) (mean=1.67) 50.0 0.0 25.0 0.0 0.0 25.0 100.0Traverse (N=7) (mean=1.29) 71.4 28.6 0.0 0.0 0.0 0.0 100.0Wilkin (N=3) (mean=1.00) 100.0 0.0 0.0 0.0 0.0 0.0 100.0NOTE: Means are based on a one to five scale, with one being “not at all” and five being “a great deal.” “DNK/refused” is excluded from the mean.
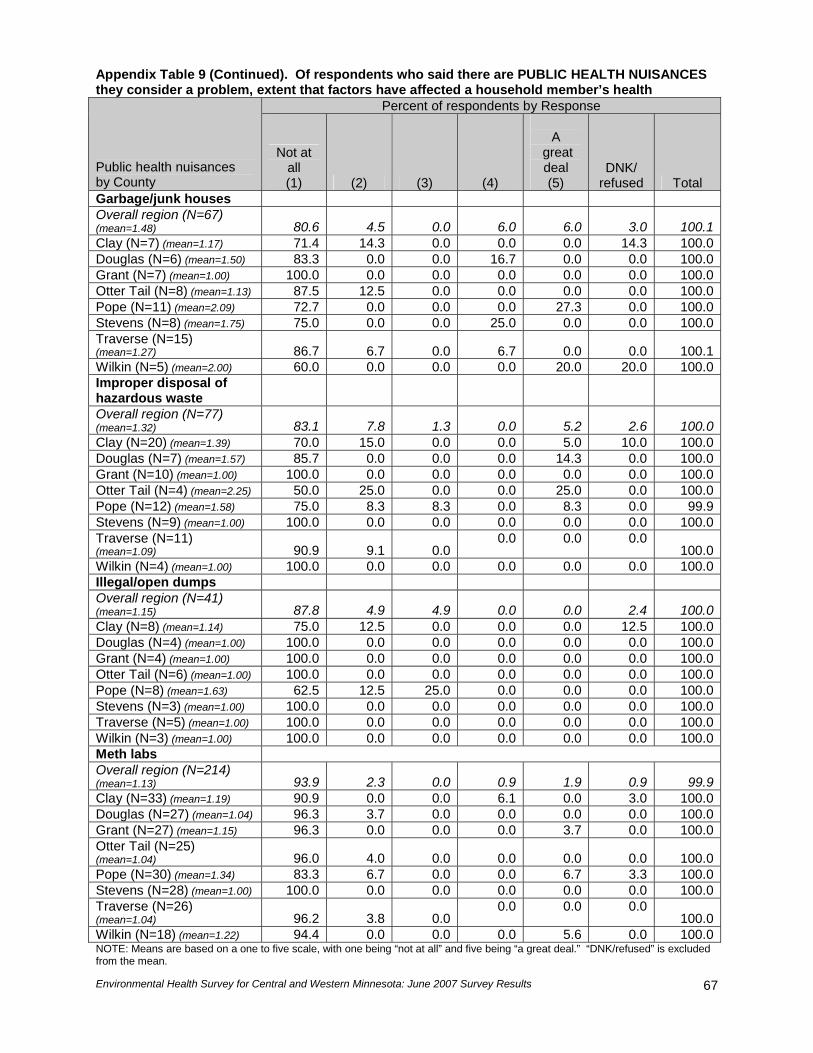
Environmental Health Survey for Central and Western Minnesota: June 2007 Survey Results
67
Appendix Table 9 (Continued). Of respondents who said there are PUBLIC HEALTH NUISANCES they consider a problem, extent that factors have affected a household member’s health
Percent of respondents by Response
Public health nuisances by County
Not at all (1) (2) (3) (4)
A
great deal (5)
DNK/ refused Total
Garbage/junk houses Overall region (N=67) (mean=1.48) 80.6 4.5 0.0 6.0 6.0 3.0 100.1Clay (N=7) (mean=1.17) 71.4 14.3 0.0 0.0 0.0 14.3 100.0Douglas (N=6) (mean=1.50) 83.3 0.0 0.0 16.7 0.0 0.0 100.0Grant (N=7) (mean=1.00) 100.0 0.0 0.0 0.0 0.0 0.0 100.0Otter Tail (N=8) (mean=1.13) 87.5 12.5 0.0 0.0 0.0 0.0 100.0Pope (N=11) (mean=2.09) 72.7 0.0 0.0 0.0 27.3 0.0 100.0Stevens (N=8) (mean=1.75) 75.0 0.0 0.0 25.0 0.0 0.0 100.0Traverse (N=15) (mean=1.27) 86.7 6.7 0.0 6.7 0.0 0.0 100.1Wilkin (N=5) (mean=2.00) 60.0 0.0 0.0 0.0 20.0 20.0 100.0Improper disposal of hazardous waste
Overall region (N=77) (mean=1.32) 83.1 7.8 1.3 0.0 5.2 2.6 100.0Clay (N=20) (mean=1.39) 70.0 15.0 0.0 0.0 5.0 10.0 100.0Douglas (N=7) (mean=1.57) 85.7 0.0 0.0 0.0 14.3 0.0 100.0Grant (N=10) (mean=1.00) 100.0 0.0 0.0 0.0 0.0 0.0 100.0Otter Tail (N=4) (mean=2.25) 50.0 25.0 0.0 0.0 25.0 0.0 100.0Pope (N=12) (mean=1.58) 75.0 8.3 8.3 0.0 8.3 0.0 99.9Stevens (N=9) (mean=1.00) 100.0 0.0 0.0 0.0 0.0 0.0 100.0Traverse (N=11) (mean=1.09) 90.9 9.1 0.0
0.0 0.0 0.0 100.0
Wilkin (N=4) (mean=1.00) 100.0 0.0 0.0 0.0 0.0 0.0 100.0Illegal/open dumps Overall region (N=41) (mean=1.15) 87.8 4.9 4.9 0.0 0.0 2.4 100.0Clay (N=8) (mean=1.14) 75.0 12.5 0.0 0.0 0.0 12.5 100.0Douglas (N=4) (mean=1.00) 100.0 0.0 0.0 0.0 0.0 0.0 100.0Grant (N=4) (mean=1.00) 100.0 0.0 0.0 0.0 0.0 0.0 100.0Otter Tail (N=6) (mean=1.00) 100.0 0.0 0.0 0.0 0.0 0.0 100.0Pope (N=8) (mean=1.63) 62.5 12.5 25.0 0.0 0.0 0.0 100.0Stevens (N=3) (mean=1.00) 100.0 0.0 0.0 0.0 0.0 0.0 100.0Traverse (N=5) (mean=1.00) 100.0 0.0 0.0 0.0 0.0 0.0 100.0Wilkin (N=3) (mean=1.00) 100.0 0.0 0.0 0.0 0.0 0.0 100.0Meth labs Overall region (N=214) (mean=1.13) 93.9 2.3 0.0 0.9 1.9 0.9 99.9Clay (N=33) (mean=1.19) 90.9 0.0 0.0 6.1 0.0 3.0 100.0Douglas (N=27) (mean=1.04) 96.3 3.7 0.0 0.0 0.0 0.0 100.0Grant (N=27) (mean=1.15) 96.3 0.0 0.0 0.0 3.7 0.0 100.0Otter Tail (N=25) (mean=1.04) 96.0 4.0 0.0 0.0 0.0 0.0 100.0Pope (N=30) (mean=1.34) 83.3 6.7 0.0 0.0 6.7 3.3 100.0Stevens (N=28) (mean=1.00) 100.0 0.0 0.0 0.0 0.0 0.0 100.0Traverse (N=26) (mean=1.04) 96.2 3.8 0.0
0.0 0.0 0.0 100.0
Wilkin (N=18) (mean=1.22) 94.4 0.0 0.0 0.0 5.6 0.0 100.0NOTE: Means are based on a one to five scale, with one being “not at all” and five being “a great deal.” “DNK/refused” is excluded from the mean.
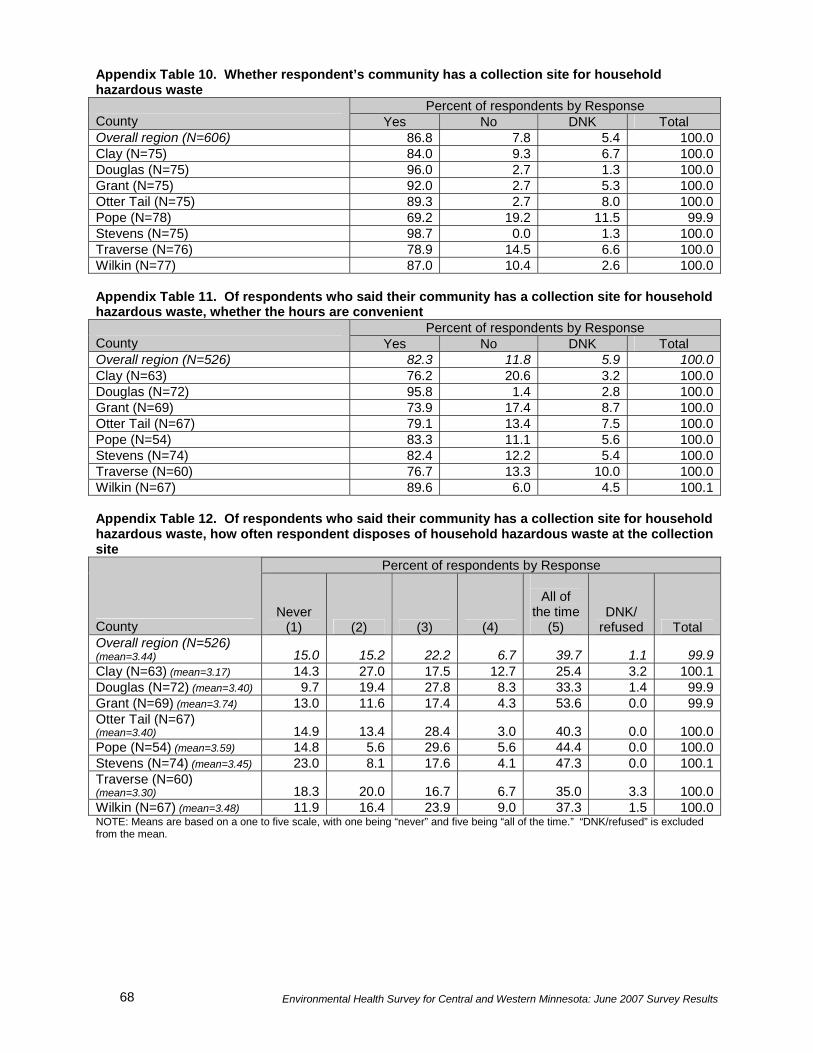
Environmental Health Survey for Central and Western Minnesota: June 2007 Survey Results 68
Appendix Table 10. Whether respondent’s community has a collection site for household hazardous waste
Percent of respondents by Response County Yes No DNK Total Overall region (N=606) 86.8 7.8 5.4 100.0Clay (N=75) 84.0 9.3 6.7 100.0Douglas (N=75) 96.0 2.7 1.3 100.0Grant (N=75) 92.0 2.7 5.3 100.0Otter Tail (N=75) 89.3 2.7 8.0 100.0Pope (N=78) 69.2 19.2 11.5 99.9Stevens (N=75) 98.7 0.0 1.3 100.0Traverse (N=76) 78.9 14.5 6.6 100.0Wilkin (N=77) 87.0 10.4 2.6 100.0 Appendix Table 11. Of respondents who said their community has a collection site for household hazardous waste, whether the hours are convenient
Percent of respondents by Response County Yes No DNK Total Overall region (N=526) 82.3 11.8 5.9 100.0Clay (N=63) 76.2 20.6 3.2 100.0Douglas (N=72) 95.8 1.4 2.8 100.0Grant (N=69) 73.9 17.4 8.7 100.0Otter Tail (N=67) 79.1 13.4 7.5 100.0Pope (N=54) 83.3 11.1 5.6 100.0Stevens (N=74) 82.4 12.2 5.4 100.0Traverse (N=60) 76.7 13.3 10.0 100.0Wilkin (N=67) 89.6 6.0 4.5 100.1 Appendix Table 12. Of respondents who said their community has a collection site for household hazardous waste, how often respondent disposes of household hazardous waste at the collection site
Percent of respondents by Response
County Never
(1) (2) (3) (4)
All of
the time (5)
DNK/ refused Total
Overall region (N=526) (mean=3.44) 15.0 15.2 22.2 6.7 39.7 1.1 99.9Clay (N=63) (mean=3.17) 14.3 27.0 17.5 12.7 25.4 3.2 100.1Douglas (N=72) (mean=3.40) 9.7 19.4 27.8 8.3 33.3 1.4 99.9Grant (N=69) (mean=3.74) 13.0 11.6 17.4 4.3 53.6 0.0 99.9Otter Tail (N=67) (mean=3.40) 14.9 13.4 28.4 3.0 40.3 0.0 100.0Pope (N=54) (mean=3.59) 14.8 5.6 29.6 5.6 44.4 0.0 100.0Stevens (N=74) (mean=3.45) 23.0 8.1 17.6 4.1 47.3 0.0 100.1Traverse (N=60) (mean=3.30) 18.3 20.0 16.7 6.7 35.0 3.3 100.0Wilkin (N=67) (mean=3.48) 11.9 16.4 23.9 9.0 37.3 1.5 100.0NOTE: Means are based on a one to five scale, with one being “never” and five being “all of the time.” “DNK/refused” is excluded from the mean.
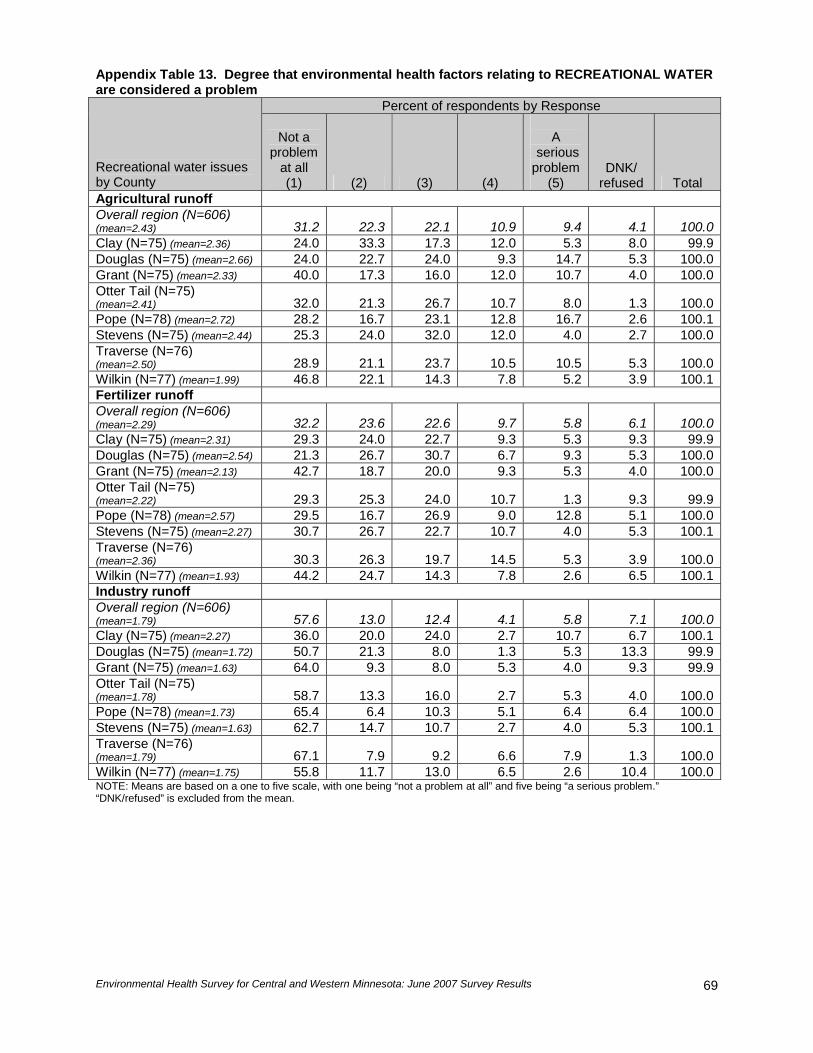
Environmental Health Survey for Central and Western Minnesota: June 2007 Survey Results
69
Appendix Table 13. Degree that environmental health factors relating to RECREATIONAL WATER are considered a problem
Percent of respondents by Response
Recreational water issues by County
Not a problem
at all (1) (2) (3) (4)
A
serious problem
(5) DNK/
refused Total Agricultural runoff Overall region (N=606) (mean=2.43) 31.2 22.3 22.1 10.9 9.4 4.1 100.0Clay (N=75) (mean=2.36) 24.0 33.3 17.3 12.0 5.3 8.0 99.9Douglas (N=75) (mean=2.66) 24.0 22.7 24.0 9.3 14.7 5.3 100.0Grant (N=75) (mean=2.33) 40.0 17.3 16.0 12.0 10.7 4.0 100.0Otter Tail (N=75) (mean=2.41) 32.0 21.3 26.7 10.7 8.0 1.3 100.0Pope (N=78) (mean=2.72) 28.2 16.7 23.1 12.8 16.7 2.6 100.1Stevens (N=75) (mean=2.44) 25.3 24.0 32.0 12.0 4.0 2.7 100.0Traverse (N=76) (mean=2.50) 28.9 21.1 23.7 10.5 10.5 5.3 100.0Wilkin (N=77) (mean=1.99) 46.8 22.1 14.3 7.8 5.2 3.9 100.1Fertilizer runoff Overall region (N=606) (mean=2.29) 32.2 23.6 22.6 9.7 5.8 6.1 100.0Clay (N=75) (mean=2.31) 29.3 24.0 22.7 9.3 5.3 9.3 99.9Douglas (N=75) (mean=2.54) 21.3 26.7 30.7 6.7 9.3 5.3 100.0Grant (N=75) (mean=2.13) 42.7 18.7 20.0 9.3 5.3 4.0 100.0Otter Tail (N=75) (mean=2.22) 29.3 25.3 24.0 10.7 1.3 9.3 99.9Pope (N=78) (mean=2.57) 29.5 16.7 26.9 9.0 12.8 5.1 100.0Stevens (N=75) (mean=2.27) 30.7 26.7 22.7 10.7 4.0 5.3 100.1Traverse (N=76) (mean=2.36) 30.3 26.3 19.7 14.5 5.3 3.9 100.0Wilkin (N=77) (mean=1.93) 44.2 24.7 14.3 7.8 2.6 6.5 100.1Industry runoff Overall region (N=606) (mean=1.79) 57.6 13.0 12.4 4.1 5.8 7.1 100.0Clay (N=75) (mean=2.27) 36.0 20.0 24.0 2.7 10.7 6.7 100.1Douglas (N=75) (mean=1.72) 50.7 21.3 8.0 1.3 5.3 13.3 99.9Grant (N=75) (mean=1.63) 64.0 9.3 8.0 5.3 4.0 9.3 99.9Otter Tail (N=75) (mean=1.78) 58.7 13.3 16.0 2.7 5.3 4.0 100.0Pope (N=78) (mean=1.73) 65.4 6.4 10.3 5.1 6.4 6.4 100.0Stevens (N=75) (mean=1.63) 62.7 14.7 10.7 2.7 4.0 5.3 100.1Traverse (N=76) (mean=1.79) 67.1 7.9 9.2 6.6 7.9 1.3 100.0Wilkin (N=77) (mean=1.75) 55.8 11.7 13.0 6.5 2.6 10.4 100.0NOTE: Means are based on a one to five scale, with one being “not a problem at all” and five being “a serious problem.” “DNK/refused” is excluded from the mean.

Environmental Health Survey for Central and Western Minnesota: June 2007 Survey Results 70
Appendix Table 13 (Continued). Degree that environmental health factors relating to RECREATIONAL WATER are considered a problem
Percent of respondents by Response
Recreational water issues by County
Not a problem
at all (1) (2) (3) (4)
A
serious problem
(5) DNK/
refused Total Improper sewage disposal Overall region (N=606) (mean=1.78) 56.8 17.3 11.2 4.1 5.4 5.1 99.9Clay (N=75) (mean=1.97) 46.7 17.3 16.0 8.0 4.0 8.0 100.0Douglas (N=75) (mean=1.71) 58.7 20.0 5.3 1.3 8.0 6.7 100.0Grant (N=75) (mean=1.82) 61.3 14.7 6.7 6.7 8.0 2.7 100.1Otter Tail (N=75) (mean=1.84) 50.7 17.3 16.0 4.0 4.0 8.0 100.0Pope (N=78) (mean=2.03) 43.6 23.1 15.4 3.8 7.7 6.4 100.0Stevens (N=75) (mean=1.69) 60.0 20.0 12.0 2.7 4.0 1.3 100.0Traverse (N=76) (mean=1.91) 56.6 14.5 13.2 5.3 7.9 2.6 100.1Wilkin (N=77) (mean=1.27) 76.6 11.7 5.2 1.3 0.0 5.2 100.0Overuse of recreational water by campers and boaters Overall region (N=606) (mean=1.77) 52.8 21.5 15.0 3.5 3.0 4.3 100.1Clay (N=75) (mean=1.92) 40.0 20.0 20.0 6.7 0.0 13.3 100.0Douglas (N=75) (mean=2.04) 44.0 22.7 18.7 6.7 5.3 2.7 100.1Grant (N=75) (mean=1.67) 58.7 24.0 6.7 4.0 4.0 2.7 100.1Otter Tail (N=75) (mean=2.08) 34.7 26.7 28.0 5.3 1.3 4.0 100.0Pope (N=78) (mean=1.97) 46.2 24.4 21.8 1.3 6.4 0.0 100.1Stevens (N=75) (mean=1.54) 62.7 25.3 6.7 1.3 2.7 1.3 100.0Traverse (N=76) (mean=1.45) 68.4 13.2 13.2 1.3 0.0 3.9 100.0Wilkin (N=77) (mean=1.49) 67.5 15.6 5.2 1.3 3.9 6.5 100.0Lakes and swimming beaches Overall region (N=606) (mean=1.72) 54.6 22.4 13.7 3.8 2.1 3.3 99.9Clay (N=75) (mean=1.72) 45.3 30.7 10.7 2.7 1.3 9.3 100.0Douglas (N=75) (mean=1.66) 57.3 25.3 10.7 2.7 2.7 1.3 100.0Grant (N=75) (mean=1.74) 57.3 18.7 12.0 4.0 4.0 4.0 100.0Otter Tail (N=75) (mean=1.65) 53.3 28.0 16.0 1.3 0.0 1.3 99.9Pope (N=78) (mean=1.91) 51.3 19.2 19.2 7.7 2.6 0.0 100.0Stevens (N=75) (mean=1.62) 57.3 25.3 10.7 2.7 1.3 2.7 100.0Traverse (N=76) (mean=2.05) 48.7 17.1 19.7 9.2 5.3 0.0 100.0Wilkin (N=77) (mean=1.39) 66.2 15.6 10.4 0.0 0.0 7.8 100.0NOTE: Means are based on a one to five scale, with one being “not a problem at all” and five being “a serious problem.” “DNK/refused” is excluded from the mean.

Environmental Health Survey for Central and Western Minnesota: June 2007 Survey Results
71
Appendix Table 13 (Continued). Degree that environmental health factors relating to RECREATIONAL WATER are considered a problem
Percent of respondents by Response
Recreational water issues by County
Not a problem
at all (1) (2) (3) (4)
A
serious problem
(5) DNK/
refused Total Public pools and spas Overall region (N=606) (mean=1.35) 72.9 11.2 5.6 1.7 1.2 7.4 100.0Clay (N=75) (mean=1.68) 52.0 21.3 5.3 5.3 2.7 13.3 99.9Douglas (N=75) (mean=1.46) 61.3 18.7 6.7 1.3 1.3 10.7 100.0Grant (N=75) (mean=1.40) 72.0 6.7 5.3 2.7 2.7 10.7 100.1Otter Tail (N=75) (mean=1.38) 66.7 16.0 9.3 0.0 0.0 8.0 100.0Pope (N=78) (mean=1.21) 88.5 3.8 3.8 1.3 1.3 1.3 100.0Stevens (N=75) (mean=1.18) 85.3 6.7 2.7 0.0 1.3 4.0 100.0Traverse (N=76) (mean=1.25) 80.3 13.2 3.9 1.3 0.0 1.3 100.0Wilkin (N=77) (mean=1.26) 76.6 3.9 7.8 1.3 0.0 10.4 100.0NOTE: Means are based on a one to five scale, with one being “not a problem at all” and five being “a serious problem.” “DNK/refused” is excluded from the mean. Appendix Table 14. Of respondents who said there are RECREATIONAL WATER issues they consider a problem, level of priority in addressing each problem
Percent of respondents by Level of priority
Recreational water issues by County Low
priority Medium priority
High priority
DNK/ refused Total
Agricultural runoff Overall region (N=123) 7.3 17.9 72.4 2.4 100.0Clay (N=13) 7.7 23.1 61.5 7.7 100.0Douglas (N=18) 5.6 11.1 77.8 5.6 100.1Grant (N=17) 5.9 29.4 58.8 5.9 100.0Otter Tail (N=14) 0.0 21.4 78.6 0.0 100.0Pope (N=23) 0.0 17.4 82.6 0.0 100.0Stevens (N=12) 16.7 8.3 75.0 0.0 100.0Traverse (N=16) 25.0 25.0 50.0 0.0 100.0Wilkin (N=10) 0.0 0.0 100.0 0.0 100.0Lakes and swimming beaches Overall region (N=36) 13.9 13.9 72.2 0.0 100.0Clay (N=3) 33.3 0.0 66.7 0.0 100.0Douglas (N=4) 0.0 0.0 100.0 0.0 100.0Grant (N=6) 0.0 50.0 50.0 0.0 100.0Otter Tail (N=1) 0.0 0.0 100.0 0.0 100.0Pope (N=8) 0.0 0.0 100.0 0.0 100.0Stevens (N=3) 0.0 33.3 66.7 0.0 100.0Traverse (N=11) 36.4 9.1 54.5 0.0 100.0Wilkin (N=0) NA NA NA NA NA

Environmental Health Survey for Central and Western Minnesota: June 2007 Survey Results 72
Appendix Table 14 (Continued). Of respondents who said there are RECREATIONAL WATER issues they consider a problem, level of priority in addressing each problem
Percent of respondents by Level of priority
Recreational water issues by County Low
priority Medium priority
High priority
DNK/ refused Total
Industry runoff Overall region (N=60) 8.3 18.3 70.0 3.3 99.9Clay (N=10) 10.0 10.0 80.0 0.0 100.0Douglas (N=5) 0.0 20.0 80.0 0.0 100.0Grant (N=7) 0.0 28.6 71.4 0.0 100.0Otter Tail (N=6) 0.0 33.3 66.7 0.0 100.0Pope (N=9) 0.0 22.2 77.8 0.0 100.0Stevens (N=5) 0.0 40.0 60.0 0.0 100.0Traverse (N=11) 27.3 9.1 45.5 18.2 100.1Wilkin (N=7) 14.3 0.0 85.7 0.0 100.0Improper sewage disposal Overall region (N=58) 6.9 20.7 67.2 5.2 100.0Clay (N=9) 0.0 22.2 77.8 0.0 100.0Douglas (N=7) 14.3 0.0 85.7 0.0 100.0Grant (N=11) 0.0 18.2 54.5 27.3 100.0Otter Tail (N=6) 0.0 33.3 66.7 0.0 100.0Pope (N=9) 0.0 22.2 77.8 0.0 100.0Stevens (N=5) 20.0 20.0 60.0 0.0 100.0Traverse (N=10) 20.0 30.0 50.0 0.0 100.0Wilkin (N=1) 0.0 0.0 100.0 0.0 100.0Fertilizer runoff Overall region (N=94) 4.3 28.7 64.9 2.1 100.0Clay (N=11) 18.2 36.4 36.4 9.1 100.1Douglas (N=12) 0.0 16.7 83.3 0.0 100.0Grant (N=11) 0.0 45.5 45.5 9.1 100.1Otter Tail (N=9) 0.0 11.1 88.9 0.0 100.0Pope (N=17) 0.0 17.6 82.4 0.0 100.0Stevens (N=11) 0.0 36.4 63.6 0.0 100.0Traverse (N=15) 13.3 33.3 53.3 0.0 99.9Wilkin (N=8) 0.0 37.5 62.5 0.0 100.0Overuse of recreational water by campers and boaters Overall region (N=39) 10.3 38.5 48.7 2.6 100.1Clay (N=5) 40.0 60.0 0.0 0.0 100.0Douglas (N=9) 0.0 33.3 55.6 11.1 100.0Grant (N=6) 0.0 66.7 33.3 0.0 100.0Otter Tail (N=5) 0.0 40.0 60.0 0.0 100.0Pope (N=6) 0.0 33.3 66.7 0.0 100.0Stevens (N=3) 33.3 33.3 33.3 0.0 99.9Traverse (N=1) 0.0 0.0 100.0 0.0 100.0Wilkin (N=4) 25.0 0.0 75.0 0.0 100.0Public pools and spas Overall region (N=17) 11.8 47.1 41.2 0.0 100.1Clay (N=6) 33.3 50.0 16.7 0.0 100.0Douglas (N=2) 0.0 100.0 0.0 0.0 100.0Grant (N=4) 0.0 75.0 25.0 0.0 100.0Otter Tail (N=0) NA NA NA NA NAPope (N=2) 0.0 0.0 100.0 0.0 100.0Stevens (N=1) 0.0 0.0 100.0 0.0 100.0Traverse (N=1) 0.0 0.0 100.0 0.0 100.0Wilkin (N=1) 0.0 0.0 100.0 0.0 100.0NOTE: NA = not applicable.

Environmental Health Survey for Central and Western Minnesota: June 2007 Survey Results
73
Appendix Table 15. Of respondents who said there are RECREATIONAL WATER issues they consider a problem, extent that issues have affected a household member’s health
Percent of respondents by Response
Recreational water issues by County
Not at all (1) (2) (3) (4)
A
great deal (5)
DNK/ refused Total
Public pools and spas Overall region (N=17) (mean=2.00) 64.7 11.8 0.0 5.9 17.6 0.0 100.0Clay (N=6) (mean=1.67) 83.3 0.0 0.0 0.0 16.7 0.0 100.0Douglas (N=2) (mean=1.50) 50.0 50.0 0.0 0.0 0.0 0.0 100.0Grant (N=4) (mean=2.00) 75.0 0.0 0.0 0.0 25.0 0.0 100.0Otter Tail (N=0) (mean=NA) NA NA NA NA NA NA NAPope (N=2) (mean=2.50) 50.0 0.0 0.0 50.0 0.0 0.0 100.0Stevens (N=1) (mean=5.00) 0.0 0.0 0.0 0.0 100.0 0.0 100.0Traverse (N=1) (mean=2.00) 0.0 100.0 0.0 0.0 0.0 0.0 100.0Wilkin (N=1) (mean=1.00) 100.0 0.0 0.0 0.0 0.0 0.0 100.0Lakes and swimming beaches Overall region (N=36) (mean=1.86) 72.2 0.0 11.1 2.8 13.9 0.0 100.0Clay (N=3) (mean=1.67) 66.7 0.0 33.3 0.0 0.0 0.0 100.0Douglas (N=4) (mean=2.50) 50.0 0.0 25.0 0.0 25.0 0.0 100.0Grant (N=6) (mean=1.00) 100.0 0.0 0.0 0.0 0.0 0.0 100.0Otter Tail (N=1) (mean=1.00) 100.0 0.0 0.0 0.0 0.0 0.0 100.0Pope (N=8) (mean=2.50) 50.0 0.0 25.0 0.0 25.0 0.0 100.0Stevens (N=3) (mean=2.33) 66.7 0.0 0.0 0.0 33.3 0.0 100.0Traverse (N=11) (mean=1.64) 81.8 0.0 0.0 9.1 9.1 0.0 100.0Wilkin (N=0) (mean=NA) NA NA NA NA NA NA NAAgricultural runoff Overall region (N=123) (mean=1.51) 72.4 8.1 7.3 0.8 5.7 5.7 100.0Clay (N=13) (mean=1.55) 53.8 23.1 0.0 7.7 0.0 15.4 100.0Douglas (N=18) (mean=1.88) 66.7 5.6 5.6 0.0 16.7 5.6 100.2Grant (N=17) (mean=1.00) 94.1 0.0 0.0 0.0 0.0 5.9 100.0Otter Tail (N=14) (mean=1.36) 71.4 21.4 7.1 0.0 0.0 0.0 99.9Pope (N=23) (mean=1.86) 60.9 4.3 21.7 0.0 8.7 4.3 99.9Stevens (N=12) (mean=1.09) 83.3 8.3 0.0 0.0 0.0 8.3 99.9Traverse (N=16) (mean=1.31) 81.3 6.3 12.5 0.0 0.0 0.0 100.1Wilkin (N=10) (mean=1.89) 70.0 0.0 0.0 0.0 20.0 10.0 100.0Fertilizer runoff Overall region (N=94) (mean=1.41) 77.7 7.4 4.3 2.1 4.3 4.3 100.1Clay (N=11) (mean=1.56) 54.5 18.2 0.0 9.1 0.0 18.2 100.0Douglas (N=12) (mean=1.58) 83.3 0.0 0.0 8.3 8.3 0.0 99.9Grant (N=11) (mean=1.00) 90.9 0.0 0.0 0.0 0.0 9.1 100.0Otter Tail (N=9) (mean=1.22) 77.8 22.2 0.0 0.0 0.0 0.0 100.0Pope (N=17) (mean=2.06) 52.9 5.9 23.5 0.0 11.8 5.9 100.0Stevens (N=11) (mean=1.09) 90.9 9.1 0.0 0.0 0.0 0.0 100.0Traverse (N=15) (mean=1.07) 93.3 6.7
0.0 0.0 0.0 0.0 100.0
Wilkin (N=8) (mean=1.50) 87.5 0.0 0.0 0.0 12.5 0.0 100.0NOTE: NA = not applicable. Means are based on a one to five scale, with one being “not at all” and five being “a great deal.” “DNK/refused” is excluded from the mean.
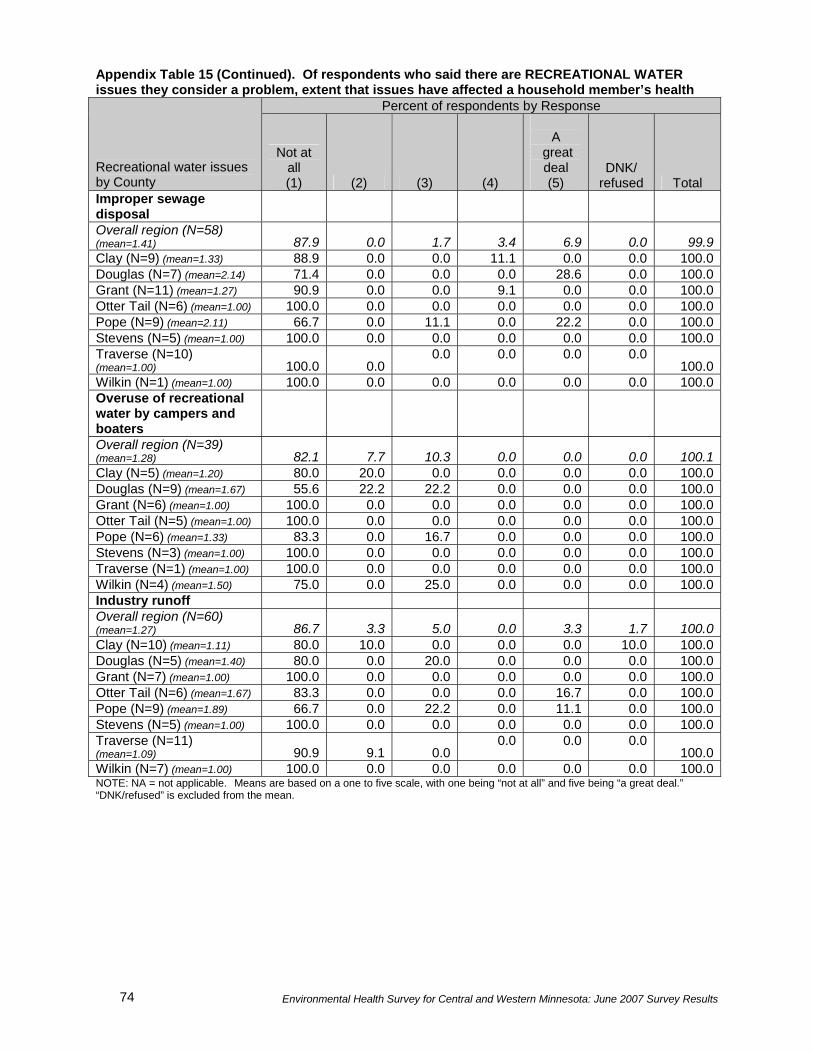
Environmental Health Survey for Central and Western Minnesota: June 2007 Survey Results 74
Appendix Table 15 (Continued). Of respondents who said there are RECREATIONAL WATER issues they consider a problem, extent that issues have affected a household member’s health
Percent of respondents by Response
Recreational water issues by County
Not at all (1) (2) (3) (4)
A
great deal (5)
DNK/ refused Total
Improper sewage disposal Overall region (N=58) (mean=1.41) 87.9 0.0 1.7 3.4 6.9 0.0 99.9Clay (N=9) (mean=1.33) 88.9 0.0 0.0 11.1 0.0 0.0 100.0Douglas (N=7) (mean=2.14) 71.4 0.0 0.0 0.0 28.6 0.0 100.0Grant (N=11) (mean=1.27) 90.9 0.0 0.0 9.1 0.0 0.0 100.0Otter Tail (N=6) (mean=1.00) 100.0 0.0 0.0 0.0 0.0 0.0 100.0Pope (N=9) (mean=2.11) 66.7 0.0 11.1 0.0 22.2 0.0 100.0Stevens (N=5) (mean=1.00) 100.0 0.0 0.0 0.0 0.0 0.0 100.0Traverse (N=10) (mean=1.00) 100.0 0.0
0.0 0.0 0.0 0.0 100.0
Wilkin (N=1) (mean=1.00) 100.0 0.0 0.0 0.0 0.0 0.0 100.0Overuse of recreational water by campers and boaters Overall region (N=39) (mean=1.28) 82.1 7.7 10.3 0.0 0.0 0.0 100.1Clay (N=5) (mean=1.20) 80.0 20.0 0.0 0.0 0.0 0.0 100.0Douglas (N=9) (mean=1.67) 55.6 22.2 22.2 0.0 0.0 0.0 100.0Grant (N=6) (mean=1.00) 100.0 0.0 0.0 0.0 0.0 0.0 100.0Otter Tail (N=5) (mean=1.00) 100.0 0.0 0.0 0.0 0.0 0.0 100.0Pope (N=6) (mean=1.33) 83.3 0.0 16.7 0.0 0.0 0.0 100.0Stevens (N=3) (mean=1.00) 100.0 0.0 0.0 0.0 0.0 0.0 100.0Traverse (N=1) (mean=1.00) 100.0 0.0 0.0 0.0 0.0 0.0 100.0Wilkin (N=4) (mean=1.50) 75.0 0.0 25.0 0.0 0.0 0.0 100.0Industry runoff Overall region (N=60) (mean=1.27) 86.7 3.3 5.0 0.0 3.3 1.7 100.0Clay (N=10) (mean=1.11) 80.0 10.0 0.0 0.0 0.0 10.0 100.0Douglas (N=5) (mean=1.40) 80.0 0.0 20.0 0.0 0.0 0.0 100.0Grant (N=7) (mean=1.00) 100.0 0.0 0.0 0.0 0.0 0.0 100.0Otter Tail (N=6) (mean=1.67) 83.3 0.0 0.0 0.0 16.7 0.0 100.0Pope (N=9) (mean=1.89) 66.7 0.0 22.2 0.0 11.1 0.0 100.0Stevens (N=5) (mean=1.00) 100.0 0.0 0.0 0.0 0.0 0.0 100.0Traverse (N=11) (mean=1.09) 90.9 9.1 0.0
0.0 0.0 0.0 100.0
Wilkin (N=7) (mean=1.00) 100.0 0.0 0.0 0.0 0.0 0.0 100.0NOTE: NA = not applicable. Means are based on a one to five scale, with one being “not at all” and five being “a great deal.” “DNK/refused” is excluded from the mean.

Environmental Health Survey for Central and Western Minnesota: June 2007 Survey Results
75
Appendix Table 16. Degree that environmental health factors relating to DRINKING WATER are considered a problem
Percent of respondents by Response
Drinking water issues by County
Not a problem
at all (1) (2) (3) (4)
A
serious problem
(5) DNK/
refused Total Abandoned wells that are not sealed Overall region (N=606) (mean=1.65) 58.4 13.9 7.9 2.3 5.1 12.4 100.0Clay (N=75) (mean=1.75) 52.0 16.0 6.7 4.0 5.3 16.0 100.0Douglas (N=75) (mean=1.48) 62.7 10.7 8.0 1.3 2.7 14.7 100.1Grant (N=75) (mean=1.64) 62.7 6.7 14.7 0.0 5.3 10.7 100.1Otter Tail (N=75) (mean=1.70) 56.0 16.0 10.7 1.3 5.3 10.7 100.0Pope (N=78) (mean=1.73) 56.4 11.5 2.6 2.6 9.0 17.9 100.0Stevens (N=75) (mean=1.67) 53.3 17.3 9.3 0.0 5.3 14.7 99.9Traverse (N=76) (mean=1.78) 55.3 21.1 7.9 5.3 5.3 5.3 100.2Wilkin (N=77) (mean=1.46) 68.8 11.7 3.9 3.9 2.6 9.1 100.0Contaminated PUBLIC drinking water Overall region (N=606) (mean=1.65) 69.3 9.6 6.3 4.1 6.9 3.8 100.0Clay (N=75) (mean=2.11) 56.0 12.0 6.7 12.0 12.0 1.3 100.0Douglas (N=75) (mean=1.52) 72.0 5.3 8.0 0.0 6.7 8.0 100.0Grant (N=75) (mean=1.82) 62.7 9.3 8.0 6.7 8.0 5.3 100.0Otter Tail (N=75) (mean=1.48) 77.3 10.7 5.3 0.0 6.7 0.0 100.0Pope (N=78) (mean=1.54) 69.2 6.4 7.7 3.8 3.8 9.0 99.9Stevens (N=75) (mean=1.64) 68.0 14.7 4.0 2.7 8.0 2.7 100.1Traverse (N=76) (mean=1.75) 67.1 9.2 9.2 6.6 6.6 1.3 100.0Wilkin (N=77) (mean=1.32) 81.8 9.1 1.3 1.3 3.9 2.6 100.0Contaminated PRIVATE drinking water Overall region (N=606) (mean=1.52) 67.0 13.2 8.3 1.8 3.3 6.4 100.0Clay (N=75) (mean=1.57) 60.0 16.0 8.0 2.7 2.7 10.7 100.1Douglas (N=75) (mean=1.48) 68.0 13.3 10.7 0.0 2.7 5.3 100.0Grant (N=75) (mean=1.61) 64.0 14.7 12.0 1.3 4.0 4.0 100.0Otter Tail (N=75) (mean=1.53) 65.3 18.7 8.0 0.0 4.0 4.0 100.0Pope (N=78) (mean=1.51) 64.1 10.3 7.7 1.3 3.8 12.8 100.0Stevens (N=75) (mean=1.60) 58.7 18.7 8.0 1.3 4.0 9.3 100.0Traverse (N=76) (mean=1.55) 73.7 7.9 7.9 6.6 2.6 1.3 100.0Wilkin (N=77) (mean=1.30) 81.8 6.5 3.9 1.3 2.6 3.9 100.0NOTE: Means are based on a one to five scale, with one being “not a problem at all” and five being “a serious problem.” “DNK/refused” is excluded from the mean.

Environmental Health Survey for Central and Western Minnesota: June 2007 Survey Results 76
Appendix Table 17. Of respondents who said there are DRINKING WATER issues they consider a problem, level of priority in addressing each problem
Percent of respondents by Level of priority
Drinking water issues by County Low
priority Medium priority
High priority
DNK/ refused Total
Contaminated PUBLIC drinking water Overall region (N=67) 3.0 13.4 82.1 1.5 100.0Clay (N=18) 0.0 22.2 77.8 0.0 100.0Douglas (N=5) 0.0 20.0 80.0 0.0 100.0Grant (N=11) 0.0 9.1 90.9 0.0 100.0Otter Tail (N=5) 20.0 0.0 80.0 0.0 100.0Pope (N=6) 0.0 50.0 50.0 0.0 100.0Stevens (N=8) 12.5 0.0 87.5 0.0 100.0Traverse (N=10) 0.0 0.0 90.0 10.0 100.0Wilkin (N=4) 0.0 0.0 100.0 0.0 100.0Contaminated PRIVATE drinking water Overall region (N=31) 3.2 19.4 77.4 0.0 100.0Clay (N=4) 0.0 50.0 50.0 0.0 100.0Douglas (N=2) 0.0 0.0 100.0 0.0 100.0Grant (N=4) 0.0 0.0 100.0 0.0 100.0Otter Tail (N=3) 0.0 0.0 100.0 0.0 100.0Pope (N=4) 0.0 25.0 75.0 0.0 100.0Stevens (N=4) 0.0 0.0 100.0 0.0 100.0Traverse (N=7) 14.3 28.6 57.1 0.0 100.0Wilkin (N=3) 0.0 33.3 66.7 0.0 100.0Abandoned wells that are not sealed Overall region (N=45) 4.4 31.1 62.2 2.2 99.9Clay (N=7) 0.0 28.6 71.4 0.0 100.0Douglas (N=3) 0.0 0.0 100.0 0.0 100.0Grant (N=4) 0.0 25.0 75.0 0.0 100.0Otter Tail (N=5) 0.0 40.0 60.0 0.0 100.0Pope (N=9) 0.0 44.4 55.6 0.0 100.0Stevens (N=4) 0.0 0.0 100.0 0.0 100.0Traverse (N=8) 12.5 37.5 37.5 12.5 100.0Wilkin (N=5) 20.0 40.0 40.0 0.0 100.0
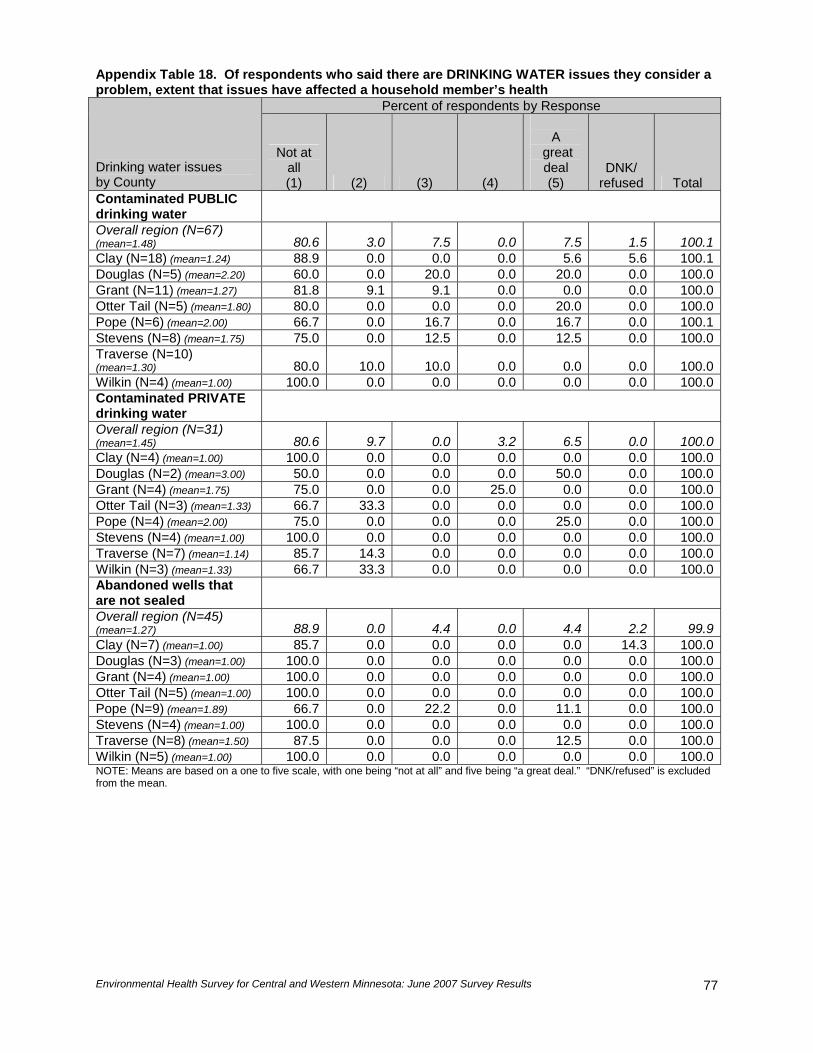
Environmental Health Survey for Central and Western Minnesota: June 2007 Survey Results
77
Appendix Table 18. Of respondents who said there are DRINKING WATER issues they consider a problem, extent that issues have affected a household member’s health
Percent of respondents by Response
Drinking water issues by County
Not at all (1) (2) (3) (4)
A
great deal (5)
DNK/ refused Total
Contaminated PUBLIC drinking water Overall region (N=67) (mean=1.48) 80.6 3.0 7.5 0.0 7.5 1.5 100.1Clay (N=18) (mean=1.24) 88.9 0.0 0.0 0.0 5.6 5.6 100.1Douglas (N=5) (mean=2.20) 60.0 0.0 20.0 0.0 20.0 0.0 100.0Grant (N=11) (mean=1.27) 81.8 9.1 9.1 0.0 0.0 0.0 100.0Otter Tail (N=5) (mean=1.80) 80.0 0.0 0.0 0.0 20.0 0.0 100.0Pope (N=6) (mean=2.00) 66.7 0.0 16.7 0.0 16.7 0.0 100.1Stevens (N=8) (mean=1.75) 75.0 0.0 12.5 0.0 12.5 0.0 100.0Traverse (N=10) (mean=1.30) 80.0 10.0 10.0 0.0 0.0 0.0 100.0Wilkin (N=4) (mean=1.00) 100.0 0.0 0.0 0.0 0.0 0.0 100.0Contaminated PRIVATE drinking water Overall region (N=31) (mean=1.45) 80.6 9.7 0.0 3.2 6.5 0.0 100.0Clay (N=4) (mean=1.00) 100.0 0.0 0.0 0.0 0.0 0.0 100.0Douglas (N=2) (mean=3.00) 50.0 0.0 0.0 0.0 50.0 0.0 100.0Grant (N=4) (mean=1.75) 75.0 0.0 0.0 25.0 0.0 0.0 100.0Otter Tail (N=3) (mean=1.33) 66.7 33.3 0.0 0.0 0.0 0.0 100.0Pope (N=4) (mean=2.00) 75.0 0.0 0.0 0.0 25.0 0.0 100.0Stevens (N=4) (mean=1.00) 100.0 0.0 0.0 0.0 0.0 0.0 100.0Traverse (N=7) (mean=1.14) 85.7 14.3 0.0 0.0 0.0 0.0 100.0Wilkin (N=3) (mean=1.33) 66.7 33.3 0.0 0.0 0.0 0.0 100.0Abandoned wells that are not sealed Overall region (N=45) (mean=1.27) 88.9 0.0 4.4 0.0 4.4 2.2 99.9Clay (N=7) (mean=1.00) 85.7 0.0 0.0 0.0 0.0 14.3 100.0Douglas (N=3) (mean=1.00) 100.0 0.0 0.0 0.0 0.0 0.0 100.0Grant (N=4) (mean=1.00) 100.0 0.0 0.0 0.0 0.0 0.0 100.0Otter Tail (N=5) (mean=1.00) 100.0 0.0 0.0 0.0 0.0 0.0 100.0Pope (N=9) (mean=1.89) 66.7 0.0 22.2 0.0 11.1 0.0 100.0Stevens (N=4) (mean=1.00) 100.0 0.0 0.0 0.0 0.0 0.0 100.0Traverse (N=8) (mean=1.50) 87.5 0.0 0.0 0.0 12.5 0.0 100.0Wilkin (N=5) (mean=1.00) 100.0 0.0 0.0 0.0 0.0 0.0 100.0NOTE: Means are based on a one to five scale, with one being “not at all” and five being “a great deal.” “DNK/refused” is excluded from the mean.

Environmental Health Survey for Central and Western Minnesota: June 2007 Survey Results 78
Appendix Table 19. Degree that FOOD HEALTH AND SAFETY STANDARDS are addressed Percent of respondents by Response
Food protection areas by County
Not addressed
at all (1) (2) (3) (4)
Very well
addressed (5)
DNK/ refused Total
Food in grocery and convenience stores, delis, and meat markets Overall region (N=606) (mean=3.93) 2.1 6.4 22.4 29.5 35.5 4.0 99.9Clay (N=75) (mean=3.73) 1.3 12.0 24.0 34.7 25.3 2.7 100.0Douglas (N=75) (mean=4.00) 2.7 1.3 21.3 37.3 32.0 5.3 99.9Grant (N=75) (mean=3.99) 2.7 4.0 22.7 29.3 37.3 4.0 100.0Otter Tail (N=75) (mean=3.73) 0.0 10.7 28.0 32.0 24.0 5.3 100.0Pope (N=78) (mean=3.93) 1.3 7.7 23.1 28.2 35.9 3.8 100.0Stevens (N=75) (mean=3.88) 4.0 5.3 24.0 28.0 34.7 4.0 100.0Traverse (N=76) (mean=3.95) 2.6 9.2 22.4 19.7 43.4 2.6 99.9Wilkin (N=77) (mean=4.27) 2.6 1.3 14.3 27.3 50.6 3.9 100.0Food in restaurants and bars Overall region (N=606) (mean=3.81) 4.5 6.6 23.9 26.9 32.3 5.8 100.0Clay (N=75) (mean=3.66) 2.7 4.0 37.3 34.7 20.0 1.3 100.0Douglas (N=75) (mean=3.86) 1.3 4.0 25.3 38.7 24.0 6.7 100.0Grant (N=75) (mean=3.84) 6.7 6.7 18.7 24.0 37.3 6.7 100.1Otter Tail (N=75) (mean=3.30) 5.3 14.7 36.0 18.7 17.3 8.0 100.0Pope (N=78) (mean=4.13) 2.6 3.8 17.9 25.6 46.2 3.8 99.9Stevens (N=75) (mean=3.70) 6.7 6.7 24.0 28.0 29.3 5.3 100.0Traverse (N=76) (mean=3.89) 3.9 9.2 17.1 26.3 36.8 6.6 99.9Wilkin (N=77) (mean=4.04) 6.5 3.9 15.6 19.5 46.8 7.8 100.1Food prepared for and served at community events Overall region (N=606) (mean=3.64) 8.7 10.2 18.6 26.4 31.0 5.0 99.9Clay (N=75) (mean=3.46) 6.7 14.7 25.3 22.7 24.0 6.7 100.1Douglas (N=75) (mean=3.61) 5.3 8.0 29.3 24.0 25.3 8.0 99.9Grant (N=75) (mean=3.36) 20.0 12.0 12.0 21.3 33.3 1.3 99.9Otter Tail (N=75) (mean=3.19) 17.3 13.3 14.7 34.7 16.0 4.0 100.0Pope (N=78) (mean=4.14) 1.3 3.8 21.8 20.5 46.2 6.4 100.0Stevens (N=75) (mean=3.64) 8.0 13.3 14.7 29.3 30.7 4.0 100.0Traverse (N=76) (mean=3.79) 7.9 6.6 17.1 30.3 34.2 3.9 100.0Wilkin (N=77) (mean=3.90) 3.9 10.4 14.3 28.6 37.7 5.2 100.1NOTE: Means are based on a one to five scale, with one being “not addressed at all” and five being “very well addressed.” “DNK/refused” is excluded from the mean.

Environmental Health Survey for Central and Western Minnesota: June 2007 Survey Results
79
Appendix Table 20. Of respondents who said FOOD HEALTH AND SAFETY STANDARDS are not well addressed, level of priority in addressing poor health and safety standards
Percent of respondents by Level of priority
Food protection areas by County Low
priority Medium priority
High priority
DNK/ refused Total
Food in grocery and convenience stores, delis, and meat markets Overall region (N=52) 7.7 36.5 50.0 5.8 100.0Clay (N=10) 10.0 40.0 40.0 10.0 100.0Douglas (N=3) 0.0 33.3 66.7 0.0 100.0Grant (N=5) 20.0 20.0 40.0 20.0 100.0Otter Tail (N=8) 0.0 25.0 75.0 0.0 100.0Pope (N=7) 0.0 28.6 71.4 0.0 100.0Stevens (N=7) 14.3 42.9 42.9 0.0 100.1Traverse (N=9) 0.0 44.4 44.4 11.1 99.9Wilkin (N=3) 33.3 66.7 0.0 0.0 100.0Food in restaurants and bars Overall region (N=67) 13.4 37.3 46.3 3.0 100.0Clay (N=5) 20.0 60.0 20.0 0.0 100.0Douglas (N=4) 0.0 25.0 75.0 0.0 100.0Grant (N=10) 30.0 30.0 30.0 10.0 100.0Otter Tail (N=15) 0.0 20.0 80.0 0.0 100.0Pope (N=5) 20.0 20.0 60.0 0.0 100.0Stevens (N=10) 10.0 30.0 50.0 10.0 100.0Traverse (N=10) 10.0 90.0 0.0 0.0 100.0Wilkin (N=8) 25.0 25.0 50.0 0.0 100.0Food prepared for and served at community events Overall region (N=115) 42.6 40.0 15.7 1.7 100.0Clay (N=16) 25.0 50.0 25.0 0.0 100.0Douglas (N=10) 20.0 40.0 20.0 20.0 100.0Grant (N=24) 50.0 29.2 20.8 0.0 100.0Otter Tail (N=23) 52.2 43.5 4.3 0.0 100.0Pope (N=4) 50.0 50.0 0.0 0.0 100.0Stevens (N=16) 50.0 37.5 12.5 0.0 100.0Traverse (N=11) 45.5 27.3 27.3 0.0 100.1Wilkin (N=11) 36.4 54.5 9.1 0.0 100.0

Environmental Health Survey for Central and Western Minnesota: June 2007 Survey Results 80
Appendix Table 21. Of respondents who said FOOD HEALTH AND SAFETY STANDARDS are not well addressed, extent that poor health and safety standards have affected a household member’s health
Percent of respondents by Response
Food protection areas by County
Not at all (1) (2) (3) (4)
A great
deal (5)
DNK/ refused Total
Food in restaurants and bars Overall region (N=67) (mean=2.27) 52.2 13.4 6.0 7.5 19.4 1.5 100.0Clay (N=5) (mean=2.40) 40.0 20.0 20.0 0.0 20.0 0.0 100.0Douglas (N=4) (mean=3.00) 25.0 25.0 0.0 25.0 25.0 0.0 100.0Grant (N=10) (mean=1.80) 80.0 0.0 0.0 0.0 20.0 0.0 100.0Otter Tail (N=15) (mean=2.93) 26.7 13.3 20.0 6.7 26.7 6.7 100.1Pope (N=5) (mean=3.40) 20.0 20.0 0.0 20.0 40.0 0.0 100.0Stevens (N=10) (mean=1.50) 80.0 10.0 0.0 0.0 10.0 0.0 100.0Traverse (N=10) (mean=1.60) 60.0 30.0 0.0 10.0 0.0 0.0 100.0Wilkin (N=8) (mean=2.38) 62.5 0.0 0.0 12.5 25.0 0.0 100.0Food in grocery and convenience stores, delis, and meat markets Overall region (N=52) (mean=1.81) 67.3 7.7 7.7 11.5 5.8 0.0 100.0Clay (N=10) (mean=1.60) 70.0 10.0 10.0 10.0 0.0 0.0 100.0Douglas (N=3) (mean=2.33) 66.7 0.0 0.0 0.0 33.3 0.0 100.0Grant (N=5) (mean=1.00) 100.0 0.0 0.0 0.0 0.0 0.0 100.0Otter Tail (N=8) (mean=1.63) 62.5 25.0 0.0 12.5 0.0 0.0 100.0Pope (N=7) (mean=2.86) 28.6 0.0 28.6 42.9 0.0 0.0 100.1Stevens (N=7) (mean=1.00) 100.0 0.0
0.0 0.0 0.0 0.0 100.0
Traverse (N=9) (mean=2.11) 55.6 11.1 11.1 11.1 11.1 0.0 100.0Wilkin (N=3) (mean=2.33) 66.7 0.0 0.0 0.0 33.3 0.0 100.0Food prepared for and served at community events Overall region (N=115) (mean=1.30) 87.8 4.3 0.9 4.3 2.6 0.0 99.9Clay (N=16) (mean=1.38) 87.5 0.0 0.0 12.5 0.0 0.0 100.0Douglas (N=10) (mean=1.80) 80.0 0.0 0.0 0.0 20.0 0.0 100.0Grant (N=24) (mean=1.25) 87.5 4.2 4.2 4.2 0.0 0.0 100.1Otter Tail (N=23) (mean=1.22) 87.0 8.7 0.0 4.3 0.0 0.0 100.0Pope (N=4) (mean=1.00) 100.0 0.0 0.0 0.0 0.0 0.0 100.0Stevens (N=16) (mean=1.25) 87.5 6.3 0.0 6.3 0.0 0.0 100.1Traverse (N=11) (mean=1.00) 100.0 0.0
0.0 0.0 0.0 0.0 100.0
Wilkin (N=11) (mean=1.45) 81.8 9.1 0.0 0.0 9.1 0.0 100.0NOTE: Means are based on a one to five scale, with one being “not at all” and five being “a great deal.” “DNK/refused” is excluded from the mean.
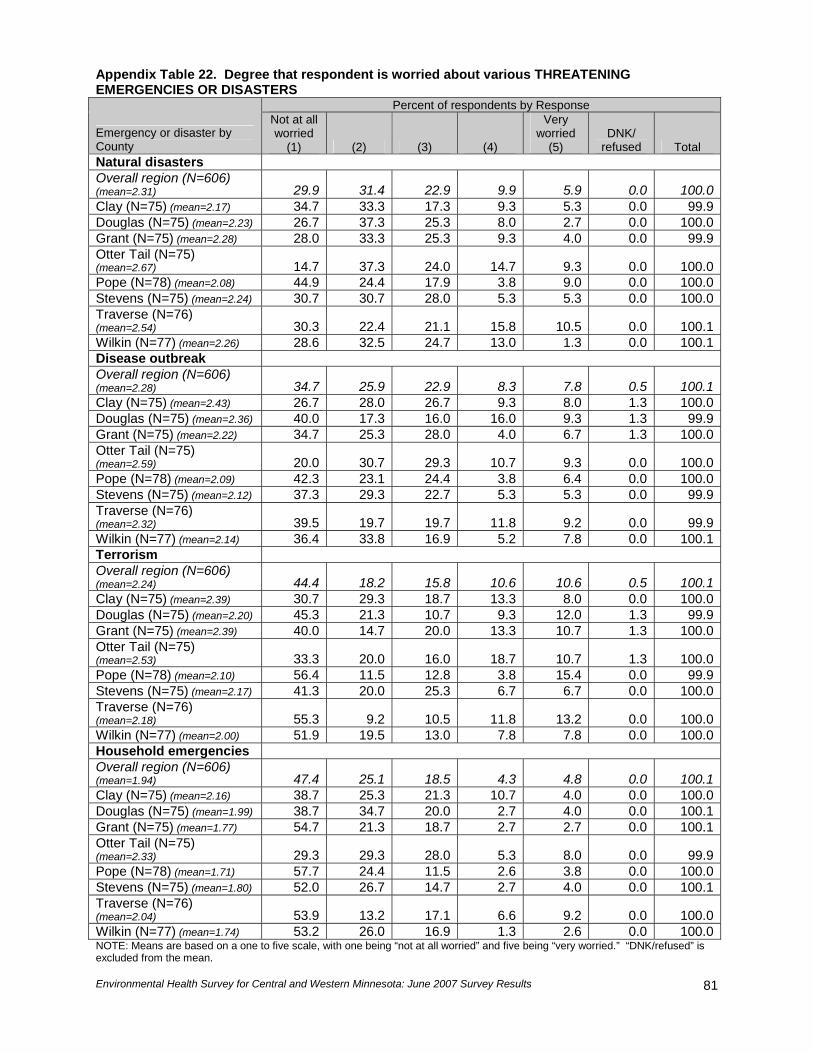
Environmental Health Survey for Central and Western Minnesota: June 2007 Survey Results
81
Appendix Table 22. Degree that respondent is worried about various THREATENING EMERGENCIES OR DISASTERS
Percent of respondents by Response
Emergency or disaster by County
Not at all worried
(1) (2) (3) (4)
Very worried
(5) DNK/
refused Total Natural disasters Overall region (N=606) (mean=2.31) 29.9 31.4 22.9 9.9 5.9 0.0 100.0Clay (N=75) (mean=2.17) 34.7 33.3 17.3 9.3 5.3 0.0 99.9Douglas (N=75) (mean=2.23) 26.7 37.3 25.3 8.0 2.7 0.0 100.0Grant (N=75) (mean=2.28) 28.0 33.3 25.3 9.3 4.0 0.0 99.9Otter Tail (N=75) (mean=2.67) 14.7 37.3 24.0 14.7 9.3 0.0 100.0Pope (N=78) (mean=2.08) 44.9 24.4 17.9 3.8 9.0 0.0 100.0Stevens (N=75) (mean=2.24) 30.7 30.7 28.0 5.3 5.3 0.0 100.0Traverse (N=76) (mean=2.54) 30.3 22.4 21.1 15.8 10.5 0.0 100.1Wilkin (N=77) (mean=2.26) 28.6 32.5 24.7 13.0 1.3 0.0 100.1Disease outbreak Overall region (N=606) (mean=2.28) 34.7 25.9 22.9 8.3 7.8 0.5 100.1Clay (N=75) (mean=2.43) 26.7 28.0 26.7 9.3 8.0 1.3 100.0Douglas (N=75) (mean=2.36) 40.0 17.3 16.0 16.0 9.3 1.3 99.9Grant (N=75) (mean=2.22) 34.7 25.3 28.0 4.0 6.7 1.3 100.0Otter Tail (N=75) (mean=2.59) 20.0 30.7 29.3 10.7 9.3 0.0 100.0Pope (N=78) (mean=2.09) 42.3 23.1 24.4 3.8 6.4 0.0 100.0Stevens (N=75) (mean=2.12) 37.3 29.3 22.7 5.3 5.3 0.0 99.9Traverse (N=76) (mean=2.32) 39.5 19.7 19.7 11.8 9.2 0.0 99.9Wilkin (N=77) (mean=2.14) 36.4 33.8 16.9 5.2 7.8 0.0 100.1Terrorism Overall region (N=606) (mean=2.24) 44.4 18.2 15.8 10.6 10.6 0.5 100.1Clay (N=75) (mean=2.39) 30.7 29.3 18.7 13.3 8.0 0.0 100.0Douglas (N=75) (mean=2.20) 45.3 21.3 10.7 9.3 12.0 1.3 99.9Grant (N=75) (mean=2.39) 40.0 14.7 20.0 13.3 10.7 1.3 100.0Otter Tail (N=75) (mean=2.53) 33.3 20.0 16.0 18.7 10.7 1.3 100.0Pope (N=78) (mean=2.10) 56.4 11.5 12.8 3.8 15.4 0.0 99.9Stevens (N=75) (mean=2.17) 41.3 20.0 25.3 6.7 6.7 0.0 100.0Traverse (N=76) (mean=2.18) 55.3 9.2 10.5 11.8 13.2 0.0 100.0Wilkin (N=77) (mean=2.00) 51.9 19.5 13.0 7.8 7.8 0.0 100.0Household emergencies Overall region (N=606) (mean=1.94) 47.4 25.1 18.5 4.3 4.8 0.0 100.1Clay (N=75) (mean=2.16) 38.7 25.3 21.3 10.7 4.0 0.0 100.0Douglas (N=75) (mean=1.99) 38.7 34.7 20.0 2.7 4.0 0.0 100.1Grant (N=75) (mean=1.77) 54.7 21.3 18.7 2.7 2.7 0.0 100.1Otter Tail (N=75) (mean=2.33) 29.3 29.3 28.0 5.3 8.0 0.0 99.9Pope (N=78) (mean=1.71) 57.7 24.4 11.5 2.6 3.8 0.0 100.0Stevens (N=75) (mean=1.80) 52.0 26.7 14.7 2.7 4.0 0.0 100.1Traverse (N=76) (mean=2.04) 53.9 13.2 17.1 6.6 9.2 0.0 100.0Wilkin (N=77) (mean=1.74) 53.2 26.0 16.9 1.3 2.6 0.0 100.0NOTE: Means are based on a one to five scale, with one being “not at all worried” and five being “very worried.” “DNK/refused” is excluded from the mean.
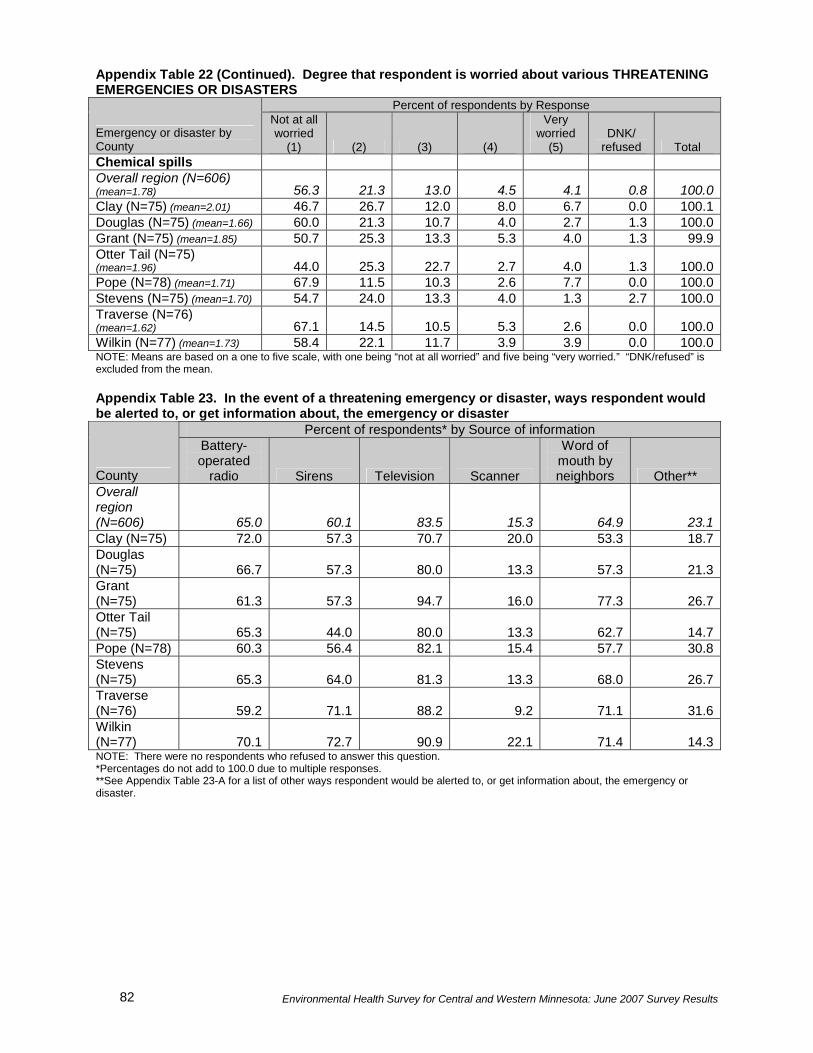
Environmental Health Survey for Central and Western Minnesota: June 2007 Survey Results 82
Appendix Table 22 (Continued). Degree that respondent is worried about various THREATENING EMERGENCIES OR DISASTERS
Percent of respondents by Response
Emergency or disaster by County
Not at all worried
(1) (2) (3) (4)
Very worried
(5) DNK/
refused Total Chemical spills Overall region (N=606) (mean=1.78) 56.3 21.3 13.0 4.5 4.1 0.8 100.0Clay (N=75) (mean=2.01) 46.7 26.7 12.0 8.0 6.7 0.0 100.1Douglas (N=75) (mean=1.66) 60.0 21.3 10.7 4.0 2.7 1.3 100.0Grant (N=75) (mean=1.85) 50.7 25.3 13.3 5.3 4.0 1.3 99.9Otter Tail (N=75) (mean=1.96) 44.0 25.3 22.7 2.7 4.0 1.3 100.0Pope (N=78) (mean=1.71) 67.9 11.5 10.3 2.6 7.7 0.0 100.0Stevens (N=75) (mean=1.70) 54.7 24.0 13.3 4.0 1.3 2.7 100.0Traverse (N=76) (mean=1.62) 67.1 14.5 10.5 5.3 2.6 0.0 100.0Wilkin (N=77) (mean=1.73) 58.4 22.1 11.7 3.9 3.9 0.0 100.0NOTE: Means are based on a one to five scale, with one being “not at all worried” and five being “very worried.” “DNK/refused” is excluded from the mean. Appendix Table 23. In the event of a threatening emergency or disaster, ways respondent would be alerted to, or get information about, the emergency or disaster
Percent of respondents* by Source of information
County
Battery- operated
radio Sirens Television Scanner
Word of mouth by neighbors Other**
Overall region (N=606) 65.0 60.1 83.5 15.3 64.9 23.1Clay (N=75) 72.0 57.3 70.7 20.0 53.3 18.7Douglas (N=75) 66.7 57.3 80.0 13.3 57.3 21.3Grant (N=75) 61.3 57.3 94.7 16.0 77.3 26.7Otter Tail (N=75) 65.3 44.0 80.0 13.3 62.7 14.7Pope (N=78) 60.3 56.4 82.1 15.4 57.7 30.8Stevens (N=75) 65.3 64.0 81.3 13.3 68.0 26.7Traverse (N=76) 59.2 71.1 88.2 9.2 71.1 31.6Wilkin (N=77) 70.1 72.7 90.9 22.1 71.4 14.3NOTE: There were no respondents who refused to answer this question. *Percentages do not add to 100.0 due to multiple responses. **See Appendix Table 23-A for a list of other ways respondent would be alerted to, or get information about, the emergency or disaster.
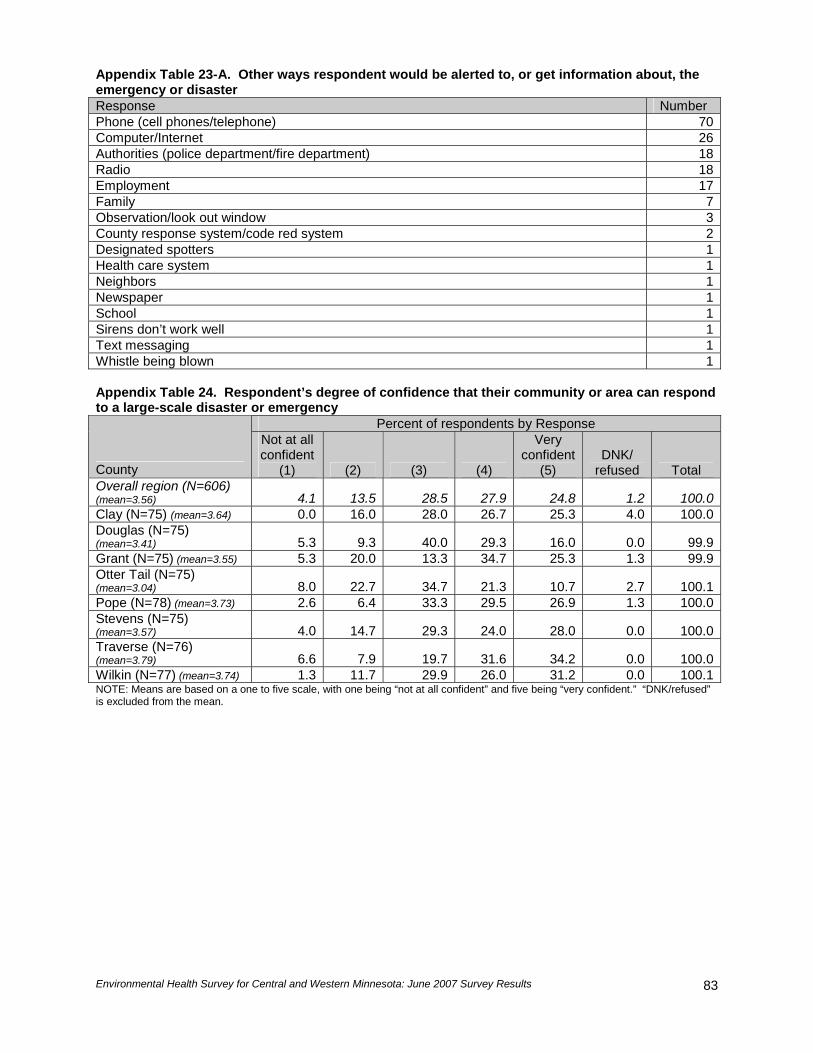
Environmental Health Survey for Central and Western Minnesota: June 2007 Survey Results
83
Appendix Table 23-A. Other ways respondent would be alerted to, or get information about, the emergency or disaster Response Number Phone (cell phones/telephone) 70Computer/Internet 26Authorities (police department/fire department) 18Radio 18Employment 17Family 7Observation/look out window 3County response system/code red system 2Designated spotters 1Health care system 1Neighbors 1Newspaper 1School 1Sirens don’t work well 1Text messaging 1Whistle being blown 1 Appendix Table 24. Respondent’s degree of confidence that their community or area can respond to a large-scale disaster or emergency
Percent of respondents by Response
County
Not at all confident
(1) (2) (3) (4)
Very confident
(5) DNK/
refused Total Overall region (N=606) (mean=3.56) 4.1 13.5 28.5 27.9 24.8 1.2 100.0Clay (N=75) (mean=3.64) 0.0 16.0 28.0 26.7 25.3 4.0 100.0Douglas (N=75) (mean=3.41) 5.3 9.3 40.0 29.3 16.0 0.0 99.9Grant (N=75) (mean=3.55) 5.3 20.0 13.3 34.7 25.3 1.3 99.9Otter Tail (N=75) (mean=3.04) 8.0 22.7 34.7 21.3 10.7 2.7 100.1Pope (N=78) (mean=3.73) 2.6 6.4 33.3 29.5 26.9 1.3 100.0Stevens (N=75) (mean=3.57) 4.0 14.7 29.3 24.0 28.0 0.0 100.0Traverse (N=76) (mean=3.79) 6.6 7.9 19.7 31.6 34.2 0.0 100.0Wilkin (N=77) (mean=3.74) 1.3 11.7 29.9 26.0 31.2 0.0 100.1NOTE: Means are based on a one to five scale, with one being “not at all confident” and five being “very confident.” “DNK/refused” is excluded from the mean.

Environmental Health Survey for Central and Western Minnesota: June 2007 Survey Results 84
Appendix Table 25. Level of preparedness of respondent’s household in the event of an emergency or disaster
Percent of respondents by Response
County
Not at all prepared
(1) (2) (3) (4)
Very prepared
(5) DNK/
refused Total Overall region (N=606) (mean=3.17) 10.4 16.7 32.2 26.4 14.0 0.3 100.0Clay (N=75) (mean=3.14) 5.3 18.7 38.7 29.3 6.7 1.3 100.0Douglas (N=75) (mean=3.47) 4.0 16.0 30.7 25.3 22.7 1.3 100.0Grant (N=75) (mean=3.11) 9.3 21.3 33.3 21.3 14.7 0.0 99.9Otter Tail (N=75) (mean=3.01) 14.7 16.0 30.7 30.7 8.0 0.0 100.1Pope (N=78) (mean=3.26) 15.4 11.5 26.9 24.4 21.8 0.0 100.0Stevens (N=75) (mean=2.96) 13.3 20.0 32.0 26.7 8.0 0.0 100.0Traverse (N=76) (mean=3.11) 15.8 9.2 38.2 22.4 14.5 0.0 100.1Wilkin (N=77) (mean=3.31) 5.2 20.8 27.3 31.2 15.6 0.0 100.1NOTE: Means are based on a one to five scale, with one being “not at all prepared” and five being “very prepared.” “DNK/refused” is excluded from the mean. Appendix Table 26. Of respondents who are not well prepared for an emergency or disaster, likelihood of respondent taking necessary steps, within the next three months, to prepare for an emergency or disaster
Percent of respondents by Response
County
Not at all likely (1) (2) (3) (4)
Very likely (5)
DNK/ refused Total
Overall region (N=164) (mean=2.40) 26.8 31.7 22.6 7.3 9.8 1.8 100.0Clay (N=18) (mean=2.56) 16.7 33.3 33.3 11.1 5.6 0.0 100.0Douglas (N=15) (mean=2.64) 13.3 26.7 40.0 6.7 6.7 6.7 100.1Grant (N=23) (mean=2.17) 39.1 17.4 34.8 4.3 4.3 0.0 99.9Otter Tail (N=23) (mean=2.22) 34.8 30.4 21.7 4.3 8.7 0.0 99.9Pope (N=21) (mean=2.76) 23.8 19.0 28.6 14.3 14.3 0.0 100.0Stevens (N=25) (mean=2.29) 24.0 52.0 0.0 8.0 12.0 4.0 100.0Traverse (N=19) (mean=2.56) 21.1 31.6 21.1 10.5 10.5 5.3 100.1Wilkin (N=20) (mean=2.20) 35.0 40.0 10.0 0.0 15.0 0.0 100.0NOTE: Means are based on a one to five scale, with one being “not at all likely” and five being “very likely.” “DNK/refused” is excluded from the mean.
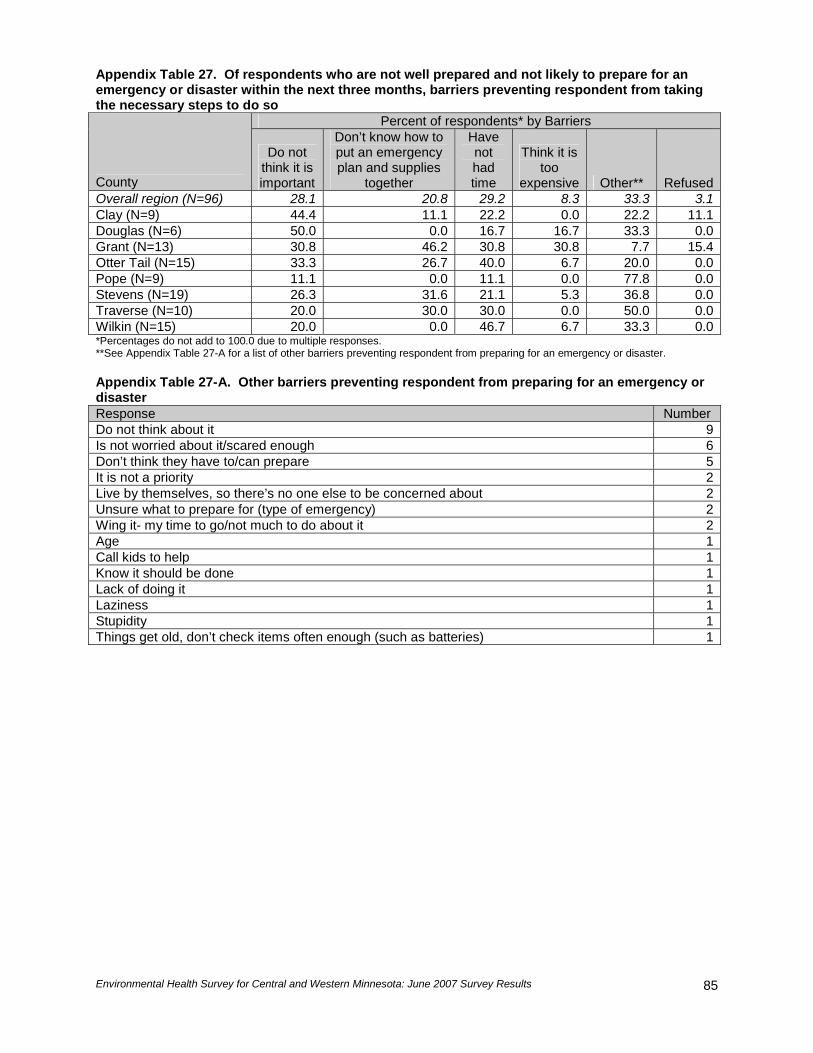
Environmental Health Survey for Central and Western Minnesota: June 2007 Survey Results
85
Appendix Table 27. Of respondents who are not well prepared and not likely to prepare for an emergency or disaster within the next three months, barriers preventing respondent from taking the necessary steps to do so
Percent of respondents* by Barriers
County
Do not think it is important
Don’t know how to put an emergency plan and supplies
together
Have not had time
Think it is too
expensive Other** RefusedOverall region (N=96) 28.1 20.8 29.2 8.3 33.3 3.1Clay (N=9) 44.4 11.1 22.2 0.0 22.2 11.1Douglas (N=6) 50.0 0.0 16.7 16.7 33.3 0.0Grant (N=13) 30.8 46.2 30.8 30.8 7.7 15.4Otter Tail (N=15) 33.3 26.7 40.0 6.7 20.0 0.0Pope (N=9) 11.1 0.0 11.1 0.0 77.8 0.0Stevens (N=19) 26.3 31.6 21.1 5.3 36.8 0.0Traverse (N=10) 20.0 30.0 30.0 0.0 50.0 0.0Wilkin (N=15) 20.0 0.0 46.7 6.7 33.3 0.0*Percentages do not add to 100.0 due to multiple responses. **See Appendix Table 27-A for a list of other barriers preventing respondent from preparing for an emergency or disaster. Appendix Table 27-A. Other barriers preventing respondent from preparing for an emergency or disaster Response Number Do not think about it 9Is not worried about it/scared enough 6Don’t think they have to/can prepare 5It is not a priority 2Live by themselves, so there’s no one else to be concerned about 2Unsure what to prepare for (type of emergency) 2Wing it- my time to go/not much to do about it 2Age 1Call kids to help 1Know it should be done 1Lack of doing it 1Laziness 1Stupidity 1Things get old, don’t check items often enough (such as batteries) 1
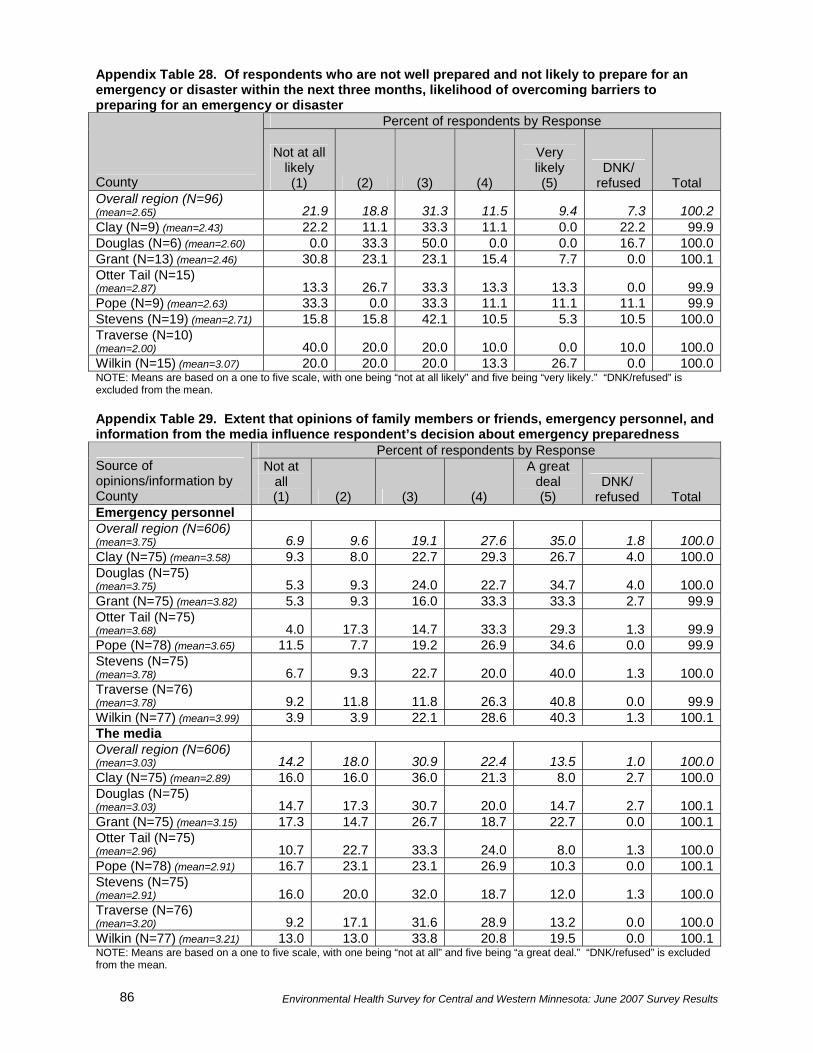
Environmental Health Survey for Central and Western Minnesota: June 2007 Survey Results 86
Appendix Table 28. Of respondents who are not well prepared and not likely to prepare for an emergency or disaster within the next three months, likelihood of overcoming barriers to preparing for an emergency or disaster
Percent of respondents by Response
County
Not at all likely (1) (2) (3) (4)
Very likely (5)
DNK/ refused Total
Overall region (N=96) (mean=2.65) 21.9 18.8 31.3 11.5 9.4 7.3 100.2Clay (N=9) (mean=2.43) 22.2 11.1 33.3 11.1 0.0 22.2 99.9Douglas (N=6) (mean=2.60) 0.0 33.3 50.0 0.0 0.0 16.7 100.0Grant (N=13) (mean=2.46) 30.8 23.1 23.1 15.4 7.7 0.0 100.1Otter Tail (N=15) (mean=2.87) 13.3 26.7 33.3 13.3 13.3 0.0 99.9Pope (N=9) (mean=2.63) 33.3 0.0 33.3 11.1 11.1 11.1 99.9Stevens (N=19) (mean=2.71) 15.8 15.8 42.1 10.5 5.3 10.5 100.0Traverse (N=10) (mean=2.00) 40.0 20.0 20.0 10.0 0.0 10.0 100.0Wilkin (N=15) (mean=3.07) 20.0 20.0 20.0 13.3 26.7 0.0 100.0NOTE: Means are based on a one to five scale, with one being “not at all likely” and five being “very likely.” “DNK/refused” is excluded from the mean. Appendix Table 29. Extent that opinions of family members or friends, emergency personnel, and information from the media influence respondent’s decision about emergency preparedness
Percent of respondents by Response Source of opinions/information by County
Not at all (1) (2) (3) (4)
A great deal (5)
DNK/ refused Total
Emergency personnel Overall region (N=606) (mean=3.75) 6.9 9.6 19.1 27.6 35.0 1.8 100.0Clay (N=75) (mean=3.58) 9.3 8.0 22.7 29.3 26.7 4.0 100.0Douglas (N=75) (mean=3.75) 5.3 9.3 24.0 22.7 34.7 4.0 100.0Grant (N=75) (mean=3.82) 5.3 9.3 16.0 33.3 33.3 2.7 99.9Otter Tail (N=75) (mean=3.68) 4.0 17.3 14.7 33.3 29.3 1.3 99.9Pope (N=78) (mean=3.65) 11.5 7.7 19.2 26.9 34.6 0.0 99.9Stevens (N=75) (mean=3.78) 6.7 9.3 22.7 20.0 40.0 1.3 100.0Traverse (N=76) (mean=3.78) 9.2 11.8 11.8 26.3 40.8 0.0 99.9Wilkin (N=77) (mean=3.99) 3.9 3.9 22.1 28.6 40.3 1.3 100.1The media Overall region (N=606) (mean=3.03) 14.2 18.0 30.9 22.4 13.5 1.0 100.0Clay (N=75) (mean=2.89) 16.0 16.0 36.0 21.3 8.0 2.7 100.0Douglas (N=75) (mean=3.03) 14.7 17.3 30.7 20.0 14.7 2.7 100.1Grant (N=75) (mean=3.15) 17.3 14.7 26.7 18.7 22.7 0.0 100.1Otter Tail (N=75) (mean=2.96) 10.7 22.7 33.3 24.0 8.0 1.3 100.0Pope (N=78) (mean=2.91) 16.7 23.1 23.1 26.9 10.3 0.0 100.1Stevens (N=75) (mean=2.91) 16.0 20.0 32.0 18.7 12.0 1.3 100.0Traverse (N=76) (mean=3.20) 9.2 17.1 31.6 28.9 13.2 0.0 100.0Wilkin (N=77) (mean=3.21) 13.0 13.0 33.8 20.8 19.5 0.0 100.1NOTE: Means are based on a one to five scale, with one being “not at all” and five being “a great deal.” “DNK/refused” is excluded from the mean.
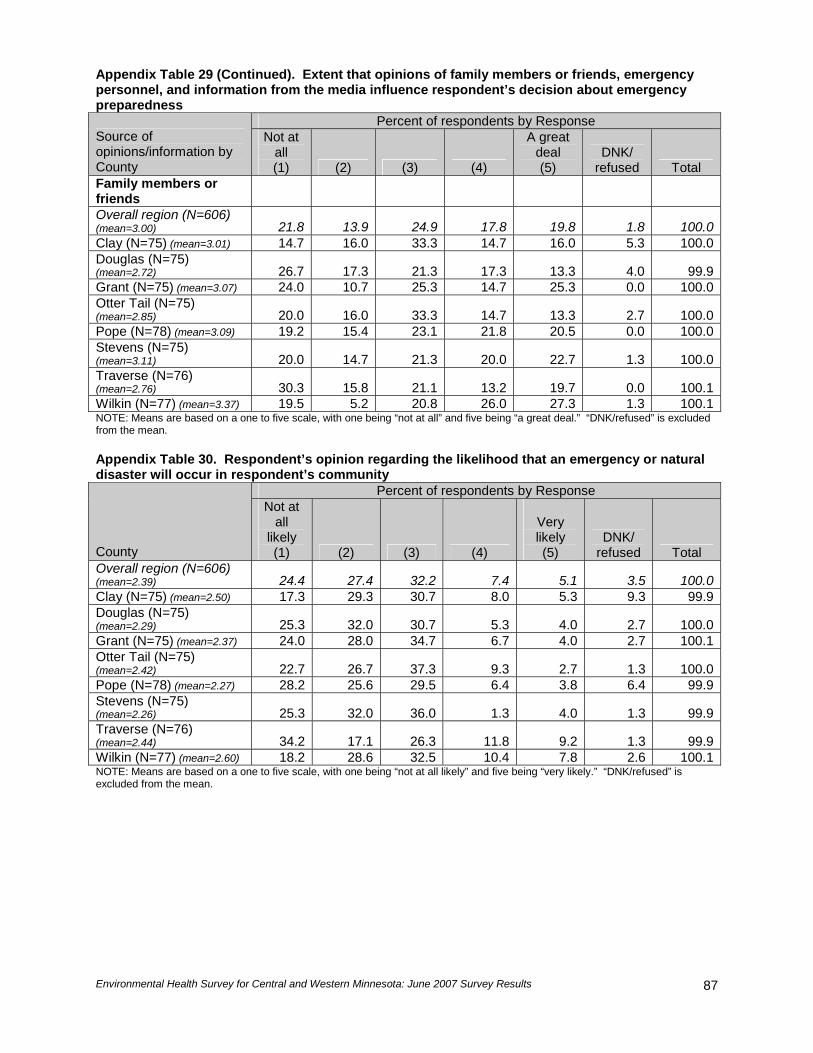
Environmental Health Survey for Central and Western Minnesota: June 2007 Survey Results
87
Appendix Table 29 (Continued). Extent that opinions of family members or friends, emergency personnel, and information from the media influence respondent’s decision about emergency preparedness
Percent of respondents by Response Source of opinions/information by County
Not at all (1) (2) (3) (4)
A great deal (5)
DNK/ refused Total
Family members or friends Overall region (N=606) (mean=3.00) 21.8 13.9 24.9 17.8 19.8 1.8 100.0Clay (N=75) (mean=3.01) 14.7 16.0 33.3 14.7 16.0 5.3 100.0Douglas (N=75) (mean=2.72) 26.7 17.3 21.3 17.3 13.3 4.0 99.9Grant (N=75) (mean=3.07) 24.0 10.7 25.3 14.7 25.3 0.0 100.0Otter Tail (N=75) (mean=2.85) 20.0 16.0 33.3 14.7 13.3 2.7 100.0Pope (N=78) (mean=3.09) 19.2 15.4 23.1 21.8 20.5 0.0 100.0Stevens (N=75) (mean=3.11) 20.0 14.7 21.3 20.0 22.7 1.3 100.0Traverse (N=76) (mean=2.76) 30.3 15.8 21.1 13.2 19.7 0.0 100.1Wilkin (N=77) (mean=3.37) 19.5 5.2 20.8 26.0 27.3 1.3 100.1NOTE: Means are based on a one to five scale, with one being “not at all” and five being “a great deal.” “DNK/refused” is excluded from the mean. Appendix Table 30. Respondent’s opinion regarding the likelihood that an emergency or natural disaster will occur in respondent’s community
Percent of respondents by Response
County
Not at all
likely (1) (2) (3) (4)
Very likely (5)
DNK/ refused Total
Overall region (N=606) (mean=2.39) 24.4 27.4 32.2 7.4 5.1 3.5 100.0Clay (N=75) (mean=2.50) 17.3 29.3 30.7 8.0 5.3 9.3 99.9Douglas (N=75) (mean=2.29) 25.3 32.0 30.7 5.3 4.0 2.7 100.0Grant (N=75) (mean=2.37) 24.0 28.0 34.7 6.7 4.0 2.7 100.1Otter Tail (N=75) (mean=2.42) 22.7 26.7 37.3 9.3 2.7 1.3 100.0Pope (N=78) (mean=2.27) 28.2 25.6 29.5 6.4 3.8 6.4 99.9Stevens (N=75) (mean=2.26) 25.3 32.0 36.0 1.3 4.0 1.3 99.9Traverse (N=76) (mean=2.44) 34.2 17.1 26.3 11.8 9.2 1.3 99.9Wilkin (N=77) (mean=2.60) 18.2 28.6 32.5 10.4 7.8 2.6 100.1NOTE: Means are based on a one to five scale, with one being “not at all likely” and five being “very likely.” “DNK/refused” is excluded from the mean.

Environmental Health Survey for Central and Western Minnesota: June 2007 Survey Results 88
Appendix Table 31. Age of respondent Percent of respondents by Years of age
County Less
than 21 21 to 24 25 to 34 35 to 44 45 to 54 55 to 64 65 or older Refused Total
Overall region (N=606) 0.8 0.8 8.9 14.2 19.5 22.1 33.2 0.5 100.0 Clay (N=75) 0.0 0.0 12.0 18.7 22.7 21.3 25.3 0.0 100.0 Douglas (N=75) 2.7 0.0 2.7 16.0 16.0 28.0 33.3 1.3 100.0 Grant (N=75) 0.0 0.0 6.7 12.0 14.7 21.3 42.7 2.7 100.1 Otter Tail (N=75) 0.0 4.0 9.3 10.7 13.3 20.0 42.7 0.0 100.0 Pope (N=78) 1.3 0.0 11.5 6.4 20.5 28.2 32.1 0.0 100.0 Stevens (N=75) 0.0 1.3 6.7 13.3 21.3 25.3 32.0 0.0 99.9 Traverse (N=76) 1.3 0.0 14.5 13.2 19.7 14.5 36.8 0.0 100.0 Wilkin (N=77) 1.3 1.3 7.8 23.4 27.3 18.2 20.8 0.0 100.1 Appendix Table 32. Education of respondent
Percent of respondents by Level of education
County
Less than high
school
High school
graduate or GED
Some vocational/tech, but no degree
Vocational/tech degree
Some college, but no degree
College degree
Graduate school or
professional degree Refused Total
Overall region (N=606) 5.0 26.7 5.8 15.3 12.9 24.6 9.2 0.5 100.0 Clay (N=75) 4.0 22.7 5.3 17.3 10.7 29.3 9.3 1.3 99.9 Douglas (N=75) 0.0 21.3 8.0 16.0 14.7 24.0 14.7 1.3 100.0 Grant (N=75) 8.0 25.3 2.7 17.3 12.0 28.0 5.3 1.3 99.9 Otter Tail (N=75) 4.0 28.0 10.7 10.7 14.7 18.7 13.3 0.0 100.1 Pope (N=78) 5.1 26.9 7.7 20.5 11.5 20.5 7.7 0.0 99.9 Stevens (N=75) 2.7 24.0 2.7 16.0 9.3 36.0 9.3 0.0 100.0 Traverse (N=76) 9.2 34.2 6.6 13.2 13.2 19.7 3.9 0.0 100.0 Wilkin (N=77) 6.5 31.2 2.6 11.7 16.9 20.8 10.4 0.0 100.1

Environmental Health Survey for Central and Western Minnesota: June 2007 Survey Results
89
Appendix Table 33. Annual household income of respondent before taxes Percent of respondents by Annual household income
County Less than $20,000
$20,000 to
$34,999
$35,000 to
$49,999
$50,000 to
$74,999
$75,000 to
$99,999 $100,000 or more Refused Total
Overall region (N=606) 9.1 18.5 18.2 21.6 10.6 6.9 15.2 100.1 Clay (N=75) 6.7 21.3 9.3 24.0 8.0 6.7 24.0 100.0 Douglas (N=75) 9.3 16.0 14.7 21.3 5.3 10.7 22.7 100.0 Grant (N=75) 13.3 12.0 20.0 25.3 8.0 4.0 17.3 99.9 Otter Tail (N=75) 12.0 21.3 14.7 21.3 12.0 6.7 12.0 100.0 Pope (N=78) 7.7 17.9 26.9 23.1 10.3 5.1 9.0 100.0 Stevens (N=75) 9.3 12.0 17.3 18.7 22.7 5.3 14.7 100.0 Traverse (N=76) 7.9 27.6 14.5 21.1 7.9 7.9 13.2 100.1 Wilkin (N=77) 6.5 19.5 27.3 18.2 10.4 9.1 9.1 100.1 Appendix Table 34. Whether respondent lives inside or outside of city limits
Percent of respondents by Location
County Inside city
limits Outside city
limits Refused Total Overall region (N=606) 55.0 44.7 0.3 100.0Clay (N=75) 81.3 17.3 1.3 99.9Douglas (N=75) 32.0 66.7 1.3 100.0Grant (N=75) 41.3 58.7 0.0 100.0Otter Tail (N=75) 34.7 65.3 0.0 100.0Pope (N=78) 44.9 55.1 0.0 100.0Stevens (N=75) 65.3 34.7 0.0 100.0Traverse (N=76) 64.5 35.5 0.0 100.0Wilkin (N=77) 75.3 24.7 0.0 100.0 Appendix Table 35. Household size of respondent
Percent of respondents by Number of people
County One Two Three or
more Refused Total Overall region (N=606) 16.8 48.5 34.2 0.5 100.0Clay (N=75) 20.0 37.3 41.3 1.3 99.9Douglas (N=75) 17.3 52.0 28.0 2.7 100.0Grant (N=75) 18.7 52.0 29.3 0.0 100.0Otter Tail (N=75) 8.0 65.3 26.7 0.0 100.0Pope (N=78) 12.8 59.0 28.2 0.0 100.0Stevens (N=75) 25.3 42.7 32.0 0.0 100.0Traverse (N=76) 18.4 39.5 42.1 0.0 100.0Wilkin (N=77) 14.3 40.3 45.5 0.0 100.1

Environmental Health Survey for Central and Western Minnesota: June 2007 Survey Results 90
Appendix Table 36. Whether there are children younger than 18 living in respondent’s household Percent of respondents by Response
County Yes No Refused Total Overall region (N=606) 28.5 71.1 0.3 99.9Clay (N=75) 42.7 57.3 0.0 100.0Douglas (N=75) 25.3 73.3 1.3 99.9Grant (N=75) 20.0 80.0 0.0 100.0Otter Tail (N=75) 22.7 77.3 0.0 100.0Pope (N=78) 23.1 76.9 0.0 100.0Stevens (N=75) 25.3 74.7 0.0 100.0Traverse (N=76) 39.5 60.5 0.0 100.0Wilkin (N=77) 29.9 68.8 1.3 100.0 Appendix Table 37. Gender of respondent
Percent of respondents by Gender County Male Female Total Overall region (N=606) 32.3 67.7 100.0Clay (N=75) 44.0 56.0 100.0Douglas (N=75) 34.7 65.3 100.0Grant (N=75) 18.7 81.3 100.0Otter Tail (N=75) 41.3 58.7 100.0Pope (N=78) 30.8 69.2 100.0Stevens (N=75) 26.7 73.3 100.0Traverse (N=76) 25.0 75.0 100.0Wilkin (N=77) 37.7 62.3 100.0 Appendix Table 38. Ways that organizations can provide respondent with educational material and information about environmental health problems and disaster preparedness
Percent of respondents* by Sources of delivery
County Regular
mail TV Radio Local
newspaper Community
events Personal contact Internet Email Other** Refused
Overall region (N=606) 68.6 71.0 58.6 64.2 44.7 50.7 37.1 34.5 6.9 0.7 Clay (N=75) 52.0 68.0 46.7 45.3 26.7 30.7 30.7 29.3 5.3 2.7 Douglas (N=75) 54.7 66.7 52.0 54.7 30.7 50.7 38.7 32.0 8.0 0.0 Grant (N=75) 80.0 78.7 61.3 70.7 50.7 54.7 36.0 38.7 8.0 1.3 Otter Tail (N=75) 69.3 66.7 54.7 68.0 44.0 36.0 37.3 29.3 5.3 0.0 Pope (N=78) 64.1 61.5 50.0 64.1 43.6 46.2 30.8 30.8 7.7 0.0 Stevens (N=75) 72.0 72.0 65.3 70.7 52.0 58.7 44.0 37.3 5.3 1.3 Traverse (N=76) 81.6 85.5 72.4 80.3 60.5 69.7 36.8 36.8 10.5 0.0 Wilkin (N=77) 75.3 68.8 66.2 59.7 49.4 58.4 42.9 41.6 5.2 0.0 *Percentages do not add to 100.0 due to multiple responses. **See Appendix Table 38-A for a list of other ways that organizations can provide respondent with educational material and information.
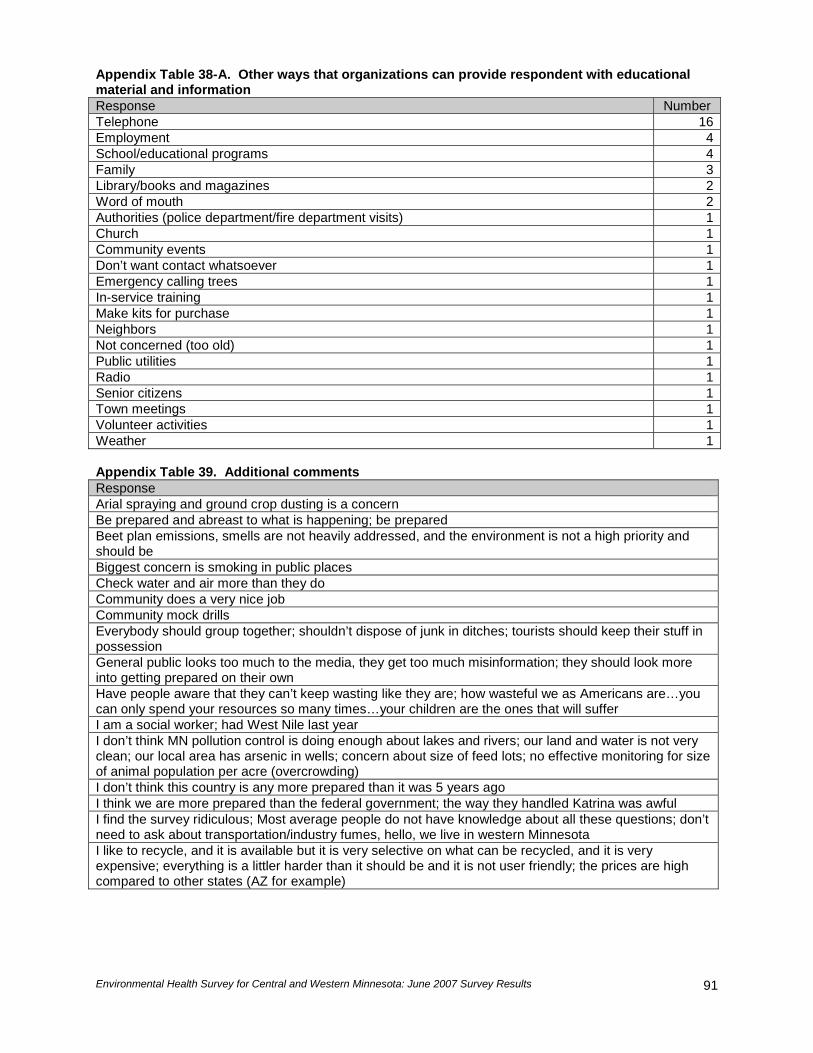
Environmental Health Survey for Central and Western Minnesota: June 2007 Survey Results
91
Appendix Table 38-A. Other ways that organizations can provide respondent with educational material and information Response Number Telephone 16Employment 4School/educational programs 4Family 3Library/books and magazines 2Word of mouth 2Authorities (police department/fire department visits) 1Church 1Community events 1Don’t want contact whatsoever 1Emergency calling trees 1In-service training 1Make kits for purchase 1Neighbors 1Not concerned (too old) 1Public utilities 1Radio 1Senior citizens 1Town meetings 1Volunteer activities 1Weather 1 Appendix Table 39. Additional comments Response Arial spraying and ground crop dusting is a concern Be prepared and abreast to what is happening; be prepared Beet plan emissions, smells are not heavily addressed, and the environment is not a high priority and should be Biggest concern is smoking in public places Check water and air more than they do Community does a very nice job Community mock drills Everybody should group together; shouldn’t dispose of junk in ditches; tourists should keep their stuff in possession General public looks too much to the media, they get too much misinformation; they should look more into getting prepared on their own Have people aware that they can’t keep wasting like they are; how wasteful we as Americans are…you can only spend your resources so many times…your children are the ones that will suffer I am a social worker; had West Nile last year I don’t think MN pollution control is doing enough about lakes and rivers; our land and water is not very clean; our local area has arsenic in wells; concern about size of feed lots; no effective monitoring for size of animal population per acre (overcrowding) I don’t think this country is any more prepared than it was 5 years ago I think we are more prepared than the federal government; the way they handled Katrina was awful I find the survey ridiculous; Most average people do not have knowledge about all these questions; don’t need to ask about transportation/industry fumes, hello, we live in western Minnesota I like to recycle, and it is available but it is very selective on what can be recycled, and it is very expensive; everything is a littler harder than it should be and it is not user friendly; the prices are high compared to other states (AZ for example)
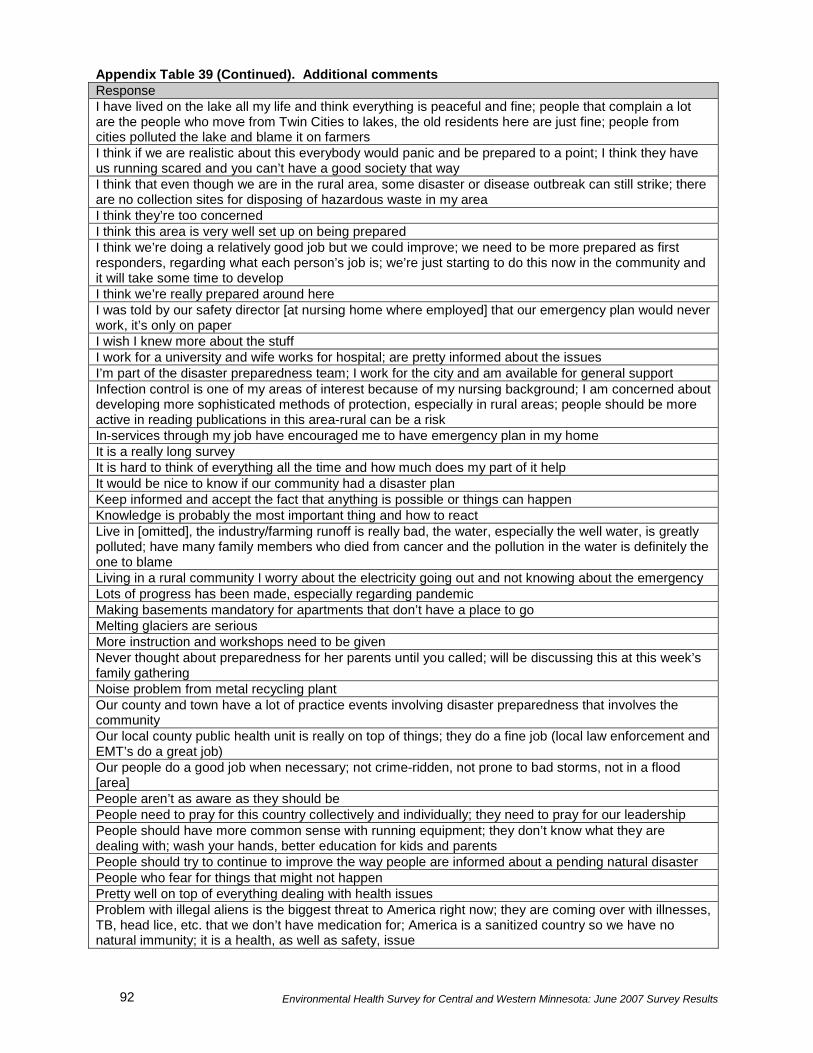
Environmental Health Survey for Central and Western Minnesota: June 2007 Survey Results 92
Appendix Table 39 (Continued). Additional comments Response I have lived on the lake all my life and think everything is peaceful and fine; people that complain a lot are the people who move from Twin Cities to lakes, the old residents here are just fine; people from cities polluted the lake and blame it on farmers I think if we are realistic about this everybody would panic and be prepared to a point; I think they have us running scared and you can’t have a good society that way I think that even though we are in the rural area, some disaster or disease outbreak can still strike; there are no collection sites for disposing of hazardous waste in my area I think they’re too concerned I think this area is very well set up on being prepared I think we’re doing a relatively good job but we could improve; we need to be more prepared as first responders, regarding what each person’s job is; we’re just starting to do this now in the community and it will take some time to develop I think we’re really prepared around here I was told by our safety director [at nursing home where employed] that our emergency plan would never work, it’s only on paper I wish I knew more about the stuff I work for a university and wife works for hospital; are pretty informed about the issues I’m part of the disaster preparedness team; I work for the city and am available for general support Infection control is one of my areas of interest because of my nursing background; I am concerned about developing more sophisticated methods of protection, especially in rural areas; people should be more active in reading publications in this area-rural can be a risk In-services through my job have encouraged me to have emergency plan in my home It is a really long survey It is hard to think of everything all the time and how much does my part of it help It would be nice to know if our community had a disaster plan Keep informed and accept the fact that anything is possible or things can happen Knowledge is probably the most important thing and how to react Live in [omitted], the industry/farming runoff is really bad, the water, especially the well water, is greatly polluted; have many family members who died from cancer and the pollution in the water is definitely the one to blame Living in a rural community I worry about the electricity going out and not knowing about the emergency Lots of progress has been made, especially regarding pandemic Making basements mandatory for apartments that don’t have a place to go Melting glaciers are serious More instruction and workshops need to be given Never thought about preparedness for her parents until you called; will be discussing this at this week’s family gathering Noise problem from metal recycling plant Our county and town have a lot of practice events involving disaster preparedness that involves the community Our local county public health unit is really on top of things; they do a fine job (local law enforcement and EMT’s do a great job) Our people do a good job when necessary; not crime-ridden, not prone to bad storms, not in a flood [area] People aren’t as aware as they should be People need to pray for this country collectively and individually; they need to pray for our leadership People should have more common sense with running equipment; they don’t know what they are dealing with; wash your hands, better education for kids and parents People should try to continue to improve the way people are informed about a pending natural disaster People who fear for things that might not happen Pretty well on top of everything dealing with health issues Problem with illegal aliens is the biggest threat to America right now; they are coming over with illnesses, TB, head lice, etc. that we don’t have medication for; America is a sanitized country so we have no natural immunity; it is a health, as well as safety, issue
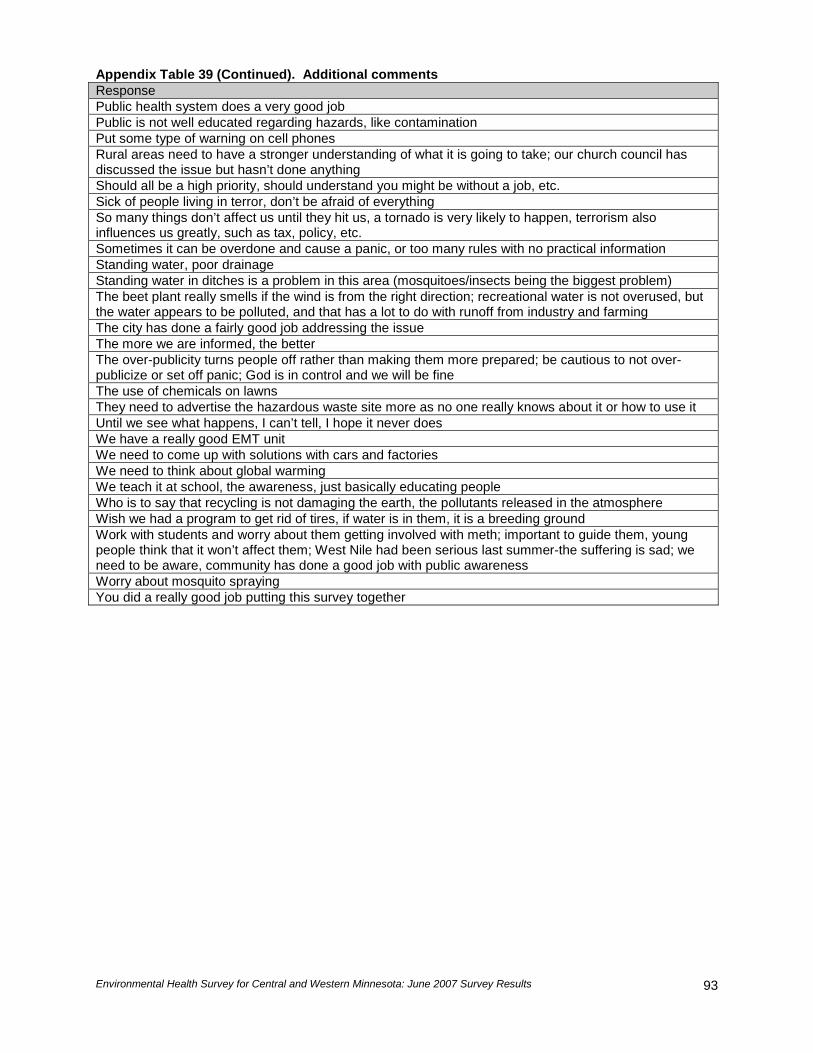
Environmental Health Survey for Central and Western Minnesota: June 2007 Survey Results
93
Appendix Table 39 (Continued). Additional comments Response Public health system does a very good job Public is not well educated regarding hazards, like contamination Put some type of warning on cell phones Rural areas need to have a stronger understanding of what it is going to take; our church council has discussed the issue but hasn’t done anything Should all be a high priority, should understand you might be without a job, etc. Sick of people living in terror, don’t be afraid of everything So many things don’t affect us until they hit us, a tornado is very likely to happen, terrorism also influences us greatly, such as tax, policy, etc. Sometimes it can be overdone and cause a panic, or too many rules with no practical information Standing water, poor drainage Standing water in ditches is a problem in this area (mosquitoes/insects being the biggest problem) The beet plant really smells if the wind is from the right direction; recreational water is not overused, but the water appears to be polluted, and that has a lot to do with runoff from industry and farming The city has done a fairly good job addressing the issue The more we are informed, the better The over-publicity turns people off rather than making them more prepared; be cautious to not over-publicize or set off panic; God is in control and we will be fine The use of chemicals on lawns They need to advertise the hazardous waste site more as no one really knows about it or how to use it Until we see what happens, I can’t tell, I hope it never does We have a really good EMT unit We need to come up with solutions with cars and factories We need to think about global warming We teach it at school, the awareness, just basically educating people Who is to say that recycling is not damaging the earth, the pollutants released in the atmosphere Wish we had a program to get rid of tires, if water is in them, it is a breeding ground Work with students and worry about them getting involved with meth; important to guide them, young people think that it won’t affect them; West Nile had been serious last summer-the suffering is sad; we need to be aware, community has done a good job with public awareness Worry about mosquito spraying You did a really good job putting this survey together

Environmental Health Survey for Central and Western Minnesota: June 2007 Survey Results 94
SURVEY INSTRUMENT
Environmental Health Survey for Central and Western Minnesota: June 2007 Survey Results 95
Eight-County Environmental Health Survey for Central and Western Minnesota Hello, my name is ____________ and I'm calling from the Center for Social Research at North Dakota State University on behalf of the health departments in an eight-county region in western Minnesota. We are conducting a research study to find out views about public health issues and emergency preparedness among residents in your area. Do you have a few minutes to answer some questions? The survey is voluntary and you may quit at any time. The information you provide will be combined with that of other residents in your area and your identity will be kept confidential. It should take about 15 minutes to complete the survey. If you have questions about the study, you may call Dr. Richard Rathge at 701-231-8621. If you have questions about the rights of human research participants or to report a problem, you may call the North Dakota State University Institutional Review Board at 701-231-8908. To begin, I'd like to ask you some questions that refer to environmental health. Environmental health is defined as environmental factors contributing to the human health of a community. The first series of questions will address OUTDOOR AIR QUALITY. Q1a. On a one to five scale, with one being "not a problem at all" and five being "a serious problem," how much of an environmental health problem are: Transportation emissions or exhaust 1. Not a problem at all 2. 3. 4. 5. A serious problem 6. [DNK/refused]
Q1aa. [If Q1a=4 or 5] How would you rank the level of priority in addressing: Transportation emissions or exhaust where one is "low priority," two is medium priority, and three is high priority? 1. Low priority 2. Medium priority 3. High priority 4. [DNK/refused]
Q1ab. [If Q1a=4 or 5] On a one to five scale, with one being "not at all" and five being "a great deal," have Transportation emissions or exhaust affected a household member's health, including your own? 1. Not at all 2. 3. 4. 5. A great deal 6. [DNK/refused]
Q1b. On a one to five scale, with one being "not a problem at all" and five being "a serious problem," how much of an environmental health problem are: Industry fumes 1. Not a problem at all 2. 3. 4. 5. A serious problem 6. [DNK/refused]
Q1ba. [If Q1b=4 or 5] How would you rank the level of priority in addressing: Industry fumes where one is "low priority," two is medium priority, and three is high priority? 1. Low priority 2. Medium priority 3. High priority 4. [DNK/refused] Q1bb. [If Q1b=4 or 5] On a one to five scale, with one being "not at all" and five being "a great deal," have Industry fumes affected a household member's health, including your own? 1. Not at all 2. 3. 4. 5. A great deal 6. [DNK/refused]
Environmental Health Survey for Central and Western Minnesota: June 2007 Survey Results 96
Q1c. On a one to five scale, with one being "not a problem at all" and five being "a serious problem," how much of an environmental health problem are: Stoves and fireplaces (use fuels including wood, corn, pellets) 1. Not a problem at all 2. 3. 4. 5. A serious problem 6. [DNK/refused]
Q1ca. [If Q1c=4 or 5] How would you rank the level of priority in addressing: Stoves and fireplaces (use fuels including wood, corn, pellets) where one is "low priority," two is medium priority, and three is high priority? 1. Low priority 2. Medium priority 3. High priority 4. [DNK/refused] Q1cb. [If Q1c=4 or 5] On a one to five scale, with one being "not at all" and five being "a great deal," have Stoves and fireplaces (use fuels including wood, corn, pellets) affected a household member's health, including your own? 1. Not at all 2. 3. 4. 5. A great deal 6. [DNK/refused]
Q1d. On a one to five scale, with one being "not a problem at all" and five being "a serious problem," how much of an environmental health problem are: Outdoor fire pits/campfires/fireplaces 1. Not a problem at all 2. 3. 4. 5. A serious problem 6. [DNK/refused]
Q1da. [If Q1d=4 or 5] How would you rank the level of priority in addressing: Outdoor fire pits/campfires/fireplaces where one is "low priority," two is medium priority, and three is high priority? 1. Low priority 2. Medium priority 3. High priority 4. [DNK/refused] Q1db. [If Q1d=4 or 5] On a one to five scale, with one being "not at all" and five being "a great deal," have Outdoor fire pits/campfires/fireplaces affected a household member's health, including your own? 1. Not at all 2. 3. 4. 5. A great deal 6. [DNK/refused]
Q1e. On a one to five scale, with one being "not a problem at all" and five being "a serious problem," how much of an environmental health problem is: Agricultural dust, burning 1. Not a problem at all 2. 3. 4. 5. A serious problem 6. [DNK/refused]
Q1ea. [If Q1e=4 or 5] How would you rank the level of priority in addressing: Agricultural dust, burning where one is "low priority," two is medium priority, and three is high priority? 1. Low priority 2. Medium priority 3. High priority 4. [DNK/refused] Q1eb. [If Q1e=4 or 5] On a one to five scale, with one being "not at all" and five being "a great deal," has Agricultural dust, burning affected a household member's health, including your own? 1. Not at all 2. 3. 4. 5. A great deal 6. [DNK/refused]

Environmental Health Survey for Central and Western Minnesota: June 2007 Survey Results 97
Q1f. On a one to five scale, with one being "not a problem at all" and five being "a serious problem," how much of an environmental health problem is: Livestock, feedlot odor 1. Not a problem at all 2. 3. 4. 5. A serious problem 6. [DNK/refused]
Q1fa. [If Q1f=4 or 5] How would you rank the level of priority in addressing: Livestock, feedlot odor where one is "low priority," two is medium priority, and three is high priority? 1. Low priority 2. Medium priority 3. High priority 4. [DNK/refused] Q1fb. [If Q1f=4 or 5] On a one to five scale, with one being "not at all" and five being "a great deal," has Livestock, feedlot odor affected a household member's health, including your own? 1. Not at all 2. 3. 4. 5. A great deal 6. [DNK/refused]
Q1g. On a one to five scale, with one being "not a problem at all" and five being "a serious problem," how much of an environmental health problem is: Lagoon odor 1. Not a problem at all 2. 3. 4. 5. A serious problem 6. [DNK/refused]
Q1ga. [If Q1g=4 or 5] How would you rank the level of priority in addressing: Lagoon odor where one is "low priority," two is medium priority, and three is high priority? 1. Low priority 2. Medium priority 3. High priority 4. [DNK/refused] Q1gb. [If Q1g=4 or 5] On a one to five scale, with one being "not at all" and five being "a great deal," has Lagoon odor affected a household member's health, including your own? 1. Not at all 2. 3. 4. 5. A great deal 6. [DNK/refused]
Now, I'd like to ask you a couple questions that address INDOOR AIR QUALITY and HOUSING ISSUES. Q2a. On a one to five scale, with one being "not a problem at all" and five being "a serious problem," how much of an environmental health problem is: Radon 1. Not a problem at all 2. 3. 4. 5. A serious problem 6. [DNK/refused]
Q2aa. [If Q2a=4 or 5] How would you rank the level of priority in addressing: Radon where one is "low priority," two is medium priority, and three is high priority? 1. Low priority 2. Medium priority 3. High priority 4. [DNK/refused] Q2ab. [If Q2a=4 or 5] On a one to five scale, with one being "not at all" and five being "a great deal," has Radon affected a household member's health, including your own? 1. Not at all 2. 3. 4. 5. A great deal 6. [DNK/refused]
Q2b. On a one to five scale, with one being "not a problem at all" and five being "a serious problem," how much of an environmental health problem is: Environmental tobacco smoke (secondhand smoke) 1. Not a problem at all 2. 3. 4. 5. A serious problem 6. [DNK/refused]
Environmental Health Survey for Central and Western Minnesota: June 2007 Survey Results 98
Q2ba. [If Q2b=4 or 5] How would you rank the level of priority in addressing: Environmental tobacco smoke (secondhand smoke) where one is "low priority," two is medium priority, and three is high priority? 1. Low priority 2. Medium priority 3. High priority 4. [DNK/refused] Q2bb. [If Q2b=4 or 5] On a one to five scale, with one being "not at all" and five being "a great deal," has Environmental tobacco smoke (secondhand smoke) affected a household member's health, including your own? 1. Not at all 2. 3. 4. 5. A great deal 6. [DNK/refused]
Q2c. On a one to five scale, with one being "not a problem at all" and five being "a serious problem," how much of an environmental health problem is: Asbestos 1. Not a problem at all 2. 3. 4. 5. A serious problem 6. [DNK/refused]
Q2ca. [If Q2c=4 or 5] How would you rank the level of priority in addressing: Asbestos where one is "low priority," two is medium priority, and three is high priority? 1. Low priority 2. Medium priority 3. High priority 4. [DNK/refused] Q2cb. [If Q2c=4 or 5] On a one to five scale, with one being "not at all" and five being "a great deal," has Asbestos affected a household member's health, including your own? 1. Not at all 2. 3. 4. 5. A great deal 6. [DNK/refused]
Q2d. On a one to five scale, with one being "not a problem at all" and five being "a serious problem," how much of an environmental health problem is: Mold 1. Not a problem at all 2. 3. 4. 5. A serious problem 6. [DNK/refused]
Q2da. [If Q2d=4 or 5] How would you rank the level of priority in addressing: Mold where one is "low priority," two is medium priority, and three is high priority? 1. Low priority 2. Medium priority 3. High priority 4. [DNK/refused] Q2db. [If Q2d=4 or 5] On a one to five scale, with one being "not at all" and five being "a great deal," has Mold affected a household member's health, including your own? 1. Not at all 2. 3. 4. 5. A great deal 6. [DNK/refused]
Q2e. On a one to five scale, with one being "not a problem at all" and five being "a serious problem," how much of an environmental health problem is: Carbon monoxide 1. Not a problem at all 2. 3. 4. 5. A serious problem 6. [DNK/refused]

Environmental Health Survey for Central and Western Minnesota: June 2007 Survey Results 99
Q2ea. [If Q2e=4 or 5] How would you rank the level of priority in addressing: Carbon monoxide where one is "low priority," two is medium priority, and three is high priority? 1. Low priority 2. Medium priority 3. High priority 4. [DNK/refused] Q2eb. [If Q2e=4 or 5] On a one to five scale, with one being "not at all" and five being "a great deal," has Carbon monoxide affected a household member's health, including your own? 1. Not at all 2. 3. 4. 5. A great deal 6. [DNK/refused]
Q2f. On a one to five scale, with one being "not a problem at all" and five being "a serious problem," how much of an environmental health problem is: Lead 1. Not a problem at all 2. 3. 4. 5. A serious problem 6. [DNK/refused]
Q2fa. [If Q2f=4 or 5] How would you rank the level of priority in addressing: Lead where one is "low priority," two is medium priority, and three is high priority? 1. Low priority 2. Medium priority 3. High priority 4. [DNK/refused] Q2fb. [If Q2f=4 or 5] On a one to five scale, with one being "not at all" and five being "a great deal," has Lead affected a household member's health, including your own? 1. Not at all 2. 3. 4. 5. A great deal 6. [DNK/refused]
Now, I'd like to ask you a series of questions that address PUBLIC HEALTH NUISANCES. Q3a. On a one to five scale, with one being "not a problem at all" and five being "a serious problem," how much of an environmental health problem are: Animals/rodents 1. Not a problem at all 2. 3. 4. 5. A serious problem 6. [DNK/refused]
Q3aa. [If Q3a=4 or 5] How would you rank the level of priority in addressing: Animals/rodents where one is "low priority," two is medium priority, and three is high priority? 1. Low priority 2. Medium priority 3. High priority 4. [DNK/refused] Q3ab. [If Q3a=4 or 5] On a one to five scale, with one being "not at all" and five being "a great deal," have Animals/rodents affected a household member's health, including your own? 1. Not at all 2. 3. 4. 5. A great deal 6. [DNK/refused]
Q3b. On a one to five scale, with one being "not a problem at all" and five being "a serious problem," how much of an environmental health problem are: Mosquitoes and other insects 1. Not a problem at all 2. 3. 4. 5. A serious problem 6. [DNK/refused]
Q3ba. [If Q3b=4 or 5] How would you rank the level of priority in addressing: Mosquitoes and other insects where one is "low priority," two is medium priority, and three is high priority? 1. Low priority 2. Medium priority 3. High priority 4. [DNK/refused]

Environmental Health Survey for Central and Western Minnesota: June 2007 Survey Results 100
Q3bb. [If Q3b=4 or 5] On a one to five scale, with one being "not at all" and five being "a great deal," have Mosquitoes and other insects affected a household member's health, including your own? 1. Not at all 2. 3. 4. 5. A great deal 6. [DNK/refused]
Q3c. On a one to five scale, with one being "not a problem at all" and five being "a serious problem," how much of an environmental health problem are: Meth labs 1. Not a problem at all 2. 3. 4. 5. A serious problem 6. [DNK/refused]
Q3ca. [If Q3c=4 or 5] How would you rank the level of priority in addressing: Meth labs where one is "low priority," two is medium priority, and three is high priority? 1. Low priority 2. Medium priority 3. High priority 4. [DNK/refused] Q3cb. [If Q3c=4 or 5] On a one to five scale, with one being "not at all" and five being "a great deal," have Meth labs affected a household member's health, including your own? 1. Not at all 2. 3. 4. 5. A great deal 6. [DNK/refused]
Q3d. On a one to five scale, with one being "not a problem at all" and five being "a serious problem," how much of an environmental health problem are: Garbage/junk houses 1. Not a problem at all 2. 3. 4. 5. A serious problem 6. [DNK/refused]
Q3da. [If Q3d=4 or 5] How would you rank the level of priority in addressing: Garbage/junk houses where one is "low priority," two is medium priority, and three is high priority? 1. Low priority 2. Medium priority 3. High priority 4. [DNK/refused] Q3db. [If Q3d=4 or 5] On a one to five scale, with one being "not at all" and five being "a great deal," have Garbage/junk houses affected a household member's health, including your own? 1. Not at all 2. 3. 4. 5. A great deal 6. [DNK/refused]
Q3e. On a one to five scale, with one being "not a problem at all" and five being "a serious problem," how much of an environmental health problem are: Illegal/open dumps 1. Not a problem at all 2. 3. 4. 5. A serious problem 6. [DNK/refused]
Q3ea. [If Q3e=4 or 5] How would you rank the level of priority in addressing: Illegal/open dumps where one is "low priority," two is medium priority, and three is high priority? 1. Low priority 2. Medium priority 3. High priority 4. [DNK/refused] Q3eb. [If Q3e=4 or 5] On a one to five scale, with one being "not at all" and five being "a great deal," have Illegal/open dumps affected a household member's health, including your own? 1. Not at all 2. 3. 4. 5. A great deal 6. [DNK/refused]

Environmental Health Survey for Central and Western Minnesota: June 2007 Survey Results 101
Q3f. On a one to five scale, with one being "not a problem at all" and five being "a serious problem," how much of an environmental health problem is: Improper disposal of hazardous waste 1. Not a problem at all 2. 3. 4. 5. A serious problem 6. [DNK/refused]
Q3fa. [If Q3f=4 or 5] How would you rank the level of priority in addressing: Improper disposal of hazardous waste where one is "low priority," two is medium priority, and three is high priority? 1. Low priority 2. Medium priority 3. High priority 4. [DNK/refused] Q3fb. [If Q3f=4 or 5] On a one to five scale, with one being "not at all" and five being "a great deal," has the Improper disposal of hazardous waste affected a household member's health, including your own? 1. Not at all 2. 3. 4. 5. A great deal 6. [DNK/refused]
Q4. Regarding household hazardous waste, does your community have a collection site for disposing of household hazardous waste, such as household chemicals, fluorescent light bulbs, batteries, paint, used motor oil, etc.? 1. Yes 2. No 3. [DNK]
Q4a. [If Q4=1] Are the hours convenient? 1. Yes 2. No 3. [DNK] Q4b. [If Q4=1] On a one to five scale, with one being "never" and five being "all of the time," how often do you dispose of your household hazardous waste at the collection site? 1. Never 2. 3. 4. 5. All of the time 6. [DNK/refused]
The next series of questions addresses RECREATIONAL WATER. Q5a. On a one to five scale, with one being "not a problem at all" and five being "a serious problem," how much of an environmental health problem are: Public pools and spas 1. Not a problem at all 2. 3. 4. 5. A serious problem 6. [DNK/refused]
Q5aa. [If Q5a=4 or 5] How would you rank the level of priority in addressing: Public pools and spas where one is "low priority," two is medium priority, and three is high priority? 1. Low priority 2. Medium priority 3. High priority 4. [DNK/refused] Q5ab. [If Q5a=4 or 5] On a one to five scale, with one being "not at all" and five being "a great deal," have Public pools and spas affected a household member's health, including your own? 1. Not at all 2. 3. 4. 5. A great deal 6. [DNK/refused]
Environmental Health Survey for Central and Western Minnesota: June 2007 Survey Results 102
Q5b. On a one to five scale, with one being "not a problem at all" and five being "a serious problem," how much of an environmental health problem are: Lakes and swimming beaches 1. Not a problem at all 2. 3. 4. 5. A serious problem 6. [DNK/refused]
Q5ba. [If Q5b=4 or 5] How would you rank the level of priority in addressing: Lakes and swimming beaches where one is "low priority," two is medium priority, and three is high priority? 1. Low priority 2. Medium priority 3. High priority 4. [DNK/refused] Q5bb. [If Q5b=4 or 5] On a one to five scale, with one being "not at all" and five being "a great deal," have Lakes and swimming beaches affected a household member's health, including your own? 1. Not at all 2. 3. 4. 5. A great deal 6. [DNK/refused]
Q5c. On a one to five scale, with one being "not a problem at all" and five being "a serious problem," how much of an environmental health problem is: Industry runoff 1. Not a problem at all 2. 3. 4. 5. A serious problem 6. [DNK/refused]
Q5ca. [If Q5c=4 or 5] How would you rank the level of priority in addressing: Industry runoff where one is "low priority," two is medium priority, and three is high priority? 1. Low priority 2. Medium priority 3. High priority 4. [DNK/refused] Q5cb. [If Q5c=4 or 5] On a one to five scale, with one being "not at all" and five being "a great deal," has Industry runoff affected a household member's health, including your own? 1. Not at all 2. 3. 4. 5. A great deal 6. [DNK/refused]
Q5d. On a one to five scale, with one being "not a problem at all" and five being "a serious problem," how much of an environmental health problem is: Agricultural runoff such as feedlots and pesticides 1. Not a problem at all 2. 3. 4. 5. A serious problem 6. [DNK/refused]
Q5da. [If Q5d=4 or 5] How would you rank the level of priority in addressing: Agricultural runoff such as feedlots and pesticides where one is "low priority," two is medium priority, and three is high priority? 1. Low priority 2. Medium priority 3. High priority 4. [DNK/refused] Q5db. [If Q5d=4 or 5] On a one to five scale, with one being "not at all" and five being "a great deal," has Agricultural runoff such as feed lots and pesticides affected a household member's health, including your own? 1. Not at all 2. 3. 4. 5. A great deal 6. [DNK/refused]

Environmental Health Survey for Central and Western Minnesota: June 2007 Survey Results 103
Q5e. On a one to five scale, with one being "not a problem at all" and five being "a serious problem," how much of an environmental health problem is: Overuse of recreational water by campers and boaters 1. Not a problem at all 2. 3. 4. 5. A serious problem 6. [DNK/refused]
Q5ea. [If Q5e=4 or 5] How would you rank the level of priority in addressing: Overuse of recreational water by campers and boaters where one is "low priority," two is medium priority, and three is high priority? 1. Low priority 2. Medium priority 3. High priority 4. [DNK/refused] Q5eb. [If Q5e=4 or 5] On a one to five scale, with one being "not at all" and five being "a great deal," has Overuse of recreational water by campers and boaters affected a household member's health, including your own? 1. Not at all 2. 3. 4. 5. A great deal 6. [DNK/refused]
Q5f. On a one to five scale, with one being "not a problem at all" and five being "a serious problem," how much of an environmental health problem is: Improper sewage disposal 1. Not a problem at all 2. 3. 4. 5. A serious problem 6. [DNK/refused]
Q5fa. [If Q5f=4 or 5] How would you rank the level of priority in addressing: Improper sewage disposal where one is "low priority," two is medium priority, and three is high priority? 1. Low priority 2. Medium priority 3. High priority 4. [DNK/refused] Q5fb. [If Q5f=4 or 5] On a one to five scale, with one being "not at all" and five being "a great deal," has Improper sewage disposal affected a household member's health, including your own? 1. Not at all 2. 3. 4. 5. A great deal 6. [DNK/refused]
Q5g. On a one to five scale, with one being "not a problem at all" and five being "a serious problem," how much of an environmental health problem is: Fertilizer runoff 1. Not a problem at all 2. 3. 4. 5. A serious problem 6. [DNK/refused]
Q5ga. [If Q5g=4 or 5] How would you rank the level of priority in addressing: Fertilizer runoff where one is "low priority," two is medium priority, and three is high priority? 1. Low priority 2. Medium priority 3. High priority 4. [DNK/refused] Q5gb. [If Q5g=4 or 5] On a one to five scale, with one being "not at all" and five being "a great deal," has Fertilizer runoff affected a household member's health, including your own? 1. Not at all 2. 3. 4. 5. A great deal 6. [DNK/refused]
The next series of questions dealing with environmental health problems addresses DRINKING WATER.
Environmental Health Survey for Central and Western Minnesota: June 2007 Survey Results 104
Q6a. On a one to five scale, with one being "not a problem at all" and five being "a serious problem," how much of an environmental health problem are: Abandoned wells that are not sealed 1. Not a problem at all 2. 3. 4. 5. A serious problem 6. [DNK/refused]
Q6aa. [If Q6a=4 or 5] How would you rank the level of priority in addressing: Abandoned wells that are not sealed where one is "low priority," two is medium priority, and three is high priority? 1. Low priority 2. Medium priority 3. High priority 4. [DNK/refused] Q6ab. [If Q6a=4 or 5] On a one to five scale, with one being "not at all" and five being "a great deal," have Abandoned wells that are not sealed affected a household member's health, including your own? 1. Not at all 2. 3. 4. 5. A great deal 6. [DNK/refused]
Q6b. On a one to five scale, with one being "not a problem at all" and five being "a serious problem," how much of an environmental health problem is: Contaminated PUBLIC drinking water 1. Not a problem at all 2. 3. 4. 5. A serious problem 6. [DNK/refused]
Q6ba. [If Q6b=4 or 5] How would you rank the level of priority in addressing: Contaminated PUBLIC drinking water where one is "low priority," two is medium priority, and three is high priority? 1. Low priority 2. Medium priority 3. High priority 4. [DNK/refused] Q6bb. [If Q6b=4 or 5] On a one to five scale, with one being "not at all" and five being "a great deal," has Contaminated PUBLIC drinking water affected a household member's health, including your own? 1. Not at all 2. 3. 4. 5. A great deal 6. [DNK/refused]
Q6c. On a one to five scale, with one being "not a problem at all" and five being "a serious problem," how much of an environmental health problem is: Contaminated PRIVATE drinking water 1. Not a problem at all 2. 3. 4. 5. A serious problem 6. [DNK/refused]
Q6ca. [If Q6c=4 or 5] How would you rank the level of priority in addressing: Contaminated PRIVATE drinking water where one is "low priority," two is medium priority, and three is high priority? 1. Low priority 2. Medium priority 3. High priority 4. [DNK/refused] Q6cb. [If Q6c=4 or 5] On a one to five scale, with one being "not at all" and five being "a great deal," has Contaminated PRIVATE drinking water affected a household member's health, including your own? 1. Not at all 2. 3. 4. 5. A great deal 6. [DNK/refused]
The last series of questions dealing with environmental health issues address FOOD PROTECTION.
Environmental Health Survey for Central and Western Minnesota: June 2007 Survey Results 105
Q7a. On a one to five scale, with one being "not addressed at all" and five being "very well addressed," to what degree are food health and safety standards addressed in the following areas: Food in restaurants and bars 1. Not addressed at all 2. 3. 4. 5. Very well addressed 6. [DNK/refused]
Q7aa. [If Q7a=1 or 2] How would you rank the level of priority in addressing: Food in restaurants and bars where one is "low priority," two is medium priority, and three is high priority? 1. Low priority 2. Medium priority 3. High priority 4. [DNK/refused] Q7ab. [If Q7a=1 or 2] On a one to five scale, with one being "not at all" and five being "a great deal," has any household member's health, including your own, been affected by poor health and safety standards regarding: Food in restaurants and bars 1. Not at all 2. 3. 4. 5. A great deal 6. [DNK/refused]
Q7b. On a one to five scale, with one being "not addressed at all" and five being "very well addressed," in your community, to what degree are food health and safety standards addressed in the following area: Food in grocery and convenience stores, delis, and meat markets 1. Not addressed at all 2. 3. 4. 5. Very well addressed 6. [DNK/refused]
Q7ba. [If Q7b=1 or 2] How would you rank the level of priority in addressing: Food in grocery and convenience stores, delis, and meat markets where one is "low priority," two is medium priority, and three is high priority? 1. Low priority 2. Medium priority 3. High priority 4. [DNK/refused] Q7bb. [If Q7b=1 or 2] On a one to five scale, with one being "not at all" and five being "a great deal," has any household member's health, including your own, been affected by poor health and safety standards regarding: Food in grocery and convenience stores, delis, and meat markets 1. Not at all 2. 3. 4. 5. A great deal 6. [DNK/refused]
Q7c. On a one to five scale, with one being "not addressed at all" and five being "very well addressed," in your community, to what degree are food health and safety standards addressed in the following area: Food prepared for and served at community events, such as potlucks and church dinners 1. Not addressed at all 2. 3. 4. 5. Very well addressed 6. [DNK/refused]
Q7ca. [If Q7c=1 or 2] How would you rank the level of priority in addressing: Food prepared for and served at community events, such as potlucks and church dinners where one is "low priority," two is medium priority, and three is high priority? 1. Low priority 2. Medium priority 3. High priority 4. [DNK/refused]

Environmental Health Survey for Central and Western Minnesota: June 2007 Survey Results 106
Q7cb. [If Q7c=1 or 2] On a one to five scale, with one being "not at all" and five being "a great deal," has any household member's health, including your own, been affected by poor health and safety standards regarding: Food prepared for and served at community events, such as potlucks and church dinners 1. Not at all 2. 3. 4. 5. A great deal 6. [DNK/refused]
Now we would like to know your opinions on the topic of EMERGENCY PREPAREDNESS in the event of a threatening emergency or disaster. [press any key to continue] Q8. On a one to five scale, with one being "not at all worried" and five being "very worried," how worried are you about...
--Household emergencies, such as fire, gas leaks, etc. --Natural disasters such as violent storms, tornadoes, winter ice storms, floods --Chemical spills --A disease outbreak, such as flu or a pandemic --Terrorism
1. Not at all worried 2. 3. 4. 5. Very worried 6. [DNK/refused] Q9. In the event of a threatening emergency or disaster, how would you be alerted to, or get information about, the emergency or disaster? [check all that apply, then click NEXT] Would you use or be alerted by:
--A battery-operated radio --Sirens --A TV --A Scanner --Word of mouth by neighbors --Other (Specify:_________________________________) --[Refused]
Q10. On a one to five scale, with one being "not at all confident" and five being "very confident," how confident are you that your community or area can respond to a large-scale disaster or emergency? 1. Not at all confident 2. 3. 4. 5. Very confident 6. [DNK/refused] Common emergency preparedness measures include the development of a family emergency plan that includes phone numbers of family contacts and important personal information, and emergency supplies of food and water for 3 days, clothing items, a battery-powered radio, medications and other important items. [press any key to continue] Q11. On a one to five scale, with one being "not at all prepared" and five being "very prepared," how prepared is your household for an emergency or disaster? 1. Not at all prepared 2. 3. 4. 5. Very prepared 6. [DNK/refused]
Q11a. [If Q11=1 or 2] On a one to five scale, with one being "not at all likely" and five being "very likely," how likely is your household to take necessary steps, within the next three months, to prepare for an emergency or disaster? 1. Not at all likely 2. 3. 4. 5. Very likely 6. [DNK/refused]
Environmental Health Survey for Central and Western Minnesota: June 2007 Survey Results 107
Q11b. [If Q11a=1 or 2] What are the barriers preventing you from taking the necessary steps in preparing for an emergency or disaster? [check all that apply, then click NEXT] You... --Do not think it is important --Don't know how to put an emergency plan and supplies together --Have not had time --Think it is too expensive --Other (Specify:_________________________________) --[Refused]
Q11c. [If Q11a=1 or 2] On a one to five scale, with one being "not at all likely" and five being "very likely," how likely are you to overcome the barriers to becoming prepared for an emergency or disaster? 1. Not at all likely 2. 3. 4. 5. Very likely 6. [DNK/refused]
Q12. On a one to five scale, with one being "not at all" and five being "a great deal," how much do the opinions of FAMILY MEMBERS or FRIENDS, influence your decision about emergency preparedness (for example, developing an emergency plan and supply kit)? 1. Not at all 2. 3. 4. 5. A great deal 6. [DNK/refused] Q13. On a one to five scale, with one being "not at all" and five being "a great deal," how much do the opinions of EMERGENCY PERSONNEL, such as fire, police, emergency medical services, influence your decision about emergency preparedness (for example, developing an emergency plan and supply kit)? 1. Not at all 2. 3. 4. 5. A great deal 6. [DNK/refused] Q14. On a one to five scale, with one being "not at all" and five being "a great deal," how much does information from THE MEDIA (newspapers, TV, radio, brochures, Internet, magazines, etc.,) influence your decision about emergency preparedness (for example, developing an emergency plan and supply kit)? 1. Not at all 2. 3. 4. 5. A great deal 6. [DNK/refused] Q15. On a one to five scale, with one being "not at all likely" and five being "very likely," what do you think is the likelihood an emergency or natural disaster will occur in your community? 1. Not at all 2. 3. 4. 5. A great deal 6. [DNK/refused] Just a few final questions so we can know more about who responded to the survey. [press any key to continue] Q16. Which category best describes your age? 1. Less than 21 years of age 2. 21 to 24 years of age 3. 25 to 34 years of age 4. 35 to 44 years of age 5. 45 to 54 years of age 6. 55 to 64 years of age
Environmental Health Survey for Central and Western Minnesota: June 2007 Survey Results 108
7. 65 years or older 8. [Refused] Q17. Which category best describes your current level of education? 1. Less than high school 2. High school graduate or GED 3. Some vocational/technical school, but no degree 4. Vocational/technical degree 5. Some college, but no degree 6. College degree 7. Graduate school or professional degree 8. [Refused] Q18. Which category best describes your annual household income before taxes? 1. Less than $20,000 2. $20,000 to $34,999 3. $35,000 to $49,999 4. $50,000 to $74,999 5. $75,000 to $99,999 6. $100,000 or more 7. [Refused] Q19. Do you live inside or outside city limits? 1. Inside city limits 2. Outside city limits 3. [DNK/refused] Q20. What is your household size? 1. One person 2. Two people 3. Three or more people 4. [DNK/refused] Q21. Are there children younger than 18 living in your home? 1. Yes 2. No 3. [DNK/refused] Q22. Finally, I will read a list of ways that information is delivered. Please tell me the best way an organization can provide you with educational materials and information about environmental health problems and disaster preparedness. [check all that apply, then click NEXT]
--Regular mail --TV --Radio --Local newspaper --Community events --Personal contact --Internet --Email --Other (Specify:_________________________________) --[Refused]
Q23. Are there any comments regarding environmental health issues or disaster preparedness you would like to add? [enter response, then click NEXT] [if nothing to add, click NEXT]
Environmental Health Survey for Central and Western Minnesota: June 2007 Survey Results 109
Thank you for helping us with this important study. Goodnight. Q24. Record gender based on voice. 1. Male 2. Female Q25. Record zip code based on call sheet:____________ Q26. Record county code based on call sheet. 1. Clay (27) 2. Douglas (41) 3. Grant (51) 4. Otter Tail (111) 5. Pope (121) 6. Stevens (149) 7. Traverse (155) 8. Wilkin (167)