environmental foundation of jamaica projects... · 2008-04-04 · environmental foundation of...
TRANSCRIPT

Environmental Foundation of Jamaica Project No. 05/06/010-PL480
Beach Erosion and Other Coastal Hazards: Ensuring Safety at the Community and Management Levels
BEACHES
Beach Erosion And Coastal Hazards: Ensuring Safety
PHASE TWO FINAL REPORT April, 2008
Prepared for the
Environmental Foundation of Jamaica
By:
The Marine Geology Unit
Department of Geography and Geology The University of the West Indies
Mona Campus Kingston 7 Jamaica
This report was prepared by Edward Robinson, Shakira A. Khan and Richard A. Coutou
i
TABLE OF CONTENTS
1 BACKGROUND ............................................................................................. 1
1.1 Project Objectives ................................................................................... 1
1.2 Project location and personnel ............................................................... 2
2 Implementation .............................................................................................. 3
3 Analysis of historical data .............................................................................. 5
4 Near-Shore Bathymetry ................................................................................. 5
5 Data Storage.................................................................................................. 1
6 COMMUNITY AWARENESS PROGRAMME ................................................ 1
6.1 St. Margaret’s Bay .................................................................................. 3
6.1.1 Physiography and Geology ............................................................. 3
6.1.1.1 Coastline morphology ............................................................... 3
6.1.2 Nearshore descriptions .................................................................... 7
6.1.3 Hazards ........................................................................................... 9
6.1.4 Community awareness programme ............................................... 11
6.2 Homers Cove ........................................................................................ 12
6.2.1 Physiography and Geology ........................................................... 12
6.2.1.1 Coastline morphology ............................................................. 13
6.2.2 Nearshore Description ................................................................... 16
6.2.3 Hazards ......................................................................................... 17
6.2.4 Community awareness programme ............................................... 19
6.3 Farquhar’s Beach ................................................................................. 20
6.3.1 Physiography and Geology ........................................................... 21
6.3.1.1 Coastline morphology ............................................................. 22
6.3.2 Nearshore description ................................................................... 27
6.3.3 Hazards ......................................................................................... 27
6.3.4 Community awareness programme ............................................... 28
6.4 Galina ................................................................................................... 29
6.4.1 Physiography and Geology ........................................................... 30
6.4.2 Nearshore area description ........................................................... 31
6.4.3 Hazards ......................................................................................... 33
6.4.4 Community awareness program .................................................... 34
6.5 Copacabana and Wickie Wackie .......................................................... 35
6.5.1 Physiography and Geology ........................................................... 36
6.5.1.1 Coastline morphology ............................................................. 37
6.5.2 Nearshore area description ........................................................... 40
6.5.3 Hazards ......................................................................................... 41
6.5.4 Community awareness programme ............................................... 44
7 BEACHES Workshop .................................................................................. 45
8 OTHER ACTIVITIES .................................................................................... 47
9 PUBLIC RELATIONS .................................................................................. 52
10 Problems and Distractions in Project Execution ....................................... 54
REFERENCES ................................................................................................... 55

ii
APPENDIX A.2 Table of Advisory committee members and meeting held for the period July 2006 to April 2007............................................................................. 57
APPENDIX B - Minutes & progress reports for the project; July 2006 to April 2007 .................................................................................................................... 58
11 ........................................................................................................................ 64 APPENDIX C ...................................................................................................... 68
Facsimile of materials produced for the community of St. Margaret’s Bay, Portland .............................................................................................................. 68
Appendix D ........................................................................................................ 70
Facsimile of materials produced for the community of Farquhar’s Beach, Clarendon ........................................................................................................... 70 Appendix E ........................................................................................................ 72
Facsimile of educational materials produced for the community of Galina, St. ... 72
Mary .................................................................................................................... 72
Appendix E.2 Brochure provided to community members, with the hazard map and guidelines for safe building practices suitable in this setting and tips on hurricane preparedness. ..................................................................................... 73 Appendix F ........................................................................................................ 74
Facsimile of materials produced for the community of Homers Cove and Little Bay, Westmoreland ............................................................................................. 74
Appendix G ........................................................................................................ 76
Appendix H .......................................................................................................... 1
Programme of Talks Pre4sneted at the workshop organised for the presentation of the findings of the BEACHES project and the hurricane dean impact assessment conducted island wide by various agencies. ..................................... 1
LIST OF FIGURES
Figure 1 Locations of nearshore bathymetric surveys conducted by the MGU ..... 1
Figure 2 Marine Geology Unit coastal hazard data base index (modified from the Shell Road Map 2007 edition) ............................................................................... 1
Figure 3 Coastal Communities assessed in Phase 2 of the B.E.A.C.H.E.S. project ................................................................................................................... 2
Figure 4 Graph of beach monitoring station, Profile 3, established by the Ken Jones Aero Drome, comparing the 12 month period, December 2006 to December 2007. ................................................................................................... 4
Figure 5 Graph of beach monitoring station, Profile 5, established east of the groynes in the center of the Bay and shows a comparison of the 12 month period, January 2006 and December 2006. .......................................................... 5
Figure 6 Graph of beach monitoring station, Profile 5, established December 2007. ..................................................................................................................... 6
Figure 7 Graph of beach monitoring station, Profile 9, established west of the mouth of the Rio Grande along the eastern side of the bay and showing a comparison of the 12 month period, December 2006 and December 2007. ......... 7

iii
Figure 8. Hazard map for St. Margaret’s Bay, Portland identifying critical facilities, areas below the 7 m contour which are susceptible to flooding and storm surge and near shore bathymetry of the bay. ................................................................. 8
Figure 9. Rear of a house, located along the eastern section of the bay which has been experiencing long term coastline retreat. Damage to this structure was caused by waves which now reach these buildings. ........................................... 10
Figure 10 Hazard Map prepared for the community of St. Margaret’s Bay. This map shows the style of map currently being produced, although the final map will use the same sheet lines defined in the IKONOS imagery index. ....................... 10
Figure 11. Residents attending the presentation made to the community of St. Margaret’s Bay during which the hazard map was presented and the various processes taking place in the bay and affecting the coast was explained. ......... 11
Figure 12. Limestone platform on which the community of Homers Cove, is situated ............................................................................................................... 13
Figure 13 Graph of the two profiles measured at the eastern end of Little Bay in May 2006 and December 2006 ........................................................................... 14
Figure 14 Graph of the two profiles measured in the center of Brighton Beach in May 2006 and December 2006 ........................................................................... 15
Figure 15. Graph of profile established on the Platform at Homers Cove showing the position of the debris ridge and elevation of the platform above sea level. WHERE IS THE EDGE OF THE PLATFORM? .................................................. 16
Figure 16. Nearshore bathymetric map of Homers Cove and Little Bay ............. 17
Figure 17 Map of Homers Cove and Little Bay, showing distribution of mapped storm/tsunami deposits (Red dots) and nearshore bathymetry. .......................... 18
Figure 18 Several boulders placed onshore by hurricane Ivan, one of them blocked the path from the house behind to the sea. HOW FAR FROM THE SEA? HOW BIG ARE THEY (MASS)?.......................................................................... 18
Figure 19 Site of a house destroyed by the boulder strew deposited by Hurricane Ivan. .................................................................................................................... 19
Figure 20. Hazard Map of Homers Cove and Little Bay ...................................... 20
Figure 21. Community meeting held to discuss the hazards affecting Homers Cove ................................................................................................................... 20
Figure 22 Farquhar’s Beach following the passage of Hurricane Ivan, September 2004. Photo: J. Tyndale-Biscoe Co. Ltd. ............................................................ 21
Figure 23 Position of mangrove stand and beach sediments between the Milk River and Farquhar’s Beach over the period 1941-2004. ................................... 22
Figure 24 Dead mangrove tree in the swash zone (left). Long shore drift (right) has resulted in progradation of the beach at the same location. ......................... 23
Figure 25 Changes in the seaward edge of the mangrove (dashed lines) and the position of the beach (solid lines) between 2002 & 2007 .................................... 24
Figure 26 Graph of beach monitoring station established at the western end of the beach and shows a comparison of the 10 month period, June 2006 and April 2007. ................................................................................................................... 25
Figure 27 Rapid recovery of the beach in front of the fishing village at Farquhars Beach over a two month period, note the position of the tree once in the foreshore (January) now in the newly formed berm (March). .............................. 26

iv
Figure 28 Graph showing rapid changes in beach width over a two week period between March 7th 2007 and March 22nd 2007 at Farquhars Beach. .................. 27
Figure 29 Hazard Map prepared for the community of Farquhar’s Beach .......... 28
Figure 30. Members of the community attending the presentation made by the Unit on hazards affecting Farquhar’s Beach and Milk River area. ...................... 29
Figure 31 Example of a boulder on platform at Galina ....................................... 30
Figure 32 Physiographic map of the Galina area, showing distribution of mapped storm/tsunami deposits and nearshore bathymetry. ........................................... 31
Figure 33 Topographic map of the Galina area, showing depth soundings recorded to complete the nearshore bathymetry in this area. ............................. 32
Figure 34 Completed bathymetry of the north coast shelf between Galina Point and Crab Woods. Isobaths at five meter intervals............................................... 32
Figure 35 Galina Hazard Map prepared for the Community ............................... 34
Figure 36 Residents from Galina and surrounding areas listening to Prof. E. Robinson explain the processes involved in boulder emplacement on the platform. .............................................................................................................. 35
Figure 37 Copacabana post hurricane Ivan, September, 2004. Photo: J. Tyndale-Biscoe Co. Ltd..................................................................................................... 36
Figure 38 Material is supplied to the beaches through a westerly long shore drift transporting sediment brought to the coast by the Chalky and Cane Rivers. ...... 37
Figure 39. Locations of Profiles established along the south east coast to monitor changes in beach shape and impact of storms on this section of the coastline. . 38
Figure 40. Summary graph of beach profiles measured at Copacabana illustrating changes occurring over the 9 month period between June 2006 and March 2007. ........................................................................................................ 39
Figure 41 Summary Graph of the transect at Wickie Wackie monitored in Phase Two of the Project illustrating changes over the 10 month period between November 2006 and August 2007. ..................................................................... 40
Figure 42 Bathymetric map of the shelf south of Caribbean Terrace east to Wickie Wackie..................................................................................................... 41
Figure 43 Bathymetric map of the area east of the Palisadoes ........................... 41
Figure 44. Pond overflowed flooding adjacent street after heavy rain blocking access to these homes, Wickie Wackie, October 2005. ..................................... 42
Figure 45 Example of the damage caused by storm surge generated by Hurricane Ivan striped sediment from beach exposing beach rock (right) and undermining foundations of homes (Photo taken at Copacabana, September 2004) ................................................................................................................... 43
Figure 46 Hazard map of the Caribbean terrace to Wickie Wackie area identifying areas that are prone to coastal flooding and erosion. ......................................... 44
Figure 47. A resident of the community viewing the poster with the hazard map of the area with explanations and illustrations of the impact that these hazards have on the community. ............................................................................................... 45
Figure 48 Buried tsunami layer identified behind the beach at Iter Boreal, St. Mary .................................................................................................................... 47

v
Figure 49 Coring for buried tsunami and/ or storm deposits in the swamps behind the beach at Iter Boreale (left). Core showing sediment layers within the swamp (right) .................................................................................................................. 48
Figure 50 Core showing sand layers between two peat layers from mangroves in St. Elizabeth ........................................................................................................ 49
Figure 51 Member of the USGS team examining a cross section of the debris ridge on the limestone platform at Galina St. Mary ............................................. 50
Figure 52 Storm ridge and boulder deposits at Homers Cove, Westmoreland ... 51
Figure 53 Map showing Boulder locations, Debris ridge and area prone to storm surge at Galina St. Mary ..................................................................................... 52

1
1 BACKGROUND
This report covers the activities conducted under the EFJ project 05/06/010-
PL480, Beach Erosion And Other Coastal Hazards: Ensuring safety at the
Community and Management Levels up to the close of the project in January
2008.. This was an extension of a two year project 03/09/431-PL480 Evaluation
of Coastline Changes and Hazards in Jamaica to Improve Hazard Reduction
Strategies for Coastal Communities funded by the Environmental Foundation of
Jamaica (Rowe & Robinson, 2005; Robinson et al. 2006a). The acronym
B.E.A.C.H.E.S. (Beach Erosion And Coastal Hazards: Ensuring Safety) was
adopted for the first phase of the project and has been extended for this phase.
The wextended project incorporated investigations into the hazards affecting
coastal communities that are not only situated on beaches but also included
communities on cliffs that are at risk from severe storms and/or tsunamis. The
objectives of the project are outlined below. The impacts of Hurricanes Ivan
(September 2004), Dennis and Emily (July 2005) and the passage of hurricanes
Dean and Felix in August and September 2007 necessitated additional, EFJ-
funded field work to examine the after-effects of these storms, delaying some
aspects of the community awareness and hazard map completion parts of the
programme.
1.1 Project Objectives
The BEACHES project was designed to address and provide improved measures
of hazard susceptibility related to coastal erosion and the effects of storm
induced hazards which increasingly affect Jamaica’s coastline at both the
community and management levels. Through this project a comprehensive
database, housing current and historical data mainly in the form of aerial survey
photographs, maps and reports for the Jamaican coastline was developed. This
data was used to provide quantitative data on the rates of erosion along selected

2
stretches of the coast as well as the extent to which storm waves impact the
coastline.
The main objectives of the second phase of the project were:
1) To identify hazards affecting communities located on cliffed coastlines.
2) To analyze and review all the data processed over the three year
programme to provide information on past and projected erosion rates on
specific stretches of the coastline.
3) To extend mapping of coastal hazards to those affecting cliffed coastlines
4) To analyse existing high resolution coastal bathymetric survey data and
initiate bathymetric profiling for areas where such information is lacking,
primarily along coastlines adjacent to the communities.
5) To complete the community programmes initiated in phase one of the
project and extend the community based programme to include 2
communities located on cliffed coast lines.
1.2 Project location and personnel
The project has been managed and implemented by the Marine Geology Unit
(MGU) of the Department of Geography & Geology (DOGG), UWI Mona
Campus. Project staffing is as follows:

3
Project Coordinator: Mr. Rafi Ahmad, Director of the Unit for Disaster
Studies (UDS), Department of Geography & Geology, UWI, responsible
for overall coordination of the project’s activities. Mr. Ahmad also chaired
the Project Advisory Committee.
Project Manager: Professor Emeritus Edward Robinson, Head of the
Unit, managed the project.
Project Officer: Miss Deborah-Ann C. Rowe, Research Associate, Marine
Geology Unit was Project Officer from May 2006 until September 2006.
This position was subsequently filled by Miss Shakira A. Khan Research
Associate, Marine Geology Unit, (September 2006 - Current). The Project
Officer was responsible for carrying out the day-to-day activities of the
project, comprising the coastline change study and the community
awareness programme.
Part-time Assistance: Additional, part-time assistance has been
provided, at different times through the project, by Mr. Richard Coutou,
Miss Kadean Mitchell and Mr. Kareem John.
The Project Advisory Committee (Appendix A) met quarterly and reviewed the
project’s progress (Appendix B) and provided guidance and recommendations,
where necessary, to improve procedures in identifying and analyzing the hazards
affecting the coast.
2 Methodologies
Phase two of the B.E.A.C.H.E.S. project followed on the methodologies
established in the first two years of activities (Robinson et al., 2006). The
following activities were carried out to establish the nature of the seafloor

4
topography, and the source, distribution and movement of onshore and offshore
sediments in the neighbourhood of the affected beaches:
Beach profiling: This was carried out to establish the nature of the beaches in
different parts of the study localities and to determine the changes in topography
over the one-year study period. Most of the profiles were at locations previously
erected. The surveys were carried out using two levels, a Hilger Watts SL10-1
and a Topcon AT-FZ automatic level, and metric survey staffs. In each case the
level was set up at a position which enabled leveling to be effected for the whole
profile without the level station having to be moved. Readings of angle and
distance to the staff were taken at slope changes along each profile, and a note
of sediment characteristics was made at each staff position, frequently supported
by photography. Profiles were measured from the reference point into the sea up
to a maximum depth of about one metre. On most occasions it was not possible
to extend the line into deeper water, or even to a one metre depth, because of
the frequently rough sea conditions.
The plots of all the profiles are contained in Appendix B2, together with the
tabular survey data. Initially the reference point for each profile was marked by a
metal peg buried in the sand. However, difficulties arose in relocating the pegs,
and in some instances the pegs had been removed. These factors are described
for each profile as necessary. Alternative permanent objects were substituted for
the pegs.
Beach Inspection: Beach inspections were carried out to observe and record
changes in the beach profile and sediment composition.
Bathymetry: The surveys were carried out at additional localities as described
below in order to determine the geometry of the island shelf and uppermost
slope.

5
3 Implementation
The communities that participated in the programme were, in chronological order,
St. Margaret’s Bay, Portland; Homers Cove, Westmoreland; Farquhars Beach,
Clarendon; Galina, St. Mary and Copacabana/ Wickie Wackie, St. Andrew. The
results of the community interactions were summarised at a workshop to which
interested stakeholders from government and non-profit organisations were
invited.
The community work was supported by the acquisition and analysis of various
types of data on the coastline and immediate offshore region. These included
continuing analysis of historical information, the mapping of coastal features, the
acquisition and compilation of near-shore bathymetry up to the edge of the island
shelf and the up-dating of the MGU’s database.
4 Analysis of historical data
A list of aerial photographs and satellite imagery available to the MGU was
contained in the Final Report on Phase one of the BEACHES project (Robinson,
Rowe & Khan, 2006). These along with reports of storm and hurricane damage
were used to assess the impacts of storm waves and tsunami on sections of our
coastline. Some gaps in the imagery were filled during the present programme.
5 Near-Shore Bathymetry
Bathymetric profiling by the MGU was conducted to gather data on the
morphology of the submarine shelf at five of the locations associated with the
communities studied, three on the north coast and two on the south coast (Figure
1). This exercise was carried out by members of the Unit with assistance of local
fishermen in these communities who are familiar with the off shore area. Their
6
expertise provided information on reef locations and extent as well as description
of sediment cover in the areas. The width and gradient of the shelf was
determined and bathymetric maps produced. This information is discussed below
in relation to each community.

1
Figure 1 Locations of nearshore bathymetric surveys conducted by the MGU

1
6 Data Storage
The database developed in Phase one, allowing for immediate retrieval of data
related to a particular area, has continued to grow as new maps, field data,
satellite and aerial imagery have been added to the system. A new cataloguing
system has been designed and the original index has also been improved upon,
utilizing a more up to date map of the island allowing for easier identification of
sites (Figure 2). However, the goal of creating an interactive “clickable” interface
has not yet been achieved, partly due to budgetary constrains in obtaining a
computer program to execute this. Until such a programme becomes available a
database catalogue using Microsoft Access, together with a nested folder and file
system has been developed for identification and retrieval of files.
Figure 2 Marine Geology Unit coastal hazard data base index (modified from the Shell Road Map 2007
edition)
7 COMMUNITY AWARENESS PROGRAMME
The community hazard awareness programme carried out in Phase Two was
designed to be site specific in addressing hazards affecting the coastline. The
aim was to improve the communities understanding of the hazards that impact

2
them and provide options for hazard mitigation at the community level. This
aspect of the project focused on five sites (Figure 3)5), two are cliffed
communities located on elevated limestone terraces and three are communities
associated with beaches in low lying areas.
Meetings were organised with the assistance of local community leaders and
invitations made verbally and with the assistance of printed announcements
distributed to the residents, parish representatives of NEPA and parish disaster
co-ordinators. Meetings were held in the communities, typically at schools which
normally also serve as the ODPEM emergency shelters or community centres.
Visual presentations were made with the use of Power point slide shows via
multimedia projectors as well as through posters and pamphlets distributed to
residents and deposited in schools and libraries in the area. The site-specific
brochures were handed out with the hazard maps and explanations of the terms
used. Large posters (36”x36”) were also provided to community groups, schools,
government agencies (e.g. ODPEM parish representatives and disaster
coordinators and NEPA parish representatives).
Figure 3 Coastal Communities assessed in Phase 2 of the B.E.A.C.H.E.S. project
3
7.1 St. Margaret’s Bay
The community of St. Margaret’s Bay is situated along a low-lying, embayed
coastline immediately west of the mouth of the Rio Grande in Portland Parish.
Housing is strung out on both sides of the main north coast road. The Unit has
been conducting beach monitoring and coastal hazard identification in the
community of St. Margaret’s Bay since 2004. The community was included in this
study as a follow-up to a preliminary appraisal of beach erosion affecting
housing, which was carried out by the MGU for NEPA and USAID (Robinson et
al. 2003; Rowe et al. 2003).
7.1.1 Physiography and Geology
The western end of St. Margaret’s Bay, in front of the Ken Jones Aerodrome,
consists of a sand and gravel beach backed by dunes, which varies annually
between 30-50 meters wide. The beach becomes narrower in the central and
eastern sections of the bay. The central section of the coastline is fronted by a
narrow low-lying beach, consisting largely unconsolidated sands and gravels,
backed by steeply sloping hills. At the eastern end of the bay adjacent to the
mouth of the Rio Grande the beach is of variable width (8-20 metres), and this
area is backed by the estuary of the Rio Grande.
7.1.1.1 Coastline morphology
In Phase Two of the project three profiles were maintained to continue monitoring
and assessment of beach changes and coastline position at St. Margaret’s Bay.
These profiles were to be monitored at six month intervals from June 2006 to
December 2007 however two attempts to survey the profiles in June 2007 were
hampered by bad weather and had to be abandoned. The ID numbers of the
profiles have been retained from the previous surveys.
4
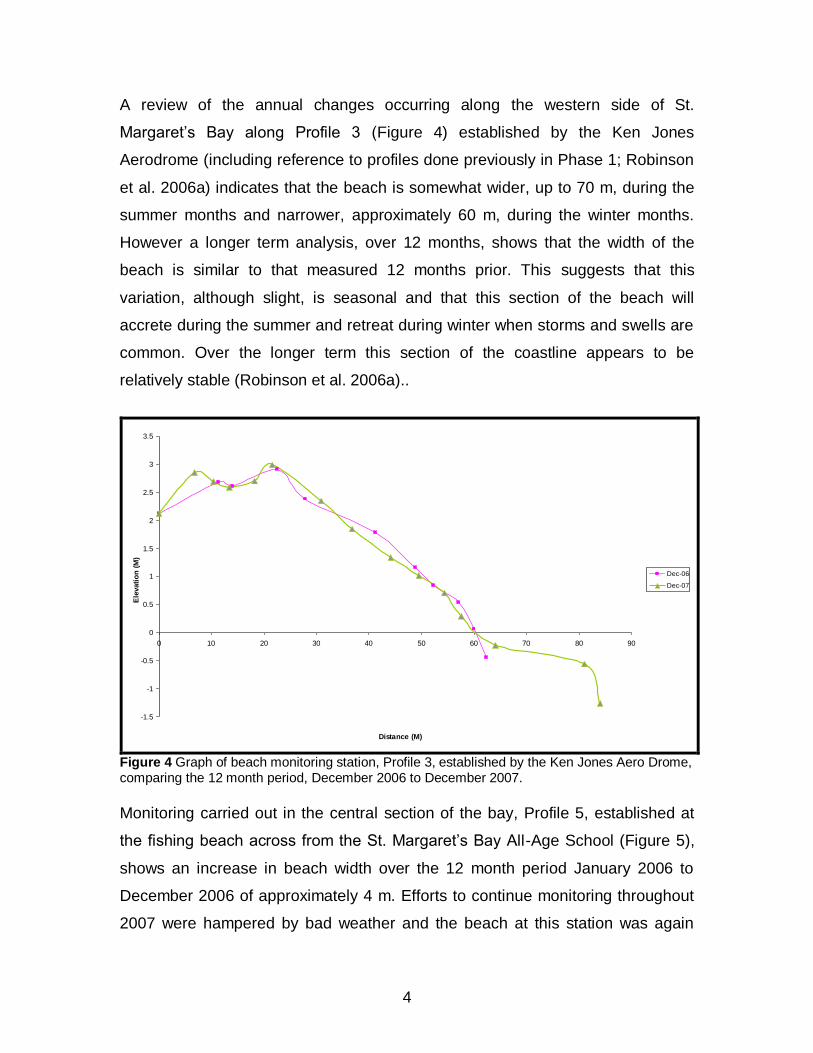
A review of the annual changes occurring along the western side of St.
Margaret’s Bay along Profile 3 (Figure 4) established by the Ken Jones
Aerodrome (including reference to profiles done previously in Phase 1; Robinson
et al. 2006a) indicates that the beach is somewhat wider, up to 70 m, during the
summer months and narrower, approximately 60 m, during the winter months.
However a longer term analysis, over 12 months, shows that the width of the
beach is similar to that measured 12 months prior. This suggests that this
variation, although slight, is seasonal and that this section of the beach will
accrete during the summer and retreat during winter when storms and swells are
common. Over the longer term this section of the coastline appears to be
relatively stable (Robinson et al. 2006a)..
-1.5
-1
-0.5
0
0.5
1
1.5
2
2.5
3
3.5
0 10 20 30 40 50 60 70 80 90
Distance (M)
Ele
vati
on
(M
)
Dec-06
Dec-07
Figure 4 Graph of beach monitoring station, Profile 3, established by the Ken Jones Aero Drome, comparing the 12 month period, December 2006 to December 2007.
Monitoring carried out in the central section of the bay, Profile 5, established at
the fishing beach across from the St. Margaret’s Bay All-Age School (Figure 5),
shows an increase in beach width over the 12 month period January 2006 to
December 2006 of approximately 4 m. Efforts to continue monitoring throughout
2007 were hampered by bad weather and the beach at this station was again
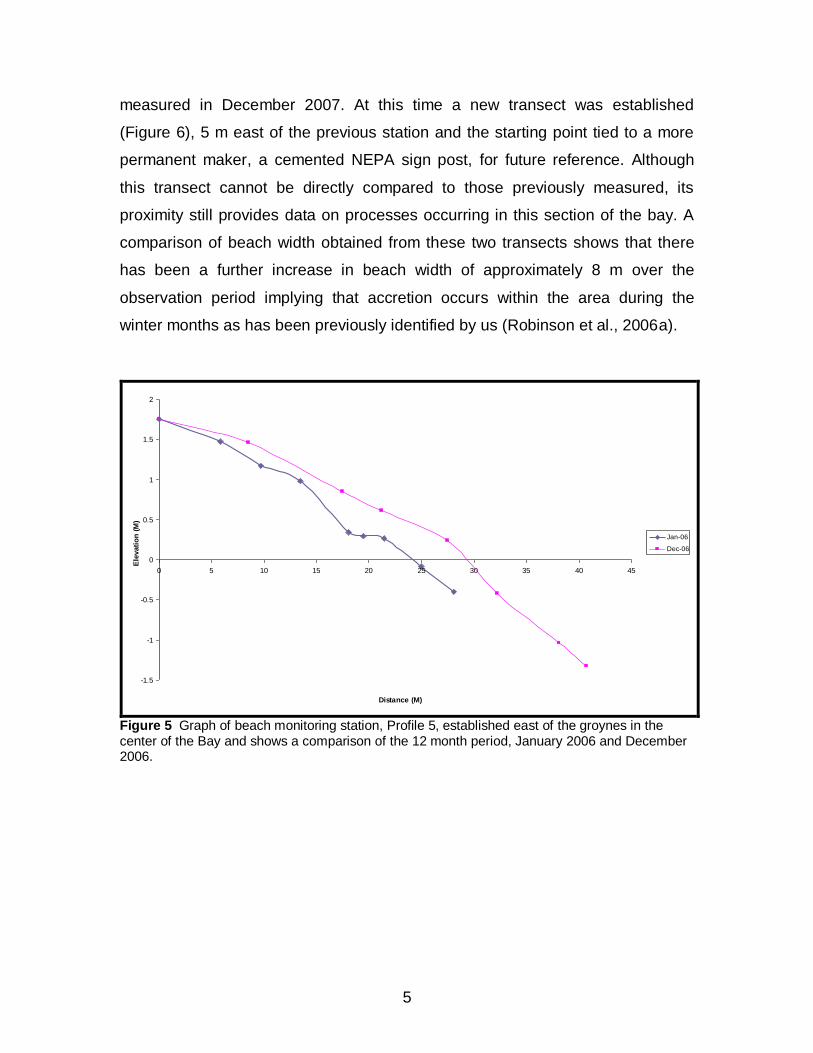
5
measured in December 2007. At this time a new transect was established
(Figure 6), 5 m east of the previous station and the starting point tied to a more
permanent maker, a cemented NEPA sign post, for future reference. Although
this transect cannot be directly compared to those previously measured, its
proximity still provides data on processes occurring in this section of the bay. A
comparison of beach width obtained from these two transects shows that there
has been a further increase in beach width of approximately 8 m over the
observation period implying that accretion occurs within the area during the
winter months as has been previously identified by us (Robinson et al., 2006a).
-1.5
-1
-0.5
0
0.5
1
1.5
2
0 5 10 15 20 25 30 35 40 45
Distance (M)
Ele
vati
on
(M
)
Jan-06
Dec-06
Figure 5 Graph of beach monitoring station, Profile 5, established east of the groynes in the center of the Bay and shows a comparison of the 12 month period, January 2006 and December 2006.

6
-100
-50
0
50
100
150
200
250
0 10 20 30 40 50 60 70 80
Distance (m)
Ele
va
tio
n (
cm
)
Dec-07
Figure 6 Graph of beach monitoring station, Profile 5, established December 2007.
The third transect monitored (Profile 9) is located at the eastern side of the bay,
just west of the mouth of the Rio Grande River. Monitoring of this section of the
bay has shown that it has experienced long term erosion. Initial measurements in
July 2005 show that the beach extended approximately 35 m from the top of the
beach face to the base of the foreshore. Over the last two years the beach has
decreased in width by almost 10 m with almost no seasonal variation observed.
In the last year alone the beach has retreated by 2 m (Figure 7) threatening
property located along this stretch.

7
-1
-0.5
0
0.5
1
1.5
0 5 10 15 20 25 30 35 40
Distance (M)
Ele
va
tio
n (
M)
Dec-06
Dec-07
Figure 7 Graph of beach monitoring station, Profile 9, established west of the mouth of the Rio Grande along the eastern side of the bay and showing a comparison of the 12 month period, December 2006 and December 2007.
7.1.2 Nearshore descriptions
The island shelf is relatively narrow in this region, less than 1 km wide in places
and slopes gently offshore to about 13 m depth then steepens sharply defining
the shelf edge at a depth of approximately 10-20 m. To seaward the sea floor
steepens sharply to depths in excess of 1000 m.
Sediment both onshore and on the sea floor is terriginous in origin and forms
clastic beaches consisting of coarse sand mixed with cobble and/or pebble sized
clasts. Evidence from carbonate producing organisms on the beach suggests
that they exist in the offshore area however they do not produce sufficient
material to be considered important sediment producers at this site.

8
Figure 8. Hazard map for St. Margaret’s Bay, Portland identifying critical facilities, areas below the 7 m contour which are susceptible to flooding and storm surge and near shore bathymetry of the bay (slightly modified from the original map illustrated in the Phase 1 report (Robinson et al. 2006)..

9
7.1.3 Hazards
The study focused on the 4 km stretch of coastline extending from Downer’s Bluff
west to Welsh Woman’s Point (Figure 10). The section of the beach from the
centre of the town east towards the Rio Grande is of the most concern. The
beach erosion, flooding and storm surge documented in these areas affects the
road and houses behind the beach which are sited on a thin strip of land between
the beach and a small morass. The land itself is made up of semi-consolidated
sand and gravel, evidently an old bar formed from sediments provided by the Rio
Grande, which would initially have enclosed a lagoon, now in-filled as the
morass.
Of critical concern is the threat to structures seaward of the main road, west of
the Rio Grande, some of which have already had to be abandoned due to
damage by waves (Figure 9).
10
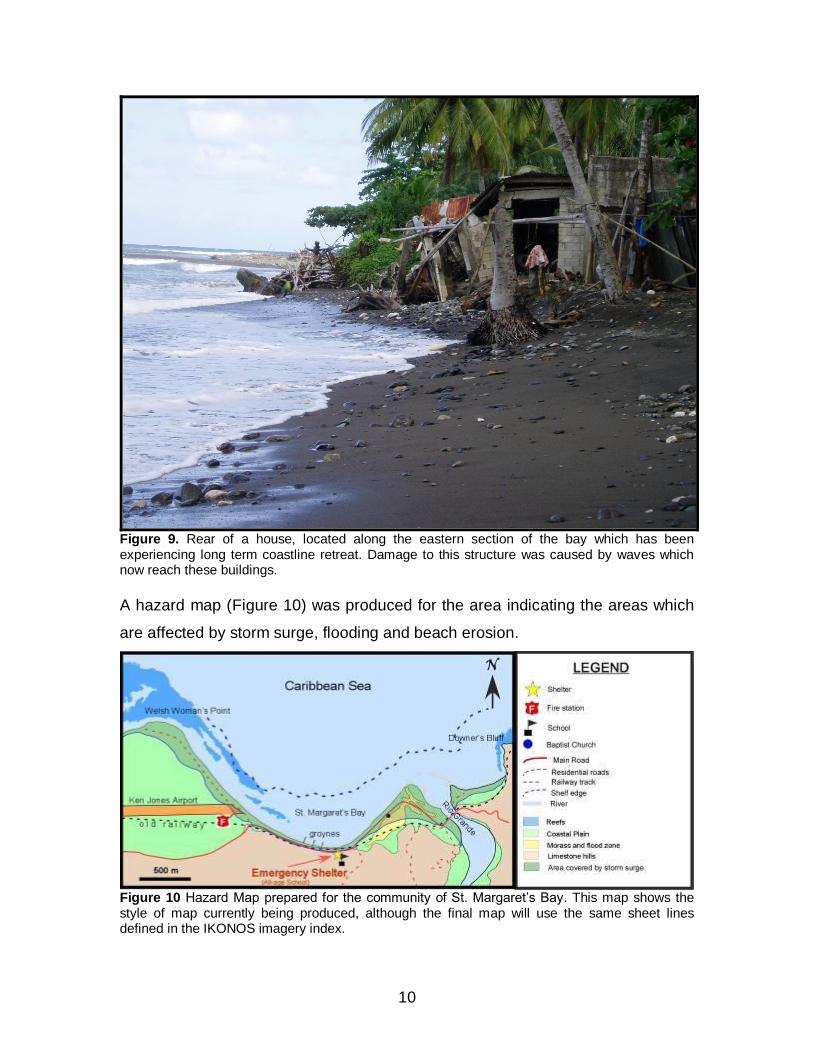
Figure 9. Rear of a house, located along the eastern section of the bay which has been experiencing long term coastline retreat. Damage to this structure was caused by waves which now reach these buildings.
A hazard map (Figure 10) was produced for the area indicating the areas which
are affected by storm surge, flooding and beach erosion.
Figure 10 Hazard Map prepared for the community of St. Margaret’s Bay. This map shows the style of map currently being produced, although the final map will use the same sheet lines defined in the IKONOS imagery index.

11
7.1.4 Community awareness programme
Presentations were made to the community through organised meetings to
gather information from residents on the impacts of hazards in the community as
well as to disseminate findings of the project during the first phase. A meeting to
disseminate educational material, coordinated with the assistance of community
leaders and the NEPA Portland parish office, was held on 8th November 2006
(Figure 11) at Olive’s School. The community was presented with hazard maps
and brochures outlining the types of coastal hazards to which the community is
vulnerable. These meetings were used to discuss the impacts of the various
hazards identified that affect the community and inform residents of the physical
processes taking place and what measures can be taken to reduce their
vulnerability. The interaction with the community has led to increased awareness
and improved understanding of the hazards in the area (Appendix C).
Figure 11. Residents attending the presentation made to the community of St. Margaret’s Bay during which the hazard map was presented and the various processes taking place in the bay and affecting the coast was explained.

12
7.2 Homers Cove
This is one of two cliffed communities included in phase two of the project that
have been damaged by past storms and/or hurricanes. Reports of the extensive
damage to housing in the area were made in the media. The community of
Homers Cove is a small fishing village which has developed around a small
embayment within the limestone terraces which extends from the Negril Light
House in the west to Salmon Point in the east. The quiet, rustic setting of the
community also appeals to tourists looking to escape and there are several small
hotels/boarding houses in the area.
7.2.1 Physiography and Geology
The community is situated on a wide, raised Late Pleistocene limestone platform,
terminated seawards by a cliff that varies in height from sea level up to 5 metres
in some places (Figure 12). The community is spread over the limestone terrace
which is relatively flat at the seaward edge of the platform and backed in several
places by vegetated ridges, averaging some 50 m from the shore.
13
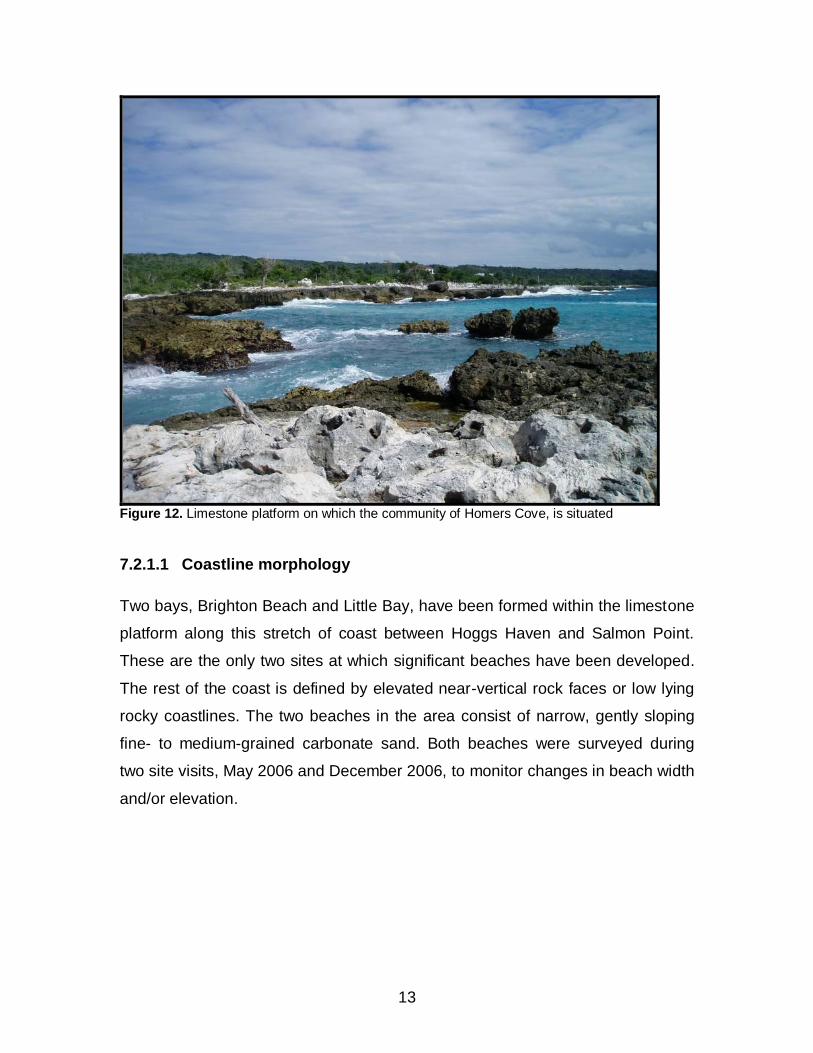
Figure 12. Limestone platform on which the community of Homers Cove, is situated
7.2.1.1 Coastline morphology
Two bays, Brighton Beach and Little Bay, have been formed within the limestone
platform along this stretch of coast between Hoggs Haven and Salmon Point.
These are the only two sites at which significant beaches have been developed.
The rest of the coast is defined by elevated near-vertical rock faces or low lying
rocky coastlines. The two beaches in the area consist of narrow, gently sloping
fine- to medium-grained carbonate sand. Both beaches were surveyed during
two site visits, May 2006 and December 2006, to monitor changes in beach width
and/or elevation.

14
Little Bay Profile 1
-100
-50
0
50
100
150
200
250
0 5 10 15 20 25 30 35
Distance (m)
Ele
va
tio
n (
cm
)
6-May
6-Dec
Figure 13 Graph of the two profiles measured at the eastern end of Little Bay in May 2006 and December 2006
At Little Bay the beach, measured from the limestone hill at the back of the
beach, is approximately 25 m in width and slopes up to approximately 2 m ASL
(Figure 13). Very little change was observed across the profile with beach width
remaining constant and a reduction in the elevation of the foreshore of only 1 cm.
Apparent differences in elevation of approximately 20 cm (Figure 13) within the
first 5 m of this transect, are due to variation in the position of the measuring staff
on the dirt road behind the beach. Although residents report erosion of this beach
this was not observed over the six month period of observation and may have
been due to a past event or it occurs over a longer period.

15
Brighton Beach Profile 2
-50
0
50
100
150
200
0 5 10 15 20 25 30 35 40 45
Distance (m)
Ele
va
tio
n (
cm
)
May-06
Dec-06
Figure 14 Graph of the two profiles measured in the centre of Brighton Beach in May 2006 and December 2006
Brighton Beach, measured from the base of the limestone hill at the back
of the beach, has an average width of 34 m and is approximately 1.9 m ASL
(Figure 14). A reduction in beach width of 2 m and a general reduction in the
elevation of the foreshore by approximately 20 cm were observed between May
and December 2006 (Figure 14). Generally the beach showed very little change
and appears to be stable.

16
0
100
200
300
400
500
600
700
800
0102030405060
Distance (m)
Ele
vati
on
(cm
)
Figure 15. Graph of profile established on the Platform at Homers Cove measured from the edge of the platform (right) showing the position of the debris ridge and elevation of the platform above sea level.
A transect was also established over the platform west of Brighton Beach (N
18.22318° W 78.28563°) to determine elevation and position of the debris ridge
(Figure 15). It shows that the debris ridge at this point has developed
approximately 40 m from the platform edge which is 4 m ASL.
7.2.2 Nearshore Description
Bathymetric surveys were carried out by the Unit in May 2006 with the assistance
of (Mr. Ceylon Clayton) a fisherman from the community. The island shelf at this
site is relatively shallow; the depth at the shelf edge is about 20m and the shelf is
approximately 300 – 400 m wide and covered by carbonate sediments. Although
reefs are developed along this shelf the reef crest seldom breaks the sea surface
(Figure 16).
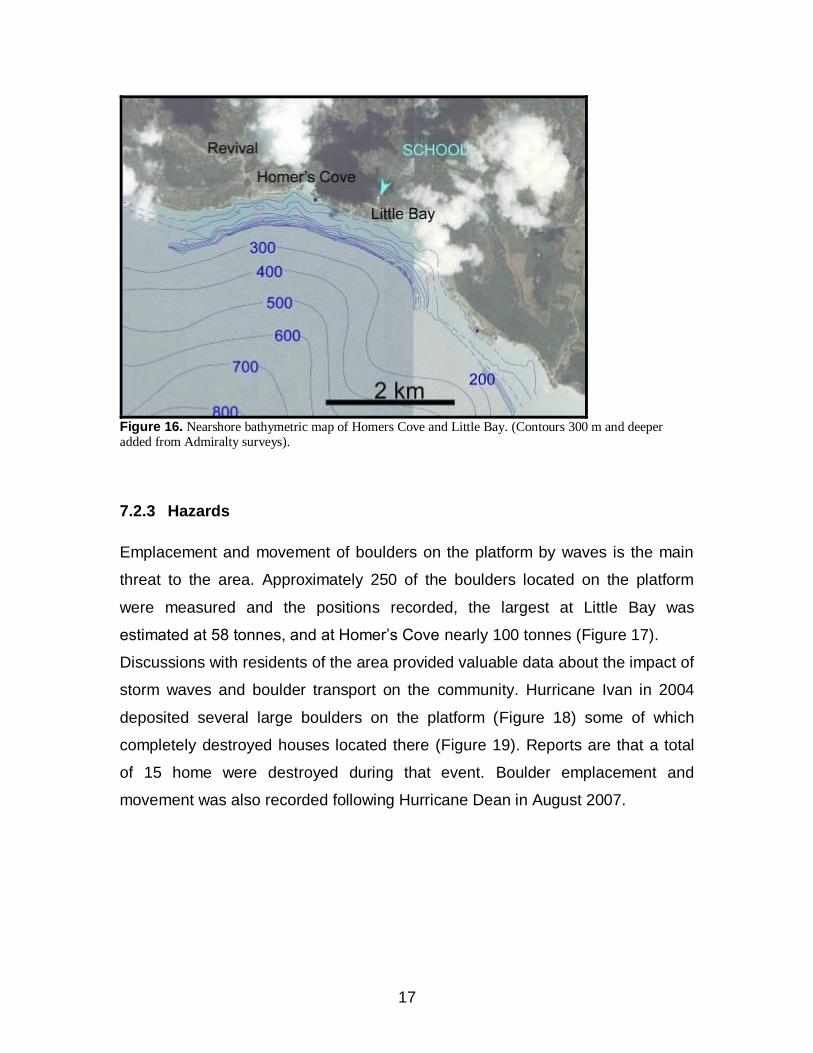
17
Figure 16. Nearshore bathymetric map of Homers Cove and Little Bay. (Contours 300 m and deeper added from Admiralty surveys).
7.2.3 Hazards
Emplacement and movement of boulders on the platform by waves is the main
threat to the area. Approximately 250 of the boulders located on the platform
were measured and the positions recorded, the largest at Little Bay was
estimated at 58 tonnes, and at Homer’s Cove nearly 100 tonnes (Figure 17).
Discussions with residents of the area provided valuable data about the impact of
storm waves and boulder transport on the community. Hurricane Ivan in 2004
deposited several large boulders on the platform (Figure 18) some of which
completely destroyed houses located there (Figure 19). Reports are that a total
of 15 home were destroyed during that event. Boulder emplacement and
movement was also recorded following Hurricane Dean in August 2007.

18
Figure 17 Map of Homers Cove and Little Bay, showing distribution of mapped storm/tsunami deposits (Red dots) and near-shore bathymetry.
Figure 18 Several boulders placed onshore by hurricane Ivan, one of them blocked the path from the house behind to the sea.

19
Figure 19 Site of a house destroyed by the boulder strew deposited by Hurricane Ivan.
7.2.4 Community awareness programme
The hazard map produced using data acquired through this project (Figure 20)
identifies areas affected by storm surge and boulder transport and was
incorporated in the educational material provided to the community (Appendix F).
The processes and impacts of storm waves and boulder transport were the key
areas focused on at the community meeting. This was held on 13th February
2007, and was organised with the assistance of the principal of the Little Bay All-
age school and with participants from the community, as well as neighbouring
areas, including representation from the Negril Coral Reef Preservation
Association (Figure 21).

20
Figure 20. Hazard Map of Homers Cove and Little Bay
Figure 21. Community meeting held to discuss the hazards affecting Homers Cove
7.3 Farquhar’s Beach
Farquhars Beach is a small fishing community at the western end of the
Clarendon Parish coastline, under Round Hill and readily accessible only from
Milk River. As with other south coast communities Farquhar’s Beach suffered

21
extensively from the passage of Hurricane Ivan (Figure 22). Storm surge height
was estimated at 2.5 m and inundation distances of as much as 100 m in places
(Robinson et al., 2006a; Rowe et al. 2005).
Figure 22 Farquhar’s Beach following the passage of Hurricane Ivan, September 2004. Photo: J. Tyndale-
Biscoe Co. Ltd.
7.3.1 Physiography and Geology
Farquhar’s Beach lies on a narrow strip of more or less level land sandwiched
between the coastline and the foot of the steep, southern slope of Round Hill, the
main access is by a dirt road leading from Milk River Bath. The limestone slopes
of Round Hill are precipitous in places and the eastern part of the area contains a
number of large boulders scattered amongst the houses, clearly generated by
ancient rock-falls. West of the village, Round Hill slopes directly into the sea,
forming a cliffed coast. East of the village the level land widens to include a belt
of mangrove swamp associated with the mouth of the Milk River.

22
7.3.1.1 Coastline morphology
Farquhar’s Beach is unusual in that the village is fronted by a beach that
changes its features more or less continuously in response to the westward
movement of sediment from the Rio Minho system, propelled by westward-
moving shoreline currents and the outflow of the Milk River (Figure 23).
Figure 23 Position of mangrove stand and beach sediments between the Milk River and Farquhar’s Beach over the period 1941-2004.
The mangrove-covered stretch of coast between Farquhar’s Beach and the
mouth of the Milk River is low-lying and swampy with extensive pools behind the
beach itself. Storm surge generated by hurricane Ivan in 2004 caused
considerable damage to mangroves behind the beach stripping sand from the
beach and depositing some of this material in the mangrove stands. At this time
the beach in front of the mangrove was only 1-2m wide. Considerable recovery of
the beach fronting the mangroves has been observed over the past year (Figure

23
24) with the beach in front of the mangroves reaching a width of 40m. Analysis of
historical data and mapping of the coastline and strand line show that there has
been a noticeable change in the position of these two features over time (Figure
23). Charcoal-burning takes place within the mangrove area.
Figure 24 Dead mangrove tree in the swash zone (left). Long shore drift (right) has resulted in progradation of the beach at the same location.
Changes in coastline geometry at the fishing beach
The beach in front of the settlement is the main fishing beach. It consists almost
entirely of siliciclastic and black magnetite sand, but with a generous sprinkling of
mollusc shells.
This section of the beach is an example of what is probably the most rapid and
extreme change in beach morphology anywhere on the Jamaican coastline. The
sediment supplied to the beach is sourced by long-shore drift from the sediment
discharge of the Rio Minho. The changes, which range from decadal (Figure 23)
to monthly (Figure 27), include large variations in beach width. A detailed
account of older changes was given in Robinson et al., 2006.

24
Figure 25 Estimated changes in the seaward edge of the mangrove (dashed lines) and the position of the beach (solid lines) between 2002 & 2007
A transect was established at the western end of the bay to monitor short term
changes in beach width and elevation. These profiles show that the beach
undergoes rapid transformation which illustrates the very dynamic nature of the
beach system in this area. Figure 26 illustrates the changes in the beach profile
over the sixteen month period between June 2006 and October 2007. A road
crosses the transect line and so the area between the peg and the 10 m is
usually cleared if covered by sand during storms. This was the case after
hurricane Ivan and so the sand was piled seaward of the road and is reflected on
the profile as by a steep incline about 1.5 m high about 10 m from the start of the
profile (Figure 26). The Beach at that time was just over 1.5 m above sea level
and between 27 and 28m wide with a steeply dipping foreshore. When compared
to the profile of October 2007, a decrease in elevation and increase in beach

25
width is observed. Along this profile the width of the beach has increased by
approximately 14m, resulting in a wider berm/backshore area and a gently
sloping foreshore.
-100
-50
0
50
100
150
200
0 10 20 30 40 50 60
Distance (m)
Ele
vati
on
(cm
)
Jun-06
Oct-07
Figure 26 Graph of beach monitoring station established at the western end of the beach and shows a comparison of the 10 month period, June 2006 and April 2007.
A look closer at the changes which occurred during the 18 months that this
beach was monitored shows that the supply and removal of sediment to this
beach can occur on a weekly rather than monthly basis. During a visit to
Farquhars Beach in January 2007, the beach profile was measured and it was
clear that beach erosion was a process affecting the area evident by the
presence of semi-upright trees, now partially in the sea and swash zone (Figure
27) and the relocation of temporary structures to a more landward position.
Subsequent visits to the area in March 2007 revealed that the beach had
recovered and increased in width. In fact this recovery occurred within days.
Figure 27 illustrate the changes that have occured in the beach within months.
The erosive scarp formed in January 2007, was still evident in March 2007
(Figure 27, right photo) and the trees previously in the swash zone were now in
the berm.

26
Figure 27 Rapid recovery of the beach in front of the fishing village at Farquhars Beach over a two month period, note the position of the tree once in the foreshore (January) now in the newly formed berm (March).
The beach profile was measured twice in on the 7th and 22nd of March 2007 and
a comparison of these two profiles (Figure 28) helps to quantify the rapid
changes in beach width at this site. The backshore area remained unchanged
during this period. However there appeared to be a large supply of sediment to
the beach as the foreshore advanced by approximately 70 m. This influx of
sediment formed a new berm at the same elevation as the one identified on
March 7th. However the erosional scarp formed previously was still evident,
identifying the position of the foreshore two weeks before (Figure 28).
January 2007 March 22, 2007

27
-150
-100
-50
0
50
100
150
200
0 20 40 60 80 100 120
Distance (M)
Ele
vati
on
(cm
)
March 7th 2007
March 22 2007
Figure 28 Graph showing rapid changes in beach width over a two week period between March 7
th 2007 and March 22
nd 2007 at Farquhars Beach.
7.3.2 Nearshore description
No bathymetric work was conducted in this area by the Marine Geology Unit
however the dynamic nature of the sediment transport along this section of the
coast from the mouth of the Rio Minho west through Canoe Valley suggests that
such a survey is necessary to fully understand the impact of storm waves
onshore.
7.3.3 Hazards
Beach erosion, riverine flooding, storm surge and rock falls are the major
hazards identified in the area. The rock falls, in particular are of unknown age,
but have probably been generated b one or more earthquakes. These have been
identified on the hazard map (Figure 29). Beach accretion can also bring
problems to the community, by making access to the foreshore and fishing boats
difficult (see also the discussion in Robinson et al. 2006).

28
Figure 29 Hazard Map prepared for the community of Farquhar’s Beach
7.3.4 Community awareness programme
A meeting with the community of Farquhar’s Beach and its environs was
organised with the assistance of leaders in the community and took place on
18th March 2007 (Figure 30). The meeting provided a forum for those present to
discuss the data collected in phase one of the project as well as new data
acquired which showed rapid changes occurring at the fishing beach in front of
the village. These changes were already well-recognised by the fishermen.
Educational material (Appendix D) was prepared for the community explaining
the hazard map (Figure 29) and the geomorphological map showing changing
positions of the beach (Figure 23). The hazard map identified areas which are
affected by rock falls, storm surge, flooding and beach erosion.

29
Figure 30. Members of the community attending the presentation made by the Unit on hazards affecting Farquhar’s Beach and Milk River area.
7.4 Galina
Galina was the second cliffed community investigated in Phase Two of the
BEACHES project. Galina is situated on an elevated limestone platform, forming
cliffs at the water’s edge, and lacking beaches of any kind. The community is
situated in a position where it is exposed to severe weather and has suffered
damage to housing and loss of lives from passing hurricanes. The existence of
storm debris on the cliffs, including very large boulders (Figure 31), is indicative
of a history of severe weather events and possible tsunami onslaughts. A
description of the platform and distribution of the boulders was published in
Robinson et al. (2006b).

30
Figure 31 Example of a boulder on platform at Galina
7.4.1 Physiography and Geology
The community of Galina and neighbouring areas consists of a village core
around which small hotels, guest houses, homes and light industry buildings
have been constructed. The community sits on a limestone platform of late
Pleistocene age (120,000 years old) raised above sea level to heights of up to 15
m. The coastline itself forms a cliff. Behind the platform an ancient sea cliff with
caves towers up to some 90 m high. As previously reported bathymetric profiling
by the MGU (Figure 32) indicates a relatively uneven island shelf with abundant
coral growth, but no reef crest breaking the surface. To the northeast the shelf is
about 500 m wide but narrows sharply along the north facing coastline to as little
as 200 m.

31
Figure 32 Physiographic map of the Galina area, showing distribution of mapped storm/tsunami deposits
and nearshore bathymetry.
7.4.2 Nearshore area description
Bathymetric data acquired during the first phase of the project provided details of
the shelf at the eastern end of Galina and western sections of the study area in
the vicinity of Crab Woods. As a result the central sections of the study area
lacked bathymetric details. This was collected in May 2007 (Figure 33) and
added to the data previously acquired to complete the bathymetric map for this
section of the coastline (Figure 34).

32
Figure 33 Topographic map of the Galina area, showing depth soundings recorded to complete the nearshore bathymetry in this area.
Figure 34 Completed bathymetry of the north coast shelf between Galina Point and Crab Woods. Isobaths at five meter intervals

33
Although no permanent beaches exist the sediment on the sea floor consists of
carbonate sand and pebbles derived from the reefs, together with blocks of talus
derived as rock fall from the cliffed shoreline.
7.4.3 Hazards
The main hazards result from passing storms and hurricanes. The heavy swells
and storm surges generated by these flood the platform and reach as far as
dwellings 200 m from the shoreline. These storm waves can deposit boulders on
shore, as well as move boulders that already exist on the platform. The possibility
of tsunami hazard has been discussed by Robinson et al. 2006b. The Hazard
map generated through this project identifies the debris ridge, position of the
boulders on the platform and the areas affected by storm surge (Figure 35).

34
Figure 35 Galina Hazard Map prepared for the Community
7.4.4 Community awareness program
Community surveys in the form of questionnaires were carried out in the
community to gather information from residents on the impacts of hazards in the
community. Visual presentations, with the aid of power point slide show and
multimedia projectors, were also made to the community at a meeting held on
2nd May 2007 (Figure 36) coordinated with the assistance of community leaders
and the NEPA St. Mary parish office. At this meeting the community was
presented with hazard maps and brochures outlining the types of coastal hazards
to which the community is vulnerable and measures to be taken to reduce this
vulnerability (Appendix E). The interaction with the community has led to

35
increased awareness and improved understanding of the hazards in the area.
Residents are keen to implement mitigation measures to protect their community
and raised questions about creating an artificial reef offshore as this was one
way to dampen the effects of the waves before they reach the coast. Although
we felt that this was a great idea, we acknowledged that it would be very
expensive and would require engineers and a greater technical study.
Figure 36 Residents from Galina and surrounding areas listening to an explanation of the processes involved in boulder emplacement on the platform.
The community was advised that they should start with a community organization
with a strategic plan and mission. With this they can approach local government
and non-government agencies about funding and further possible research into
protecting and saving the town of Galina from further harm.
7.5 Copacabana and Wickie Wackie
Monitoring of the beaches and analysis of near shore bathymetry has continued
in Phase two of the project. The communities of Copacabana and Wickie Wackie

36
lie to the east of Kingston, between Harbour View and Bull Bay, St. Andrew
Parish. They differ from the other communities studied in that they are essentially
dormitory suburbs for Kingston. Housing on sections of this coastline was
severely damaged during the passage of Hurricane Ivan in 2004 (Figure 37).
Figure 37 Copacabana post hurricane Ivan, September, 2004. Photo: J. Tyndale-Biscoe Co. Ltd.
The main hazards are storm surge, beach erosion and flooding from blocked
drains and the pond at Wickie Wackie. The beaches at these two localities
underwent erosion and subsequent changes in profile as a result of Ivan’s storm
surge, but have been slowly recovering and were not severely impacted by
hurricanes Dennis and Emily in 2005. However Hurricane Dean in August 2007
also generated storm waves and surge levels which impacted homes along the
beach in Wickie Wackie.
7.5.1 Physiography and Geology
At Copacabana and Wickie Wackie the narrow coastal plain is constructed of
fluvially derived sediments supplied by the Chalky and Cane Rivers (Figure 38).

37
This stretch of coast is bounded to the east by the Chalky River and to the west
by the Cane River. At Copacabana the higher elevations in the community
consist of impure limestones and conglomerates of the August Town Formation.
At Wickie Wackie the community is only a meter or two above sea level and is
bounded along the seaward margins by coastal dunes. Much of the inland area
had been filled artificially and a large pond exists by the eastern section of the
community.
Figure 38 Material is supplied to the beaches through a westerly long shore drift transporting sediment brought to the coast by the Chalky and Cane Rivers.
7.5.1.1 Coastline morphology
Long term coastline changes were investigated using air photographs and
satellite imagery for the area, spanning 40 years. This analysis showed that the
coastline in this area is relatively stable with the greatest changes occurring at
the mouths of the rivers, as is also the case at St. Margaret’s Bay.
Short term changes were investigated through beach profile monitoring on a
quarterly basis from January 2005 to August 2007. Three profiles were

38
established in Phase one of this project, one at Copacabana and two at Wickie
Wackie (Figure 39). Monitoring of these sites continued in Phase Two and show
seasonal changes and the effect that Hurricanes Emily and Dennis had on the
coast. In June 2006, Profile 1 had to be abandoned as efforts by a resident of
Wickie Wackie to establish additional protection for his property from storm surge
place construction material along the transect. The remaining profiles were
monitored through to August 2007.
Figure 39. Locations of Profiles established along the south east coast to monitor changes in beach shape and impact of storms on this section of the coastline.
A summary of the changes to beach morphology at Copacabana is shown in
Figure 40. Over the 9 month period between June 2006 and August 2007 the
beach shows an overall increase in width of approximately 2.5 m. There are also
some changes in elevation of the berm however these appears to be a result of
the redistribution of sediment over time.

39
-1.5
-1
-0.5
0
0.5
1
1.5
0 5 10 15 20 25 30
Distance (M)
Ele
vati
on
(M
)
Jun-06
Mar-07
Figure 40. Summary graph of beach profiles measured at Copacabana illustrating changes occurring over the 9 month period between June 2006 and March 2007.
The transect at Wickie Wackie which was monitored in Phase two of the project
showed that the first 20 m of the profile, from the seaward face of the dunes to
the middle of the berm appears to be stable. However, a net reduction in beach
width of approximately 21m was measured over the 10 month period between
November 2006 and August 2007 (Figure 41).

40
-1
-0.5
0
0.5
1
1.5
2
2.5
3
0 10 20 30 40 50 60 70 80 90
Distance (m)
Ele
vati
on
(m
)
Nov-06
Aug-07
Figure 41 Summary Graph of the transect at Wickie Wackie monitored in Phase Two of the Project illustrating changes over the 10 month period between November 2006 and August 2007.
7.5.2 Nearshore area description
The nearshore bathymetry (Figure 42 & Figure 43) of the western part of this
area was surveyed by the British Admiralty in the 1950s. The survey extended as
far east as the promontory immediately west of Wickie Wackie beach. In June
2006 the Marine Geology Unit extended the nearshore survey as far east as Bull
Bay. Where overlap with the Admiralty survey occurs there are depth
discrepancies that we attribute to changes in topography (submarine slides?)
over the past 50 years, as a result of storms etc. Noteworthy is the fact that the
edge of the island shelf lies only 200 m offshore from the housing development of
Caribbean Terrace at Harbour View. At Copacabana the shelf widens from about
300 m to 500 m, while opposite Wickie Wackie the shelf is 500 to 600 m wide.

41
Figure 42 Bathymetric map of the shelf south of Caribbean Terrace east to Wickie Wackie
Figure 43 Bathymetric map of the area east of the Palisadoes
7.5.3 Hazards
The main hazards identified in the area are beach erosion, flooding of low lying
areas in close proximity to two ponds in the area. During times of heavy rainfall
these ponds flood the surrounding areas blocking access to homes (Figure

42
44Error! Reference source not found.). Other hazards include damage from
winds and storm surge generated by hurricanes.
Figure 44. Pond overflowed flooding adjacent street after heavy rain blocking access to these homes, Wickie Wackie, October 2005.
Storm surge generated by Hurricane Ivan (2004) damaged homes exposing
foundations of sea walls and some homes (Figure 45). Sediment from the beach
was also removed lowering its elevation and exposing beach rock.

43
Figure 45 Example of the damage caused by storm surge generated by Hurricane Ivan striped sediment from beach exposing beach rock (right) and undermining foundations of homes (Photo taken at Copacabana, September 2004)
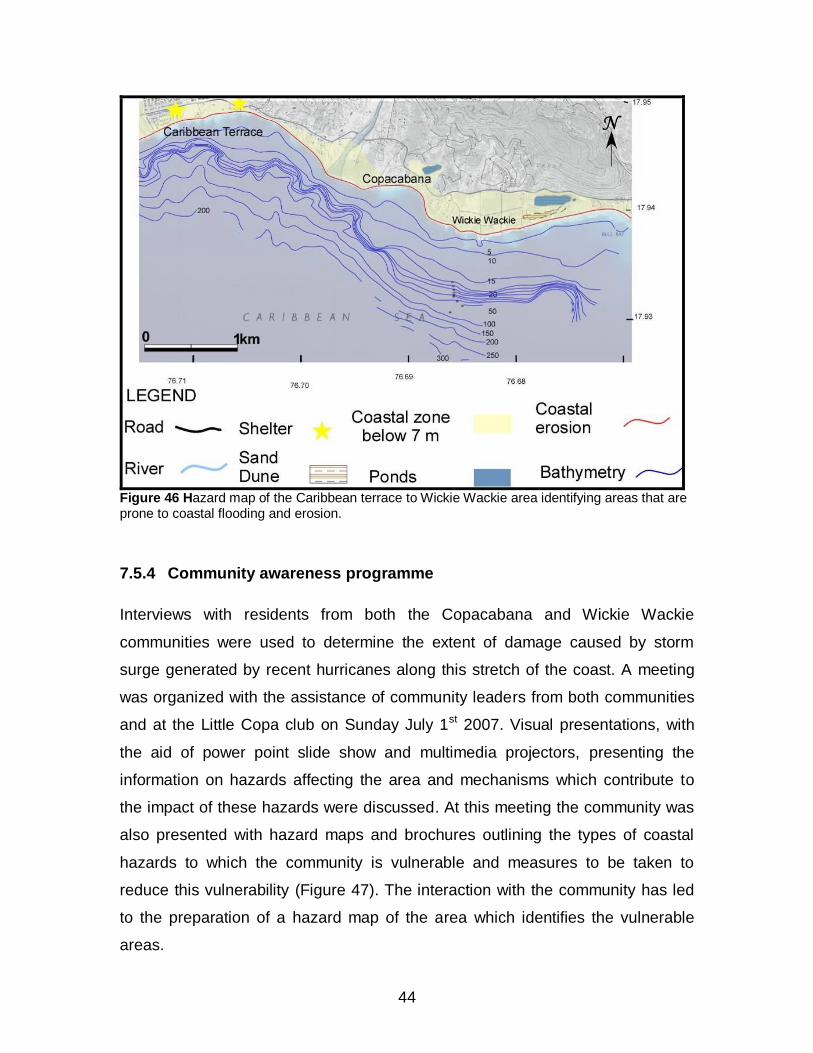
The Hazard map (Figure 46) generated for the coastal communities from
Caribbean Terrace to Wickie Wackie identifies the emergency shelters as well as
low lying areas that may be affected by storm surge as well as areas prone to
coastal flooding and the sections of the coastline experiencing coastline retreat. It
should be noted that no clearly established emergency shelters exist at
Copacabana and Wickie Wackie.
44
Figure 46 Hazard map of the Caribbean terrace to Wickie Wackie area identifying areas that are prone to coastal flooding and erosion.
7.5.4 Community awareness programme
Interviews with residents from both the Copacabana and Wickie Wackie
communities were used to determine the extent of damage caused by storm
surge generated by recent hurricanes along this stretch of the coast. A meeting
was organized with the assistance of community leaders from both communities
and at the Little Copa club on Sunday July 1st 2007. Visual presentations, with
the aid of power point slide show and multimedia projectors, presenting the
information on hazards affecting the area and mechanisms which contribute to
the impact of these hazards were discussed. At this meeting the community was
also presented with hazard maps and brochures outlining the types of coastal
hazards to which the community is vulnerable and measures to be taken to
reduce this vulnerability (Figure 47). The interaction with the community has led
to the preparation of a hazard map of the area which identifies the vulnerable
areas.

45
Figure 47. A resident of the community viewing the poster with the hazard map of the area with explanations and illustrations of the impact that these hazards have on the community.
8 BEACHES Workshop
As a final component to the project a workshop was held on November 6th
2007 to present findings of the BEACHES project. The workshop had sixty six
registered participants and was organized into five presentations from members
of the Marine Geology Unit. These sessions included methodology used in the
project, both in the field and in preparing the hazard maps; the actual hazards
identified in each community and the mechanisms driving them. Feed-back from
the communities and suggestions for the way forward and next steps required for
mitigation and improvement of the safety of the residents in the areas
investigated were also discussed at the workshop. A sixth presentation was
made by Mr. Rafi Ahmad who provided details on Hurricanes Ivan and Dean the
two most recent hurricanes to have severely impacted sections of the coast.
46
The 5 Hazard maps prepared for each community were also presented at
the workshop (APPENDIX G). Discussions and feed-back from the workshop will
be included in the proceedings and these will be used to improve the final large
scale hazard maps being prepared.
The BEACHES workshop was combined with another workshop, also
supported by funding from the Environmental foundation of Jamaica, which
focused on the impacts of Hurricane Dean on coastal areas. This workshop
brought together several agencies involved in hazard assessment in Jamaica
and included 9 presentations from 8 organizations (APPENDIX H).
COASTAL HAZARD MAPS
In addition to the coastal hazard maps of sections of the coastline which included
the five communities focused on during the project 3 other maps were prepared
with the 1:12500 base maps and includes storm surge inundation distance,
critical facilities, emergency shelters and bathymetry data needed to understand
off-shore processes (Appendix**). Some 40 maps are in various stages of
preparation and were scheduled for completion at the end of the project.
However the completion of these maps has been delayed, partly due to the
interference by hurricanes Dean and Felix and the subsequent 2 months of bad
weather, and the emphasis placed by the Unit on preparing a report on the
impact of hurricane Dean on the Jamaican coastline, funded by the
Environmental Foundation of Jamaica (EFJ) as an off-shoot of the BEACHES
project.
IMPACT OF HURRICANE DEAN ON THE COASTLINE
Following the passage of hurricane Dean in late-August, the Marine Geology Unit
was asked to prepare a report on the physical impact of the hurricane on the
Jamaican coastline. This report has been completed and a draft report has been
submitted in electronic form to the EFJ..
.

47
9 OTHER ACTIVITIES
In order to improve the Unit’s understanding of and expertise in the mapping of
evidence indicative of past giant wave events (hurricane and/or tsunami) the
opportunity was taken to invite a specialist team of tsunami experts from the US
Geological Survey to visit the island and look at such evidence identified by
members of the MGU. This took place in January 2007 and several sites were
examined over the five-day visit. The sites included the two BEACHES project
cliffed communities of Galina and Homers Cove, as well as other sites at Iter
Boreale St. Mary, Discovery Bay St. Ann, Mahoe Bay, St. James, West End
Negril, and Black River and Parottee St. Elizabeth. An extensive and
comprehensive report was received from the USGS following the visit. A
probable tsunami layer was identified at Iter Boreale from which a fragment of
glass was taken to be dated by the USGS team to determine the date of
deposition (Figure 48).
Figure 48 Buried tsunami layer identified behind the beach at Iter Boreal, St. Mary

48
Exploratory coring for buried wave deposits was also undertaking during the field
excursion. Sites sampled include Iter Boreale, Negril, and Black River, St.
Elizabeth. Samples of buried sand deposits were collected from Iter Boreale
(Figure 49) and Black River (Figure 50).
Figure 49 Coring for buried tsunami and/ or storm deposits in the swamps behind the beach at Iter Boreale (left). Core showing sediment layers within the swamp (right)

49
Figure 50 Core showing sand layers between two peat layers from mangroves in St. Elizabeth
The trip also included examination of boulders, debris ridges and storm deposits
at Galina (Figure 51) and Discovery Bay, St. Ann and Homers Cove,
Westmoreland (Figure 52). The debris ridge and boulders located on the platform
at Galina, are well defined features and have been mapped (Figure 53) to identify
vulnerable areas.

50
Figure 51 Member of the USGS team examining a cross section of the debris ridge on the limestone platform at Galina St. Mary

51
Figure 52 Storm ridge and boulder deposits at Homers Cove, Westmoreland

52
Figure 53 Map showing Boulder locations, Debris ridge and area prone to storm surge at Galina St. Mary
10 PUBLIC RELATIONS
Community involvement in phase two of the project was a key factor in
developing hazard awareness training sessions. The data collected are being
made available to the public through a series of oral and visual presentations.
Whether through conversations with individual community members, small focus
groups or through presentations to larger groups the project has gained feedback
from the general public and support from the scientific community. The activities
included:
Led a Geological Society field trip to Galina to look at the coastal debris
deposits there.

53
Presented two papers at the Geography conference in July, one on
community relations and one on physical hazards of the coastline. The
MGU also helped lead a conference field trip along Palisadoes to Port
Royal.
Contributed two articles to the Gleaner on the Palisadoes access to the
airport.
Led field trip, organized for visiting tsunami scientists from the United
States Geological Survey (USGS), to areas identified in this project
showing evidence of giant waves deposits (see details above).
Members of the Unit, representing the UWI, participated in the United
Nations Framework Convention on Climate Change (UNFCCC) Experts
meeting on Adaptation for small island developing states in February
2007, and prepared a poster on selected coastal hazards for the event.
Conducted a coastal hazard field trip to project localities on the eastern
coast for student members of the Geological Society of Trinidad &
Tobago.
Gave a presentation to fellow environmentalists at the Jamaica Institute of
Environmental Professionals (JIEP) annual conference (May 2007) on
physical hazards of the coastline
Presented posters and gave a presentation at the Institute of Jamaica’s
public forum for International Biodiversity and climate change.
Contributed to a Red Cross documentary on coastal hazards and
Vulnerability.
Delivered a presentation on coastal hazards at the UWI Climate Change
Conference (June 2007).
Initiated production of a newsletter “Shorelines”.
Saw publication in a professional journal of our article on giant wave
deposits investigated through this project (Robinson et al.2006b, see
references)
The Unit has also had two articles published in The Gleaner; August 2006
and September 2006, ongoing in the Unit’s Gleaner series on “Hazards of

54
the Jamaican Coastline”, and a further Gleaner article on access to the
Norman Manley airport in September 2007.
A meeting with government agencies and the public was held in
November 2007 and took the form of an interactive workshop to discuss
the various hazards identified and measures that can be taken to address
them (8 BEACHES Workshop).
A presentation to the Geological Society of Jamaica’s workshop on
hazaeds and the insurance industry in November 2007.
11 Problems and Distractions in Project Execution
During December and January of 2007 the MGU became involved, at the request
of the Ministry of Local Government and the Environment, through its National
Works Agency, to assist in the technical evaluation of the Palisadoes access
road to the airport, a project carried out by a team of Cuban specialists.
Execution of the stated objectives of the project as outlined above were varied in
response to the unusually wet weather in March 2007 which hampered offshore
investigation and delayed the final phase of the community awareness
component of the project. Further interruptions from Dean etc. have been
mentioned above.
One of the Unit’s computers crashed earlier in 2007. This unit was networked
with the UWI’s system to use the ArcGIS software. A temporary replacement was
put in use but with very limited capabilities. A replacement computer was ordered
and delivered in August 2007, funded internally by the Unit..

55
REFERENCES
Robinson, E., Rowe, D-A. C. & Khan, S. A. 2006a. BEACHES, Evaluation of Coastline Changes and Hazards in Jamaica to Improve Hazard Reduction Strategies for Coastal Communities: Phase One Final Report to the Environmental Foundation of Jamaica on the first year of activities, Project No. 03/09/431-PL480, 82 pages. Robinson, E,. Rowe, D-A.C. & Khan, S.A. 2006b. Wave-emplaced boulders on Jamaica’s rocky shores. Zeitschrift fur Geomorphologie, Supplement Volume 146, 39-57.
Rowe, D-A.C. & Robinson, E. 2005. Evaluation of Coastline Changes and Hazards in Jamaica to improve Hazard Reduction Strategies for Coastl Communities (BEACHES). End of First Year Report to the Environmental Foundation of Jamaica, Aprol 18, 2005. 113 pages.
Robinson, E., Khan, S. A. & Rowe, D-A. C. 2003. Preliminary Assessment of Beach Erosion at St. Margaret's Bay, Portland, Jamaica. Prepared for the Government of Jamaica's National Environment and Planning Agency and the United States Agency for International Development, Implemented by Associates in Rural Development Inc. through the Ridge to Reef Project. 70 pages.

56
APPENDIX A List of projects Advisory Committee members:
Prof David Barker (Chair) Head Dept of Geography & Geology UWI Mona
Mr. Rafi Ahmad (Deputy Chair) Unit for Disaster Studies, Department of Geography and Geology UWI Mona
Michelle Edwards, Office of Disaster Preparedness and Emergency Management,
Mr. Derrick Gayle, Field Officer, Environmental Foundation of Jamaica.
Mr. Ainsley Henry, National Environment and Planning Agency, Ministry of Lands and the Environment.
Mr. Franklyn McDonald, United Nations Environmental Programme (UNEP).
Mrs. Hermione McKenzie, Department of Sociology and Social Work, UWI.
Mr. Patrick Rose, National Works Agency
Dr. Dale Webber, Director, Centre for Marine Sciences, UWI.
Ex officio:
Professor Edward Robinson, Project Manager
Miss Shakira Khan, Project Officer

57
Name
Meetings (Total = 5 Meetings) Number of
Meetings Attended
July 11
th
2006
October 3
rd
2006
December 5
th
2006
February 6
th
2007
April 17
th
2007
Prof. David Barker (Chair) Head of Department Department of Geography and Geology, UWI
Present
1
Mr. Rafi Ahmad (Deputy Chair) Unit for Disaster Studies Department of Geography and Geology, UWI
Present
Present
Present
3
Michelle Edwards Office of Disaster Preparedness and Emergency Management
Present
Present
2
Mr. Derrick Gayle Field Officer Environmental Foundation of Jamaica
0
Mr. Ainsley Henry National Environment and Planning Agency
Present
Present
Present
3
Mr. Franklyn McDonald United Nations Environmental Program
Present
1
Mrs. Herminoe McKenzie Department of Sociology and Social Work, UWI
Present
Present
2
Mr. Patrick Rose National Works Agency
0
Dr. Dale Webber Director Centre for Marine Sciences, UWI
0
Prof. Edward Robinson Project Manager Marine Geology Unit Department of Geography and Geology, UWI
Present
Present
Present
Present
Present
5
Ms. Shakira Khan Project Officer Marine Geology Unit Department of Geography and Geology, UWI
Present
Present
Present
Present
Present
5
Ms. Debbie Ann-Rowe Project Officer Marine Geology Unit Department of Geography and Geology, UWI
Present
1
Mr. Richard Coutou Marine Geology Unit Department of Geography and Geology, UWI
Present
1
APPENDIX A.2 Table of Advisory committee members and meeting held for the period July 2006 to April
2007

58
APPENDIX B - Minutes & progress reports for the project; July 2006 to April
2007
Minutes of the Advisory Committee for the project
Evaluation of Coastline Changes and Hazards in Jamaica to Improve Hazard Reduction
Strategies for Coastal Communities
Held July 11th, 2006
1. Call to Order
The meeting was called to order at 6:00 p.m.
Persons present
Mr. Franklyn McDonald, Mr. Ainesly Henry – NEPA, Prof. Edward Robinson – Marine Geology Unit (UWI) and Ms. Deborah-Ann Rowe – Marine Geology Unit (UWI), Ms.
Shakira Khan - Marine Geology Unit (UWI).
2. Apologies & Absences
Apologies were tendered for Mr. Rafi Ahmad and Professor David Barker
3. Correction and Confirmation of Minutes
Motions for adoption and seconding of the minutes were as follows: confirmation by Mr. Franklyn McDonald, seconded by Mr. Ainesly Henry.
4. Matters Arising from minutes of the meeting of April 11th
2006
- Geography Conference Presentations- the Unit will be making 2 presentations at the meeting and will be leading the Palisadoes segment of the Portmore to
Palisaodes conference field trip, part of the Global Change and Caribbean
Vulnerability: environment, economy and society at risk? To be held on July
24th- 28
th 2006.
- Tide Gauges – nothing new Chinese were approached to change the location of
the new gauges.
5. Progress Report
-
This was presented by Prof. Robinson via a power point presentation to the members
of the committee. The report included:-
A summary of the five communities, St. Margaret’s Bay, Farquhars Beach,
Copacabana/ Wickie Wackie, Annotto Bay and Galina. The Impact of Hurricanes at Homers Cove and Little Bay, south western Jamaica has also
been looked at. Prof. reiterated that one of the main objectives of the project
59
was to address and provide improved measures of hazard susceptibility for
the problem of coastal erosion. The Unit has selected sites for continuous monitoring and assessment of storm surge limits.
The Project extension will focus on community involvement. Two
communities are far advanced, St. Margaret’s Bay and Annotto Bay
A list of sites where bathymetric surveying has been done, these are
necessary to provide baseline data for continued studies.
Presentation on the database and index created for the historical records
acquired to date. This includes over 1600 digitized aerial photographs, satellite images and maps.
- Current Activities
- BEACHES Final Report to EFJ for the project 03/09/431-PL480 is currently being written for submission at the end of July 2006.
- The Unit Applied to EFJ for a one year extension was granted a one year extension to
be completed April 2007.
- We have been able to date two samples from collected from boulders, courtesy of the
National Environmental Protection Agency (NEPA).
6. Any Other Business
a. Ms. Deborah – Ann Rowe has been awarded a scholarship to attend the
University of Chester to pursue a PhD in paleotsunami deposits in Southwestern
Jamaica. She will be leaving the unit and her duties as Project Officer on October 4
th 2006. we wish her all the best in her studies.
b. Mr. Franklyn McDonald Noted that sand Mining has taken place in Little Bay in the past. Documentation exists of this activity as the sand was mined for use on
the Negril Beach
c. Mr. McDonald told the committee that the wag water river was pushed further west in the 1930’s as par of the Flood Mitigation Program implemented at that
time. This was done in an effort to protect the town by preventing the river from
spreading. Reports of this should exist at the Public Works department, now the National Works Agency (NWA).
d. Mr. McDonald advised the committee that the “Adaptation to climate change” document will be revised and asked the unit if they could contribute to this
endeavour.
e. Mr. Ainsley Henry enquired about the progress of the Palisadoes project, however Prof has had no further word on this.
7. Continuing the Advisory Committee

60
The members of the committee were asked if they would continue to serve for the one
year extension of the project, all agreed to do so. Suggestions were made to invite representatives from the National Works Agency and
the Mines and Geology Division to join the committee.
8. Date of Next Meeting
The next meeting is scheduled for Tuesday, October 3rd 2006.
Action Column
The meeting was adjourned at 7:28 p.m.
Minutes of the Advisory Committee for the project
Evaluation of Coastline Changes and Hazards in Jamaica to Improve Hazard Reduction
Strategies for Coastal Communities held October 3rd , 2006
1. Call to Order The meeting was called to order at 5:50 p.m. by Mr. Ahmad. The proceedings were
conducted by Prof. Robinson.
Persons present Ainsley Henry – NEPA, Hermione McKenzie – Social Sciences, UWI, Michelle Edwards
– ODPEM, Rafi Ahmad – UDS, Patrick Rose – NWA, Edward Robinson – MGU and
Shakira Khan – MGU.
2. Apologies & Absences Apologies were tendered for Prof. David Barker
3. Correction and Confirmation of Minutes
1. Mr. Ainsley Henry’s name has been misspelt through out the minutes
Motions for adoption and seconding of the minutes were as follows: confirmation by Mr.
Ainsley Henry, seconded by Prof. Edward Robinson.
4. Welcome new committee members
Prof Robinson welcomed Mr. Patrick Rose from the National Works Agency (NWA)
who is the newest member of the BEACHES advisory committee.
5. Matters Arising from minutes of the meeting of July 11th
2006
Prof. Robinson to extend invitations to representatives from NWA and Mines and Geology
Division

61
a. BEACHES project extension - We are at the end of the first six months of the
extension period and the focus will now be on the community awareness component of the project. However the monitoring of profiles will be continued.
b. Publications – We have had two articles published in The Gleaner (August 31st
2006 and September 7th 2006).
The unit produced the first issue of its Newsletter “Shorelines” which presents a
review of the activities of the Marine Geology Unit. The committee was asked for feed back on way to improve this publication.
6. Progress Report
A review of the activities of the last 6 months was presented by Prof. Robinson via a
power point presentation to the members of the committee.
The report included:-
A summary of the field activities undertaken at Discovery Bay, Peartree
Bottom and Galina investigating boulder deposits.
Review of the buried deposits identified along the north coast at Mahoe Bay,
Iterboreal and Palmetto Point.
Report on the meeting with the Annotto Bay community and an out line of
the work plan for the community awareness component of the project.
The status of the bathymetric surveying along the North east (Annotto Bay
and Galina) and south west coast (Savannah la mar and Homers cove).
Participation in the “Global Change and Caribbean Vulnerability:
Environment, Economy and Society at risk?” conference. The Unit
presented a paper and organized the Caribbean Terrace/ Palisadoes leg of the
conference field trip.
Presentation on the database and index created for the historical records
acquired to date. This includes over 1600 digitized aerial photographs, satellite images and maps.
7. Unit Staff c. Ms. Deborah – Ann Rowe, BEACHES Project Officer has left the Unit to take up
a scholarship at the University of Chester to pursue a PhD in paleotsunami
deposits in Southwestern Jamaica. Ms. Shakira Khan has been offered this position and will be assisted by two part time assistants, which have not yet been
identified.
8. Any Other Business
f. Mr. Ahmad informed the committee that a delegation of Norwegian scientists
from the Norwegian geotechnical institute will be visiting the Island at the end of

62
October to prepare a hazard and risk assessment study to be conducted jointly
with the Unit for Disaster Studies and other stake holders.
g. Professor Robinson informed the committee that a team of scientists from the
United States Geological Survey (USGS) is interested in including Jamaica in
their present study on tsunami deposits in the Caribbean.
9. Date of Next Meeting
The next meeting is scheduled for Tuesday, December 5th 2006.
Action Column
The meeting was adjourned at 7:06 p.m.
Minutes of the Advisory Committee for the project
Evaluation of Coastline Changes and Hazards in Jamaica to Improve Hazard Reduction
Strategies for Coastal Communities Held December 5th, 2006
1. Call to Order The meeting was called to order at 5:59 p.m. by Prof. David Barker and handed over to
Prof. Robinson.
Persons present
Ainsley Henry – NEPA, Prof. David Barker – Dept Geography & Geology, UWI,
Edward Robinson – MGU and Shakira Khan – MGU.
2. Apologies & Absences Apologies were tendered for Mr. Patrick Rose, Dr. Dale Webber and Mr. Rafi Ahmad
3. Correction and Confirmation of Minutes
2. Minutes of the Advisory Committee for the project ……. held October 3rd
2005
should read Minutes of the Advisory Committee for the project ……. held October
3rd
2006
Motions for adoption and seconding of the minutes were as follows: confirmation by
Prof. Edward Robinson, seconded by Mr. Ainsley Henry.
4. Matters Arising from minutes of the meeting of October 3rd
2006
d. Unit staff
63
The unit has employed Miss Kadean Mitchell a final year geology undergraduate
student on a part-time basis and we anticipate the return of Mr. Richard Coutou in January 2007.
e. Norwegian Geotechnical Institute Delegation
We have met with the team from NGI and they have selected one project based in Jamaica which will focus on landslide assessment on the northern slopes of the
Blue Mountains.
f. USGS Visiting Tsunami research team
The USGS team will be Visiting Jamaica on the 22nd
of January 2007 for 1 week.
A joint field programme will be developed to visit several boulder and potential buried deposit sites around the island. The unit will be using a corer on loan
from The Petroleum Corporation of Jamaica (PCJ) to look for buried deposits.
5. Progress Report
A printed summary report for the period October 3rd
to December 5th
2006 was
reviewed for the committee by Prof. Robinson.
The report included:-
A review of the Units involvement with the NWA/Cuban consultant project
to rehabilitate the Palisadoes.
Review of the St. Margaret’s Bay community meeting and the feed back
from eth community members.
The schedule for upcoming community meetings as part of the community
awareness component of the project. Galina, St. Mary is planned for the 3rd
week of January 2007 and Homers Cove, Westmoreland will be the 2nd
week
of February 2007.
During field work carried out along the north coast, particularly at Iter
Boreale, St. Mary, Prof. Robinson noted that drains being used in eth
highway construction were partially filled with silts and this indicates that
they will not be effective in providing adequate drainage for the area in the future. Mr. Henry noted that NEPA can review such construction issues and
request improvements.
Prof Reported that the corer would also be used in Negril and Canoe Valley
along the south coast.
6. Any Other Business
h. Both David Barker and Ainsley Henry reported on the dangers of conducting field work in the Canoe Valley area. Suggestions were made to request protection
from the ICF.

64
i. Ainsley has made a request to access the data in the Unit to identify base data for
several of our monitoring sites; Prof. Robinson has agreed to this.
7. Date of Next Meeting
The next meeting is scheduled for Tuesday, February 6
th 2007 at 5:00pm.
Action Column
The meeting was adjourned at 6:41 p.m.
Minutes of the Advisory Committee for the project
Evaluation of Coastline Changes and Hazards in Jamaica to Improve Hazard Reduction
Strategies for Coastal Communities
Held February 6th, 2007
1. Call to Order The meeting was called to order at 5:33 p.m. by Mr. Rafi Ahmad and handed over to
Prof. Robinson.
Persons present
Mr. Rafi Ahmad – Dept Geography & Geology, UWI, Ms. Michelle Edwards – ODPEM,
Prof. Edward Robinson – MGU and Shakira Khan – MGU.
2. Apologies & Absences Apologies were tendered for Mr. Derrick Gayle, Dr. Dale Webber, Mr. Ainsley Henry
and Prof. David Barker.
3. Correction and Confirmation of Minutes
12
5. During field work …..noted that eth drains should read During field work
…..noted that the drains
Motions for adoption and seconding of the minutes were as follows: confirmation by Prof. Edward Robinson, seconded by Ms. Shakira Khan.
4. Matters Arising from minutes of the meeting of December 5th
2006
g. Unit staff
The Unit is to provided Mr. Henry with copies of the Photos of the drains at Iter
Boreale

65
Mr. Richard Coutou has returned and is once again with the Unit on a part-time
basis, Ms. Kadean Mitchell will also continue with us on a part-time basis.
h. Norwegian Geotechnical Institute Delegation
Mr. Ahmad reported that discussions with the team have led to the development
of a tsunami hazard map of SW Barbados.
i. USGS Visiting Tsunami research team
The USGS team spent 7 days in Jamaica in January and was involved in a joint field exercise with the MGU investigating potential tsunami deposits around the
island. Mr. Ahmad recommended that a field trip be organized to share
information garnered on that trip with interested parties.
5. Progress Report
A printed summary report for the period December 5th 2006 to February 6
th 2007was
reviewed for the committee by Prof. Robinson.
The report included:-
A review of the Units involvement with the USGS Tsunami team and the
joint fieldwork carried out in January.
The schedule for upcoming community meetings as part of the community
awareness component of the project. Homers Cove, Westmoreland will be the 2
nd week of February 2007.
The MGU also visited the Woods Hole research vessel Corwith
Cramer as part of a UWI delegation.
Our most recent publication Robinson, E.; Rowe D.-A. C.; Khan, S. A.
2006. Wave- Emplaced Boulders on Jamaica’s Rocky Shores. Z.
Geomorph. N.F. Vol. 146, 39-57
6. Any Other Business
j. Mr. Ahmad suggested that the Unit should present its work to a wider audience.
7. Date of Next Meeting
The next meeting is scheduled for Tuesday, April 17
th 2007 at 5:30pm.
Action Column

66
The meeting was adjourned at 6:20 p.m.
Minutes of the Advisory Committee for the project
Evaluation of Coastline Changes and Hazards in Jamaica to Improve Hazard Reduction
Strategies for Coastal Communities
Held April 17th, 2007
1. Call to Order
The meeting was called to order at 5:55 p.m. by Mr. Rafi Ahmad and handed over to
Prof. Robinson.
Persons present
Mr. Rafi Ahmad – Dept Geography & Geology, UWI, Hermione McKenzie – Social Sciences, UWI, Prof. Edward Robinson – MGU and Shakira Khan – MGU, Richard
Coutou - MGU.
2. Apologies & Absences Apologies were tendered for Prof. David Barker.
3. Correction and Confirmation of Minutes
Motions for adoption and seconding of the minutes were as follows: confirmation by Mr.
Rafi Ahmad, seconded by Prof. Edward Robinson.
4. Matters Arising from minutes of the meeting of December 5th
2006
a. Norwegian Geotechnical Institute Delegation Mr. Ahmad reported that there will be a meeting to review progress being done.
Rafi will recommend that they invite a member of the MGU, which was Prof
Edward Robinson.
Climate Change
Mrs McKenzie is working on a project looking at the policy related to climate change.
5. Progress Report
A printed summary report for the period February 6
th 2006 to April 16
th 2007 was
reviewed for the committee by Prof. Robinson.
The report included:-
Community meetings were conductance for Homers Cove and Little Bay,
Westmoreland in February and at Faquhars Beach, Clarendon on 18th March.

67
Joint MGU and UDS field leader on GSTT coastal hazards field trip on 10th
February.
MS Deborah-Ann Rowe returned to Jamaica to conducted field work on
buried tsunami deposits and she also assisted the unit on B.E.A.C.H.E.S.
hazard map preparation.
The schedule for upcoming community meetings as part of the community
awareness component of the project. Homers Cove, Westmoreland will be the 2
nd week of February 2007.
Continued beach monitoring and profiling.
Mapping of coastline at Farquhars Beach and the mouth of the milk ricer due
to rapid sedimentation.
6. Any Other Business
a. Ask MS Hermaine to assist with presenting the policy section at the NGO meeting.
7. Date of Next Meeting
The next meeting is scheduled for Tuesday, Junr 26th 2007 at 5:30pm.
Action Column
The meeting was adjourned at 7:00 p.m.

68
APPENDIX C
Facsimile of materials produced for the community of St. Margaret’s Bay, Portland
Appendix C. 1 St. Margaret’s Bay coastal hazard poster

69
Appendix C.2 St. Margaret’s Bay coastal hazard brochure

70
Appendix D Facsimile of materials produced for the community of Farquhar’s Beach, Clarendon
Appendix D.1 Farquhar’s Beach coastal hazard poster

71
Appendix D.2 Farquhar’s Beach coastal hazard brochure

72
Appendix E Facsimile of educational materials produced for the community of Galina, St. Mary
Appendix E.1 Poster provided to schools and government agencies in St. Mary for use in future hazard awareness programs conducted in the community.

73
Appendix E.2 Brochure provided to community members, with the hazard map and guidelines for safe building practices suitable in this setting and tips on hurricane preparedness.

74
Appendix F
Facsimile of materials produced for the community of Homers Cove and Little Bay, Westmoreland

75

76
Appendix G
Hazard Maps prepared for the five communities investigated
Appendix G

1

2
Appendix G

3
Appendix G

4
Appendix G

1
Appendix H Programme of Talks presented at the workshop organised for the presentation of the findings of the BEACHES project and the hurricane dean impact assessment conducted island wide by various agencies.
`
Funded by the Environmental Foundation of Jamaica
8:30-9:00 am WORKSHOP REGISTRATION
9:00 – 9:20 am
Opening Remarks Mrs. Eleanor Jones
Session 1 Mr. Rafi Ahmad –
chairman
9:20 – 9:35 am
BEACHES –Project objective and methods used
Prof. Edward Robinson –Marine Geology Unit (MGU) UWI
9:35 – 9:50 am
Coastal Hazard Maps - design and applications
Mr. Richard Coutou (MGU-UWI)
9:50 – 10:05 am Coastline assessment, documenting physical features
Prof. Edward Robinson (MGU-UWI)
10:05 – 10:30 am
COFFEE BREAK & POSTER VIEWING
Session 2 Prof. Ronald Young
– chairman
10:30 – 10:45 am
Hazards of our Coastline – Impacts on coastal communities
Shakira Khan (MGU-UWI)
10:45 – 11:00 am
Characteristics of Hurricane Dean
Mr. Rafi Ahmad Unit for Disaster Studies (UWI)
11:00 – 11:15 am
Offshore sand deposits – South coast shelf: A preliminary
appraisal Prof. Edward Robinson (MGU-UWI)
11:15 – 12:00 pm
PARTICIPANTS REVIEW
END OF MORNING WORKSHOP
Impact of Hurricanes on Jamaica's Coastline
Beach Erosion And Coastal Hazards: Ensuring Safety (B.E.A.C.H.E.S.)
Mona Visitor’s Lodge & Conference Center UWI, Mona Campus
November 6th, 2007

2
Funded by the Environmental Foundation of Jamaica
1:30 – 1:45 pm REGISTRATION – Hurricane Dean Impact assessment
1:45 – 2:00 pm Opening Remarks
Session 1 -Prof. David Barker-
chairman
2:00 – 2:15 pm
Impact of storm surge: implications for future development Mr. Norman Harris and Ms. Georgette D’Aguilar
Mines & Geology Division
2:15 – 2:30
Impact of Hurricanes Dean and Felix on Manatee Bay, St. Catherine
Dr. David Miller1 and Dr. Andrew Pearson
1Department of Geography & Geology (UWI)
2:30 – 2:45 pm
Sectoral Damage Analyses of Hurricane Dean - Financial Sector and the Main Road Infrastructure
Dr. Parris Lyew-Ayee and Ms. Karen McIntyre Mona Geoinformatix Ltd
2:45 – 3:00 pm
Coastal Impact of Hurricane Dean Mr. Ainsley Henry and Miss. Stacy Moses
Integrated Planning & Environment Division, NEPA
3:00 – 3:15 pm
Damage assessment: A critical Pre and Post disaster impact decision making tool, the case of Hurricane Dean
Mrs. Karema Akins-Mitchell Office of Disaster Preparedness and Emergency Management
(ODPEM)
3:15 – 3:45 pm
COFFEE BREAK & POSTER VIEWING
Session 2
3:45 - 4:00 pm Ms. Claire Bernard
Planning Institute of Jamaica (PIOJ)
4:00 – 4:15 pm Policy Implications of Hurricane Dean
Ms. Kim-Marie Spence Caribbean Policy Research Institute
4:15 – 4:30 pm
Hurricane Dean- Impacts and Issues in relation to coastal communities: Case of Portland Cottage and its environs
Dr. Balfour Spence and Miss Natainia Lummen Department of Geography & Geology (UWI)
4:30 – 4:45 pm
Comparative review of Hurricanes Ivan and Dean Professor Edward Robinson and Ms. Monique Johnson (MGU-
UWI)
4:45 – 5:00 pm
PARTICIPANTS REVIEW
Impact of Hurricanes on Jamaica's Coastline
Hurricane Dean Impact Assessment
Mona Visitor’s Lodge & Conference Center UWI, Mona Campus
November 6th, 2007

3
Appendix I
Provisional Coastal Hazard Maps generated for sections of the coastline not covered by the communities investigated
Appendix I a. Coastal hazard map of the Mosquito Cove to Sandy Bay section of the north coast base map sheet 21D of the 1:12,500 map series

4
Appendix I b. Coastal hazard map of the Boscobel, St. Mary area. Base map sheet 92A of the 1:12,500 map series.

5
Appendix I c. Coastal hazard map of the Browns Bay to Innes Bay section of the east coast base map sheet 135 C of the 1:12,500 map series