environmental cost of different unit rates941182/...a319 airbus-319 a320 airbus-320 a321 airbus-321...
TRANSCRIPT

Department of Science and Technology Institutionen för teknik och naturvetenskap Linköping University Linköpings universitet
gnipökrroN 47 106 nedewS ,gnipökrroN 47 106-ES
LiU-ITN-TEK-G--16/042--SE
Environmental cost ofdifferent unit rates
David Ngo
Frida Shamoun
2016-06-02

LiU-ITN-TEK-G--16/042--SE
Environmental cost ofdifferent unit rates
Examensarbete utfört i Logistikvid Tekniska högskolan vid
Linköpings universitet
David NgoFrida Shamoun
Handledare Tobias Andersson GranbergExaminator Valentin Polishchuk
Norrköping 2016-06-02

Upphovsrätt
Detta dokument hålls tillgängligt på Internet – eller dess framtida ersättare –under en längre tid från publiceringsdatum under förutsättning att inga extra-ordinära omständigheter uppstår.
Tillgång till dokumentet innebär tillstånd för var och en att läsa, ladda ner,skriva ut enstaka kopior för enskilt bruk och att använda det oförändrat förickekommersiell forskning och för undervisning. Överföring av upphovsrättenvid en senare tidpunkt kan inte upphäva detta tillstånd. All annan användning avdokumentet kräver upphovsmannens medgivande. För att garantera äktheten,säkerheten och tillgängligheten finns det lösningar av teknisk och administrativart.
Upphovsmannens ideella rätt innefattar rätt att bli nämnd som upphovsman iden omfattning som god sed kräver vid användning av dokumentet på ovanbeskrivna sätt samt skydd mot att dokumentet ändras eller presenteras i sådanform eller i sådant sammanhang som är kränkande för upphovsmannens litteräraeller konstnärliga anseende eller egenart.
För ytterligare information om Linköping University Electronic Press seförlagets hemsida http://www.ep.liu.se/
Copyright
The publishers will keep this document online on the Internet - or its possiblereplacement - for a considerable time from the date of publication barringexceptional circumstances.
The online availability of the document implies a permanent permission foranyone to read, to download, to print out single copies for your own use and touse it unchanged for any non-commercial research and educational purpose.Subsequent transfers of copyright cannot revoke this permission. All other usesof the document are conditional on the consent of the copyright owner. Thepublisher has taken technical and administrative measures to assure authenticity,security and accessibility.
According to intellectual property law the author has the right to bementioned when his/her work is accessed as described above and to be protectedagainst infringement.
For additional information about the Linköping University Electronic Pressand its procedures for publication and for assurance of document integrity,please refer to its WWW home page: http://www.ep.liu.se/
© David Ngo, Frida Shamoun
Abstract Flight planning is a large part of the air traffic operations that are presently being conducted. Airlines strive to achieve the cheapest and most cost effective routes for their flights, resulting in aircraft sometimes flying longer routes in order to avoid expensive airspaces with high unit rates. The unit rates among different European airspaces can differ significantly, even between neighboring states. This issue has been an ongoing obstacle for the Swedish air navigation provider, LFV, as some airlines tend to fly over the Baltic Sea, through the Baltic countries, instead of the shorter route through Swedish airspace. These protracted routes result in extra kilometers being flown yearly, consequently consuming extra fuel, as well as imply a revenue loss to LFV and Sweden.
Data of flight plans from 28th April 2014 to 3rd May 2014 have been collected and analyzed in conjuncture with literature and previous relevant studies. The study was further supplemented with data gathered through interviews with the Swedish Air Traffic Control Center at Stockholm Arlanda Airport, Scandinavian Airlines, Novair, and LFV.
The conclusions of this study is that the airspace dodging behavior generate a revenue loss to LFV, totaling approximately €じ 032 354 million per year. Should these flights fly the shortest route between their origin and destination, which would imply flying through Swedish airspace, the before mentioned sum would mean an increase in LFV’s reported revenue from air traffic control services by 2%. Airspace dodging also results in roughly 380 408 superfluous kilometers being flown and 1 874 486 liters of additional fuel being consumed every year.

Acknowledgment Firstly, we would like to thank our supervisor, Tobias Andersson Granberg, and our examiner, Valentin Polishchuk, for their invaluable support during this study, and their continuous encouragement throughout the entire Air Traffic and Logistics program at Linköping University.
Secondly, we would also like to express our gratitude towards Billy Josefsson, Patrik Bergviken, and LFV for the opportunity to conduct this study, their support and enthusiasm, as well as their kindness to share their vast web of contacts within the aviation industry. Likewise, much information would have been lost without the kindness of Thomas Jönsson, Johan Dahlström, Henrik Ekstrand, and Peter Sandgren, who shared their knowledge with us.
Thirdly, many thanks to Swedavia Customer Service at Stockholm Arlanda Airport for providing workspace and a bunch of encouragement.
Lastly, we would like to thank Iman Pereira for his constant encouragement and ability to lift everyone’s spirits in any situation. Also, this study would not have been possible without the expert aid in Excel and data processing from Christoffer Niklasson and Johnny Waldemarsson.

Table of contents 1. Introduction ............................................................................................................ 1
1.1. Background ..................................................................................................... 1
1.2. Purpose ............................................................................................................ 2
1.3. Delimitations ................................................................................................... 2
1.4. Report structure .............................................................................................. 2
2. Method Theory ....................................................................................................... 4
2.1. Quantative and qualitative data collection ................................................... 4
2.2. Literature study ............................................................................................... 4
2.3. Interviews ........................................................................................................ 4
2.3.1. Interview Medium and Execution ................................................................ 5
2.3.2. Sample Selection .......................................................................................... 6
2.4. Observation ..................................................................................................... 6
2.5. Break-Even Analysis ........................................................................................ 6
2.6. Method Implementation ................................................................................ 7
2.6.1. The Planning Phase ...................................................................................... 7
2.6.2. The Data Collection Phase ........................................................................... 8
2.6.3. The Analysis Phase ....................................................................................... 9
2.6.4. The Final Phase ............................................................................................ 9
3. Theoretical Frame of Reference ............................................................................ 11
3.1. Airspace Design .............................................................................................. 11
3.1.1. Area Navigation .......................................................................................... 11
3.1.2. Free Route Airspace .................................................................................... 12
3.2. Flight planning ............................................................................................... 13
3.2.1. Fuel Consumption ....................................................................................... 13
3.2.2. Route Charges and Unit Rates ................................................................... 14
3.3. Previous research ........................................................................................... 15
4. Description of the Current State ........................................................................... 17
4.1. LFV Air Navigation Services of Sweden ........................................................ 17
4.2. The Swedish Airspace ................................................................................... 18

4.3. Aviation Industry and Statistics ................................................................... 19
4.4. Interview with FMP Manager Thomas Jönsson ........................................... 19
4.4.1. Factors in Flight Planning .......................................................................... 20
4.4.2. Airspace Dodging ....................................................................................... 20
4.5. Interview with Scandinavian Airlines Pilot Johan Dahlström ..................... 21
4.5.1. Flight planning from a pilot’s perspective................................................... 21
4.5.2. Aircraft crew and Airspace dodging ........................................................... 22
4.6. Interview with Operations Center Manager Peter Sandgren ..................... 22
4.6.1. Flight Planning as a Charter Company ..................................................... 23
4.6.2. Incentive to Dodge ..................................................................................... 23
5. Results ................................................................................................................... 25
5.1. Data Processing ............................................................................................. 25
5.2. The Waypoints and Protracted Routes ........................................................ 26
5.3. Flights and Distances ..................................................................................... 31
5.4. Revenue Calculations .................................................................................... 34
5.5. Fuel Calculations ........................................................................................... 37
5.6. Break-even calculations ................................................................................ 38
6. Analysis ................................................................................................................. 42
6.1. The Revenue .................................................................................................. 42
6.2. The Fuel ......................................................................................................... 43
6.3. The Problem of Airspace Dodging ............................................................... 44
6.4. The Study ....................................................................................................... 45
6.5. Source discussion .......................................................................................... 46
7. Conclusion ............................................................................................................ 48
References ....................................................................................................................49
Appendix 1 ..................................................................................................................... 1
Interview with Thomas Jönsson – Stockholm Arlanda ATCC ................................. 1
Appendix 2 ..................................................................................................................... 3
Interview with Johan Dahlström – SAS pilot ............................................................ 3
Appendix 3 ..................................................................................................................... 5

Interview with Peter Sandgren – Operation Center Manager ................................. 5
Appendix 4 ..................................................................................................................... 6
Entry/exit points in Sweden ...................................................................................... 6
Entry/exit points in Denmark ................................................................................... 8
Appendix 5 ................................................................................................................... 10
International Waypoints ......................................................................................... 10
Table 1. Unit rates for May 2016 flights. ...................................................................... 15
Table 2. Waypoints of Interest. ................................................................................... 27
Table 3. Combinations Consisting of Waypoints. ....................................................... 28
Table 4. Protracted Routes. ......................................................................................... 29
Table 5. Flights of interest. .......................................................................................... 31
Table 6. Distance lost calculations. ............................................................................ 34
Table 7. Specifications for Airbus-319/320/321, Boeing-737-800, Embraer 170, and Embraer 190. ................................................................................................................ 36
Table 8. Route charges for an A320. ........................................................................... 39
Figure 1. Break-even diagram. ....................................................................................... 7
Figure 2. Waypoint symbols. ....................................................................................... 12
Figure 3. The Swedish and Danish FAB. .................................................................... 18
Figure 4. Jet fuel prices from 2009 – 2016. ................................................................. 19
Figure 5. Route alternatives for departing flights. ..................................................... 24
Figure 6. Waypoints in neighboring States................................................................ 26
Figure 7. Single-waypoint route [left], and Multi-waypoint route [right]................ 28
Figure 8. Flight route through Sweden. ..................................................................... 29
Figure 9. Southwest bound protracted route. ........................................................... 30
Figure 10. Northeast bound protracted route ............................................................ 30
Figure 11. Percentage Airline Distribution. ................................................................ 33
Figure 12. Aircraft model distribution. ....................................................................... 33
Figure 13. Protracted route [red] vs Swedish route [green]. ...................................... 39
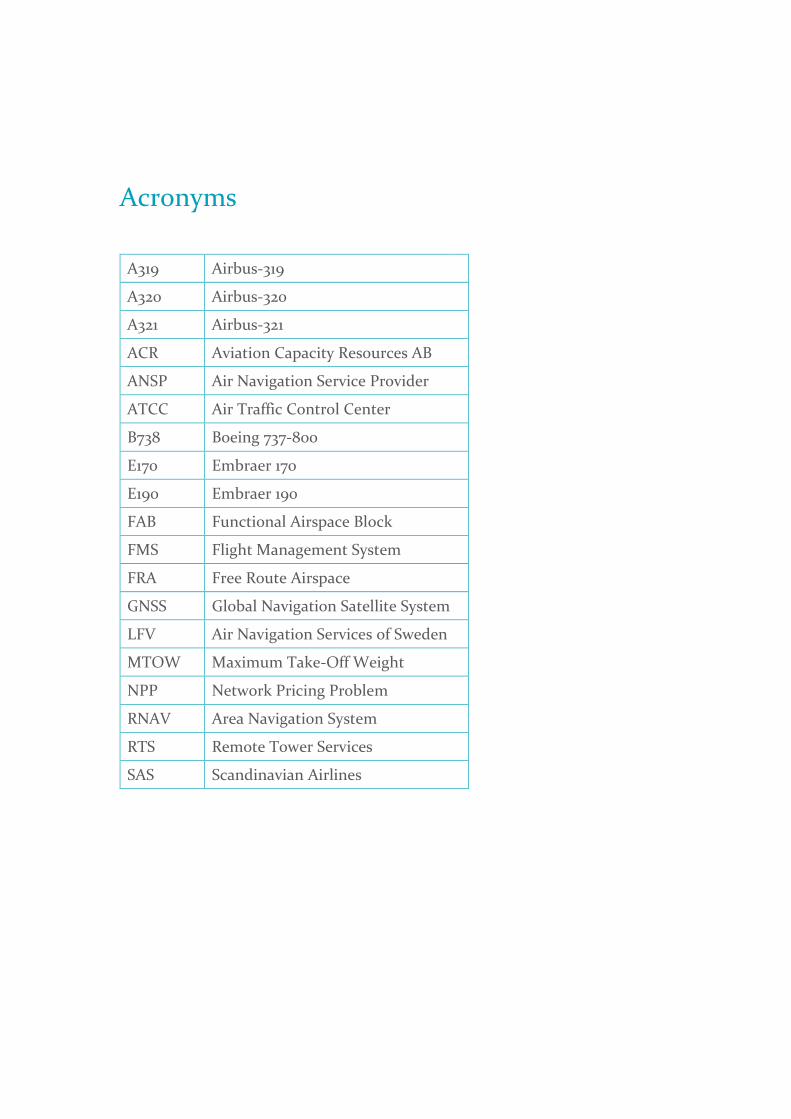
Acronyms
A319 Airbus-319
A320 Airbus-320
A321 Airbus-321
ACR Aviation Capacity Resources AB
ANSP Air Navigation Service Provider
ATCC Air Traffic Control Center
B738 Boeing 737-800
E170 Embraer 170
E190 Embraer 190
FAB Functional Airspace Block
FMS Flight Management System
FRA Free Route Airspace
GNSS Global Navigation Satellite System
LFV Air Navigation Services of Sweden
MTOW Maximum Take-Off Weight
NPP Network Pricing Problem
RNAV Area Navigation System
RTS Remote Tower Services
SAS Scandinavian Airlines

PAGE 1
1. Introduction Through the recent decades, globalization has brought the world together in such a way that it is now a part of the average person’s life. Air travel has developed from being a means of travel for the wealthy, to a plausible travel mode for both work and leisure. This has in turn resulted in a world where cultures, views, and prospects are not bound by borders (Al-Rodhan & Stoudmann, 2006).
Further, the development of aeronautical travel does not seem to diminish, rather the opposite, with statistics of passenger numbers increasing for each year. Although Europe may have one of the lowest regional growths, it still sees a steady increase in the number of passengers that travel within and across the European border. This steady increase in air traffic demand can partially be explained by higher living standards and lower consumer costs, in conjuncture with a broader selection and easier accessibility (IATA, 2014).
1.1. BACKGROUND
Along with the steady growth of the number of travelers who crosses nation borders, it has become an issue to maintain these borders within the European airspace. Each State has their own body of airspace which tend to follow the boundaries of each nation, within which it may provide, and charge a fee for, air traffic control services (EUROCONTROL e, n.d). As each State are themselves responsible to set a price for their services, unit rates, which regulates the air traffic service price, between different European States may differ greatly. These differences are mainly based on dissimilarities in a number of factors, such as economy, technology, and airspace (EUROCONTROL, 2014).
Although fuel costs, which are based in part on fuel consumption, may depend on factors such as wind conditions, it may not be the most important element when it comes to flight planning. Due to the States’ different unit rates, it may be of interest to commercial airlines to include other aspects, such as time and unit rates (EUROCONTROL, 2014), in order to reduce the company’s total cost, rather than focusing mainly on reducing fuel cost and consumption.
Presently, this results in airlines opting to plan for longer routes, in order to avoid traveling through airspace with high unit rates, rather than fly the shortest distance and reduce emissions. In addition to the environmental setbacks this implies, LFV Air Navigation Services of Sweden believe that revenue forego them, due to flight plans routing detour pathways in order to avoid Swedish airspace and its route charges. Moreover, airspace users are billed according to the flight plan filed with EUROCONTROL and not according to the actual flight path the billed aircraft ended up taking (EUROCONTROL c, n.d). Aircraft can therefore request

PAGE 2
to deviate from their original flight plan in mid-flight and take a shorter alternate route through a different airspace sector. While it would be environmentally beneficial for the air traffic service in said sector to accept such a request, it would not be economically, as charges would still be paid to the sector for which the flight was planned, and not the sector through which the aircraft deviated to.
In addition to ascertain the revenue loss which LFV may be facing, due to airlines flight planning routes around Swedish airspace, it may also be of interest, from an environmental standpoint, to determine the amount of extra fuel that is required to fly such protracted routes. As the world has grown to become more environmentally conscious, it may be of interest to some airlines as well to know how much extra emissions is actually dispersed and attempt to reduce this, if they wish to show their environmental commitment to the public.
1.2. PURPOSE
The purpose of this study is to calculate the lost revenue for LFV and extra fuel consumed when airlines plan a longer flight route to avoid airspace with high route charges instead of flying the shortest route. The results shall provide a depiction of the situation to LFV, who can then use the information to initiate or push for discussions regarding route charges in Europe.
1.3. DELIMITATIONS
This study will not take into account the extra fuel required to transport supplementary fuel. Thusly, this report will only present a minimum amount, and the actual amount should be estimated to be higher.
The data that has been studied is compiled of historical data from the dates 28th April to 3rd May of 2014. These dates are assumed to represent a normal period in air traffic, without significant abnormalities. The results presented in this report are therefore based on the assumption that the other days of the year do not deviate considerably from the dates which have been studied.
1.4. REPORT STRUCTURE
To accommodate an easier navigation for the reader to find the chapters which may be of interest, a short description of the remaining chapters has been compiled and listed below.
Chapter 2 - Method Theory This chapter highlights the theory regarding the methods used to collect data for the study, and how data collected in such a way can be interpreted. It also describes how the implementations of tasks were performed and the reasoning behind them. The chapter may be of relevance to readers who are not yet familiar

PAGE 3
with the methods implemented in this study or who are curious about how the different methods and tasks were executed.
Chapter 3 - Theoretical Frame of Reference This chapter outlines the theory behind different aspects regarding air traffic and flight planning. These include information in reference to airspace design, fuel consumption, unit rates, and other information regarding route planning for flights. The chapter introduces information that may clarify calculations and reasoning behind the conclusions of the study.
Chapter 4 - Description of the Current State This chapter illustrates the current situation of LFV and the air traffic services which the company provides. It further makes a short description of LFV’s financial situation, and how flights avoiding Swedish airspace poses a problem for both the company and the environment. The chapter provides the reader with information relevant to understanding the situation on which this study is based upon. The results of interviews or other research data that is generated specifically for this study is also presented in this chapter.
Chapter 5 - Results In this part of the report calculations, tables and numerical values are presented, and a detailed description of the calculation process is given. This chapter lays the groundwork upon which discussions and conclusions would later be based. The chapter may therefore be of interest to readers wishing to gain an insight in the calculations and data that contributed to the conclusions of this study.
Chapter 6 - Analysis This chapter discusses the results and the potential solutions to the problems that are addressed in the study. These are analyzed and compared to the theory that has been described in Chapter 3. Readers who are interested in examining the reasoning behind the conclusions made, are recommended to read this chapter.
Chapter 7 - Conclusion Lastly, the conclusions, results, and suggested recommendations are presented in this chapter. It may be of interest to readers who only wish to acquire a short summary of the conclusions made in this study.

PAGE 4
2. Method Theory
2.1. QUANTATIVE AND QUALITATIVE DATA COLLECTION
Studies can mainly be divided into two groups, quantitative and qualitative. The data that is collected for these studies can be sorted in a similar way. Data which include numerical values, or information that can be presented in a numerical or statistical way, can be classified as quantitative data (Justesen & Mik-Meyer, 2011). Methods which can be applied to gather such data may include surveys with grade answers, mathematical models or other analysis based on numerical characteristics (Björklund & Paulsson, 2012).
To gain a deeper understanding of the subject at hand, a qualitative data collection method may be more appropriate. These methods can be utilized to analyze situations or events, and can result in information which may be difficult to generalize, in comparison to quantitative data (Björklund & Paulsson, 2012). Qualitative data collection methods may include observations and interviews. However, performing an interview does not necessarily always generate qualitative results. Likewise, not all surveys generate quantitative results (Justesen & Mik-Meyer, 2011). What defines a study to be quantitative or qualitative is how the research has been conducted and how the data which is collected has been processed.
2.2. LITERATURE STUDY
A literature study is conducted in order to acquire a greater understanding of the problem at hand, as it may be of interest to build a base of knowledge regarding the subject of the study. A literature study can provide insight in the complexity of the subject, relevance, and present previous studies made by other researchers. These previous studies may then come to influence how the conducting study is viewed or executed.
Information generated through a literature study can also provide a base on which the study’s theoretical framework and method can stand. However, the literature is not limited to the study’s immediate subject, and can in some cases utilize theory from other fields and be applied to the specific study (Thorvald, 2015).
2.3. INTERVIEWS
Interviews can generally be categorized into three difference structures; structured, semi-structured, and unstructured. For a structured interview, all questions are prepared beforehand, and the person conducting the interview does not deviate from these, neither by wording nor by sequence. This may constrain the possibility to adapt to the situation, delve deeper into unexpected information

PAGE 5
that might arise, or the respondents’ potential to elaborate on his or her answers (Dalen, 2008).
The semi-structured interview is a looser version of the structured format. In this case, the interview can be prepared by deciding formulated questions or subjects. However, these questions and the sequence that they are asked, would be subject to change, should the questioner feel it appropriate. The questioner would also have the freedom to add additional, unprepared question, if the interview would happen to highlight different aspects which the questioner did not anticipate beforehand (Justesen & Mik-Meyer, 2011).
The last structure, or the lack thereof, is known as an unstructured interview. An interview conducted in this form emphasizes on dialog, the respondent’s experiences and opinions, and is often conducted without any questions being prepared ahead of time. Questions are instead based on the situation and the respondent’s reactions or previous answers (Björklund & Paulsson, 2012).
2.3.1. Interview Medium and Execution
Interviews can be conducted in multiple ways, for instance face to face, or through the aid of technologies, such as e-mail, mobile telephones, chat services, or Internet-based call services (Björklund & Paulsson, 2012). The choice of medium plays an important role in the information gained through an interview, as each medium has its own strengths and weaknesses, which can affect the results of an interview. A benefit of written or electronical interviews may include that the respondent does not have an immediate time pressure in which he or she must formulate and provide an answer. Furthermore, questioners conducting interviews face to face can affect respondents by interrupting, body language, or through hidden implications when speaking (Davidsson, 2009). A drawback, however, could be that the questioner would not be able to modify or rectify a question formulation, should the respondent misunderstand the written question. Nor would the questioner be able to ask follow-up questions to better understand an answer or continue on an unanticipated subject of relevance.
Additional aspects which are of significance is if the questioners choose to conduct the interviews with each person individually or in a group, and how the interview will be documented. The choice of documentation method can affect the way respondents choose to relay their answers, and thus influence the information gained from the interview and, consequently, the result of the study. Respondents may hold back or censure their answers when asked questions regarding sensitive subjects, if he or she feels uncomfortable that their answers are written down or that they are recorded whilst they speak (Ejvegård, 2009). The questioner can choose to not document or record during the actual interview, to reduce such effects, but would then run the risk of not remembering the interview in its
PAGE 6
entirety, remembering wrong, or emphasize different aspects than the respondent (Björklund & Paulsson, 2012).
To ensure that the study is as objective as possible, it is important for the questioner to be aware of how the questions are asked, as they might be leading or suggestive in an attempt to coerce the respondent to provide a specific answer (Ejvegård, 2009).
2.3.2. Sample Selection
Furthermore, to ensure the quality of the study, decisions should be made concerning the selection of people which should be questioned. The data collected through interviews may depend on who are questioned, how many people are questioned, and what criteria is for the respondents to qualify for the interview (Björklund & Paulsson, 2012). Answers which respondents give to a given question may depend on their personal experience, opinions, and observations. Additionally, age, political views, and socioeconomic conditions can affect how respondents interpret different subjects, situations, or questions. The goal of the sample selection is to gather information from a person or people that can reflect the diversity and opinions of a specific target group, relevant to the study.
2.4. OBSERVATION
Observation is a method of data collection which can be conducted through physical presence or through technological recording equipment, and is often used to get a better insight in certain processes or events (Björklund & Paulsson, 2012). The method does, however, require the observer to possess some level of competence within the field of study, in order to be able to identify relevant information that arises during the observation, and draw conclusions from it. Data gathered from merely one observation are, nevertheless, subject to chance, and conclusions drawn from the instance may be tainted by the observer’s bias. Observations should, therefore, be conducted on multiple occasions in order to reduce the effect of chance, and the possibility for the observer to influence the results through bias (Kylén, 2004). Another factor that needs to be taken into account is that the presence of observers may influence the behavior of the observed, thusly affecting the outcome of the results (Ejvegård, 2009).
2.5. BREAK-EVEN ANALYSIS
Within business economy, different analysis methods exist to determine the benefits of different options. Break-even analysis is used in situations where there are two different cost items, that are of interest to identify. These items can be divided into fixed costs and variable costs (Andersson, 2010). Cost is then put in relation to revenue as the quantity of each grows, which can be seen in Figure 1, in order to find the point where the total cost and revenue of a company meet,

PAGE 7
resulting in no monetary loss or gain (Austin & Boxerman, 1995). Results to the left of the break-even point in the diagram would amount to a financial loss. Likewise, results to the right of the break-even point would generate a financial gain for the company.
Figure 1. Break-even diagram.
2.6. METHOD IMPLEMENTATION
In order to apply structure to the work process, the study was divided into four phases; the planning phase, data collection phase, analysis phase, and lastly, the final phase.
The planning phase comprised of planning the preliminary structure of the report, revealing potential methods, delimitations, and literature that could be applied to this study. During the data collection phase, information was gathered through both web based and physically acquirable literature, as well as through interviews and contacts with access to sought data. In the analysis phase, the data which had been collected was sorted and processed, in order to generate results for the study. Lastly, during the final phase, the results were discussed in order to clarify the meaning of the different results, as well as what other factors may have affected the outcome.
2.6.1. The Planning Phase
The planning phase began with arranging a meeting with Patrik Bergviken, Process Manager for Air Traffic Management at LFV, to discuss what the study would entail. It was then decided that the study would involve the extra fuel associated with aircraft flying around Swedish airspace, instead of the shorter distance

PAGE 8
through it. A meeting with Billy Josefsson, Manager for Automation and Human Performance at LFV, was also held in order to discuss further goals and purposes for the study. From this interview, it was added that the study should include an aspect of the revenue loss for LFV, due to airspace dodging.
In preparation to both these meetings, a number of questions were composed to incite discussions leading to, and clarifying, the wishes and expectations that LFV would have on the study. The meetings were therefore of a nature akin to a semi-structured interview, allowing supplementary questions or non-scripted questions to be asked, should it have proven that a topic was necessary to be explained further, or if unanticipated topics arose. It also provided Bergviken and Josefsson the possibility to freely add their own opinions in regards to what they considered to be important aspects of the study. The interviews were conducted by two questioners, where one mainly documented the interview through written notes on a computer, while the other engaged in the conversation. Furthermore, the meetings provided a list of potential individuals that might prove to be of interest to contact, in order to retrieve information or data. These contacts all had some connection to the aviation industry, ranging from administrative personnel to pilots.
The planning phase also included a preliminary literary study with the aim to gain a better understanding of the common components of flight planning, and the Swedish and European airspace. Literature regarding general methods commonly used in studies was also sought after in this phase, thus providing options of methods which could be applied to this study.
2.6.2. The Data Collection Phase
In conjunction with the planning phase, a literature study was conducted in order to gather information regarding LFV, the different components of flight planning, airspace design and the Swedish airspace, and other aviation customs. The literature study was also conducted to perceive what has been done and results of similar research within the field of study. The literature used for this study was found by acquiring reports, articles, journals, or websites on the topic of the study, through Internet searches, most commonly using the Google or Google Scholar search engine, while information regarding research methods were found at the library of Linköping University.
During this phase, interviews were conducted with Thomas Jönsson, Flow Management Positions Manager at LFV, Johan Dahlström, pilot at SAS Scandinavian Airlines, and Peter Sandgren, Operations Center Manager at Novair. The interview with Jönsson was aimed at gathering information regarding flight planning and reasons to airspace dodging from a flow management perspective. The interview with Dahlström was executed with the similar goals as the interview with Jönsson, but rather focusing on a pilot and airline perspective. Sandgren was
PAGE 9
interviewed to ascertain information regarding how an airline would conduct their flight planning and what factors are important to them.
As with the previous interviews, these were also structured according to a semi-structured interview format, allowing the benefits as previously mentioned. These interviews were also conducted by two questioners, with the setup of one leading the interview while the other took notes on a computer, allowing both to concentrate on their designated tasks.
EUROCONTROL’s data regarding historical flight plans within European airspace was provided by Valentin Polishchuk, Associate Professor in the Department of Science and Technology at Linköping University. Further, Swedish waypoints were collected from LFV publications, and international waypoints were gathered from the navigation site OpenNav.
2.6.3. The Analysis Phase
To illustrate the positions of the waypoints that were gathered during the data collection phase, coordinates were entered to the geographical information system of Eniro. This allowed the waypoints to be numbered, facilitating the possibility to cross-reference with a list that was comprised in Microsoft Office Excel. Distances between waypoints were also measured using Eniro, and the results were listed in an Excel page, in order to be processed.
The calculations conducted in Excel were chosen to be based on the aircraft models which most commonly flew the protracted routes relevant to this study, as will be presented at a later point in Chapter 5.3. Based on the model performance specifications, as presented in Table 7, fuel differences between the shortest available flight path and the path around Swedish airspace is calculated, as well as route charges. This was then used to estimate the extra fuel cost and extra time associated with flying around the Swedish airspace.
Utilizing Excel, the flight plans were then filtered to only include flights which may be of interest to this study. Such flights would include aircraft flying along the border of, but not enter, the Swedish airspace, most commonly in a northeast or southwest trajectory. It could also include flights entering the Swedish airspace only for a short distance. These flights were then drawn in Eniro to illustrate the path taken, and compare it to the path which it could have been chosen instead. The filtered data was then used to provide statistical information regarding how common the occurrence of airspace dodging is, and use this as a basis of revenue lost.
2.6.4. The Final Phase
During the final phase, comparisons of the results generated through the analysis phase, the literature, and theoretical frame of reference was conducted.

PAGE 10
Discussions regarding environmental and ethical aspects of the results were also highlighted during this phase, as well as possible factors which may have affected the results in some way.
PAGE 11
3. Theoretical Frame of Reference
3.1. AIRSPACE DESIGN
Much like ground based traffic, air traffic is also based on predetermined routes according to which aircraft flies. As airspace tend to follow national borders, it is natural that a country chooses to design the air traffic organization in their own way. Although some standards must be established in order to ensure aviation safety, all countries are not unanimous in what constitutes as an efficient and flexible airspace structure (EUROCONTROL k, n.d). The following subchapters will describe a couple of the airspace designs that are currently utilized within European airspace.
3.1.1. Area Navigation
Area navigation utilizes waypoints when routing air traffic. Aircraft plan the route of their flight according to a series of waypoints, which are points with fixed coordinates, and are sequenced in a specific combination in order to describe the desired flight path. This sequence of waypoints is loaded into the flight management system, FMS, of the aircraft (EUROCONTROL g, n.d) after the flight plan has been approved by EUROCONTROL. The area navigation system, also known as RNAV, includes a diverse array of constrains regarding the speed and altitude when crossing these waypoints. These constraints are programmed into the navigation database of the aircraft prior to its departure (EUROCONTROL h, n.d).
The waypoints which the RNAV system utilizes are described as a code combination comprised of a series of letters. Although it might at times be complicated, these letter combinations are most commonly possible to pronounce as one word (Christopher, Pruchnicki, Burian, & Cotton, 2014). An example of this is the waypoint TALEK, located north of Stockholm (LFV, 2010). This sets it apart from Navigation Reference System, NRS, which is comprised of both letters and digits. Consequently, pronouncing NRS combinations could be found rather challenging, and they are therefore read as each character separately (Christopher, Pruchnicki, Burian, & Cotton, 2014). Thusly, the waypoint SA863, which is also located in proximity to Stockholm, would read as sierra-alpha-eight-six-three.
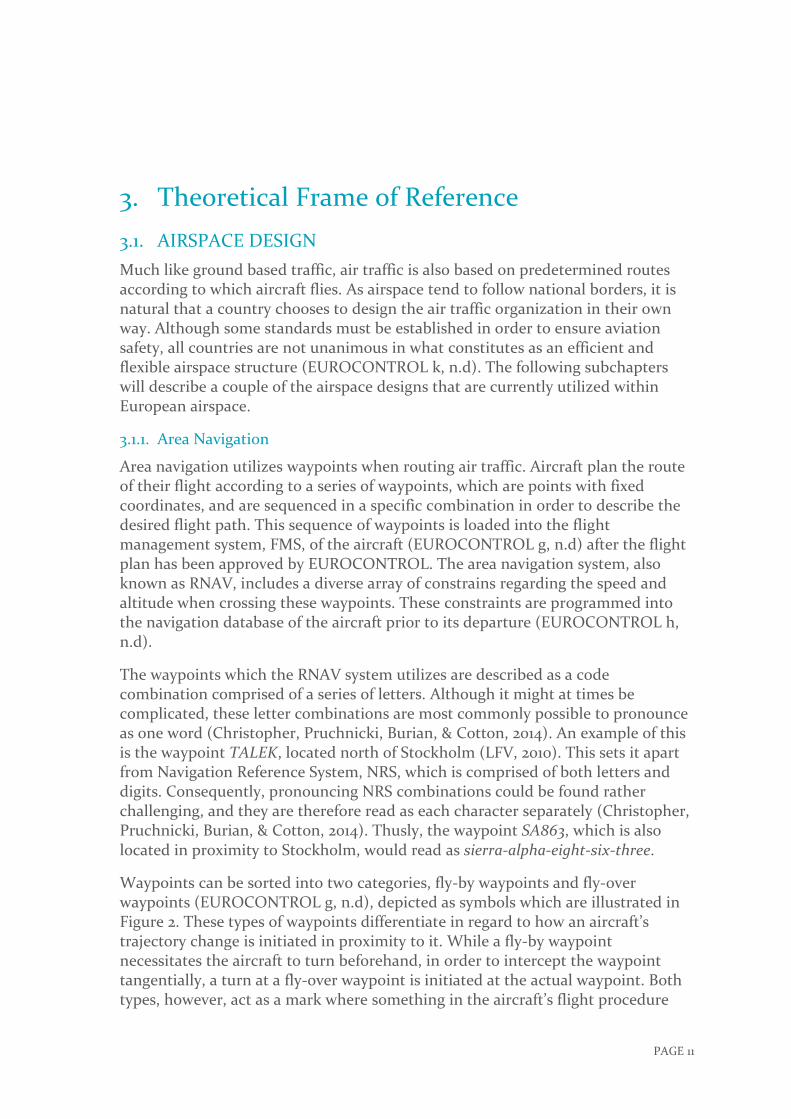
Waypoints can be sorted into two categories, fly-by waypoints and fly-over waypoints (EUROCONTROL g, n.d), depicted as symbols which are illustrated in Figure 2. These types of waypoints differentiate in regard to how an aircraft’s trajectory change is initiated in proximity to it. While a fly-by waypoint necessitates the aircraft to turn beforehand, in order to intercept the waypoint tangentially, a turn at a fly-over waypoint is initiated at the actual waypoint. Both types, however, act as a mark where something in the aircraft’s flight procedure

PAGE 12
changes, may it be the route segment at which the aircraft travels, or altitude. Waypoints are therefore most commonly located at points where the trajectory of a route changes, speed or altitude restrictions may be in effect, alternatively, cease to be in effect, and positions where aircraft can be placed in a holding state, as well as locations where registered routes end (Åkerlind & Örtlund, 2011).
Figure 2. Waypoint symbols.
RNAV is based on Global Navigation Satellite System, GNSS, a type of navigation system that provides an aircraft with positioning data through the use of satellites. As certain areas are restricted in the sense that aircraft may not descend below a certain altitude, it is important to take into consideration that there may be a difference between a desired position of an aircraft, which is described through a flight plan, and the actual position of said aircraft. This difference in flight path is taken into consideration by the RNAV system, which would only tolerate a fixed amount of deviation (Åkerlind & Örtlund, 2011).
3.1.2. Free Route Airspace
Free route airspace is defined as airspace within which aircraft may plan their routes freely, given it has specified an entry and an exit points for the airspace sector. While aircraft may still route themselves according to waypoints, as in the case of area navigation, this is not a requirement when navigating through this type of airspace. However, aircraft are still subjected to, and are expected to follow instructions from, the local air traffic control responsible for air traffic control services in the sector (NEFAB, n.d).
Nevertheless, free route airspace does not necessarily mean that all the airspace within a sector is without restrictions. In addition to constraints regarding given entry and exit points, aircraft navigating through the sector must comply with avoiding danger areas or other restricted areas, may they be permanent or temporary. In order to aid aircraft avoid such areas, air traffic control can choose to direct flights to existing waypoints, or a location of no previous notability described by coordinates (SKYbrary, 2015).
As an effect of free route airspace, most airlines are able to plan their routes to be the shortest distance between the desired entry point and exit point of a sector.

PAGE 13
Thusly, benefits of the airspace structure may include reduced flight time, lower emissions, and reduced fuel consumption (EUROCONTROL f, u.d.)
On the other hand, since aircraft within the airspace sector would not be following predetermined airways, it is possible that it would be more difficult for air traffic control to detect and assess potential conflicts. It may also ensue separation problems, due to the aircraft flying direct routes, and require a higher level of cooperation and attentiveness from air traffic controllers (SKYbrary, 2015).
3.2. FLIGHT PLANNING
To allow flights to conduct their operations within European airspace, a flight plan is required to be issued by an airline dispatcher or pilot, and be registered at EUROCONTROL’s Network Manager Operations Centre (EUROCONTROL a, n.d). This plan includes information regarding the intended flight path, such as the point of departure, destination, travel distance and direction, altitude, and speed. Information regarding the aircraft’s fuel capacity, weight, and other specifics for the aircraft model and airworthiness must also be included (Sabre Airlines Solutions, n.d).
The resulting plan presents a number of potential flight paths, which are described in the form of waypoints and airways listed in a specific arrangement. When details of the flight path have been set, calculations of the flight’s fuel consumption can be made for each of the potential flight paths (Zhang, Kamgarpour, Sun, & Tomlin, 2011).
While the before mentioned factors constitute the bare essentials for a flight plan, most airlines wish to reduce their overall costs by optimization. These optimization problems additionally need to take into account restrictions such as those posed by air traffic control or other regulations, and weather conditions (Altus, 2009).
3.2.1. Fuel Consumption
Other than for environmental issues, fuel consumption has become a point of interest for most parties within aviation and flight planning, in part due to increased fuel prices (Johns & Khan, 2009). An aircraft’s fuel consumption depends on a few factors, which primarily include route length and flight altitude, as well as aircraft weight, travel speed, and the aerodynamic resistance of the aircraft model (Sabre Airlines Solutions, n.d). For passenger aircraft, aspects such as cabin design and passenger allocation may also pose as relevant factors, due to weight distributions (Peeters, Middel, & Hoolhorst, 2005).
As weight presents itself as a major factor when regarding fuel consumption, a common method to reduce fuel consumption has been to reduce the weight of the aircraft. Although weight reduction can be obtained by removing gratuitous items

PAGE 14
or converting manuals into a digital format, the bulk of the excessive weight lies in the fuel that is required to firstly sustain the aircraft from its origin to its destination, and secondly to act as a reserve for deviations from the flight plan. Furthermore, extra fuel on its own requires an additional amount of fuel to transport (Sabre Airlines Solutions, n.d).
3.2.2. Route Charges and Unit Rates
When planning routes for flights, an essential factor to take into consideration is the cost for air traffic management service in each sector through which the flight plan is routed. The charges for these services are based on the State’s air traffic management costs, which may differ from State to State, and includes expenses for staff, infrastructure, and other operations (EUROCONTROL b, n.d). The route charges are calculated by utilizing an equation based on three variables, distance, weight, and unit rate. Aircraft in the exclusive use of Monarchs, Government Officials, or authorized search and rescue operations are, however, absolved from such a fee. To calculate a flight’s total route charge, the individual charges for each charging zone through which the aircraft is flight planned to travel is summated, described as followed, where R is the total sum of the individual charges, ri, and i represents a charging zone, e.g. a State (EUROCONTROL c, n.d). 迎 = ∑ 堅��
The formula to calculate the individual charges for each zone, as mentioned previously, is the product of multiplying factors for distance (di) measured as a hundredth of the distance in kilometers, weight (p) in metric tons, and unit rate (ti), and is defined as follows (EUROCONTROL c, n.d): 堅� = 穴� × 喧 × 建� Additionally, the weight factor has its own mathematical formula on which it is based on, and takes into account the maximum take-off weight, MTOW, for the aircraft of interest. This results in the following equation (EUROCONTROL c, n.d):
喧 = √警劇��のど
In Sweden, as in all contracting States, route charges are debited for aircraft exceeding 2 000 kilograms. These route charges are intended to cover the costs for the services provided by the Swedish Transport Agency, LFV, and Sweden’s EUROCONTROL membership fee. As of 2008, these charges would also come to include costs for air traffic control service equipment at airports. Other services which are also comprised in the route charge are flight calls, search and rescue,

PAGE 15
metrological services, and aeronautical information services. (Transportstyrelsen, n.d).
Unit rates are established by each contracting State individually, and is also known as a basic unit rate. This basic unit rate, which must be approved by EUROCONTROL, is described in euro, and is subject to change at the beginning of every new calendar year. However, States which do not wield euro as their national currency, have their unit rates adjusted monthly in order to keep up with shifting exchange rates (EUROCONTROL d, n.d). Flights flown in May 2016 were subjected to the following unit rates in Sweden and its neighboring countries, presented in Table 1.
Table 1. Unit rates for May 2016 flights (EUROCONTROL d, n.d).
Zone Unit Rate
Sweden € 63.02
Norway € 41.05
Denmark € 61.91
Finland € 56.32
Estonia € 31.10*
Latvia € 27.40
Lithuania € 44.99
Poland € 33.84
Germany € 82.68
Russian Federation
(MTOW = 51 – 100 tons)
$ 85.7**
≈
€ ずす.39***
*from 2015, (Lennuliiklusteeninduse AS, 2014). ** from 2010, (ICAO, 2010), newer version is purchasable. ***exchange rate 2016-05-19, (Google, 2016).
3.3. PREVIOUS RESEARCH
Maximizing revenue is a point of interest for most companies, and the aviation industry is no exception. Unit rates, being part of the total route cost, have been a topic of some research focusing on revenue, trade-offs, route planning, and environmental issues.

PAGE 16
A study conducted by Castelli, Labbé, and Violin (2012) studied the revenue of Air Navigation Service Providers, ANSP, and how they are affected by high route charges. The study utilized a mathematical algorithm and hierarchical optimization problem to maximize the revenue for a specific ANSP. The optimization method used was a Network Pricing Problem, NPP, where a set of arcs, each assigned certain costs. It is of interest to the owners of this network to maximize the revenue gained from these arcs, while the users of the network are keen to minimize their expenses for their path. According to NPP, the network owners are in control of how the users proceed through the network, as their chosen paths and behavior are in relation to the costs of the arcs (Castelli, Labbé, & Violin, 2013). Castelli, Labbé, and Violin, however, chose to exclude factors such as crew costs for flights, aircraft maintenance, and fuel cost. Instead, they focused on aircraft weight, maximum take-off weight, MTOW, cruise speed, and the distance flown between points within a given airspace. They concluded that unit rates had an effect on air traffic, and saw a correlation of airspace with high unit rates generating less traffic. Thusly, it is determined that unit rates have an effect on the revenue of an ANSP, due to the amount of traffic the unit rate may attract or deter.
Another study, made by Delgado, examined how route charges affected the behavior and route planning of different airlines. This study was also interested in the habit of airlines planning routes around airspace, which held higher unit rates, opting for a longer route through low-cost airspaces instead, if it resulted in a lower total cost for the airline. Delgado studied a set of routes, and compared them to the shortest possible route, focusing on how the differences effected the route charges and fuel consumption. The study focused only on commercial flights flying on 12th September 2014, and concluded that 16.6% of the flights on the given day chose another route other than the shortest route which the study had specified (Delgado, 2015). This is similar to what is addressed in this study, with the exception that this study focuses on flights around Swedish airspace, as well as delimitating in regards to aircraft size, rather than differentiating commercial and non-commercial flights. Furthermore, this study is based on data collected from 6 days in April and May, rather than one day in September.
Reynolds et al. also studied the environmental impacts of airline routes. The study compared the air navigation service charges and fuel costs to the emission of carbon dioxide. EUROCONTROL’s formula for calculating route charges was used, and the study concluded that an airline’s ideal route may differ from airline to airline, and include factors such as weather and wind, in addition to the air navigation and fuel costs (Reynolds, Budd, Gilingwater, & Caves, 2009).

PAGE 17
4. Description of the Current State
4.1. LFV AIR NAVIGATION SERVICES OF SWEDEN
LFV is the Swedish provider of commercial air traffic services within the Swedish airspace, and since 1978 has also been responsible for the military air traffic (LFV, n.d). LFV is also conducting research aiming to improve the current state of air traffic services and management. These improvements range from refining safety, efficiency, and capacity, to environmental issues due to aviation.
Some of the projects which LFV are involved in include the EUROCONTROL lead project program Single European Sky ATM Research, SESAR, which aims to reconstruct the European airspace into blocks based on traffic flow instead of national borders. The project was conceived to address the increasing air traffic, and to improve aviation as a whole, both financially and operationally (EUROCONTROL i, n.d). LFV has also been a forerunner when researching the utilization of Remote Tower Services, RTS. The idea is based on being able to conduct air traffic tower services from a different location than the area in which the service is actually provided. The hope is that, through these services, be able to provide cost-efficient air traffic services, especially for airports with a generally low amount of traffic, and enable an increased flexibility to tower operations (LFV a, n.d).
LFV is currently an enterprise consisting of approximately 1 200 employees (LFV b, n.d), responsible for airports and two control centers across Sweden, and also provide air traffic services to 5 airports in the United Arab Emirates since 2013 (LFV c, n.d). The number of airports in control of LFV are seeing a dwindling trend, due to the competing air traffic service provider Aviation Capacity Resources AB, ACR, which were introduced to the market in 2010. In 2016, ACR laid claim to two additional airport towers previously controlled by LFV, Borlänge and Gällivare, totaling ACR’s tower count to ごし, and subsequently reducing LFV’s tower count to 22 (ACR, n.d). During the year of 2015, LFV air navigation operations increased by around 1% from the previous year, resulting in approximately 712 000 flights within Swedish airspace handled by the air navigation provider over the course of the year (LFV, 2016).
Financially, LFV’s revenue at the end of 2014 amounted to 3.36 billion Swedish crowns (LFV, 2015), converting to approximately €358.1 million, using the exchange rate of 9.393 that was current on the 31st December 2014 (European Central Bank, n.d). The air traffic amounted to 2.465 billion Swedish crowns, comprising roughly 73% of the total revenue. The Swedish unit rate was, however, lowered at the beginning of 2015, due to economy, exchange rates, and reduced costs in the Swedish aviation industry. Nevertheless, in spite of the lowered charges, LFV saw an increase by 1.6% in their revenue for the first quarter of 2015, compared to the
PAGE 18
previous year. This was credited, partially, to an increase in the distance flown by flights in Swedish airspace, as well as the aircraft being heavier (LFV, 2015).
4.2. THE SWEDISH AIRSPACE
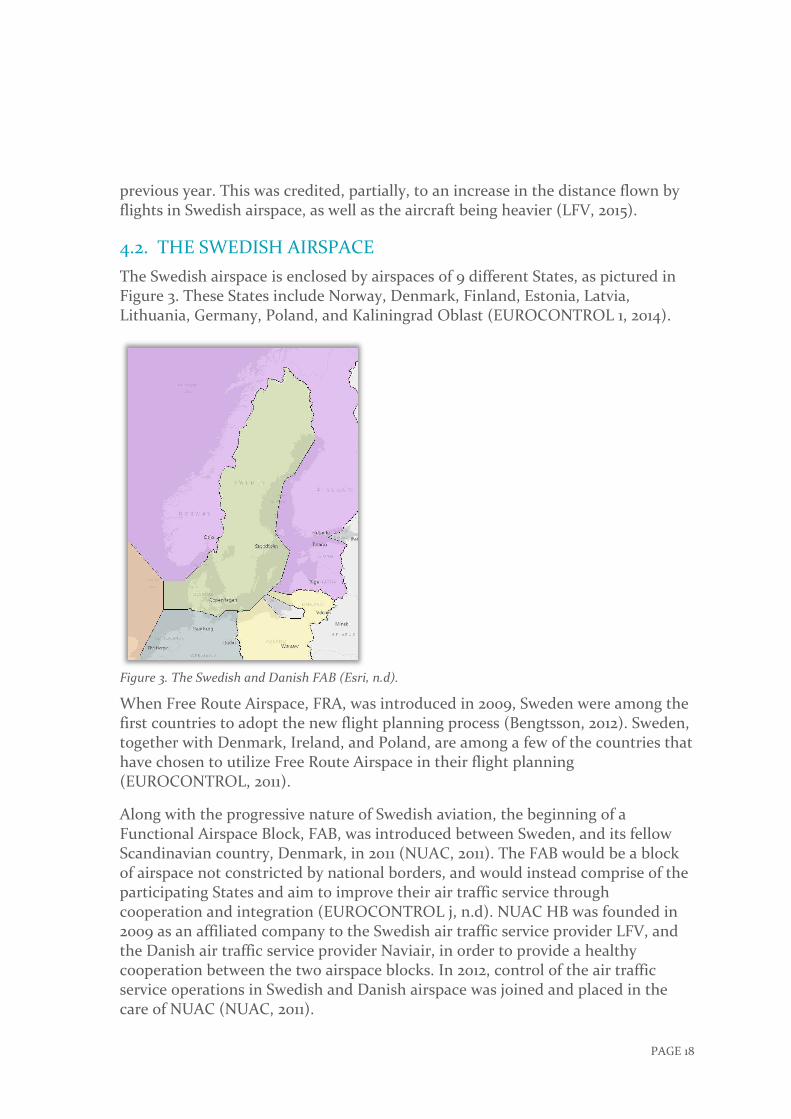
The Swedish airspace is enclosed by airspaces of 9 different States, as pictured in Figure 3. These States include Norway, Denmark, Finland, Estonia, Latvia, Lithuania, Germany, Poland, and Kaliningrad Oblast (EUROCONTROL 1, 2014).
Figure 3. The Swedish and Danish FAB (Esri, n.d).
When Free Route Airspace, FRA, was introduced in 2009, Sweden were among the first countries to adopt the new flight planning process (Bengtsson, 2012). Sweden, together with Denmark, Ireland, and Poland, are among a few of the countries that have chosen to utilize Free Route Airspace in their flight planning (EUROCONTROL, 2011).
Along with the progressive nature of Swedish aviation, the beginning of a Functional Airspace Block, FAB, was introduced between Sweden, and its fellow Scandinavian country, Denmark, in 2011 (NUAC, 2011). The FAB would be a block of airspace not constricted by national borders, and would instead comprise of the participating States and aim to improve their air traffic service through cooperation and integration (EUROCONTROL j, n.d). NUAC HB was founded in 2009 as an affiliated company to the Swedish air traffic service provider LFV, and the Danish air traffic service provider Naviair, in order to provide a healthy cooperation between the two airspace blocks. In 2012, control of the air traffic service operations in Swedish and Danish airspace was joined and placed in the care of NUAC (NUAC, 2011).

PAGE 19
4.3. AVIATION INDUSTRY AND STATISTICS
As of 2013, the commercial air travel most commonly consists of either Airbus or Boeing aircraft models, with the ten most commonly sold aircraft for commercial use being two Airbus models and eight Boeing models (Said, 2013). Factors which make these models appealing to airline companies include the aircraft’s fuel efficiency, combined with the maximum capacity of passengers.
The number of flight with European origin have increased by 3% compared to the previous year, with the biggest contributors to the growth being Turkey, the United Kingdom, and Spain. Additionally, European ticket prices has seen a 5.4% decrease, continuing the declining trend from previous year (EUROCONTROL, 2016).
The price for aircraft fuel may vary from month to month, and has in recent years seen a decrease, as illustrated in Figure 4.
Figure 4. Jet fuel prices from 2009 – 2016 (IATA, n.d).
However, prices have seen a slight increase since the beginning of 2016, resulting in jet fuel costing $55.3 per barrel in May of 2016 (IATA, n.d). With $ご equal €こ.せぜぜ during the same month (X-Rates, 2016), this roughly translates to €しぜ.ずご per barrel, or €こ.しさ per liter.
4.4. INTERVIEW WITH FMP MANAGER THOMAS JÖNSSON
Thomas Jönsson is employed by LFV and works as manager for Flow Management Positions (FMP) at the Air Traffic Control Center (ATCC) in Stockholm. The interview was conducted on Wednesday, the 22nd of March, 2016, at the ATCC in

PAGE 20
Stockholm. This chapter will cover a summary of the interview, while a version comprised of the questions asked can be found in Appendix 1.
4.4.1. Factors in Flight Planning
According to Jönsson, cost is the only priority for airlines, and nothing else. The first thing that comes to mind when mentioning factors that are taken into account, however, when flight planning is the route charges. Secondly is the fuel costs, which he states constitutes the bulk of the flight expenses. While wind normally has a significant role in fuel consumption calculations, Jönsson assesses it not to play an important role in flight plans through Swedish airspace specifically, but do affect the angle at which the aircraft approaches the Swedish sector. However, the reason for this prioritization is due to the low fuel price the aviation industry is currently experiencing. Saving fuel and putting effort into green flights were more important historically, when the fuel price was high, but with the descending prices, fuel has become less and less of a factor when planning flights. However, it is most likely that fuel prices will rise again.
Flight planning is, however, also subject to constraints, such as restricted airspace and runways in use. Specific flights can also be subject to restrictions and prioritizations, where some flight may be more important to an airline than others. An example that was given was Finnair’s flights to Helsinki. As most of Finnair’s outgoing flights origin from Helsinki, it is important to have the inbound flights arrive on time, consequently avoiding passengers missing their connecting flights to other destinations.
An additional factor that was highlighted during the interview was the political aspect of flight planning. Due to aviation being a widely international operation, it is natural that nations’ political relations with each other will reflect on how air traffic management is handled. Politics could therefore result in flight plans being routed to avoid certain nations or airspace. Some nations have also established complicated administrative processes, resulting in some airlines possibly choosing to avoid such a nation’s airspace. An example of this is Kaliningrad Oblast, a federal subject of Russia located along the coast of the Baltic Sea, between Lithuania and Poland. Jönsson specifies Kaliningrad Oblast as peculiar in regards to flight planning, as the region’s air traffic control service, among other administrative complications, requests passport information of the passengers travelling through their airspace. Russia also tend to avoid Turkish airspace for political reasons, and sections of Ukrainian airspace is likewise restricted.
4.4.2. Airspace Dodging
As cost is the major factor when it comes to route planning, airlines have been known to route flight plans past airspace with high unit rates, thus resulting in a longer distance travelled. Jönsson confirms that such tactics were a problem a
PAGE 21
couple of years ago, and some cases were noticeably obvious in what the airlines were doing and why. He also states that the Swedish climate does not generate any significant weather conditions that would justify airlines flight planning around Swedish airspace. In recent years, however, the reduction of the Swedish unit rate has resulted in this occurrence not transpiring as often as before.
Historically, LFV has also had problem with airlines flight planning around Sweden, but that would later request passage through Swedish airspace in mid-flight. As airlines are billed according to their last filed flight plan, this would result in Swedish air traffic control providing their services but not be paid for it. This occurrence has also seen a downward trend, most likely due to the reduced unit rate, and LFV being stricter with not allowing flight to shortcut through their airspace without flight planning for it.
However, Jönsson still sees airspace dodging due to unit rate differences being a problem. In addition to being environmentally damaging, it also poses a problem for the nations’ that have a low unit rate. As most airlines wish to travel through the cheapest airspace, said airspace tend to become overcrowded and air traffic control of the region may have a hard time meeting demands, resulting in delays in the sector.
4.5. INTERVIEW WITH SCANDINAVIAN AIRLINES PILOT JOHAN DAHLSTRÖM
Johan Dahlström is employed by SAS, Scandinavian Airlines, and has worked as a pilot since 1986. He has also previously worked for Singapore Airlines for approximately 3.5 years before coming to SAS. The interview was conducted on Tuesday, the 5th of April, 2016, at Stockholm Arlanda Airport. This chapter will cover a summary of the interview, while the questions asked can be found in Appendix 2.
4.5.1. Flight planning from a pilot’s perspective
According to Dahlström, the flight planning of SAS flights is conducted in Copenhagen by a dedicated team of expert flight planners. Therefore, pilots do not tend to question the route that has been provided to them by the Copenhagen flight planners, as they possess information and take factors into account that pilots are not aware of. However, flight plans are drawn to be as financially beneficial as possible by reducing costs. An example of airspace which is inclined to be avoided due to high unit rates is airspace controlled by Scotland.
While unit rates are a major factor in the planning process, other factors, such as slot times and delays, also play an important role. Delays may cause the company to be liable to financially compensate passengers, and provide food, drinks, and, in some cases, a place to spend the night. Additionally, it may cause complications

PAGE 22
with aviation regulations, as pilots and cabin crew are not permitted to work too many hours without sufficient rest in between. Late-arriving crew may be restricted from flying their next immediate flight, due to mandatory breaks, thus resulting in extra expenses as the company has to provide and pay for crew lodging as well.
Pilots do not tend to change the flight plan that has been suggested to them. They can, however, adjust the amount of fuel that has been specified in their flight plan documents, and add alternative airports at which the aircraft can land, should any complications at its original destination arise. The fuel amount can either be increased or decreased, depending on the present flight conditions, and the pilot’s wishes.
Furthermore, Dahlström states that he always tried to fly the shortest route, without regard to monetary consequences, which is not uncommon among his fellow pilots. Should one route prove to result in a shorter travel distance and travel time, a pilot may request entry to a different airspace than in which it was originally flight planed. When pilots do this, they are usually oblivious to the different unit rates for each specific country. European air traffic services tend to allow this with a rate of approximately 70% – 80%, and is a fairly easy process. This practice is, however, not conducted with countries outside of Europe.
4.5.2. Aircraft crew and Airspace dodging
SAS pilots, like the majority of other pilots, are payed a fixed monthly salary which is not affected by the number of shifts they work. Pilots do therefore not dodge certain airspace for financial savings, but rather in an attempt to make the overall flight easier. Such areas may include northern Norway, due to a rich mountain landscape, and some southern European countries, due to language difficulties. Naturally, airspace containing hazardous weather are avoided, regardless of cost.
While the pilots may enjoy a fixed monthly salary, some cabin crew do not enjoy such benefits. Dahlström says that SAS implemented an hour-based salary for its cabin crew somewhere between 3 – 4 years ago. This system is, however, not a new idea, and other airlines have implemented and used such a payment system far earlier than SAS. Nevertheless, SAS cabin crew, and cabin crew in general, are not paid less should a flight take a shorter amount of time than expected. The contrary would, on the other hand, prove to be true, where a longer travel time would result in the cabin crew being paid for overtime.
4.6. INTERVIEW WITH OPERATIONS CENTER MANAGER PETER SANDGREN
Peter Sandgren is employed by Novair, and has worked as Operation Center Manager since 2000. His tasks include planning and controlling the positions and

PAGE 23
movements of staff and aircraft, as well as analyzing the air traffic situation of the week, and draw flight plans for the company’s flights. The interview was conducted on Thursday, the 28th of April, 2016, at the Headquarters of Novair in Stockholm. This chapter will cover a summary of the interview, while the questions asked can be found in Appendix 3.
4.6.1. Flight Planning as a Charter Company
According to Sandgren, the flight planning of Novair strives to optimize their routes, foremost, in regards to costs. As a smaller airline, mainly flying charter flights from Sweden, Novair does not own their own fleet. The company currently holds one aircraft, an Airbus321, under their name. Other aircraft that may be required for the company’s operations are leased. The main cost items for Novair are thusly fuel, leasing and associated costs, route costs, and aircraft staff.
With costs as their primary interest, Novair always chooses the route that is the most financially beneficial. This is mostly shown in their route planning, where the route generating the cheapest overall cost is often the one chosen, even though it may result in a longer distance flown. Unlike regular airlines, such as SAS in the previous chapter, Novair does not have to regard time as a major planning factor. As the company deals with charter flights, it does not have to accommodate passengers with connecting flights, and the associated costs in regards to delayed flights. According to current regulations, compensation towards passengers is only required after a delay of at least 3 hours. This allows the company to fly longer routes without a large consideration to the time aspect, should the route prove to generate the lowest overall cost and result in a delay less than 3 hours. They are, however, not exempt from other regular constraints such as hazardous weather conditions or localized disturbances in the form of strikes or other irregularities.
As in the case of SAS, Novair’s pilots do not tend to change their assigned flight plan in mid-air. Changes might occur occasionally, and is then often due to known turbulence or other weather conditions in an area, but these deviations are usually so small that they rarely appear in the flight plans. Additionally, Novair also avoid flying through airspace belonging to Kaliningrad Oblast, due to the additional costs and administrational posts associated with flying through Russian airspace.
4.6.2. Incentive to Dodge
Most of Novair’s flights depart from Stockholm Arlanda Airport, and include destinations such as the Canary Islands, Greece, and Turkey. While flights bound for the Canary Islands tend to fly through Sweden, heading west, the southern destinations Greece and Turkey generates a different picture. According to Sandgren, LFV has set certain rules regarding departing and arriving flights around the airport to the capital, in order to maintain sufficient distance between aircraft around the airport airspace. These regulations resulted in a landing route through

PAGE 24
the waypoint TROSA for flights arriving from the south, but do no longer pose as an option for Novair flights departing from Arlanda. Departing Novair flights heading for southern destinations, such as Greece and Turkey, are instead recommended to fly through a waypoint located northeast of the airport, close to the airspace border, as seen as the grey route to the right in Figure 5. The location of this waypoint enables easy access to the airspaces of Estonia, Latvia, and Lithuania. Exiting the Swedish airspace also provides a natural path around Kaliningrad Oblast, and into airspace belonging to Poland or Belarus, both of which are regarded as very cheap airspaces, in order to continue further south.
Figure 5. Route alternatives for departing flights (Sandgren, 2016).
Sandgren means that due to these regulations, airlines are more inclined to leave Swedish airspace and enter Baltic airspace prematurely, instead of making the left turn in order stay in Sweden, represented by the blue route in Figure 5. According to Sandgren, this route would result in 2 additional minutes and more fuel to fly. He speculates that LFV would retain a larger amount of southbound flights from Stockholm Arlanda Airport within Swedish airspace, if the middle departure route south of the airport was a more commonly used option.

PAGE 25
5. Results
5.1. DATA PROCESSING
In order to analyze the flights that bypass Swedish airspace, a list of entry and exit points to the Swedish-Danish FAB has been documented, see Appendix 4, along with waypoints in Estonia, Latvia, Lithuania, and Poland, located around the south-eastern border of the Swedish airspace, see Appendix 5.
The EUROCONTROL data regarding flight plans in European airspace that has been studied ranged from 28th April 2014 to 3rd May 2014. These were received in .SO6.7z-files, but converted to txt-files in order to enable processing in Excel. The txt-files were, however, too large for Excel to handle, as they exceeded the maximum amount of possible rows. The data files were therefore divided into two separate txt-files, where the divide occurred approximately in the middle between two flights.
Thereafter, the txt-files were opened in Excel, separating columns by blanks, and removing the columns containing data regarding flight level at the beginning of the segment, flight level at the end of the segment, status regarding climb, descent, or cruise, latitude, longitude, and segment parity, as these points were not regarded as necessary information to proceed. The longitude and latitude information are instead registered in reference to the waypoint data. The fields that remained to be analyzed include the segment identifier, the origin and destination of the flight, aircraft type, the date and time the segment began and ended, call sign, flight identifier, sequence, and the length of the segment.
Subsequently, a command was added to each of the Excel-files in order to enable filtration to only display the flight plans which may be of interest to this study. The filtration method utilizes the ISNUMBER function within the Excel program, in combination with an IF and SEARCH function, enabling the user to search for a number of waypoints, which is of interest to the user. Excel would then search through all the rows in the segment identifier column and display the segments which contains the waypoints which were sought after. The flight can thereafter be identified through the flight identification number, and each specific flight can be analyzed in its entirety.
The waypoints which were chosen are all located within Estonian, Latvian, Lithuanian, or Polish airspace over the Baltic Sea, which is illustrated in Figure 6, as flights flying through these waypoints could be perceived to fly in such a way in order to avoid Swedish airspace. Flights which crossed at least two of the sought waypoints were then documented in order to closer examine the flight’s route plan around the Swedish airspace. These flights were then analyzed in order to find a pattern which airspace dodging flights seems to use, which could then be

PAGE 26
compared to the shortest route which had previously been calculated. The data generated were then calculated and summed up to generate an estimated figure of the extra distance travelled, which could then be used in order to estimate the extra fuel consumed. It also allowed an overview of the airlines and aircraft models which tends to fly the detours.
Figure 6. Waypoints in neighboring States (Eniro Sverige AB, 2016).
5.2. THE WAYPOINTS AND PROTRACTED ROUTES
In order to identify the commonly used routes which airlines take in order to avoid Swedish airspace, waypoints in neighboring airspaces within 60 km from the Swedish airspace border were examined. Flights including these waypoints were then extracted from the historical flight plan data. Waypoints farther than 60 km from the Swedish airspace border were regarded as excessive, as they were deemed to require significant rerouting, in order for such flights to fly through Swedish airspace. The waypoints of interest were as listed in Table 2, as well as their coordinates and mark number, which can be found on the Eniro webpage described below:
http://kartor.eniro.se/m/JvHEa

PAGE 27
Table 2. Waypoints of Interest.
Waypoint Name (Mark No.) Coordinates
ADAXA (132) じす°ごず’じさ”N こごせ°じざ’じし”E
BALIT (133) じじ°しせ’ざず”N こごぜ°こじ’させ”E
DESON (134) じす°じざ’しご”N こさこ°さじ’ござ”E
DEVEL (135) じし°しざ’じご”N こごじ°しし’じざ”E
EDERA (136) じず°こせ’さず”N こさこ°ざじ’ざせ”E
ELPOL (137) じし°ざす’さざ”N こごじ°ざせ’こさ”E
KEDUX (138) じす°ごさ’しす”N こごぜ°ざし’さし”E
LASMA (139) じす°さす’こず”N こさこ°ごさ’じじ”E
LATMI (140) じじ°さす’じじ”N こごせ°ごこ’こさ”E
LUKED (141) じす°ざご’こず”N こさこ°こじ’ざじ”E
MOTAD (142) じじ°ごさ’ざし”N こごず°ざこ’さこ”E
OKLAD (143) じす°じし’さご”N こさこ°しし’ざじ”E
PIMEX (144) じせ°ごさ’しす”N こさご°ごさ’じさ”E
RUTEK (145) じず°じし’ささ”N こさご°こせ’じせ”E
SOPUN (146) じず°じこ’ざぜ”N こさこ°じせ’じぜ”E
TILAV (147) じし°さし’じぜ”N こごじ°ここ’ここ”E
VENOR (148) じず°じさ’こさ”N こさご°ごさ’ごす”E
VIBUL (149) じし°さこ’ざこ”N こごじ°ごす’させ”E
The waypoints AMPAK (150) and BABEN (154), in Polish airspace, were also sought after, but did not yield any matches, and were therefore disregarded in any further data processing. Furthermore, only flight plans containing two or more of the waypoints were regarded as relevant for this study, as an aircraft would require to pass through at least two waypoints in order to create a deviating route around Swedish airspace. Aircraft passing through only one waypoint were assumed to possess an angle that did not enable a reasonable route alteration towards Swedish airspace, as illustrated in Figure 7.

PAGE 28
Figure 7. Single-waypoint route [left], (Enrio Sverige AB, 2016), and Multi-waypoint route [right], (Eniro Sverige AB, 2016).
The studied waypoints resulted in flight plans combining the following waypoints, as presented in Table 3.
Table 3. Combinations Consisting of Waypoints.
TILAV (147) – ADAXA (132) – DESON (134)
KEDUX (138) – BALIT (133) – DESON (134)
KEDUX (138) – BALIT (133)
ADAXA (132) – DESON (134)
BALIT (133) – KEDUX (138) – LUKED (141) – OKLAD (143)
BALIT (133) – KEDUX (138) – LUKED (141)
ADAXA (132) – LASMA (139)
LUKED (141) – LASMA (139)
ADAXA (132) – LUKED (141)
TILAV (147) – PIMEX (144)
MOTAD (142) – PIMEX (144)
TILAV (147) – RUTEK (145)
RUTEK (145) – EDERA (136)
DESON (134) – KEDUX (138) – LUKED (141)
These waypoint combinations resulted in over 500 flights of interest per day. Aircraft passing only two waypoints proved to already fly through Swedish

PAGE 29
airspace, and were studied in order to confirm that flights flown within Swedish airspace flew the shortest distance through the country. One popular waypoint to, and from, Swedish airspace was discovered to be NINTA (44), which was combined with a second Swedish entry or exit point, without the flight plan listing additional Swedish waypoints in between. Flights flying through both Swedish and Danish airspaces seemed to favor to fly a straight line through the Swedish waypoints NINTA (44), KOLJA (151), ELVIX (152), MALIV (153), and enter or exit Danish airspace through ODARU (154), as presented in Figure 8.
Figure 8. Flight route through Sweden (Eniro Sverige AB, 2016).
The distance between ODARU (154) and Danish entry/exit points was therefore used to subtract from the total distance a flight would travel though the DK/SE-FAB, in order to isolate the distance flown in the Swedish airspace.
Furthermore, two protracted route combinations emerged, one northeast bound, as seen in Figure 9, and one southwest bound, presented in Figure 10, which avoided Swedish airspace entirely. These routes were as listed in Table 4.
Table 4. Protracted Routes.
Southwest Bound VATOS (156) → MOLOK (157) → LOGNA (158) → MILTA (159) → DESON (134) → KEDUX (138) → BALIT (133) →
OLMOR (160) → KUNER (161) → VAPOS (162)
Northeast Bound KUNER (161) → OLMOR (160) → BALIT (133) → KEDUX (138) → LUKED (141) → OKLAD (143) → *VEN (165) →
LUSIM (163) → LATEG (164)
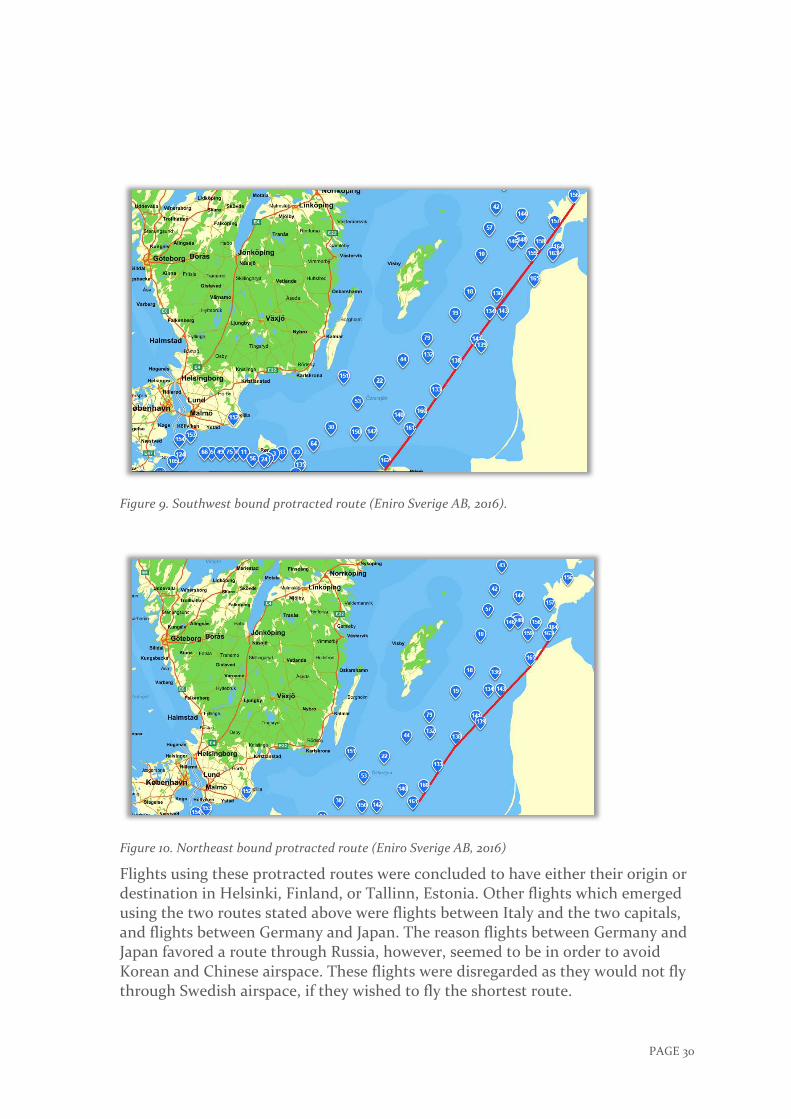
PAGE 30
Figure 9. Southwest bound protracted route (Eniro Sverige AB, 2016).
Figure 10. Northeast bound protracted route (Eniro Sverige AB, 2016)
Flights using these protracted routes were concluded to have either their origin or destination in Helsinki, Finland, or Tallinn, Estonia. Other flights which emerged using the two routes stated above were flights between Italy and the two capitals, and flights between Germany and Japan. The reason flights between Germany and Japan favored a route through Russia, however, seemed to be in order to avoid Korean and Chinese airspace. These flights were disregarded as they would not fly through Swedish airspace, if they wished to fly the shortest route.

PAGE 31
5.3. FLIGHTS AND DISTANCES
The flights which emerged to bypass Swedish airspace, even though it would result in a shorter route, were between the origins and destinations presented in Table 5.
Table 5. Flights of interest.
Origin - Destination
Distance now (km)
Distance alternative
(km)
Distance difference
(km)
Alternative SWE/DK-FAB
Entry/Exit points
Distance in Swedish
airspace lost (km)
EDDT Berlin – EFHK Helsinki
1124.15 1111.03 13.12 GORPI (23), DEREX (10)
415.94
EDDL Düsseldorf – EFHK Helsinki
1572.11 1506.35 65.76 GIMRU (96), NEBSI (40)
649.95
EDDF Frankfurt – EFHK Helsinki
1548.09 1517.67 30.42 BIKRU (7), NEKET (42)
544.02
LEMD Madrid – EFHK Helsinki
2995.72 2962.83 32.89 SALLO (66), NEKET (42)
579.95
LEMG Malaga – EFHK Helsinki
3366.54 3347.78 18.76 BIKRU (7), NEKET (42)
544.02
LSGG Geneva – EFHK Helsinki
2002.51 1992.17 10.34 POKEN (56), DEREX (10)
471.82
LSZH Zürich – EFHK Helsinki
1792.78 1780.95 11.83 GORPI (23), NINTA (44)
220.33
LFPG Paris - EFHK Helsinki
1981.54 1908.57 72.97 GITER (97), NEBSI (40)
645.95
EFHK Helsinki – LEBL Barcelona
2625.46 2606.3 19.16 DEREX (10), GORPI (23)
415.94

PAGE 32
EFHK Helsinki – LSZH Zürich
1781.45 1780.95 0.5 NINTA (44), GORPI (23)
220.33
EFHK Helsinki – EDDT Berlin
1116.69 1111.03 5.66 DEREX (10), GORPI (23)
415.94
EFHK Helsinki – EDDF Frankfurt
1542.66 1517.67 24.99 NEKET (42), BIKRU (7)
544.02
EFHK Helsinki – EBBR Brussels
1738.06 1647.23 90.83 NEBSI (40), GITER (97)
645.95
EFHK Helsinki – LFPG Paris
1996.73 1908.57 88.16 NEBSI (40), GITER (97)
645.95
EFHK Helsinki – LEMD Madrid
2985.9 2962.83 23.07 SALLO (66), NEKET (42)
579.35
EFHK Helsinki – LEMG Malaga
3362.17 3347.78 14.39 NEKET (42), BIKRU (7)
544.02
EFHK Helsinki – EDDL Düsseldorf
1569.84 1506.35 63.49 NEBSI (40), GIMRU (96)
658.57
EFHK Helsinki – EBLG Liége
1678.54 1609.39 69.15 NEBSI (40), KOKOR (104)
650.88
EETN Tallinn – EDDF Frankfurt
1477.33 1466.32 11.01 DEREX (10), POKEN (56)
471.82
EDDF Frankfurt – EETN Tallinn
1474.22 1466.32 7.9 POKEN (56), DEREX (10)
471.82
The flights listed above were primarily operated by four airlines, Finnair, Lufthansa, Finncomm Airlines, and AirBerlin. One flight over the course of the examined days was also operated by Nordic Global Airline, and the percentage distribution of each airline is presented in Figure 11.

PAGE 33
Figure 11. Percentage Airline Distribution.
Regarding the aircraft model used by these airlines, Airbus models proved to be the most dominant one. Aircraft flown by Finncomm Airlines were, however, exclusively of an Embraer make, and the Boeing aircraft tended to belong to AirBerlin. The aircraft model distribution is presented in Figure 12. These distributions were later used to calculate route charges and fuel consumption.
Figure 12. Aircraft model distribution.
7,3%
37,6%
19,7%
34,9%
0,5%
Airline Distribution
AirBerlin: Finnair: Finncomm Airlines: Lufthansa: Nordic Global Airline:
18%
33%
22%
7%
2%
18%
Aircraft Model Distribution
A319: A320: A321: B738: E170: E190:

PAGE 34
5.4. REVENUE CALCULATIONS
In order to account for the revenue loss of LFV, the combined distances which could have been flown in Swedish airspace by the before mentioned flights were calculated and resulted as presented in Table 6.
Table 6. Distance lost calculations.
Origin - Destination Average number of flights per
day
Number of flights per
year
Distance in Swedish airspace lost per
flight
(km)
Distance in Sweden per
year
(km)
EDDT Berlin – EFHK Helsinki
1.83 669.17 415.94 278 334.57
EDDL Düsseldorf – EFHK Helsinki
0.17 60.83 649.95 39 536.46
EDDF Frankfurt – EFHK Helsinki
4.83 1 764.17 544.02 959 743.76
LEMD Madrid – EFHK Helsinki
0.50 182.50 579.95 105 840.88
LEMG Malaga – EFHK Helsinki
0.17 60.83 544.02 33 092.74
LSGG Geneva – EFHK Helsinki
1.50 547.50 471.82 258 321.45
LSZH Zürich – EFHK Helsinki
1.33 486.67 220.33 107 228.00
LFPG Paris - EFHK Helsinki 0.83 304.17 645.95 196 478.61
EFHK Helsinki – LEBL Barcelona
1.17 425.83 415.94 177 119.73
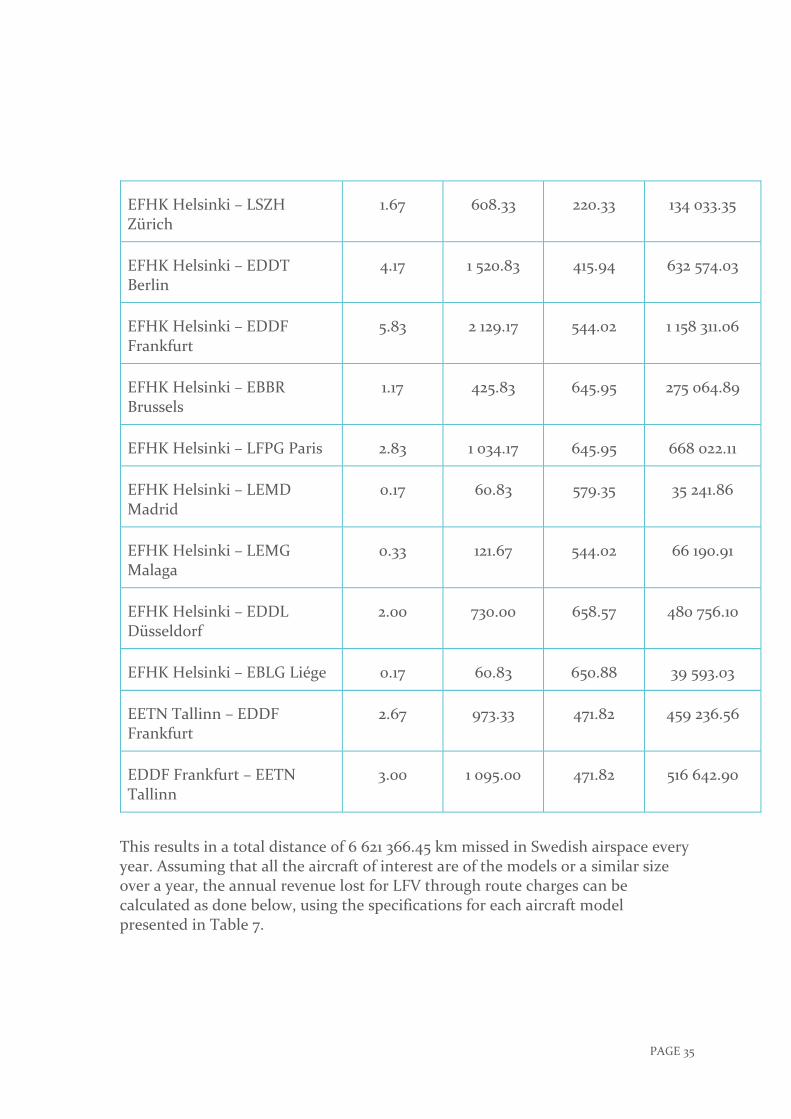
PAGE 35
EFHK Helsinki – LSZH Zürich
1.67 608.33 220.33 134 033.35
EFHK Helsinki – EDDT Berlin
4.17 1 520.83 415.94 632 574.03
EFHK Helsinki – EDDF Frankfurt
5.83 2 129.17 544.02 1 158 311.06
EFHK Helsinki – EBBR Brussels
1.17 425.83 645.95 275 064.89
EFHK Helsinki – LFPG Paris 2.83 1 034.17 645.95 668 022.11
EFHK Helsinki – LEMD Madrid
0.17 60.83 579.35 35 241.86
EFHK Helsinki – LEMG Malaga
0.33 121.67 544.02 66 190.91
EFHK Helsinki – EDDL Düsseldorf
2.00 730.00 658.57 480 756.10
EFHK Helsinki – EBLG Liége 0.17 60.83 650.88 39 593.03
EETN Tallinn – EDDF Frankfurt
2.67 973.33 471.82 459 236.56
EDDF Frankfurt – EETN Tallinn
3.00 1 095.00 471.82 516 642.90
This results in a total distance of 6 621 366.45 km missed in Swedish airspace every year. Assuming that all the aircraft of interest are of the models or a similar size over a year, the annual revenue lost for LFV through route charges can be calculated as done below, using the specifications for each aircraft model presented in Table 7.

PAGE 36
Table 7. Specifications for Airbus-319/320/321 (SAS Group, n.d), Boeing-737-800 (SAS Group, n.d), Embraer 170 (AircraftCompare, n.d), and Embraer 190 (Embraer Commercial Aviation, 2014).
Aircraft model MTOW Fuel consumption Distribution
A319 75.5 metric tons
0.033 liters/seat km
141 seats
0.033 × 141 ≈
4.653 liters/km
0.18
A320 75.5 metric tons
0.029 liters/seat km
168 seats
0.029 × 168 ≈
4.872 liters/km
0.33
A321 89.0 metric tons
0.029 liters/seat km
198 seats
0.029 × 198 ≈
5.742 liters/km
0.22
B738 (B737-800, basic)
79.0 metric tons
0.029 liters/seat km
181 seats
0.029 × 181 ≈
5.249 liters/km
0.07
E170 37.2 metric tons
0.29 km/liter
≈
3.448 liters/km*
0.02
E190 50.3 metric tons
0.23 km/liter
≈
4.348 liters/km*
0.18
* Conversion calculator (The Calculator Site, n.d)
Route charge formula: 堅� = 穴� × 喧 × 建� 喧 = √警劇��のど
Swedish Unit Rate, May 2016: € 63.02 Missed distance in Sweden/Year: 6 621 366.45 km Exchange rate: € ご = SEK ぜ.393

PAGE 37
The route charge formula was modified to take into account aircraft type distribution presented in Table 7, when calculating the annual revenue loss. A variable for the distribution factor, a, was added to the distance variable. 堅� = 穴� × � × 喧 × 建� Annual revenue loss =
(岾滞 滞態怠 戴滞滞.替泰 怠待待 × ど.なぱ峇 × √胎泰.泰泰待 × はぬ.どに) + (岾滞 滞態怠 戴滞滞.替泰 怠待待 × ど.ぬぬ峇 × √胎泰.泰泰待 × はぬ.どに) +(岾滞 滞態怠 戴滞滞.替泰 怠待待 × ど.にに峇 × √腿苔泰待 × はぬ.どに) + (岾滞 滞態怠 戴滞滞.替泰 怠待待 × ど.どば峇 × √胎苔泰待 × はぬ.どに) +(岾滞 滞態怠 戴滞滞.替泰 怠待待 × ど.どに峇 × √戴胎,態泰待 × はぬ.どに) + (岾滞 滞態怠 戴滞滞.替泰 怠待待 × ど.なぱ峇 × √泰待.戴泰待 × はぬ.どに) ≈€の どぬに ぬのね 剣堅 鯨継計 ねば にはぱ ひどど
LFV current revenue from air traffic service = € さすさ 429 469 or SEK 2 465 000 000
Income gained of current air traffic service revenue = 泰 待戴態 戴泰替態滞態 替態苔 替滞苔 ≈ な.ひ%
The average number of flights per day = 36.33 flights Additional number of flights rerouted to Sweden per month = 36.33 × 31 ≈ 1 126.23
Number of LFV controlled flights in 2015 = 712 000 flights
Number of LFV controlled flights per month in 2015 = 胎怠態 待待待怠態 ≈ のひ ぬぬぬ.ぬぬ
Flights per month increase from 2015 = 怠 怠態滞.態戴泰苔 戴戴戴.戴戴 ≈ な.ひ%
5.5. FUEL CALCULATIONS
To calculate the extra fuel, which is consumed due to flights bypassing Swedish airspace instead of flying the shortest route through it, the total extra distance was calculated from the distance differences presented in Table 5 and the number of flights which flew each route. This resulted in a total extra distance of approximately 380 407.87 km every year. Using the aircraft model specifications and distributions presented in Table 7, fuel consumption and fuel cost could be calculated using the method below. The formula includes the extra distance per year, d, the aircraft distribution, a, and the specific fuel consumption, c, of aircraft type, i.
Extra distance/year: 380 407.87 km
Formula: ∑ 穴 × � × 潔� Extra fuel consumed/Year =

PAGE 38
岫ぬぱど ねどば.ぱば × ど.なぱ × ね.はのぬ岻 + 岫ぬぱど ねどば.ぱば × ど.ぬぬ × ね.ぱばに岻+ 岫ぬぱど ねどば.ぱば × ど.にに × の.ばねに岻 + 岫ぬぱど ねどば.ぱば × ど.どば × の.にねひ岻+ 岫ぬぱど ねどば.ぱば × ど.どに × ぬ.ねねぱ岻 + 岫ぬぱど ねどば.ぱば × ど.なぱ × ね.ぬねぱ岻≈ な ぱばね ねぱは.ね 詣�建結堅嫌
Fuel price, €/barrel: € 49.71, average for May 2016, 1 barrel ≈ 119.24 liter.
Fuel price, €/liter: 替苔.胎怠怠怠苔.態替 ≈ ど.ねに
Cost for extra fuel/year (2016) = な ぱばね ねぱは.ね × ど.ねに ≈ €ばぱな ねのの 剣堅 鯨継計 ば ぬねど にどひ
5.6. BREAK-EVEN CALCULATIONS
According to the information gathered from the interviews, the largest factor to airlines planning protracted routes is costs. It would therefore be of interest to analyze the amount that is saved through routes around Sweden, and at what fuel price would this no longer be a beneficial option.
To determine the break-even point for the fuel price, two flights from Table 5 were chosen. EDDT Berlin to EFHK Helsinki was chosen to represent the southwest bound routes, which is illustrated in Figure 13, and EETN Tallinn to EDDF Frankfurt was chosen to exemplify the northeast bound routes.

PAGE 39
Figure 13. Protracted route [red] vs Swedish route [green] (Eniro Sverige AB, 2016).
These were then compared to the route through Sweden with the same origins and destinations, as presented in Table 8. As the most common aircraft model was proven to be A320, its specifications regarding fuel consumption was also chosen for these calculations.
Table 8. Route charges for an A320.
EDDT Berlin – EFHK Helsinki
Distance
Route cost
[Current route]
EDDT Berlin – EFHK Helsinki
Distance
Route cost
[Alternative Swedish Route]
Finland 62.45 km
€ し3.22
91.49 km
€ すざ.32
Estonia 250.57 km
€ ぜじ.76
224.17km
€ せじ.67
Latvia 232.82 km 73.93 km

PAGE 40
€ 78.39 € 24.89
Lithuania 54.35km
€ 30.05
-
Kaliningrad 74.23 km
€ すぜ.68
-
Poland 361.45 km
€ 150.30
178.25 km
€ 74.12
Germany 88.27 km
€ 89.68
127.25 km
€ 129.28
Sweden - 415.94 km
€ 322.11
Total €: 557.09 699.39
Total km: 1124.15 1111.03
Total liters:
[km × 4.872]
5476.86 5412.94
EETN Tallinn – EDDF Frankfurt
Distance
Route cost
[Current route]
EETN Tallinn – EDDF Frankfurt
Distance
Route cost
[Alternative Swedish Route]
Finland - -
Estonia 253.43 km
€ ぜす.せじ
258.73 km
€ ぜせ.88
Latvia 221.55 km
€ 74.60
73.87 km
€ 24.87
Lithuania 54.06 km
€ 29.89
-
Kaliningrad 74.01 km
€ すぜ.しせ
-
Poland 347.05 km
€ 144.32
33.07 km
€ 13.75

PAGE 41
Germany 527.21 km
€ 535.64
628.86 km
€ 638.91
Sweden - 471.82 km
€ 365.38
Total €: 950.77 1141.78
Total km: 1477.33 1466.33
Total liters:
[km × 4,872]
7197.55 7143.96
The values presented above were then applied to a break-even formula which reads as follows, where R stands for the route charges for the longer route L or the shorter route S, and F stands for the fuel required for the route, and p is the break-even fuel price: 迎� + 繋� × 喧 = 迎� + 繋� × 喧
Berlin – Helsinki ののば.どひ + のねばは.ぱは喧 = はひひ.ぬひ + のねなに.ひね喧 のねばは.ぱは喧 − のねなに.ひね喧 = はひひ.ぬひ − ののば.どひ はぬ.ひに喧 = なねに.ぬど 喧 = なねに.ぬどはぬ.ひに ≈ に.にぬ €/� Tallinn - Frankfurt ひのど.ばば + ばなひば.のの喧 = ななねな.ばぱ + ばなねぬ.ひは喧 ばなひば.のの喧 − ばなねな.ひは喧 = ななねな.ばぱ − ひのど.ばば のぬ.のひ喧 = なひな.どな 喧 = なひな.どなのぬ.のひ ≈ ぬ.のは €/�

PAGE 42
6. Analysis
6.1. THE REVENUE
As presented in the previous chapter, the amount of flights currently flying a longer route around Swedish airspace, would generate roughly €5 million a year in additional revenue for LFV, if they flew through Sweden instead. According to most sources, scientific papers and airline representatives, it is confirmed that the key factor in flight planning is the overall cost of a flight. Costs can, however, come in many different forms, such as fuel, vessel leasing, and consequences of a delayed flight. Furthermore, the prioritization of each cost form differs between different airlines. As described in chapter 4.5, regular scheduled flights hold time in a much higher regard than charter flights, as regular scheduled flights often transport passengers with connecting flights. Delays to such flights do therefore often result in complications such as with rebooking flights, and accommodating passengers with food, drink, and lodging.
Charter flights, on the other hand, fly their passengers directly to their destination, and do not suffer as dire consequences as a result of delays as their regular scheduled counterparts. As far as delays are concerned, charter airlines are able to operate with up to three hours of delay, before passengers are able to claim monetary compensation according to aviation laws. Charter airlines can thusly focus on cutting down on costs and choose the absolutely cheapest route, whereas regular scheduled airlines sometimes have to choose a more expensive route in order to avoid major delays.
This study has highlighted two routes, which are currently used to bypass Swedish airspace. Furthermore, this could mean that additional routes used to evade Sweden exists outside of the 60 km parameter, which was used in this study. One of these routes is emphasized in the interview with Novair, where Peter Sandgren states that due to regulations enforced by LFV, discourages airlines departing from Stockholm Arlanda Airport to remain in Swedish airspace. Owing to the position of the departure waypoint, not entering the cheaper Baltic airspaces is deemed as an illogical choice. Southbound flights would therefore, supposedly, fly over land instead of the waypoints over the Baltic Sea, and would consequently not appear in the statistics of this study. The existence of such established routes around Swedish airspace, on the other hand, cement the issue that airlines consciously avoid Sweden, due the route charges.
The regulations regarding departing and arriving air traffic to Stockholm Arlanda Airport is an attempt to reduce overlapping routes, and avoid aircraft flying in close proximity to each other in areas with heavy traffic. Similarly, it could be argued that the protracted routes are flown in order to avoid in-bound flights to the Swedish capital. However, other flights flying through Swedish airspace do
PAGE 43
currently fly in similar proximity to the Swedish capital. It can therefore be assumed that the evading flights do not fly the way they do due to safety reasons.
Furthermore, the 1.9% increase of the air traffic revenue for LFV, presented in the previous chapter 5.4, is based on the assumption that the additional traffic would not result in additional costs. The additional workload might, however, require supplementary resources in order to handle the increased traffic. The amount of additional flights in Swedish airspace highlighted in this study would amount to approximately 36 extra flights per day, which may or may not be manageable with the current workload.
Workload may also become an issue, should the unit rates become standardized. If all countries within EUROCONTROL’s area of operations had the same unit rate, airlines may be more inclined to plan and chose the shortest possible routes. However, this may also result in countries, mainly in central Europe, being heavily congested. The congestion, in turn, would then likely result in delays, rerouting, and other complications nullifying the benefits standardized unit rates may include.
6.2. THE FUEL
The issue of airlines flying longer routes in order to reduce their overall flight costs, results in an extra 1 874 486.4 liters of fuel that is consumed per year. This does not, however, account for the additional fuel, which is required in order to transport the original extra fuel. Consequently, the number presented in this study is possibly lower than the actual extra fuel consumed per year.
Fuel constitutes a large portion of the cost of a flight, meaning that airlines tend to plan their flights with high regard to fuel required. Thusly, most companies main reason to reduce their fuel consumption is to reduce their own expenses, rather than for environmental reasons. However, due to fuel being such a motivating factor, regulations of fuel prices could result in influencing airlines to fly the shortest possible route to a certain degree. Yet, this is not reflected in the statistical fuel prices, as they have historically been reduced, only to be slightly increased recently. High fuel prices could discourage airlines from airspace dodging, as it would heavily punish unnecessarily long routs in the form of large fuel charges. A way to regulate fuel prices could be to introduce some form of environmental tax. This may be faced with resistance, as no company would willingly pay an added fee. It would also be difficult to globalize such a tax, meaning that airlines based in Europe would be at a disadvantage if it was introduced, leading to further resistance.
This would, however, pose a problem as fuel prices currently differ between different countries, and introducing a standard price for aircraft fuel may come with its own set of complications. High fuel prices could also incite airlines to cut

PAGE 44
corners when planning for the amount of fuel required for a flight, increasing the risk for air traffic related incidents. If prices were to increase, but still differ between countries, it may instead lead to a growth in airlines choosing to tanker, meaning they would refuel for multiple flights at one location. The consequences of such behavior would result in extra fuel being consumed, as extra fuel requires additional fuel to transport, as previously mentioned.
Furthermore, fuel can fluctuate greatly over a small period of time. Due to the nature of the fuel market, it could then be argued that airlines have methods to combat such a variance in expenses, in the attempt to stabilize their revenue and prognosis. Such a method could be to purchase large amounts of fuel beforehand, when the price is low, thus having quantities of cheap fuel as reserve for when the prices begin to rise.
6.3. THE PROBLEM OF AIRSPACE DODGING
It can be concluded that airspace dodging is an existent issue, as both data and airlines can confirm, but all parties involved are yet unclear on how it can be solved. For some airlines, it may not be an issue at all, as long as planning protracted routes results in a lower flight charge. This becomes most apparent in the case of charter airlines, as delays are not of large concern, compared to regular scheduled airlines.
On the other hand, the distance difference between the shortest route through Sweden and the currently flown protracted routes, do not provide hefty delays, even for regular scheduled flights. The largest difference between the two route alternatives is calculated to be approximately 90 kilometers. Assuming that normal cruising speed of an aircraft is around 1000 km/h, an extra 90 kilometers would only mean a delay of roughly 5 minutes. Something even regular scheduled flights can be assumed capable of handling without major complications. It can therefore be presumed that time would not be suitable leverage factor, in the purpose of discouraging airspace dodging.
An option could be to standardize unit rates. However, it runs the risk of congesting the airspace above certain countries, resulting in delays and rerouting. This would consequently eliminate the benefits standardized unit rates were introduced for. EUROCONTROL’s SESAR project aims to provide a more unified and effective airspace above Europe by dividing airspace sectors into blocks in regard to air traffic flow, rather than national borders. This could counteract congestion, depending on how it is implemented. However, it raises an issue where certain countries’ income may decline as a consequence of this, making them opposed to such an implementation, if not compensated in some way.

PAGE 45
It should also be noted that the shorter routes through Sweden would result in aircraft traveling longer distances through Denmark and Germany as well. Both of these countries hold a higher unit rate than the Baltic counties and Poland, and Germany also has a significantly higher unit rate than both Sweden and Denmark. Airspace dodging would therefore not only depend on the Swedish unit rate, but also that of Germany and Denmark. This means that while it may, in some cases, be cheaper to fly through Sweden, the additional distance flown in both Denmark and Germany could negate any eventual savings that flying through Swedish airspace would entail, resulting in protracted routes around Sweden remaining more beneficial. An alternative would be to match the unit rates of Poland or the Baltic nations. However, this would seem as an unlikely option, due to socioeconomic differences limiting how low Sweden can set its unit rate or how high Poland, Estonia, Latvia, and Lithuania can set theirs.
6.4. THE STUDY
A weakness that can be stated for this study is the issue that the data from which the results are concluded, are rather limited. Air traffic may vary depending on the seasons, world economy, and other factors which affect the willingness of people to travel by aircraft. The results are therefore dependent on the regularity of the studied data to repeat itself over the course of a year, and is consequently subject to abnormalities that do not occur on a regular basis, but would now be accounted as a norm. On the other hand, assuming that the analyzed data is of days without significant disruptions, it does not take into account these irregularities in the end result.
However, it also can be argued that the data is applicable to a whole year of LFV operations. As can be seen in the calculations in chapter 5.4, the air traffic which would be rerouted to Sweden amounted to 1.9% of the current operations, is similar to the revenue increase of 1.9%. It can therefore be claimed that the numbers presented in this study are not disproportionate, and that the data can be considered reliable.
Furthermore, this study has not taken into account the increased workload for Danish air traffic control services. As most flights that are required to fly through both Swedish and Danish airspaces to achieve their shortest route, are funneled through the Swedish waypoint ODARU, the suggested shortest routes might risk congesting the Danish airspace and infringe upon air traffic arriving to, and departing from Copenhagen Airport. Nevertheless, it can also be argued that the suggested alternatives would generate additional revenue to Danish air traffic control services, assuming that the current capacity is sufficient.
PAGE 46
Lastly, this study has mainly focused on flight passing Swedish airspace entirely, and not taken into account for flights flying from or to Swedish airports. As stated by Novair in chapter 4.6, current regulations set by LFV seem to discourage southbound flights departing from Stockholm Arlanda Airport to remain in Swedish airspace. The arrangements for the airport were set into place in order to maintain sufficient spacing between arriving and departing flights. This favors landing aircraft in the extent that their pathing towards Stockholm Arlanda Airport is very straight, enabling inbound flights to conduct more environmentally friendly landings. However, should aircraft departing from Stockholm be assigned a more southern waypoint trajectory, LFV may encourage more flights to remain in Swedish airspace, rather than enter Baltic airspace shortly after take-off, and consequently increase their revenue further than has been previously stated. This could, on the other hand, entail an increased risk to air traffic safety, as this would result in aircraft flying both ways at low altitudes.
6.5. SOURCE DISCUSSION
As this study is based on a wide variety of sources, it can also be assumed that the reliability of these sources may come to vary as well. Sources, such as EUROCONTROL and LFV, although trustworthy, may have their own agendas and ideals which they wish to promote, thusly resulting in possible bias information. However, most of the information gathered from such sources have been numerical data, which are a bit more resilient to bias, and seeing as EUROCONTROL is the leading organization regarding air traffic, it was deemed natural that a large portion of information should come from the organization.
Bias may also be a factor in the interviews that have been conducted during the course of this study. Representatives from the different companies are most likely to highlight issues which their own company view as a problem, rather than considering others’ point of view. To reduce the risk of leaning towards only one company’s opinion, multiple companies have been interviewed, in order to assess each of the different companies’ views and opinions, and analyze the combined information gathered from them.
The scientific articles that have been utilized in this study are mostly articles regarding air traffic and aviation as a whole, some also examining similar queries as this study, but in a different aspect. Scientific studies are, however, not exempt from bias from the authors of the paper. Nevertheless, where these studies have been mentioned in this report, it has been in regards to the scientific methods which have historically been used. The results of these studies have therefore not had a significant effect on the results of this study, and bias influence can consequently be disregarded. Published studies are, however, often classified as scientific sources and tend to be regarded as reliable.

PAGE 47

PAGE 48
7. Conclusion Firstly, according to the observations of historical flight plan data from EUROCONTROL, the issue of airspace dodging is an existing one affecting the Swedish airspace and LFV. The result of airlines avoiding Swedish airspace, due to high unit rates, have been estimated to € 5 032 354 or SEK 47 268 900 in lost revenue for LFV. Should the flights be flown in Sweden instead, LFV would increase their current proceeds from air traffic control services by 1.9%, not regarding eventual costs related to increased air traffic in Swedish airspace. The protracted routes currently amount to 380 408 superfluous kilometers being flown per year, resulting in the extra fuel required to fly the longer routes amounts to an estimate of an additional 1 874 486 liters of aircraft fuel being consumed per year.
Secondly, although airspace dodging may pose a problem to Swedish air navigation, only focusing on Swedish airspace and unit rates may not be sufficient. The shorter routes through Sweden, which would result in less emissions, also result in extra distance flown in Germany and Denmark, compared to the currently flown routes. Both Germany and Denmark are more expensive than the Baltic countries and Poland, and Germany also having a significantly higher unit rate than Sweden. This could result in aircraft choosing to continue using their routes around Swedish airspace, even though Sweden lowered their unit rate, as any eventual savings gained in Sweden would conceivably be negated by the extra distance in Germany and Denmark.
Finally, it all comes down to the cost of each flight. Regardless of regular scheduled flights or charter flights, companies are constantly searching for the most cost effective way to route their operations. Since cost plays such a key factor in airline companies’ behavior, it is logical to assume that the conduct can be influenced by modifying the elements of the key factor, in order to generate a desired behavior.

PAGE 49
References ACR. (n.d). Läs om ACRs historia. Retrieved March 29, 2016, from http://www.acr-
sweden.se/verksamhet/historia/
AircraftCompare. (n.d). Embraer 170 - Specifications. Retrieved May 18, 2016, from http://www.aircraftcompare.com/aircraft-specification/Embraer-170/118/spec
Al-Rodhan, N. R., & Stoudmann, G. (2006). Definitions of Globalization: A Comprehensive Overview and a Proposed Definition. Geneva: Geneva Centre for Security Policy. Retrieved March 16, 2016, from http://www.academia.edu/2969717/Definitions_of_Globalization_A_Comprehensive_Overview_and_a_Proposed_Definition-_The_International_Relations_and_Security_Network_ETH_Zurich_June_19_2006
Altus, S. (2009). Effective Flight Plans Can Help Airlines Economize. Aero QTR_03 09, pp. 27-30.
Andersson, G. (2010). Kalkyler som beslutsunderlag (6:4 ed.). Lettland: Sudentlitteratur AB. Retrieved May 19, 2016
Austin, C. J., & Boxerman, S. B. (1995). Quantitative Analysis for Health Services Administration. Michigan. Retrieved May 19, 2016, from http://www-personal.umich.edu/~dmendez/Lecture_Notes/Austin%26Boxerman.Chpt.2..pdf
Bengtsson, P. (2012). The Phased Introduction of Free Route Airspace into DK/SE FAB. NUAC. Retrieved March 29, 2016, from http://www.eurocontrol.int/sites/default/files/field_tabs/content/documents/nm/presentations/120125-uf-day2-od-1400-bengtsson.pdf
Björklund, M., & Paulsson, U. (2012). Seminarieboken - att skriva, presentera och opponera (2:1 ed.). Lund: Studentlitteratur AB.
Castelli, L., Labbé, M., & Violin, A. (2013). A Network Pricing Formulation for the revenue maximization of European Air Navigation Service Providers. Transportation Research, 214-226. Retrieved April 26, 2016
Christopher, B., Pruchnicki, S., Burian, B. K., & Cotton, S. (2014, July 7). Enchancing NextGen RNAV Capabilities: Human Performance Evaluation of NRS Waypoint Nomenclatures. The International Journal of Aviation

PAGE 50
Psychology, 24(3), 156. Retrieved March 29, 2016, from http://www.tandfonline.com/doi/abs/10.1080/10508414.2014.918409
Dalen, M. (2008). Intervju som metod (3:e ed.). Malmö: Gleerups Utbildning AB.
Davidsson, B. (2009). Self report - att använda skrivna texter som redskap. In J. Dimenäs (Ed.), Lära till lärare (pp. 70-79). Stockholm: Liber AB.
Delgado, L. (2015). European route choice determinants - Examining fuel and route charge trade-offs. Eleventh USA/Europe Air Traffic Management Research and Development Seminar. Retrieved April 26, 2016
Ejvegård, R. (2009). Vetenskaplig metod (4:1 ed.). Lund, Sverige: Studentlitteratur AB.
Embraer Commercial Aviation. (2014, June). Specifications E190. Retrieved May 18, 2016, from http://www.embraercommercialaviation.com/Pages/Ejets-190.aspx
Eniro Sverige AB. (2016, May 17). Retrieved from http://kartor.eniro.se/m/u6Iwo
Eniro Sverige AB. (2016, May 19). Fuskrutt vs Sverigerutt. Retrieved May 19, 2016, from http://kartor.eniro.se/m/wVYCQ
Eniro Sverige AB. (2016, May 17). Genomfart Sverige. Retrieved from http://kartor.eniro.se/m/TWUF7
Eniro Sverige AB. (2016, May 11). Maps. Retrieved from http://kartor.eniro.se/m/R0mwV
Eniro Sverige AB. (2016, May 17). Multi-waypoint route. Retrieved from http://kartor.eniro.se/m/OiqkC
Eniro Sverige AB. (2016, May 17). www.eniro.se. Retrieved from http://kartor.eniro.se/m/x92E9
Enrio Sverige AB. (2016, May 17). Single-waypoint route. Retrieved from http://kartor.eniro.se/m/VqWXc
Esri. (n.d). ArcGIS. ArcMap, v 10.3.1. California: Esri. Retrieved 14 April, 2016
EUROCONTROL 1. (2014). Local Single Sky ImPlementation (LSSIP) SWEDEN. EUROCONTROL. Retrieved March 29, 2016, from https://www.eurocontrol.int/sites/default/files/content/documents/official-documents/reports/2015-lssip2014-sweden.pdf
EUROCONTROL. (2011, November 17). Flight plan processing enters Free Route Airspace era. Retrieved March 29, 2016, from
PAGE 51
http://www.eurocontrol.int/news/flight-plan-processing-enters-free-route-airspace-era
EUROCONTROL. (2014). Performance Review Report - An Assessment of Air Traffic Management in Europe during the Calendar Year 2014. EUROCONTROL. Retrieved March 17, 2016, from http://www.eurocontrol.int/sites/default/files/publication/files/prr-2014.PDF
EUROCONTROL. (2016, April 4). EUROCONTROL Statistics and Forecasts. Industry Monitor - The EUROCONTROL bulletin on air transport trends(182). Retrieved April 12, 2016, from https://www.eurocontrol.int/sites/default/files/publication/files/eurocontrol-industry-monitor-182.pdf
EUROCONTROL a. (n.d). Flight planning. Retrieved March 15, 2016, from http://www.eurocontrol.int/articles/flight-planning
EUROCONTROL b. (n.d). What are route charges? Retrieved March 15, 2016, from www.eurocontrol.int: http://www.eurocontrol.int/articles/what-are-route-charges
EUROCONTROL c. (n.d). Establishing route charges. Retrieved March 15, 2016, from www.eurocontrol.int: http://www.eurocontrol.int/articles/establishing-route-charges
EUROCONTROL d. (n.d). Monthly Adjusted Unit Rates. Retrieved March 23, 2016, from http://www.eurocontrol.int/services/monthly-adjusted-unit-rates
EUROCONTROL e. (n.d). Charging zones. Retrieved March 16, 2016, from http://www.eurocontrol.int/articles/charging-zones
EUROCONTROL f. (n.d.). Free Route Airspace. Retrieved March 23, 2016, from http://www.eurocontrol.int/articles/free-route-airspace
EUROCONTROL g. (n.d). What is Area Navigation? - Module 1. European Airspace Concept Workshops for PNB Implementation (p. 17). ICAO. Retrieved March 24, 2016, from http://www.icao.int/MID/Documents/2014/PBN%20Workshop-Tunis/01%20What%20is%20Area%20Navigation_VJUL13.pdf
EUROCONTROL h. (n.d). RNAV Approaches. Retrieved March 24, 2016, from www.eurocontrol.int: https://www.eurocontrol.int/sites/default/files/publication/files/2013-rnav-approaches-factsheet.pdf
PAGE 52
EUROCONTROL i. (n.d). Single European Sky. Retrieved March 29, 2016, from http://www.eurocontrol.int/dossiers/single-european-sky
EUROCONTROL j. (n.d). FABs. Retrieved March 29, 2016, from http://www.eurocontrol.int/dossiers/fabs
EUROCONTROL k. (n.d). Flight planning, the air route network and airspace design in Europe. Retrieved March 30, 2016, from http://www.eurocontrol.int/dossiers/flight-planning-air-route-network-and-airspace-design-europe
European Central Bank. (n.d). Swedish krona (SEK). Retrieved March 29, 2016, from https://www.ecb.europa.eu/stats/exchange/eurofxref/html/eurofxref-graph-sek.en.html
Google. (2016, May 19). U.S dollars = Euros. Retrieved May 19, 2016, from https://www.google.se/search?q=dollars+to+euro&ie=utf-8&oe=utf-8&client=firefox-b&gfe_rd=cr&ei=mIY9V9ysDYzDuAHd3Jz4Dw#safe=off&q=85%2C7+dollars+to+euro
IATA. (2014, October 16). New IATA Passenger Forecast Reveals Fast-Growing Markets of the Future. Retrieved March 16, 2016, from http://www.iata.org/pressroom/pr/Pages/2014-10-16-01.aspx
IATA. (n.d). Fuel Price Analysis. Retrieved May 30, 2016, from http://www.iata.org/publications/economics/fuel-monitor/Pages/price-analysis.aspx
IATA. (n.d). Jet Fuel Price Development. Retrieved May 30, 2016, from http://www.iata.org/publications/economics/fuel-monitor/Pages/price-development.aspx
ICAO. (2010). Tariffs for Airports and Air Navigation Services. Retrieved May 19, 2016, from http://www.aerohelp.ru/data/432/Doc7100.pdf
Johns, J. A., & Khan, M. U. (2009). Fuel Conservation Information on MyBoeingFleet. Aero QTR_03 09, p. 19. Retrieved March 15, 2016, from http://www.boeing.com/commercial/aeromagazine/articles/qtr_03_09/pdfs/AERO_Q309.pdf
Justesen, L., & Mik-Meyer, N. (2011). Kvalitativa metoder - Från vetenskapsteori till praktik (1:1 ed.). Lund, Sverige: Studentlitteratur AB.
Kylén, J.-A. (2004). Att få svar (1:a ed.). Stockholm: Bonnier Utbildning AB.
PAGE 53
Lennuliiklusteeninduse AS. (2014, November 24). Price List for Air Navigation Services. Retrieved May 10, 2016, from http://www.eans.ee/wp-content/uploads/2011/06/Lennuliiklustasude_hinnakiri_al_01_01_2015_ENG.pdf
LFV. (2010, April 8). List of Waypoints and Name-code designators (WGS84) forFMS/RNAV SIDs at Stockholm/Arlanda (ESSA). The LFV Group. Retrieved March 30, 2016, from https://www.aro.lfv.se/Editorial/View/493/ES_AD_2_ESSA_4-15_en
LFV. (2015). Årsredovisning 2015. LFV. Retrieved May 17, 2016, from http://www.lfv.se/globalassets/nyheter/nyheter-2016/arsredovisning-2015.pdf
LFV. (2016, January 11). LFVs statistik visar på rekordår för flyget. Retrieved May 18, 2016, from www.lfv.se/nyheter/nyheter-2016/lfvs-statistik-visar-pa-rekordar-for-flyget
LFV a. (n.d). Remote Tower Services. Retrieved March 29, 2016, from http://lfv.se/en/services/airport-services/remote-tower-services
LFV b. (n.d). Om oss. Retrieved March 29, 2016, from http://lfv.se/om-oss
LFV c. (n.d). Här finns LFV. Retrieved March 29, 2016, from http://lfv.se/om-oss/styrelse-och-ledning/harfinnsvi
LFV. (n.d). Vår historia. Retrieved March 29, 2016, from http://lfv.se/om-oss/styrelse-och-ledning/lfvs-historia
NEFAB. (n.d). Free Route Airspace. Retrieved March 23, 2016, from North European Functional Airspace Block: http://www.nefab.eu/dev/view/86
NUAC. (2011, March). NUAC company is operational. Newsletter 01/2011. Retrieved March 29, 2016, from http://www.naviair.dk/media/list/-400000/nuac_newsletter_1-2011-a4web.pdf
Peeters, P., Middel, J., & Hoolhorst, A. (2005). Fuel efficiency of commercial aircraft - An overview of historical and future trends. National Aerospace Laboratory NLR. Retrieved March 15, 2016, from http://www.transportenvironment.org/sites/te/files/media/2005-12_nlr_aviation_fuel_efficiency.pdf
Reynolds, T. G., Budd, L., Gilingwater, D., & Caves, R. (2009). Effects of Airspace Charging on Airline Route Selection & Greenhouse Gas Emissions. 9th AIAA Aviation Technology, Integration and Operations Conference (ATIO). South Carolina. Retrieved April 26, 2016

PAGE 54
Sabre Airlines Solutions. (n.d). Flight Planning - A discussion of fuel cost containment relevant to fuel planning. Retrieved March 16, 2016, from http://www.sabreairlinesolutions.com/images/uploads/Flight_Planning_White_Paper.pdf
Said, S. (2013, May 24). Top 10 Most Commonly Sold Commercial Jets to Airlines. Retrieved April 12, 2016, from http://www.therichest.com/business/technology/top-10-most-commonly-sold-commercial-jets-to-airlines/?view=all
Sandgren, P. (2016, April 28). Routes from ESSA. Stockholm, Sweden. Retrieved May 23, 2016
SAS Group. (n.d). Airbus A319/A320/A321. Retrieved May 10, 2016, from http://www.sasgroup.net/en/airbus-a319-100-and-a320a321/
SAS Group. (n.d). Boeing 737-600/700/800. Retrieved May 18, 2016, from http://www.boeing.com/assets/pdf/commercial/startup/pdf/737ng_perf.pdf
SKYbrary. (2015, February 3). Free Route Airspace (FRA). Retrieved March 23, 2016, from http://www.skybrary.aero/index.php/Free_Route_Airspace_%28FRA%29
The Calculator Site. (n.d). Fuel Consumption Converter. Retrieved May 18, 2016, from http://www.thecalculatorsite.com/conversions/fuelconsumption.php
Thorvald, P. (2015). Rapportskrivning - En lathund för studenter. Skövde: Högskolan i Skövde.
Transportstyrelsen. (n.d). Avgift för flygtrafiktjänster. Retrieved March 15, 2016, from www.transportstyrelsen.se: https://www.transportstyrelsen.se/sv/luftfart/Flygplatser-och-flygtrafiktjanst/Flygtrafiktjanst/Avgift-flygtrafiktjanster/
X-Rates. (2016, May 30). US Dollar to Euro. Retrieved May 30, 2016, from http://www.x-rates.com/calculator/
Zhang, W., Kamgarpour, M., Sun, D., & Tomlin, C. J. (2011, December 19). A Hierarchical Flight Planning Framework for Air Traffic Management. Proceedings of the IEEE, 100(1), 179-194. Retrieved March 15, 2016, from http://ieeexplore.ieee.org/stamp/stamp.jsp?tp=&arnumber=6011668
Åkerlind, O., & Örtlund, H. (2011). The ABZ of Flight Operations. Molkom: Håkan Örtlund Produktion AB. Retrieved March 29, 2016

PAGE 55

Appendix 1
INTERVIEW WITH THOMAS JÖNSSON – STOCKHOLM ARLANDA ATCC
Vilka faktorer tas i beaktning när man färdplanerar? [What factors are taken into account when flight planning?]
Hur färdplanerar flygbolagen? (prioriteringar, önskemål, etc.) [How do airlines flight plan? (priorities, wishes, etc.)
Finns det några vindförhållanden i det svenska luftrummet, med omnejd, där det är rimligt för flygbolagen att flyga en omväg? [Are there any wind conditions in Swedish, and surrounding airspace, which makes it reasonable for airlines to fly detours around Sweden?]
Vad finns det för rimliga avgränsningar som man bör göra när man analyserar färdplaner och färdvägar? [What are some reasonable delimitations one should consider when analyzing flight plans and flight routes?]
Hur ofta förekommer det att flygbolag färdplanerar en längre färdväg, men sedan frågar om att åka igenom svenskt luftrum? [How often do airlines plan a longer flight route, only to request to fly through Swedish airspace in mid-flight?]
Hur ofta accepterar Sverige sådana efterfrågningar? [How often do Sweden accept such requests?]
Hur ofta ändras Europas unit-rates? [How often are the unit rates in Europe changed?]

Anser du att enroute-dodging är ett befintligt problem? [Do you consider airspace dodging to be a problem?]
Finns det några specifika rutter eller flygbolag som tenderar att planera längre färdplaner? [Are there any specific routes or airlines that tend to plan protracted routes?]
Har du några förslag på metoder för att beräkna den kortaste färdvägen? [Do you have any suggestions on methods to calculate the shortest distance?]
Har du något att tillägga? [Do you have anything to add?]
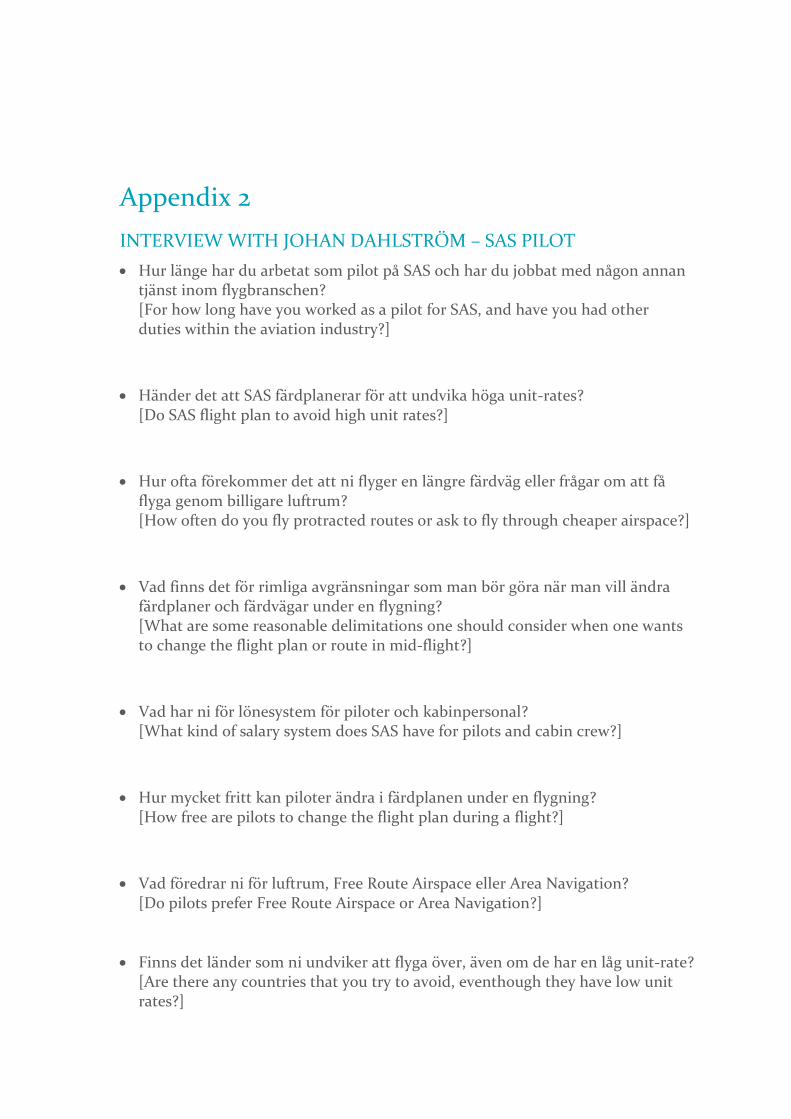
Appendix 2
INTERVIEW WITH JOHAN DAHLSTRÖM – SAS PILOT
Hur länge har du arbetat som pilot på SAS och har du jobbat med någon annan tjänst inom flygbranschen? [For how long have you worked as a pilot for SAS, and have you had other duties within the aviation industry?]
Händer det att SAS färdplanerar för att undvika höga unit-rates? [Do SAS flight plan to avoid high unit rates?]
Hur ofta förekommer det att ni flyger en längre färdväg eller frågar om att få flyga genom billigare luftrum? [How often do you fly protracted routes or ask to fly through cheaper airspace?]
Vad finns det för rimliga avgränsningar som man bör göra när man vill ändra färdplaner och färdvägar under en flygning? [What are some reasonable delimitations one should consider when one wants to change the flight plan or route in mid-flight?]
Vad har ni för lönesystem för piloter och kabinpersonal? [What kind of salary system does SAS have for pilots and cabin crew?]
Hur mycket fritt kan piloter ändra i färdplanen under en flygning? [How free are pilots to change the flight plan during a flight?]
Vad föredrar ni för luftrum, Free Route Airspace eller Area Navigation? [Do pilots prefer Free Route Airspace or Area Navigation?]
Finns det länder som ni undviker att flyga över, även om de har en låg unit-rate? [Are there any countries that you try to avoid, eventhough they have low unit rates?]

Har Ni något att tillägga? [Do you have anything to add?]

Appendix 3
INTERVIEW WITH PETER SANDGREN – OPERATION CENTER MANAGER
Vad är den viktigaste faktor som tas hänsyn till vid färdplanering? [What is the most important factor that needs to be taken into consideration when flight planning?]
Händer det att ni färdplanerar för att undvika höga unit rates? [Do you flight plan in order to avoid high unit rates?]
Finns det länder ni undviker att flyga över? Om ja, vilka?
[Are there countries which you avoid flying through? If yes, which are said countries?]
Hur mycket fritt kan piloterna ändra i färdplanen under en flygning?
[How free are the pilots to change the flight plan during a flight?]
Har ni något att tillägga?
[Do you have anything to add?]

Appendix 4
ENTRY/EXIT POINTS IN SWEDEN No. Waypoint Coordinates Entry (E)/Exit (X)
1 ABAXI 66°47'06.9"N 015°52'33"E X
2 ALAMI 59°02'52"N 020°54'57"E X
3 AMROR 54°53'24"N 015°05'50"E E/X
4 BAKLA 61°21'14.5"N 019°24'57"E E/X
5 BAKLI 54°55'00.0"N 013°33'38.8"E E
6 BEXUL 65°35'34"N 024°09'14"E E/X
7 BIKRU 54°55'00"N 014°10'00"E E/X
8 BODRI 62°24'45.4"N 019°49'27"E E/X
9 BOMGU 58°54'24"N 010°43'07"E E/X
10 DEREX 57°40'22"N 020°12'39"E E/X
11 DETNI 54°55'00"N 014°20'39"E E
12 DODAM 60°02'40"N 019°18'06"E X
13 DOPUD 68°08'29"N 023°19'18"E E/X
14 EGAGO 61°40'33"N 012°13'00"E E/X
15 EKMIK 65°15'06"N 023°43'39"E E/X
16 ESEBA 60°00'46"N 012°23'32"E X
17 EVLAN 60°15'08"N 019°06'43"E E/X
18 EVONA 57°09'54"N 019°55'29"E E/X
19 GELDA 56°52'17"N 019°34'00"E E/X
20 GIKAV 64°02'03.5"N 013°47'37.9"E E/X
21 GILEN 68°01'39"N 017°06'04"E E/X
22 GISON 55°55'54"N 017°42'06"E E/X
23 GORPI 54°55'00"N 015°39'18"E E/X
24 GOSOT 54°48'20.3"N 014°51'28.1"E E/X
25 IRGAL 62°49'50"N 020°00'39"E E/X
26 KELAS 60°28'07"N 019°10'33"E E
27 KOLOB 54°49'23.0"N 014°56'39.1"E E/X
28 KOSKA 59°10'58"N 020°40'34"E E
29 LAMPI 63°32'19"N 021°02'12"E E/X
30 LARMA 55°16'28"N 016°30'06"E E/X
31 LIDNA 66°16'52"N 015°27'39"E E
32 LUPET 59°38'25"N 019°52'35"E E
33 LUSID 54°55'00"N 015°17'46"E E/X
34 MAGON 66°44'07"N 023°53'32"E E/X
35 MASEV 60°10'40"N 012°32'05"E E
36 MIMKI 66°56'09"N 016°05'26"E E/X
37 MISMO 66°10'29"N 023°49'10"E E/X

38 MOGLU 59°07'30"N 011°46'09"E E/X
39 NEBET 67°02'05"N 023°43'01"E E
40 NEBSI 58°54'17.9"N 020°56'28.5"E E/X
41 NEBUR 65°33'28"N 014°30'30"E E/X
42 NEKET 58°18'16"N 020°34'43"E E/X
43 NEREN 58°37'39.8"N 020°46'18.4"E E/X
44 NINTA 56°13'43.6"N 018°17'08.3"E E/X
45 NISIX 59°19'07"N 020°25'54"E E/X
46 NOGBO 64°27'45.3"N 014°06'50.0"E E/X
47 OGLAV 68°49'59"N 021°10'22"E E/X
48 OGLOB 59°55'59"N 019°27'44"E E
49 OKAGA 54°55'00"N 013°45'49"E E
50 OLGUV 62°26'03"N 012°10'53"E E/X
51 OSKOK 62°19'11"N 012°15'44"E E/X
52 PENAX 66°38'10"N 015°40'34"E E/X
53 PENOR 55°38'19"N 017°09'41"E E/X
54 POBEL 68°29'52"N 019°05'55"E E/X
55 POKAS 59°58'53"N 019°26'33"E E
56 POKEN 54°49'10.5"N 014°33'51.3"E E/X
57 RASEL 58°01'40.6"N 020°24'52.8"E E/X
58 REGMA 59°06'32"N 011°20'58"E X
59 REPKU 58°48'21"N 010°36'29"E E/X
60 RIKUM 59°58'15"N 019°24'29"E X
61 RIXEM 68°47'28"N 020°19'29"E E/X
62 ROGED 60°30'46"N 012°36'24"E E/X
63 ROVPA 60°44'01.6"N 012°23'43.8"E E/X
64 RUMAR 55°02'00.7"N 016°04'15.2"E E/X
65 RUNGA 59°44'59"N 019°43'27"E E
66 SALLO 54°55'00.0"N 013°23'10.3"E E/X
67 SOLKA 63°19'51"N 012°03'09"E E/X
68 SUTEV 64°33'14"N 022°44'16"E E/X
69 SUVAR 61°09'05"N 012°43'10"E E/X
70 TIGBA 62°56'14"N 012°07'31"E X
71 TIPEL 67°15'43"N 016°19'48"E E
72 TOGMI 61°45'43"N 019°32'25"E E/X
73 TUMGU 59°53'28"N 012°01'12"E E
74 TUVLU 67°41'26"N 023°29'43"E E/X
75 UNGAV 54°55'00"N 013°59'41"E X
76 USIKI 66°15'27"N 015°23'42"E E/X
77 VALAK 63°25'07"N 020°34'27"E E/X
78 VATEX 59°19'03"N 011°49'14"E E/X
79 VEDEN 56°31'54"N 018°52'36"E E/X
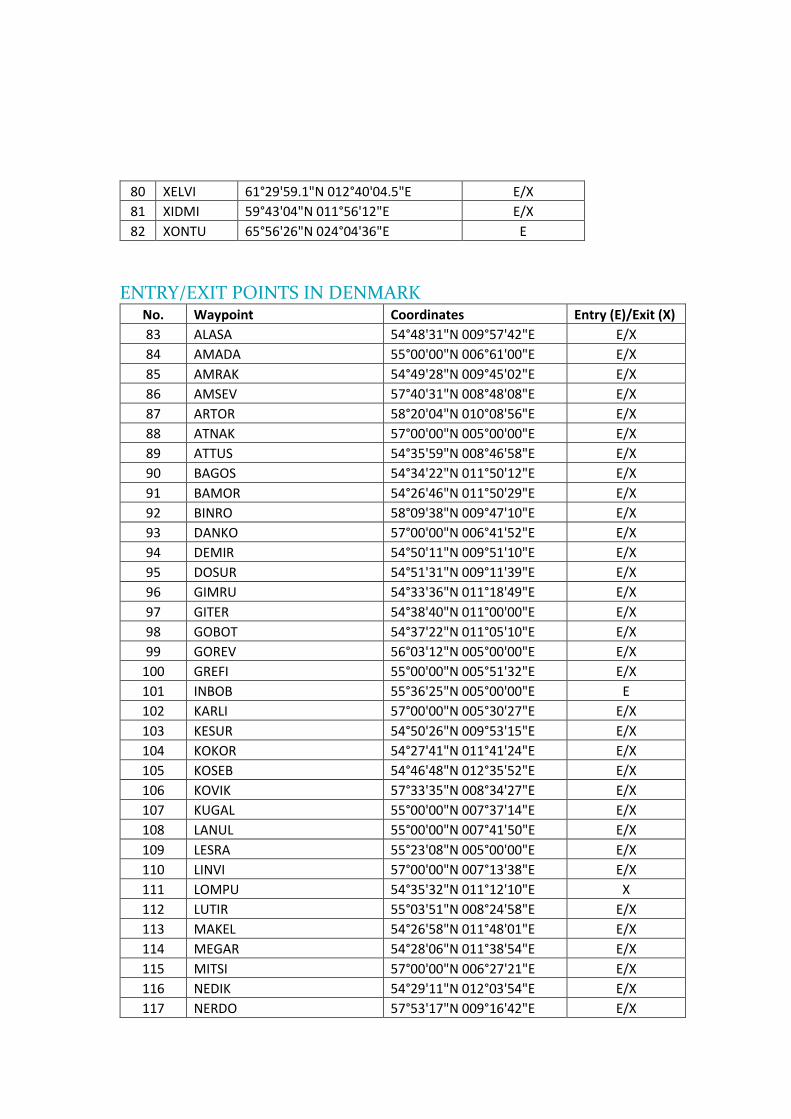
80 XELVI 61°29'59.1"N 012°40'04.5"E E/X
81 XIDMI 59°43'04"N 011°56'12"E E/X
82 XONTU 65°56'26"N 024°04'36"E E
ENTRY/EXIT POINTS IN DENMARK No. Waypoint Coordinates Entry (E)/Exit (X)
83 ALASA 54°48'31"N 009°57'42"E E/X
84 AMADA 55°00'00"N 006°61'00"E E/X
85 AMRAK 54°49'28"N 009°45'02"E E/X
86 AMSEV 57°40'31"N 008°48'08"E E/X
87 ARTOR 58°20'04"N 010°08'56"E E/X
88 ATNAK 57°00'00"N 005°00'00"E E/X
89 ATTUS 54°35'59"N 008°46'58"E E/X
90 BAGOS 54°34'22"N 011°50'12"E E/X
91 BAMOR 54°26'46"N 011°50'29"E E/X
92 BINRO 58°09'38"N 009°47'10"E E/X
93 DANKO 57°00'00"N 006°41'52"E E/X
94 DEMIR 54°50'11"N 009°51'10"E E/X
95 DOSUR 54°51'31"N 009°11'39"E E/X
96 GIMRU 54°33'36"N 011°18'49"E E/X
97 GITER 54°38'40"N 011°00'00"E E/X
98 GOBOT 54°37'22"N 011°05'10"E E/X
99 GOREV 56°03'12"N 005°00'00"E E/X
100 GREFI 55°00'00"N 005°51'32"E E/X
101 INBOB 55°36'25"N 005°00'00"E E
102 KARLI 57°00'00"N 005°30'27"E E/X
103 KESUR 54°50'26"N 009°53'15"E E/X
104 KOKOR 54°27'41"N 011°41'24"E E/X
105 KOSEB 54°46'48"N 012°35'52"E E/X
106 KOVIK 57°33'35"N 008°34'27"E E/X
107 KUGAL 55°00'00"N 007°37'14"E E/X
108 LANUL 55°00'00"N 007°41'50"E E/X
109 LESRA 55°23'08"N 005°00'00"E E/X
110 LINVI 57°00'00"N 007°13'38"E E/X
111 LOMPU 54°35'32"N 011°12'10"E X
112 LUTIR 55°03'51"N 008°24'58"E E/X
113 MAKEL 54°26'58"N 011°48'01"E E/X
114 MEGAR 54°28'06"N 011°38'54"E E/X
115 MITSI 57°00'00"N 006°27'21"E E/X
116 NEDIK 54°29'11"N 012°03'54"E E/X
117 NERDO 57°53'17"N 009°16'42"E E/X
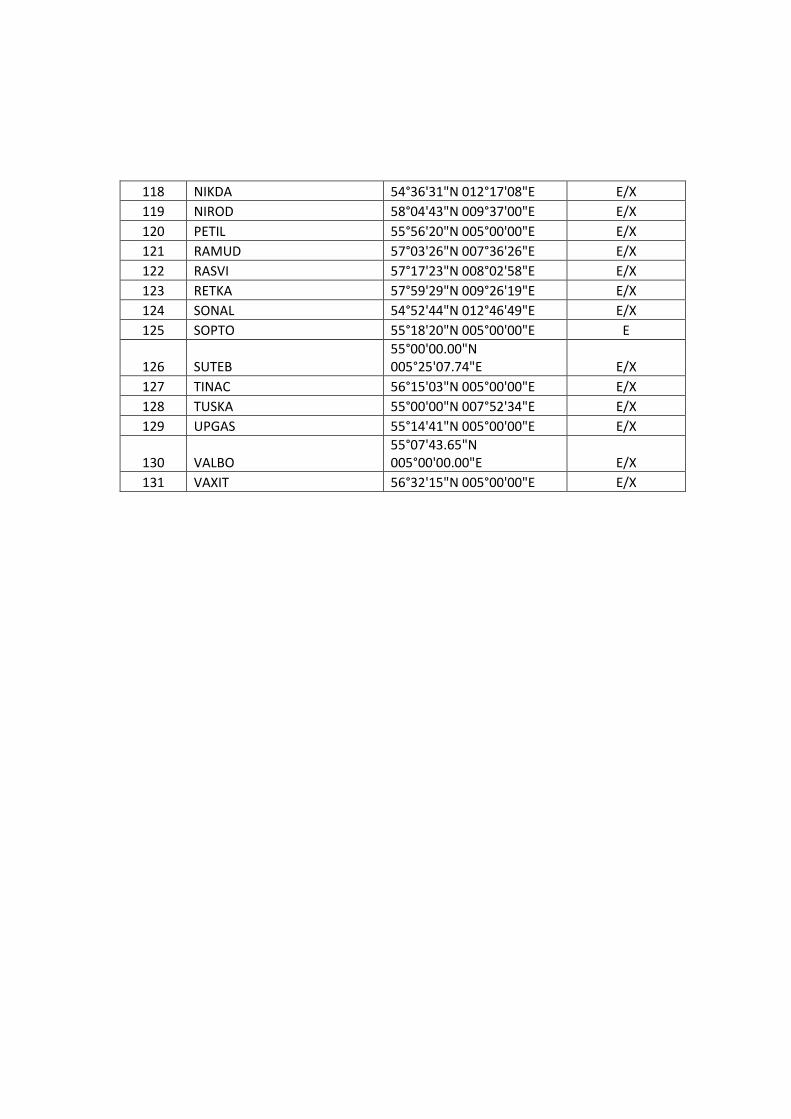
118 NIKDA 54°36'31"N 012°17'08"E E/X
119 NIROD 58°04'43"N 009°37'00"E E/X
120 PETIL 55°56'20"N 005°00'00"E E/X
121 RAMUD 57°03'26"N 007°36'26"E E/X
122 RASVI 57°17'23"N 008°02'58"E E/X
123 RETKA 57°59'29"N 009°26'19"E E/X
124 SONAL 54°52'44"N 012°46'49"E E/X
125 SOPTO 55°18'20"N 005°00'00"E E
126 SUTEB
55°00'00.00"N
005°25'07.74"E E/X
127 TINAC 56°15'03"N 005°00'00"E E/X
128 TUSKA 55°00'00"N 007°52'34"E E/X
129 UPGAS 55°14'41"N 005°00'00"E E/X
130 VALBO
55°07'43.65"N
005°00'00.00"E E/X
131 VAXIT 56°32'15"N 005°00'00"E E/X

Appendix 5
INTERNATIONAL WAYPOINTS Estonia Longitude г ヲン° No. Waypoint Coordinates
132 LATEG ヵΑ°ヴヶ’ヲΑ”N ヰヲヲ°ヰヶ’ヱヶ”E
133 LEMSI ヵΓ°ヰヰ’ヴΓ”N ヰヲヲ°ヴΒ’ヲヲ”E
134 LOGNA ヵΑ°ヵヰ’ンヵ”N ヰヲヱ°ンΓ’ンΑ”E
135 LONSA ヵΓ°ヰヴ’ヵヶ”N ヰヲン°ヵヰ’ヰヴ”E
136 LUTAL ヵΑ°ンヵ’ヵΒ”N ヰヲン°ヵヴ’ヵン”E
137 MASIS ヵΒ°ンΓ’ヲヱ”N ヰヲン°ヲヲ’ヰΓ”E
138 MOLOK ヵΒ°ヰヶ’ヵヴ”N ヰヲヲ°ヰヱ’ンヱ”E
139 NEREN ヵΒ°ンΑ’ヴヰ”N ヰヲヰ°ヴヶ’Βヰ”E
140 NETNA ヵΑ°ヵヲ’ンヲ”N ヰヲヲ°ヴΑ’ヲヲ”E
141 ODVIN ヵΒ°ヵヰ’ヰヵ”N ヰヲン°ヰヱ’ンン”E
142 OSMUR ヵΓ°ヱヴ’ヵΑ”N ヰヲン°ヲΒ’ンン”E
143 PIMEX ヵΒ°ヱヲ’ヴヶ”N ヰヲヱ°ヱヲ’ヵヲ”E
144 ROSAX ヵΓ°ヲΒ’ンヵ”N ヰヲン°ヴヶ’ヴヶ”E
145 SUVIX ヵΒ°ヴヱ’ヲヶ”N ヰヲヲ°ンヵ’ンヶ”E
146 TODNA ヵΒ°ヰヰ’ヱヲ”N ヰヲヱ°ンン’ヰΓ”E
147 VADAN ヵΓ°ヰΒ’ヵヰ”N ヰヲン°ヴヱ’ヴヲ”E
148 VATOS ヵΒ°ヲΑ’ヲΓ”N ヰヲヲ°ヲΓ’ヴヴ”E
Latvia Longitude г ヲヲ° No. Waypoint Coordinates
149 ADAXA ヵヶ°ヱΑ’ヵヲ”N ヰヱΒ°ヵン’ヵヴ”E
10 DEREX ヵΑ°ヴヰ’ヲヲ”N ヰヲヰ°ヱヲ’ンΓ”E
150 DESON ヵヶ°ヵン’ヴヱ”N ヰヲヰ°ヲヵ’ヱン”E
151 EDERA ヵΑ°ヰΒ’ヲΑ”N ヰヲヰ°ンヵ’ンΒ”E
18 EVONA ヵΑ°ヰΓ’ヵヴ”N ヰヱΓ°ヵヵ’ヲΓ”E
152 GARSO ヵヶ°ヰΒ’ヴヶ”N ヰヲヰ°ヰヴ’ヵヶ”E
19 GELDA ヵヶ°ヵヲ’ヱΑ”N ヰヱΓ°ンヴ’ヰヰ”E
153 GOBEK ヵヶ°ンン’ヵヱ”N ヰヲヲ°ンヱ’ヵヵ”E
154 LAPSA ヵΑ°ヲヰ’ヱン”N ヰヲヲ°ンΒ’ヱン”E
155 LASMA ヵヶ°ヲヶ’ヰΑ”N ヰヲヰ°ヱヲ’ヵヵ”E
156 LELDA ヵΑ°ヲヶ’ヱヵ”N ヰヲヲ°ヴヶ’ンン”E
157 LUKED ヵヶ°ンヱ’ヰΑ”N ヰヲヰ°ヰヵ’ンヵ”E
158 LUSIM ヵΑ°ヴヱ’ヰΒ”N ヰヲヱ°ヵΒ’ヵΓ”E
159 MILTA ヵΑ°ヴヱ’ヱΑ”N ヰヲヱ°ヲΑ’ヱΓ”E
160 NATAN ヵΒ°ヰヱ’ヱヶ”N ヰヲヱ°ンヲ’ンン”E
42 NEKET ヵΒ°ヱΒ’ヱヶ”N ヰヲヰ°ンヴ’ヴン”E

161 OKLAD ヵヶ°ヵヴ’ヲヱ”N ヰヲヰ°ヴヴ’ンヵ”E
162 ORVIX ヵヶ°ヵヴ’ヰΓ”N ヰヲヲ°ヲヲ’ヴヵ”E
57 RASEL ヵΒ°ヰヱ’ヴヱ”N ヰヲヰ°ヲヴ’ヵン”E
163 RUCAV ヵヶ°ヰヴ’ヲヶ”N ヰヲヱ°ヰヵ’ンΑ”E
164 RUTEK ヵΑ°ヵヴ’ヲヲ”N ヰヲヱ°ヰΒ’ヵΒ”E
165 SOPUN ヵΑ°ヵヰ’ンΓ”N ヰヲヰ°ヵΒ’ヵΓ”E
166 TENSI ヵΑ°ヰン’ヴΑ”N ヰヲヲ°ヱΓ’ヲヰ”E
167 VALED ヵヶ°ヴン’ヱヱ”N ヰヲヲ°ヲΑ’ヴン”E
79 VEDEN ヵヶ°ンヱ’ヵヴ”N ヰヱΒ°ヵヲ’ンヶ”E
168 VENOR ヵΑ°ヵヲ’ヰヲ”N ヰヲヱ°ヱヲ’ヱヶ”E
Lithuania Longitude г ヲヲ° No. Waypoint Coordinates
169 AKUMA ヵヵ°ヱヱ’ンΒ”N ヰヲヲ°ヴヵ’ヱヱ”E
170 ASKOR ヵヶ°ヲヲ’ヵΒ”N ヰヲヲ°ンヶ’ヴヶ”E
171 BALIT ヵヵ°ヴΒ’ンΑ”N ヰヱΓ°ヰヵ’ヲΒ”E
172 BUMUG ヵヵ°ヴヴ’ヰヲ”N ヰヲヰ°ヱヶ’ヲヴ”E
173 GILUT ヵヵ°ヲヱ’ヱΒ”N ヰヲヱ°ヴヰ’ヱΓ”E
174 IAN05 ヵヵ°ヵΓ’ヱΓ.ヲΒ”N ヰヲヱ°ヰヶ’ヰヵ.ンン”E
175 IAN20 ヵヶ°ヰヰ’ヴヰ.ヴΓ”N ヰヲヱ°ヰヶ’ヴヱ.Βヵ”E
176 IAN43 ヵヶ°ヰヲ’ヵヴ.ヰΒ”N ヰヲヱ°ヰΑ’ヴヲ.ヲヰ”E
177 KEDUX ヵヶ°ヱヲ’ヴヶ”N ヰヱΓ°ンヴ’ヲヴ”E
178 KLA12 ヵヵ°ヵヴ’ヰΓ.ヵΒ”N ヰヲヱ°ヲヱ’ンヰ.Γヶ”E
179 KLA17 ヵヵ°ヵヴ’ヰヰ.ヶΓ”N ヰヲヰ°ヴΓ’ヱΑ.ΑΓ”E
180 KLA27 ヵヶ°ヰヱ’ヰヵ.ヱヶ”N ヰヲヰ°ヵヵ’ヰΑ.Γヰ”E
181 KRAKI ヵヴ°ヵヶ’ヲΓ”N ヰヲヲ°ヴヴ’ヰヵ”E
182 MANUX ヵヵ°ヴヰ’ンヴ”N ヰヲヲ°ヰヲ’ヰΒ”E
183 MIRMA ヵヶ°ヲヵ’ヲヱ”N ヰヲヲ°ヰΓ’ヴン”E
44 NINTA ヵヶ°ヱン’ヴヴ”N ヰヱΒ°ヱΑ’ヰΒ”E
184 PN034 ヵヶ°ヰヵ’ヴヱ.ヶヰ”N ヰヲヱ°ヰヲ’ヰヶ.ヶン”E
185 PN043 ヵヶ°ヰヲ’ヵヵ.ンヱ”N ヰヲヱ°ヰΑ’ンヲ.ンΓ”E
186 R2196 ヵヵ°ヵΑ’ヵヱ.Γヲ”N ヰヲヱ°ヰヵ’ヲヵ.ヱヲ”E
187 R2197 ヵヵ°ヵΒ’ヵヴ.ンヵ”N ヰヲヱ°ヰヵ’ヵヰ.ヲΑ”E
188 RONUS ヵヶ°ヰヵ’ヲヵ”N ヰヲヰ°ヲΓ’ヴヴ”E
189 RUSNE ヵヵ°ヱヴ’ヰΑ”N ヰヲヱ°ヲヶ’ヱΑ”E
190 TIGNU ヵヵ°ンヶ’ヱン”N ヰヱΓ°ヵヰ’ヱΒ”E
191 TIRIN ヵヶ°ヰヴ’ヰヲ”N ヰヲヰ°ヴヴ’ヵヲ”E
192 TOTRA ヵヵ°ヲヶ’ンヵ”N ヰヲヲ°ヴヶ’ヱヶ”E
193 VALUV ヵヵ°ヴヱ’ンヲ”N ヰヲヰ°ヰΑ’ヵΓ”E

Poland Latitude д ヵヴ°ヲ0 & Longitude г ヲ0°
No. Waypoint Coordinates
194 AMPAK ヵヵ°ヱヲ’ヰΒ”N ヰヱΑ°ヰΑ’ヱヶ”E
3 AMROR ヵヴ°ヵン’ヲヴ”N ヰヱヵ°ヰヵ’ヵヰ”E
195 BABEN ヵヴ°ヲン’ヱΑ”N ヰヱヵ°ヱヴ’ンヱ”E
196 DEVEL ヵヴ°ヴン’ヵヱ”N ヰヱヵ°ヴヴ’ヵン”E
197 DOMAG ヵヴ°ヵΒ’ヲΒ”N ヰヱΑ°ヴヱ’ヰΒ”E
198 ELPOL ヵヴ°ンヶ’ヲン”N ヰヱヵ°ンΒ’ヰヲ”E
199 GDA08 ヵヴ°ヲヲ’ヰヰ.ヵヵ”N ヰヱΒ°ンヰ’ヲン.ヱヵ”E
200 GDA38 ヵヴ°ヲヰ’ヴヶ.ヲΑ”N ヰヱΒ°ンヵ’ヰヲ.Γヱ”E
24 GOSOT ヵヴ°ヴΒ’ヲヰ”N ヰヱヴ°ヵヱ’ヲΒ”E
201 IPLIT ヵヴ°ンΒ’ヱヶ”N ヰヱΓ°ヲヱ’ヲヰ”E
202 KEMUM ヵヴ°ヲΓ’ヰヵ”N ヰヱΑ°ヲΒ’ヲン”E
27 KOLOB ヵヴ°ヴΓ’ヲン”N ヰヱヴ°ヵヶ’ンΓ”E
203 KUNER ヵヵ°ヱヵ’ンヱ”N ヰヱΒ°ヲヶ’ヵン”E
30 LARMA ヵヵ°ヱヶ’ンヰ.ヲヵ”N ヰヱヶ°ンヰ’ヰヱ.ヰΓ”E
204 LATMI ヵヵ°ヲヶ’ヵヵ”N ヰヱΒ°ヱヰ’ヰヲ”E
33 LUSID ヵヴ°ヵヵ’ヰヰ”N ヰヱヵ°ヱΑ’ヴヶ”E
205 MOTAD ヵヵ°ヱヲ’ンヴ”N ヰヱΑ°ンヰ’ヲヰ”E
206 PIVET ヵヴ°ヵヲ’ヲΒ”N ヰヱヵ°ヵヰ’ヲン”E
56 POKEN ヵヴ°ヴΓ’ヱヱ”N ヰヱヴ°ンン’ヵヱ”E
207 R1850 ヵヴ°ヲヲ’ヱヶ.ヵヶ”N ヰヱΒ°ヲΓ’ンヰ.ヱΒ”E
208 RANOK ヵヴ°ヵヴ’ヴヶ”N ヰヱΒ°ヵΑ’ンヰ”E
209 SUROD ヵヴ°ンΑ’ヲヵ”N ヰヱヶ°ヵヴ’ヱヶ”E
210 TILAV ヵヴ°ヲヴ’ヵΓ”N ヰヱヵ°ヰヰ’ヰヰ”E
211 VAPOS ヵヴ°ヴΑ’ヴン”N ヰヱΑ°ヴΓ’ンヶ”E
212 VIBUL ヵヴ°ヲヰ’ンヰ”N ヰヱヵ°ヱヶ’ヲΒ”E