env415 air pollution control engineering
TRANSCRIPT

8/14/2019 ENV415 Air Pollution Control Engineering
http://slidepdf.com/reader/full/env415-air-pollution-control-engineering 1/98

8/14/2019 ENV415 Air Pollution Control Engineering
http://slidepdf.com/reader/full/env415-air-pollution-control-engineering 2/98
Ai r Regulations and Publ ic Pol icy(TÜRK YE)
Air Regu lat ions and Public Policy(TÜRK YE)
Ai r Regulations and Publ ic Pol icy(TÜRK YE)
Air Regu lat ions and Public Policy(TÜRK YE)

8/14/2019 ENV415 Air Pollution Control Engineering
http://slidepdf.com/reader/full/env415-air-pollution-control-engineering 3/98
Ai r Regulations and Publ ic Pol icy(TÜRK YE)
Air Regu lat ions and Public Policy(TÜRK YE)
Ai r Regulations and Publ ic Pol icy(TÜRK YE)
Air Regu lat ions and Public Policy(TÜRK YE)

8/14/2019 ENV415 Air Pollution Control Engineering
http://slidepdf.com/reader/full/env415-air-pollution-control-engineering 4/98
http://www.cevreonline.com/index.htm http://www.testmer.com.tr/alt_kategori.asp?id=134
Ai r Regulations and Publ ic Pol icy(TÜRK YE)
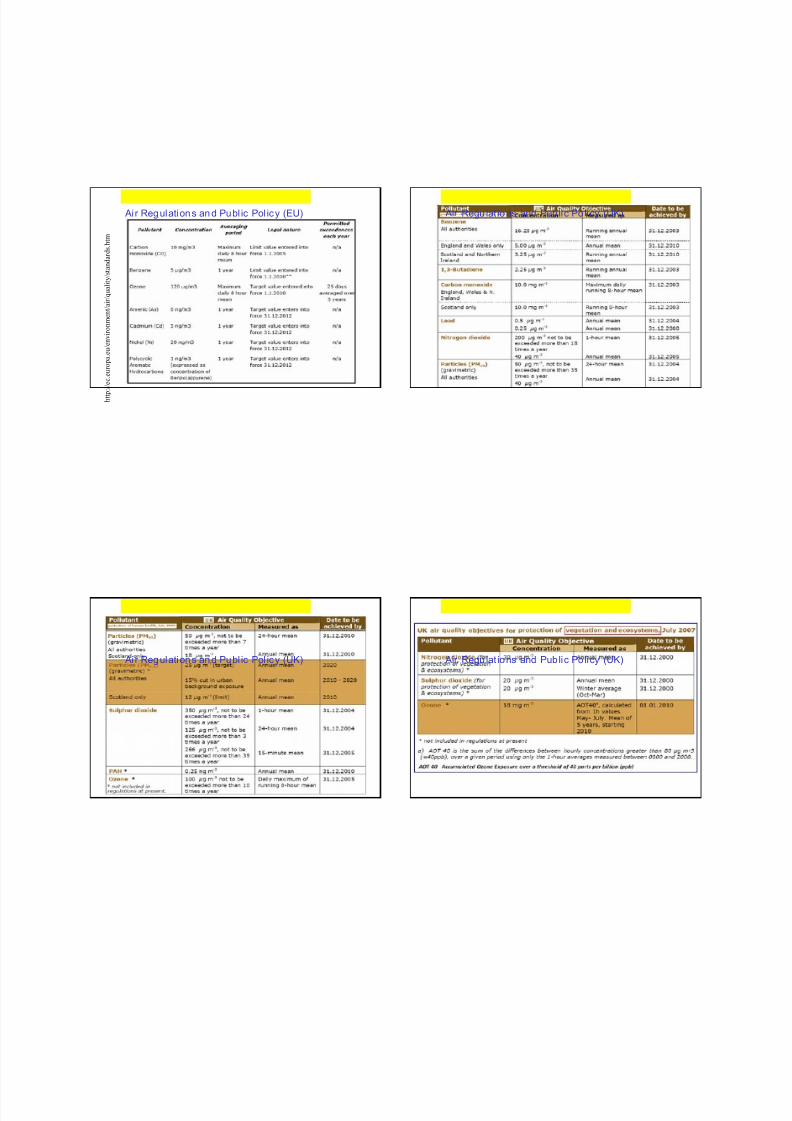
Air Regu lat ions and Public Policy (EU)
Ai r Regulations and Publ ic Pol icy (EU)
http://www.epa.gov/air/criteria.html
Air Regu lat ions and Public Policy (USA-EPA)
8/14/2019 ENV415 Air Pollution Control Engineering
http://slidepdf.com/reader/full/env415-air-pollution-control-engineering 5/98
h t t p : / / e c .
e u r o p a . e u / e n v i r o n m e n t / a i r / q u a l i t y / s t a n d a r d s . h
t m
Ai r Regulations and Publ ic Pol icy (EU) Air Regu lat ions and Public Policy (UK)
Ai r Regulations and Publ ic Pol icy (UK) Air Regu lat ions and Public Policy (UK)

8/14/2019 ENV415 Air Pollution Control Engineering
http://slidepdf.com/reader/full/env415-air-pollution-control-engineering 6/98
21
What are the Pollutants?
National Ambient Ai r Quality Standards (NAAQS)
Primary pollutant: emitted directlySecondary pollutant: formed by chemical reactions among primary pollutants
*VOC: Volatile Organic Compound; 1health related; 2welfare related
Reading: Chap 1.1-1.4, 1.8-1.9
Pollutant Average Time Primary Standard 1 Secondary Standard 2
PM10 24-hour 150 µg/m3 Same as Primary
PM2.5 Annual 15 µg/m3 Same as Primary24-hour 35 µg/m3 Same as Primary
SO2 Annual 0.03 ppmv
24-hour 0.14 ppmv 3-hour 0.5 ppm (1300 µg/m3)
NO2 Annual 0.053 ppmv (100 µg/m3) Same as Primary
CO 8-hour 9 ppmv (10 mg/m3) None1-hour 35 ppmv (40 mg/m3) None
O3 8-hour 0.075 ppmv (2008 std) Same as Primary
8-hour 0.08 ppmv (1997 std) Same as Primary1-hour 0.12 ppmv Same as Primary
Pb Rolling 3-month average 0.15 µg/m3 (2008 std) Same as PrimaryQuarterly average 1.5 µg/m3 Same as Primary
22
Air Pollut ion Index (API) /Pollutants Standard Index (PSI)
• Segmented linear function connected by straight lines• Overall API is the maximum of all the sub-index values
API Value Air Quali ty Descriptor
0-50 Good
51-100 Moderate
101-199 Unhealthful
200-299 Very unhealthful
300 Hazardous
http://airnow.gov/index.cfm?action=airnow.national
23
Air Pollu tion Ind ex
0
100
200
300
400
500
0 1000 2000 3000 4000Pollutant Conc (ug/m3)
P S I S u b I n
d e x
TSP
SO2
TSP X SO2
CO
O3
NO2
Value 24 hr TSP
g/m3
24 hr SO2
g/m3
TSPXSO2
g/m3)2
8 hr CO
mg/m3
8 hr O3
g/m3
1 hr NO2
g/m3
0 0 0 N/A 0 0 N/A
50 75 80 N/A 5 118 N/A
100 260 365 N/A 10 235 N/A
200 375 800 65,000 17 400 1130
300 625 1600 261,000 34 800 2260
400 875 2100 393,000 46 1000 3000
500 1000 2620 490,000 57.5 1200 3750
Calculate the API of the following: 7 mg/m3 CO, 300 g/m3 TSP, 300 g/m3 SO2
24
Sources
Q: What are the most important sources for each criteria pollutant?What are the major sources in Alachua County?
Source Category CO NOx VOCs SO2 PM10 PM2.5
1998 200 8 1998 2008 199 8 2008 1998 2008 1998 2008 199 8 2008
Transportation Sources
Highway Vehicles 73.2 38.9 8.6 5.2 3.4 5.9 <0.1 0.3 0.3 0.2 0.1 0.2Off-Highway 23.7 18.0 4.2 4.3 2.6 2.7 0.5 0.4 0.3 0.3 0.3 0.3
Stationary Sources
Fuel CombustionElectric Utilities 0.5 0.7 6.2 3.0 <0.1 <0.1 7.6 13.4 0.2 0.5 0.5 0.1Industrial Furnaces 1.2 1.2 3.0 1.8 0.1 0.2 1.7 2.7 0.2 0.3 0.2 0.1Residential and Other 2.7 3.4 1.1 7.3 1.3 0.9 0.6 0.6 0.4 0.5 0.4 0.4
Industrial ProcessesChemical and Allied Product MFG 1.1 0.3 0.1 <0.1 0.2 0.4 0.3 0.3 <0.1 <0.1 <0.1 <0.1Petroleum & Related Industries 0.4 0.4 <0.1 <0.1 0.6 0.5 0.2 0.3 0.2 0.1 <0.1 <0.1Metal Processing 1.7 0.9 <0.1 <0.1 <0.1 <0.1 0.2 0.4 <0.1 <0.1 <0.1 0.1Other Industrial Processes 0.6 0.5 0.5 0.4 0.4 0.4 0.3 0.4 0.3 1.0 0.4 0.2Solvent Utilization <0.1 <0.1 <0.1 <0.1 4.2 5.1 <0.1 <0.1 <0.1 <0.1 <0.1 <0.1Storage & Transport <0.1 0.1 <0.1 <0.1 1.3 1.3 <0.1 <0.1 <0.1 <0.1 <0.1 <0.1
Waste Disposal & Recycling 3.1 1.6 0.2 0.1 0.4 0.5 <0.1 <0.1 0.5 0.3 0.3 0.5
Miscellaneous 0.7 11.7 0.2 0.2 1.3 0.7 <0.1 <0.1 20.3 11.5 2.7 4.3
Total 115.4 77.7 24.3 16.3 15.9 18.8 11.4 18.9 22.9 14.8 4.9 6.3
Miscellaneous PM is mainly from fugitive, agricultural sources and fire
National US Emissions, 1998 and 2008 (millions of tons per year)

8/14/2019 ENV415 Air Pollution Control Engineering
http://slidepdf.com/reader/full/env415-air-pollution-control-engineering 7/98
25
Source Performance Standards• New Source Performance Standards (NSPS’s):
mass emission rates applied to new sources forspecific pollutants from specific sources
• National Emission Standards for Hazardous Air Pollutants (NESHAP’s): emission rates forhazardous air pollutants that do not have NAAQSbut may result in “an increase in seriousirreversible, or in capacitating, reversible illness”.
• Standards can be based on mass, energy orprocess weight Why?
• Tier II Standards: emission rates per mile formobile sources
26
Prevention of Significant Deterioration• Prevent polluting clean air up to the ambient standards
by simply locating industry in clean air region
• Class I: Pristine; Class II: Almost all other; Class III:
Industrialized
Federal PSD Allowable Increments
Any difference between classes?
75371024-hr max
37195Annual geometric meanPM-10
700512253-hour max
18291524-hr max
40202Annual average
SO2
Class IIIClass IIClass IPollutant
Allowable increment g/m3
Q: Can I move my factory to Yellowstone NP where the air
quality is better than NAAQS?
27
Criteria for Selecting Appropriate AirPollution Control Device
• Degree of reduction of emissions
required to meet emission standards
• Process and effluent characteristics• Equipment capacities, efficiency and
limitations
• Capital investment and operation costs
28
Structure of the class
Fundamentals
Particulate Control
Devices
Gas PropertiesParticle Characteristics
Energy
CycloneElectrostatic Precipitator (ESP)
Fabric Filter Particulate Scrubber
Mobile Source
AdsorptionAbsorptionIncineration NOx, SOx
Gas Control
Devices

8/14/2019 ENV415 Air Pollution Control Engineering
http://slidepdf.com/reader/full/env415-air-pollution-control-engineering 8/98
29
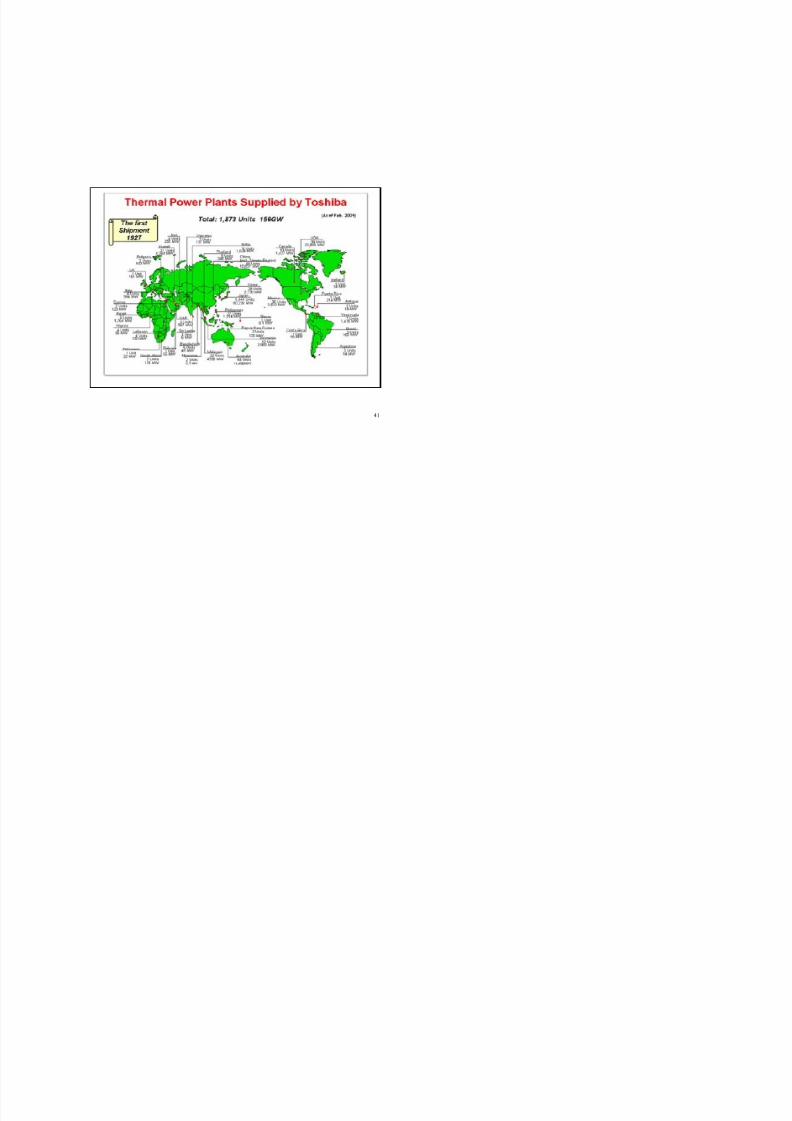
Termal Power Plant
30
31 32

8/14/2019 ENV415 Air Pollution Control Engineering
http://slidepdf.com/reader/full/env415-air-pollution-control-engineering 9/98
33 34
35 36
Method Absorbent/
Adsorbent
Byproducts
Wet Type
NaOH or Na2SO3
solution Na2SO3, NaNO3, SO2,gypsum
NH3-Water (NH4)2SO4, SO2, gypsum,S
Slaked lime orlimestone slurry
Gypsum
Mg(OH)2-slurry SO2, gypsum (blendedwith slaked lime slurry)
Basic Al2(SO4)3-solution gypsum
Gypsum
Dilute-H2SO4 Gypsum
Dry Type Activated carbon (NH4)2SO4, gypsum, S,H2SO4
Flue Gas Desulphurization Methods (FGD)

8/14/2019 ENV415 Air Pollution Control Engineering
http://slidepdf.com/reader/full/env415-air-pollution-control-engineering 10/98
37
Flue Gas Desulphurization Methods (FGD)
38
39
Air Pollu tion Control
Termal power plant
40
Yanma Sonrası CO2 Giderme
8/14/2019 ENV415 Air Pollution Control Engineering
http://slidepdf.com/reader/full/env415-air-pollution-control-engineering 11/98

8/14/2019 ENV415 Air Pollution Control Engineering
http://slidepdf.com/reader/full/env415-air-pollution-control-engineering 12/98
27.11.2012 1
Properties of Gases
• Ideal gas law
• Unit of concentration
• Vapor pressure & partial pressure
• Solubility
• Energy
• Humidity & psychrometric chart
• Cooling
Reading:
Chap 1.5-1.7, 10, 7.3, 8.5
27.11.2012 2
Ideal Gas Law
Other references:
1. CRC Handbook of Chemistry & Physics
2. Perry’s Chemical Engineers’ Handbook
T RnQP
T R MW P
T R MW
M
T RnV P
82.057
8.3148.314
8.314
27.11.2012 3
Unit of Concentration
Is 1 g/cm3 SO2 equal to 1 ppb SO2?
The annual standard of NO2 is 100 g/m3. What is the
concentration in ppb?
Is “ppm” molar basis, volume basis or mass basis?
What’s the difference between “ ACFM” and “SCFM” ?
27.11.2012 4
Vapor Pressure
The pressure required to maintain a vapor in equilibrium
with the condensed vapor (liquid or solid) with a flat
surface at a specified temperature
(Saturation)
Vapor PressureTime to reach equilibrium
How does vapor p ressure change if the temperature increases?
T C
B AT Pv
)(log Pv in mmHg and T in oC (if Table 9.2 is used)

8/14/2019 ENV415 Air Pollution Control Engineering
http://slidepdf.com/reader/full/env415-air-pollution-control-engineering 13/98
27.11.2012 5 27.11.2012 6
What is the vapor pr essure of water at 20 oC? If the
measurement is conducted on Mars (the atmosphericpressure is about 0.006 atm), what will be the value?
27.11.2012 7 27.11.2012 8
Partial Pressure: the pressure that a gas (or vapor) in a
mixture of gases would exert if it were to occupy the entire
volume occupied by the mixture
T A A P yP
)100( )(
S RH T P
PS
v
A
Supersaturation: S > 1 ( RH > 100%)
Saturation Ratio(or relative humidity for water)
y A: mole fraction of component A
in the mixture in the gas phase
PT : total pressure of the system
Q: After a shower at dusk, the temperature starts to drop. How do PV and P A change correspondingly? Can you predict the weather at dawn?
1 mole of
O2 @ 1 atm
4 moles of N2
Q: How much is PO2?

8/14/2019 ENV415 Air Pollution Control Engineering
http://slidepdf.com/reader/full/env415-air-pollution-control-engineering 14/98
27.11.2012 9
SolubilityHenry’s Law: the concentration of a gas dissolved in solution
is proportional to its partial pressure at a constant temperature
A A HxP
A A x H y 1or
H : pressure/
mole fraction in liquid
H 1: mole fraction in vapor/
mole fraction in liquid
H
Q: Is H a constant at a given temperature?
27.11.2012 10
Solubility Data for NH3 in Water
27.11.2012 11
Solubility Data for SO2 in Water
27.11.2012 12
Energy
• Heat Capacity: the amount of energy required toraise the temperature of the substance by 1 oC.
Q: Which one requires mor e energy to raise 1 oC?Water or copper?
• Specific Heat Capacity (Cp or Cv): heat capacity on
a unit mass basis (also a molar basis for gas)• Enthalpy: the difference of energy compared to that
at reference temperature (25 oC or 60 oF) – see TableB.7
• For liquid like water, the latent heat (HL, energy ofvaporization) also needs to be included.
)( 0T T C H p
Q: How much energy can we extract from 2 kg of air cooling from 100 to 50oC? (Table A.1 next page)
Q: Is energy important in APCD? Why?

8/14/2019 ENV415 Air Pollution Control Engineering
http://slidepdf.com/reader/full/env415-air-pollution-control-engineering 15/98
27.11.2012 13
Handout
27.11.2012 14
Humidity in Air/Water Mixture
• The state of an air/water mixture is
determined by pressure, temperature
& humidity
• Psychometric Chart (Figures B.3 &
B.4 or Handout)
– Dry bulb temperature
– Wet bulb temperature: the
temperature at which a thermometer
with a wet wick wrapped around thebulb stabilizes
Q: Why is T DB always higher than T WB?
Q: Properties of TDB of 40 oC and TWB of 30 oC?
Q: If a stream of moist air is cooled and humidified adiabaticallyfrom TDB of 40 oC and TWB of 30 oC to TDB of 32 oC, how much is the change of
water per pound of dry air?
http://www.usatoday.com/weather/wsling.htm
27.11.2012 15http://howard.engr.siu.edu/staff1/tech/MET/ET401/LAB/psychro_carrier_si.jpg
27.11.2012 16
Cooling
• Dilution with ambient air (pros & cons?)
– Mass balance and energy balance
• Injection with water: remember to add latent
heat for vaporization (pros & cons?)
mixair gas
mixmixair air gasgas
mmm
H m H m H m
gas
air
air mix
mixgas
gasair T
T
T T
T T QQ
Q: Why is cooling of exhaust necessary?
Q: What options do we have?
8/14/2019 ENV415 Air Pollution Control Engineering
http://slidepdf.com/reader/full/env415-air-pollution-control-engineering 16/98
27.11.2012 17
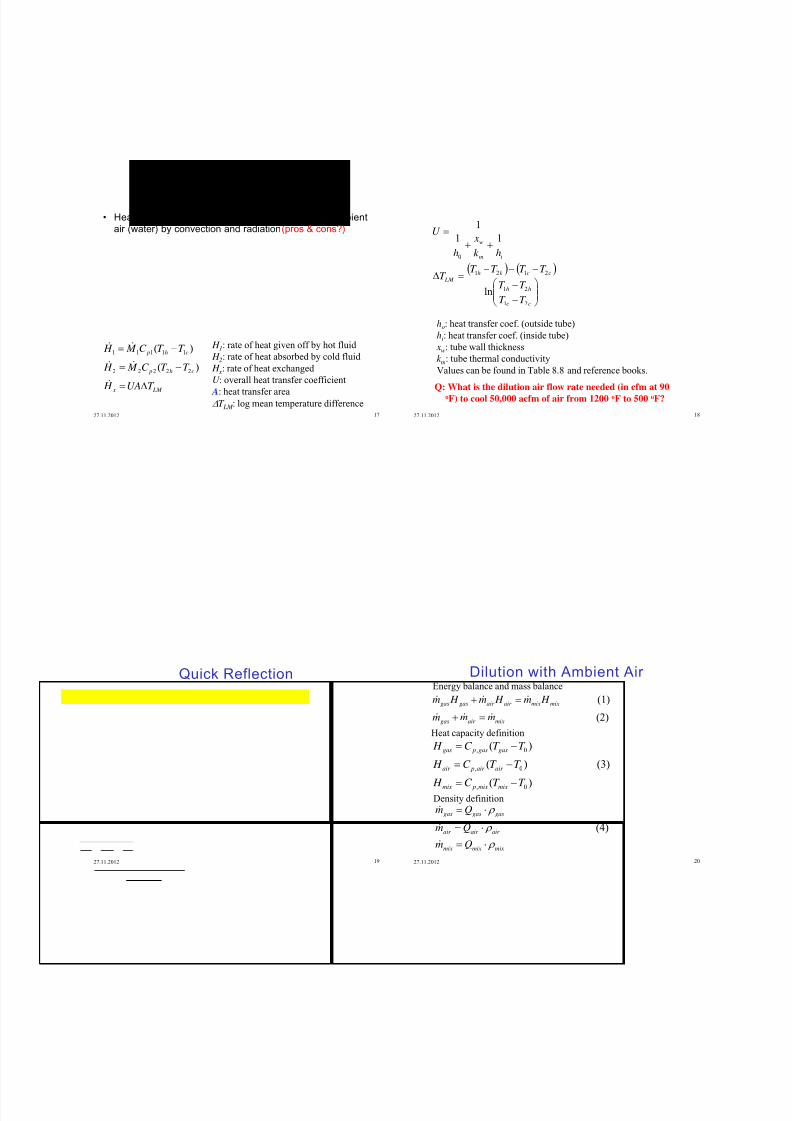
• Heat Exchanger: large U-tubes to transfer heat to ambient
air (water) by convection and radiation (pros & cons?)
LM x
ch p
ch p
T UA H
T T C M H
T T C M H
)(
)(
22222
11111 H 1: rate of heat given off by hot fluid
H 2: rate of heat absorbed by cold fluid
H x: rate of heat exchanged
U : overall heat transfer coefficient A: heat transfer area
T LM : log mean temperature difference27.11.2012 18
cc
hh
cchh LM
im
w
T T
T T
T T T T T
hk
x
h
U
21
21
2121
0
ln
11
1
ho: heat transfer coef. (outside tube)
hi: heat transfer coef. (inside tube)
xw: tube wall thickness
k m: tube thermal conductivity
Values can be found in Table 8.8 and reference books.
Q: What is the dilution air flow rate needed (in cfm at 90oF) to cool 50,000 acfm of air from 1200 oF to 500 oF?
27.11.2012 19
Quick Reflection
27.11.2012 20
Dilution with Ambient Air
)(
(3) )(
)(
0,
0,
0,
T T C H
T T C H
T T C H
mixmix pmix
air air pair
gasgas pgas
(2)
(1)
mixair gas
mixmixair air gasgas
mmm
H m H m H m
Heat capacity definition
Energy balance and mass balance
Density definition
mixmixmix
air air air
gasgasgas
Qm
Qm
Qm
(4)
8/14/2019 ENV415 Air Pollution Control Engineering
http://slidepdf.com/reader/full/env415-air-pollution-control-engineering 17/98
27.11.2012 21
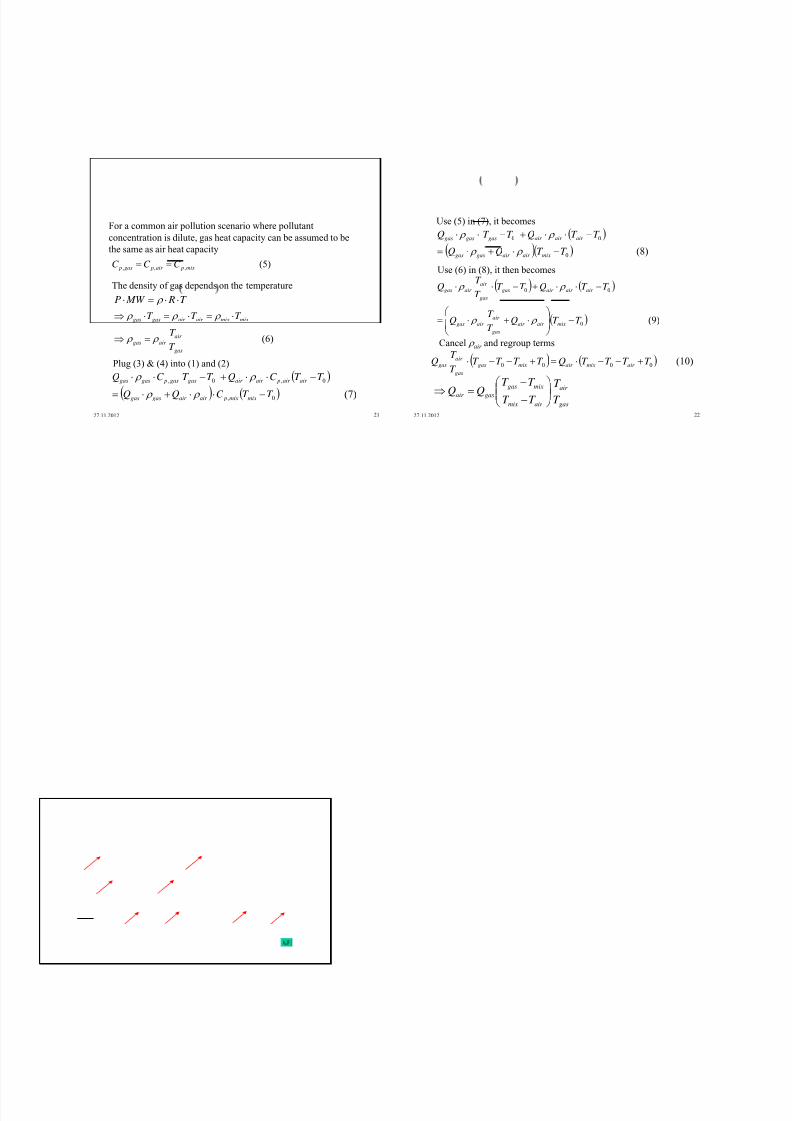
For a common air pollution scenario where pollutant
concentration is dilute, gas heat capacity can be assumed to be
the same as air heat capacity
(5) ,,, mix pair pgas p C C C
(6) gas
air air gas
mixmixair air gasgas
T
T
T T T
The density of gas depends on the temperature
T R MW P
Plug (3) & (4) into (1) and (2)
(7) 0,
0,0,
T T C QQ
T T C QT T C Q
mixmix pair air gasgas
air air pair air gasgas pgasgas
27.11.2012 22
gas
air
air mix
mixgas
gasair T
T
T T
T T QQ
Use (5) in (7), it becomes
(8) 0
00
T T QQ
T T QT T Q
mixair air gasgas
air air air gasgasgas
Use (6) in (8), it then becomes
(9) 0
00
T T QT
T Q
T T QT T T
T Q
mixair air
gas
air air gas
air air air gas
gas
air air gas
Cancel air and regroup terms
(10) 0000 T T T T QT T T T T
T Q
air mixair mixgas
gas
air gas

8/14/2019 ENV415 Air Pollution Control Engineering
http://slidepdf.com/reader/full/env415-air-pollution-control-engineering 18/98
2012/11/27 1
Particle Characteristics
• Aerosol size
• Aerosol size distribution
• Representative size
• Weighted distribution
• Log-normal distribution
Reading: Chap 3.1-3.2
2012/11/27 2
Q: How do we characterize a particle?
Size, Shape, Density, Composition (toxicity, corrosivity,
reactivity), Phase (liquid, solid)
Coal fly ash particles Iron oxide particles from arc welding
Q: Why should we care the particle size?
Q: How do we determine particle size?
Characterizing an Aerosol Particle
2012/11/27 3
d p > 10 m 1 < d p <10 m d p < 1 m
Health Concern: deposition in our respiratory system
Control Device’s Collection Efficiency: depends on particle size
Lifetime of Aerosols in the Atmosphere: particle size
Environmental Quality (e.g. visibility): particle size
2012/11/27 4
(see also Figure 3.1)
Size Range of Aerosol Particles
Hinds, Aerosol Technology, 1999

8/14/2019 ENV415 Air Pollution Control Engineering
http://slidepdf.com/reader/full/env415-air-pollution-control-engineering 19/98
2012/11/27 5
Q: How do we characterize particle”S”?
• Concentration:
– Number concentration by counting
– Mass concentration by weight measurement
• Size
• Spread
Particle size distribution
Ex: Particles in room air:
N = 104 #/cm3 M = 5.23610-6 g/cc d p = 10-3 cm = 10 m
Aerosol Size Dist ribution
Q: Does this mean all the 104 particles in the 1 cc air are 10 m? Whatis the effect if we use this size to represent the system (e.g. in inhalation
system)? How can we better describe this aerosol system?
2012/11/27 6
Particle Size Distribution• Monodisperse - All the particles are of the same size
• Polydisperse - Particles are of more than one sizes (more realistic)
Typical data from measurement:
Can also be mass?
Lower Limit
m
Upper Limit
m
Count orFrequency,
ni(#)
NormalizedCount, h
i'
(#/ dp)
Fraction,
f i(#/total)
Fraction/size
(1/m)
Percent
(%)
Cumul.Percent
(%)
0 4 104 26 0.104 0.026 10.4 10.4
4 6 160 80 0.16 0.08 16 26.4
6 8 161 80.5 0.161 0.0805 16.1 42.5
8 9 75 75 0.075 0.075 7.5 50
9 10 67 67 0.067 0.067 6.7 56.7
10 14 186 46.5 0.186 0.0465 18.6 75.3
14 16 61 30.5 0.061 0.0305 6.1 81.4
16 20 79 19.75 0.079 0.01975 7.9 89.3
20 35 103 6.867 0.103 0.0069 10.3 99.6
35 50 4 0.267 0.004 0.0003 0.4 100
50 100 0 0 0 0 0 100
ni= N = 1000 f
i= 1 100
2012/11/27 7
dpi
(m)
0 10 20 30 40 50
F r e q u e
n c y / C o u n t
0
50
100
150
200
Q: Which size has the highest concentration?
Frequency (or count ) versus particle size
ii Count n
F r e q u e n c y
o r C o u n t
Lower
Limit m
Upper
Limit m
Count or
Frequency,
n i (#)
0 4 104
4 6 160
6 8 161
8 9 75
9 10 67
10 14 186
14 16 61
16 20 79
20 35 103
35 50 4
50 100 0
n i = N = 1000
2012/11/27 8
Normalized Count, Frequency/ dp versus particle size
dpi
( m )
0 10 20 30 40 50
n i ( d p i )
S i z e D
i s t r i b u t i o n F u n c t i o n
( f r e q u
e n c y /
d
p
0
20
40
60
80
i
pii d h N )'( p
i
p
i
id
n
d
Count h
'
Q: What is the value of the total area?
Lower
Limit m
Upper
Limit m
Normalized
Count, hi'
(#/ dp)
0 4 26
4 6 80
6 8 80.5
8 9 75
9 10 67
10 14 46.5
14 16 30.5
16 20 19.75
20 35 6.867
35 50 0.267
50 100 0

8/14/2019 ENV415 Air Pollution Control Engineering
http://slidepdf.com/reader/full/env415-air-pollution-control-engineering 20/98
2012/11/27 9
Fraction/ dp versus particle size
dpi (m)
0 10 20 30 40 50
f i ( d
p i )
P r o b a b i l i t y D e n s i t y F u n c t i o n
( f r a c t i o n /
d
p i )
0.00
0.02
0.04
0.06
0.08
Q: What is the value of
the total area?
p
i
p
ii
i
i
d
f
N d
n
N h
N
n f
11'
Lower
Limit m
Upper
Limit m
Fraction,
f i (#/total)
Fraction/size
(1/m)
0 4 0.104 0.026
4 6 0.16 0.08
6 8 0.161 0.0805
8 9 0.075 0.075
9 10 0.067 0.067
10 14 0.186 0.0465
14 16 0.061 0.0305
16 20 0.079 0.01975
20 35 0.103 0.0069
35 50 0.004 0.0003
50 100 0 0
f i = 1
2012/11/27 10
• MEAN (arithmetic average):
the sum of all the particles sizes divided by the number of
particles
• MEDIAN:
The diameter for which 50% of the total are smaller and
50% are larger; the diameter corresponds to a
cumulative fraction of 50%
• MODE:
Most frequent size; setting the derivative of thefrequency function to 0 and solving for d p.
0
)( p p p
i
pii p
p dd d f d
n
d n
N
d d
Representative Size
2012/11/27 11
• GEOMETRIC MEAN:
the Nth root of the product of N values
Expressed in terms of ln(d p)
• Very commonly used because an aerosol system typically
covers a wide size range from 0.001 to 1000 m
d d d d d pg p
n
p
n
p
n N
pi
n d N
pi 1 2 3
1 11 2 3 ...
/( )
/
N
d nd
N
d n
d
pii
pg
pii
pg
lnexp
ln
ln
2012/11/27 12
Weighted Distributions• Why do we need distributions other than number
distribution?
• What are the other distributions?
• Definition: frequency of the property (e.g. number, mass)
contributed by particles of the size interval
• What is the effect?
Ex. A system containing spherical particles Number Concentration: Mass Concentration:
100 #/cc 1m & =1.91g/cm3 10-10 g/cc 1m
1 #/cc 10m 10-9 g/cc 10m
Q: Do we have “more” 1 m or 10 m particles
(i.e. are the majority 1 or 10 m)?
Q: How will it impact the PSD we see?

8/14/2019 ENV415 Air Pollution Control Engineering
http://slidepdf.com/reader/full/env415-air-pollution-control-engineering 21/98
2012/11/27 13
dp (m)
0 10 20 30 40 50
M a s s f r a c t i o n / m
0.00
0.01
0.02
0.03
0.04
dp (m)
0 10 20 30 40 50
q ( d
p ) P r o b a b i l i t y D e n s i t y F u n c t i o n
0.00
0.02
0.04
0.06
0.08
0.10
Number Distribution Mass Distribution
Q: What is the mode size of the above distribution?
• Count Mean Diameter:
• Mass Mean Diameter:
0
)( p p p
i
pii
pn dd d nd
n
d nd
0
)( p p p
i
pii
pm dd d md
md md
Q: Which one should we use? Mass, number or other?
2012/11/27 14
Lognormal PSD• Normal Distribution: widely used elsewhere (e.g. student
grade), but typically not for aerosol science, because
– most aerosols exhibit a skewed distribution function
– if a wide size range is covered, a certain fraction of the
particles may have negative values due to symmetry.
2/1
2
2
2
1
2exp
2
1
N
d d n
d d
dd
df
p pi
p p
p
standard deviation
Q: If you just developed a particle control device that can collect 100% for
dp> 5 um and 0% for dp < 5 um, how will you report your device’s collection
efficiency? Tests were done using the particles shown on page 13.
2012/11/27 15
• The application of a lognromal distribution has no
theoretical basis, but has been found to be applicable
to most single source aerosols
• Usefuel for particle of a wide range of values
(largest/smaller size > 10)
• How to use it? Simply replace d p by ln(d p).
lnln
d n d
N pg
i pi geometric mean diameter
ln(ln ln )
g
i pi pgn d d
N
2
1geometric standard deviation
2
2
)(ln2
lnlnexp
ln2
1
ln g
pg p
g p
d d
d d
df
Q: How much is g
for monodisperse
aerosol?
Q: What’s the unit of g?
2012/11/27 16
• Features of Lognormal PSD
)/ln(
lnlnln
%50%84
%50%84
d d
d d g
For a given distribution, the
geometric standard deviation
remains constant
(nondimensional) for all
weighted distributions.
Q: If g = 1.5,
how much is d 84% / d 16%?
)/ln(ln2 %50%7.97 d d g
Size range (m) 0-2 2-5 5-9 9-15 15-25 >25
Mass (mg) 4.5 179.5 368 276 73.5 18.5
Size range (m) Mass fraction (m j) Cumulative percent
0-2 0.0049 0.5
2-5 0.195 20.0
5-9 0.4 60.0
9-15 0.3 90.0
15-25 0.08 98.0
>25 0.02 100
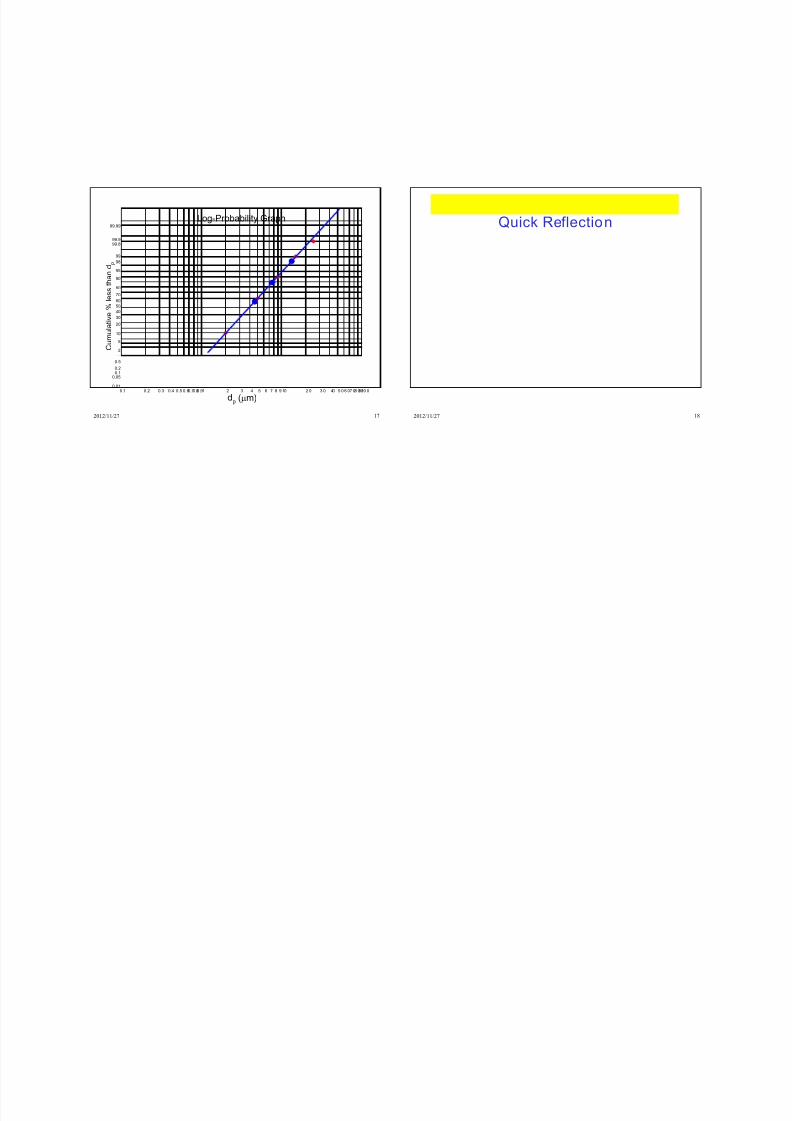
Measurement from a cascade impactor
Is this a log-normal distribution?
What’s d 50%? g?
Download log-probability graph
8/14/2019 ENV415 Air Pollution Control Engineering
http://slidepdf.com/reader/full/env415-air-pollution-control-engineering 22/98
2012/11/27 17
Log-Probability Graph
dp (m)
0 .1 0 .2 0 .3 0 .4 0 .5 0. 60 .70 .80 .91 2 3 4 5 6 7 8 9 10 2 0 3 0 40 5 0 6 07 08 09010 0
C u m u l a t i v e % l e
s s t h a n d
p
0.01
0.05
0.10.2
0.5
1
2
5
10
20
30
40
50
60
70
80
90
95
98
99
99.899.9
99.99
2012/11/27 18
Quick Reflection
8/14/2019 ENV415 Air Pollution Control Engineering
http://slidepdf.com/reader/full/env415-air-pollution-control-engineering 23/98
2012/11/2 1
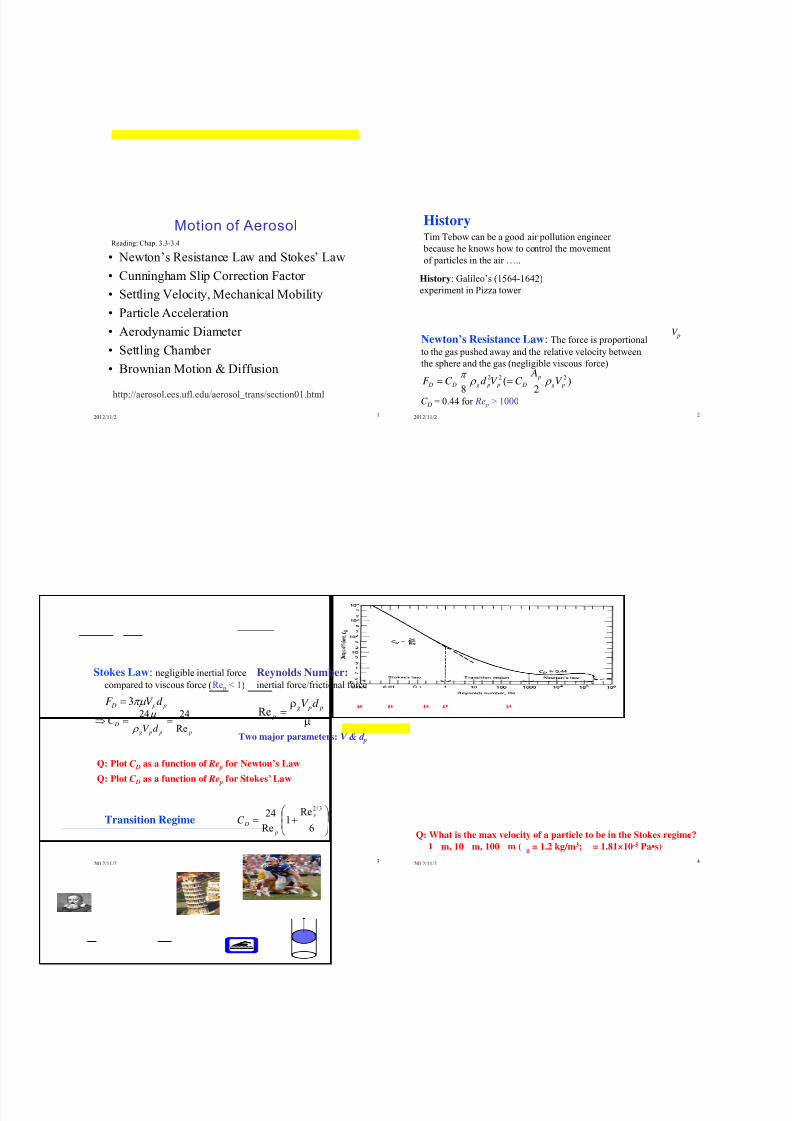
Motion of Aerosol
• Newton’s Resistance Law and Stokes’ Law
• Cunningham Slip Correction Factor
• Settling Velocity, Mechanical Mobility
• Particle Acceleration
• Aerodynamic Diameter
• Settling Chamber
• Brownian Motion & Diffusion
Reading: Chap. 3.3-3.4
http://aerosol.ees.ufl.edu/aerosol_trans/section01.html
2012/11/2 2
History
History: Galileo’s (1564-1642)
experiment in Pizza tower
Newton’s Resistance Law: The force is proportional
to the gas pushed away and the relative velocity between
the sphere and the gas (negligible viscous force)
)2
(8
222 pg
p D p pg D D V AC V d C F
V p
C D = 0.44 for Re p > 1000
Tim Tebow can be a good air pollution engineer
because he knows how to control the movement
of particles in the air …..
2012/11/2 3
p p D d V F 3
p p pg
Dd V
C Re
2424
Stokes Law: negligible inertial force
compared to viscous force (Re p < 1)
Reynolds Number:inertial force/frictional force
p pg
p
d V Re
Two major parameters: V & d p
Q: Plot C D as a function of Re p for Newton’s Law
Q: Plot C D as a function of Re p for Stokes’ Law
Transition Regime
6
Re1
Re
243/2
p
p
DC
2012/11/2 4
Q: What is the max velocity of a particle to be in the Stokes regime?
1 m, 10 m, 100 m ( g = 1.2 kg/m3; = 1.81×10⁻⁵ Pa•s)

8/14/2019 ENV415 Air Pollution Control Engineering
http://slidepdf.com/reader/full/env415-air-pollution-control-engineering 24/98
2012/11/2 5 2012/11/2 6
Categorize aerosol movement based on
interaction between the particle and gas molecules
Mean free path of gas ( ): average distance traveled by a gas
molecule between successive collisions; 0.066 m for air at STP
Ruler of aerosol movement:
)1.0( 52.21
3
md d
C
C
Vd F
p
p
c
c
p
D
(derivation for d p < 1 m @ STP)
1 mm 0.1 m
gas velocity at the surface of small particles is not zero --> slip
Cunningham Slip Correction Factor:
http://aerosol.ees.ufl.edu/aerosol_trans/section06.html
2012/11/2 7
Settling Velocity• When the drag force is equal and opposite to the
gravitational force
• Particle Mechanical Mobility (is a measure of the ease for an aerosol to have a
constant motion)
6
)(3
3gd
C
d V mgF F
pg p
C
p p
G D
1Refor18
2
p
c p p
TS
gC d V
p
C
D d
C
F
V B
3
)regimelaminarLaw,sStoke'(
Q: What is the physical meaning of B?
Q: Does a smaller or a larger particle have larger mobility?
the smaller the aerosol, the larger the mechanical mobility (i.e. easier to move)
Q: What is the impact of considering Cc on a particle’s
settling velocity? Why?
~ 0
2012/11/2 8
Relaxation Time: indication of the time required for a
particle to adjust/relax its velocity to a new condition of force
Terminal/Settling Velocity
18)
3(
6
2
3 C p p
p
C p
p C d
d
C d mB
)considered isonacceleratiotherif (or ag BF V GTS (Figure 3.8 in the book)
(remember B is an intrinsic property of a given aerosol)
Q: What other acceleration?
Transition Regime Turbulent Regime
29.043.0
71.014.171.0153.0
air
p p
TS
d gV
74.1
air
p p
TS
gd V
Small particles "relax" to new
environments (i.e. following the
flow well) in a very short time
larger particles are tend to stick to
their original path.

8/14/2019 ENV415 Air Pollution Control Engineering
http://slidepdf.com/reader/full/env415-air-pollution-control-engineering 25/98
2012/11/2 9
If flow regime is unknown because V TS is unknown --> K factor 33.0
2
g p
p
gd K
Laminar K< 3.3
Turbulent K > 43.6
Q: Can we clean the dust in this classroom by waiting them to
settle down? How long will it take? Assume the particle
size is: 1 m, 10 m, 100 m. The room is 3 m high.
Fig 3-8 in the book
Q: For a 100 µm unit-density particle, which flow regime is
applicable?
2012/11/2 10
2012/11/2 11
Particle Acceleration
)1()(
)()(
)()(3
/
t
TS
p DG
eV t V dt
t dV t V g
dt
t dV md t V mgF F
FG=mg
t=0
V(t)=0
FG=mg
t=V(t)=?
FG=mg
t>3V(t)=VTS
F D=3 V(t)d p
F D=3 V TS d p
• Newton’s law
http://aerosol.ees.ufl.edu/aeros
ol_trans/section04.html
2012/11/2 12
Time for unit density particles to reach their terminal velocity
d p (m) 3 (ms) S * (cm)
0.01 0.00002 6.810-6
0.1 0.00026 8.810-5
1 0.011 3.610-3
10 0.94 0.23
100 92 12.7
* V0=1000 cm/s
Non-zero Initial velocity
V t V V V e f f
t ( ) ( )
/ 0
Stopping Distance
S V BmV 0 0
)1()()(/
0
t
f f eV V t V t x For Re0 < 1
Small aerosols adapt to the new environment (i.e. following
the flow well) in a very short time, almost instantly!!!
8/14/2019 ENV415 Air Pollution Control Engineering
http://slidepdf.com/reader/full/env415-air-pollution-control-engineering 26/98
2012/11/2 13
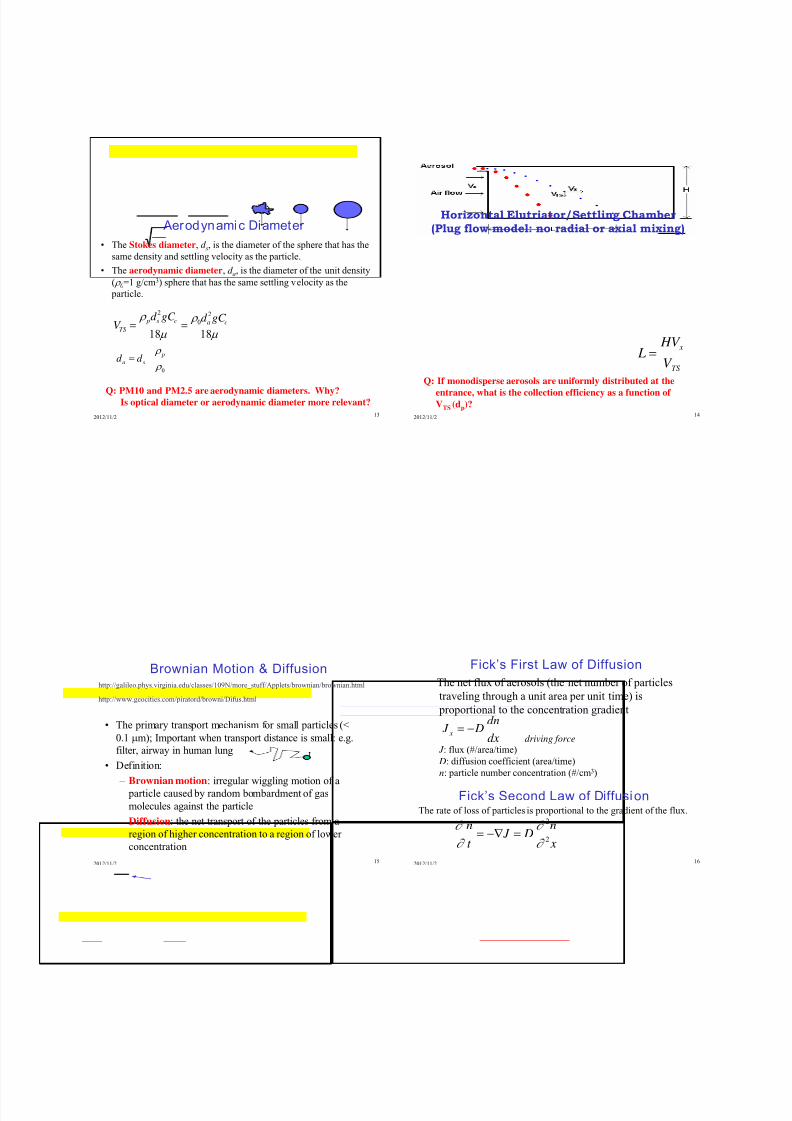
Aerodynamic Diameter
• The Stokes diameter, d s, is the diameter of the sphere that has the
same density and settling velocity as the particle.
• The aerodynamic diameter, d a, is the diameter of the unit density
( 0=1 g/cm3) sphere that has the same settling velocity as the
particle.
1818
2
0
2
cacs p
TS
gC d gC d V
0
psa d d
Q: PM10 and PM2.5 are aerodynamic diameters. Why?
Is optical diameter or aerodynamic diameter more relevant?
2012/11/2 14
L HV
V
x
TS
Horizontal Elutriator/Settling Chamber(Plug flow model: no radial or axial mixing)
Q: If monodisperse aerosols are uniformly distributed at theentrance, what is the collection efficiency as a function of
VTS (dp)?
2012/11/2 15
Brownian Motion & Diffusion
• The primary transport mechanism for small particles (<
0.1 m); Important when transport distance is small: e.g.
filter, airway in human lung
• Definition:
– Brownian motion: irregular wiggling motion of a
particle caused by random bombardment of gas
molecules against the particle
– Diffusion: the net transport of the particles from a
region of higher concentration to a region of lower
concentration
http://galileo.phys.virginia.edu/classes/109N/more_stuff/Applets/brownian/brownian.html
http://www.geocities.com/piratord/browni/Difus.html
2012/11/2 16
Fick’s First Law of Diffusion
The net flux of aerosols (the net number of particles
traveling through a unit area per unit time) is
proportional to the concentration gradient
J : flux (#/area/time)
D: diffusion coefficient (area/time)
n: particle number concentration (#/cm3)
dx
dn D J x
Fick’s Second Law of Diffusion
x
n D J
t
n2
2
The rate of loss of particles is proportional to the gradient of the flux.
driving force

8/14/2019 ENV415 Air Pollution Control Engineering
http://slidepdf.com/reader/full/env415-air-pollution-control-engineering 27/98
2012/11/2 17
• Solve 1-D equation
Spread of particles over time and space
n
t D
n
x
2
2
11
2
1
16
1
Numbers on curves are values of Dt
2012/11/2 18
Solution Dt
x
Dt
N t xn o
4exp
2),(
2
Mean Square Displacement of particles
Result:
Dt
x
2
2
x N
x n x t dxo
2 21
( , )
Stokes-Einstein Equation for Diffusivi ty
p
c
d
kTC D 3
Q: How to have a larger diffusivity? Why?
Air, water, universe?

8/14/2019 ENV415 Air Pollution Control Engineering
http://slidepdf.com/reader/full/env415-air-pollution-control-engineering 28/98
Cyclone
• Impactor, Stokes Number
• Cyclone Operation and Applications
• Standard Dimensions
• Lapple Theory
• Pressure Drop
• Arrangement, Discharge
Reading: Chap. 4 of Air Pollution Control-A Design Approach
http://aerosol.ees.ufl.edu/cyclone/section01.html
Stokes Number: the ratio of
stopping distance of a particle to a
characteristic dimension of the
obstacle. It’s a particle’s persistence
to the size of the obstacle.
j
c p p
jc D
UC d
D
U
d
S Stk
92/
2
Q: Does a smaller or a largerparticle possess higher persistence?
Impactor
f(Stk) efficiencyImpaction
2
j D
http://aerosol.ees.ufl.edu/cyclone/section03.html
U
Stk DC d
p
j
c
50
50
9
Q: How can we collect more smaller particles using the same nozzle?
Cyclone Operation
http://aerosol.ees.ufl.edu/cyclone/section05.htmlhttp://aerosol.ees.ufl.edu/cyclone/section05.html

8/14/2019 ENV415 Air Pollution Control Engineering
http://slidepdf.com/reader/full/env415-air-pollution-control-engineering 29/98
Axial Inlet
Bottom Inlet
* Air Pollution
Control Equipment Calculation,
Theodore, CRC Press, 2008.
Cyclone Performance for Various Applicatio ns
* Air Pollution
Control Equipment ,Theodore &
Buonicore,
CRC Press, 1988.
Standard Cyclone
Dimensions
* Air Pollution
Control Equipment Calculation,
Theodore, CRC Press, 2008.
Standard Cyclone Dimensions
a
b
h
H
B http://aerosol.ees.ufl.edu/cyclone/section06.html

8/14/2019 ENV415 Air Pollution Control Engineering
http://slidepdf.com/reader/full/env415-air-pollution-control-engineering 30/98
General guidelines:
• a < S
• b < (D-De)/2
• H > 3D
• Cone angle = 7o ~ 8o
•De/D = 0.4~0.5, H/De = 8, S/De = 1
Cyclones used for removing wood dust
Q: Why? Number of effective turns
2
1 h H h
a N e
Gas residence time
ie V DN t / Terminal velocity
D
V d t bV
ig p p
t
9
/
22
Smallest collected diameter
g pie p V N
b
d
9
a
b
h
H
B
Lapple Theory (plug f low)
Q: How can we reduce the smallest size further?
Vi
~0
~0
50% cut size
pie
pV N
bd
2
9%50
The collection efficiency
of any size d pj
2
%50 /1
1
pj p
jd d
Overall efficiency
j j f
Penetration
1P
Particle size ratio d p /d p50%
(%)
Q: Is the dp50% the median size of the
size distribution of the inflow particles?
Q: Is the laminar flow assumption valid?
Q: Is f j mass based?
Pressure Drop
Number of gas inlet velocity head
2
e
c H D
abK N
Static pressure drop
H ig N V P2
2
1
Power requirement
PQw f
K c = 16 for normal tangential inlet
= 7.5 for one with an inlet vane
Higher flow velocity results in a higher efficiency at the cost of a
higher pressure drop (and hence power)
Common ranges for pressure drops:
Low efficiency cyclone 2-4 inch of water
Medium efficiency cyclone 4-8 inch of water
High efficiency cyclone 8-10 inch of water

8/14/2019 ENV415 Air Pollution Control Engineering
http://slidepdf.com/reader/full/env415-air-pollution-control-engineering 31/98
Example 4-5
• Design a conventional Lapple cyclone to function as a pre-
cleaner (η > 70%) on a gas stream that flows at 120
m3/min. ∆P < 3000 Pa. p = 1500 kg/m3, g = 1 kg/m3, = 0.07 kg/m-hr (1.944×10⁻⁵ kg/m-s). Specify your final
choice of body diameter, overall cyclone efficiency, inlet
gas velocity and pressure drop (assuming Kc = 14).
Size range (m) Mass % in size range
0-2 2.0
2-4 18.0
4-10 30.0
10-20 30.0
20-40 15.040-100 4.0
>100 1.0
Multi-cyclone Collector
APTI 442, US-EPA,
Chapter 2, 2003.
Arrangement
Series
Parallel/
BatteryAir Pollution Control Equipment, Theodore & Buonicore, CRC Press, 2008
Q: If each cyclone’s efficiency is 80%,
how much is the total efficiency for
this serial cyclone? Q: Advantages?
Disadvantages?
Discharge Valves
APTI 442, US-EPA,
Chapter 2, 2003.
Q: What may happen to
if equipped with a bad
discharge device?

8/14/2019 ENV415 Air Pollution Control Engineering
http://slidepdf.com/reader/full/env415-air-pollution-control-engineering 32/98
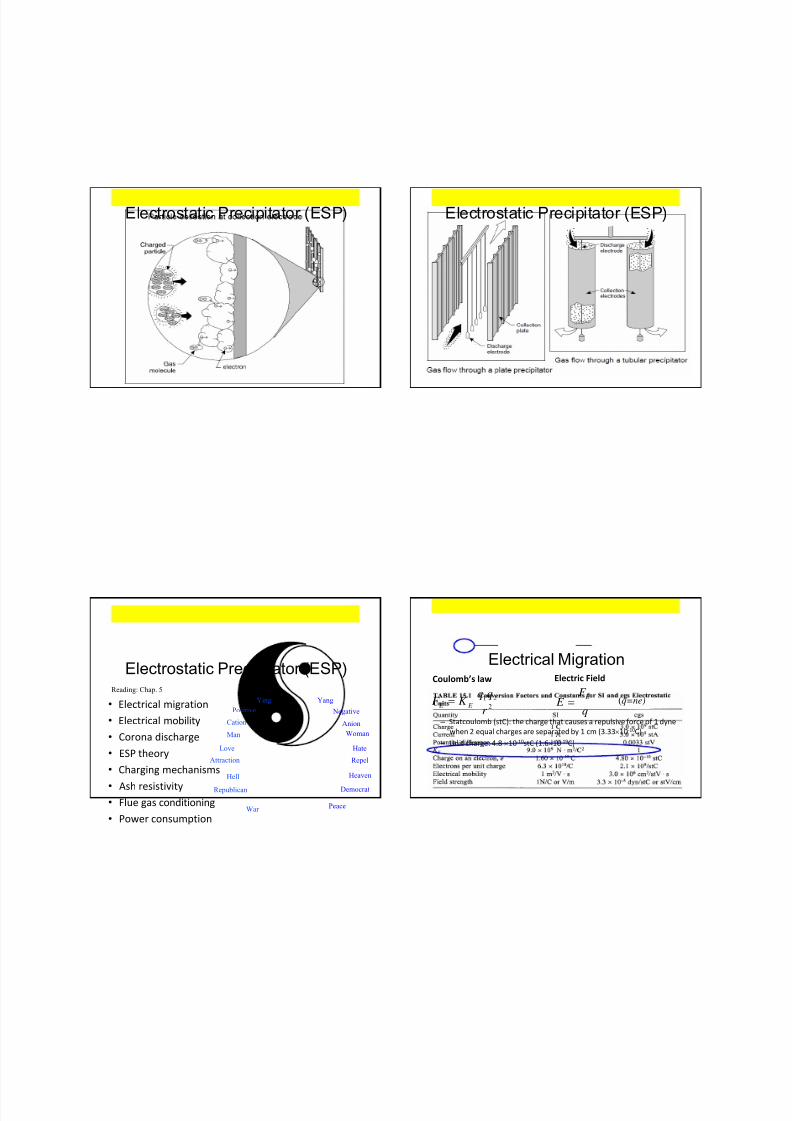
Electrostatic Precipitator (ESP) Electrostatic Precipitator (ESP)
Electrostatic Precipitator (ESP) Electrostatic Precipitator (ESP)
8/14/2019 ENV415 Air Pollution Control Engineering
http://slidepdf.com/reader/full/env415-air-pollution-control-engineering 33/98
Electrostatic Precipitator (ESP) Electrostatic Precipitator (ESP)
Electrostatic Precipitator (ESP)
• Electrical migration
• Electrical mobility
• Corona discharge
• ESP theory
• Charging mechanisms
• Ash resistivity
• Flue gas conditioning
• Power consumption
Reading: Chap. 5
Positive Negative
Republican Democrat
Love Hate
Ying Yang
Man Woman
Hell Heaven
Cation Anion
War Peace
Attraction Repel
Electrical Migration
– Statcoulomb (stC): the charge that causes a repulsive force of 1 dyne
when 2 equal charges are separated by 1 cm (3.3310‐10C)
– Unit charge: 4.8 10‐10stC (1.610‐19C)
2
21
r
qqK F E E E
F
q
E (q=ne)
Electric FieldCoulomb’s law

8/14/2019 ENV415 Air Pollution Control Engineering
http://slidepdf.com/reader/full/env415-air-pollution-control-engineering 34/98
Millikan Experiment
(Robert Millikan,
US, 1868-1953;
Nobel Prize
Laureate, 1923)
Hinds, Aerosol Technology, 1999
http://nobelprize.org/nobel_prizes/physics/laureates/1923/millikan‐bio.html
Electrical Mobility
Electrical Mobility
• Terminal velocity in an electrical field
(electrical migration velocity/drift velocity)
c
TE p
C
V d qE
3
qEBd
qEC wV p
cTE
3
qBd
qC
E
V Z
p
cTE 3
(force balance) D E F F
(for Re < 1)
Q: What is the physical meaning of electrical mobility?
Q: When does a particle have a higher mobility?
Q:
Differenc
e between
cyclone
and ESPin terms
of forces
acting on
the
system?
What’s
the effect?
p
C
d
C B 3
Particle Mechanical Mobility
Positive Corona Negative Corona+ -
+ -
+
+ -
+
+
+
-
-
+
- +
- +
‐
-
‐
+
+
Corona Discharge
Step 1
Step 2
Step 3
Step 4
Collection Plate Collection Plate
Electron
Molecule
Particle
Electrode Electrode
Q: How can we generate charges?
8/14/2019 ENV415 Air Pollution Control Engineering
http://slidepdf.com/reader/full/env415-air-pollution-control-engineering 35/98
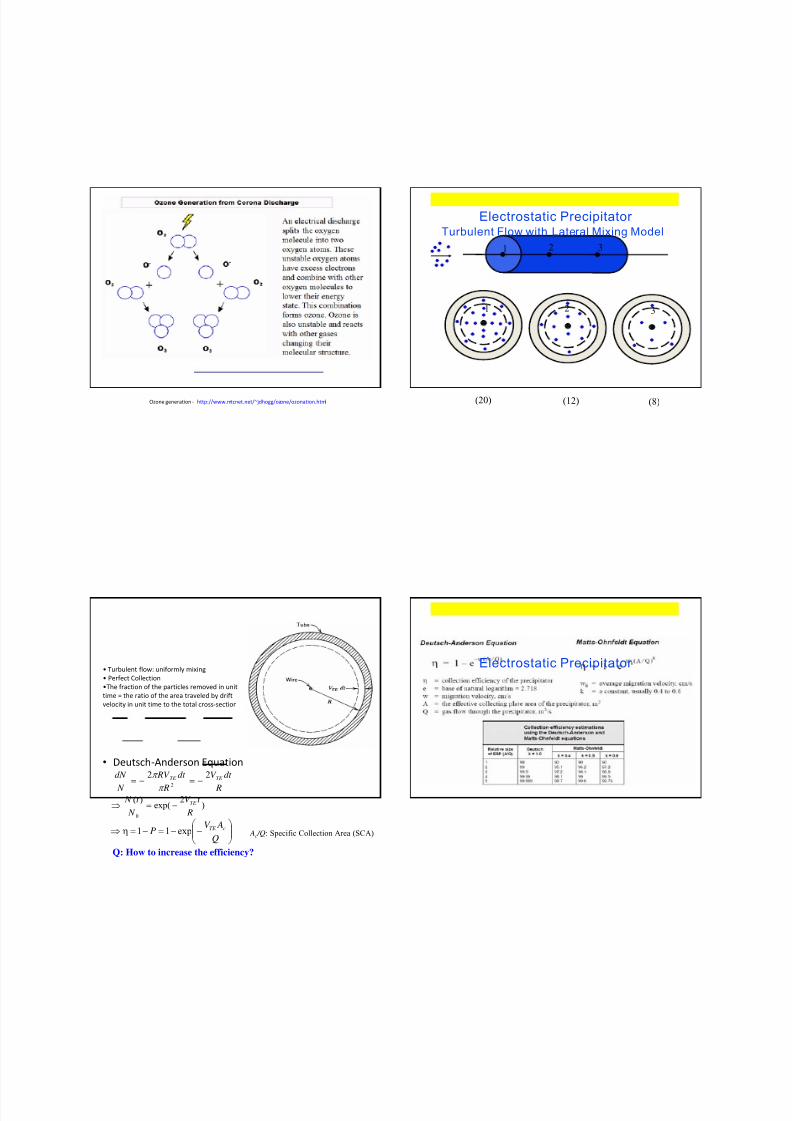
Ozone generation ‐ http://www.mtcnet.net/~jdhogg/ozone/ozonation.html
1 2 3
1 2 3
(20) (12) (8)
Turbulent Flow with Lateral Mixing Model
Electrostatic Precipitator
• Deutsch‐Anderson
Equation
R
dt V
R
dt RV
N
dN TE TE 222
)2
exp()(
0 R
t V
N
t N TE
Q
AV P cTE exp11 Ac /Q: Specific Collection Area (SCA)
• Turbulent flow: uniformly mixing
• Perfect Collection
•The fraction of the particles removed in unit
time = the ratio of the area traveled by drift
velocity in unit time to the total cross‐section
Q: How to increase the efficiency?
Electrostatic Precipitator
8/14/2019 ENV415 Air Pollution Control Engineering
http://slidepdf.com/reader/full/env415-air-pollution-control-engineering 36/98
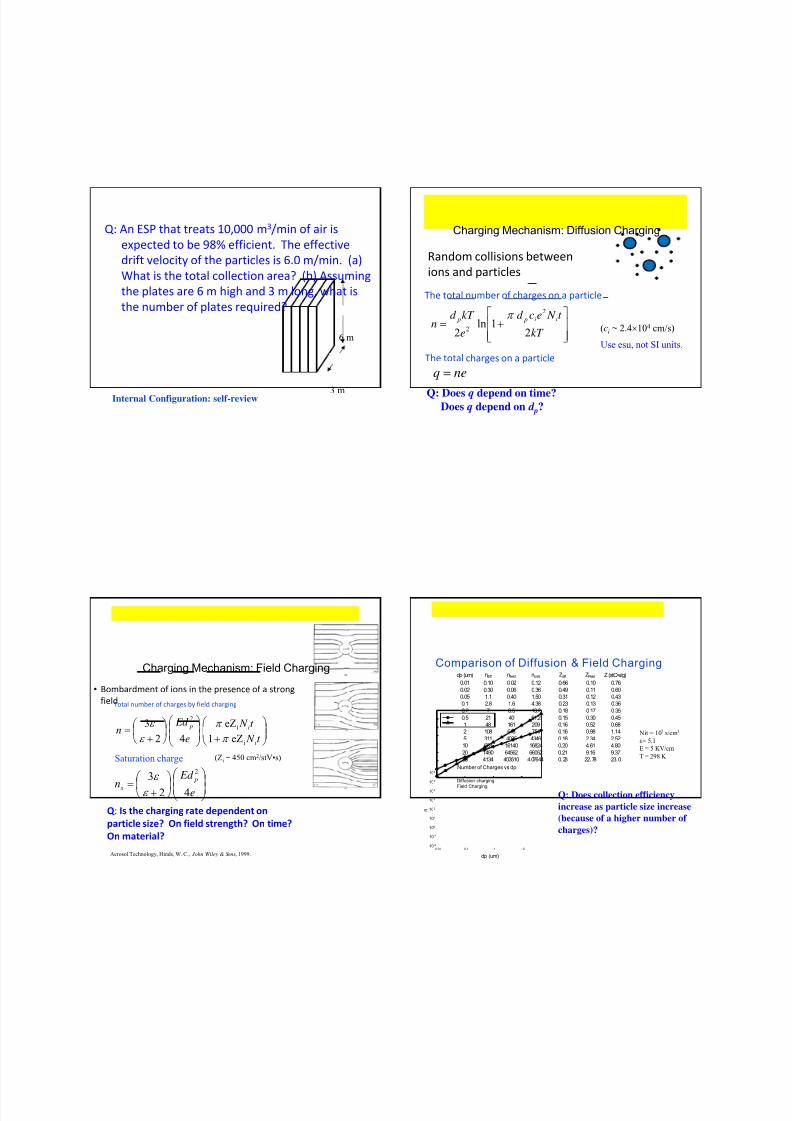
Q: An ESP that treats 10,000 m3/min of air is
expected to be 98% efficient. The effective
drift velocity of the particles is 6.0 m/min. (a)
What is the total collection area? (b) Assuming
the plates are 6 m high and 3 m long, what is
the number of plates required?
6 m
3 mInternal Configuration: self-review
Charging Mechanism: Diffusion Charging
Random collisions between
ions and particles
kT
t N ecd
e
kT d n
ii p p
2
1ln
2
2
2
Q: Does q depend on time?
Does q depend on d p?
The total number of charges on a particle
(ci ~ 2.4104 cm/s)
neq
The total charges on a particle
Use esu, not SI units.
Charging Mechanism: Field Charging
• Bombardment of ions in the presence of a strong
field
eZ1
eZ
4
2
3
i
i
2
t N
t N
e
Ed n
i
i p
Total number of charges by field charging
Q : Is the charging rate dependent on particle size? On field strength? On time? On material?
Aerosol Technology, Hinds, W. C., John Wiley & Sons, 1999.
e
Ed n
p
s4
2
32
Saturation charge (Zi ~ 450 cm2/stV•s)
Comparison of Diffusion & Field Charging
Q: Does collection efficiency
increase as particle size increase
(because of a higher number of
charges)?
dp (um) ndiff nfield ntotal Zdiff ZField Z (stC•s/g)
0.01 0.10 0.02 0.12 0.66 0.10 0.76
0.02 0.30 0.06 0.36 0.49 0.11 0.60
0.05 1.1 0.40 1.50 0.31 0.12 0.43
0.1 2.8 1.6 4.38 0.23 0.13 0.36
0.2 7 6.5 13.2 0.18 0.17 0.35
0.5 21 40 61.2 0.15 0.30 0.45
1 48 161 209 0.16 0.52 0.68
2 108 646 754 0.16 0.98 1.14
5 311 4035 4346 0.18 2.34 2.52
10 683 16140 16824 0.20 4.61 4.80
20 1490 64562 66052 0.21 9.16 9.37
50 4134 403510 407644 0.23 22.78 23.0
Number of Charges vs dp
dp (um)
0.01 0.1 1 10
n
10-2
10-1
100
101
102
103
104
105
106
Diffusion charging
Field Charging
Nit = 107 s/cm3
= 5.1
E = 5 KV/cm
T = 298 K

8/14/2019 ENV415 Air Pollution Control Engineering
http://slidepdf.com/reader/full/env415-air-pollution-control-engineering 37/98
ELectrical Mobility vs dp
dp (um)
0.01 0.1 1 10
Z
( s t C . s
/ g )
0.1
1
10 Diffusion charging
Field Charging
Combined Charging
Typical fly ash
size distribution
Q: If the ESP is used to collect the
fly ash, how will the particle sizedistribution at ESP outlet look like?
Resistivity/Conductivity
• Impact of particles’ resistivity on ESP’s performance:
• Factors: temperature, composition
• Flue gas conditioning
109 - 1010 ohm-cm is desired
Q: How does resistivity affect an ESP’s performance?
Dust Resistivity Effects of sulfur content and temperature on resistivity
Q: Is S in coal good or bad?
8/14/2019 ENV415 Air Pollution Control Engineering
http://slidepdf.com/reader/full/env415-air-pollution-control-engineering 38/98
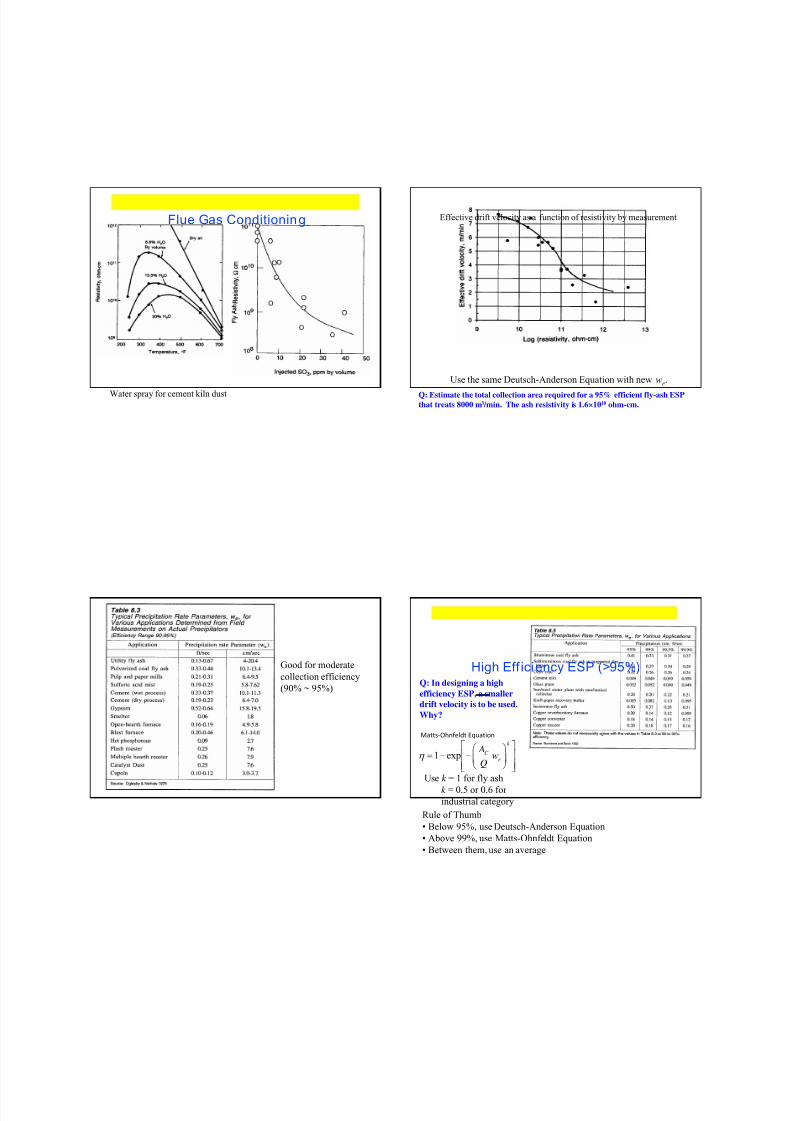
Water spray for cement kiln dust
Flue Gas Conditioning Effective drift velocity as a function of resistivity by measurement
Use the same Deutsch-Anderson Equation with new we.
Q: Estimate the total collection area required for a 95% efficient fly-ash ESP
that treats 8000 m3 /min. The ash resistivity is 1.6×10¹⁰ ohm-cm.
Good for moderate
collection efficiency
(90% ~ 95%)
High Eff iciency ESP (>95%)
Matts‐Ohnfeldt Equation
k
eC
wQ
Aexp1
Use k = 1 for fly ash
k = 0.5 or 0.6 for
industrial category
Rule of Thumb
• Below 95%, use Deutsch-Anderson Equation
• Above 99%, use Matts-Ohnfeldt Equation
• Between them, use an average
Q: In designing a high
efficiency ESP, a smaller
drift velocity is to be used.
Why?

8/14/2019 ENV415 Air Pollution Control Engineering
http://slidepdf.com/reader/full/env415-air-pollution-control-engineering 39/98
Power Consumption
avgC C V I P
C
C e
A
kPw
Power density ~ 1-2 W/ft2
Q
kPC exp1
• Corona power
• Drift velocity
• Efficiency vs. Corona Power
k = 0.55 for Pc/Q in W/cfs up to 98.5%

8/14/2019 ENV415 Air Pollution Control Engineering
http://slidepdf.com/reader/full/env415-air-pollution-control-engineering 40/98
Fabric Filters
• Filtration
• Fabric Selection
• Fabric Cleaning
• Air/Cloth Ratio, Filtration Velocity
• Filtration Mechanisms
• Pressure Drop and Design Consideration
• Nanofiber Filter
Reading: Chap. 6
Filtration
Packing density/solidity
Fiber filter
porosity-1 volumetotal
mefiber volu
For fiber filter, < 0.1
For woven filter, ~ 0.3
Q: Do filters function simply as sieves (to
collect particles larger than the sieve spacing)?
Filtration

8/14/2019 ENV415 Air Pollution Control Engineering
http://slidepdf.com/reader/full/env415-air-pollution-control-engineering 41/98
Shaker Baghouse
Theodore & Buonicore,
Air Pollution Control Equipment,
CRC Press, 1988.
Frequency Several cycles/s
Motion type Simple harmonic
or sinusoidal
Peak
acceleration
1-10 gravity
Amplitude Fraction to a few
inches
Mode Off-stream
Duration 10-100 cycles, 30
s to a few minutes
Common bag diameter
5, 8, 12 in
Shaker Cleaning Parameters
Q: What are the common
problems encountered?
Reverse
Air
Baghouse
Reverse-Air
Q: Pros and Cons?Cleaning dust on baghouse
walls by traditional sledge-
hammering
Frequency Clean a compartment at a time,
sequencing 1 compartmentafter another; continuous or
initiated by a max.-pressure-drop switch
Motion Gent le collapse of bag(concave inward) upon
deflation; slowly repressurize acompartment after completion
of a backflush
Mode Off stream
Duration 1-2 min, incl. valve opening,closing & dust settling periods;reverse-air flow itself normally
10-30 s
Bag diameter 8, 12 inch; length 22, 30 ft
Bag tension 50-75 lb
Reverse-Air Cleaning Parameters
Reverse-Jet

8/14/2019 ENV415 Air Pollution Control Engineering
http://slidepdf.com/reader/full/env415-air-pollution-control-engineering 42/98
Pulse-Jet Filters and Cleaning Pulse-Jet Frequency A row of bags at a time;
sequenced 1 row after
another; can sequence suchthat no adjacent rows clean
one after another; initiation of
cleaning can be triggered by
max-pressure-drop switch or
may be continuous
Motion Shock wave passes down bag;
bag distends from cage
momentarily
Mode On-stream; in difficult-to-
clean applications such as
coal-fired boilers, off-stream
compartment cleaning being
studied
Duration Compressed air (100 psi)
pulse duration 0.1 s; bag row
effectively off-line
Bag
diameter
5-6 in
Q: How can the blown-away particles by the on-line cleaning process be collected?
Q: Felted fabric or woven fabric?
Compartmentalized Pulse-Jet Baghouse and Venturis for Cleaning

8/14/2019 ENV415 Air Pollution Control Engineering
http://slidepdf.com/reader/full/env415-air-pollution-control-engineering 43/98
Ai r/Cloth Ratio
A
QV
Filtration velocity
(average velocity)
Q: If thicker fabric is needed
to sustain the high force, is
its operating cost higher?
Filtration Mechanisms• Diffusion (Lee & Liu, 1982)
factor ichydrodynamKuwabara 44
3ln
2
1
number Peclet
158.2
2
0
3/2
Ku
D
U d Pe
PeKu
f
D
Lee, K.W. & Liu, B.Y.H., Aerosol Sci. Technol. ,
1:47-61, 1982
Q: How does efficiency change wrt d p?
Q: How to increase efficiency by diffusion?
• Impaction (Yeh & Liu, 1974)
4.0for5.27)286.29(
18
2
)(
8.2262.0
0
2
0
2
R R R J
d
U C d
d
U Stk
Ku
J Stk
f
c p p
f
I
f
p
d
d R
Yeh. H.C. & Liu, B.Y.H., J. Aerosol Sci.,
5:191-217, 1974
Q: How to increase impaction efficiency?
Q: How does efficiency change wrt d p?
( J = 2 for
R > 0.4)
• Interception (Krish & Stechkina, 1978)
2
2
)1(2
)2
1(1
11)1ln(2
2
1 R
R R
Ku
R R
Krish, A. A. & Stechkina, I. B., “The theory of Aerosol Filtration with Fibrous Filters”,
in Fundamentals of Aerosol Science, Ed. Shaw, D. T., Wiley, 1978.
Q: How to increase interception efficiency?
Fat Man’s Misery,
Mammoth Cave NP

8/14/2019 ENV415 Air Pollution Control Engineering
http://slidepdf.com/reader/full/env415-air-pollution-control-engineering 44/98
• Gravitational Settling
• Total Single Fiber Efficiency
• Total Filter Efficiency
0
2
0
TS0
18
directionsamein theVand for U )1(
U
gC d
U
V G
RG
c p pTS
G
G R I D
G R I D
)1)(1)(1)(1(1
f
f
S d H P exp1)1(
4exp11
S f : Solidarity factor
H = 1mm
= 0.05
d f = 2m
U 0=10 cm/s
Q: Should we increase or decrease flow velocity in order to increase
collection efficiency for (a) tobacco smoke, (b) cement dust?
Filter efficiency for individual mechanismand combined mechanisms
dp (m)
0.01 0.1 1 10
E f f i
c i e n c y
0.0
0.2
0.4
0.6
0.8
1.0
Interception
Impaction
DiffusionGravitation
Total
Parallel
Flow
Operation
Q: How do you determine when to clean?

8/14/2019 ENV415 Air Pollution Control Engineering
http://slidepdf.com/reader/full/env415-air-pollution-control-engineering 45/98
Pressure Drop (Filter Drag Model)
s p f PPPP
V LVt K V K 21
Areal Dust Density LVt W
Filter drag
V
PS W K K S 21
K 1 & K 2 to be determined empirically
(resistance factor)
P f : fabric pressure drop
P f : particle layer pressure dropPs: structure pressure drop
Time (min) P, Pa
0 150
5 380
10 505
20 610
30 690
60 990
Q: What is the pressure drop after 100 minutes of operation?
L = 5 g/m3 and V = 0.9 m/min.
K 2
K 1
tr
tc
tf
t j
Time
P r e s s u r e
pm
Time to filter
ccr f t t t N t )( N
N
Flow rate
11
N
N
Filtering velocity
C C
N N
NA
Q
A
QV
C C
N N
A N
Q
A
QV
)1(
11
Q: What are the parameters that affect our decision on the
number of compartments to be used?
Areal dust density
))(1( 1 c N r N j Lt V Lt V N W
Filter drag
j j W K K S 21
Actual filtering velocity
1 N N j V f V
Pressure drop
j jm j V S PP
N 1/ N f N V V f
3 0.874 0.8
5 0.767 0.71
10 0.67
12 0.6515 0.64
20 0.6220
Ex. Calculate the max pressure drop that must be supplied for
the following baghouse for a filtration time of 60 minutes: K1
= 1 inch H2O-min/ft, K2 = 0.003 inch H2O-min-ft/grain, tc = 4
min, 5 compartments, L = 10 grain/ft3, Q = 40000 ft3/min, Ac
= 4000 ft2/compartment.
Nanofiber Filter
Nano-alumina on microglass
Argonide
E-spun PAN nanofiber
Dr. Wolfgang Sigmund, MSE. UF

8/14/2019 ENV415 Air Pollution Control Engineering
http://slidepdf.com/reader/full/env415-air-pollution-control-engineering 46/98
1
Particulate Scrubbers
• Types of scrubbers: spray chamber and
venturi scrubber
• Theory and design consideration
• Pressure drop
• Contacting power
Reading: Chap. 7
27.11.2012
WET SCRUBBERS: PARTICLE COLLECTION MECHANISM
Droplets collect particles by using one or more of several collection mechanisms.
These mechanisms are impaction, direct interception, diffusion, electrostatic
attraction, condensation, centrifugal force, and gravity. However, impaction and
diffusion are the two primary ones.
The particle's mass breaks away
from the streamlines and impact or
hit the droplet. Most scrubbers do
operate with gas stream velocities
well above 0.3 m/s. Therefore, at
these velocities, particles having
diameters greater than1.0 m are
collected by this mechanism.
Very small particles (less than 0.1
m in diameter) are so tiny that
they are bumped by gas
molecules as they move in the
exhaust stream. This bumping, or
bombardment, causes them to
fi rst move one way and thenanother in a random manner, or to
diffuse, through the gas. This
irregular motion can cause the
particles to collide with a droplet
and be collected.27.11.2012 2
WET SCRUBBERS: PARTICLE COLLECTION MECHANISM
27.11.2012 3
Packed towers are the simplest and most commonly used approaches to gas scrubbing. The
principle of this type of scrubber is to remove contaminants from the gas stream by passing
the stream through a packed structure which provides a large wetted surface area to induce
intimate contact between the gas and the scrubbing liquor. The contaminant is absorbed
into or reacted with the scrubbing liquor.
The packing of the tower is normally a proprietary loose fill random packing designed to
encourage dispersion of the liquid flow without tracking, to provide maximum contact area
for the ‘mass transfer’ interaction and to offer minimal back pressure to the gas flow. The
reactivity between the contaminant and the scrubbing liquor influences the system
designer’s determination of gas and liquor flow and the height and diameter of the packed bed.
A demister is fitted at the top of the tower to prevent entrainment of droplets of the
scrubbing liquor into the extraction system or stack.
Packed towers can be designed for very high efficiencies with relatively low capital and
running costs. The low pressure drop associated with packed bed scrubbers permits the use
of smaller more economical fans. Although efficiency may be affected, a packed tower will
usually function when gas or liquor flows vary from its original design parameters.
Packed towers can become clogged by insoluble particulates or the insoluble products of
chemical reactions and this scrubbing technique should not be used where this is cause for
concern.
PACKED TOWER SCRUBBING
27.11.2012 4

8/14/2019 ENV415 Air Pollution Control Engineering
http://slidepdf.com/reader/full/env415-air-pollution-control-engineering 47/98
The principle of air stripping
has been used for a number
of years for the removal of
dissolved gases such as
carbon dioxide, hydrogen
sulphide and ammonia from
aqueous liquors. It has also
been used as a means of
increasing dissolved oxygen
content for the oxidation of
dissolved metals such as
iron. It was in the late
1970’s that this technology
was applied to the removalof volatile organic
compounds (VOCs) from
water.
PACKED TOWER STRIPPING
AND DEGASSING
27.11.2012 5
In a fluidized bed scrubber the typical single bed of a packed tower structure is replaced by
two or more shallow beds, and the high surface area angular packing are replaced by
hollow ellipsoids which are ‘fluidized’ by the gas stream. This is relatively fast moving
when compared to the velocity of the gas flow through a packed tower.
The residence time of the gas in the tower is thus rather less than in a packed tower but this
tends to be compensated by the higher mass transfer induced by the gas turbulence in the
‘fluidized’packing.
Fluidized bed scrubbers are not normally used for odour control because of the short
residence time of the gas flow within the tower.
A prime advantage of the fluidized bed is that the mobility of the packing minimizes the
aggregation of particulates and insoluble depositions. Very small particulates, 8μm and
below, will however tend to pass through a fluidized bed.
With the higher gas velocity the tower diameter can be narrower and a more compact unit
designed. Additional costs are, however, incurred with more expensive packing, the
complexity of the structure, and the capital outlay and running costs of larger fans.
The efficient function of the fluidized bed depends on the velocity of the gas stream being
maintained between specified minimum and maximum levels – and this would typically be
a narrower range than in a packed tower.
FLUIDISED BED SCRUBBING
27.11.2012 6
7
Spray Chamber
R e c i r c u l a t e d w a t e r
Water to settling basin and recycle pump
Vertical spray chamber (countercurrent flow)
Collecting medium:
Liquid drops
Wetted surface
Q: What parameters will affect
the collection efficiency?
Q: Any other arrangement of
air & water?
27.11.2012 8
Q: Is the gas velocity of any concern? Is droplet size important?
27.11.2012

8/14/2019 ENV415 Air Pollution Control Engineering
http://slidepdf.com/reader/full/env415-air-pollution-control-engineering 48/98
9
Cyclone Spray Chamber &
Impingement Scrubber
Flagan & Seinfeld, Fundamental of Air
Pollution Engineering, 1988
Q: Is used water
recirculated?
27.11.2012
Venturi scrubbing is a most effective
technique for the removal of
particulates from a gas stream, even
down to sub-micron size. Scrubbing
liquor and gas stream are brought
together in turbulent contact within
the venturi throat and the particulates
are forced into the atomized liquor.
Venturi scrubbing may be adequate to
handle some more reactive
contaminants but to reduce fumes to
acceptable levels it may be necessary
to effect further treatment using a
packed tower scrubber. Combination
units incorporating both types of
scrubber using a common sump are
most practical in some circumstances.
Venturi scrubbing is typically a cost
effective and efficient approach to
removing particulates.
VENTURI SCRUBBERS
27.11.2012 10
Type of Wet Scrubbers
27.11.2012 11 12
Venturi Scrubber
Handbook of Air Pollution Control Engineering & Technology, Mycock, McKenna & Theodore, CRC Inc., 1995.
High efficiency even for small particles
Q: ESP for sticky, flammable or highly corrosive materials?
QL/QG: 0.001 - 0.003 VG: 60 - 120 m/s
27.11.2012

8/14/2019 ENV415 Air Pollution Control Engineering
http://slidepdf.com/reader/full/env415-air-pollution-control-engineering 49/98
13
THEORY: Spray Chamber
Droplet concentration in the chamber
d cd
L
d c
d d
V Ad
Q
V A
N n
3
6
V d : droplet falling velocity relative to a fixed coordinate
V dt : droplet terminal settling velocity in still air (i.e. relative to the gas flow)
Volume (m3) of each droplet3
6 d d d
Total number of droplets (Nd ) that pass the chamber per second
33
6
6d
L
d
L
d
Ld
d
Q
d
QQ N
V dt
V G
V d
Gdt d V V V
Q L: volumetric liquid flow rate (m3/s)
27.11.2012 27.11.2012 14
THEORY: Spray Chamber
27.11.2012 15
THEORY: Spray Chamber
27.11.2012 16
THEORY: Spray Chamber

8/14/2019 ENV415 Air Pollution Control Engineering
http://slidepdf.com/reader/full/env415-air-pollution-control-engineering 50/98

8/14/2019 ENV415 Air Pollution Control Engineering
http://slidepdf.com/reader/full/env415-air-pollution-control-engineering 51/98
2127.11.2012 22
Single droplet collection efficiency
d
p
d
d
G
L
Diameter ratio Viscosity ratio
d
G
Gdt d V d
Re
DSc
G
G
d G
dt p pc
d
V d C St
18
2
Particle Reynolds # Particle Schmidt # Particle Stokes #
Deposition of Particles on a Spherical Collector
(diffusion)
(interception) (impaction)
27.11.2012
23
Impaction only
2
35.0
St
St I d
p = 2 g/cm3
Q: Why is there an
optimal size?
Q: The operating condition of a vertical countercurrent spray chamber are: Q L /QG = 1 L/m3,
V G = 20 cm/s, d d = 300 m and z = 1 m. Calculate the collection efficiency of 8m
particles through this chamber. Assume atmospheric pressure, 25 oC and p of 1 g/cm3.
(Impaction parameterK p is
used in textbook; K p = 2 St )
27.11.2012 24
Venturi Scrubbers: Calvert Design
po po
po
po
GG
d LG Ld
K f K
f K f K
Q
d V Q 1
7.0
49.0
7.0
7.0ln4.17.0
55expP
Particle penetration through a venturi scrubber
K po=2St (aerodynamic diameter) using throat velocity
f = 0.5 for hydrophilic materials, 0.25 for hydrophobic materials
Sauter mean droplet diameter (Nukiyama and Tanasawa), d d
5.145.0
5.0
5.0
1 1000597
G
L
L
L
LG
d Q
Q
V
k d
k 1 = 58600 if V G is in cm/s
= 1920 if V G is in ft/s
, L and should be in cgs
Q L and QG should be of the same unit
27.11.2012
8/14/2019 ENV415 Air Pollution Control Engineering
http://slidepdf.com/reader/full/env415-air-pollution-control-engineering 52/98
25
f
f r p
D
Ld
G Dd t
G
LG L
vd
C
d
C l X
X X X k
Q
QV k p
Re
(Re)
4
Re
24
116
3
)1(2
3/1
242
2
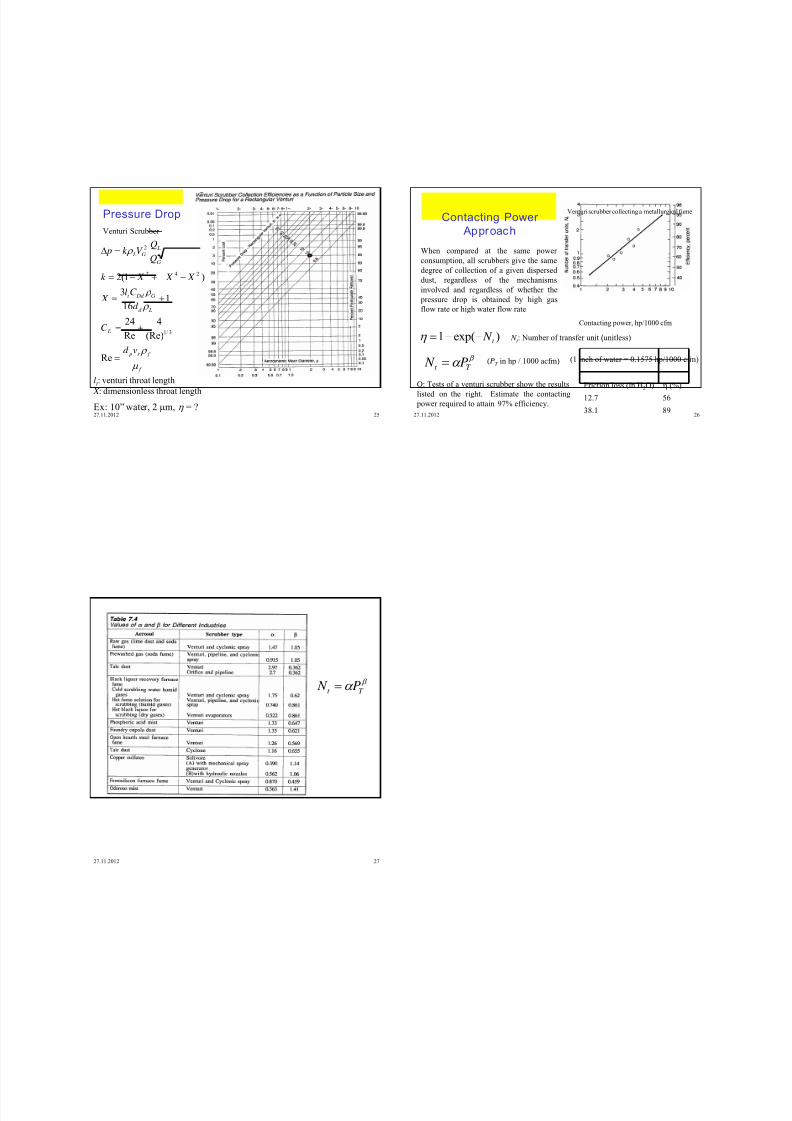
Pressure Drop
Venturi Scrubber
lt : venturi throat length X : dimensionless throat length
Ex: 10” water, 2 m, = ?27.11.2012 26
Contacting Power
Approach
)exp(1 t N
T t P N
Contacting power, hp/1000 cfm
When compared at the same power
consumption, all scrubbers give the same
degree of collection of a given dispersed
dust, regardless of the mechanisms
involved and regardless of whether the
pressure drop is obtained by high gas
flow rate or high water flow rate
(PT in hp / 1000 acfm)
N t : Number of transfer unit (unitless)
(1 inch of water = 0.1575 hp/1000 cfm)
Venturi scrubber collecting a metallurgical fume
Q: Tests of a venturi scrubber show the results
listed on the right. Estimate the contacting
power required to attain 97% efficiency.
Friction loss (in H2O) (%)
12.7 56
38.1 8927.11.2012
27
T t P N
27.11.2012
8/14/2019 ENV415 Air Pollution Control Engineering
http://slidepdf.com/reader/full/env415-air-pollution-control-engineering 53/98

8/14/2019 ENV415 Air Pollution Control Engineering
http://slidepdf.com/reader/full/env415-air-pollution-control-engineering 54/98
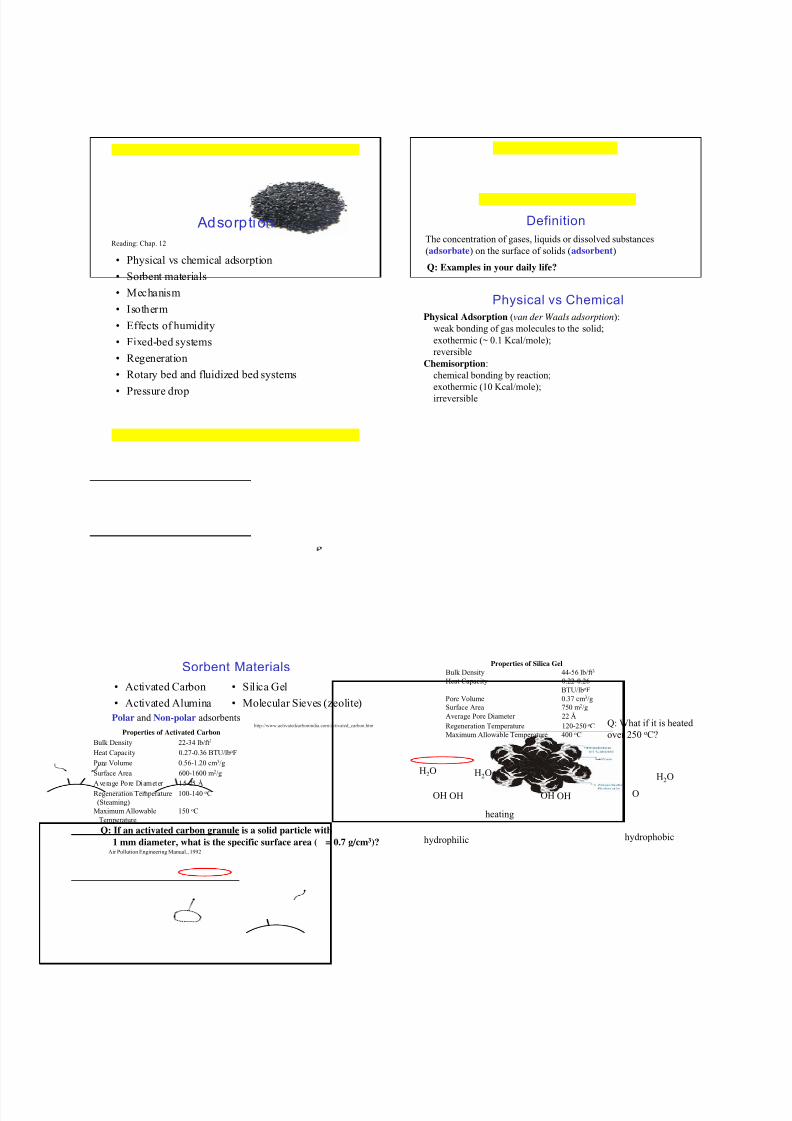
• Crystalline zeolite
• Uniform pores to selectively separate compounds by size & shape
Air Pollution Engineering Manual., 1992
Properties of Activated AluminaBulk Density
Granules 38-42 lb/ft3
Pellets 54-58 lb/ft3
Specific Heat 0.21-0.25 BTU/lboFPore Volume 0.29-0.37 cm3/gSurface Area 210-360 m2/gAverage Pore Diameter 18-48 ÅRegeneration Temperature (Steaming) 200-250 oCM axi mu m Al lowabl e T empera tur e 500 oC
Properties of Molecular Sieves
Anhydrous SodiumAluminosilicate
Anhydrous CalciumAluminosilicate
AnhydrousAluminosilicate
Type 4A 5A 13XDensity in bulk (lb/ft3) 44 44 38Specific Heat (BTU/lboF) 0.19 0.19 -Effective diameter of pores (Å) 4 5 13Regeneration Temperature (oC) 200-300 200-300 200-300Maximum Allowable Temperature (oC) 600 600 600
Adsorption Mechanism
Rate of adsorption
Rate of desorption
)1( f pk r aa
f k r d d
At equilibriumd a
a
k pk
pk f
Mono-layer coverage f k m a ' (m: mass of adsorbate adsorbed per unit mass of adsorbent)
Langmuir Isotherm
Adsorption Isotherm: the mass of adsorbate per unitmass of adsorbent at equilibrium & at a given
temperature
( f : fraction of surfacearea covered)
f
1- f
p
m
pk
k
k m
p
pk
pk m
1
2
12
1 1
1
Langmuir Isotherm
( p: partial pressure of the adsorbate, i.e., toluene)
Q: Low P? High P?
8/14/2019 ENV415 Air Pollution Control Engineering
http://slidepdf.com/reader/full/env415-air-pollution-control-engineering 55/98
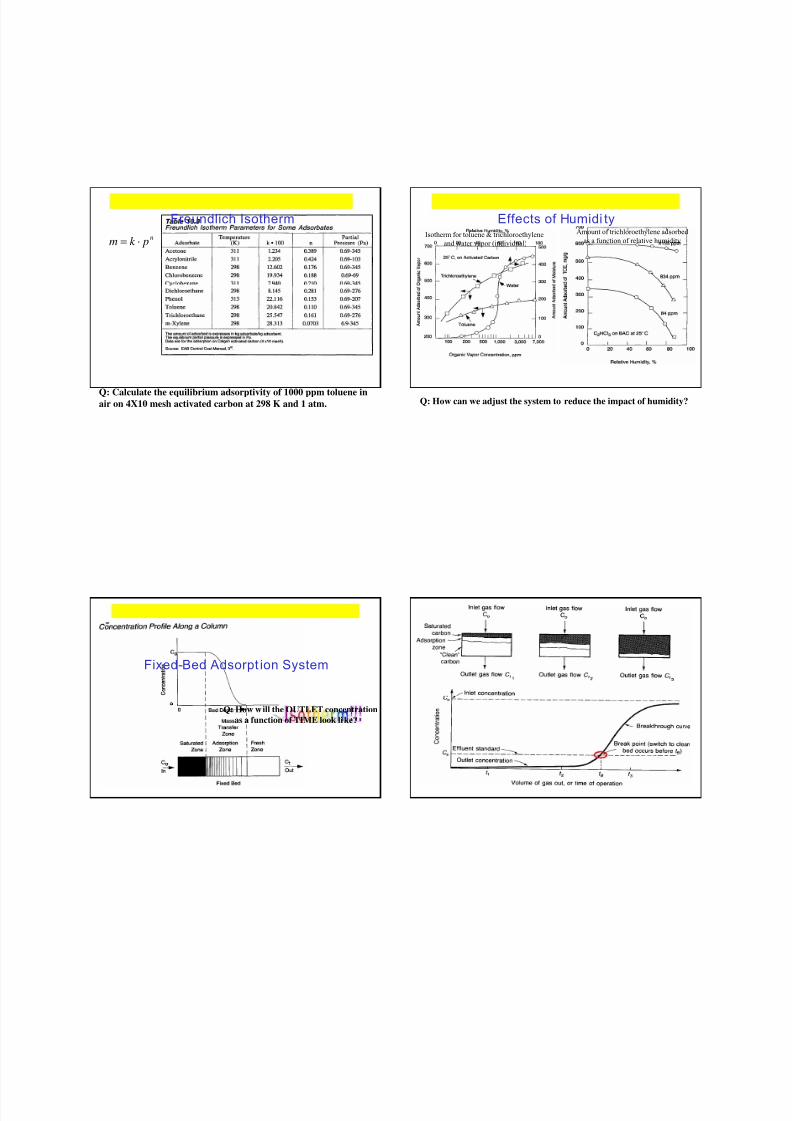
Freundlich Isotherm
n pk m
Q: Calculate the equilibrium adsorptivity of 1000 ppm toluene in
air on 4X10 mesh activated carbon at 298 K and 1 atm.
Effects of Humidi tyIsotherm for toluene & trichloroethylene
and water vapor (individual)
Amount of trichloroethylene adsorbedas a function of relative humidity
Q: How can we adjust the system to reduce the impact of humidity?
Fixed-Bed Adsorpt ion System
Q: How will the OUTLET concentration
as a function of TIME look like?
8/14/2019 ENV415 Air Pollution Control Engineering
http://slidepdf.com/reader/full/env415-air-pollution-control-engineering 56/98
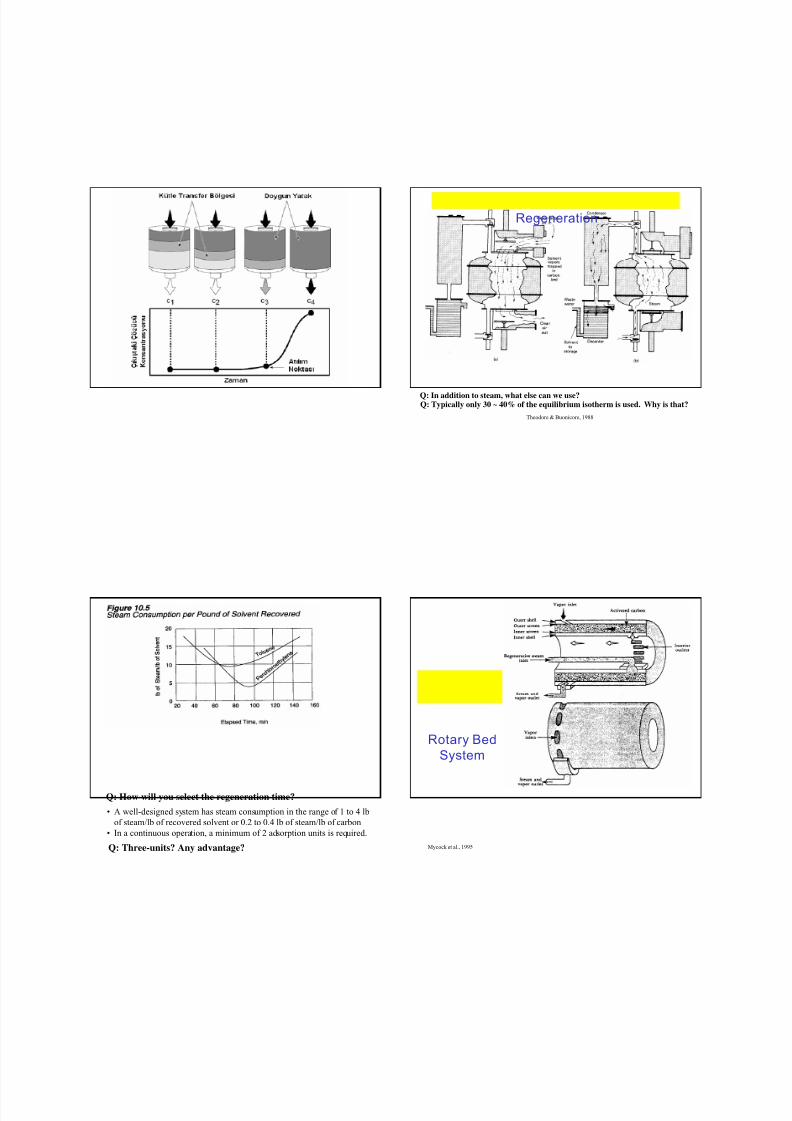
Regeneration
Theodore & Buonicore, 1988
Q: In addition to steam, what else can we use?Q: Typically only 30 ~ 40% of the equilibrium isotherm is used. Why is that?
• A well-designed system has steam consumption in the range of 1 to 4 lbof steam/lb of recovered solvent or 0.2 to 0.4 lb of steam/lb of carbon
• In a continuous operation, a minimum of 2 adsorption units is required.
Q: Three-units? Any advantage?
Q: How will you select the regeneration time?
Rotary Bed
System
Mycock et al., 1995

8/14/2019 ENV415 Air Pollution Control Engineering
http://slidepdf.com/reader/full/env415-air-pollution-control-engineering 57/98
Fluidized-Bed
System
Q: Benefits?
Pressure Drop
75.1'
)1(150
')1( 2
3
Gd G D
d Pg
p
gg p
Typical operating range:
< 20 in H2O; 20 < V < 100 ft/min==> determine theMaximum Adsorbent Bed Depth
P: pressure drop (lb/ft2) D: bed depth (ft) : void fractionG’: gas mass flux (lb/ft2-hr) g: gas viscosity (lb/ft-hr)d p: carbon particle diameter (ft)
Q: Why?
Union Carbide Empirical Equation56.1
10037.0
V DP
P: bed pressure drop, in H2OV : gas velocity, ~60-140 ft/min D: bed depth, ~5-50 inchesd p: 4X6 mesh sized carbon
Minimum Adsorbent Bed Depth
Need to be at least longer than the MTZ
S
B
s C
C D X
MTZ 11
1
C B: breakthrough capacity %C S : saturation capacity % X S : degree of saturation in the MTZ (usually 50%) D: bed depth
Other Systems: Nongenerablehpsl
Thin-bed adsorber
Canister adsorber
Mycock et al., 1995
Q: What need to be known to start the design of an adsorption
bed system?
8/14/2019 ENV415 Air Pollution Control Engineering
http://slidepdf.com/reader/full/env415-air-pollution-control-engineering 58/98
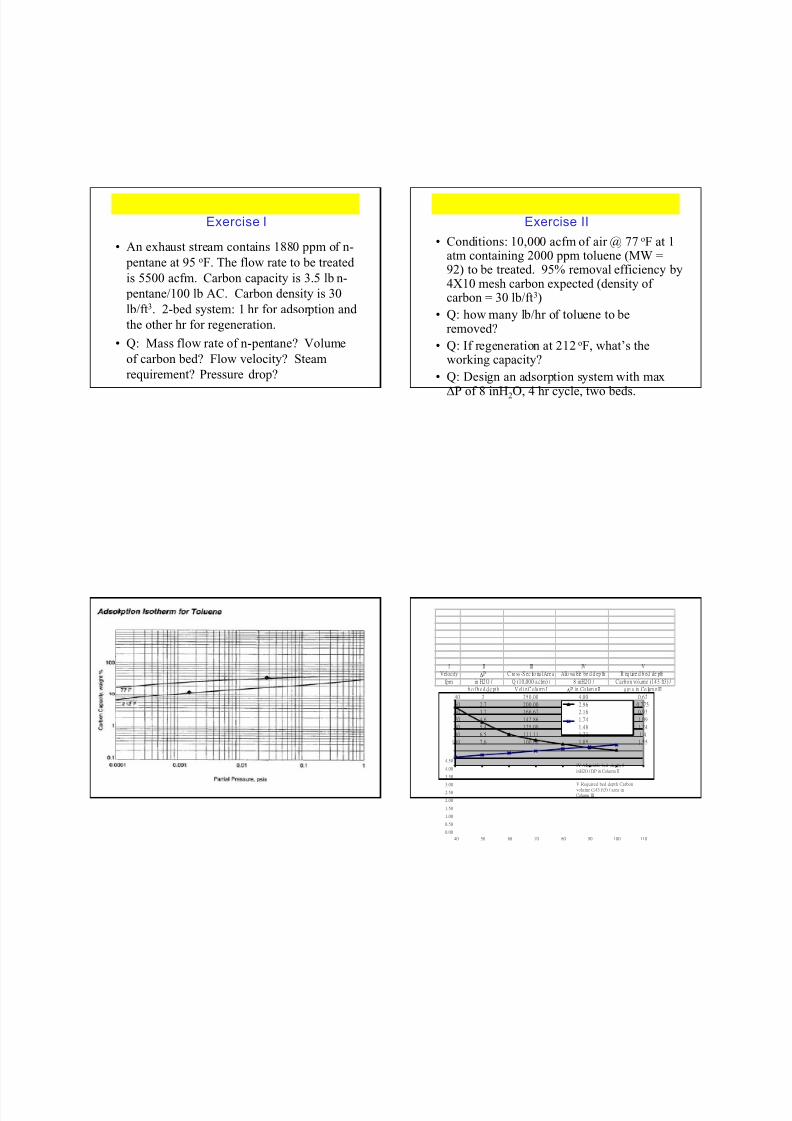
Exercise I
• An exhaust stream contains 1880 ppm of n- pentane at 95 oF. The flow rate to be treatedis 5500 acfm. Carbon capacity is 3.5 lb n- pentane/100 lb AC. Carbon density is 30lb/ft3. 2-bed system: 1 hr for adsorption andthe other hr for regeneration.
• Q: Mass flow rate of n-pentane? Volumeof carbon bed? Flow velocity? Steam
requirement? Pressure drop?
Exercise II
• Conditions: 10,000 acfm of air @ 77 oF at 1atm containing 2000 ppm toluene (MW =92) to be treated. 95% removal efficiency by4X10 mesh carbon expected (density ofcarbon = 30 lb/ft3)
• Q: how many lb/hr of toluene to beremoved?
• Q: If regeneration at 212 oF, what’s theworking capacity?
• Q: Design an adsorption system with maxP of 8 inH2O, 4 hr cycle, two beds.
0.00
0.50
1.00
1.50
2.00
2.50
3.00
3.50
4.00
4.50
40 50 60 70 80 90 100 110
IV Allowable bed depth 8
inH2O / DP in Column II
V Required bed depth Carbon
volume (143 ft3) / area in
Column III
I II III IV V
Velocity P C ro ss -S ec tio na l Are a Allo wa ble be d d ep th R eq uire d b ed de pth
fpm in H2O / Q (10,000 a cfm) / 8 inH2O / C a rbon volume (143 ft3) /
ft o f b e d d e pt h V el i n C o lu mn I P in Co lum n II a re a in Co lum n III
40 2 250.00 4.00 0.62
50 2.7 200.00 2.96 0.775
60 3.7 166.67 2.16 0.93
70 4.6 142.86 1.74 1.09
80 5.4 125.00 1.48 1.24
90 6.5 111.11 1.23 1.4
100 7.6 100.00 1.05 1.55

8/14/2019 ENV415 Air Pollution Control Engineering
http://slidepdf.com/reader/full/env415-air-pollution-control-engineering 59/98
Absorption
• Definition
• Equipment
• Packing materials
• Design considerations:
– Mass balance
– High gas flow
– Mass flow
• Concentrated systems
• HTU (Height of a Transfer Unit) and NTU
Reading: Chap. 13
img.alibaba.com/photo/50678451/Ceramic_Metal_...
Definition
Transfer of a gaseous component
(absorbate) from the gas phase to a
liquid (absorbent) phase through a
gas-liquid interface.
Q: What are the key parameters that affect the effectiveness?
Q: How can we improve absorption efficiency?
Mass transfer rate: gas phase controlled absorption
liquid phase controlled absorption
Q: Does it matter if it’s gas phase or liquid phase controlled?
Equipment
Mist
Eliminator
Liquid
SprayPacking
Liquid outlet
Dirty gas in
Spray
nozzle
Clean gas out
Countercurrent
packed tower
Spray tower
Mycocket al., 1995
Redistributor Q: Limitations of a
spray tower? Q: Why redistributor?
Clean gas out
Dirty gas in
Berl
Saddle
Intalox
SaddleRaschig
Ring
Lessing
RingPall
Ring
Tellerette
Three-bed cross
flow packed tower
Liquid sprayDry Cell
Packing
Mycock et al., 1995Q: Criteria for good packing materials?
8/14/2019 ENV415 Air Pollution Control Engineering
http://slidepdf.com/reader/full/env415-air-pollution-control-engineering 60/98
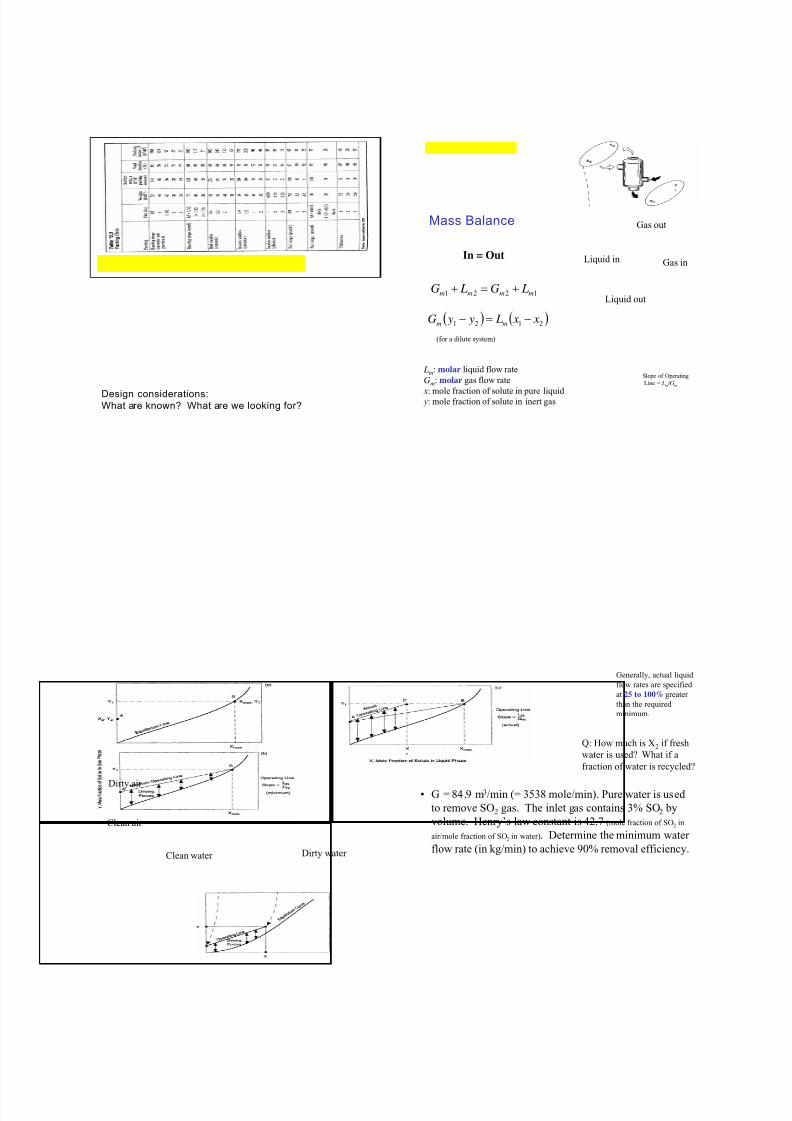
Design considerations:
What are known? What are we looking for?
Mass Balance
In = Out
Slope of OperatingLine = Lm /Gm
1221 mmmm LG LG
2121 x x L y yG mm
Lm: molar liquid flow rate
Gm: molar gas flow rate x: mole fraction of solute in pure liquid
y: mole fraction of solute in inert gas
(for a dilute system)
Gas in
Liquid out
Gas out
Liquid in
Clean water Dirty water
Clean air
Dirty air
Generally, actual liquid
flow rates are specified
at 25 to 100% greater
than the required
minimum.
• G = 84.9 m3/min (= 3538 mole/min). Pure water is used
to remove SO2 gas. The inlet gas contains 3% SO2 by
volume. Henry’s law constant is 42.7 (mole fraction of SO2 in
air/mole fraction of SO2 in water). Determine the minimum water
flow rate (in kg/min) to achieve 90% removal efficiency.
Q: How much is X2 if fresh
water is used? What if afraction of water is recycled?
8/14/2019 ENV415 Air Pollution Control Engineering
http://slidepdf.com/reader/full/env415-air-pollution-control-engineering 61/98
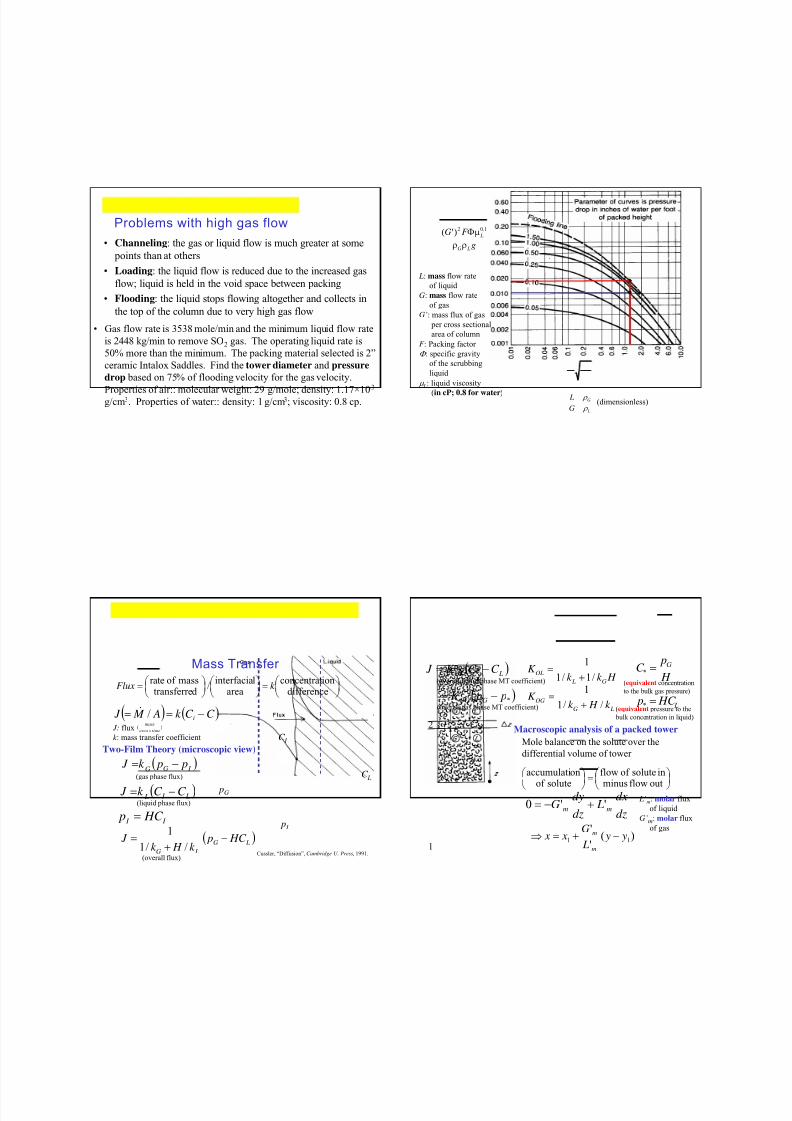
• Channeling: the gas or liquid flow is much greater at some
points than at others
• Loading: the liquid flow is reduced due to the increased gas
flow; liquid is held in the void space between packing
• Flooding: the liquid stops flowing altogether and collects in
the top of the column due to very high gas flow
Problems with high gas flow
• Gas flow rate is 3538 mole/min and the minimum liquid flow rate
is 2448 kg/min to remove SO2 gas. The operating liquid rate is
50% more than the minimum. The packing material selected is 2”
ceramic Intalox Saddles. Find the tower diameter and pressure
drop based on 75% of flooding velocity for the gas velocity.Properties of air:: molecular weight: 29 g/mole; density: 1.17×10⁻³
g/cm3. Properties of water:: density: 1 g/cm3; viscosity: 0.8 cp. L
G
G
L
g
F G
LG
L
1.02)'(
L: mass flow rate
of liquid
G: mass flow rate
of gas
G’: mass flux of gas
per cross sectional
area of column
F : Packing factor
: specific gravity
of the scrubbing
liquid
L: liquid viscosity
(in cP; 0.8 for water)
(dimensionless)
Mass Transfer
differenceionconcentrat
arealinterfacia
/d transferre
massof ratek Flux
Two-Film Theory (microscopic view)
I GG p pk J
L I L C C k J
I I HC p
LG
LG
HC pk H k
J
//1
1
Cussler, “Diffusion”, Cambridge U. Press, 1991.
C C k A M J i /
pG
C I
p I
C L
)(timearea
mass
J: flux
k : mass transfer coefficient
(gas phase flux)
(liquid phase flux)
(overall flux)
*
*
p pK
C C K J
GOG
LOL
LG
OG
G L
OL
k H k K
H k k K
//1
1/1/1
1
L
G
HC p
H
pC
*
*
Macroscopic analysis of a packed tower
outflowminusinsoluteof flow
soluteof onaccumulati
dz
dx L
dz
dyG mm ''0
Mole balance on the solute over the
differential volume of tower
)('
'11 y y
L
G x x
m
m
(equivalent concentration
to the bulk gas pressure)
(equivalent pressure to the
bulk concentration in liquid)
(overall liquid phase MT coefficient)
(overall gas phase MT coefficient)
1
2
L’m: molar flux
of liquid
G’m: molar flux
of gas

8/14/2019 ENV415 Air Pollution Control Engineering
http://slidepdf.com/reader/full/env415-air-pollution-control-engineering 62/98
Mole balance on the solute in the gas only
absorption bylostsolute
outflowminusinflowsolute
onaccumulatisolute
*)('0 y yaPK dz
dyG OGm
1
*
'
0
y
yOG
m Z
Z y y
dy
aPK
Gdz Z Hx y *
Z Z mmOG
m
Z Z mmOG
Hx y
Hx y
L HGaPK
G
Hx y
Hx y
L H GaPK Z
11
11
ln'/'1
1'
ln'/'/1
11
NTU?HTU?
a: packing area per volume
(tower height)
11'
' x x
G
L y y
m
m
Mass balance
Equilibrium
Hx y *
1
*
' y
yOG
m
Z y y
dy
aPK
G Z
x1 , y1*
x1 , y1
x Z , y Z *
x Z , y Z
Alternative solution:
*
*11
**
111
ln
;'
z z
z z LM
LM
z
OG
m
y y y y
y y y y y
y
y y
aPK
G Z
Assumptions for dilute/soluble systems?
Pure amine
Lm = 0.46 gmole/s
0.04% CO2
1.27% CO2
Gm = 2.31
gmole/s
C* = 7.3%
CO2 in amine
Q: A Packed tower using organic amine at 14 oC
to absorb CO2. The entering gas contains 1.27%
CO2 and is in equilibrium with a solution of
amine containing 7.3% mole CO2. The gas
leaves containing 0.04% CO2. The amine,
flowing counter-currently, enters pure. Gasflow rate is 2.31 gmole/s and liquid flow rate is
0.46 gmole/s. The tower’s cross-sectional area
is 0.84 m2. K OGa = 9.34×10⁻⁶ s-1atm-1cm-3. The
pressure is 1 atm. Determine the tower height
that can achieve this goal.
Absorption of concentrated vapor
Mole balance on the controlled volume
)'()'(0 x Ldz
d yG
dz
d mm
Gas flux
yGG mm
11'' 0
Liquid flux
x L L
mm1
1'' 0
1
1
0
0
1
1
1
1
0
0
1
1
11'
'
11
11'
'
1
x
x
x
x
G
L
y
y
x
x
x
x
G
L
y
y
y
m
m
m
m
x1 , y1
x1 , y1*
x Z , y Z *
x Z , y Z

8/14/2019 ENV415 Air Pollution Control Engineering
http://slidepdf.com/reader/full/env415-air-pollution-control-engineering 63/98
Mole balance on the gas in a differential tower volume
*)(
1
'0
2
0 y yaPK dz
dy
y
GOG
m
NTU HTU
y y y
dy
aPK
Gdz Z
y
yOG
m Z
Z
1
*)1(
'2
0
0
aPK
G HTU
OG
m0'
1
*)()1(
2
y
y Z y y y
dy NTU
HTU
(ft)
HTU
For a given packing material and
pollutant, HTU does not change much.
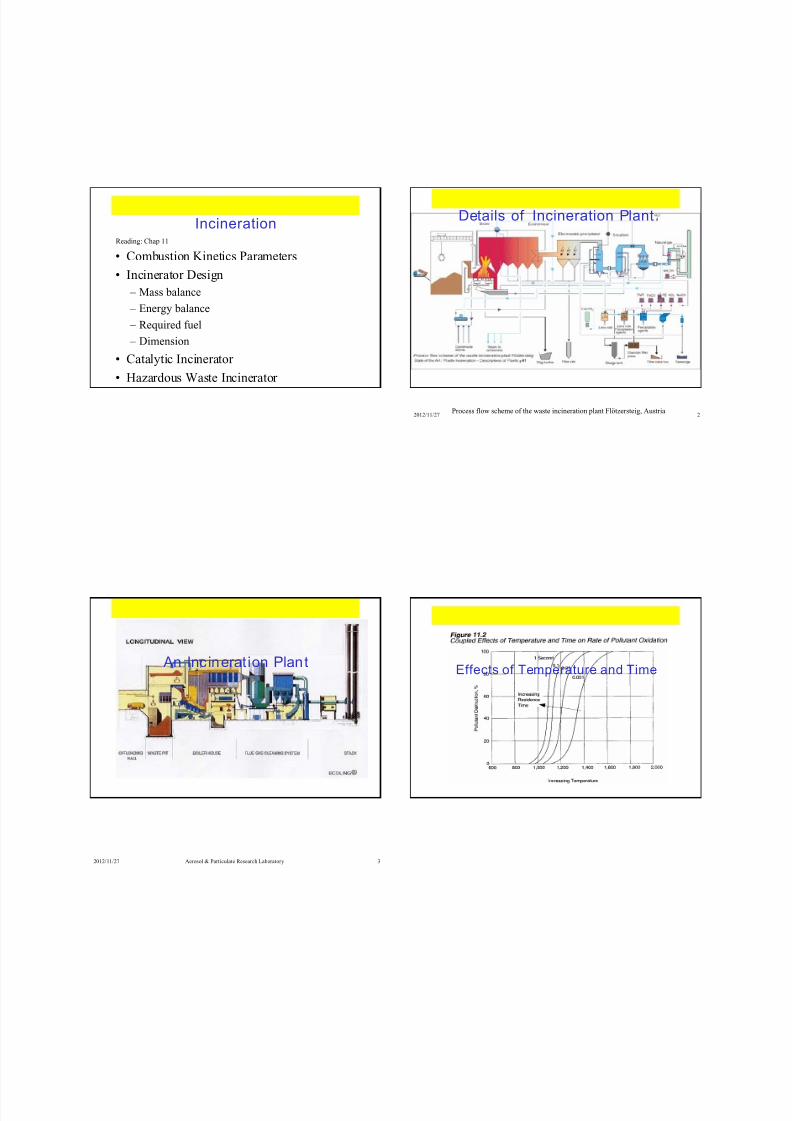
8/14/2019 ENV415 Air Pollution Control Engineering
http://slidepdf.com/reader/full/env415-air-pollution-control-engineering 64/98

8/14/2019 ENV415 Air Pollution Control Engineering
http://slidepdf.com/reader/full/env415-air-pollution-control-engineering 65/98
Combustion Kinetics (Global models)
n
A A kC
dt
dC C A: concentration of pollutant A
k : kinetic rate constant
n: reaction order
If pollutant concentration is much less than O2 concentration,
n can be assumed to be 1.
kt C
C
A
A exp0
Arrhenius Equation for rate constant
RT E Ak act /exp E act : activation energy (cal/mol) R: gas constant (1.987 cal/gmole K)
Determination of A and E act
'
'2
R
P yS Z A
O
Z’ collision rate factor
S : Steric factor (ineffective collision)
yO2: mole fraction of O2
in the afterburner
P: pressure (atm)
R’: gas constant(0.08205 l-atm/mol oK)
MW S
16
1.4600966.0 MW E act
Q: How long does it take to incinerate 99% toluene (MW = 96)
at 1000 K (O2 mole fraction = 0.15)?
(Kcal/mol)
Thermal Incinerator Design –Isothermal Plug Flow Reactor
Knowns? Unknowns?
mwaste gas
mburner air
m fuel
T 1
mexhaust T 2

8/14/2019 ENV415 Air Pollution Control Engineering
http://slidepdf.com/reader/full/env415-air-pollution-control-engineering 66/98
Mass Balance:
air exhaust air burner fuelgaswaste mmmm
Out In
Energy Balance
00 T T C mT T C Q
H Q H mq
p pg
gh
qh: heat rate required
Q: gas volume flow rate
g: gas density
H : enthalpy (Table B.7)C p: specific heat
T 0: reference temperature (25 oC or 60 oF)
.
(Stoichiometry)
Steady State Energy Balance
losscombustionVOC VOC VOC combustion fuel
air burner air burner fuel fuelgaswastegaswasteexhaust exhaust
q H m X H m
H m H m H m H m
X : fractional conversion of VOC
Assume (1) the enthalpy functions of all streams are similar to that
for air
(2) the heat loss is a fraction of the heat input
0T T C H p
losscombustionVOC VOC VOC combustion fuelloss f H m X H mq
Combining mass balance and heat loss relationship with energy balance
Heat of Combustion
Higher Heating Value (HHV) =
Lower Heating Value (LHV) + Latent Heat of Water (Table B.6)
1 BTU/lb = 2.326 KJ/kg
)()1(/
)1(
)()(
fuelexhaust losscombustion
combustionVOC VOC lossVOC
air burner exhaust air burner gaswasteexhaust gaswaste
fuel
H H f H
H m f X
H H m H H mm
lossVOC VOC VOC combustion fuel
VOC VOC VOC combustion fuel
air burner b fuel fuelgaswastegaswaste
exhaust air burner fuelgaswaste
f H m X H m
H m X H m
H m H m H m
H mmm
combustion
combustion
air urner
Then group items by each material flow
Sizing the Incinerator
T
exhaust I
Q D
v
4
Incinerator diameter Qexhaust : exhaust flow rate
vT : gas velocity in the incinerator
(20 ~ 40 ft/s)
Length of Incinerator
r T L v r : residence time (0.2 ~ 2.0 s)
Length/diameter = 2 ~ 3 Q: Stoichiometric air? Excess air? Effects?
Q: What will happen if velocity
is too low?
A waste gas stream of 2465 acfm enters the afterburner at 200 F.
The desired exhaust temperature is 1350 F. It is estimated that the
burner will bring in 200 acfm of outside air. Both the burner air and
the fuel gas enter at 80 F. Assuming 10% overall heat loss and
ignoring any benefits of the oxidation of the pollutants, calculate the
required mass flow rate of methane.

8/14/2019 ENV415 Air Pollution Control Engineering
http://slidepdf.com/reader/full/env415-air-pollution-control-engineering 67/98
Catalytic Oxidizers
• Advantages of Catalytic Oxidation – Lower fuel requirements
– Lower NOx, CO and CO2 emissions
• Disadvantages – Subject to deactivation – thermal aging (sintering of support and
deposited catalyst)
– Presence of poisons and suppressants problematic – "poison" isirreversible, fast-acting: P, Bi, As, Hg, Pb;
slow-acting: Fe, Sn, Si
– Suppressants – halogens, S
– Masking – covering or blocking access to sites - PM
– Erosion – e.g. particles in gas stream
Q: How can it do that?
Q: How does it look like?
Examples
of Catalyst
Supports
Catalytic OxidizerReduces activation energy
• Heat required to raise temperature of gases is lower

8/14/2019 ENV415 Air Pollution Control Engineering
http://slidepdf.com/reader/full/env415-air-pollution-control-engineering 68/98
Catalytic Converter
(automobiles)
Washcoats onautomotive catalyst
Automotive
catalyst Structural
design including
honeycomb
support and
mounting can
Catalytic Oxidizers continued
• Types of Catalysts
– Precious Metal: Pt, Pd, Rh – more prevalent with lower operating T and
shorter residence time
– Base Metal: Cu, Cr, Mn, Co – in some cases designed for more
resistant to certain contaminants, Cl
• Operating temperature
– Too low, get products of incomplete combustion (PICs)
– Too high, increases thermal aging (operate < 1200 oF to avoid
"sintering")
– Normally when getting high destruction effi ciency,
• k chemical rxn >> k mass transfer
Q: What design parameters are we looking for?
Q: Pollutant concentration as a function of distance from the catalyst surface: (1)
reaction on catalyst surface is slow; (2) reaction on catalyst surface is very fast?
Mass transfer limited design
• For mass transfer limited case gas phase resistance controls rateof destruction – use mass transfer coeff. k m
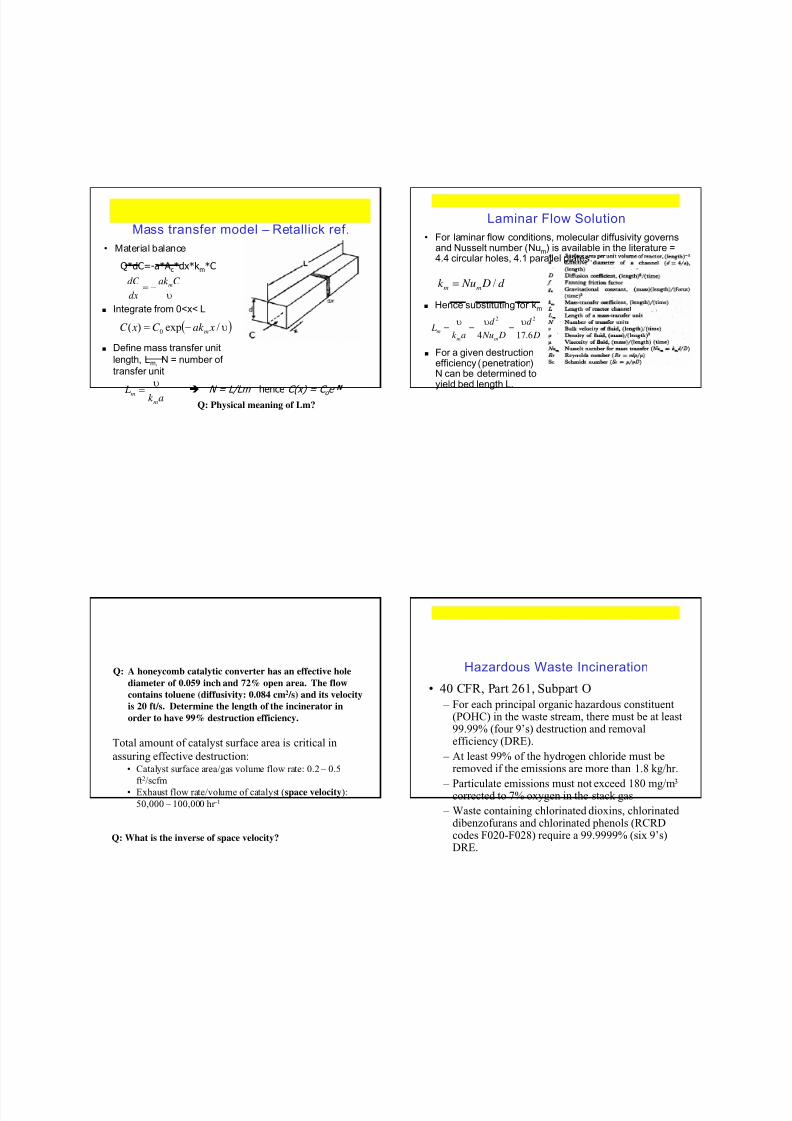
8/14/2019 ENV415 Air Pollution Control Engineering
http://slidepdf.com/reader/full/env415-air-pollution-control-engineering 69/98
Mass transfer model – Retallick ref.
• Material balance
Integrate from 0<x< L
Define mass transfer unit
length, Lm, N = number of
transfer unit
N = L/Lm hence C(x) = C o e -N
Q*dC=-a*A c*dx*k m*C
C ak
dx
dC m
/exp)( 0 xak C xC m
ak L
m
m
Q: Physical meaning of Lm?
Laminar Flow Solution
• For laminar flow conditions, molecular diffusivity governsand Nusselt number (Nu
m) is available in the literature =
4.4 circular holes, 4.1 parallel plates.
Hence substituting for km
For a given destructionefficiency (penetration)
N can be determined toyield bed length L.
d D Nuk mm /
D
d
D Nu
d
ak L
mm
m6.174
22
Q: A honeycomb catalytic converter has an effective hole
diameter of 0.059 inch and 72% open area. The flow
contains toluene (diffusivity: 0.084 cm2 /s) and its velocity
is 20 ft/s. Determine the length of the incinerator in
order to have 99% destruction efficiency.
Total amount of catalyst surface area is critical in
assuring effective destruction:• Catalyst surface area/gas volume flow rate: 0.2 – 0.5
ft2/scfm
• Exhaust flow rate/volume of catalyst (space velocity):
50,000 – 100,000 hr -1
Q: What is the inverse of space velocity?
Hazardous Waste Incineration
• 40 CFR, Part 261, Subpart O
– For each principal organic hazardous constituent(POHC) in the waste stream, there must be at least99.99% (four 9’s) destruction and removalefficiency (DRE).
– At least 99% of the hydrogen chloride must beremoved if the emissions are more than 1.8 kg/hr.
– Particulate emissions must not exceed 180 mg/m3
corrected to 7% oxygen in the stack gas
– Waste containing chlorinated dioxins, chlorinateddibenzofurans and chlorinated phenols (RCRDcodes F020-F028) require a 99.9999% (six 9’s)DRE.

8/14/2019 ENV415 Air Pollution Control Engineering
http://slidepdf.com/reader/full/env415-air-pollution-control-engineering 70/98

8/14/2019 ENV415 Air Pollution Control Engineering
http://slidepdf.com/reader/full/env415-air-pollution-control-engineering 71/98
NOx
• Thermal NOx vs Fuel NOx
• Strategies for Combustion Modifications
– Off stoichiometric combustion, flue gas
recirculation, water injection, gas reburning, low
NOx burner
• Flue Gas Treatment
– SCR, SNR, Absorption, Adsorption
Reading: Chap 16
27.11.2012 1 27.11.2012 2
NOx
Thermal NOx vs Fuel NOx
• Thermal NOx: formed by reaction between N2 and O2
in the air; sensitive to temperature
– Fast formation rate at high temperature
– Fast cooling rate freezes formed NOx
• Fuel NOx: formed from combustion of fuels containing
organic nitrogen in the fuel; dependent on localcombustion conditions and nitrogen content in the fuel
• NOx Control:
– combustion modification --> prevent formation
– flue gas treatment --> treat formed NOx
Q: Can absorption, adsorption or incineration be used to
control NOx?
27.11.2012 3
Strategies for Combustion Modification
• Reduce peak
temperatures of the
flame zone
• Reduce gas
residence time in
the flame zone
Q: Temperature as a
function of equivalent ratio?
tricStoichiomeair
fuel/
air
fuel:)(ratioEquivalent
27.11.2012 4
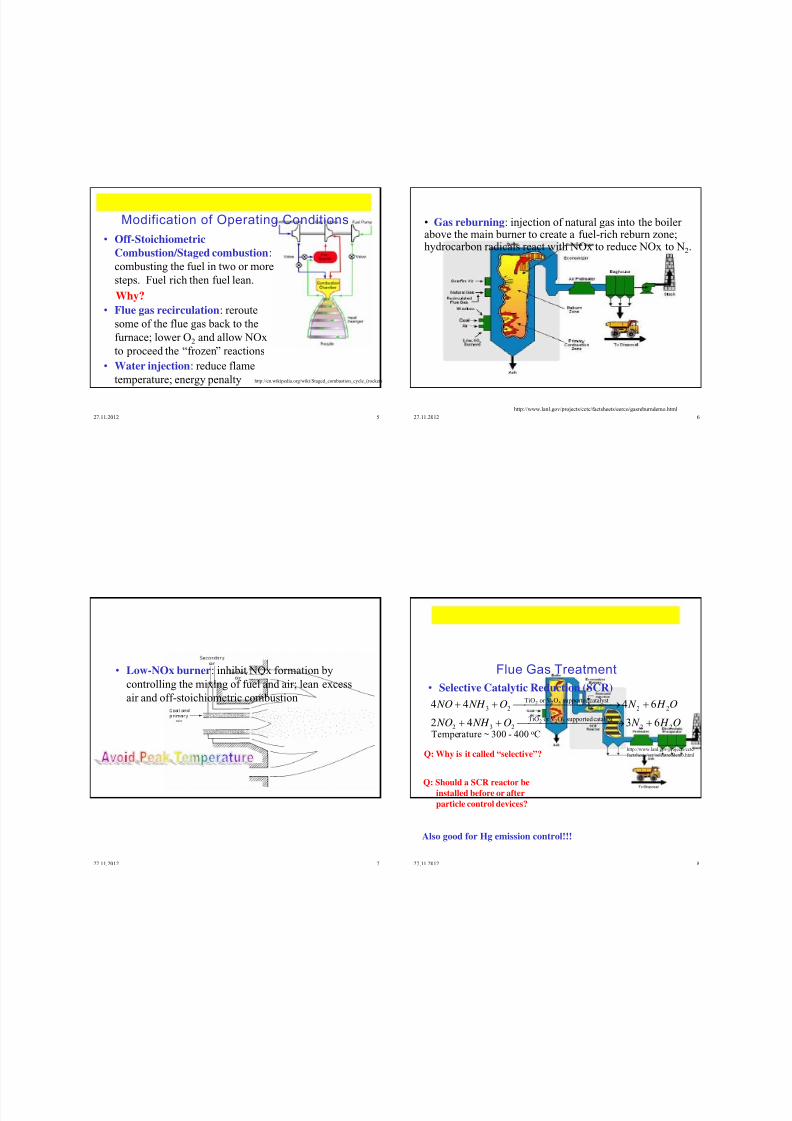
8/14/2019 ENV415 Air Pollution Control Engineering
http://slidepdf.com/reader/full/env415-air-pollution-control-engineering 72/98
• Off-Stoichiometric
Combustion/Staged combustion:
combusting the fuel in two or more
steps. Fuel rich then fuel lean.
• Flue gas recirculation: reroute
some of the flue gas back to the
furnace; lower O2 and allow NOx
to proceed the “frozen” reactions
• Water injection: reduce flame
temperature; energy penalty
Modification of Operating Conditions
Why?
http://en.wikipedia.org/wiki/Staged_combustion_cycle_(rocket)
27.11.2012 5
• Gas reburning: injection of natural gas into the boilerabove the main burner to create a fuel-rich reburn zone;hydrocarbon radicals react with NOx to reduce NOx to N2.
http://www.lanl.gov/projects/cctc/factsheets/eerco/gasreburndemo.html
27.11.2012 6
• Low-NOx burner: inhibit NOx formation by
controlling the mixing of fuel and air; lean excess
air and off-stoichiometric combustion
27.11.2012 7
Flue Gas Treatment
• Selective Catalytic Reduction (SCR)
O H N O NH NO
O H N O NH NO
22
catalystsupported OVorTiO
232
22
catalystsupported OVorTiO
23
6342
6444
522
522
Q: Should a SCR reactor be
installed before or after
particle control devices?
Q: Why is it called “selective”?
Temperature ~ 300 - 400 oC
http://www.lanl.gov/projects/cctc/
factsheets/scr/selcatreddemo.html
Also good for Hg emission control!!!
27.11.2012 8

8/14/2019 ENV415 Air Pollution Control Engineering
http://slidepdf.com/reader/full/env415-air-pollution-control-engineering 73/98
O H NOO NH
O H N O NO NH
223
2223
6454
6444
Temperature ~ 800 - 1000 oC
Q: Disadvantages of
SCR and SNR?Above 1000 oC
• Selective Noncatalytic Reduction (SNR)
222
32
2222
32
22 2
OO H OH HO
HNO NO HO
O H HOO H OH
HNO NOOH
HONO NOOH
OH O H
• Wet Absorption: generally good for only NO2
because NO is insoluble. Need to oxidize NO first.
27.11.2012 9
• Dry Sorption
– Activated carbon (220 ~ 230 oC): reduce NOx to N2;
oxidize SO2 to H2SO4 if NH3 is injected, and carbon is
thermally regenerated to remove concentrated H2SO4
– Shell Flue Gas Treating System (~ 400 oC)
– Alkali Metal and Alkali Earth Metal based sorbents:
form metal nitrates (e.g. NaNO3, Mg(NO3)2)
CuOOCu
O H SOCu H CuSO
O H N O NH NO
CuSOSOOCuO
2
2224
22
catalystsasCuSOorCuO
23
422
5.0
22
6444
5.0
4
27.11.2012 10
27.11.2012 11
Chambers Medical -
Dry Sorbent InjectionProcess Flow
For removal of SO2and HCl
27.11.2012 12

8/14/2019 ENV415 Air Pollution Control Engineering
http://slidepdf.com/reader/full/env415-air-pollution-control-engineering 74/98
27.11.2012 13 27.11.2012 14
Active carbon
and Sodium-
Bi-Carbonate
are feeded to
the flue gas in
the dry
scrubbing
system
27.11.2012 15
http://www.ergapc.co.uk/
Odour Scrubbing System
27.11.2012 16

8/14/2019 ENV415 Air Pollution Control Engineering
http://slidepdf.com/reader/full/env415-air-pollution-control-engineering 75/98
27.11.2012 17
Odour Scrubbing System
27.11.2012 18
Ash Treatment

8/14/2019 ENV415 Air Pollution Control Engineering
http://slidepdf.com/reader/full/env415-air-pollution-control-engineering 76/98
Control of SO2
• Strategies for SO2 removal
• Formation Prevention
– Low sulfur fuel, Fuel desulfurization,
• Flue Gas Treatment
– Wet scrubbing, Dry scrubbing, Spray drying, Dual
Alkali, Wellman-Lord Process
Reading: Chap 15
27.11.2012 1
Strategies for SO2 Removal
Main Option Suboption Examples of Processes
Do not create SO2 Low-sulfur fuel
Desulfurize the fuel Oil desulfurization, Coal
cleaning
SO2 scrubbing:
Throwaway Wet scrubbing Lime, Limestone, Dual alkali,
Misubishi, Bischoff, Forced
oxidation (w/ gypsum disposal)
Dry scrubbing Lime spray drying, Lime
injection, Trona, Nahcolite
Regenerative Wet processes Absorption with water(smelters), Wellman-Lord,
MgO, Citrate, Aqueous
carbonate, SULF-x,
CONOSOx, Forced oxidation
(w/ gympsum sales)Dry processes Activated carbon adsorption,
Copper oxide adsorption
27.11.2012 2
Fuel Desulfurization
Oil & natural gas
RS H H S R 2
reactioncatalytic
2
Claus process
S O H SOS H
SOO H OS H
322
23
2
reaction catalytic
22
2222
Coal
Mineral sulfate
--> wash away
Organic sulfur ???
--> SO2 removal
IGCC – Integrated
GasificationCombined
CycleSO2 Removal
High concentration (e.g. smelting)
Absorbing SO2 to make H2SO4
Low concentration (< 2000 ppm)
Flue gas desulfurization
(for sale; a commodity,not a pollutant)
27.11.2012 3
Limestone (Wet) Scrubbing
O H gCOCaSOCa HSOsCaCO
gCO HSOCaSOO H sCaCO
223
2
33
23
2
223
)(22)(
)(22)(
Q: Advantages and disadvantages compared to water?
LSO I SO L
C C k J ,,22
Mass transfer in liquid film
Overall mass transfer coefficient
LG
OGk H k
K //1
1
Main reactions converting SO2 to bisulfite in the liquid film
32
2
32
322
2 HSOO H SOSO
HSO H O H SO
: enhancement factor
precipitate
Q: Does mass transfer
increase as increases?
(packed tower)
(effluent
hold tank)
27.11.2012 4

8/14/2019 ENV415 Air Pollution Control Engineering
http://slidepdf.com/reader/full/env415-air-pollution-control-engineering 77/98
27.11.2012 5
Q: Is it better to have a high pH?
27.11.2012 6
Lime (Wet) Scrubbing
O H CaSOOO H CaSOO H CaSOOH CaSO H
SO H O H SOOH CaO H CaO
24223
23232
3222
22
25.022)(
Dual Alkali
NaOH yCaSO xCaSO
O H Na ySO xSOCaCOCaO
O H ySO xSO NaSO NaOH SO Na
34
2
2
3
2
43
2
2
3
2
4232
5.0/
5.0/
(recycled)
Q: How does it compare to limestone scrubbing?
Q: Advantages and disadvantages?
27.11.2012 7
Lime-Spray Drying
Same as lime scrubbing except the water evaporates
before the droplets reach the bottom of the tower
Dry scrubbing
Direct injection of pulverized lime or limestone, also
trona (natural Na2CO3) or nahcolite (natural NaHCO3)
Q: Advantage of dry methods over wet methods?
Ca2+
SO2
Ca2+
CaSO4
CaO
CaSO4
CaO
27.11.2012 8

8/14/2019 ENV415 Air Pollution Control Engineering
http://slidepdf.com/reader/full/env415-air-pollution-control-engineering 78/98
27.11.2012 9
Dry scrubbing
http://wpca.info/library.php
27.11.2012 10
Dry scrubbing-Process Layout
Atomizer
Wellman-Lord (W-L) process
(1) Flue gas pretreatment: (venturi prescrubber) to remove
particulates, SO3 and HCl
(2) SO2 absorption by Na2SO3 solution
3422332
42232
32232
225.0
2
NaHSOSO NaO H SOSO Na
SO NaOSO Na
NaHSOO H SOSO Na
(3) Purge treatment: centrifuge the slurry to remove solids
(4) Na2SO3 regeneration
232232
223232
COSO NaSOCO Na
O H SOSO Na NaHSOheat
(averagely, 1 mole Na2SO3 for 42 moles of SO2)
No further SO2 absorption
(concentrated, 85%)
(make-up sodium)
Claus process
27.11.2012 11 27.11.2012 12
Westvaco process
In the Westvaco process, the activated-carbon catalyst with the adsorbed/absorbed H2SO4
is regenerated by bringing it into contact with H2S in a fluidized bed at 150 oC when the
H2SO4 is converted to elemental sulphur. A fraction of elemental sulphur is recovered from
the carbon by direct vaporization in a stripper. The remaining sulphur is reacted with
hydrogen to provide the H2S require in the earlier step.
Adsorber/
Absorber Reducer Stripper
H2S
production
Unit
O H S S H SO H
SO H OO H SO
2
carbonactivated
242
42
carbonactivated
222
443
5.0
Clean Gas
Flue gas
containing SO2 H2S from
Natural gas
Activated Carbon
H2S

8/14/2019 ENV415 Air Pollution Control Engineering
http://slidepdf.com/reader/full/env415-air-pollution-control-engineering 79/98
27.11.2012 13
Diagram of gas suspension absorption system.

8/14/2019 ENV415 Air Pollution Control Engineering
http://slidepdf.com/reader/full/env415-air-pollution-control-engineering 80/98
27.11.2012 1
Control in Mobile Sources
• Types of mobile sources
• Impact of mobile sources
• Emission standards
• Types of engines: gasoline vs diesel, 4-strokes vs
2-strokes
• Emission Control: technology and policy
• Add-on Control Device – catalytic converter
• Hybrid Vehicles and Fuel Cells
Reading: Chap 15
Gasoline engines emit carbon monoxide (CO), nitrogen oxides (NOx),
hydrocarbons (HC), particulate matter (PM), and lead (where leaded gasoline isused), as well as other toxics such as benzene, 1,3 butadiene, and formaldehyde.
27.11.2012 2
Mobile Sources
AIRCRAFT
http://www.flightradar24.com/
27.11.2012 3
Mobile Sources
http://www.flightradar24.com/
27.11.2012 4
Mobile Sources
Ship Track
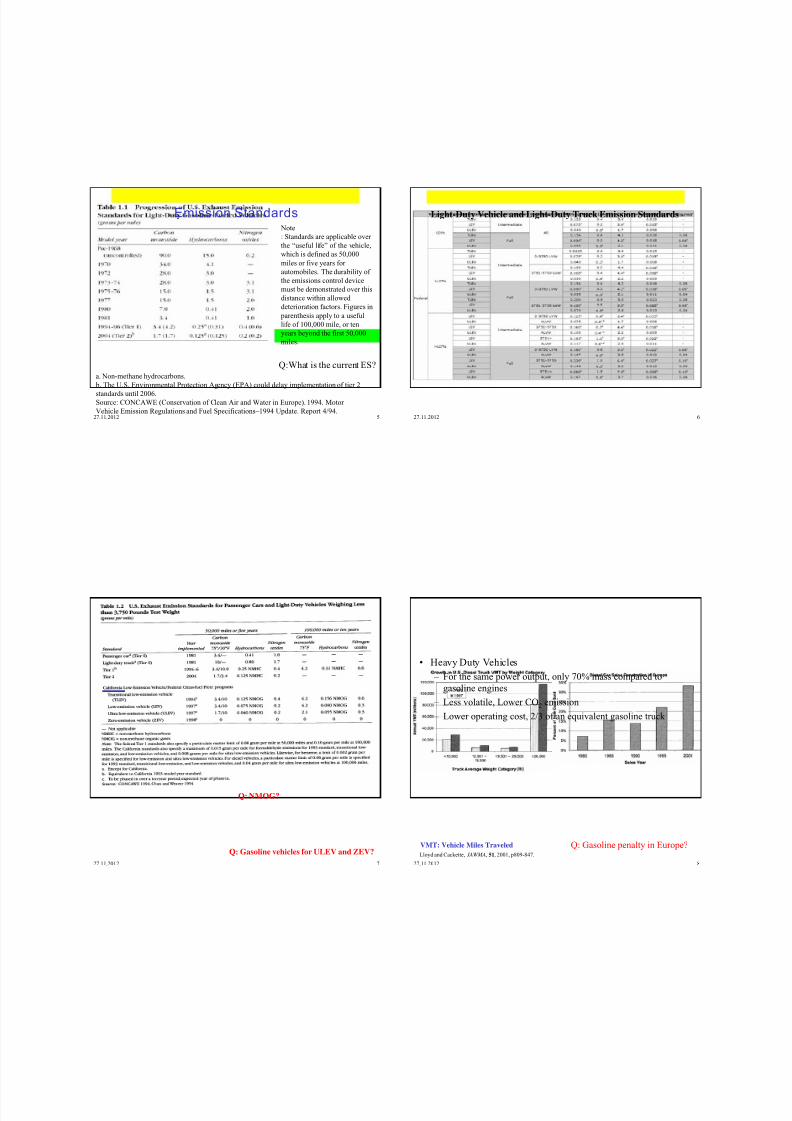
8/14/2019 ENV415 Air Pollution Control Engineering
http://slidepdf.com/reader/full/env415-air-pollution-control-engineering 81/98
27.11.2012 5
Emission Standards Note
: Standards are applicable over
the “useful life” of the vehicle,
which is defined as 50,000
miles or five years for
automobiles. The durability of
the emissions control device
must be demonstrated over this
distance within allowed
deterioration factors. Figures in
parenthesis apply to a useful
life of 100,000 mile, or ten
years beyond the first 50,000
miles.
a. Non-methane hydrocarbons. b. The U.S. Environmental Protection Agency (EPA) could delay implementation of tier 2
standards until 2006.
Source: CONCAWE (Conservation of Clean Air and Water in Europe). 1994. Motor
Vehicle Emission Regulations and Fuel Specifications–1994 Update. Report 4/94.
Q:What is the current ES?
27.11.2012 6
Light-Duty Vehicle and Light-Duty Truck Emission Standards
27.11.2012 7
Q: Gasoline vehicles for ULEV and ZEV?
Q: NMOG?
27.11.2012 8
• Heavy Duty Vehicles
– For the same power output, only 70% mass compared to
gasoline engines
– Less volatile, Lower CO2 emission
– Lower operating cost, 2/3 of an equivalent gasoline truck
Lloyd and Cackette, JAWMA, 51, 2001, p809-847.
Q: Gasoline penalty in Europe?VMT: Vehicle Miles Traveled
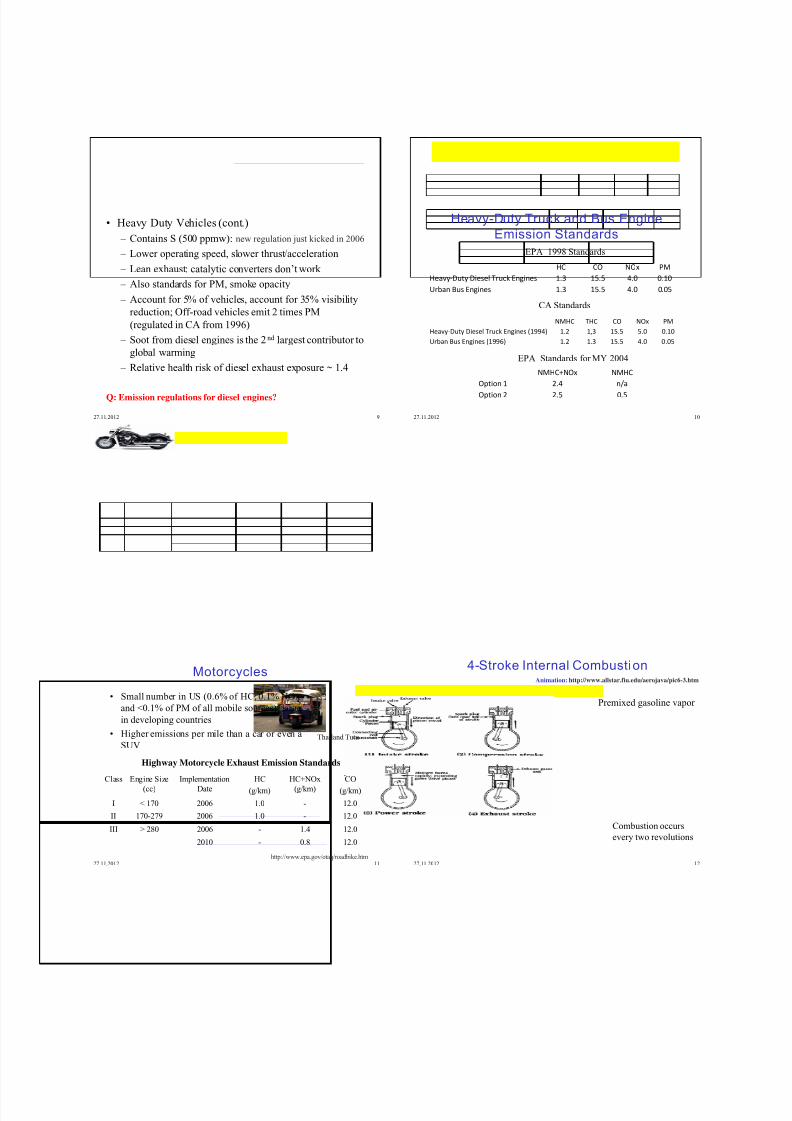
8/14/2019 ENV415 Air Pollution Control Engineering
http://slidepdf.com/reader/full/env415-air-pollution-control-engineering 82/98
27.11.2012 9
• Heavy Duty Vehicles (cont.)
– Contains S (500 ppmw): new regulation just kicked in 2006
– Lower operating speed, slower thrust/acceleration
– Lean exhaust: catalytic converters don’t work
– Also standards for PM, smoke opacity
– Account for 5% of vehicles, account for 35% visibility
reduction; Off-road vehicles emit 2 times PM
(regulated in CA from 1996)
– Soot from diesel engines is the 2nd largest contributor to
global warming
– Relative health risk of diesel exhaust exposure ~ 1.4
Q: Emission regulations for diesel engines?
Heavy-Duty Truck and Bus Engine
Emission Standards
27.11.2012 10
HC CO NOx PM
Heavy‐Duty Diesel Truck Engines 1.3 15.5 4.0 0.10
Urban Bus Engines 1.3 15.5 4.0 0.05
EPA 1998 Standards
NMHC THC CO NOx PM
Heavy‐Duty Diesel Truck Engines (1994) 1.2 1,3 15.5 5.0 0.10
Urban Bus Engines (1996) 1.2 1.3 15.5 4.0 0.05
CA Standards
EPA Standards for MY 2004
NMHC+NOx NMHC
Option 1 2.4 n/a
Option 2 2.5 0.5
27.11.2012 11
Motorcycles
• Small number in US (0.6% of HC, 0.1% NOx
and <0.1% of PM of all mobile sources); large
in developing countries
• Higher emissions per mile than a car or even a
SUV
Class Engine Size
(cc)
Implementation
Date
HC
(g/km)
HC+NOx
(g/km)
CO
(g/km)
I < 170 2006 1.0 - 12.0
II 170-279 2006 1.0 - 12.0
III > 280 2006 - 1.4 12.0
2010 - 0.8 12.0
Highway Motorcycle Exhaust Emission Standards
http://www.epa.gov/otaq/roadbike.htm
Thailand Tutu
27.11.2012 12
4-Stroke Internal Combustion
Premixed gasoline vapor
Combustion occurs
every two revolutions
Animation: http://www.allstar.fiu.edu/aerojava/pic6-3.htm

8/14/2019 ENV415 Air Pollution Control Engineering
http://slidepdf.com/reader/full/env415-air-pollution-control-engineering 83/98
27.11.2012 13
Octane Rating• A measure of gasoline’s resistance to engine knock (rattling or
pinging sound in cylinders due to premature burning)
– Heptane: 0
– Iso-octane: 100
– Anti-knock agents: Tetraethyl lead (Pb(C2H5)4), highly branched
alkanes, aromatics
• (R+M)/2
– Research Octane Number (RON): test engine running at 600 rpm – Motor Octane Number (MON): test engine at 900 rpm
C C C C C C C
C C C C C
C C
C
Q: What if a lower grade than required is used?
Q: Does my car perform better if I use a higher grade than required?
http://en.wikipedia.org/wiki/
Image:09-03-06-Octane.jpg
27.11.2012 14
Compression stroke Power stroke
Q: Why two strokes are not good?
2-Stroke Engine
http://media-2.web.britannica.com/eb-media/10/310-004-58E43DBF.gif
27.11.2012 15
Diffusion flame
700 – 900 oC
from compression
Liquid diesel injection
Ignition
delay
27.11.2012 16
Emission Control
• Engine design, vehicleshape
• Fuel composition – Octane rating, oxygenated
fuel
– Fuel desulfurization
• Alternative fuel – natural gas, liquefied
petroleum gas, methanol,ethanol , bio-diesel,hydrogen
• Transportation control – Regulatory steps, public
transportation, economicincentive
• Regulation: Inspection
• Add-on control
• Alternative powergeneration – Solar, Electrical, Fuel Cell,
Hybrid

8/14/2019 ENV415 Air Pollution Control Engineering
http://slidepdf.com/reader/full/env415-air-pollution-control-engineering 84/98
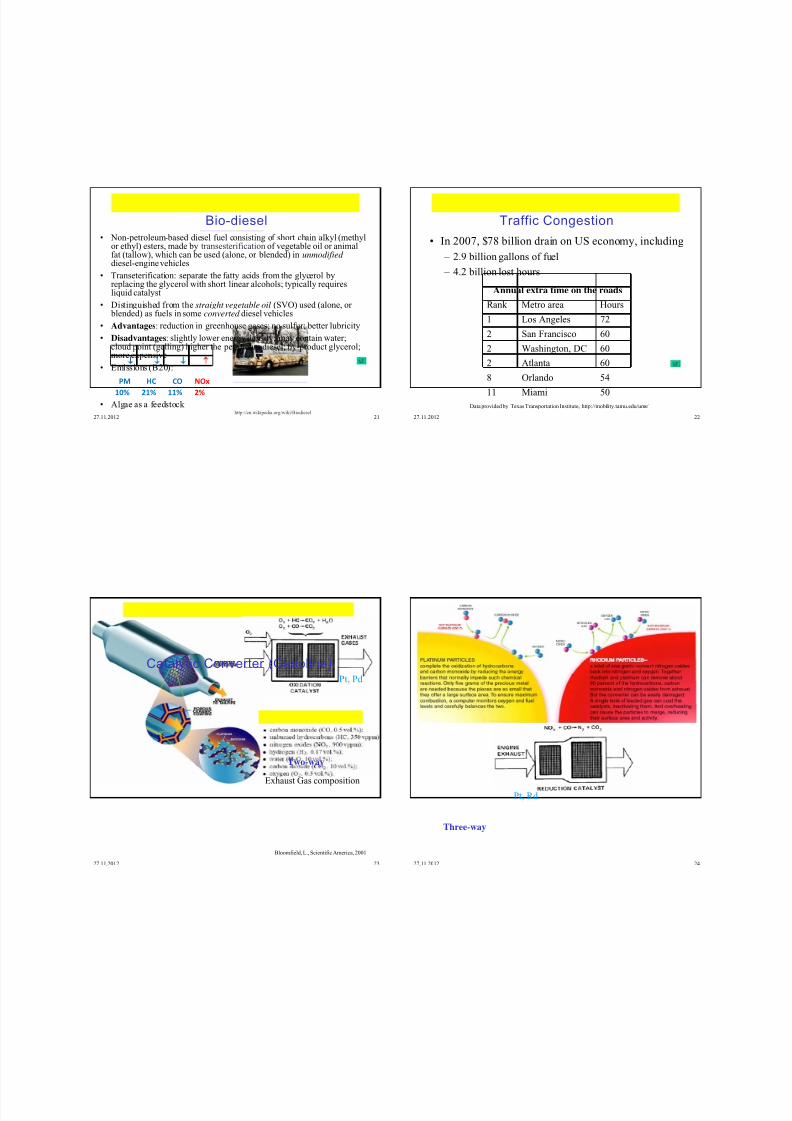
8/14/2019 ENV415 Air Pollution Control Engineering
http://slidepdf.com/reader/full/env415-air-pollution-control-engineering 85/98
27.11.2012 21
Bio-diesel• Non-petroleum-based diesel fuel consisting of short chain alkyl (methyl
or ethyl) esters, made by transesterificationof vegetable oil or animalfat (tallow), which can be used (alone, or blended) in unmodified diesel-engine vehicles
• Transeterification: separate the fatty acids from the glycerol byreplacing the glycerol with short linear alcohols; typically requiresliquid catalyst
• Distinguished from the straight vegetable oil (SVO) used (alone, or blended) as fuels in some converted diesel vehicles
• Advantages: reduction in greenhouse gases; no sulfur; better lubricity
• Disadvantages: slightly lower energy density; may contain water;cloud point (gelling) higher the petroleum diesel; by-product glycerol;more expensive
• Emissions (B20):
• Algae as a feedstock http://en.wikipedia.org/wiki/Biodiesel
PM HC CO NOx
10% 21% 11% 2%
27.11.2012 22
Traffic Congestion
• In 2007, $78 billion drain on US economy, including
– 2.9 billion gallons of fuel
– 4.2 billion lost hours
Annual extra time on the roads
Rank Metro area Hours
1 Los Angeles 72
2 San Francisco 60
2 Washington, DC 60
2 Atlanta 60
8 Orlando 5411 Miami 50
Data provided by Texas Transportation Institute, http://mobility.tamu.edu/ums/
27.11.2012 23
Catalytic Converter (Gasoline)Pt, Pd
Two-way
Bloomfield, L., Scientific America, 2001
Exhaust Gas composition
27.11.2012 24
Pt, Rd
Three-way

8/14/2019 ENV415 Air Pollution Control Engineering
http://slidepdf.com/reader/full/env415-air-pollution-control-engineering 86/98

8/14/2019 ENV415 Air Pollution Control Engineering
http://slidepdf.com/reader/full/env415-air-pollution-control-engineering 87/98
27.11.2012 29
Hydrocarbon Vapor Emissions from Gasoline Distribution
AsifFaiz et al., 1996,
Air Pollution from Motor Vehicles27.11.2012 30
Older model
O2 for lean
environment
Newer Model
(1980’s in US)
Q: Cold-start emission more
serious? How to control it?
Lean NO catalyst:
Zeolite catalyst to reduce NO
Combined with lean-burn engine
O H N CO NO HC Zeolite
222
27.11.2012 31
Catalytic Oxidizer
27.11.2012 32
Thre-way Catalytic Converter

8/14/2019 ENV415 Air Pollution Control Engineering
http://slidepdf.com/reader/full/env415-air-pollution-control-engineering 88/98
27.11.2012 33
Automotive catalyst structural design
27.11.2012 34
Washcoats on automotive catalyst
27.11.2012 35
Catalytic Oxidizer
27.11.2012 36
Catalyst Materials
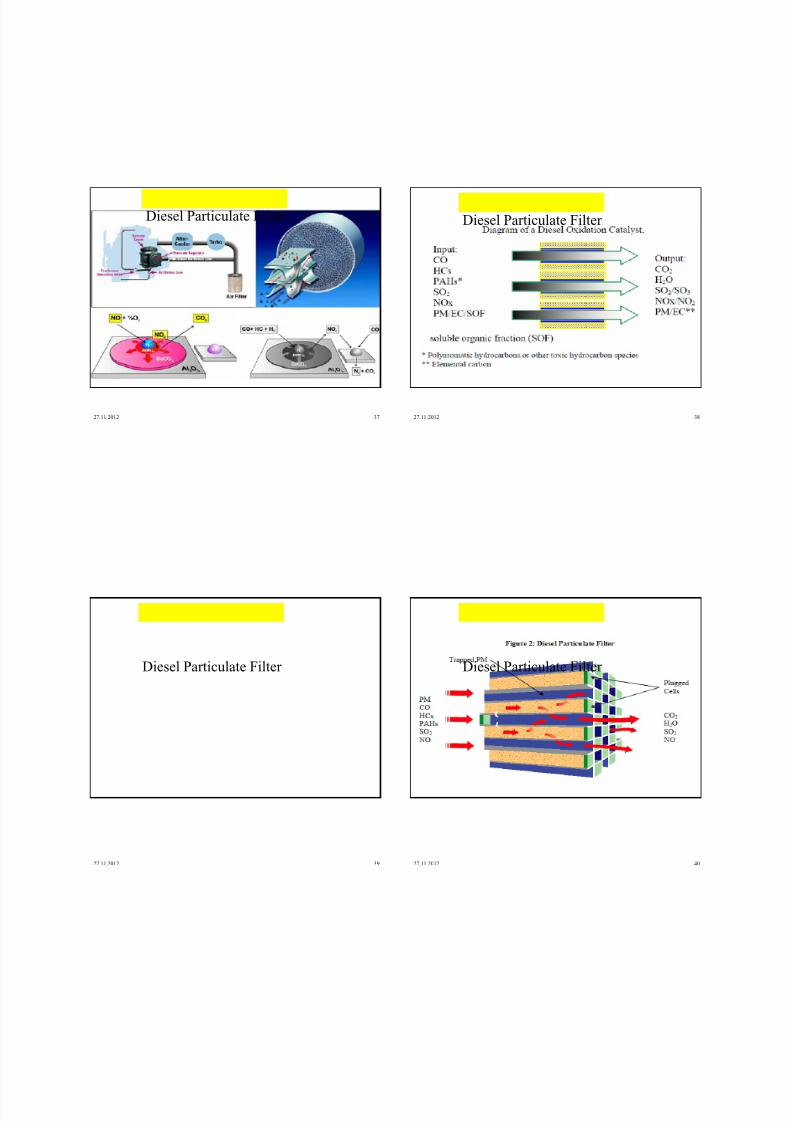
8/14/2019 ENV415 Air Pollution Control Engineering
http://slidepdf.com/reader/full/env415-air-pollution-control-engineering 89/98
27.11.2012 37
Diesel Particulate Filter
27.11.2012 38
Diesel Particulate Filter
27.11.2012 39
Diesel Particulate Filter
27.11.2012 40
Diesel Particulate Filter

8/14/2019 ENV415 Air Pollution Control Engineering
http://slidepdf.com/reader/full/env415-air-pollution-control-engineering 90/98
27.11.2012 41
Clean School Diesel Bus Technology Options
Clean Fuel /
Clean Tech
Type of Engine % Reduction in
PM Emissions
% Reduction in
NOx Emissions
Approximate Cost of Technology
Ultra-Low
Sulfur Diesel
(ULSD)
New or Used About 5 to 9%
Enables the PM
filter to work
N/A 8 to 25 cents per gallon more than
regular diesel now
In June 2006, when ULSD will be
required nationwide, cost differential
will be much less
Particulate
Matter Filter
New or Used -
1995 or newer
models
60 to 90% N/A $5,000 to $10,000Must use ULSD fuel
Oxidation
Catalyst
New or Used 20 to 30% N/A $1,000 to $2,000 and can be used
with regular diesel
Biodiesel
Fuel
New or Used B 20 - 1 0%
B100 -40%
Biodiesel increases
NOx emissions of.
B20 blend +2%
B100 fuel +10%
B20 - 15 to 30 cents per gallon more than
regular diesel
B100 - 75 cents to $1.50 per gallon more than
regular diesel (B100 may not be an option for
cold climates)
EmulsifiedDiesel Fuel
New or Used About 50% About 10% 20 cents per ga llon more thanregular diesel fuel
http://www.epa.gov/cleanschoolbus/technology.htm
27.11.2012 42
Electric Car
• First electric car in 1835 by Professor
Sibrandus Stratingh of Groningen,
Netherlands
• First battery powered electric car in
1881 by Camille Faure in France
• Lost market to ICE circa 1910
• Government backed promotion (tax
credit) revived electric carThomas Edison and an electric car in1913 (National Museum of American
History)
Q: Is it really zero emission? Q: Why isn’t it commonly used?
Plug-In: uses a wall socket at night to charge and relies on an electric
motor to go many miles before sipping any gasoline – good for short-distance driving in cities
Q: Where do you find a wall socket when not at home?
http://www.pbs.org/now/shows/223/
Who killed the electric car (EV1)?Who killed the electric car (EV1)?
27.11.2012 43
Hybrid Electric Vehicle
• Use 2 sources of motive energy:
combustion of gasoline (Internal
Combustion Engine) & electrical
energy (Electric Motor energized by
a Battery)
– ICE for highway driving
– EM provides added power duringhill climbs, acceleration, and other
periods of high demand
• Regenerative Braking: converts
some of the kinetic energy into
electric energy; electric motor
becomes a generator for battery
• Also available for heavy-duty
hybrid vehicles (diesel-electric) http://www.nrel.gov/vehiclesandfuels/ahhps/
Automobile.Honda.com
27.11.2012 44
Advantages of Hybrid Electrics
• high performance
• long-range capacities
• high fuel efficiency
Fuel economy
Lower emissions
2007 Ford Focus 2007 Toyota Prius 2007 Honda Hybrid
MPG(city) 27 MPG(city) 51 MPG(city) 49
MPG(highway) 37 MPG(highway) 60 MPG(highway) 51
Cost: federal and state purchase incentives
Driving privileges
Q: Is hybrid popular?

8/14/2019 ENV415 Air Pollution Control Engineering
http://slidepdf.com/reader/full/env415-air-pollution-control-engineering 91/98
27.11.2012 45
Fuel Cell Operation
http://en.wikipedia.org/wiki/Fuel_cell
http://www1.eere.energy.gov/hydrogenandfuelcells/
27.11.2012 46
• University of Florida Fuel Cell Research Lab
H2 source:
• H2 (gas, liquid, solidhydride) – Converted from other
energy sources (coal,solar, wind)
• Methanol (CH3OH)
• Gasoline
Limitation of H2 fuel
• Pipelines needed to convey hydrogen fuel not currently in place
• Retail fueling facilities must be placed throughout Q: Where?• Danger of H2 explosion (although gasoline explosion is also dangerous)
• Requires construction of hydrogen production facilities
27.11.2012 47
Hydrogen Fueling Station
President Bush touring a hydrogen
fueling station in DC in May 2005
Washington, DC (1st in US)
Los Angeles Int. airport, CA
Richmond, CA
Ann Arbor, MI (EPA)
Taylor, MI
50 stations in 15 states by end
of 2007
H2 fuel station in Iceland http://www.cnn.com/2007/TECH/science
/09/18/driving.iceland/index.html
27.11.2012 48
Methanol as an Alternative to Hydrogen
• Some production facilities already exist
• Distribution facilities can accommodate with slight modifications
• Dispensing facilities can accommodate with only slight
modifications
• Currently there is an abundance of methanol
Steam Reforming Equilibrium Reaction at 1atm and 300oC:
CH3OH + 1.5H2O 2.896H2 + 0.896CO2 + 0.104CO + 0.603H2O
Catalyzed by Phosphoric Acid Membrane (PAM)
Q: Are fuel cells used in stationary sources?

8/14/2019 ENV415 Air Pollution Control Engineering
http://slidepdf.com/reader/full/env415-air-pollution-control-engineering 92/98
27.11.2012 49
Evaporative Loss – Refrigerant• CFC (Chlorofluorocarbons) – Ozone depleting chemical
phased out starting from 1987 Montreal Protocol
• Replacement: HCFCs (Hydrochlorofluorocarbons)
HFCs (Hydrofluorocarbons)
Q: Impact of stockpile and CFC in discarded units?
• Further ban on global warming gases
– EU: HFC-134a banned in new cars in 2011; any otherfluorinated gas with a GWP > 150 in all vehicles in 2017
– US: ???
• Replacement: nontoxic and nonflammable
– CO2 (requires new systems); DP-1 (GWP-40); Fluid H(GWP-10)
Compound CO2 CFC-12 HCFC HFC-134a
GWP 1 8500 1300-7000 1300
http://pubs.acs.org/isubscribe/journals/cen/83/i1
8/html/8318gov2.html?emFrom=emLoginhttp://www.epa.gov/ozone/ods.html
27.11.2012 50
Gasoline and Diesel Contnets

8/14/2019 ENV415 Air Pollution Control Engineering
http://slidepdf.com/reader/full/env415-air-pollution-control-engineering 93/98
Indoor Air Pollution ControlA gram of pollution released indoors
produces about 1000 times more
exposure than one released outdoors
Rule of one thousand
Indoor Air Pollutants Indoor Air Pollutants

8/14/2019 ENV415 Air Pollution Control Engineering
http://slidepdf.com/reader/full/env415-air-pollution-control-engineering 94/98
Indoor Air Pollutants
Smoke from solid fuels is a risk factor for
•Acute respiratory infections (ARI),
•Chronic obstructive pulmonary disease (COPD)
•Lung cancer (from coal smoke)
Risks from solid fuels
Environmental tobacco smoke (ETS) Environmental tobacco smoke (ETS)

8/14/2019 ENV415 Air Pollution Control Engineering
http://slidepdf.com/reader/full/env415-air-pollution-control-engineering 95/98
American National Human Activity Pattern Survey (NHAPS)
and ARB surveys of children & adults
>11000 interviews over 2‐year period
• INDOORS 89%
• OUTDOORS 6%
• IN VEHICLES 5%
Where do we spend our time?
CO2,
CO,
SO2,
NO2,
Ozone (O3),
Hydrogen chloride (HCl),
Nitrous acid (NHO2),
Nitric acid vapour (HNO3)
Radon.
Inorganic gases contaminated indoor air
Organic gases contaminated indoor air Control of Indoor Air Quality
• Control of pollution sources
• Indoor air
purification
Indoor air quality (IAQ) can be achieved by two way
• Control of pollution sources is a most economical and effective approach
in improving IAQ to eliminate or reduce indoor pollution sources
• Indoor air purification is an important method of removing indoor pollutants and
improving IAQ under the circumstances that the ventilation and the control of
pollution sources are impossible.

8/14/2019 ENV415 Air Pollution Control Engineering
http://slidepdf.com/reader/full/env415-air-pollution-control-engineering 96/98
Control of pollution sources
• Filtrating the outdoor air to prevent outdoor pollutants from entering the
room.
• Isolating the sites that may form pollution sources (e.g., copycat rooms, printer
rooms, kitchen and toilet) in order to avoid intercrossing infection, and using
the enforced ventilation when necessary.
• Making full use of pollution‐free or low‐pollution building materials and
decorating materials. Preventing building products with high pollution from
entering market by government legislating and setting up industry standard.
For the products in markets, government can label them with different grade.
The building materials and decorating
• materials with high pollution can be eliminated by market mechanism.
• Dust and liquid drops are the important medium for bacteria to spread. It is
necessary to
termly clean
the
components
that are
easy
to
be
infected
in
air
‐
conditioning systems (e.g., filter, heat exchanger and muffler) and to replace
them in time in order to avoid the aggradations of pollutants.
Indoor Air Purification
• Filtration
• Adsorption
• Photo‐catalytic Oxidation (PCO)
• Negative Air Ions (NAIs)
• Non
‐
thermal
plasma
(NTP)
The major methods of indoor air purification include
Filtration is a quite economical and efficient
method of improving IAQ.
Filters are important components in all AC
systems.
Filtration
Ozone removal: the chemical reactions between ozone and the particles
deposited on the filters ‐ lead to oxidation products such as formaldehyde,
carbonyls, formic acid, and ultra‐fine particles
DA: Air filtration systems could become a source of contamination from
micro‐organisms harmful to human health.
Solution: to prevent the accumulation and dispersion of microorganisms by
adding anti‐microbial agents on the surfaces of filter.
Adsorption
The adsorbents able to be used to purify indoor air mainly include activated carbon,
zeolite, activated alumina, silica gel, and molecular sieves.
Adsorption on activated carbon is an extensive method of purifying indoor air due to
its large specific area and high adsorption capacity.
At
low concentration
level,
the
advantages
of
activated
carbon with
abundant
micro‐
pores are more prominent.
Activated carbon fibers (ACF) exhibit a higher adsorption capacity and have faster
adsorption kinetics than granular activated carbon (GAC), 2 to 20 times faster than
on GAC.
ACF are easier to use than GAC since they can be formed in various forms such as
cloth and felt . Therefore, ACF are more suitable as an adsorbent for removing indoor
gaseous pollutants.
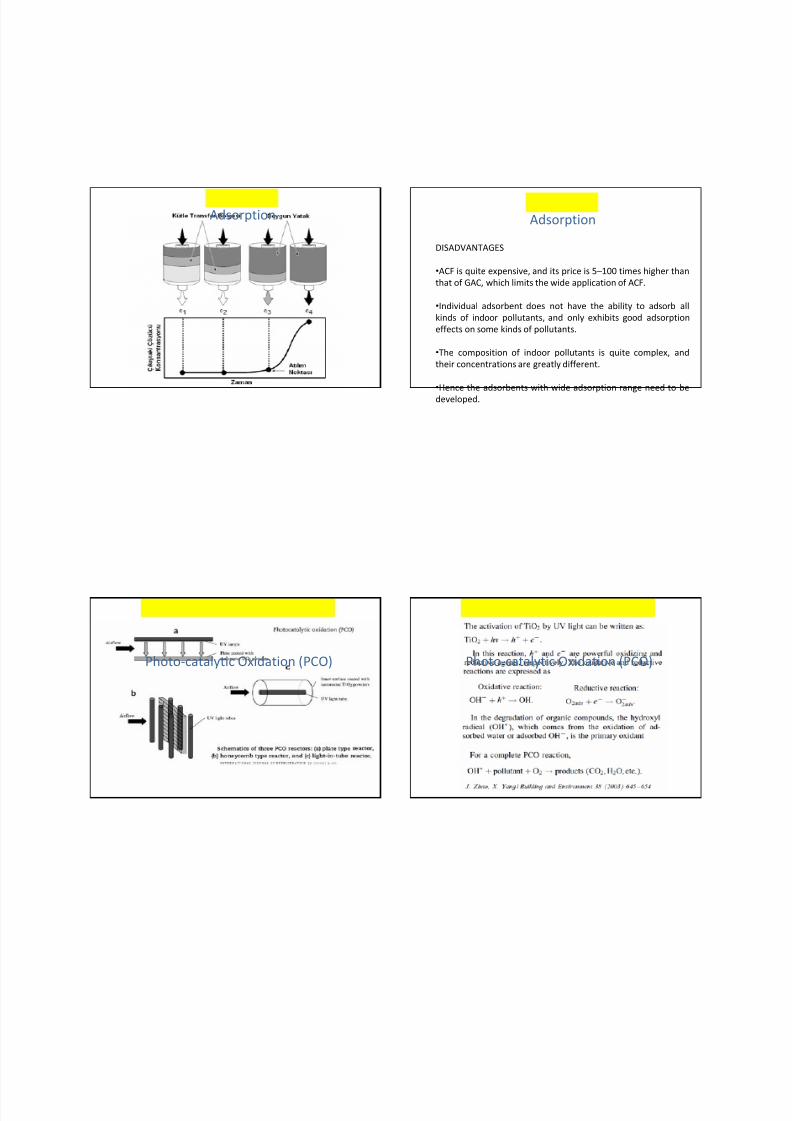
8/14/2019 ENV415 Air Pollution Control Engineering
http://slidepdf.com/reader/full/env415-air-pollution-control-engineering 97/98
Adsorption
DISADVANTAGES
•ACF is quite expensive, and its price is 5–100 times higher than
that of GAC, which limits the wide application of ACF.
•Individual adsorbent does not have the ability to adsorb all
kinds of indoor pollutants, and only exhibits good adsorption
effects on some kinds of pollutants.
•The composition of indoor pollutants is quite complex, and
their concentrations are greatly different.
•Hence the adsorbents with wide adsorption range need to be
developed.
Adsorption
Photo‐catalytic Oxidation (PCO) Photo‐catalytic Oxidation (PCO)

8/14/2019 ENV415 Air Pollution Control Engineering
http://slidepdf.com/reader/full/env415-air-pollution-control-engineering 98/98
Non‐thermal plasma (NTP) can be generated in different modes, such as direct current
corona discharge, pulse corona discharge, dielectric barrier discharge and glow
discharge.
The pulse corona discharge is usually used to generate NTP because it can reduce the
formation of O3
in the discharge process.
Atmospheric plasma discharges generate high energy electrons, while the background
gas remains close to room temperature .
The energetic electrons excite, dissociate and ionize gas molecules, which produce
chemically active species such as atomic oxygen, hydroxyl radicals and ozone.
These active species are capable to remove various indoor pollutants such as VOCs,
aerosol particles and microbe.
DA : NTP
leads
to
the
formation
of
byproducts
(e.g., CO,
O3,
NOX and
aerosol
particles)
in the process of indoor air purification.
Non‐thermal Plasma (NTP) Non‐thermal Plasma (NTP)
Non‐thermal Plasma (NTP)
The following is a summary of their (Non‐thermal plasma ) disadvantages:
• Exhibiting good purification effects on some kinds of
pollutants, but poor purification effects on other
pollutants
Non‐thermal Plasma (NTP)