entrepreneurial development - pennsylvania...
TRANSCRIPT

A Look Back at Pennsylvania’s Performance, A Look Forward to Pennsylvania’s Economic Recovery
EntrepreneurialDevelopment
in Pennsylvania
Lead AuthorAnnette Mattei
EditorJack Higgins
Research AssociateMateo Rando
3814 Walnut StreetPhiladelphia, PA 19104www.fels.upenn.edu

About the Fels Institute of Government
The Fels Institute of Government is the University of Pennsylvania’s graduate program in public policy and public management. Fels was founded in 1937 by entrepreneur and philanthropist Samuel Simeon Fels of the Fels Naptha Soap Company in response to a wave of corruption and mismanagement in Pennsylvania government. Originally established for the purpose of training local government officials, over time Fels broadened its mission; it now prepares its students for public leadership positions in city, state, and Federal agencies, elective politics, nonprofit organizations, and private firms with close connections to the public sector. Its 1,800 living alumni work in leadership roles across the US and around the world.
Combining the strengths of Penn faculty, staff, and students with a network of affiliated senior consultants, Fels Research & Consulting Group brings academic depth and practical know-how to the tough strategic and management challenges facing governments and nonprofit organizations today. Although we have expertise in a broad span of issues, we specialize in three policy areas: urban revitalization and regional competitiveness, K-12 education, and sustainability issues. Within these policy areas and others, we apply a variety of approaches to help our clients and partners get better results, move ideas into action and pay for results that matter.
About Entrepreneurial Development in Pennsylvania
In this report we take a preliminary look at Pennsylvania’s economic performance over the past few decades, with a keen eye on entrepreneurship—the linchpin of today’s “new economy.” Our research starts in year 1980, when the first entrepreneurial development initiatives were created in Pennsylvania, and tracks Pennsylvania’s performance over time as new programs were added. To assess the state’s performance—overall and in terms of entrepreneurship—we compare Pennsylvania to other competitor states and the US on average. What we found was very revealing and could be an important strategy for reviving the state’s economy and addressing the very real needs of Pennsylvania’s unemployed—jump-starting the state’s business start-up rate. It is our hope that these research findings become infused in the current gubernatorial campaign and that the banner of entrepreneurial development is taken up by the incoming governor in 2011.
For more information, or to find out more about Fels, visit http://www.fels.upenn.edu.

Table of Contents
Introduction ........................................................................................ 3
Pennsylvania on the Brink .................................................................... 3
1980–2009: Three Distinct Periods of Growth ....................................... 7
Taking Stock: What can we learn from the past few decades? ................... 9
Welcome to the “New Economy” ......................................................... 10
Pennsylvania in the New Economy: Entrepreneurship Metrics ................ 11
A New Set of Choices for Pennsylvanians ............................................. 20
Entrepreneurship + Innovation = Pennsylvania’s Economic Recovery....... 23
Acknowledgments .............................................................................. 24
Appendix: State Comparison of Entrepreneurship Metrics ...................... 25

2 | Fels Institute of Government

Entrepreneurial Development in Pennsylvania | 3
Introduction
Double-digit unemployment. Job losses in the hundreds of thousands. Dislocated workers whose jobs were phased out or permanently moved abroad. Weak growth in wages and declining household wealth.
This might sound like a menu of economic woes describing today’s economy, but it is actually Pennsylvania in the early 1980s, an all-time low point in Pennsylvania’s recent economic history. What led Pennsylvania to this point?
For much of the 20th century, Pennsylvania, thanks to a wealth of raw materials, a dense network of highways, and a strategic location close to markets, had been an industrial, manufacturing and distribution powerhouse.
But in 1965, for the first time, Pennsylvania’s share of national manufacturing employment started to decline as production shifted away from coal and steel and the state lost jobs to low-cost locations. Looking back, this clearly was the start of globalization as we know it today and, arguably, Pennsylvania was one of the first states to feel its effects.
Over the next two decades, Pennsylvania hemorrhaged more than 400,000 manufacturing jobs.
Pennsylvania on the Brink
In March 1983, on the heels of a double-dip national recession, Pennsylvania unemployment rose to 12.9 percent, which remains the state’s historically highest rate. With the bottom falling out, a Democratically-controlled Pennsylvania legislature went to battle with fiscally conservative Republican Governor Dick Thornburgh over what to do about this dire state of affairs.
Historically, large corporations and a heavily unionized workforce had dominated in Pennsylvania, reflecting its industrial might. Not surprisingly, its de facto approach to economic development was along the same lines—backroom deal making and “smoke-stack chasing.”
But by the 1980s, there was growing criticism of this approach to economic development. Many a state had already been burned by costly deals struck with companies and unions to bring large plants and, ostensibly, jobs to their state, and Pennsylvania was among them. (See Figure 1.) At the same time, the economic development world was abuzz with new research being circulated on the importance of business formation and its connection to homegrown job creation.

4 | Fels Institute of Government
Figure 1: A Tale of Two Economic Development Strategies
Smoke-stack Chasing: The “crown jewel” of Governor Shapp’s administration was the opening of a Volkswagen Rabbit plant in 1978, a deal that cost taxpayers $40 million in low-interest loans, $25 million in highway and rail construction, $3 million in training subsidies, and five years in local tax abatements. (This amounts to a $180 million investment in 2010 dollars.) In the end, the plant produced only half the jobs promised by the company and barely 10 percent of spin-off jobs, and by 1987, it was closed down.
Homegrown Job Creation: In his 1979 paper, The Job Generation Process, MIT economist David Birch did an extensive region-by-region analysis of the employment base and concluded that the difference between growing and stagnating regions was not their ability to stave off job loss or lure jobs from another location, but in fact was their ability to create new jobs. More important was his finding of who was creating new jobs—small companies of 20 or fewer workers, which created more than 50 percent of all new jobs, and young companies of four years or younger, which created 80 percent of all new jobs.
In 1978, the Shapp administration offered Volkswagen millions in tax breaks to open its North American plant in New Stanton, Pa. By 1987, it had closed down. (PHOTO: Bill Hartford, Popular Mechanics, November 1978).

Entrepreneurial Development in Pennsylvania | 5
The first state program to truly embody the idea of spurring on business formation as an economic development strategy was the Small Business Development Center (SBDC) program. Pennsylvania was among a handful of states to pilot the program beginning in 1978, and in 1980 it was officially enacted by federal legislation and funding was provided to support seven university-based centers across the state.
Building on this, Governor Thornburgh proposed a decidedly new approach to economic recovery, which he detailed in the report Choices for Pennsylvanians. The choice he put forth for Pennsylvania was the idea of forming public-private partnerships to support existing and newly forming businesses for the expressed purpose of homegrown job creation. Hence, in 1982, the Ben Franklin Partnership (known today as Ben Franklin Technology Partners) was established, the state’s first technology-based economic development program. Coupled with the previously existing Local Development Districts and the SBDCs, the state in essence had put at its disposal a “suite” of entrepreneurial development programs. (See Figure 2.) That is, through these programs the state was now providing direct business development services to individuals and companies that had the potential to grow into larger employers and generate significant economic activity for the state.
According to David Osborne, who dedicated a whole chapter of his highly-regarded book Laboratories of Democracy to Pennsylvania during this time: “The combination of the Democrats’ severe pressure to act and Thornburgh’s fiscal restraint and market orientation eventually produced perhaps the best economic development system in the country [of its time].”
1965 19821980
Pennsylvania’s “suite” of entrepreneurial development programs provides direct business development services to individuals and companies
with growth potential.

6 | Fels Institute of Government
Figure 2: Pennsylvania’s “Suite” of Entrepreneurial Development Programs
These state-funded programs provide direct business development services to individuals and companies with growth potential, in terms of the jobs they create and/or their economic impact (i.e., the “new money” they draw into the state economy, for example through exports). Companies served by these programs could be: in the conception or start-up stage; small or medium-sized; or, a young or established business. For the final 2010-2011 budget, a total of $32.8 million has been earmarked for these six programs, comprising 8.6 percent of the Department of Community and Economic Development’s (DCED) total budget of $382 million. (This includes funding from the Ben Franklin Technology Development Authority Fund and the DCED portion of the Tobacco Settlement Fund.)
Local Development Districts (established 1965): LDDs provide technical and financial assistance to small and medium-sized businesses. Seven LDDs serve 52 counties. Funding for 2010-11: $2,937,000 (0.8 percent of DCED budget).
Small Business Development Centers (established 1980): SBDCs provide consulting services and educational programs to entrepreneurs looking to start or grow their small business. There are 18 university-based centers and more than 100 outreach locations throughout the state that serve all 67 counties. Funding for 2010-11: $4,000,000 (1 percent of DCED budget).
Ben Franklin Technology Partners (established 1982): This is the state’s first technology-based economic development program and one of the country’s longest-running. Today it provides assistance and resources (including funding) to companies using technology to drive their business. Ben Franklin Technology Partners serves early-stage and established companies in every industry sector. Funding for 2010-11: $16,000,000 (4.2 percent of DCED budget).
Industrial Resource Centers (established 1988): IRCs provide technical assistance (e.g., marketing analysis, product development) to small and medium sized manufacturers. There are seven centers throughout the state. Funding for 2010-2011: $6,885,000 (1.8 percent of DCED budget).
Life Sciences Greenhouses (established 2001): The Greenhouses provide earliest-round funding to emerging life sciences companies and accelerate technology transfer by facilitating research/commercialization collaboration. There are three Greenhouses in the state, all funded by Tobacco Settlement. Funding for 2010-2011: $3,000,000 (0.8 percent of DCED budget).
Keystone Innovation Zones (established 2004): KIZs provide grant funds to community/university partnerships to generate job growth through tech transfer and entrepreneurship. KIZ companies are eligible to receive tax benefits and technical assistance. As of 2009, there were 29 KIZs. Funding is included under the Ben Franklin Technology Development Authority’s line item for 2010-2011.

Entrepreneurial Development in Pennsylvania | 7
1980–2009: Three Distinct Periods of Growth
The double-dip recession of the early 1980s marked a turning point for Pennsylvania’s economy (along with the rest of the US). Once the recessions were over, the state’s employment base rebounded and, for the most part, grew in size for the next three decades. This span of time consists of three distinct periods, each bounded by national recessions. (See Figure 3.)
(Refer to Figure 3.)
1. Wrenching Changes (1980-1990): After the recessions of the early 1980s, employment surged in Pennsylvania. Between 1983 and 1989, Pennsylvania added 670,000 jobs to the state economy, a growth rate of 13.8 percent that was stronger than the 11 percent growth seen at the national level during this time. For sure, national demographic trends were behind this growth, such as the Baby Boomers (b. 1946-1964) entering their adult years and driving consumer spending. But there also was a boom in small business formation and self-employment during this time, and it is likely Pennsylvania’s suite of entrepreneurial development programs played a part in this.
2003-2008: +303,0000
(5.0% vs. 5.0% for US)
Figure 3: Total Employment in Pennsylvania (1976-2009)
8 | Fels Institute of Government
Despite these significant job gains, wrenching changes still wreaked havoc on Pennsylvania’s economy. The manufacturing sector continued its downward spiral with the additional loss of 22 percent of jobs between 1979 and 1985. The era of the “one company town” was largely a thing of the past; by 1986, there were half the number of jobs with Pennsylvania’s largest 40 companies compared to only seven years prior. On top of this, the federal government began closing down defense bases throughout the country, including four bases in southeastern Pennsylvania alone. With the continued erosion of its jobs base, Governor Bob Casey’s administration created the Industrial Resource Centers in 1988, which targeted their business development services to small and mid-sized manufacturers in the state. A fourth program had been added to the suite.
2. Tech Boom (1990-2000): After a recession in the early 1990s, the US economy took off in the middle of the decade, largely driven by the fact that technology—semiconductors, software, telecommunications, and the like—at that point had become fairly cheap. According to the Information Technology and Innovation Foundation (ITIF), business practices and, indeed, entire business models were transformed as technology became ubiquitous and pervasive across all sectors of the economy. This era marked the “rise of the tech sector” and growing recognition of entrepreneurs, whose job was to deploy technological innovations. What followed was a period of hyperkinetic activity: unforeseen venture capital investing, record-breaking IPOs, and the build-up and eventual burst of the “dot com” bubble. Reflecting their private sector counterparts, universities were being touted as the “knowledge industry” and government was “reinventing” itself. Pennsylvania participated in this tech boom, though not at a level seen in other parts of the country. Close to 437,000 jobs were added to the state economy during this expansion period of 1991 to 2001, for growth of eight percent compared to US employment growth of 13.8 percent. In fact, in March 2000 Pennsylvania’s unemployment rate hit an all-time low of four percent, the same month the tech bubble reached its climax. But by the end of 2000, the bubble had started to deflate; by March 2001, the country was officially in recession.
3. Modest Growth, Severe Crash (2000-2010): After the start of the new millennium and a period of employment contraction, the US economy officially pulled out of recession by the end of 2001, despite the shock of the 9/11 terrorist attacks. Another employment surge followed, with Pennsylvania and the US growing their respective employment bases by five percent between 2003 and 2008. Pennsylvania gained more than 300,000 jobs during this expansion period. This surge was largely driven by the housing sector and financial services, though technological innovation was a major growth driver as well. For example, the Internet ushered in new business models such as social networking and open sourcing, and high-powered IT systems were taking life sciences into a new realm of investigation, such as the human genome project. Promoting the commercialization of technological innovation was the thinking behind Governor Tom Ridge’s start of the Life Sciences Greenhouses in 2001 and Governor Rendell’s establishment of the Keystone Innovation Zones in 2004. We know how this chapter of the story ends, with the collapse of the financial sector in fall 2007. By the end of 2007, the Great Recession was officially underway, and that is where we still find ourselves today.

Entrepreneurial Development in Pennsylvania | 9
Taking Stock: What can we learn from the past few decades?
Setting aside today’s economic state for the time being, it is clear that Pennsylvania’s economic performance over the past few decades moved in a positive direction. There was a net gain of close to 900,000 jobs added to the state’s employment base between 1980 and 2009 (including self-employed workers), for decent growth of 18 percent. Moreover, this employment growth took place during a period when Pennsylvania’s population essentially stayed the same. Pennsylvania’s growth industry sectors (in terms of employment growth) during this period were: education & health, professional & business services, and leisure & hospitality. Median household income also moved in a positive direction, though at a more modest level, with an increase of $3,900 or 8.3 percent. Most important, the state’s worst fears—that the bottom of the economy was falling out—did not come to be. The early 1980s marked a distinct turning point for Pennsylvania’s economy, a low-point from which we have been able to climb for the past 30 years.
And yet, while we were able to climb out of the abyss, when we compare Pennsylvania’s performance to a host of competitor states, and the nation on average, it appears that we have been outpaced. Pennsylvania lags in the race to create jobs, as measured by employment growth and jobs gained per 1,000 residents during this period and its ability to generate wealth for residents, as measured by 2008 median household income. (See Figure 4.) Most disturbing, Pennsylvania’s manufacturing sector continues to shed jobs at an alarming rate. Between 1990 and 2009, an additional 376,000 jobs were lost, for a decline of 40 percent; what was Pennsylvania’s second largest industry sector in terms of employment in 1990 is now the fifth largest in 2009. So while we can say Pennsylvania moved in a positive direction over the past few decades, it has been a very turbulent ride, and we do not seem to have landed so well in the so-called “new economy.”
Figure 4: Comparison of Pennsylvania’s Economic Performance (1980-2009)
Over the past 30 years, PA was generally outpaced by the nation overall and the 10 comparison states (combined)
PA 10 states combined USEmployment growth (1980-1990) 18.0% 33.0% 44.1%
Jobs gained per 1,000 residents (1980-1990) 71 114 154
Median HH income (2008) $50,713 $57,073 $52,029
Median HH income growth (1985-2008) 8.3% 6.9% 10.1%
Source: BLS/LAUS (note: includes self-employed); Census Bureau

10 | Fels Institute of Government
Welcome to the “New Economy”
We may live in uncertain times today, but if the last few decades have taught us anything, it is that we have entered an era of a “new economy.” ITIF describes the new economy as being knowledge-dependent, global in scope, rooted in information technology, and driven by innovation. (See Figure 5.) Moreover, these features have only served to accelerate the process of business formation, growth, and displacement; large public companies are now more quickly eclipsed by younger firms than they were in the past. According to a report by the Kauffman Foundation, when looking at the 100 largest public companies in the US (as measured by market capitalization), between 1917 and 1977, it took an average of 30 years for half of the “top 100” companies to be replaced on the list by newcomers; between 1977 and 1998 the average replacement time decreased to 12 years. Undoubtedly, this market turbulence is even greater today.
If these are the realities of the new economy, then entrepreneurs are its agents. In short, it is entrepreneurs who embrace the features of the new economy and translate them into new companies, some of which will go on to experience significant growth and displace existing, less productive, less efficient businesses. As stated by ITIF: “ . . . while it is true that entrepreneurial growth, market dynamism, economic ‘churning,’ and competition have been features of the American economy since the colonial days, after the 1990s the center of gravity seemed to shift to entrepreneurial activity.”
From a macro perspective, the growth of highly productive firms and the displacement of less efficient ones, the hallmark of the new economy, leads to overall higher productivity gains. In fact, there is strong evidence that success in the new economy translates into economic well-being for a state. In tracking states’ performances in the new economy, ITIF has found a positive correlation between strong-performing states and higher growth in state per capita income.
Figure 5. The new “entrepreneurial” economy
Even though a recession is still officially underway, we can say with great confidence that the “new economy” is here to stay and entrepreneurs are its agents. Here are the main features of the new “entrepreneurial” economy:
Knowledge-dependent: Competing on cost is no longer a winning proposition, not when we are competing with countries whose labor and land costs are a fraction of ours. Today’s competitive advantage, whether for individual workers, companies, states, regions or the whole country, is derived from knowledge, skills, expertise, creativity, or experiences of our people.
Global in Scope: The world is more connected today in every way imaginable, from trading markets to supply chains to online communities. Hard numbers bear this out: Global trade has grown 2.5 times faster than global GDP, and $12.5 trillion in world exports now comprise nearly 20 percent of world GDP.
Rooted in IT: Since the 1990s, when information technology like semiconductors, software, and telecommunications became cheap, IT has become ubiquitous and pervasive in all industries. Wave after wave of technological innovation has infused every industry sector of the economy and is driving productivity gains and economic growth.
Driven by Innovation: For today’s firms to remain competitive, they must be in an almost constant state of innovation, lest they risk becoming commodity producers.

Entrepreneurial Development in Pennsylvania | 11
Pennsylvania in the New Economy: Entrepreneurship Metrics
If entrepreneurship is a key driver in the new economy, then gauging Pennsylvania’s performance in this key area is an important first step to explaining our overall modest economic performance over the past 30 years. To do this, we look at seven key metrics that reflect the entrepreneurial process itself – from company start-up, to company growth, to company death – and compare Pennsylvania to a select group of ten other competitor states and the US on average. (See Figures 6 and 7.) The full state comparison can be found in the Appendix.
Entrepreneurship Metric What is representsStart-up formation% adults starting a business
The propensity of individuals in a state to conceive a company and the state economy’s capacity to support new ideas and ventures.
Small firm employmentFirms with < 500 employees
Major source of employment (and wealth) for the state. Plus, most entrepreneurial firms start off as small businesses.
Young firm employmentFirms 3 years or younger
Major source of net new jobs = vital for economic recovery. Small subset of rapid growers will become future large state employers.
Gazelles% of jobs in fast-growing companies
Most “dynamic and adaptive” companies in an innovation economy; strongly correlated with overall robust job growth.
High profile, fast-growing companiesInc. 500 + Deloitte Technology Fast 500
PR-seeking gazelles (self-submitted and self-reported), and often a state’s future iconic employers.
SBIR + STTR awards% of SBIR + STTR dollars awarded
Highly competitive federal grant program for small businesses engaged in R&D with commercialization potential.
Business churn% of openings + closings
“Dynamic equilibrium”—replacing less efficient and innovative companies with new ones, a reality of the new economy and associated with job growth..
Figure 6. Entrepreneurship Metrics
Figure 7. Comparison States for Entrepreneurship Metrics
Comparison States (10)Mid-Atlantic neighbors New York, New Jersey, Maryland, Virginia
Top performers, up-and-comers Massachusetts, North Carolina, Florida
Large, post-industrial states Ohio, Michigan, Illinois

12 | Fels Institute of Government
Metric 1: Start-up formation
Why It Matters: By definition, start-ups represent immediate job creation, even if a company never grows beyond employee #1, the business owner. The constant flow of new companies starting each year is an incredibly important component of new job creation, as pointed out by the Kauffman Foundation in a study of job creation between 1977 and 2005: “[W]ithout startups, net job creation for the American economy would be negative in all but a handful of years.”
Pennsylvania’s Performance: Pennsylvania’s start-up formation rate is abysmally low. It ranks the lowest among the 11 states looked at by this study and over the years has ranked consistently at the bottom of 50-state studies. In fact, Pennsylvania’s start-up formation rate is half that of the nation on average. In a survey of adults conducted between 2007 and 2009, 16 out of 10,000 Pennsylvania residents reported creating a new business each month, compared to 32 out of 10,000 US residents. This discrepancy between the US and Pennsylvania start-up rates has been measured as far back as 1996.
0.00% 0.05% 0.10% 0.15% 0.20% 0.25% 0.30% 0.35% 0.40%
US
11. PA10. OH
9. VA
8. IL
7. NC
4. MA
4. MD
4. MI
3. NJ
2. NY
1. FL
Data Source: The Kauffman Foundation, Index of Entrepreneurial Activity: 1996-2009.
Adjusted number of new businesses started on a monthly basis as a percentage of the state's population (2007-2009)
Figure 8: Pennsylvania Start-up Formation Ranking (Among 11 Comparison States)

Entrepreneurial Development in Pennsylvania | 13
Metric 2: Small companies
Why it matters: When new companies are formed, the majority will either fail to survive (the research tells us that roughly a third will close after two years and half after five years) or remain a small company (i.e., fewer than 500 employees). Small companies form the backbone of the US economy—they represent 99.7 percent of firms with employees and employ half the private sector. An important subset of small companies are the self-employed (also known as sole proprietors or “non-employers”), which represent 75 percent of all US businesses though they account for only 4 percent of total US business revenue.
Pennsylvania’s performance: Small firm employment in Pennsylvania accounted for 50.9 percent of total employment (in 2005, the most recent year for which data is available), slightly less than small firm employment at the US level (51.3 percent). Among the 11 states looked at in this study, Pennsylvania ranks 5th, an improvement from its 9th place standing in 1980. Despite this jump in rank, small firm employment in Pennsylvania has been consistently below the US average over the past few decades.
0% 10% 20% 30% 40% 50%
US
11. FL
10. NC
9. OH
8. VA
7. MA
6. IL
5. PA4. NJ
3. NY
2. MI
1. MD
Data Source: US Census, Business Dynamics StatisticsNotes: Includes nearly all non-farm private establishments with paid employees as well as some public sector activities.
Percentage of private sector employment in firms with paid employees with fewer than 500 employees (2005)
5% 15% 25% 35% 45% 55%
Figure 9: Pennsylvania Small Firm Employment Ranking

14 | Fels Institute of Government
Metric 3: Young Companies
Why it matters: Like a healthy ecosystem, a strong economy appears to need a recurring crop of young companies (i.e., 3 years or younger) whose job is to introduce innovation and new efficiencies into business practices, which in turn drive productivity gains, displace inefficiencies, and generate economic growth. In fact, according to The Kauffman Foundation: “ . . . there is an incredibly tight relationship between any particular [industry] sector’s job growth and the performance of young firms within that sector.”
Pennsylvania’s performance: Only 8.6 percent of employment in Pennsylvania in 2005 was with young firms, a decrease from 10.7 percent in 1980. Pennsylvania ranks toward the bottom of the study group of 11 states, at 8th place in 2005, up two spots from 1980. Like small firm employment, Pennsylvania’s young firm employment has been consistently below the US average over the past few decades.
0.0% 3.0% 6.0% 9.0% 12.0% 15.0%
US
11. MA
10. OH
9. IL
8. PA7. VA
6. NJ
5. NC
4. NY
3. MD
2. MI
1. FL
Data Source: US Census, Business Dynamics StatisticsNotes: Includes nearly all non-farm private establishments with paid employees as well as some public sector activities.
Percentage of private sector employment in firms with paid employees three years or younger (2005)
Figure 10: Pennsylvania Young Firm Employment Ranking

Entrepreneurial Development in Pennsylvania | 15
Metrics 4-6: Growth companies
Why they matter: Each year a small percentage of companies will go on to experience significant job growth, often within a few years of birth, and an even smaller subset will burst through the ranks to become major employers. These companies—dubbed “gazelles” by David Birch in his insightful research 30 years ago—are major job creators. According to The Kauffman Foundation, the fastest growing 1 percent of US companies generate roughly 40 percent of new jobs in any given year and most of these companies are young (i.e., 3 to 5 years old). An even smaller subset—the Super Gazelles—grow to substantial size (i.e., up to 10,000 employees) and become the next generation of iconic companies.
Pennsylvania’s performance: In gauging the dynamism of growth companies, Pennsylvania’s performance is decidedly middle-of-the-pack. The percentage of Pennsylvania employment in “gazelle” firms is 8.5 percent, slightly higher than the US average and 4th among the 11 study states (though Pennsylvania is in a 3-way tie for 4th).
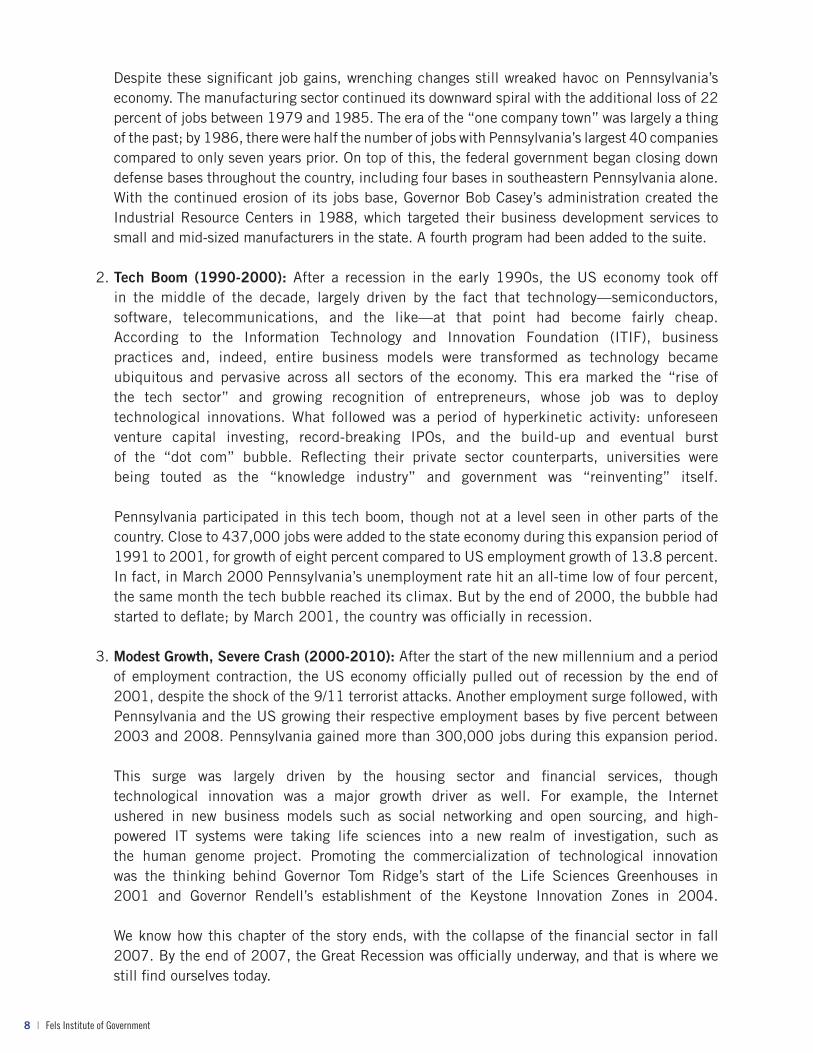
In terms of high profile, fast-growing companies, Pennsylvania ranks 7th among the 11 study states in its share of companies on the Inc. 500 and the Deloitte Technology Fast 500 lists during the years 2001 and 2009. The same was true for Pennsylvania companies’ presence on these lists between 1996 and 2000.
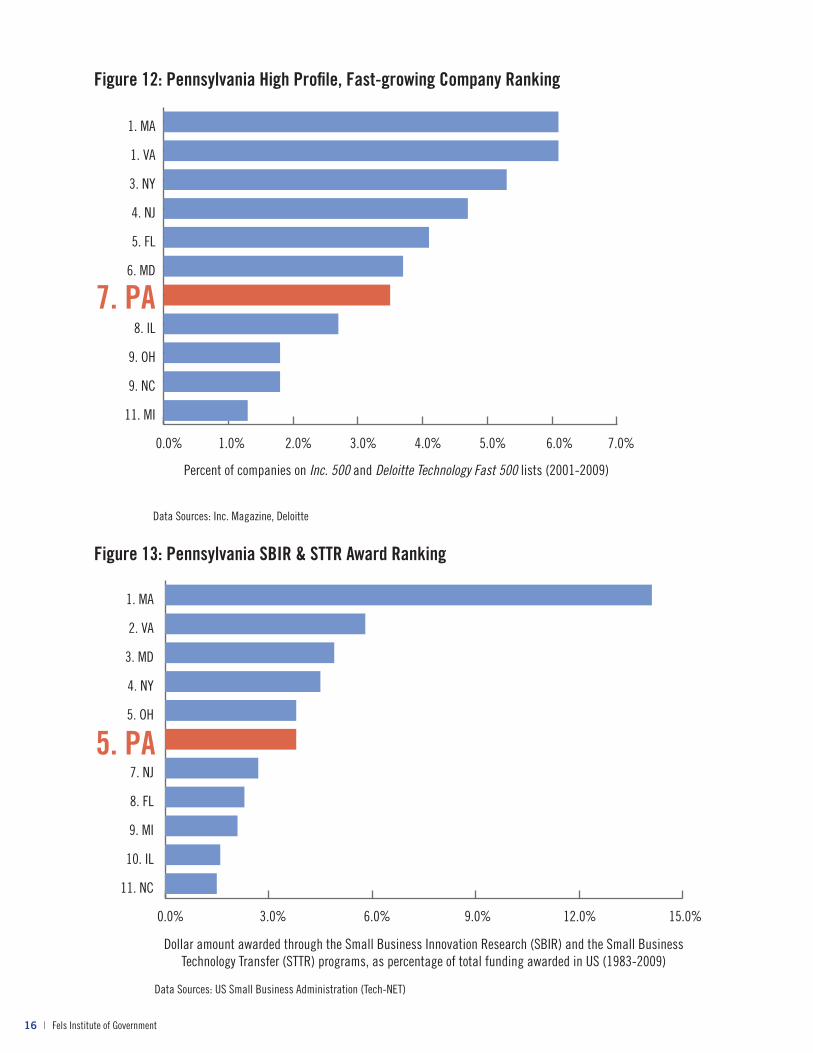
Lastly, in terms of Pennsylvania companies’ ability to secure funding from two highly competitive federal grant programs (the SBIR and STTR programs), the state consistently ranked 5th among the 11 study states. It appears to be in a second tier of states, with total dollars awarded at several steps below first-tier states like Massachusetts.
Figure 11: Pennsylvania “Gazelle” Employment Ranking
0% 3% 6% 9% 12% 15%
US
11. MI
10. OH
9. IL
8. VA
7. MA
4. FL
4. NC
4. PA
3. MD
2. NJ
1. NY
Data Source: Information Technology & Innovation Foundation, The Kauffman Foundation, 2008 State New Economy Index; Progressive Policy Institute, 1999 State New Economy Index
Jobs in “gazelle” companies (firms with annual sales revenue that has grown 20 percent or more for four straight years) as a share of total employment (2008)
16 | Fels Institute of Government
0.0% 1.0% 2.0% 3.0% 4.0% 5.0% 6.0% 7.0%
11. MI
9. NC
9. OH
8. IL
7. PA6. MD
5. FL
4. NJ
3. NY
1. VA
1. MA
Data Sources: Inc. Magazine, Deloitte
Percent of companies on Inc. 500 and Deloitte Technology Fast 500 lists (2001-2009)
Figure 12: Pennsylvania High Profile, Fast-growing Company Ranking
0.0% 3.0% 6.0% 9.0% 12.0% 15.0%
11. NC
10. IL
9. MI
8. FL
7. NJ
5. PA 5. OH
4. NY
3. MD
2. VA
1. MA
Data Sources: US Small Business Administration (Tech-NET)
Dollar amount awarded through the Small Business Innovation Research (SBIR) and the Small Business Technology Transfer (STTR) programs, as percentage of total funding awarded in US (1983-2009)
Figure 13: Pennsylvania SBIR & STTR Award Ranking

Entrepreneurial Development in Pennsylvania | 17
Shown: Roy W. Blose, President and CEO of TecPort Solutions. The five-year-old Information Technology company saw a 600 percent increase in gross revenues and a 5,000 percent increase in profits in the last three years. The Harrisburg company grew from three associates in 2005 to 125 employees in 2010. (PHOTO: Sean Simmers, The Patriot-News).
Metric 7: Business churn
Why it matters: At the tail end of the entrepreneurship cycle is company death, either of the company itself or from the displacement of other less efficient, less productive companies. This process—known as “churn” among economists—has sped up over the years and appears to be underlying productivity gains in the new economy. As explained by Kauffman: “When we’re talking about young firms . . . we’re talking about an ever-changing assortment of dynamic firms—entering and exiting; creating and destroying jobs. Such messiness is not cause for dismay or alarm; it is the provenance of net job creation. If we want to chart a rapid employment recovery, we need to foster such messy dynamism.”
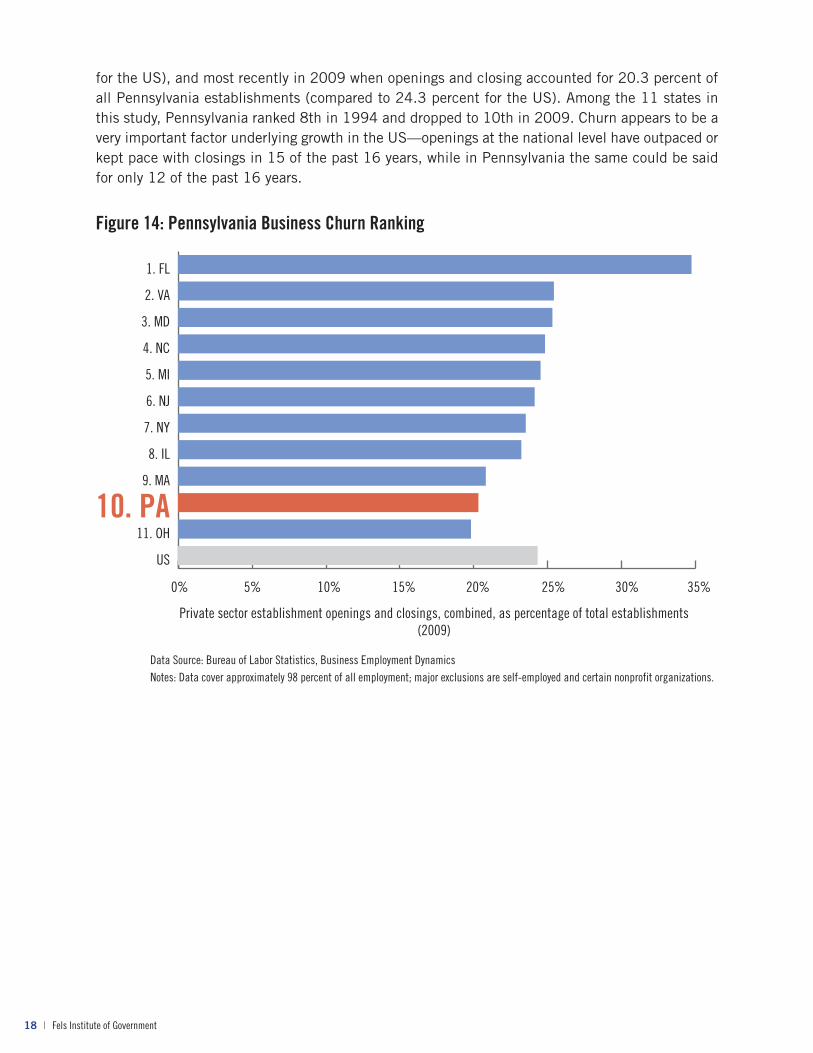
Pennsylvania’s performance: “Churn” in Pennsylvania—that is, the level of activity in terms of openings and closings and, hence, a measure of the state’s economic dynamism—appears to be a few steps below what is happening at the national level and in individual competitor states. In fact, low-level churn in Pennsylvania has been around for awhile—in 1994, when openings and closings accounted for 21.5 percent of all Pennsylvania establishments (compared to 23.6 percent
18 | Fels Institute of Government
for the US), and most recently in 2009 when openings and closing accounted for 20.3 percent of all Pennsylvania establishments (compared to 24.3 percent for the US). Among the 11 states in this study, Pennsylvania ranked 8th in 1994 and dropped to 10th in 2009. Churn appears to be a very important factor underlying growth in the US—openings at the national level have outpaced or kept pace with closings in 15 of the past 16 years, while in Pennsylvania the same could be said for only 12 of the past 16 years.
Figure 14: Pennsylvania Business Churn Ranking
0% 5% 10% 15% 20% 25% 30% 35%
US
11. OH10. PA
9. MA
8. IL
7. NY
6. NJ
5. MI
4. NC
3. MD
2. VA
1. FL
Data Source: Bureau of Labor Statistics, Business Employment DynamicsNotes: Data cover approximately 98 percent of all employment; major exclusions are self-employed and certain nonprofit organizations.
Private sector establishment openings and closings, combined, as percentage of total establishments (2009)

Entrepreneurial Development in Pennsylvania | 19
Summing It Up
When it comes to entrepreneurship in Pennsylvania, the metrics make it plain that we have a major weakness at the beginning of the entrepreneurial process—specifically, Pennsylvania’s comparably weak ability to “prime the pump” of business formation, as seen in the startlingly low start-up rate. (See Figure 8.) When a state’s start-up rate is low, this means fewer new companies are being formed every year and, therefore, a smaller pool of candidates with growth potential moves on to the next stage of growth—in other words, weaker “throughput” of the entrepreneurial process. Weaker throughput in Pennsylvania is particularly evident in the state’s comparatively low level of young firm employment. At the tail end of the process, fewer growth companies means a lower level of new job creation and, at a macro level, less innovation, efficiency, and productivity being introduced into the state economy. We see this outcome reflected in Pennsylvania’s comparatively low level of business churn, which over the past few decades has consistently been a few steps below competitor states and the national average.
What could explain Pennsylvania’s markedly low start-up formation rate? It could be a reflection of the state’s demographics. In a study of Pennsylvania’s competitiveness, The Brookings Institution states that “Pennsylvania lacks the population dynamics fundamental to flourishing economies,” which include steady foreign immigration, domestic in-migration, and attraction and retention of young professionals. But it is also could be a cultural mindset that still pervades in the state, where generations of workers have not necessarily had the expectation or tradition of striking out on their own. If this is the case, then the vestiges of Pennsylvania’s industrial heritage could very well be thwarting the state’s complete entry into the new “entrepreneurial” economy.
Figure 15: Pennsylvania Ranking on Entrepreneurship Metrics (among 11 comparison states)
Ranking Start-up Formation
(2007-2009)
Small Firm Employment
2005
Young Firm Employment
2005
Gazelles
2008
High Profile, Fast-growing Companies
(2001-2009)
SBIR+STTR Awards
(1983-2009)
Business Churn2009
1 FL MD FL NY VA MA FL
2 NY MI MI NJ MA VA VA
3 NJ NY MD MD NY MD MD
4 MA NJ NY FL NJ NY NC
5 MD PA NC NC FL PA MI
6 MI IL NJ PA* MD OH NJ
7 NC MA VA MA PA NJ NY
8 IL VA PA VA IL FL IL
9 VA OH IL IL NC MI MA
10 OH NC OH OH OH IL PA11 PA FL MA MI MI NC OH
*Tied for 4th with NC and FL
20 | Fels Institute of Government
A New Set of Choices for Pennsylvanians
As with the early 1980s, Pennsylvania finds itself at a crossroads: the economy is in deep recession, thousands of workers have lost their jobs and joined the ranks of the unemployed, many for the first time ever, and Pennsylvania’s employment base is in decline again. Once again, we are facing tough choices on what to do with an ever diminishing pool of resources to help pull us out of the economic doldrums. What is different today, however, is our better understanding of how states achieve economic growth in the “new economy” through superior performance in the realm of entrepreneurship. And while the phenomenon of entrepreneurship is an organic process, states can—and, out of economic necessity, should—have a hand in promoting entrepreneurial development.
The choices before Pennsylvania can be boiled down to three simple options: we can continue with what we are already doing, we can do something different, or we can do what we are already doing but do it better.
The first choice, continue with what we are doing, does not seem very promising. Taking stock today, the best we can say about our 30-year investment in the entrepreneurial development suite is that Pennsylvania is only marginally better off; or, put another way, it could have been a lot worse for Pennsylvania had we not invested in entrepreneurial development. Indeed, there seems to be a persistent undertow dragging down the state’s economy that we have yet to overpower.
The second choice, do something different, is an interesting question that deserves further investigation. All 50 states, and indeed many countries around the world, have embraced the tenets of the new economy and are serving as laboratories with publicly-funded entrepreneurial development initiatives. Furthermore, there is also a wealth of academic studies on the effectiveness of entrepreneurial development initiatives, and it would be wise for Pennsylvania to take a step back and evaluate its suite. The bottom line is, innovation is key in the ever-changing new economy, whether it is searching out new best practices or evaluating your own programs.
That said, there is good reason to believe that the suite of programs Pennsylvania already has in place are the right programs. Between them, they cover every industry sector in the state and offer a range of entrepreneurial development services to growth-potential companies at all stages of development. More important, we simply do not have the luxury of taking our time given the acute economic conditions of today. It seems that the third choice is really our best option: we need to keep doing what we are already doing, only better.
Doing a better job of nurturing the entrepreneurial development process is going to take lots of ingenuity, given the organic nature of entrepreneurship. As pointed out by the Kauffman Foundation, “Policies aimed at somehow making companies of the high-growth variety will necessarily be a blunt and static instrument acting on a dynamic target.” But like any savvy investor, we should make it our guiding principle to help steer entrepreneurs down the path of growth, not do the driving for them. We boil this principle down to several investment guidelines:

Entrepreneurial Development in Pennsylvania | 21
View Entrepreneurship as a Human Capital Issue
All successful companies start off as a person with the audacity to take a good idea and turn it into a business. We need to think of entrepreneurial development as a human capital issue and invest in it accordingly. This means we should be investing not just in the suite of programs falling under the banner of “economic development,” but also cross-agency in other components of the human capital development system, such as workforce training (and re-training), K-12 education, and the post-secondary system. Our foremost goal should be to change the state’s cultural mindset to one that embraces entrepreneurship as a means to achieve economic well-being.
Focus Like a Laser Beam on Start-ups
As the analysis of the report makes so clear, Pennsylvania is a true underperformer when it comes to the rate of residents starting new companies, and this weak start-up rate means fewer and weaker companies emerging at the backend. We need to gain a better understanding of why our start-up rate is so low and what we can do to jumpstart it. This does not mean abandoning our work with companies further along the growth path. In fact, to be among the strongest states in terms of entrepreneurship performance we need to do both. But for every investment we make and every program we create, we should be asking the question: how does this impact the state’s start-up rate?
Baruch Ben Dor is the President and CEO of Infrascan, Inc., and one of the developers of the Infrascanner, a portable device that helps medical professionals detect blood in the brain. The company got off the ground after winning the Wharton Business Plan Competition in 2004 and has since expanded to a global market, including multi-million dollar contracts with the US military. (PHOTO: Ryan Donnell, www.ryandonnell.com).
. . . without startups, net job creation for the American economy would be negative in all but a handful of years.
—The Kauffman Foundation
“ ”

22 | Fels Institute of Government
Invest and Deliver Regionally
According to The Brookings Institution, “Regions represent the right point and scale of intervention for . . . efforts to purposefully catalyze entrepreneurship and high-growth firms.” This statement was made with regard to federal investments in entrepreneurial development, but it is equally true for state investments. Brookings points out that policies and programs for entrepreneurial development tend to fall into two broad categories: macro investments, such as tax policies or regulations and laws; and, micro investments, such as grant awards or technical assistance provided to companies. But there seems to be a “missing middle,” the policies and programs that seek to strengthen entrepreneurial development at the metropolitan and regional level. President Obama’s administration seems to be “warming to a new, more region-oriented style of innovation policy” and Pennsylvania is arguably well-positioned to capitalize on this, as all six programs of our entrepreneurial development suite are regionally-based.
Capitalize on Growing Trends
As the phenomenon of entrepreneurship itself becomes better understood, Pennsylvania can be more strategic in entrepreneurial development by leveraging its areas of strength. For example, one area of significant opportunity is the state’s older population. According to the Kauffman Foundation, the most active cohort in terms of entrepreneurial activity are adults ages 55 to 64 years, contrary to media reports that suggest the 20-34 age cohort is most active, when actually they are the least active. Kauffman sees a coming “boom” of entrepreneurship particularly as Baby Boomers enter this age cohort. Furthermore, the Global Entrepreneurship Monitor now surveys adults up to age 99, which previously stopped at age 64, in recognition of the high rate of entrepreneurship seen in older segments of the US population.
Similarly, there is a growing body of research that non-natives in America have a considerably higher rate of entrepreneurial activity than natives. A major flow of foreigners comes to the US through the higher education system. And while there are major visa and work permit issues to overcome in this area, Pennsylvania’s relatively large foreign student college population is a potential competitive asset to be leveraged for economic growth.
Avoid Snakes in the Grass
In our efforts to retool Pennsylvania’s suite of entrepreneurial development programs, we should be wary of contracting “programitis,” that is, the compulsion to start something new. Not every problem deserves a new program. Moreover, while there are few “new ideas,” there are many better ways to get things done.
Rather, what would be immensely helpful is that we get a better understanding of how our state investments in entrepreneurial development measure up against other economic development approaches, such as tax credits and job attraction efforts. As drawn from state budget reports, by the end of the 1980s, after Pennsylvania’s entrepreneurial development suite had been in place for almost a decade, the state’s investment has, for the most part, ranged from $80,000 to $150,000 per 10,000 members of the state’s labor force. The one notable exception to this trend is Governor Rendell’s budget for 2010-2011, which earmarks $32.8 million for the suite of six entrepreneurial development programs, or about $47,000 per 10,000 members of the state’s labor force. Further research on the cost of other economic development strategies is needed for comparison purposes, though admittedly this is hard to do. DCED’s “investment tracker” website is a good start, but additional, independent research is needed in this area.

Entrepreneurial Development in Pennsylvania | 23
Entrepreneurship + Innovation = Pennsylvania’s Economic Recovery
Starting a company is a matter of economic necessity for many business owners. With the Great Recession still underway, this is truer today than ever. Most economists believe the US unemployment rate will remain above nine percent well into 2011. Even more troubling, there is the fear that many lost jobs will never come back and that we are entering an era of “chronic joblessness.” The most compelling metric in support of this fear is US productivity, which is at an all-time high. Productivity is high not because business output is higher (in fact, it isn’t). Rather, it is because companies are slashing costs, much of it labor costs. They are doing this by shifting from full-time, permanent workers to part-time and temporary workers or outsourcing to lower-cost providers (some off-shore). These new work arrangements are likely to become the new normal.
As recently reported by the Wall Street Journal, “Nearly half the unemployed—45.9 percent—have been out of work longer than six months, more than at any time since the Labor Department began keeping track in 1948.” This is a marked difference from the recessions of the 1980s, when only about a quarter of unemployed workers remained unemployed longer than six months. Economists fear that even when the country eventually emerges from recession and the unemployment rate goes down, there will be a pool of “nearly permanently unemployed workers, a condition once more common in Europe than in the US.”
If we are entering an era of chronic joblessness, it is only a matter of time before the safety net becomes unraveled for a large segment of workers. Making entrepreneurship the centerpiece of a state economic recovery strategy could help stave off such a dire situation. Programs such as the SBDCs help put workers on the path to business ownership and others such as Ben Franklin Technology Partners help nurture entrepreneurial ambition and grow companies into large employers. For the state, this could mean not only the short-term impact of cost savings (from not having to support workers through long periods of unemployment), but also the longer-term prospect of economic well-being for its residents resulting from homegrown business formation and job creation. The choices we make will surely help write the next chapter of the story.
Making entrepreneurship the centerpiece of a state economic recovery strategy could help stave off chronic joblessness.

24 | Fels Institute of Government
Acknowledgements
Research for this report was conducted by Annette B. Mattei, consultant to the Fels Institute of Government of the University of Pennsylvania, under the direction of Executive Director David B. Thornburgh. Research assistance was provided by Allison Brummel, Director of Research & Consulting, Jack Higgins, Interim Director of Research & Consulting, and Mateo Rando, Graduate Student Assistant.
Information sources used in this report include: David Osborne, Laboratories of Democracy (1988); Information Technology and Innovation Foundation, The 2008 State New Economy Index (2008); The Kauffman Foundation, The Coming Entrepreneurship Boom (2009), High-Growth Firms and the Future of the American Economy (2010), Turmoil and Growth: Young Businesses, Economic Churning, and Productivity Gains (2008), Where Will the Jobs Come From? (2009); Massachusetts Technology Collaborative, 2008 Index of the Massachusetts Innovation Economy; The Brookings Institution, Back to Prosperity: A Competitive Agenda for Renewing Pennsylvania (2003), Innovation and Entrepreneurship: The New Drift in Federal Policy (2010); Ben Franklin Technology Partners of Southeastern Pennsylvania, The Ben Franklin Experiment: Two Decades of Innovation; US Small Business Administration, Office of Advocacy, Frequently Asked Questions; and, The New York Times, “Despite Signs of Recovery, Chronic Joblessness Rises,” February 21, 2010; Wall Street Journal, “Chronic Joblessness Bites Deep,” June 6, 2010 and “Productivity Augurs Recession’s End, Usually,” August 11, 2009.
Data sources used in this report include: Bureau of Labor Statistics, Local Area Unemployment Statistics (total Pennsylvania employment), Business Employment Dynamics (business churn), Current Employment Statistics (Pennsylvania employment by industry); US Census Bureau, American Community Survey (median household income), Business Dynamics Statistics (small firm & young firm employment); The Kauffman Foundation, Index of Entrepreneurial Activity, 1996-2009 (start-up formation); Information Technology & Innovation Foundation, The 2008 State New Economy Index (gazelle employment); Inc. Magazine (Inc. 500, 1996-2009); Deloitte (Technology Fast 500, 1996-2009); US Small Business Administration, Tech-NET (SBIR & STTR awards).
Entrepreneurial Development in Pennsylvania | 25
Appendix: State Comparison of Entrepreneurship Metrics
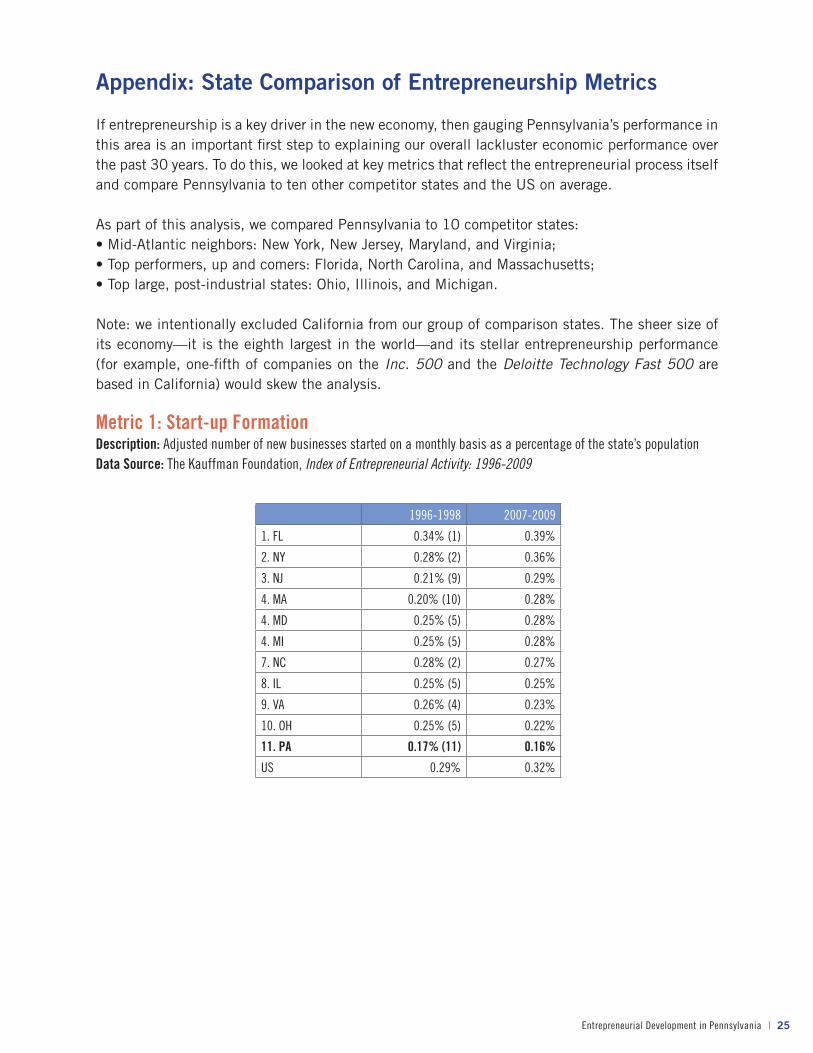
If entrepreneurship is a key driver in the new economy, then gauging Pennsylvania’s performance in this area is an important first step to explaining our overall lackluster economic performance over the past 30 years. To do this, we looked at key metrics that reflect the entrepreneurial process itself and compare Pennsylvania to ten other competitor states and the US on average.
As part of this analysis, we compared Pennsylvania to 10 competitor states:• Mid-Atlantic neighbors: New York, New Jersey, Maryland, and Virginia;• Top performers, up and comers: Florida, North Carolina, and Massachusetts;• Top large, post-industrial states: Ohio, Illinois, and Michigan.
Note: we intentionally excluded California from our group of comparison states. The sheer size of its economy—it is the eighth largest in the world—and its stellar entrepreneurship performance (for example, one-fifth of companies on the Inc. 500 and the Deloitte Technology Fast 500 are based in California) would skew the analysis.
Metric 1: Start-up FormationDescription: Adjusted number of new businesses started on a monthly basis as a percentage of the state’s populationData Source: The Kauffman Foundation, Index of Entrepreneurial Activity: 1996-2009
1996-1998 2007-2009
1. FL 0.34% (1) 0.39%
2. NY 0.28% (2) 0.36%
3. NJ 0.21% (9) 0.29%
4. MA 0.20% (10) 0.28%
4. MD 0.25% (5) 0.28%
4. MI 0.25% (5) 0.28%
7. NC 0.28% (2) 0.27%
8. IL 0.25% (5) 0.25%
9. VA 0.26% (4) 0.23%
10. OH 0.25% (5) 0.22%
11. PA 0.17% (11) 0.16%
US 0.29% 0.32%
26 | Fels Institute of Government
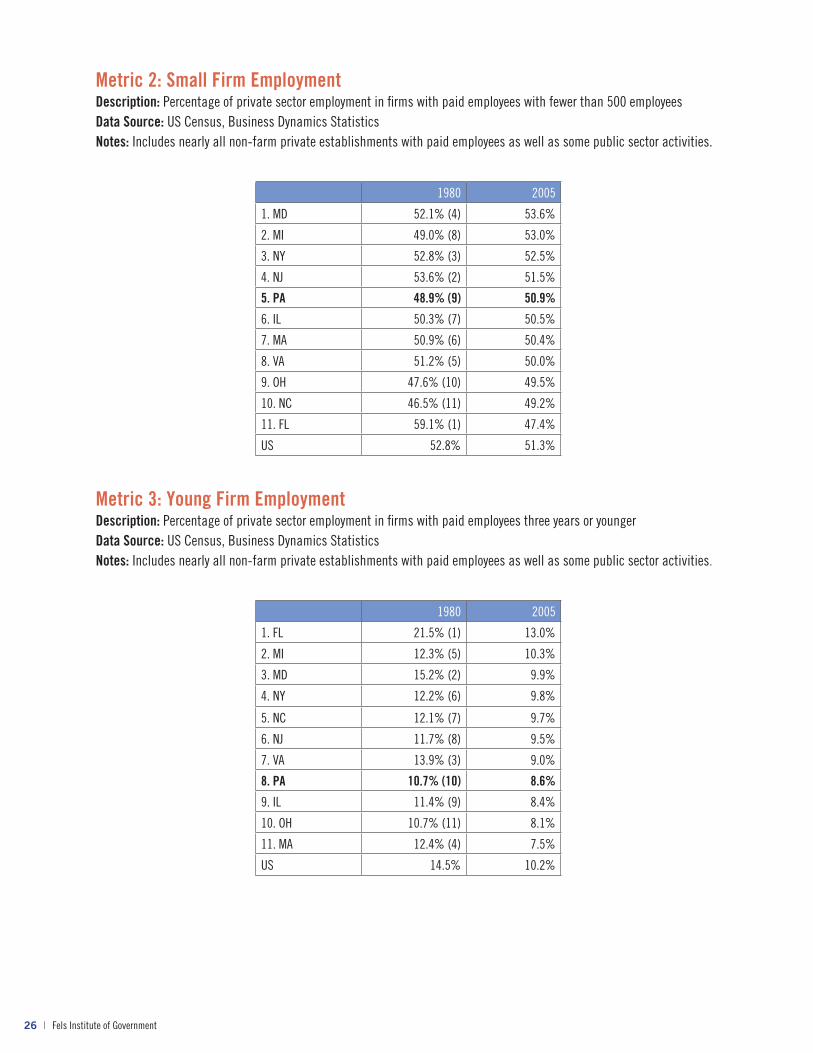
Metric 2: Small Firm EmploymentDescription: Percentage of private sector employment in firms with paid employees with fewer than 500 employeesData Source: US Census, Business Dynamics StatisticsNotes: Includes nearly all non-farm private establishments with paid employees as well as some public sector activities.
Metric 3: Young Firm EmploymentDescription: Percentage of private sector employment in firms with paid employees three years or youngerData Source: US Census, Business Dynamics StatisticsNotes: Includes nearly all non-farm private establishments with paid employees as well as some public sector activities.
1980 2005
1. MD 52.1% (4) 53.6%
2. MI 49.0% (8) 53.0%
3. NY 52.8% (3) 52.5%
4. NJ 53.6% (2) 51.5%
5. PA 48.9% (9) 50.9%
6. IL 50.3% (7) 50.5%
7. MA 50.9% (6) 50.4%
8. VA 51.2% (5) 50.0%
9. OH 47.6% (10) 49.5%
10. NC 46.5% (11) 49.2%
11. FL 59.1% (1) 47.4%
US 52.8% 51.3%
1980 2005
1. FL 21.5% (1) 13.0%
2. MI 12.3% (5) 10.3%
3. MD 15.2% (2) 9.9%
4. NY 12.2% (6) 9.8%
5. NC 12.1% (7) 9.7%
6. NJ 11.7% (8) 9.5%
7. VA 13.9% (3) 9.0%
8. PA 10.7% (10) 8.6%
9. IL 11.4% (9) 8.4%
10. OH 10.7% (11) 8.1%
11. MA 12.4% (4) 7.5%
US 14.5% 10.2%

Entrepreneurial Development in Pennsylvania | 27
Metric 4: GazellesDescription: Jobs in “gazelle” companies (firms with annual sales revenue that has grown 20 percent or more for four straight years) as a share of total employmentData Source: Information Technology & Innovation Foundation, The Kauffman Foundation, 2008 State New Economy Index; Progressive Policy Institute, 1999 State New Economy Index
Metric 5: High profile, fast-growing companiesDescription: Percent of companies on Inc. 500 and Deloitte Technology Fast 500 listsData Sources: Inc. Magazine, Deloitte
1999 2008
1. NY 12.5% (9) 12.3%
2. NJ 12.3% (8) 11.0%
3. MD 12.4% (10) 9.6%
4. NC 13.9% (4) 8.5%
4. PA 13.4% (7) 8.5%
4. FL 15.8% (1) 8.5%
7. MA 15.5% (2) 7.9%
8. VA 13.5% (6) 7.7%
9. IL 14.4% (3) 7.2%
10. OH 13.6% (5) 6.4%
11. MI 12.4% (10) 6.3%
US 14.3% 8.0%
1996-2000 2001-2009
1. VA 6.8% (2) 6.1%
1. MA 7.7% (1) 6.1%
3. NY 4.3% (5) 5.3%
4. NJ 4.3% (5) 4.7%
5. FL 5.0% (3) 4.1%
6. MD 4.6% (4) 3.7%
7. PA 3.5% (7) 3.5%
8. IL 3.0% (8) 2.7%
9. NC 2.5% (9) 1.8%
10. OH 1.9% (9) 1.8%
11. MI 1.3% (11) 1.3%

28 | Fels Institute of Government
Metric 6: SBIR + STTR awardsDescription: Dollar amount awarded through the Small Business Innovation Research (SBIR) and the Small Business Technology Transfer (STTR) programs, as percentage of total funding awarded in USData Source: US Small Business Administration (Tech-NET)
Metric 7: Business churnDescription: Private sector establishment openings and closings, combined, as percentage of total establishmentsData Source: Bureau of Labor Statistics, Business Employment DynamicsNotes: Data cover approximately 98 percent of all employment; major exclusions are self-employed and certain nonprofit organizations.
1983-1990 2001-2009 1983-2009
1. MA 15.8% (1) 13.2% (1) 14.1%
2. VA 5.5% (2) 5.9% (2) 5.8%
3. MD 5.3% (3) 4.9% (3) 4.9%
4. NY 4.5% (4) 4.5% (4) 4.5%
5. PA 4.1% (5) 4.0% (5) 3.8%
6. OH 2.7% (5) 4.0% (5) 3.8%
7. NJ 2.5% (7) 2.5% (7) 2.7%
8. FL 2.3% (8) 2.4% (8) 2.3%
9. MI 1.5% (10) 2.2% (9) 2.1%
10. IL 1.7% (9) 1.7% (10) 1.6%
11. NC 1.1% (11) 1.7% (10) 1.5%
1994 2009
1. FL 27.6% (1) 34.7%
2. VA 21.0% (9) 25.4%
3. MD 25.2% (2) 25.3%
4. NC 20.0% (11) 24.8%
5. MI 22.8% (7) 24.5%
6. NJ 24.5% (4) 24.1%
7. NY 25.1% (3) 23.5%
8. IL 23.7% (5) 23.2%
9. MA 23.0% (6) 20.8%
10. PA 21.5% (8) 20.3%
11. OH 20.7% (10) 19.8%
US 23.6% 24.3%

Entrepreneurial Development in Pennsylvania | 29

30 | Fels Institute of Government
Fels Research & Consulting
Fels Institute of GovernmentUniversity of Pennsylvania
3814 Walnut StreetPhiladelphia, PA 19104
(215) 898-2600
www.fels.upenn.edu