entorhinal cortex of the rat: organization of intrinsic connections
TRANSCRIPT

Entorhinal Cortex of the Rat:Organization of Intrinsic Connections
CYNTHIA L. DOLORFO1,3 AND DAVID G. AMARAL2*1Group in Neuroscience, University of California at San Diego, La Jolla, California 92193
2Department of Psychiatry, Center for Neuroscience and California Regional PrimateResearch Center, University of California, Davis, Davis, California 95616
3Institute of Experimental Medicine, Hungarian Academy of Science,Department of Functional Anatomy, H-1450 Budapest, Hungary
ABSTRACTTwo sets of experiments were carried out to examine the organization of associational
connections within the rat entorhinal cortex. First, a comprehensive analysis of the areal andlaminar distribution of intrinsic projections was performed by using the anterograde tracersPhaseolus vulgaris–leuocoagglutinin (PHA-L) and biotinylated dextran amine (BDA). Second,retrograde tracers were injected into the dentate gyrus and PHA-L and BDA were injectedinto the entorhinal cortex to determine the extent to which entorhinal neurons that project todifferent septotemporal levels of the dentate gyrus are linked by intrinsic connections.
The regional distribution of intrinsic projections within the entorhinal cortex was relatedto the location of the cells of origin along the mediolateral axis of the entorhinal cortex. Cellslocated in the lateral regions of the entorhinal cortex gave rise to intrinsic connections thatlargely remained within the lateral reaches of the entorhinal cortex, i.e., within therostrocaudally situated entorhinal band of cells that projected to septal levels of the dentategyrus. Cells located in the medial regions of the entorhinal cortex gave rise to intrinsicprojections confined to the medial portion of the entorhinal cortex. Injections made intomid-mediolateral regions of the entorhinal cortex mainly gave rise to projections to mid-mediolateral levels, although some fibers did enter either lateral or medial portions of theentorhinal cortex. These patterns were the same regardless of whether the projectionsoriginated from the superficial (II–III) or deep (V–VI) layers of the entorhinal cortex. Thisorganizational scheme indicates, and our combined retrograde/anterograde labeling studiesconfirmed, that laterally situated entorhinal neurons that project to septal levels of thedentate gyrus are not in direct communication with neurons projecting to the temporalportions of the dentate gyrus. These results suggest that entorhinal intrinsic connectionsallow for both integration (within a band) and segregation (across bands) of entorhinal corticalinformation processing. J. Comp. Neurol. 398:49–82, 1998. r 1998 Wiley-Liss, Inc.
Indexing terms: dentate gyrus; hippocampus; three-dimensional reconstruction; memory
consolidation; epilepsy
The entorhinal cortex is in a pivotal position within thehippocampal formation because it is strongly intercon-nected with both the neocortex and the rest of the hippo-campal formation. Projections from unimodal and polymo-dal association areas reach the hippocampal formation viathe perirhinal cortex, which sends a projection to layersI–III of the dorsolateral part of the entorhinal cortex(Deacon et al., 1983; Reep et al., 1986; Burwell andAmaral, 1996, 1998). Layers II–III of the dorsolateralentorhinal cortex in turn originate projections to septallevels of the dentate gyrus and hippocampus (Steward andScoville, 1976; Ruth et al., 1988; Dolorfo and Amaral,1998). Layers V and VI of the dorsolateral entorhinal
cortex receive projections from septal levels of the hippo-campus and subiculum (Kohler, 1985; Van Groen andWyss, 1990; Tamamaki and Nojyo, 1994) and originatereturn projections to the neocortex (Swanson and Kohler,1986; Insausti et al., 1997). Thus, cortical information
Grant sponsor: NIH; Grant numbers: NS16980 and NS16980–13S1;Grant sponsor: Human Frontiers Science Program.
*Correspondence to: David G. Amaral, Ph.D., Center for Neuroscience,University of California, Davis, 1544 Newton Court, Davis, CA 95616.E-mail: [email protected]
Received 6 December 1996; Revised 25 March 1998; Accepted 30 March1998
THE JOURNAL OF COMPARATIVE NEUROLOGY 398:49–82 (1998)
r 1998 WILEY-LISS, INC.

entering the superficial layers of the entorhinal cortex isrelayed to the dentate gyrus and hippocampus and isultimately returned to the deep layers of the entorhinalcortex and then back to the neocortex.
The connections between the more ventral portions ofentorhinal cortex and the dentate gyrus and hippocampusare similarly organized. Unlike the dorsolateral portion ofthe entorhinal cortex, however, the ventromedial parts ofentorhinal cortex receive only sparse direct projectionsfrom neocortical areas and do not originate substantialprojections back to neocortex (Swanson and Kohler, 1986;Burwell and Amaral, 1996, 1997; Insausti et al., 1997).
Based on the existing literature, four main organiza-tional features of the rat entorhinal cortex have emerged.First, cortical and some subcortical inputs terminate inrestricted mediolateral portions of the entorhinal cortex(Krettek and Price, 1977; Veening, 1978; Ottersen, 1982;Deacon et al., 1983; Alonso and Kohler, 1984; Insausti etal., 1997). Second, there is a lateral-to-septal and medial-to-temporal organization of entorhinal projections to thedentate gyrus (Wyss, 1981; Ruth et al., 1982, 1988; Dolorfoand Amaral, 1993, 1998). Third, to the extent that theyhave been studied, intrinsic connections of the entorhinalcortex appear to be limited in their mediolateral extent(Kohler, 1986, 1988). Fourth, associational connectionsoriginate in deep layers and terminate in superficial layers(Kohler, 1986, 1988). Unfortunately, these conclusionsmust be viewed as tentative because many are based on arelatively meager experimental database or have not beenconfirmed for all regions of the entorhinal cortex. Forexample, because Kohler (1986, 1988) studied only thedorsal two-thirds of the entorhinal cortex, the distributionof associational connections in its ventral portion is notcurrently clear. Moreover, whereas previous studies haveindicated that associational connections arise largely indeep layers, more recent studies have indicated that layersII and III of the entorhinal cortex may generate additionalintrinsic connections (Lingenhohl and Finch, 1991; Tama-maki and Noyjo, 1993).
The current study was prompted by our recent reanaly-sis of the three-dimensional topography of entorhinalprojections to the dentate gyrus. We have shown thatdiscrete, largely nonoverlapping bands of entorhinal layer
II neurons project to different septotemporal levels of thedentate gyrus (Dolorfo and Amaral, 1993, 1998). A band ofcells located in the most lateral part of the entorhinalcortex projects to the septal half of the dentate gyrus, amid-entorhinal band of cells projects to the third quarter ofthe dentate gyrus, and a third, rostromedially situatedband projects to the temporal quarter of the dentate gyrus.We sought to determine whether the entorhinal neuronsdestined to communicate with the septal dentate gyruswere interconnected with those that project to ventrallevels of the dentate gyrus by intrinsic entorhinal connec-tions. If this were the case, then the associational connec-tions would tend to integrate information reaching theentorhinal cortex and homogenize the output to all septo-temporal levels of the dentate gyrus. If associationalconnections between the bands were limited, however,then this would reinforce the possibility of segregation ofinformation processing in different regions of the entorhi-nal cortex and septotemporal levels of the dentate gyrus.The other issue we sought to clarify dealt with the laminarorigin of associational connections in the entorhinal cor-tex. Do these arise from both deep and superficial layersand are the distributions of the projections similar ordifferent? We were able to provide answers to thesequestions by using the discrete anterograde tracers Phaseo-lus vulgaris–leucoagglutinin (PHA-L) and biotinylateddextran amine (BDA) and the retrograde tracers Fast blue(FB) and Diamidino yellow (DY). In some experiments, allfour tracers were injected into a single animal to labelbands of entorhinal-to-dentate projecting cells and todetermine whether the cells in different bands were inter-connected.
MATERIALS AND METHODS
Surgery
Thirty-five adult male Sprague-Dawley rats (290–350 g;Harlan Sprague-Dawley, Inc., Houston, TX) were used inthese studies. Either two or four neuronal tracers wereinjected into each animal (see below) during a singlesurvival surgery. All procedures were approved by theAnimal Use and Care Committee of the Salk Institute forBiological Studies and were performed in accordance withguidelines outlined by the U.S. Public Health ServicePolicy on Human Care and Use of Laboratory Animals(Office for Protection from Research Risks, 1986). Animalswere anesthetized with a cocktail of ketamine (100 mg/ml),acepromazine (10 mg/ml), and rompun (20 mg/ml) at asurgical dose of 0.5 ml/100 g (i.p.). Anesthesia was supple-mented when needed with Nembutal (50 mg/ml) at a doseof 0.05 ml/100 g (i.p.), which was preceded by an injectionof atropine sulfate (0.1 ml/100 g, i.p.). The animal wasmounted in a Kopf stereotaxic instrument, and a midlineincision was made. Bregma was determined, and eithertwo or four small (approximately 1 mm in diameter) burrholes were drilled, the number depending on the locationsof the injection sites. The following range of coordinateswas used for anterograde tracer injections into the entorhi-nal cortex: 3.8–7.6 mm posterior, 4.4–7.0 mm lateral, and4.6–7.5 mm ventral (Paxinos and Watson, 1986). Thefollowing coordinates were used for retrograde dye injec-tions into the dentate gyrus (Paxinos and Watson, 1986)—(1) septal dentate gyrus: 2.1 mm posterior, 0.8 mm lateral,and 3.5 mm ventral from the cortical surface; (2) mid-septotemporal dentate gyrus: 5.8 mm posterior, 4.4 mm
Abbreviations
A amygdalaab angular bundleaf amygdaloid fissureAPir amygdalopiriform transition areaBDA biotinylated dextran amineDG dentate gyrusDY Diamidino yellowec external capsuleEC entorhinal cortexEnd endopiriform nucleusFB Fast blueHPC hippocampusI, II, III, V, VI cell layers of the entorhinal cortexIV layer IV of the entorhinal cortex (lamina dessicans)LEA lateral entorhinal areaMEA medial entorhinal areaPaS parasubiculumPC piriform cortexpCoA posterior cortical nucleus of the amygdalaPHA-L Phaseolus vulgaris–leuocoagglutininPrS presubiculumrs rhinal sulcusS subiculum
50 C.L. DOLORFO AND D.G. AMARAL

lateral, and 6.38 mm ventral; (3) temporal dentate gyrus:5.1 mm posterior, 3.3 mm lateral, and 7.4 mm ventral.Following the injection of tracers, the wound was sutured,and the rat was monitored for recovery from anesthesiaand returned to its home cage.
Anterograde tracer injections. In 17 animals, a glassmicropipette (10–30 µm outer diameter) containing eitherthe anterograde tracer PHA-L (Gerfen and Sawchenko,1984) or BDA (Veenman et al., 1992) was lowered intoeither superficial (II–III) or deep (V–VI) layers of theentorhinal cortex. PHA-L (2.5% solution; Vector Laborato-ries, Burlingame, CA) or BDA (10% solution; MolecularProbes, Portland, OR) was iontophoretically injected byusing a DC current source (PHA-L: 14 nA, 7 seconds on/7seconds off for 5–8 minutes; BDA: 15 nA, 7 seconds on/7seconds off for 8–10 minutes). Both PHA-L and BDA weredissolved in 0.1 M sodium phosphate buffered saline (pH7.4). The second anterograde tracer was then injected intoa site within the ipsilateral entorhinal cortex.
Retrograde and anterograde tracer injections. Fig-ure 1 illustrates the general strategy for depositing thefour neuronal tracers. The retrogradely transported fluo-rescent dyes FB (Bentivoglio et al., 1980) and DY (Keizeret al., 1983) were deposited in one of three possiblecombinations of septotemporal locations in the dentategyrus (i.e., FB and DY were injected into different loca-tions): (1) septal and temporal, (2) septal and mid-septotemporal, and (3) mid-septotemporal and temporal.The deposit of FB and DY was counterbalanced acrosslocations. A glass micropipette (60–120 µm outer diameter)containing either FB or DY was lowered into the molecularlayer of the dentate gyrus. To avoid contamination ofadjacent hippocampal fields, the dye was deposited intothe infrapyramidal blade of the dentate gyrus. After thepipette remained in place for 5 minutes, an interval timedair pressure injection system (Amaral and Price, 1983)was used to inject 50–70 nl of 3% FB (Dr. Illing GmbH &Co., Germany) or 150–250 nl of 2% DY (Dr. Illing GmbH &Co.). The pipette was then raised 100 µm, where it
remained for 5–10 minutes before it was slowly raised outof the brain. This was done to minimize diffusion of dyeinto the pipette tract. The second dye was then injectedipsilaterally into the other dentate gyrus location.
Immediately following the retrograde tracer injections,a glass micropipette containing either PHA-L or BDA waslowered into the ipsilateral entorhinal cortex, where one ofthe bands of retrogradely labeled cells was predicted tooccur (Fig. 1) or between retrogradely labeled bands basedon our previous work (Dolorfo and Amaral, 1998). PHA-Lor BDA was iontophoretically injected as described above.The second anterograde tracer was then injected into thesecond band or portion of the entorhinal cortex with noretrogradely labeled band. This allowed us to map fiberprojections between and within bands of retrogradelylabeled entorhinal-to-dentate gyrus projecting cells.
Tissue processing
After a survival period of 6–8 days, animals were deeplyanesthetized with 35% chloral hydrate and transcardiallyperfused at a rate of 35–37 ml/min with 0.9% saline (roomtemperature) followed by a series of ice-cold ‘‘pH shift’’fixatives (Berod et al., 1981): 4% paraformaldehyde in 0.1M sodium acetate buffer (pH 6.5) for 10 minutes and 4%paraformaldehyde in 0.1 M sodium borate buffer (pH 9.5)for 15 minutes. The animal’s head was covered with icethroughout. The brain was carefully removed and post-fixed in a solution of 4% paraformaldehyde/0.1 M sodiumborate buffer (pH 9.5) for 6 hours at 4°C on a shaker table.The brain was then cryoprotected in a solution of 20%glycerol in 0.02 M potassium phosphate buffered saline(KPBS) for at least 24 hours at 4°C prior to sectioning.
Brains were blocked in the coronal plane at the level ofthe anterior commissure and through the cerebellum andsectioned (30 µm) in the coronal plane on a freezingmicrotome. For analysis of FB- and DY-labeled cells, a1-in-5 series through the dentate gyrus and entorhinalcortex was immediately mounted on gelatin-coated slides.
Fig. 1. Diagram illustrating the experimental design for labelingentorhinal associational projections within bands of layer II neuronsthat project to different septotemporal levels of the dentate gyrus.A: Fast blue (FB) and Diamidino yellow (DY) were aimed at twodifferent septotemporal levels of the molecular layer of the dentategyrus to label retrogradely two separate populations of layer II
projection neurons (matching stippling patterns in B) in the entorhi-nal cortex. B: In the same animal, ipsilateral to the FB and DYinjections, Phaseolus vulgaris–leuocoagglutinin (PHA-L) or biotinyl-ated dextran amine (BDA) was injected into the entorhinal cortex atlocations predicted to be within the populations of FB- or DY-labeledcells (stippling patterns).
ENTORHINAL INTRINSIC CONNECTIONS 51

After analysis, these sections were stained with 0.25%thionin to aid in the cytoarchitectonic identification ofentorhinal cortical borders and to localize the FB and DYinjection sites. For analysis of PHA-L- and BDA-positivecells and fibers, two adjacent series of sections werecollected in either cold KPBS and immediately reacted forPHA-L and BDA as described below or were collected in acryoprotectant solution (TCS; 25% glycerin, 30% ethyleneglycol in 0.05 M sodium phosphate buffer). Tissue collectedin TCS was stored at 220°C until reacted for PHA-L andBDA-positive elements.
PHA-L visualization. Transported PHA-L was visual-ized with a peroxidase–antiperoxidase (PAP) procedure(Sternberger, 1979) modified for the detection of PHA-L infree-floating sections. Nonspecific binding was blockedwith a solution of 5% normal goat serum (NGS), 0.5%Triton X-100 (TX-100), and KPBS for 2–4 hours at roomtemperature. Sections were incubated in a primary anti-sera solution containing rabbit anti-PHA-L antibody (Dako,Carpenteria, CA) at a dilution of 1:12,000, 2% NGS, 0.3%TX-100, and KPBS, on a shaker table for 48 hours at 4°C.Sections were rinsed in two changes of 2% NGS in KPBSand then incubated in a secondary antisera solution of goatanti-rabbit IgG (Sternberger Monoclonals, Baltimore, MD)at a dilution of 1:200, 2% NGS, 0.3% TX-100, and KPBS for1 hour at room temperature. After two rinses, the sectionswere incubated in tertiary antisera solution containingrabbit PAP (1:200; Sternberger Monoclonals), 2% NGS,0.3% TX-100, and KPBS at room temperature for 1 hour.Following the tertiary antibody step, the sections wererinsed for 30 minutes and incubated in recycled secondaryantisera solution for 45 minutes and then rabbit PAPsolution for 30 minutes. The sections were then treatedwith a 0.05% 3,38-diaminobenzidine (DAB; Pierce, Ta-coma, WA) solution containing 0.01–0.03% hydrogen perox-ide and KPBS for 5–15 minutes. The DAB reaction wasstopped by rinsing the sections first with KPBS and thenwith 0.05 M sodium phosphate buffer (pH 7.4). Thesections were mounted on gelatin-coated slides and driedin a 37°C oven for at least 24 hours prior to intensificationof the DAB reaction product with osmium tetroxide andtricarbohydrazide (Johansson and Backman, 1983).
BDA visualization. Transported BDA was visualizedin a separate series of sections by incubating the sectionsin an avidin-biotin solution (Biomeda, Foster City, CA) atdilutions of 1:25 avidin and 1:50 biotin overnight at 4°C.After a 30-minute rinse in KPBS, the sections were treatedwith a solution of 0.05% DAB, 0.04% hydrogen peroxide,and KPBS for 12–30 minutes. The sections were rinsed inbuffer, mounted on gelatin-coated slides, dried as before,and intensified with osmium tetroxide and tricarbohydra-zide by using the protocol referred to above.
Data analysis
To appreciate better the global pattern of entorhinalcortical intrinsic projections and the relationship of theseprojections to retrogradely labeled bands of layer II cells,two-dimensional unfolded maps and three-dimensionalcomputer-generated models were made from the retro-grade and anterograde data. Sections stained with thioninand for PHA-L- and BDA-positive fibers and terminalswere analyzed with brightfield and darkfield optics on aLeitz Dialux 20 microscope and documented with a LeitzDMRD photomicrography system and with a Nikon Multi-phot 4- 3 5-inch camera system. Photographs were scanned
with a UMAX UTA840 linked to a Macintosh Power PC forhigh-resolution hardcopy representation. Illustrations wereconstructed by using the Adobe Photoshop software pack-age on a Macintosh Power PC computer.
Construction of two-dimensional unfoldedmaps of the entorhinal cortex
Maps for retrograde data. Prior to construction ofthe map, the distribution of FB- and DY-labeled cells in theentorhinal cortex (ipsilateral to the injection sites) and theoutlines of the cerebral hemisphere were plotted at a150-µm rostrocaudal sampling interval by using a com-puter-aided digitizing system (MD-2, Minnesota Datamet-rics, Minneapolis, MN) linked to a Leitz Dialux 20 fluores-cent microscope. The locations of the FB and DY injectionsites were also plotted. The plots were printed at amagnification of 27.53 to facilitate subsequent counting oflabeled cells. By using a Leitz stereomicroscope and at-tached drawing tube, each plot was aligned with thecounterstained Nissl section, and prominent features suchas the dentate gyrus, rhinal sulcus, and entorhinal arealand laminar boundaries were drawn onto the plots. TheFB and DY dye cores and surrounding necrosis were alsodrawn on the plots. The method for making straight-lineunfolded maps is a modification of the method described byVan Essen and Maunsell (1980) and Suzuki and Amaral(1996). This method is described in detail by Dolorfo andAmaral (1998). Briefly, starting at the fundus of the rhinalsulcus, the pial surface of each plot was divided into6-mm-wide radial bins (i.e., 250-µm-wide bin, magnified27.53). Bins extended from the pial surface to layer IV andwere drawn the entire mediolateral length of the entorhi-nal cortex of each plot. The pial surface of each plot was‘‘straightened’’ and ‘‘stacked’’ along the rostrocaudal lengthof the entorhinal cortex, thereby producing a flattenedrepresentation of the surface of the entorhinal cortex. Therhinal sulcus was used to align the set of plots. Thenumber of FB- and DY-labeled cells in layer II was countedfor each bin, and these numbers were entered into atemplate in a Microsoft Excel database (Suzuki and Ama-ral, 1996). Each element of the template corresponded toone bin of the unfolded map and was scaled to representone 250-µm-wide bin. An Excel macro was used to colorcode the FB and DY cells in each bin. Bins containing cellcounts of one or more were shaded black, and bins contain-ing zero were shaded white.
Maps for anterograde data. Camera lucida drawingsof PHA-L and BDA injection sites and labeled fibers weredrawn at 27.53 by using a Leitz stereomicroscope andattached drawing tube. Prominent features from adjacentNissl-stained sections were drawn, and anterograde mapswere constructed as the retrograde maps. In cases thatcontained four neuronal tracers (i.e., FB, DY, PHA-L, andBDA), the same bin divisions were used for the retrogradeplots and for the anterograde drawings so that the un-folded maps would be in register. The density of PHA-L-and BDA-labeled fibers within each bin was determinedqualitatively and assigned numerical values correspond-ing to four density gradations of terminal fiber labeling:1 5 light, 2 5 moderate, 3 5 moderately heavy, and 4 5heavy. For example, a density value of 1 corresponded tothe presence of one or two occasional fibers. An Excelmacro was used to color code the density of labeled fibers ineach bin into four distinguishable levels of gray.
52 C.L. DOLORFO AND D.G. AMARAL
Template map of the dentate gyrus. To summarizethe size and location of the retrograde injection sites, allFB and DY injection sites were transferred from the plotscontaining the Nissl features to an unfolded template mapof the dentate gyrus patterned after the one described bySwanson et al. (1978). By using the crest of the dentategyrus as an alignment reference, the width of the injectionwas ‘‘unfolded’’ onto the map.
Quantitation of injection sites andretrograde and anterograde maps
Two-dimensional entorhinal maps created in the Excelprogram were imported into the graphics software pro-gram Canvasy (Deneba), and the areas occupied by theinjection sites, retrograde and anterograde label, and thetotal surface area of the entorhinal cortex were measuredusing the Canvasy area tool. As verification, these areaswere also measured from hardcopy maps by using SigmaScany software linked to a digitizing tablet and DOS-based personal computer. For the anterograde maps, onlythose bins with density values greater than 1 contributedto the area measurements. For retrograde maps, all binswith labeled cell counts of at least one contributed to thearea measurements.
Three-dimensional computer reconstructions
Computer files of selected cases were generated bytracing features of each retrograde plot or anterogradedrawing by using the 3DED software package (Young etal., 1987) and a Hitachi digitizing tablet linked to a PC.Outlines of the cortical hemisphere, dentate gyrus, FB andDY injection sites, the positions of FB- and DY-labeledlayer II entorhinal neurons, PHA-L and BDA fibers, andentorhinal cytoarchitectonic borders were digitized. Cross-sectional profiles of blood vessels were used as fiducialmarks for registration. These digital representations wereused as input to a three-dimensional surface modelingprogram (Synthetic Universes [SYNU]; Hessler et al.,1992) on a Silicon Graphics Iris workstation. Renderedthree-dimensional reconstructions of the FB and DY bandsof cells, dentate gyrus and hemispheric surfaces, andPHA-L and BDA fiber distributions were visualized androtated into informative views with SYNU, and digital‘‘snapshots’’ of these views were exported to a Macintoshcomputer for hardcopy preparation.
RESULTS
Nomenclature
Dentate gyrus. In the present study, we refer to thelongitudinal length of the dentate gyrus as its ‘‘septotempo-ral axis.’’ Throughout this report, we refer to septal,mid-septotemporal, and temporal levels of the dentategyrus. However, we do not intend to imply with thisnomenclature that these terms refer to equal thirds of theseptotemporal length of the dentate gyrus. The septalportion of the dentate gyrus, based on the patterns ofretrograde labeling in the entorhinal cortex resulting fromFB and DY injections, may occupy as much as one-half ofthe septotemporal length of the dentate gyrus (Dolorfo andAmaral, 1998).
Entorhinal cortex. The most widely accepted nomen-clature for the rat entorhinal cortex was introduced byBrodmann (1909), who divided it into two primary subdivi-
sions: the lateral entorhinal area (LEA) and the medialentorhinal area (MEA). The first, clear demarcation ofthese regions was described by Blackstad (1956) on thebasis of normal fiber and experimental degeneration stud-ies. Figure 2 shows photomicrographs of Nissl-stainedcoronal sections at three levels through the rostrocaudalextent of the entorhinal cortex. Accompanying highermagnification photomicrographs show some cytoarchitec-tonic details of the LEA and MEA. We used the followingcharacteristics to demarcate the LEA and MEA fromadjacent areas. The LEA is located rostrolateral to theMEA, and its most dorsolateral border is in the proximityof the rhinal sulcus. Throughout its rostrocaudal extent,the LEA is bounded dorsally by the perirhinal and postrhi-nal cortices. At rostral levels, the LEA lies dorsal topiriform cortex, at mid-rostrocaudal levels it lies dorsal toperiamygdaloid cortex, and at caudal levels it lies dorsal tothe MEA. The MEA occupies a caudomedial positionwithin the entorhinal cortex. At rostral levels, it is limitedlaterally by ventral portions of the LEA and medially bythe parasubiculum. At caudal levels, the MEA occupiesapproximately the ventral one-third of the occipital pole.At this level, it is bounded dorsally by the perirhinal cortexand parasubiculum.
Cytoarchitectonically, the LEA and MEA can be differen-tiated according to the following criteria (see Fig. 2D,E).Layer II of the LEA is much thinner than that of the MEAand is composed of darkly staining, medium-sized, oval-shaped cells that are arranged in ‘‘islands’’ or clusters. Inthe MEA, layer II contains large, round, lightly stainingcells that are densely packed. The LEA lacks a well-definedlamina dissecans (layer IV), which is prominent in theMEA. Although a number of more elaborate schemes havebeen proposed for the demarcation of the entorhinal cortex(Haug, 1976; Krettek and Price, 1977; Insausti et al., 1997)the associational connections that we describe in thispaper do not respect the proposed boundaries of thesubdivisions. For simplicity, we have chosen to use theLEA/MEA nomenclature, which captures the fundamentaldistinction of regions that give rise either to the lateral ormedial perforant path projection.
Overview of the presentation of results
The results of the single and double anterograde tracerstudies are described first, followed by a description of the‘‘four tracer’’ experiments in which two retrograde and twoanterograde tracers were injected into the brains of indi-vidual animals. A focus of the first set of experiments wasto obtain PHA-L and BDA injections in all regions of theentorhinal cortex. In particular we attempted to obtaininjections in the ventral one-third of the entorhinal cortexbecause associational projections originating from thisregion have not been analyzed in previous studies. Webegin with a description of the distribution and attributesof the injection sites. An overview of the general rules oforganization is presented next, and then representativecases are described to demonstrate the major areal andlaminar organizational principles of the associational con-nections.
This first section of the Results is concluded with aquantitative analysis of the areal distribution of theterminal fields of entorhinal associational projections origi-nating from either superficial or deep layers. The majorhypothesis we derive from this first set of experiments isthat the organization of entorhinal associational projec-
ENTORHINAL INTRINSIC CONNECTIONS 53

Fig. 2. Cytoarchitectonic characteristics of the rat entorhinalcortex. A–C: Photomicrographs of Nissl-stained coronal sectionsthrough three selected rostrocaudal levels of the entorhinal cortex,arranged from rostral (A) to caudal (C), showing the lateral (LEA) andmedial (MEA) entorhinal area subdivisions. Arrowheads indicate LEA
and MEA boundaries. D,E: High magnification photomicrographs ofLEA (D) and MEA (E) taken from portions of the entorhinal cortexenclosed by boxes in B and C, respectively. The layers of the entorhinalcortex are indicated with roman numerals. For abbreviations, see list.Scale bar 5 1 mm for A–C, 250 µm for D,E.

Fig. 3. Locations and sizes of all Phaseolus vulgaris–leuocoaggluti-nin (PHA-L) and biotinylated dextran amine (BDA) injections evalu-ated for these studies. Boundaries of injection sites were determinedin coronal sections and were ‘‘unfolded’’ on to a two-dimensionalunfolded map of the entorhinal cortex. A detailed description of theconstruction of these maps can be found in Dolorfo and Amaral (1998).The fundus of the rhinal sulcus in the unfolded maps appears as avertical bar (rs). The border between the LEA and the MEA is
indicated by the thicker line extending from bottom left to upper rightof the maps. A: Location of injections confined to superficial layers(striped pattern) of the entorhinal cortex. B: Location of injectionsconfined to deep layers (dark pattern) of the entorhinal cortex.Injections involving both superficial and deep layers (II–V or III–V)are indicated separately with a lighter shading pattern. Case identifi-ers followed by the letter P indicate a PHA-L injection and thosefollowed by the letter B indicate a BDA injection. Scale bar 5 1 mm.
ENTORHINAL INTRINSIC CONNECTIONS 55

tions parallels the organization of the entorhinal cells thatoriginate projections to the dentate gyrus. The secondseries of studies was designed to evaluate this conclusion.Specifically, we first present a brief summary, based on ourprevious work, of the organization of the entorhinal layerII cells that project to different septotemporal levels of thedentate gyrus. Two representative cases, which had appro-priately placed retrograde and anterograde tracers, arepresented to demonstrate the relationships between theregion of layer II cells that project to a particular septotem-poral level of the dentate gyrus and the pattern of associa-tional connections stemming from an injection of antero-grade tracer located within this region. We conclude thissection by presenting quantitative data concerning theoverlap of entorhinal associational connections with thedomain of retrogradely labeled cells projecting to thedentate gyrus. The principal conclusion is that the entorhi-nal associational projections are organized in a fashionthat maintains the segregation of entorhinal informationdirected to different levels of the dentate gyrus but pro-motes further integration of entorhinal information withinall portions of the entorhinal cortex that project to thesame level of the dentate gyrus.
PHA-L and BDA injection sites
Figure 3 shows unfolded maps of the entorhinal cortexillustrating the positions and sizes of the 41 PHA-L andBDA injections analyzed in the present study. Seventeen ofthese cases came from the second ‘‘four tracer’’ set ofexperiments and are identified with the prefix ‘‘DGEC.’’Overall, 33 cases had injections located in the LEA.Fourteen injections were located within dorsolateral por-tions of the LEA and 19 injections were located withinventromedial portions of the LEA. Of the 33 cases involv-ing injections in the LEA, 17 had injections involvingmainly the superficial (II–III) layers and 10 cases hadinjections involving mainly the deep (V–VI) layers. Eightcases had injections located in the ventral portions of theMEA; four of these injections involved the superficiallayers and three involved the deep layers.
PHA-L injection sites typically consisted of a dense coreof intensely brown-colored cell bodies and proximal den-drites surrounded by a yellow-colored halo approximately100–300 µm in diameter. We defined the PHA-L injectionsite as including the dense core of labeled cells plus thehalo. PHA-L injections ranged in size from 300 µm inrostrocaudal length (e.g., EC-4 PHA-L, Fig. 3) to 900 µm inrostrocaudal length (e.g., DGEC-9 PHA-L, Fig. 3). BDAinjection sites similarly consisted of a core of dark-brown-colored cell bodies and dendrites. The size of the BDAinjections ranged from 300 µm in rostrocaudal length (e.g.,EC-20 BDA, Fig. 3) to 750 µm in rostrocaudal length (e.g.,EC-27 BDA, Fig. 3). Both PHA-L and BDA injections weretypically restricted to either superficial layers (II–III) ordeep layers (V–VI), and sometimes involved a single layer.
Organization of associational projectionsof the rat entorhinal cortex
Of the 41 cases containing either PHA-L or BDA injec-tions, 15 representative cases with injections coveringmost of the surface area of the entorhinal cortex wereselected to demonstrate the organization of entorhinalassociational projections. Entorhinal cortical associationalprojections displayed orderly biases in their areal distribu-tion, which were systematically related to the site of origin
along the mediolateral axis. In general, we observed a shiftfrom a primarily rostrocaudal orientation for the terminalfields arising from extreme lateral injection sites to aprimarily mediolateral orientation for progressively moremedial sites. These patterns were independent of whetherthe cells of origin were in superficial (II–III) or deep (V–VI)layers, and, as will become apparent from the second set ofexperiments, this areal organization corresponds to asimilar areal organization of entorhinal layer II cells thatproject to different septotemporal levels of the dentategyrus. Whereas the areal organization of entorhinal asso-ciational projections was unrelated to the layer of origin,the radial distribution of terminal fibers was dependent onregion and layer of origin. As will become clear, theorganization of entorhinal associational projections showsno principled relationships to the classical LEA and MEAcytoarchitectonic subdivisions. However, because this no-menclature is widely used, we attempt to relate, wheneverpossible, our findings to these subdivisions.
Areal organization of entorhinal associational pro-
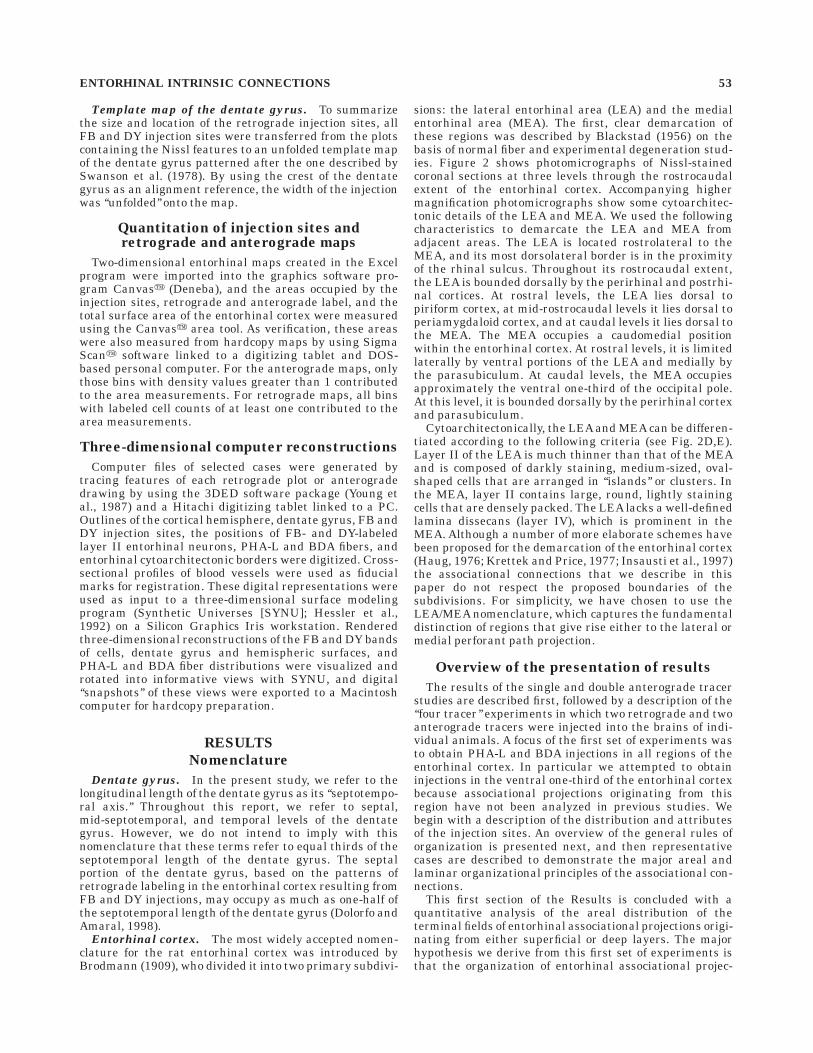
jections. The areal patterns of entorhinal associationalprojections can be best appreciated in the two-dimensionalunfolded maps of the entorhinal cortex shown in Figures4–6. Each map illustrates the distribution and density ofPHA-L- or BDA-labeled fibers and terminals in layersI–III of the entorhinal cortex resulting from injections invarious regions of either superficial (II–III) or deep (V–VI)layers. Injection sites are represented as striped rectangu-lar profiles in each map and as oval-shaped profiles in thecorresponding coronal sections.
Taken together, the anterograde tracer experimentsdemonstrated three general patterns of termination. Pro-jections originating in the far lateral portions of theentorhinal cortex (Fig. 4) were distributed primarily withinthe same lateral regions of the entorhinal cortex andextended for a fairly substantial rostrocaudal extent (Fig.4A–D). At progressively more caudal levels, as the entorhi-nal cortex widened, so did the band of labeled fibers andterminals. The density of labeling fell off sharply at moremedial portions of the entorhinal cortex. When fibersextended into the MEA, they terminated primarily in thecaudomedial portion of this field (Fig. 4A).
When the injections were situated more medially in theentorhinal cortex (Fig. 5), a different terminal field wasgenerated. In general, these terminal fields occupied amore medial position of the LEA and a more rostral portionof the MEA. On the unfolded maps, the LEA componenthad a rostrocaudal orientation and the MEA had a medio-
Fig. 4. A–D: Representative unfolded density maps of Phaseolusvulgaris–leuocoagglutinin (PHA-L) or biotinylated dextran amine(BDA)-labeled fibers and terminals. These illustrate the areal distribu-tions of entorhinal associational projections originating from injec-tions at different rostrocaudal levels of the dorsolateral portion of theentorhinal cortex. The density of fiber labeling ranges from a few fibers(sparse dots) to a dense plexus (black areas). Injection sites arerepresented as striped rectangular profiles on maps and as stripedoval profiles in adjacent coronal drawings. The rostrocaudal locationsfrom which the coronal sections (shown to the right of each map) weredrawn are indicated by the open arrowheads located at the left of eachmap. Layer IV of the entorhinal cortex in the coronal sections is shownas a heavy dotted line. The terminal field is confined mainly to themost dorsolateral portion of the entorhinal cortex. Lower case lettersand arrows in A and D point to the rostrocaudal levels from whichcamera lucida drawings were made for Figures 7 and 10. Asteriskindicates that the caudalmost section was unavailable for analysis.
56 C.L. DOLORFO AND D.G. AMARAL
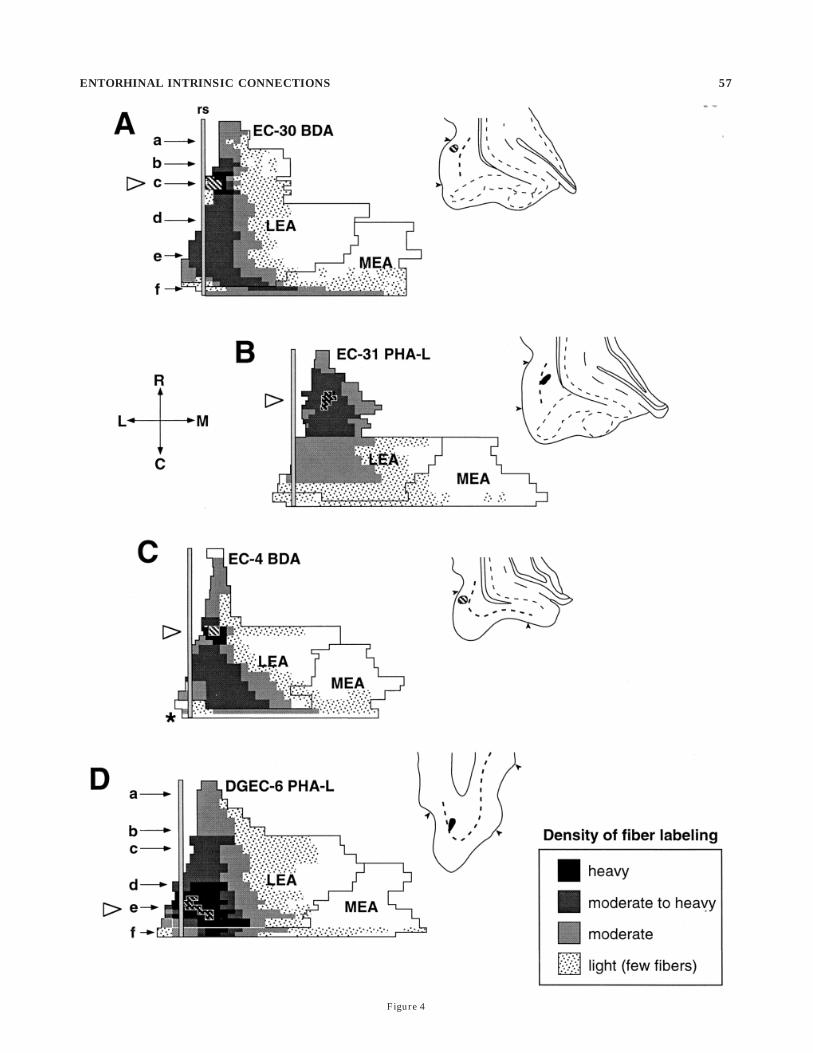
Figure 4
ENTORHINAL INTRINSIC CONNECTIONS 57

Fig. 5. A–G: Representative unfolded density maps illustratingthe areal distributions of entorhinal associational projections originat-ing from mid-mediolateral portions of the entorhinal cortex. Conven-tions as in Figure 4. Note that the terminal distribution in these casesoccupies a different portion of the entorhinal map than that shown in
Figure 4, which illustrated more laterally situated injections. Notealso that a substantial portion of the terminal plexus extends into themedial entorhinal area (MEA) in these cases. Lower case letters andarrows in F point to the rostrocaudal levels from which camera lucidadrawings were made for Figure 11.
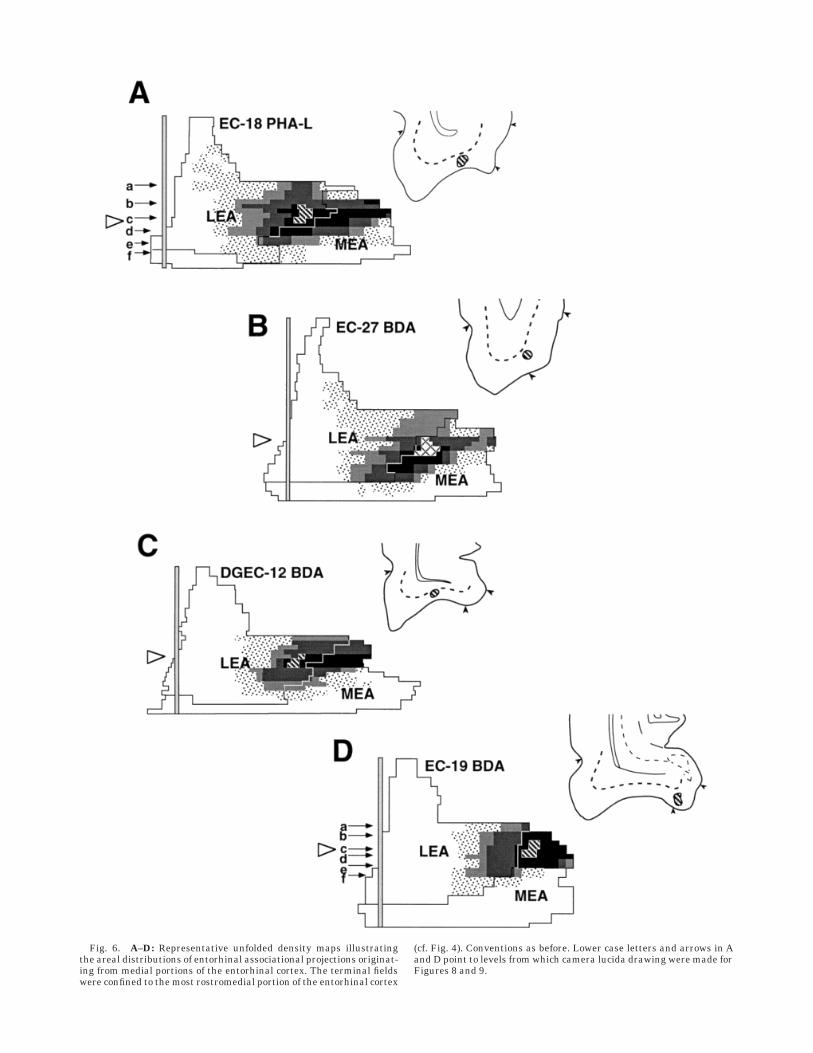
Fig. 6. A–D: Representative unfolded density maps illustratingthe areal distributions of entorhinal associational projections originat-ing from medial portions of the entorhinal cortex. The terminal fieldswere confined to the most rostromedial portion of the entorhinal cortex
(cf. Fig. 4). Conventions as before. Lower case letters and arrows in Aand D point to levels from which camera lucida drawing were made forFigures 8 and 9.

Fig. 7. A–F: Representative camera lucida drawings of the laminardistribution of entorhinal associational projections originating froman injection of biotinylated dextran amine (BDA) into the superficiallayers of the dorsolateral part of the entorhinal cortex. Six levels ofcoronal sections, arranged from rostral (A) to caudal (F), of case EC-30BDA are shown. The six levels correspond to those indicated in theunfolded map of this case in Figure 4A. This BDA injection wascentered in layer III (C). Note that fibers (indicated as thin linesthroughout the sections) are distributed primarily to layers I–III
within a restricted mediolateral sector for most of the rostrocaudallength of the entorhinal cortex. Note the relatively dense distributionof labeled fibers in the outer portions of layer I. Layer III also containsa dense plexus of labeled fibers that terminate preferentially in thedeep part of the layer rostrally and more superficial portions caudally.Arrowheads delimit the extents of the lateral (LEA) and medial (MEA)entorhinal areas, and roman numerals indicate the various cortical layersas defined by Lorente de No (1934). Boxed area in D shows region fromwhich the photomicrograph shown in Figure 12Awas taken.

Fig. 8. A–F: Representative camera lucida drawings showing thelaminar distribution of entorhinal associational projections originat-ing from superficial layers of the ventral part of the entorhinal cortex.Conventions as in Figure 7. In this experiment (EC-18 PHA-L), aninjection of Phaseolus vulgaris–leuocoagglutinin was centered withinlayer III of the ventromedial part of the lateral entorhinal cortex (LEA;
C). The unfolded density map of this case is shown in Figure 6. As withother injections confined to the superficial layers of the entorhinalcortex (cf. Figs. 7 and 9), these fibers terminate mainly in layers I–III.In contrast to dorsolateral injections, however, fibers from ventrome-dial portions terminate more heavily in the deep portion of the layer.

Fig. 9. A–F: Representative camera lucida drawings of coronalsections of case EC-19 BDA showing the distribution of entorhinalassociational projections originating from superficial layers of theventromedial part of the entorhinal cortex. This injection of biotinyl-ated dextran amine involved layers II and III (C,D). The unfolded
density map of this case is shown in Figure 6A. Note that the densestfiber distribution is found in deep parts of layer I. Details of thelaminar distribution of fibers (boxed area in C) are shown in thephotomicrograph of Figure 13A.

Fig. 10. A–F: Representative camera lucida drawings of the lami-nar distribution of entorhinal associational projections originatingfrom deep layers of the dorsolateral part of the entorhinal cortex. Incase DGEC-6 PHA-L, an injection of Phaseolus vulgaris–leuocoagglu-tinin was centered in layers V and VI (E). As with injections in
superficial layers (cf. Fig. 7), projections arising from deep layersterminated most heavily within layers I–III. Note, however, therelatively less dense and less organized fibers in layer I. Details of thelaminar distribution of fibers (boxed area in D) are shown in thephotomicrograph of Figure 12C.

Fig. 11. A–F: Representative camera lucida drawings of the lami-nar distribution of entorhinal associational projections originatingfrom deep layers of the mid-mediolateral portion of the entorhinalcortex (cf. Fig. 8). This case (EC-17 PHA-L) had an injection of
Phaseolus vulgaris–leuocoagglutinin centered in layers V and VI (C).Note the dense fiber labeling in layer III and the relatively sparse fiberlabeling in layers I and II. Details of the laminar distribution of fibers(boxed area in D) are shown in the photomicrograph of Figure 13C.

lateral orientation that gave the terminal field a boomer-ang appearance. The third pattern of termination wasobserved when injections were located in the rostromedialportions of the entorhinal cortex (Fig. 6). In these cases,the terminal field occupied rostromedial portions of theMEA and LEA.
Thus far, we have related the pattern of terminaldistribution independent of a consideration of the laminarorigin of the projections. This is due to the fact that similarpatterns of regional terminal labeling were observed re-gardless of the layer of origin. For example, injections intosuperficial (Fig. 4A) or deep (Fig. 4D) layers of the dorsolat-eral entorhinal cortex lead to generally similar regionalpatterns of labeling. The distribution of labeled fibers andterminals within different layers of the innervated re-gions, however, did vary depending on the location of theinjection site.
Laminar organization of entorhinal associational
projections. The laminar patterns of entorhinal associa-tional projections can be best appreciated in the series ofcamera lucida drawings of coronal sections shown inFigures 7–11. In general, regardless of the cell layer(s) oforigin, entorhinal associational projections are distributedprimarily and most widely to layers I–III. The exception to
this was at the level of the injection site, where, regardlessof the cell layer of origin, labeled fibers formed a ‘‘column’’that extended throughout all layers.
Projections originating in superficial layers of the
entorhinal cortex. The laminar organization of projec-tions arising from the superficial layers of the dorsolateralportion of the entorhinal cortex is illustrated in Figure 7.
The injection primarily involved layer III (Fig. 7C).Overall, the heaviest fiber and terminal labeling wasobserved in layers I and III and the most far reachingprojections (Fig. 7F) were distributed mainly to layer I. Atthe level of the injection (Fig. 7C), labeled fibers werelocated throughout layers I–VI. Fibers within layers I–IIItended to be thin and varicose, whereas fibers withinlayers V and VI were thicker and smoother. Thick descend-ing fibers entered the angular bundle presumably en routeto more rostral levels of the entorhinal cortex or to thehippocampus and subiculum. At rostral levels, thick fibersreentered the entorhinal cortex from the external capsule(large arrow in Fig. 7A).
At levels located rostral to the injection site, the diffusefiber pattern of the injection site resolved, with labelingbecoming most noticeable in the superficial portion of layerI; the deep half of the layer had few, if any, labeled fibers.
Fig. 12. Darkfield (A,C) and brightfield (B,D) photomicrographsillustrating the patterns of fiber distribution resulting from injectionsof anterograde tracers into the superficial or deep layers of thedorsolateral entorhinal cortex. A: Darkfield photomicrograph of fiberslabeled with biotinylated dextran amine resulting from an injectioninto layer III (case EC-30 BDA). Note the dense fiber labeling inthe superficial portion of layer I and the deep portions of layer III.
B: Brightfield photomicrograph of the adjacent Nissl-stained section.C: Darkfield photomicrograph of fibers labeled with Phaseolus vulgar-is–leuocoagglutinin resulting from an injection into layers V–VI (caseDGEC-6 PHA-L). Note the dense fiber plexus within layers III and therelatively less dense fiber labeling in layer I. D: Brightfield photomicro-graph of the adjacent Nissl-stained section. Scale bar 5 250 µm.
ENTORHINAL INTRINSIC CONNECTIONS 65

Near the caudal pole of the entorhinal cortex, however, thedensity of fibers within layer I became lighter overall and,in contrast to rostral levels, the density was somewhathigher in the deeper portions of the layer (Fig. 7F). Thefiber density in layer III was relatively high both rostrallyand caudally from the injection site. Near the injection siteand throughout much of the remaining caudal portion ofthe entorhinal cortex, labeled fibers in layer III weredistributed evenly throughout the radial extent of thelayer. Toward the caudal pole of the entorhinal cortex,however, there was decreased density of labeled fibers andterminals in the deep portion of layer III. At levels locatedrostral to the injection site, labeled fibers were preferen-tially located in the deep portion of layer III. Thus, at theserostral levels there was a deep-to-superficial shift in layer Iand a superficial-to-deep shift in layer III. This pattern offiber distribution emphasized the relative sparseness oflabeled fibers in layer II at these levels.
Layer II received the fewest labeled fibers and terminalsof the superficial layers. Fiber density in layer II decreasedgradually and about equally in both rostral and caudaldirections from the injection site, so that only a few labeledfibers were present in layer II at the extreme rostral andcaudal poles of the entorhinal cortex. Even though fibers
were relatively sparse in layer II, they were varicose andcould be seen occasionally to surround in a basketlikeplexus the somata of layer II cells. These superficialinjections did not lead to appreciable fiber and terminallabeling in the deep layers of the entorhinal cortex, otherthan at the injection site (Fig. 7E). As noted above, onlyoccasional thick labeled fibers penetrated the deep layersand were presumed to be fibers en passant into or out ofthe angular bundle or external capsule.
Overall, the general distribution of labeled fibers result-ing from superficial injections of more medial portions ofthe entorhinal cortex were similar to those resulting fromdorsolateral injections, with two exceptions involving thepattern of labeling in layers I and III. Figures 8 and 9 showa series of camera lucida drawings of cases with injectionsprimarily involving layers II–III. The injection illustratedin Figure 8 was located in a mid-mediolateral position, andthe injection illustrated in Figure 9 was located in theextreme medial portion of the entorhinal cortex.
As with the dorsolateral injections, the overall highestfiber density resulting from these medial injections wasobserved in layer I. Unlike the dorsolateral injections,however, where the labeled fibers and terminals weredensest in the superficial portion of the layer, the heaviest
Fig. 13. Darkfield (A,C) and brightfield (B,D) photomicrographsillustrating the patterns of fiber distribution resulting from injectionsof anterograde tracers into the superficial or deep layers of theventromedial entorhinal cortex. A: Darkfield photomicrograph offibers labeled with biotinylated dextran amine resulting from aninjection centered in layers II and III of the rostral part of the medialentorhinal area (case EC-19 BDA). Note the extremely dense fiber
labeling in deep portions of layer I and the most superficial portions oflayer III. B: Brightfield photomicrograph of the adjacent Nissl-stainedsection. C: Darkfield photomicrograph of fibers labeled with Phaseolusvulgaris–leuocoagglutinin resulting from the injection into layers Vand VI (case EC-17 PHA-L). Note the dense fiber plexus within layerIII and fewer labeled fibers in layer I. D: Brightfield photomicrographof the adjacent Nissl-stained section. Scale bar 5 250 µm.
66 C.L. DOLORFO AND D.G. AMARAL

labeling in these medial cases was located in the deepportion of layer I (Figs. 8, 9). It should be noted, however,that the few fibers in the superficial portion of the layerwere highly varicose. It also appeared in these medialcases that the overall density of fibers in layer I wasgreater, that fibers extended for greater distances in layerI, and that fibers were more exclusively limited to layer I.This latter aspect of the laminar organization was sopronounced that at certain caudal levels there were virtu-ally no fibers in layer III (Fig. 8E).
The layer III fiber and terminal labeling demonstratedother differences in these medially placed injections. First,there were relatively fewer fibers in layer III as oneprogressed rostrally and caudally from the injection site.Second, fibers were more evenly distributed throughoutlayer III at levels rostral to the injection site, whereasthere was a tendency for the labeled fibers to be densest inthe deep portion of the layer in the dorsolateral injections.Similar to the dorsolateral injections, labeled fibers lo-cated caudal to the injection site were confined mainly tothe superficial portion of layer III.
In summary, for cases that had injections confined tosuperficial layers of the entorhinal cortex, the distributionof labeled fibers was mainly to layers I and III. Fiberdensities were sparse in layer II but were of thin caliberand varicose, indicating possible termination. Overall,terminal fiber densities were greatest and projections weremost extensive in layer I. There were also differences inthe radial distribution of fibers within layer I and III thatdepended on the site of origin along the mediolateral axis.Layer III tended to be more heavily labeled after thedorsolateral injections than after the medial injections,and there were differences in what portion of layer III waslabeled, depending on whether the area that was viewedwas located rostral or caudal to the injection or whetherthe injection was placed laterally or medially. None of the
superficial injections led to appreciable fiber and terminallabeling in the deep layers of the entorhinal cortex exceptin the immediate vicinity of the injection site.
Projections originating in deep layers of the entorhi-
nal cortex. Figures 10 and 11 show a series of cameralucida drawings from cases that had injections confined tothe deep layers of the dorsolateral and mid-mediolateralportions of the entorhinal cortex, respectively. As men-tioned earlier, the areal and laminar distribution of entorhi-nal associational projections originating from layers V–VIshare many of the same features as those originating fromsuperficial layers. For example, injections in deep layersalso gave rise to projections mainly to layers I and III.However, the projections arising from the deep layers didshow some differences in their laminar distribution. First,fiber terminations in layer I were generally relativelysparse compared with those arising from the superficiallayers. Second, in cases with deep, dorsolaterally locatedinjections, the radial shift of fiber terminations rostrally inlayer III was opposite to that resulting from injectionsinvolving superficial layers. Finally, fiber projections tolayers V–VI were more prominent with deep layer injec-tions.
The injection illustrated in Figure 10 primarily involvedlayers V and VI (and a few cells in layer III) at caudallevels of the dorsolateral LEA. As with superficial injec-tions in this region, labeled fibers were located throughoutlayers I–VI at the level of the injection site (Fig. 10E).Ascending fibers formed networks of thin, varicose fiberswithin layers I–III; the most dense network was located inlayer III. Many of the labeled fibers within layers V and VIwere thick and smooth and entered the angular bundlepresumably en route to more rostral levels of the entorhi-nal cortex (large arrows in Fig. 10C,D). In contrast to caseswith superficial layer injections, however, many labeledfibers within layers V and VI were of thin and varicosecaliber, indicating possible terminations.
At levels rostral and caudal to the injection site, biasesin the density of fiber labeling within layers I and IIIbecame more evident. In sharp contrast to the denselabeling in the superficial part of layer I that was typicalfor superficial layer injections (Fig. 7), labeling withinlayer I following deep injections was relatively sparse. Atlevels rostral to the injection site, the few labeled fiberswithin layer I were located in the deep part of the layer(Fig. 10A–C), whereas in the vicinity of, and caudal to, theinjection site, labeled fibers were distributed throughoutthe layer (Fig. 10D–F). As with dorsolaterally locatedsuperficial layer injections, the fiber density in layer IIIwas high both rostrally and caudally from the level of thedeep injections. Contrary to the pattern with superficialinjections, the fiber plexus in layer III rostral to theinjection site was preferentially distributed to the superfi-cial portion of the layer (Fig. 10A). Similar to the situationwith superficial injections, labeled fibers located caudal tothe injection were preferentially distributed within thesuperficial part of layer III. The fiber and terminal labelingin the deep layers also demonstrated differences. In con-trast to superficial layer injections, where there were fewlabeled fibers in the deep layers, labeling in layers V andVI following the deep injections was observed for most ofthe rostrocaudal extent of the entorhinal cortex.
In general, the projections arising from deep or superfi-cial layers of medial portions of the entorhinal cortex werefairly similar, with two exceptions involving the density of
Fig. 14. Graph illustrating the mean percentage (bars) and thepercentages of individual experiments (symbols) of the entorhinalcortical surface area labeled by associational projections originatingfrom superficial layers, deep layers, or superficial and deep layerscombined. Filled symbols indicate cases with injections in the lateralentorhinal area. Open symbols indicate cases with injections in themedial entorhinal area.
ENTORHINAL INTRINSIC CONNECTIONS 67

Fig. 15. Three-dimensional organization of entorhinal-to-dentategyrus projecting bands. A: Lateral view of a three-dimensional recon-struction of the caudal half of the rat brain showing two separatepopulations of layer II cells retrogradely labeled by retrograde tracerinjections placed in septal and temporal levels of the dentate gyrus,respectively. The band of cells (black spheres) lying primarily in thedorsolateral portion of the entorhinal cortex is the septally projectingband. The band of cells lying primarily in medial portions of theentorhinal cortex (light gray spheres) is the temporally projectingband. The unlabeled area located between the septally and temporally
projecting bands is the mid-septotemporal projecting band. B: Two-dimensional unfolded map of the two labeled bands of this case isshown. Note that the two bands in the unfolded map appear strikinglysimilar in shape and position as do the terminal fields of entorhinalassociation projections that originate from extreme dorsolateral andextreme medial portions of the entorhinal cortex. C: Same unfoldedmap as in B but rotated into the format used throughout the rest of theillustrations. The heavy line in the middle of the map marks theborder between the lateral and medial entorhinal areas.
Fig. 16. A–C: Line drawings of coronal sections through theentorhinal cortex (arranged from rostral to caudal) showing thedistribution of retrogradely labeled cells following an injection ofdiamidino yellow into septal levels of the dentate gyrus (gray cellslocated dorsolaterally in the entorhinal cortex) and Fast Blue into amid-septotemporal level (black cells in a mid-mediolateral portion ofthe entorhinal cortex). The unfolded two-dimensional map illustratingthe distribution of these cells is shown at the top left of the figure.D–F: Darkfield photomicrographs illustrating the distribution ofanterogradely labeled fibers resulting from an injection of biotinylateddextran amine into the dorsolateral portion of the entorhinal cortex.
Layer IV (lamina dissecans) is illustrated by a dashed line in thesephotomicrographs. The unfolded two-dimensional map illustratingthe distribution of labeled fibers is shown at top right. Because thesame unfolded maps of the entorhinal cortex are used to illustrate boththe retrograde and anterograde labeling, it is possible to see that theassociational connections are confined largely to the dorsolaterallysituated band of cells that projected to the septal portion of the dentategyrus. Filled arrowheads indicate the lateral and medial extent of theentorhinal cortex. Asterisk indicates that the caudalmost section wasunavailable for analysis. Scale bar 5 1 mm.
68 C.L. DOLORFO AND D.G. AMARAL

Figure 16
ENTORHINAL INTRINSIC CONNECTIONS 69

labeling in layers I, V, and VI. Figure 11 shows a series ofcamera lucida drawings of a case with a deep layerinjection in the mid-mediolateral portion of the entorhinalcortex. Labeled fibers within layer I were much less densethan after superficial injections, but the distribution offibers was similar (Fig. 8). The paucity of labeling in layer Iwas even more pronounced than after the deep, dorsolat-eral injections. As with the dorsolateral injections, thedeep injections in the mid-mediolateral entorhinal cortexgave rise to a plexus of fibers in layers V and VI. The deepprojection in these cases tended to be more restricted inboth the mediolateral and rostrocaudal extent. The label-ing in these layers was also lighter than that followingdeep injections in the dorsolateral entorhinal cortex.
In summary, projections arising from the deep layers ofthe entorhinal cortex were fairly similar regardless ofwhether the injection was located in the dorsolateral ormedial portions of the entorhinal cortex. As with superfi-cial layer injections, injections into deep layers of theentorhinal cortex gave rise to projections that were distrib-uted mainly to layers I and III, and fibers extendedfarthest from the injection site in layer I. In contrast to thesuperficial injections, injections into the deep layers pro-duced fiber densities in layer I that were relatively lighterand projections to layers V and VI that were relativelystronger. The laminar organization of fibers arising fromsuperficial or deep layers of the entorhinal cortex areillustrated in Figures 12 and 13.
Quantitative analysis of areal extentof entorhinal association projections
To determine quantitatively the extent of divergence ofassociational projections within the entorhinal cortex, wecompared the surface area of the associational terminalfields with the surface area of the entire entorhinal cortex;these data were derived from the unfolded maps (seeMaterials and Methods). The percentage of the surfacearea of the entorhinal cortex innervated by associationalconnections is illustrated in Figure 14. On average andregardless of whether the injection involved deep or super-ficial layers, the terminal field covered approximately 33%of the surface area of the entorhinal cortex.
We now examine how the terminal field of associationalconnections in the entorhinal cortex relates to the organi-zation of entorhinal neurons that give rise to perforantpath projections to the dentate gyrus.
Organization of entorhinal associationalprojections in relation to the organization ofentorhinal projections to the dentate gyrus
The set of anterograde experiments described abovedemonstrated that entorhinal associational projectionshave a restricted distribution within the entorhinal cortex.Cells in the dorsolateral region of the cortex, for example,gave rise to associational projections that distributedprimarily to the dorsolateral region. The pattern of associa-tional connections is strikingly reminiscent of the patternof labeled layer II cells resulting from retrograde tracerinjections into different septotemporal levels of the den-tate gyrus (Dolorfo and Amaral, 1993, 1998). These paral-lel observations prompted us to determine whether theseassociational connections were either restricted to do-mains of neurons projecting to a particular septotemporallevel of the dentate gyrus or linked domains of neuronsprojecting to different septotemporal levels. This question
was addressed by injecting different retrograde tracersinto two different septotemporal levels of the dentategyrus to label two different populations of entorhinal layerII neurons. In the same animal, anterograde neuronaltracers were injected into two locations within the entorhi-nal cortex that were predicted to be either within orbetween the two populations of retrogradely labeled neu-rons. If the distribution of anterograde tracer was confinedmainly to the domain of one of the populations of retro-gradely labeled cells, we would conclude that associationalconnections integrate information that is directed to acertain septotemporal level of the dentate gyrus. However,if the associational connections interconnected two popula-tions of retrogradely labeled cells, then we would concludethat the associational connections tended to integrateinformation directed to different septotemporal levels. Theresults described below are consistent with the formerconclusion.
We first present a brief description of the three-dimensional organization of populations of entorhinalneurons projecting to the dentate gyrus (Dolorfo andAmaral, 1998). Detailed descriptions of two representativecases that had four appropriately located injections arepresented next. These cases illustrate the relationship ofassociational connections to the patterns of retrogradelylabeled cells. Finally, quantitative analyses of the arealoverlap between the terminal fields of entorhinal associa-tional connections and populations of labeled entorhinal-to-dentate projecting neurons are presented.
Three-dimensional organizationof populations of entorhinal neurons
that project to the dentate gyrus
We previously demonstrated, by using three-dimen-sional computer reconstructions of retrogradely labeledentorhinal layer II neurons resulting from tracer injec-tions into different septotemporal levels of the dentategyrus, that different populations of cells project to differentseptotemporal levels of the dentate gyrus (Dolorfo andAmaral, 1998). A three-dimensional reconstruction of theentorhinal cortex of the rat is illustrated in Figure 15. Two
Fig. 17. Additional information from experiment DGEC-16 (whichis also illustrated in Fig. 16) is illustrated here. A–C: Line drawings ofcoronal sections through the entorhinal cortex (arranged from rostralto caudal) showing the distribution of retrogradely labeled cellsfollowing an injection of diamidino yellow into septal levels of thedentate gyrus (gray cells located dorsolaterally in the entorhinalcortex) and Fast Blue into a mid-septotemporal level (black cells in amid-mediolateral portion of the entorhinal cortex). The sections aredifferent from those illustrated in Figure 16 to demonstrate levels thatalso contained dense anterograde labeling (D–F). The unfolded two-dimensional map illustrating the distribution of these cells is shown atthe top left of the figure. D–F: Darkfield photomicrographs illustratingthe distribution of anterogradely labeled fibers resulting from aninjection of Phaseolus vulgaris–leuocoagglutinin into the medial por-tion of the entorhinal cortex. Layer IV (lamina dissecans) is illustratedby a dashed line in these photomicrographs. The unfolded two-dimensional map illustrating the distribution of labeled fibers isshown at top right. As in Figure 16, the same unfolded maps of theentorhinal cortex are used to illustrate both the retrograde andanterograde labeling. It is possible to see that the associationalconnections are largely confined to the mid-mediolaterally situatedband of cells that projected to the mid-septotemporal portion of thedentate gyrus. Filled arrowheads indicate the lateral and medialextents of the entorhinal cortex. Asterisk indicates that the caudal-most section was unavailable for analysis. Scale bar 5 1 mm.
70 C.L. DOLORFO AND D.G. AMARAL

Figure 17
ENTORHINAL INTRINSIC CONNECTIONS 71

bands of retrogradely labeled cells are shown on thisreconstruction; the one located adjacent to the rhinalsulcus (dark gray profiles) resulted from an injection of FBinto the septal portion of the dentate gyrus, and the otherband, located medially in the entorhinal cortex (light grayprofiles), resulted from an injection of DY into the tempo-ral portion of the dentate gyrus. The distribution of theseretrogradely labeled cells is also illustrated on a two-dimensional unfolded map of the entorhinal cortex (Fig.15B). In every case with a discrete retrograde tracerinjection into the dentate gyrus, a similar ‘‘bandlike’’population of retrogradely labeled cells was observed.When the retrograde tracer injection was located in theseptal half of the dentate gyrus, the band of labeledentorhinal cells was located laterally. When the retrogradetracer injection was located in the third quarter of thedentate gyrus, the location of the band of labeled neuronsshifted medially in the entorhinal cortex. When the injec-tion was placed into the temporal pole of the dentate gyrus,the band of labeled cells was located in the extremerostromedial portion of the entorhinal cortex. The result ofthis organization was that largely nonoverlapping popula-tions of entorhinal neurons projected to the septal, mid-septotemporal, and temporal levels of the dentate gyrus.In the experiments described in the next section, wedetermined whether the entorhinal associational connec-tions remained within these bands or went across thesebands. From a series of five experiments in which both theretrograde and anterograde tracers were successfullyplaced, we selected two, DGEC-16 (Figs. 16, 17) andDGEC-11 (Figs. 18, 19), which provided representativepatterns of labeling.
Entorhinal associational projectionsarising from regions containing septally
and mid-septotemporally projecting bands:Case DGEC-16
In experiment DGEC-16, an injection of DY was placedinto the septal dentate gyrus and resulted in a band ofretrogradely labeled cells located dorsolaterally in theentorhinal cortex (Fig. 16A–C, gray cells). A FB injectionwas placed into a mid-septotemporal level and led to aband of retrogradely labeled cells in a mid-mediolateralportion of the entorhinal cortex (Fig. 16A–C, black cells).The overall patterns of these retrogradely labeled cells areillustrated in the unfolded map on the top left of Figure 16.
In this same brain, an injection of BDA was placed inlayers III–V of the dorsolateral entorhinal cortex, in theregion predicted to contain the septally directed retro-gradely labeled cells. As illustrated in the darkfield photo-micrographs in Figure 16D–F and in the unfolded map atthe top right of this figure, the anterogradely labeled fibersresulting from this injection were distributed mainly to thesame portion of the entorhinal cortex that containedseptally directed retrogradely labeled cells. In fact, 62.7%of the area occupied by BDA-labeled fibers was found tocoincide with the septally projecting band of DY-labeledcells, whereas only 31.8% of the area occupied by BDA-labeled fibers coincided with the mid-septotemporally pro-jecting band of FB-labeled cells. The density of fibers in themid-septotemporally projecting band was substantiallylighter than in the septally projecting band. Similarly, theanterograde tracer PHA-L was injected into layers II–III ofthe mid-mediolateral entorhinal cortex, in a position pre-dicted to contain mid-septotemporally directed labeled
cells (Fig. 17). As illustrated in Figure 17D–F and in theunfolded map at the top right of this figure, the antero-gradely labeled fibers were confined mainly to the domainof the retrogradely labeled cells. In this case, 80.3% of thearea innervated by PHA-L-labeled fibers overlapped withthe mid-septotemporally projecting band of layer II cells,whereas only 17.5% of the PHA-L-labeled fibers over-lapped with the septally projecting band.
In summary, associational projections arising from ei-ther dorsolateral or mid-mediolateral portions of the ento-rhinal cortex were confined primarily to the regions contain-ing the septally projecting and mid-septotemporallyprojecting band of layer II cells, respectively. Whereasthese associational projections overlapped strongly withthe bands of dentate gyrus projecting cells in which theyoriginated, the associational projections extended onlyweakly into adjacent bands of dentate projecting cells.Finally, associational projections originating from regionscontaining the septally projecting band were virtuallysegregated from regions that project to temporal levels ofthe dentate gyrus.
Entorhinal associational projections arisingfrom regions containing septally and
temporally projecting bands: Case DGEC-11
To emphasize the high degree of overlap of the domainsof associational connections in the entorhinal cortex andthe domains of layer II cells projecting to the dentategyrus, we briefly describe an additional case DGEC-11,which also had four tracer injections. In this case, a FBinjection was located in the septal pole of the dentategyrus, which resulted in a retrogradely labeled band oflayer II cells located dorsolaterally in the entorhinal cortex(Fig. 18A–C, black cells). A DY injection was also located inthe temporal quarter of the dentate gyrus, which resultedin a band of retrogradely labeled layer II cells located in amedial portion of entorhinal cortex (Fig. 18A–C, graycells). The position of these septally and temporally project-ing bands are also shown in the unfolded retrograde mapon the top left of Figure 18.
The anterograde tracer injections in this case weresomewhat different than those in the previous case be-cause the PHA-L injection was placed in layers II–III ofmid-mediolateral portions of the entorhinal cortex, a re-gion that was predicted to be located between the FB-labeled septally projecting band and the DY-labeled tempo-rally projecting band (Fig. 18). As shown in Figure 18D–F
Fig. 18. A–C: Line drawings of coronal sections through theentorhinal cortex (arranged from rostral to caudal) showing thedistribution of retrogradely labeled cells following an injection of FastBlue into septal levels of the dentate gyrus (black cells locateddorsolaterally in the entorhinal cortex) and diamidino yellow into atemporal level (gray cells in a medial portion of the entorhinal cortex).The unfolded two-dimensional map illustrating the distribution ofthese cells is shown at the top left of the figure. D–F: Darkfieldphotomicrographs illustrating the distribution of anterogradely la-beled fibers resulting from an injection of Phaseolus vulgaris–leuocoagglutinin into the caudal portion of the lateral entorhinalcortex. Layer IV (lamina dissecans) is illustrated by a dashed line inthese photomicrographs. The unfolded two-dimensional map illustrat-ing the distribution of labeled fibers is shown at top right. In this case,the associational connections in the entorhinal cortex are located inbetween the bands of cells that project to septal or temporal portions ofthe dentate gyrus. Filled arrowheads indicate the lateral and mediallimits of the entorhinal cortex. Scale bar 5 1 mm.
72 C.L. DOLORFO AND D.G. AMARAL

Figure 18
ENTORHINAL INTRINSIC CONNECTIONS 73

and in the unfolded map at the top right of this figure, thePHA-L-labeled fibers were confined primarily to the unla-beled mid-mediolateral region of the entorhinal cortexlocated between the two retrogradely labeled bands. How-ever, at least some of the labeled fibers also were distrib-uted to the adjacent portions of the entorhinal cortexcontaining the retrogradely labeled septally projecting andtemporally projecting bands (Fig. 18). Even in this case,however, only 23.8% of the area occupied by PHA-L-labeled fibers overlapped with the septally projectingband, and only 18.8% of the PHA-L-occupied area over-lapped with the temporally projecting band.
In this same brain, a BDA injection was placed in layersII–III of the medial portions of the entorhinal cortex, theregion of the entorhinal cortex predicted to contain theDY-labeled temporally projecting cells. As shown inthe darkfield photomicrographs in Figure 19D–F and inthe unfolded map at the top right of this figure, theresulting BDA-labeled fibers were confined mainly to theregions containing the DY-labeled temporally projectingband of cells. In this case, 74.4% of the area occupied by theBDA-labeled fibers was confined to the region containingthe temporally projecting band. BDA-labeled fibers did notreach the regions containing the septally projecting bandof cells.
In summary, as in experiment DGEC-16, experimentDGEC-11 indicates that an injection placed within one ofthe bands of entorhinal cells projecting to septal, mid-septotemporal, or temporal levels of the dentate gyrusleads to associational labeling that is largely confined tothe same band. This finding supports the conclusion that,although entorhinal associational connections may inte-grate information within a band of cells projecting to onelevel of the dentate gyrus, they do not integrate informa-tion projecting to disparate levels of the dentate gyrus.
Quantitative analysis of entorhinalassociational projections
Because we had measured the area of termination frominjections of BDA or PHA-L and the entire surface area ofthe entorhinal cortex, we were able to assess the propor-tions of entorhinal surface area covered by the associa-tional projections. Moreover, because we were able topredict the regions of the entorhinal cortex that projectedto different septotemporal levels of the dentate gyrus, wewere able to relate the proportional area of the associa-tional connections to the entorhinal regions that projectedto different levels of the dentate gyrus. The results of theseanalyses are presented in Figure 20. The average surfacearea occupied by retrogradely labeled cells projecting toseptal levels of the dentate gyrus was approximately23.7% of the total entorhinal surface, whereas the associa-tional projections originating within this region of theentorhinal cortex occupied, on average, 29.1% of thesurface area. The surface area occupied by retrogradelylabeled cells projecting to mid-septotemporal levels of thedentate gyrus was 48.5%, whereas the associational projec-tions originating within this region occupied, on average,43.4% of its surface area. Finally, the surface area occupiedby retrogradely labeled cells projecting to temporal levelsof the dentate gyrus was 31.5%, whereas the associationalprojections originating within this entorhinal region occu-pied, on average, 25.0% of its surface area.
We also evaluated the amount of overlap of the areaoccupied by the association connections with the domains
of cells projecting to different septotemporal portions of thedentate gyrus. Associational projections originating inseptally, mid-septotemporally, and temporally projectingregions of the entorhinal cortex had more than 60%overlap with the band of retrogradely labeled cells inwhich the injection site was located (Fig. 20B). In mostcases, the percentage of overlap was greater than 75%. Incontrast, overlap of an associational projection with anadjacent band averaged only 20%, and there was essen-tially no overlap between the most lateral and medialassociational connections.
These quantitative analyses support our observationsthat entorhinal intrinsic projections are confined primarilyto the respective regions that originate projections to aparticular septotemporal level of the dentate gyrus. Theassociational connections generally do not integrate ento-rhinal neurons that project to different septotemporallevels of the dentate gyrus.
DISCUSSION
The entorhinal cortex plays a pivotal role in the commu-nication between the hippocampal formation and theneocortex. Much of the cortical sensory information thatenters the hippocampal formation enters through theentorhinal cortex, and much of the return projection to theneocortex originates in the entorhinal cortex (Fig. 22).There is now fairly substantial information on the sourceand regional termination of cortical inputs to the entorhi-nal cortex, particularly in the monkey (Insausti et al.,1987, 1997; Suzuki and Amaral, 1994) but also in the rat(Deacon et al., 1983; Burwell and Amaral, 1996). There isalso substantial information available on the topographicorganization of entorhinal projections to the other regionsof the hippocampal formation (Swanson et al., 1978; Wyss,1981; Ruth et al., 1982, 1988; Witter and Groenewegen,1984; Witter et al., 1989; Dolorfo and Amaral, 1998). Oneaspect of entorhinal neuroanatomy that has not receivedas much attention is the pattern of local associationalconnections, and this has been the topic of the experimentsdescribed in the current paper. Not only have we at-tempted to define the regional and laminar patterns ofprojections originating from deep and superficial layers of
Fig. 19. This figure provides additional information concerningexperiment DGEC-11. A–C: Line drawings of coronal sections throughthe entorhinal cortex (arranged from rostral to caudal) showing thedistribution of retrogradely labeled cells following an injection ofdiamidino yellow into septal levels of the dentate gyrus (gray cellslocated dorsolaterally in the entorhinal cortex) and Fast Blue into amid-septotemporal level (black cells in a mid-mediolateral portion ofthe entorhinal cortex). The rostrocaudal levels of the sections aredifferent from those in Figure 18 to show levels through the densestareas of anterograde labeling (D–F). The unfolded, two-dimensionalmap illustrating the distribution of these cells is shown at the top leftof the figure. D–F: Darkfield photomicrographs illustrating the distri-bution of anterogradely labeled fibers resulting from an injection ofbiotinylated dextran amine into the medial portion of the entorhinalcortex. Layer IV (lamina dissecans) is illustrated by a dashed line inthese photomicrographs. The unfolded two-dimensional map illustrat-ing the distribution of labeled fibers is shown at top right. Theanterogradely labeled fibers and terminals in this case is confined tothe band of retrogradely labeled cells that projected to the temporalportion of the dentate gyrus. Filled arrowheads indicate the lateraland medial limits of the entorhinal cortex and the border between thelateral (LEA) and medial (MEA) entorhinal areas. Scale bar 5 1 mm.
74 C.L. DOLORFO AND D.G. AMARAL
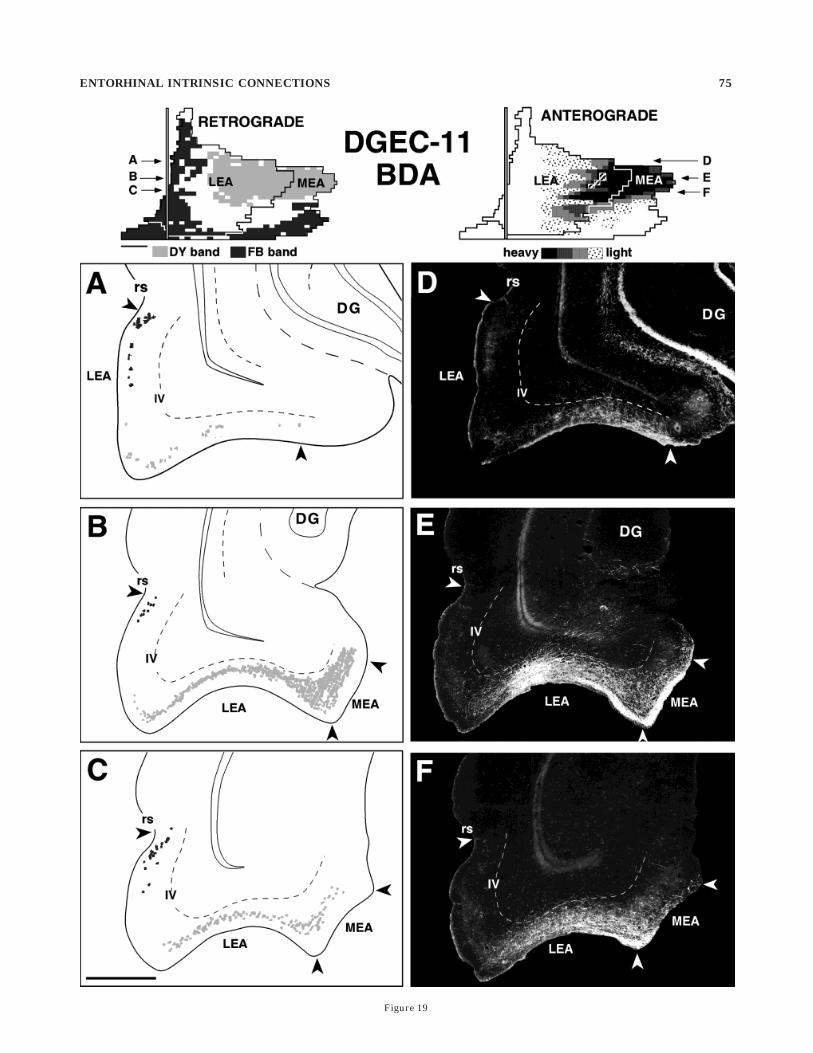
Figure 19
ENTORHINAL INTRINSIC CONNECTIONS 75

Fig. 20. A: Quantitative analyses of the percent of entorhinalsurface area labeled retrogradely following injections into the dentategyrus or labeled anterogradely following injections into the entorhinalcortex, related to bands of the entorhinal cortex that project to septal,mid-septotemporal, and temporal levels of the dentate gyrus. The bargraphs illustrate that the surface area of entorhinal cortex thatdemonstrated retrogradely labeled cells was comparable to the regiondemonstrating associational connections. In each bar graph, symbolsrepresent individual cases contributing to the mean. B: Left: Bargraphs illustrating the percentage of overlap of bands of retrogradelylabeled and associational connections in the entorhinal cortex. Dataare derived from the four tracer injections. The horizontal legendindicates the location of the retrograde tracer injection (septal,mid-septotemporal, and temporal) and the locations of the antero-
grade tracer injections (lateral, mid-mediolateral, and medial). Thereis substantial overlap of the associational connections with the domainof retrograde tracers. Right: Bar graphs illustrating the percentage ofoverlap of bands of retrogradely labeled cells with associationalconnections. In this case, the comparison is made between associa-tional connections in the portion of the entorhinal cortex projecting toone level of the dentate gyrus with the band(s) of labeled cells resultingfrom injections of retrograde tracer in different portions of the dentategyrus. The graphs indicate that there is no overlap between associa-tional connections in the lateral (septally projecting) band of entorhi-nal cortex and the medial (temporal projecting) entorhinal cortex.There is somewhat more overlap of the associational connections inthe septally projecting portion of the entorhinal cortex with themid-septotemporally projecting portion of the entorhinal cortex.
76 C.L. DOLORFO AND D.G. AMARAL

different regions of the entorhinal cortex, we have alsosought to study the relationship between the organizationof associational connections within the entorhinal cortexand the distribution of layer II neurons that innervatedifferent septotemporal regions of the dentate gyrus. Ourmajor findings can be summarized in relation to datapresented in Figure 21.
Figure 21 presents three-dimensional computer recon-structions of the rat entorhinal cortex and surroundingcerebral cortex. In Figure 21A, the entorhinal cortex isoutlined and the lateral (LEA) and medial (MEA) subdivi-sions have been demarcated. The remaining three panelsillustrate data from experiment DGEC-11 that was de-scribed in detail in the Results section. In Figure 21B, bluespheres demonstrate the locations of retrogradely labeledcells along the rhinal sulcus resulting from a FB injectioninto septal levels of the dentate gyrus. Yellow spheresdemonstrate the locations of retrogradely labeled cellsresulting from an injection of DY into temporal levels ofthe dentate gyrus. The intervening region shows theunlabeled band of entorhinal cortex that projects to mid-septotemporal levels of the dentate gyrus. It should benoted that the portions of the LEA and MEA that project toseptal levels of the dentate gyrus are located rostrocaudalrather than mediolateral to each other. Thus, a standardcoronal section would not typically include portions of theLEA and MEA that project to the septal level of the dentategyrus.
In Figure 21C, the anterogradely labeled fibers resultingfrom an injection of PHA-L into the mid-portion of theentorhinal cortex is illustrated as are outlines represent-ing the domains of the FB- and DY-labeled cells. Thisthree-dimensional view clearly demonstrates that the bulkof the anterogradely labeled fibers are located within themid-region and do not appreciably invade the septally ortemporally projecting bands of entorhinal cortex. Simi-larly, in Figure 21D, the distribution of BDA labeled fibersresulting from an injection in the rostromedial portion ofthe entorhinal cortex is illustrated. The fibers resultingfrom this injection were confined mainly to the zone oftemporally projecting entorhinal cortex in which the injec-tion site was located. This is a particularly compelling casebecause the BDA injection was located fairly close to theborder of the mid-region that projects to the mid-portion ofthe dentate gyrus. Thus, the associational connections inthe entorhinal cortex tended to interconnect cells thatprojected to one level of the dentate gyrus rather thaninterconnect cells that projected to different levels. Oneimplication of this finding is that input to the lateralportion of the entorhinal cortex, for example, will berelayed to septal but not temporal levels of the dentategyrus. We will return to this issue below when we discussthe functional consequences of this organization.
We now compare and contrast our findings with those ofprevious studies on the intrinsic connections of the entorhi-nal cortex. The novel aspect of the studies reported in thecurrent paper is that, for the first time, the three-dimensional organization of associational connections inthe entorhinal cortex was evaluated by using the unfoldedmap technique and computer-aided three-dimensional re-construction. These studies confirmed and extended find-ings from previous studies on the laminar origin anddistribution of associational connections. The most exten-sive previous studies of entorhinal associational connec-tions in the rat were those by Kohler (1986, 1988) who used
the PHA-L technique. In addition to Kohler’s work, bothLingenhohl and Finch (1991) and Tamamaki and Noyjo(1993) studied the distribution of axons originating fromintracellularly labeled entorhinal neurons. Although ourwork is generally consistent with these previous studies,we have noted some differences and made some extensionsto the conclusions of these previous studies.
One fundamental question deals with the areal extent ofthe distribution of associational connections in the entorhi-nal cortex. Does the lateral entorhinal cortex project to themedial entorhinal cortex? What about the reverse projec-tion? Kohler (1986, 1988) indicated that the associationalconnections that arise in the LEA are confined primarily tothe LEA. In contrast, he indicated that projections fromthe MEA to the LEA were prominent. Although our datasupport the conclusion that the MEA projects heavily tothe LEA, we found that some portions of the LEA alsoproject heavily to the MEA. Thus, if an injection wasplaced into the more dorsolateral portions of the LEA, theassociational connections were largely confined to theLEA. However, if the injection was placed in the moreventromedial portion of the LEA, then there were substan-tial, medially directed associational projections that crossedthe border into the MEA. It is likely that Kohler did notobserve these projections because his injections of the LEAtended to be placed dorsolaterally.
Another important issue for the understanding of infor-mation processing in the entorhinal cortex deals with thelaminar origins and terminations of the associationalprojections. Kohler (1986, 1988) indicated that the mostrobust associational connections arose from the deep lay-ers of the entorhinal cortex and terminated in the superfi-cial layers. Although his illustrations also indicated thatsuperficial injections produced labeled fibers in the super-ficial layers, he tended to interpret these as fibers ofpassage directed to the subicular complex. Our studiesconfirm the finding of prominent associational connectionsarising from the deep layers of the entorhinal cortex,which terminate most heavily in the superficial layers.However, we also observed widespread distributions ofvaricose fibers in the superficial layers following injectionsin the superficial layers. In fact, the fiber labeling in layer Iin these experiments appeared to be stronger than thelabeling after the deep injections. This finding was particu-larly clear when injections involved ventromedial portionsof the entorhinal cortex.
Overall, the divergence of projections originating fromrather discrete populations of neurons involved in ourinjection sites was quite large and was similar regardlessof whether the injection was in the deep or superficiallayers or in the LEA or MEA. The average injectioninvolved approximately 0.179 mm2 of the entorhinal sur-face, which accounted for only about 1% of its surface area.Nevertheless, the domain of the projections originatingfrom these injections covered approximately 34% of thesurface area of the entorhinal cortex. The spatial extent ofterminal fields originating from layers V and VI (33.1%)was about the same as that originating from layers II andIII (34.1%).
Therefore, we conclude that extensive associational con-nections arise from layers II and III and from the deeplayers. The single cell intracellular labeling studies ofLingenhohl and Finch (1991) and Klink and Alonso (1997)appear to support this conclusion because their labeledlayer II neurons gave rise to extensive axonal ramifica-
ENTORHINAL INTRINSIC CONNECTIONS 77
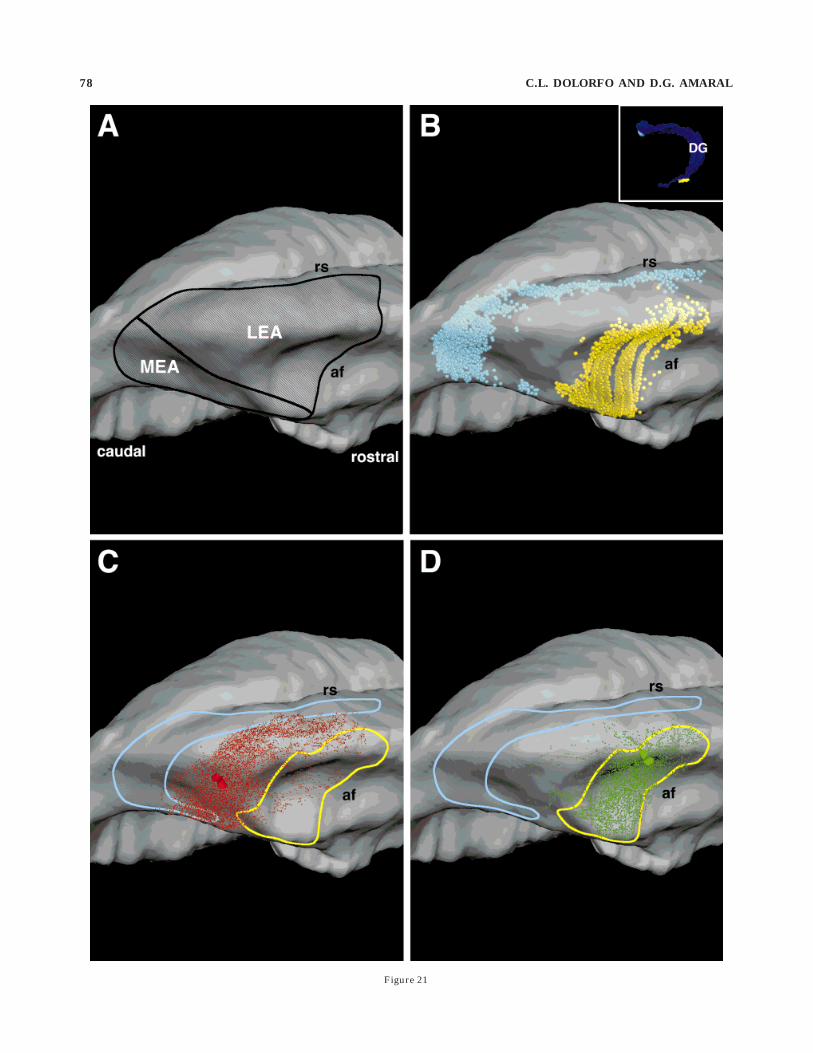
Figure 21
78 C.L. DOLORFO AND D.G. AMARAL

tions in the superficial layers. Thus, the pattern of associa-tional connections raises the possibility that the cells oforigin of the perforant path projections receive substantialinput from cells in both the deep and superficial layers. Itshould also be noted that, although the superficial layersgave rise to rather meager associational connections to thedeep layers, associational connections originating in thedeep layers did distribute to adjacent portions of theselayers, and these projections tended to be fairly extensiverostrocaudally if the injection was located in the dorsolat-eral portion of the entorhinal cortex.
Cortical and subcortical afferents to theentorhinal cortex are topographically
segregated
One implication of the findings of the present study isthat inputs to certain mediolateral portions of the entorhi-nal cortex will be relayed almost exclusively to certainseptotemporal portions of the dentate gyrus. Thus, thequestion arises as to whether there is a regional localiza-tion of inputs to the entorhinal cortex. Projections convey-ing information from the neocortex terminate preferen-tially in the dorsolateral and caudomedial portions of theentorhinal cortex (Deacon et al., 1983; Vandano et al.,1991; Wyss and Van Groen, 1992; Coogan and Burkhalter,1993; Burwell and Amaral, 1996; Insausti et al., 1997), i.e.,the parts of the entorhinal cortex that send projections toseptal half of the dentate gyrus (Wyss, 1981; Ruth et al.,1988; Dolorfo and Amaral, 1993, 1998). In contrast, subcor-tical structures such as the amygdala, which conveyinformation concerning the affective significance of stimuli,terminate primarily in rostroventral portions of the ento-rhinal cortex (Krettek and Price, 1977; Miettinen et al.,1996), i.e., the part of the entorhinal cortex that sendsprojections to temporal levels of the dentate gyrus (Wyss,1981; Ruth et al., 1982, 1988). These few examples indicatethat there is a topographic organization to the inputs tothe entorhinal cortex. This observation implies that septaland temporal hippocampus may receive different kinds ofinformation through the perforant path inputs. Althoughdata are rather scant on this issue, they support the
conclusion of septotemporal differences of hippocampalfunction.
Rats with lesions restricted to the septal portions of thehippocampal formation exhibit longer escape latencies inthe Morris water maze (Moser et al., 1993). In contrast,rats with lesions restricted to temporal portions of thehippocampus do not show a spatial learning deficit. Consis-tent with these behavioral findings, recent electrophysi-ological studies have reported difficulties in recordingplace fields in neurons in the ventral hippocampus. Thoseneurons that demonstrated spatial firing characteristicstended to have rather crude place fields (Jung et al., 1994).Taken together, these studies suggest that the septalportion of the hippocampus receives greater direct sensoryinformation from the neocortex and is more responsible forcarrying out spatial information processing. In contrast,the temporal hippocampus receives less direct neocorticalsensory information and does not appear to be as inti-mately involved in spatial learning and memory.
Reciprocity of entorhinal–hippocampalconnections: Feedback loops
and reverberation
By one view of the function of the hippocampal forma-tion in memory processing (Squire et al., 1984), sensoryinformation ‘‘passes through’’ the hippocampal formationin the process of forming ‘‘representations’’ of ongoingexperiences leading to consolidation of long-term memory.The associational connections of the entorhinal cortex thatwe have described would not seem to be exploited in thistype of single pass processing. However, in other views ofhippocampal processing that portray the structure asbeing important in timing and involved in comparisons ofincoming information with information perceived previ-ously (Buzsaki, 1989), the associational connections sum-marized in Figure 22 may be a fundamental substrate forthe establishment of feedback loops or reverberationthrough the various hippocampal fields. It will be ofinterest to determine whether the superficial-to-superfi-cial and deep-to-superficial associational connections arethe substrate for these reverberating pathways. In thiscontext, a number of important microcircuitry issues re-main to be resolved. What are the target neurons of theassociational projections? What is the chemoanatomy ofthese projections? Are they excitatory, inhibitory, or mixed?Do the associational connections arise as collaterals fromneurons projecting to the dentate gyrus and hippocampusor to the neocortex or subcortical regions? The answers tothese questions will go some way toward providing informa-tion essential to understanding local information process-ing within the entorhinal cortex and the role of theentorhinal cortex in the consolidated activities of thehippocampal formation.
ACKNOWLEDGMENTS
This work was supported in part by NIH grants NS16980(D.G.A.) and NS16980–13S1 (C.L.D.) and by a grant fromthe Human Frontiers Science Program. We thank JanetWeber, Mary Ann Lawrence, and Kaon Tong for excellenthistological assistance and Dr. Brian W. Leonard forcomments on an earlier version of this manuscript. We alsothank Dr. Paul Adams, Rick Avila, and David Hessler withthe three-dimensional reconstructions.
Fig. 21. Three-dimensional computer reconstructions of the lateralaspect of the caudal half of a rat brain (case DGEC-11) demonstratingthe organization of retrogradely labeled cells and fibers of the entorhi-nal associational system. A: Caudoventral view of the rat brainshowing the areal position of the entorhinal cortex (outlined area). Theentorhinal cortex has been subdivided into medial (MEA) and lateral(LEA) entorhinal areas. B: Caudoventral view of the entorhinal cortexshowing the position of a septally projecting band of layer II entorhinalneurons (blue) and a temporally projecting band of layer II neurons(yellow) resulting from an injection of Fast Blue (FB) in septal dentategyrus and an injection of diamidino yellow (DY) in temporal dentategyrus (see inset for location of injection sites). C: The distribution ofPhaseolus vulgaris–leuocoagglutinin-labeled fibers (red) arising froman injection localized within layers II and III of a mid-septotemporallyprojecting portion of the entorhinal cortex (i.e., the portion containingno retrogradely labeled layer II neurons in C). D: The distribution ofbiotinylated dextran amine-labeled fibers (green) arising from aninjection localized within layer II of a temporally projecting portion ofthe entorhinal cortex (i.e., the region in B containing DY-labeled layerII neurons). In C and D, the blue and yellow profiles indicate theposition of the FB and DY bands of layer II neurons. Dots representthe location of FB- and DY-labeled layer II cells. Each dot representsone labeled neuron.
ENTORHINAL INTRINSIC CONNECTIONS 79

Figure 22
80 C.L. DOLORFO AND D.G. AMARAL
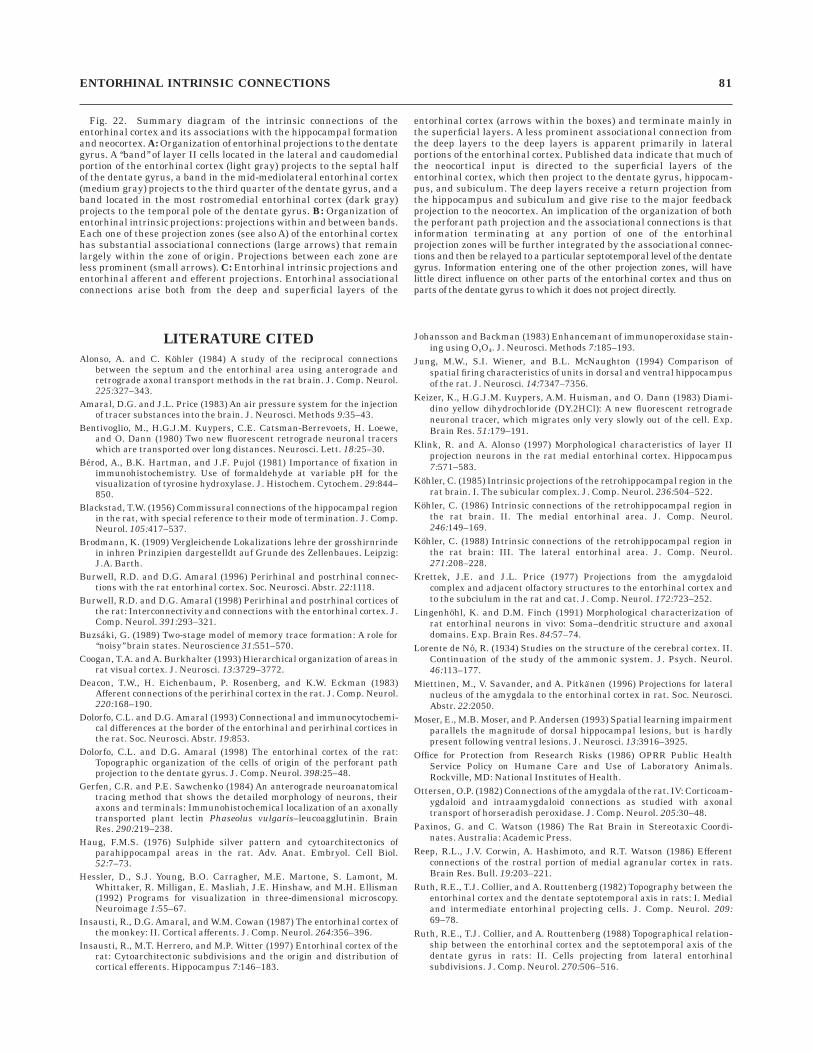
LITERATURE CITED
Alonso, A. and C. Kohler (1984) A study of the reciprocal connectionsbetween the septum and the entorhinal area using anterograde andretrograde axonal transport methods in the rat brain. J. Comp. Neurol.225:327–343.
Amaral, D.G. and J.L. Price (1983) An air pressure system for the injectionof tracer substances into the brain. J. Neurosci. Methods 9:35–43.
Bentivoglio, M., H.G.J.M. Kuypers, C.E. Catsman-Berrevoets, H. Loewe,and O. Dann (1980) Two new fluorescent retrograde neuronal tracerswhich are transported over long distances. Neurosci. Lett. 18:25–30.
Berod, A., B.K. Hartman, and J.F. Pujol (1981) Importance of fixation inimmunohistochemistry. Use of formaldehyde at variable pH for thevisualization of tyrosine hydroxylase. J. Histochem. Cytochem. 29:844–850.
Blackstad, T.W. (1956) Commissural connections of the hippocampal regionin the rat, with special reference to their mode of termination. J. Comp.Neurol. 105:417–537.
Brodmann, K. (1909) Vergleichende Lokalizations lehre der grosshirnrindein inhren Prinzipien dargestelldt auf Grunde des Zellenbaues. Leipzig:J.A. Barth.
Burwell, R.D. and D.G. Amaral (1996) Perirhinal and postrhinal connec-tions with the rat entorhinal cortex. Soc. Neurosci. Abstr. 22:1118.
Burwell, R.D. and D.G. Amaral (1998) Perirhinal and postrhinal cortices ofthe rat: Interconnectivity and connections with the entorhinal cortex. J.Comp. Neurol. 391:293–321.
Buzsaki, G. (1989) Two-stage model of memory trace formation: A role for‘‘noisy’’ brain states. Neuroscience 31:551–570.
Coogan, T.A. and A. Burkhalter (1993) Hierarchical organization of areas inrat visual cortex. J. Neurosci. 13:3729–3772.
Deacon, T.W., H. Eichenbaum, P. Rosenberg, and K.W. Eckman (1983)Afferent connections of the perirhinal cortex in the rat. J. Comp. Neurol.220:168–190.
Dolorfo, C.L. and D.G. Amaral (1993) Connectional and immunocytochemi-cal differences at the border of the entorhinal and perirhinal cortices inthe rat. Soc. Neurosci. Abstr. 19:853.
Dolorfo, C.L. and D.G. Amaral (1998) The entorhinal cortex of the rat:Topographic organization of the cells of origin of the perforant pathprojection to the dentate gyrus. J. Comp. Neurol. 398:25–48.
Gerfen, C.R. and P.E. Sawchenko (1984) An anterograde neuroanatomicaltracing method that shows the detailed morphology of neurons, theiraxons and terminals: Immunohistochemical localization of an axonallytransported plant lectin Phaseolus vulgaris–leucoagglutinin. BrainRes. 290:219–238.
Haug, F.M.S. (1976) Sulphide silver pattern and cytoarchitectonics ofparahippocampal areas in the rat. Adv. Anat. Embryol. Cell Biol.52:7–73.
Hessler, D., S.J. Young, B.O. Carragher, M.E. Martone, S. Lamont, M.Whittaker, R. Milligan, E. Masliah, J.E. Hinshaw, and M.H. Ellisman(1992) Programs for visualization in three-dimensional microscopy.Neuroimage 1:55–67.
Insausti, R., D.G. Amaral, and W.M. Cowan (1987) The entorhinal cortex ofthe monkey: II. Cortical afferents. J. Comp. Neurol. 264:356–396.
Insausti, R., M.T. Herrero, and M.P. Witter (1997) Entorhinal cortex of therat: Cytoarchitectonic subdivisions and the origin and distribution ofcortical efferents. Hippocampus 7:146–183.
Johansson and Backman (1983) Enhancemant of immunoperoxidase stain-ing using OsO4. J. Neurosci. Methods 7:185–193.
Jung, M.W., S.I. Wiener, and B.L. McNaughton (1994) Comparison ofspatial firing characteristics of units in dorsal and ventral hippocampusof the rat. J. Neurosci. 14:7347–7356.
Keizer, K., H.G.J.M. Kuypers, A.M. Huisman, and O. Dann (1983) Diami-dino yellow dihydrochloride (DY.2HCl): A new fluorescent retrogradeneuronal tracer, which migrates only very slowly out of the cell. Exp.Brain Res. 51:179–191.
Klink, R. and A. Alonso (1997) Morphological characteristics of layer IIprojection neurons in the rat medial entorhinal cortex. Hippocampus7:571–583.
Kohler, C. (1985) Intrinsic projections of the retrohippocampal region in therat brain. I. The subicular complex. J. Comp. Neurol. 236:504–522.
Kohler, C. (1986) Intrinsic connections of the retrohippocampal region inthe rat brain. II. The medial entorhinal area. J. Comp. Neurol.246:149–169.
Kohler, C. (1988) Intrinsic connections of the retrohippocampal region inthe rat brain: III. The lateral entorhinal area. J. Comp. Neurol.271:208–228.
Krettek, J.E. and J.L. Price (1977) Projections from the amygdaloidcomplex and adjacent olfactory structures to the entorhinal cortex andto the subciulum in the rat and cat. J. Comp. Neurol. 172:723–252.
Lingenhohl, K. and D.M. Finch (1991) Morphological characterization ofrat entorhinal neurons in vivo: Soma–dendritic structure and axonaldomains. Exp. Brain Res. 84:57–74.
Lorente de No, R. (1934) Studies on the structure of the cerebral cortex. II.Continuation of the study of the ammonic system. J. Psych. Neurol.46:113–177.
Miettinen, M., V. Savander, and A. Pitkanen (1996) Projections for lateralnucleus of the amygdala to the entorhinal cortex in rat. Soc. Neurosci.Abstr. 22:2050.
Moser, E., M.B. Moser, and P. Andersen (1993) Spatial learning impairmentparallels the magnitude of dorsal hippocampal lesions, but is hardlypresent following ventral lesions. J. Neurosci. 13:3916–3925.
Office for Protection from Research Risks (1986) OPRR Public HealthService Policy on Humane Care and Use of Laboratory Animals.Rockville, MD: National Institutes of Health.
Ottersen, O.P. (1982) Connections of the amygdala of the rat. IV: Corticoam-ygdaloid and intraamygdaloid connections as studied with axonaltransport of horseradish peroxidase. J. Comp. Neurol. 205:30–48.
Paxinos, G. and C. Watson (1986) The Rat Brain in Stereotaxic Coordi-nates. Australia: Academic Press.
Reep, R.L., J.V. Corwin, A. Hashimoto, and R.T. Watson (1986) Efferentconnections of the rostral portion of medial agranular cortex in rats.Brain Res. Bull. 19:203–221.
Ruth, R.E., T.J. Collier, and A. Routtenberg (1982) Topography between theentorhinal cortex and the dentate septotemporal axis in rats: I. Medialand intermediate entorhinal projecting cells. J. Comp. Neurol. 209:69–78.
Ruth, R.E., T.J. Collier, and A. Routtenberg (1988) Topographical relation-ship between the entorhinal cortex and the septotemporal axis of thedentate gyrus in rats: II. Cells projecting from lateral entorhinalsubdivisions. J. Comp. Neurol. 270:506–516.
Fig. 22. Summary diagram of the intrinsic connections of theentorhinal cortex and its associations with the hippocampal formationand neocortex. A: Organization of entorhinal projections to the dentategyrus. A ‘‘band’’ of layer II cells located in the lateral and caudomedialportion of the entorhinal cortex (light gray) projects to the septal halfof the dentate gyrus, a band in the mid-mediolateral entorhinal cortex(medium gray) projects to the third quarter of the dentate gyrus, and aband located in the most rostromedial entorhinal cortex (dark gray)projects to the temporal pole of the dentate gyrus. B: Organization ofentorhinal intrinsic projections: projections within and between bands.Each one of these projection zones (see also A) of the entorhinal cortexhas substantial associational connections (large arrows) that remainlargely within the zone of origin. Projections between each zone areless prominent (small arrows). C: Entorhinal intrinsic projections andentorhinal afferent and efferent projections. Entorhinal associationalconnections arise both from the deep and superficial layers of the
entorhinal cortex (arrows within the boxes) and terminate mainly inthe superficial layers. A less prominent associational connection fromthe deep layers to the deep layers is apparent primarily in lateralportions of the entorhinal cortex. Published data indicate that much ofthe neocortical input is directed to the superficial layers of theentorhinal cortex, which then project to the dentate gyrus, hippocam-pus, and subiculum. The deep layers receive a return projection fromthe hippocampus and subiculum and give rise to the major feedbackprojection to the neocortex. An implication of the organization of boththe perforant path projection and the associational connections is thatinformation terminating at any portion of one of the entorhinalprojection zones will be further integrated by the associational connec-tions and then be relayed to a particular septotemporal level of the dentategyrus. Information entering one of the other projection zones, will havelittle direct influence on other parts of the entorhinal cortex and thus onparts of the dentate gyrus to which it does not project directly.
ENTORHINAL INTRINSIC CONNECTIONS 81

Squire, L.R., N.J. Cohen, and L. Nadel (1984) The medial temporal regionand memory consolidation: A new hypothesis. In H. Weigartner and E.Parker (eds): Memory Consolidation. Hillsdale, NJ: Erlbaum, pp.185–210.
Sternberger, L.A. (1979) Immunocytochemistry. New York: John Wiley &Sons.
Steward, O. and S.A. Scoville (1976) Cells of origin of entorhinal corticalafferents to the hippocampus and fascia dentata of the rat. J. Comp.Neurol. 169:347–370.
Suzuki, W.A. and D.G. Amaral (1994) Topographic organization of thereciprocal connections between the monkey entorhinal cortex and theperirhinal and parahippocampal cortices. J. Neurosci. 14:1856–1877.
Suzuki, W.A. and D.G. Amaral (1996) The construction of straight lineunfolded two-dimensional density maps of neuroanatomical projectionsin the monkey cerebral cortex. Neurosci. Protocols 80:1–19.
Swanson, L.W. and C. Kohler (1986) Anatomical evidence for directprojections from the entorhinal area to the entire cortical mantle in therat. J. Neurosci. 6:371–385.
Swanson, L.W., J.M. Wyss and W.M. Cowan (1978) An autoradiographicstudy of the organization of intrahippocampal association pathways inthe rat. J. Comp. Neurol. 181:681–716.
Tamamaki, N. and Y. Nojyo (1993) Projection of the entorhinal layer IIneurons in the rat as revealed by intracellular pressure-injection ofneurobiotin. Hippocampus 3:471–480.
Tamamaki, N. and Y. Nojyo (1994) Preservation of topography in theconnections between the subiculum, field CA1, and the entorhinalcortex in rats. J. Comp. Neurol. 353:379–390.
Van Essen, D.C. and J.H.R. Maunsell (1980) Two-dimensional maps of thecerebral cortex. J. Comp. Neurol. 191:255–281.
Van Groen, T. and J.M. Wyss (1990) Extrinsic projections from area CA1 ofthe rat hippocampus: Olfactory, cortical, subcortical, and bilateralhippocampal formation projections. J. Comp. Neurol. 302:515–528.
Vandano, E.C., R. Legg, and M. Glickstein (1991) Afferent and efferentconnections of the temporal association cortex in the rat: A horseradishperoxidase study. Eur. J. Neurosci. 3:317–330.
Veening, J.G. (1978) Cortical afferents of the amygdaloid complex in the rat:An HRP study. Neurosci. Lett. 8:191–195.
Veenman, C.L., A. Reiner, and M.G. Honig (1992) Biotinylated dextranamine as an anterograde tracer for single- and double-labeling studies.J. Neurosci. Methods 41:239–254.
Witter, M.P. and H.J. Groenewegen (1984) Laminar origin and septotempo-ral distribution of entorhinal and perirhinal projections to the hippocam-pus in the cat. J. Comp. Neurol. 224:371–385.
Witter, M.P., G.W. Van Hoesen, and D.G. Amaral (1989) Topographicalorganization of the entorhinal projection to the dentate gyrus of themonkey. J. Neurosci. 9:216–228.
Wyss, J.M. (1981) An autoradiographic study of the efferent connections ofthe entorhinal cortex in the rat. J. Comp. Neurol. 199:495–512.
Wyss, J.M. and T. Van Groen (1992) Connections between the retrosplenialcortex and the hippocampal formation in the rat: A review. Hippocam-pus 2:1–12.
Young, S.J., S.M. Royer, P.M. Groves, and J.C. Kinnamon (1987) Three-dimensional reconstruction from serial micrographs using and IBM PC.J. Electr. Microsc. Tech. 6:207–215.
82 C.L. DOLORFO AND D.G. AMARAL